Embed Size (px)
Citation preview

Final Project Communications Workshop November 29, 2010 1
Catchment Management for Protection of Water Resources A research project funded by the RELU Programme
Final Project Communications Workshop For Wider National and UK Stakeholders
SOAS, University of London November 29, 2010
Prepared by: Mary Jane Porter and Laurence Smith
SOAS, University of London
Catchment Management for Protection of Water Resources Rural Economy and Land Use Programme
Principal Investigator: Laurence Smith Centre for Development, Environment and Policy
SOAS, University of London, Carruthers House, High Street, Wye, Ashford, TN25 5AH
Final Project Communications Workshop November 29, 2010 2
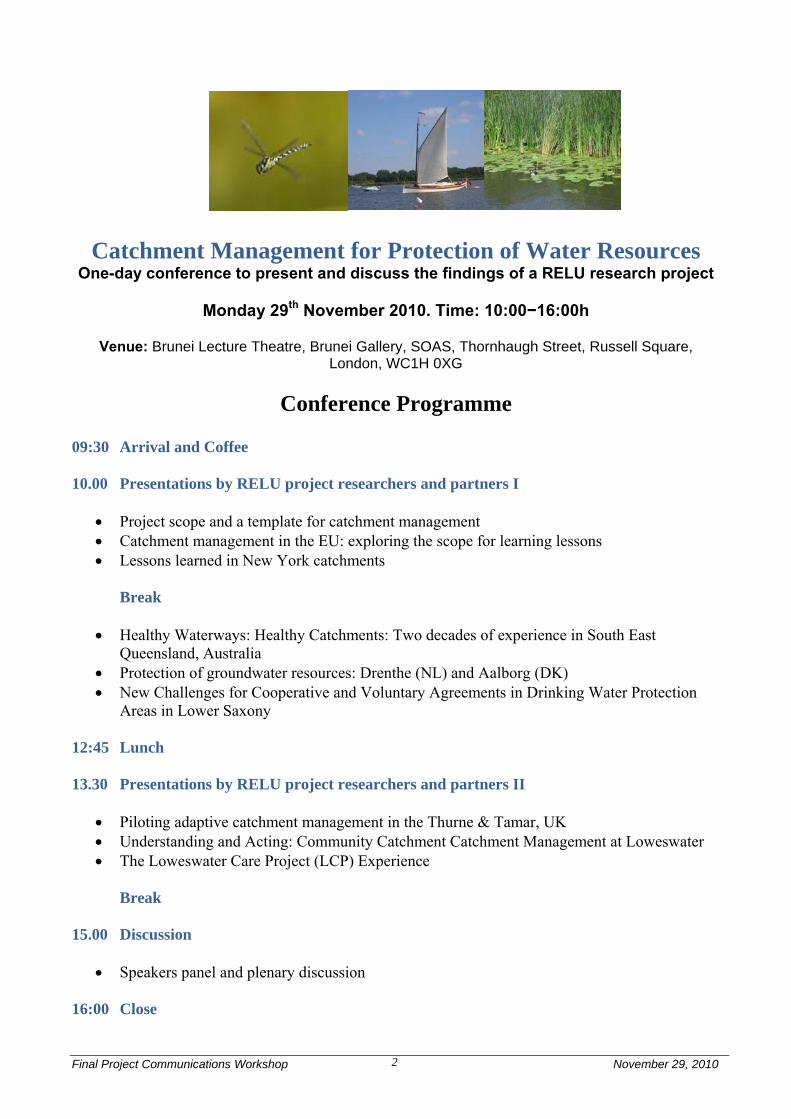
Catchment Management for Protection of Water Resources One-day conference to present and discuss the findings of a RELU research project
Monday 29th November 2010. Time: 10:00−16:00h
Venue: Brunei Lecture Theatre, Brunei Gallery, SOAS, Thornhaugh Street, Russell Square,
London, WC1H 0XG
Conference Programme 09:30 Arrival and Coffee 10.00 Presentations by RELU project researchers and partners I
• Project scope and a template for catchment management • Catchment management in the EU: exploring the scope for learning lessons • Lessons learned in New York catchments
Break
• Healthy Waterways: Healthy Catchments: Two decades of experience in South East
Queensland, Australia • Protection of groundwater resources: Drenthe (NL) and Aalborg (DK) • New Challenges for Cooperative and Voluntary Agreements in Drinking Water Protection
Areas in Lower Saxony
12:45 Lunch 13.30 Presentations by RELU project researchers and partners II
• Piloting adaptive catchment management in the Thurne & Tamar, UK • Understanding and Acting: Community Catchment Catchment Management at Loweswater • The Loweswater Care Project (LCP) Experience
Break 15.00 Discussion
• Speakers panel and plenary discussion 16:00 Close

Final Project Communications Workshop November 29, 2010 3
Workshop Summary Welcome and Overview ................................................................................................ Kevin Hiscock Welcome to you all. We have five presentations before lunch from our international partners, with three before the break and two presentations following the break. After lunch we will give you specific detail on the research that has been conducted as well as the tools that have been developed to assist in catchment management in the project’s pilot catchments, the Rivers Thurne and Tamar. After the tea break we will have a special discussion session so you will have a chance to contribute your comments. Project’s scope and a template for catchment management: ................................ Laurence Smith (For more information see presentation downloadable at: http://www.watergov.org/resources.html) We are almost at the end of our three year project. Our project objectives were:
• Developing a comparative analysis of international catchment management experience; • Assessing the transferability of achievements in the US, other European countries, and
Australia to the UK; • Piloting approaches in two case study catchments: Upper Tamar, SW England and Upper
Thurne, East Anglia; and • Developing guidelines (a catchment management template) for integration of scientific
investigation with decision-making and implementation. The project scope and activities consisted of two strands: two UK pilot case study projects (Upper Tamar River Catchment and Upper Thurne River Catchment) and a comparative analysis of international catchment management programmes. “How to protect and manage water resources in a catchment in which people can live, work and play”, was the key catchment management problem. Our focus has been on water quality, and there are many challenges. A useful concept is that of a ‘wicked problem’. This emphasizes complexity and the existence of both technical and societal uncertainty. With regard to diffuse pollution and land management what is needed is a locally ‘tailored’ mix of regulation, policies/incentives, advice, voluntary action and direct interventions. But other catchment management concerns such as household septic systems, sewage treatment works, soil loss in construction, stream corridor management, restoration of river morphology and wetlands, spatial planning and economic development, education and awareness raising, research, monitoring, modelling, and others are also important but beyond the capacity of one organisation. This needs collaboration and coordination, and an adaptive management approach. The project has sought to define the principles and components needed for this in the form of a catchment management template A ‘wicked’ diagnosis for catchment management leads to recognition of need for: a broad societal response by civil society, local and national agencies and scientists; a ‘twin-track’ (analytic-deliberative) adaptive management approach; and decentralised collaborative management and (see briefing paper at: http://www.watergov.org/resources.html).

Final Project Communications Workshop November 29, 2010 4
partnership working. Explicit recognition and understanding of this can inform policy, process and governance design. More detail and examples will be provided throughout the day (see below) and in our forthcoming book from Earthscan in 2011.
Catchment Management in the EU: exploring the scope for learning lessons ............... David Benson (For more information see presentation downloadable at: http://www.watergov.org/resources.html) Our research on comparative catchment management governance had two approaches:
• Government level analysis - UK/EU, Australia, USA • Catchment level analysis: cross national comparison of individual cases in the UK, D, NL,
DK, Australia, USA. Catchment management is a growing, but diversely described, phenomenon worldwide: North America (watershed partnerships), Europe (RBM) and Australia (ICM/NRM), developing countries (IWRM). But common key features of these approaches include:
• Scale - catchment/watershed, river basin • Stakeholders - participation of multiple actors from different levels • Collaborative institutions - collaboration of actors within specific institutional structures, e.g.
RBLPs, watershed partnerships. One way to compare catchment governance is to focus on government policy instruments:
• Regulatory forms of government policy to embed catchment management - legal measures, regulations
• Non-regulatory forms of policy to encourage catchment management - funding or voluntary approaches.
In attempting to assess lessons learned there are differences in national contexts that lead to constraints to learning between different counties. Higher level lesson learning between governments on policy instruments (hard policy) can be problematic. Lesson learning at lower levels is easier as best practice (soft policy) ideas tend to transfer more readily, for example between individual catchments. Catchment Management in the UK
• National regulations for catchment management
• Implement EU WFD (2000) legal principles and CEC guidelines
• Scale - river basin districts
• Stakeholders - consultation and active engagement with public and key stakeholders at regional and national levels
• Collaborative institutions - river basin liaison panels, national stakeholder groups and liaison panels
• But also wider collaboration at the sub-RBD scale – Catchment Sensitive Farming – Community catchment groups

Final Project Communications Workshop November 29, 2010 5
Catchment Management in Australia • Natural resource management (NRM) at regional/local scales • Australian government NRM policy based on funding mechanisms and state government
ICM policy • Landcare, Natural Heritage Trust and Caring for Our Country
– Business plan model - provisions on CM tied to funding • Scale - regional and local • Stakeholders - regional and local level engagement of government and non-governmental
actors • Collaborative institutions - 56 NRM bodies, catchment groups and landcare organisations.
Catchment Management in the USA
• Complex and fragmented situation • Top-down process - some federal legal and funding measures:
– Clean Water Act and USEPA • watershed planning, Section 319 funding
– Safe Drinking Water Act 1986 • MOA – New York watershed protection
– USDA – National Resources Conservation Services • The rise of ‘watershed partnerships’ - bottom up process • Scale, stakeholders and collaborative institutions -
– different models of CM ranging from ‘collaborative superagencies’ to local partnerships.
The UK (and EU) can learn much from the USA and Australia, for example:
• Facilitating CM through non-regulatory instruments (funding, technical assistance, voluntary/community approaches)
• Scales, stakeholder engagement and collaborative institutions. However, we need to be aware of national differences:
• Uniqueness of US/Australian approaches: less regulatory (‘bottom up’) localised forms of CM
• Uniqueness of the UK/EU approach: more regulatory (‘top down’) forms of regional based CM
• Application constraints - ‘fitting’ lessons learnt to the UK/EU context – governance forms differ.
Therefore, research has concentrated on lower level lesson learning between CM cases. Identifying and assessing best practice lessons from CM groups in the USA, Australia, NL, D, DK and applying it to the UK cases, for example: partnership working, adaptive management approach and modelling (USA, Australia), report card (Australia). The analysis is being used in a book on comparative practice (Earthscan 2011), and lessons are employed to develop a set of normative principles on best practice for CM. We conclude that lessons can be learnt from abroad for UK/EU catchment management, for example, promoting new forms of collaboration and localism through non-regulatory means. But potential constraints mean that higher level analysis should be sensitive to differences in governance approaches. This does not preclude trans-national lesson learning at lower levels, i.e. between catchments and transfer of ‘soft policy’ ideas, norms and best practices for enhanced partnerships and partnership working, and for adaptive management. Q. Funding was a crucial factor associated with improvements in Australia. In your studies in other
EU countries, are you taking the same approach in that finding, that funding was also associated with catchment management level activities?
Final Project Communications Workshop November 29, 2010 6
A. Funding is a really important issue in Australia. How that developed was initially through the Landcare movement. There were a lot of small groups emerging across Australia simultaneously and these were struggling to survive; it was the response of the federal government to provide funding. That worked reasonably well. I think it was recognized in Australia that if you wanted to promote these types of efforts at the local level you have to provide support. There are similar rationales in the US as there a number of federal funding initiatives at the state and local catchment levels, and to also help farmers. In the other EU cases we have studied, water suppliers, and thus water consumers and/or local taxpayers, have been the main source of funding.
Q. I’d like to come back to the question of scale where you compared USA and Australia with the
UK. Both the USA and Australia are federal countries, and in that respect the UK becomes similar to a state. Although you talked about support from the federal government in both of those countries with a top down process regarding catchment management, that’s like saying that the EU has in place a WFD and have obliged all the member states to implement the WFD. I would like to know what differences are there between the states in the USA and Australia for promoting catchment management in their own jurisdictions. That seems to be where the differences lie and where we can draw on principles regarding whether we need this top-down push from some sort of central organization.
A. There are two models in Australia – one in New South Wales and Victoria where the state government strongly supports catchment management through statutory institutions. In Queensland there is a lot of support from the state government in terms of finances, but there are many groups established as NGOs and not as part of the state system although they do receive funding. In the case of the Healthy Waterways programme they draw in funding from state. federal and private sources as well. As noted in the USA the scene is complex and varied. I do think that both provide interesting examples to look at in terms of comparisons as there are a number of different approaches.
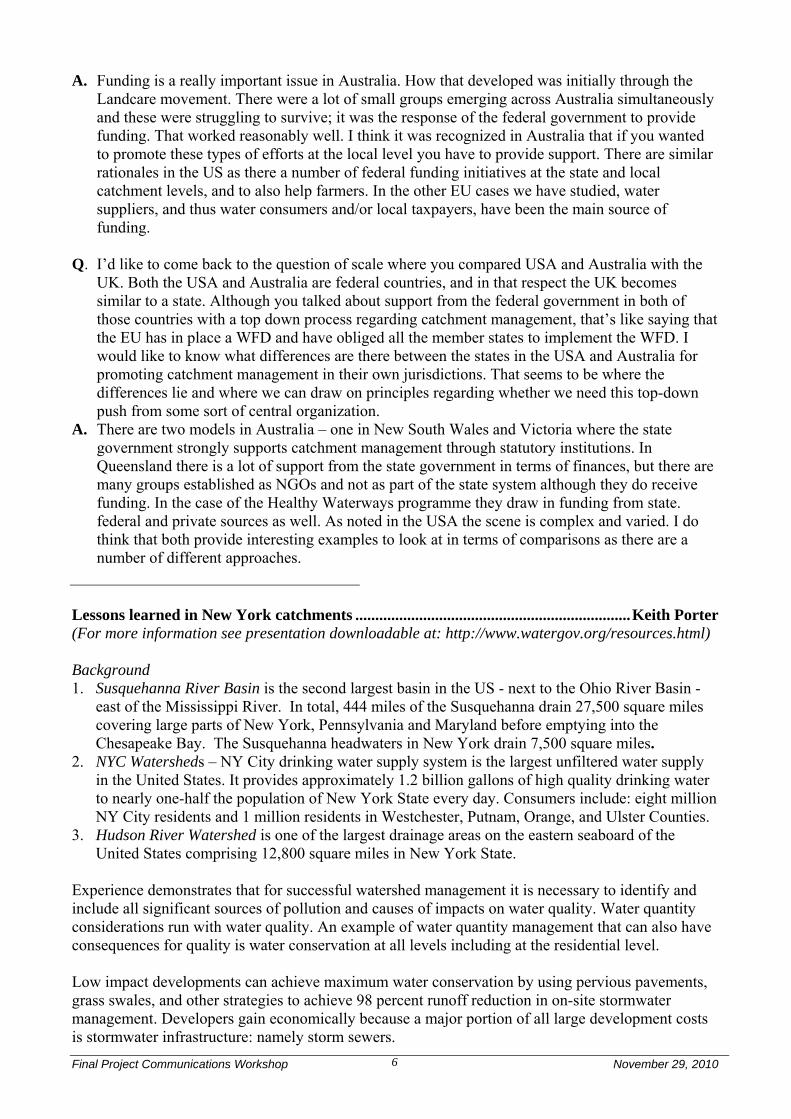
Lessons learned in New York catchments ..................................................................... Keith Porter (For more information see presentation downloadable at: http://www.watergov.org/resources.html) Background 1. Susquehanna River Basin is the second largest basin in the US - next to the Ohio River Basin -
east of the Mississippi River. In total, 444 miles of the Susquehanna drain 27,500 square miles covering large parts of New York, Pennsylvania and Maryland before emptying into the Chesapeake Bay. The Susquehanna headwaters in New York drain 7,500 square miles.
2. NYC Watersheds – NY City drinking water supply system is the largest unfiltered water supply in the United States. It provides approximately 1.2 billion gallons of high quality drinking water to nearly one-half the population of New York State every day. Consumers include: eight million NY City residents and 1 million residents in Westchester, Putnam, Orange, and Ulster Counties.
3. Hudson River Watershed is one of the largest drainage areas on the eastern seaboard of the United States comprising 12,800 square miles in New York State.
Experience demonstrates that for successful watershed management it is necessary to identify and include all significant sources of pollution and causes of impacts on water quality. Water quantity considerations run with water quality. An example of water quantity management that can also have consequences for quality is water conservation at all levels including at the residential level. Low impact developments can achieve maximum water conservation by using pervious pavements, grass swales, and other strategies to achieve 98 percent runoff reduction in on-site stormwater management. Developers gain economically because a major portion of all large development costs is stormwater infrastructure: namely storm sewers.

Final Project Communications Workshop November 29, 2010 7
Runoff and stormwater in the form of drainage is the single most significant cause of water quality and water quantity problems in the watershed. Drainage from highways is conventionally viewed as something to get rid of as quickly as possible. However, such drainage management exacerbates flooding risks and wastes water. Drainage is also a principal conveyance for pollutants to streams, which are the last barrier against pollution. Therefore stream protection is vital. In sum, there are three focal points for managing water in the watershed: at the source, the drainage of water across the landscape, and the stream corridor itself. Watershed management is costly. The high economic stakes mandate that decisions must be based on sound science. All watersheds in New York State are routinely monitored on a rotational basis. Who governs watersheds? The key to determining the governmental responsibility is at what level is the decision most appropriately made? Shared international waterbodies such as the Great Lakes, necessitate decision-making at the international levels. At the watershed level an array of governmental and other entities may be involved in partnerships representing federal, state and local units of government or organizations as demonstrated by the effective partnerships of the Susquehanna, New York City and Hudson River watersheds. However, partnerships of existing governmental units may leave a gap at the geographic scale of watersheds. Municipalities working together through inter-municipal agreements as provided under New York State law may fill this gap.
For local governments to play this role it is necessary to build capacity at the local level through technical providers. This raises the question - what technical legal tools are relevant and available at the local level? Examples include: Comprehensive Planning, Green Infrastructure Plans, Environmental Resources Overlay Maps, Lands of Conservation Interest Maps, Zoning Laws and Hazard Mitigation Plan. Key components of watershed management gleaned from the US examples are shown in the list at left.
Q. To what extent are providers of drinking water involved in the decision-making? A. Very substantially. The New York City Watershed program is actually managed through the
New York City Department of Environmental Protection, a utility that provides water for New York City. They have regulatory powers they guard vigorously but do it in a partnership way. But in the Hudson Valley where there is a desire to improve sub-basin management, the first constituent they go to for assistance is the water company, who often have a lead role.
Q. Does that put them in a trustee position? A. No. They invoke partners who can make the decisions to play a role in the municipality.
Sometimes the water companies are owned by the municipalities. The impetus often comes from the water companies to provide the facilitation to help organize in the watershed. Of all the uses of water in the states, whether for fish or recreation, the over-riding use is drinking water.
Q. I was pretty impressed by the Soil and Water Conservation Districts as technical providers when
we visited the US. Could you say a few words about the Districts?

Final Project Communications Workshop November 29, 2010 8
A. The Soil and Water Conservation District network nationally was created in response to the dust bowl problem in the 1930s. Congress recognized the desirability of providing technical support and that led to the encouragement of each state to pass state laws forming the Districts. They are county based and get their funding from county, state and federal levels. It is a true partnership, and they work closely with the US Department of Agriculture. The key aspects are that they work and mostly live in the county where they work, are well known and well respected.
Healthy Waterways: Healthy Catchments: Two decades of experience in South East Queensland, Australia ...................................................................................................... Diane Tarte (For more information see presentation downloadable at: http://www.watergov.org/resources.html) Background: • Population: 2.8 million; area: 22,672 km2; 14 major catchments • Fastest growing region in Australia • Since European settlement (circa 1850): catchment significantly altered; dams and weirs regulate
river flows; land clearing resulted in more flows, erosion and delivery of both nutrients and sediment; and decline in terrestrial and aquatic diversity.
Key drivers for change: 1) Fast growing population; 2)Security of water supply (quantity and
quality); 3) Concerns about industry viability - tourism, fishing and agriculture with total value of $5 billion/annum; 4) Increasing community expectations about improving water quality and ecosystem health; and 5) 18 government agencies with responsibility but no leadership; plus recognition that it would be cheaper to protect than to restore.
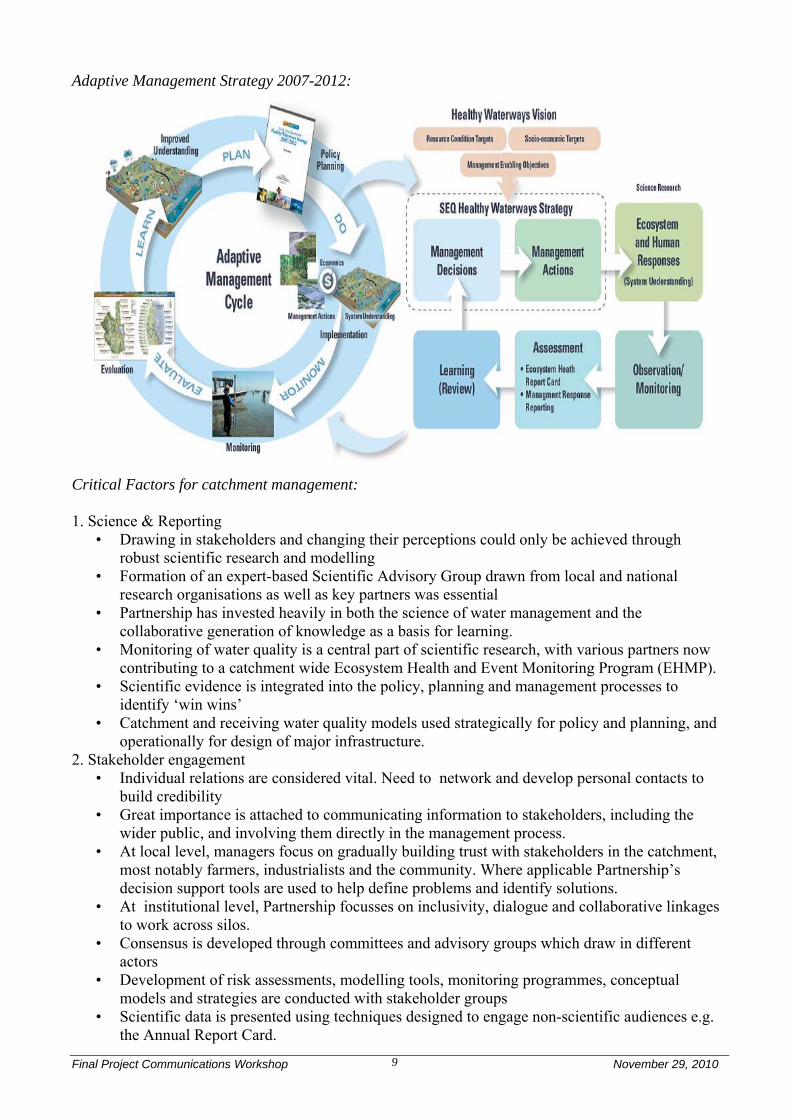
The Healthy Waterways Partnership has evolved in scope, capability, membership and governance arrangements over two decades. Development of holistic and integrated conceptual and modelling tools for analysis and communication has been essential; as has implementation of a cost-effective and integrated regional monitoring programme. Development and use of an annual Report Card has been central to the effective use of monitoring data and an adaptive management strategy well supported by partners. The Partnership has become scientifically, spatially, collaboratively and operationally more integrated, thus allowing the development of a more holistic approach to management. Successful implementation of the 2001 SEQ Water Quality Management Strategy resulting in some areas of improvement of waterways health including the Brisbane River where river-side real estate is now highly valued and recreational fishing improved significantly. The Partnership defines and measures success in two ways: Quantitative data on the condition of individual waterways reporting annually via aquatic Ecosystem Health Report Card … overall water quality appears to have stabilised despite increasing pressures from urbanization, population growth and climate change presenting growing management concerns. Market research with the community to gauge awareness and attitudes towards water issues in the catchment … community perceptions of the Partnership are positive with its activities enjoying a high recognition factor.
Final Project Communications Workshop November 29, 2010 9
Adaptive Management Strategy 2007-2012:
Critical Factors for catchment management: 1. Science & Reporting
• Drawing in stakeholders and changing their perceptions could only be achieved through robust scientific research and modelling
• Formation of an expert-based Scientific Advisory Group drawn from local and national research organisations as well as key partners was essential
• Partnership has invested heavily in both the science of water management and the collaborative generation of knowledge as a basis for learning.
• Monitoring of water quality is a central part of scientific research, with various partners now contributing to a catchment wide Ecosystem Health and Event Monitoring Program (EHMP).
• Scientific evidence is integrated into the policy, planning and management processes to identify ‘win wins’
• Catchment and receiving water quality models used strategically for policy and planning, and operationally for design of major infrastructure.
2. Stakeholder engagement • Individual relations are considered vital. Need to network and develop personal contacts to
build credibility • Great importance is attached to communicating information to stakeholders, including the
wider public, and involving them directly in the management process. • At local level, managers focus on gradually building trust with stakeholders in the catchment,
most notably farmers, industrialists and the community. Where applicable Partnership’s decision support tools are used to help define problems and identify solutions.
• At institutional level, Partnership focusses on inclusivity, dialogue and collaborative linkages to work across silos.
• Consensus is developed through committees and advisory groups which draw in different actors
• Development of risk assessments, modelling tools, monitoring programmes, conceptual models and strategies are conducted with stakeholder groups
• Scientific data is presented using techniques designed to engage non-scientific audiences e.g. the Annual Report Card.

Final Project Communications Workshop November 29, 2010 10
• Partnership sponsors annual Healthy Waterways Awards to showcase successes 3. Common Vision & Approach
By 2026, our waterways and catchments will be healthy ecosystems supporting the livelihoods and lifestyles of people in South East Queensland, and will be managed through collaboration between community, government and industry.
Two key principles: A commitment to working in a coordinated partnership structure in which all partners can be heard, contribute to decision-making and implement agreed actions within their own spheres of responsibility. Formulation of management strategies on the basis of sound science, rigorous monitoring of the waterways environment, and adaptive learning.
This common vision and approach allows the setting of specific targets for water quality which are being pursued through the adaptive management approach employed by the Partnership. 4. Linking to policy & planning frameworks
• Joined-up planning approach applied • Targets within the Healthy Waterways Strategy deliver the targets in NRM, land use
planning, water supply and environmental protection legislation. 5. Leadership - three forms are apparent:
Political leadership is of vital importance to successful implementation. Political actors are essential particularly in the early stages Support from local councils and within the state government is critical to current governance.
Scientific leadership is maintained through the Scientific Expert Panel, facilitating the involvement of leading scientists and the use of cutting edge scientific methodologies particularly in monitoring and modelling techniques. Managerial leadership is provided by the Partnership structure that facilitates collaboration between stakeholders throughout the various stages of the adaptive management framework.
6. Intermediaries • Leading individuals or ‘network champions’ have been significant in the growth of the
Partnership. Some are still involved after 15 years. • Key senior managers in partner organisations facilitate linkages between different
organisations allowing the transfer of ideas and creating a unified collaborative agenda. 7. Trust
• Establishment and maintenance of trust between members of the Partnership is essential. This takes time and builds on the opportunities for collaboration.
8. Resourcing • Drawing in of resources has also helped integration to occur • Partnership reliant on contributions from partners and external sources to deliver the regional
work programme • Individual partners undertake relevant on-ground activities either as part of their core
business or through special self-funded initiatives • Initially financial support for the regional program was provided by local councils and state
and Commonwealth governments. • Resources now sourced from other areas including support for research and monitoring from
universities, business and agencies through co-investment in special initiatives, and Commonwealth government schemes.
• Annual budget Aus $5-6 million. The Partnership originally evolved in response to severe water quality problems. Evolution could only then be maintained through:
the continual building of trust between participants, the broad based engagement of stakeholders including the public, the articulation of a common vision underpinned by clear goals,

Final Project Communications Workshop November 29, 2010 11
the construction of a strong science-based consensus, and the securing of resources.
At all times the Partnership has sought to integrate best available scientific knowledge generation with stakeholder engagement in an adaptive and collaborative approach. Adaptive cycles are based on comprehensive characterization of pollution sources and the receiving environment, collaborative planning, ongoing monitoring of impacts, science based evaluation and public reporting of results. Q. You’ll be aware of the political changes this side of the world and our current government, so
how would you advise us in the UK to maintain the core funding and the resources we need for catchment management?
A. You have to connect to the government’s program to understand what the government is trying to achieve, and look at their policies and see if this sort of collaborative approach will help them in meeting their policy outcomes. It is incredibly important to connect/link the catchment management program with the government’s policy initiatives. This applies at both the federal and state levels.
Protection of groundwater resources: Drenthe (NL) and Aalborg (DK) ......... Nico van der Moot (For more information see presentation downloadable at: http://www.watergov.org/resources.html) Drenthe – Experiences in the Netherlands Water protection scheme – Cyclic process:
• Restrictions within ground-water production fields Since 1983 – No agriculture “on top of” the production wells
• Restrictions within ground-water protection zones since 1989;
• Decreasing need for additional “pesticides policy” within groundwater protection zones since 2000
• No need for additional “manure policy” within groundwater protection zones since April 1, 2004.
WMD (water company) policy: • Voluntary Result/Reward-agreements between WMD and farmer
o Originally for both nitrate and pesticides o Only for pesticides since 2004
• Now effects of Result/Reward-agreements negligible o Stricter legislation (EU, national) o 2010 was the last year of the Result/Reward-agreements
Project – Water Sense (1) • Decision Supporting System; decreasing spilling of pesticides; lab on a chip? Project – Water Sense (2) • Decreasing irrigation • Decreasing loss of minerals • Protecting groundwater

Final Project Communications Workshop November 29, 2010 12
Drastrup Project – Experiences in Aalborg, Denmark In 1987 a decision was made by the City Council of Aalborg to make a holistic land use plan for the catchment area of the Drastrup Waterworks. Goals for the holistic land use plan were: drinking water obtained from untreated clean groundwater – now and for future generations; increase of woodlands; recreation in a landscape near the city for everybody; macroeconomic benefits and an increase in biodiversity. A new strategy to reach the goals consisted of: land swapping; buying farmland and transforming it to permanent grassland and forests; formulating an “Action Plan” for groundwater protection near the production wells; signing agreements with farmers on restricted use of manure and pesticides; and active communication with local citizens. The result was the ‘Drastrup Wedge’ which protected the groundwater in the catchment area, increased woodland and biodiversity, gave free access for recreation in natural areas, and connected the city of Aalborg with the countryside and nature reserves. Overall Results 1987-2010 • Leaking of NO3-N to the shallow groundwater
reduced to approximately 5 mg/l • Deeper down (15m-SL), increasing trend in nitrate
concentration changed to a decreasing trend • No pesticides used on approximately 800ha. • Afforestation of approximately 700ha. • Permanent natural grasslands on approximately
100ha. • Addition of approximately 20km of recreational
footpaths • Two pesticides-free towns (Drastrup and Frejlev) Q. Who is paying for the rewards in the Netherlands (NL) and the advice the farmers receive? A. The agreement was between the water company and the farmers, so the water company pays
from the drinking water revenues for both the rewards and the advice. Q. What was the reaction of the farmers in the NL to the removal of the payment for rewards
towards just the payment for advice? A. We started with the agreement with the farmers who were willing to participate and we informed
them just a short time ago that we were thinking of ending this scheme so they knew something was going to change. We still have some other policies with farmers like study groups where we have individual coaching of farmers.
Q. Do you think the advice and coaching will be as effective as the rewards? A. Advice also works as long as you can show the farmers effective practical results. When they see
that it works, they are more willing to participate. Q. I am curious in the Drastrup Project about the social and cultural effects of losing quite a lot of
farmers and farmland as the landscape changed. You are effectively removing markets, changing relationships with the land, and the economy, and I wondered if the changes to society were taken into account?
A. It has been a success to make this a recreation area in Denmark. There are many other factors involved in the landscape changes such as the increasing value of the land, so some of the

Final Project Communications Workshop November 29, 2010 13
farmers have sold their land and benefited from this. The project is well regarded both locally and nationally as a success story.
A. There has been a similar situation in the Netherlands. In front of their colleagues the farmers didn’t want to sell their land, but in private the next day they were willing to sell the land.
New Challenges for Cooperative and Voluntary Agreements in Drinking Water Protection Areas in Lower Saxony ................................................................................................. Christina Aue (For more information see presentation downloadable at: http://www.watergov.org/resources.html) Background Groundwater is the main source for drinking water (86 %). There are 300 water suppliers in Lower Saxony (LS; mostly public water boards). Thirteen percent of the total area of LS is water catchment area. Recharge is approximately 300 mm/year (in the northwest of LS). Fifty percent of the catchments are arable plots, and there are over 12000 farmers collaborating within the scheme on voluntary agreements to implement water protection measures on an area of over 100,000 ha, approcimately one third of the agricultural area.
Since the late 1980s, nitrate and pesticides have been a problem. There was political will to choose a different solution to simply regulation; i.e. a cooperative and voluntary approach which translated to a water protection decree in 1994. €22 million per year is spent from revenue from a water abstraction charge. Thus the water consumer is paying for better practice (over and above the norm) in farming in water recharge areas. Water suppliers have been responsible for the administration of the voluntary
approach in their catchments since 2008. This was successful. (See graph above concerning nitrates.) Growing Threats: • Politics: changes in the administration and in public interest • Livestock density increased • World food market and higher prices support intensification • Shortage of fuel → policy support for energy crops • Climate change: demands decarbonization → support of energy crops • Nitrogen is no longer exported by meat production • Biomass plants are demanding additional space, in a region with intensive animal husbandry and
rising land prices • Maize is the most effective culture producing CH4 • Additional increase of maize ( + >10% in the last few years), where growing of maize has
already been the main problem • Rising N-load Consequences:rapid development in LS • Growing animal density and ploughing of grasslands • Rising nitrate values and deterioriating water quality

Final Project Communications Workshop November 29, 2010 14
• Challenges for voluntary agreements: existing legal framework for agricultural production is either not defining targets, or not appropriate to respond to the pressures already there.
Conclusions • Need a law to support green energy— need a clear reform towards ecological standards • Support is needed from agriculture and politics and administration, to cope with the bioenergy
plants in place • Changes in agreements with farmers, with more focus on results and adjustments of the measures
needed • Climate change action should not consider only CO2, but should include N2O, etc. • Farmers need a much better education in the field of ecosystem and landscape values • Value of soil, water, air and biodiversity is not clarified by the society, therefore standards need
to be defined and kept • We urgently need true/ secure evaluation schemes • Before deciding about funding options, evaluate the scheme with regard to eco-system balancing
including N2O, and including external costs and external effects. Q. I see you are having trouble keeping your nitrate levels below 50 mg/l which is an issue in this
country in the areas of intensive farming. Are there any national incentives if you reach those limits, and what are you planning to do to make sure you stay below 50 mg/l?
A. We as a water supplier have to abide by the 50 mg/l and we are much lower than that because we are producing water from very deep layers, but there no restrictions because the problem of diffuse pollution is such that it is not easy to determine where it comes from. It might be from the maize this year or the wheat grown last year.
Q. Are you blending your water? A. At this time we have many production wells but there is some blending. Piloting adaptive catchment management in the Thurne & Tamar ………………………………………………………………………Alex Inman and Tobias Kruger (For more information see presentation downloadable at: http://www.watergov.org/resources.html) In the upper Thurne catchment and the Tamar River catchment, we started our process to develop a management plan by talking to people about our objectives. Through ‘circuit riding’ (i.e. initial preparatory contact and discussion with individuals by phone and meetings) in both catchments, we asked people to join us, bringing an open mind. We learned a great deal from this ‘circuit riding’, including the fears and sensitivities people had about this process. These tensions were important to understand. We also tried to engage with those who did not usually take part in this type of effort, and those who in the past had been distrustful of scientists and government agencies. We also encouraged farmers to participate. From our ‘circuit riding’ those participating in our meetings had gained an understanding of what they were getting into and therefore came with a collaborative mindset. In our first workshop in 2008, many groups were represented, including
Final Project Communications Workshop November 29, 2010 15
farmers. We presented basic information about each catchment, and undertook an exercise for the participants to help define the problems they recognized as being key. It was important that the definition of the problems be led by stakeholders. In our 2nd workshop, we responded to requests to make use of existing data and to make it more accessible. In particular we introduced and developed with stakeholders an ecosystems health report card for the Thurne catchment. In the Tamar we made use of Environment Agency WFD classification maps. Both were well received. We also introduced the idea of models that could predict changes that might impact water quality, and we received a mandate to build a model. In the 3rd workshop we tested the model using different simulations which helped the stakeholders understand why there were certain problems in each catchment. We had a further meeting with farmers to gather better land use data and to use it to ground-truth the model. In the 4th workshop, we proposed a management plan with estimated costs and discussed governance arrangements for its delivery. The stakeholders decided that a multi-sectoral response was needed. Innovative and interactive use of modelling helped frame the scale and severity of problems. Catchments are complex – so we need models that help us characterise them, set water quality goals and identify the best mix of actions. Decisions are thus at least partly based on model outcomes, and everyone involved needs to accept the validity of the model results. Modelling requires an adaptive cycle itself, and can be considered a form of social learning. Our procedure with the stakeholders in both catchments was as follows. First we presented the perceptual model in the form of a network diagram and developed a collective understanding of the factors and causal linkages that were important; identifying factors that can be managed as well as natural mediating factors. Revisions followed based on suggestions by stakeholders after each demonstrated use, particularly of the graphically presented results, and after ground-truthing of data inputs with farmers. We piloted the phosphorus component in the project (but further work will develop the modelling approach for nitrogen and other pollutants). In the Tamar initial scepticism about the use of models was overcome by this process. Overall regarding this first stage in the modelling process, we learned the following lessons.
• It was agreed that models can lend scientific credibility to catchment management and serve as a basis for scenarios and cost-benefit analysis.
• Stakeholders advised that the model must not neglect the effects of sewage treatment works, septic tanks, soils, land management and roads.
• This created new challenges as the understanding of some of these processes is incomplete and data are limited – the stakeholders drove the agenda at this point.
Actual model development was based on export coefficients for categories of land use or other activities, and on the source-mobilisation-pathway paradigm. Lessons from the formal model development and use were that:
• The fact that the model looks at all sources of pollution, not just agriculture, added to its credibility
• Discussions evolved around explicit vs. implicit representations, the dominance of some factors which justifies the exclusion of others & how model limitations are accounted for in uncertainty estimates
• Despite its limitations, the model can be claimed to be useful because it makes best use of all available data & uncertainties are quantified
• Farmers appreciated the concept of probability & explained it to others in non-scientific terms (collective learning).

Final Project Communications Workshop November 29, 2010 16
Conclusions • Modelling provided a platform for stakeholders to collaboratively frame the scale and severity of
the problem, and develop a collective understanding of uncertainty. • Stakeholders had the opportunity to model potential solutions to the problem in real time,
stimulating highly dynamic and engaged discussion. • Modelling allowed an appreciation of trade-offs to be developed. Provision of indicative scenario
costs provided all important economic reality to the debate.
• The model became an explicit vehicle for stakeholders to incorporate their knowledge within the problem solving process (see table on the right), thereby stimulating ownership and gaining trust in the outcomes.
• Co-production of models clarifies expectations, encourages transparency and openness.
• Being explicit about uncertainties helps build trust.
• Measured data will always be limited – stakeholder (especially farmer) knowledge can plug important gaps and this encourages ownership.
• There remains the issue of confidentiality. Who will govern the model that is collectively produced?
• And modelling will only add value if it is adapted and refined as additional monitoring data becomes available. Ways must be found to make this as inexpensive as possible.
Q. This was done as a research project, and in my experience one usually goes into a research
project with the problems defined. I’m curious to what extent did the stakeholders need to grapple with scope, scale and science of the problem to come up with management solutions?
A. Framing of the problem is absolutely key. We in the science community can say we know what the problems are, but there is a lot of distrust about science by individuals, including farmers, who live in the catchment. To build trust we went back to first principles and asked the stakeholders what they thought the problems actually were. This seemed to set the right tone, and people started believing in the overall approach and subsequently the model. Collective understanding of the scope, scale and science of the problem developed during the process, but a usable and accepted model was essential to make the real world complexity manageable.
Q. You said several times in your presentation that you didn’t have time or resources to take a
decision to implement a plan. I was wondering what kind of decision you could have taken in the first place, and where would the decision about an integrated plan have gone politically?
A. You have raised the question of governance and about who would deliver the plan. We discussed this with our stakeholders in the last workshop. People raised the idea of having some kind of a coordinating organization that could bring the plan together, and possibly have a central coordinator. It would be up to the stakeholder groups to take the project forward.
A. We were very careful not to promise more than we could deliver. We explained this was a research effort in piloting a process, and that we were not empowering the stakeholders to make decisions for their catchments. However, through the circuit riding and the process of engaging the stakeholders we engendered a lot of interest and support, and it became possible to envision moving towards implementation were resources and decision-making authority available. We now have confidence concerning recommendations that we can put into a template for catchment management having gone through this process.
Final Project Communications Workshop November 29, 2010 17
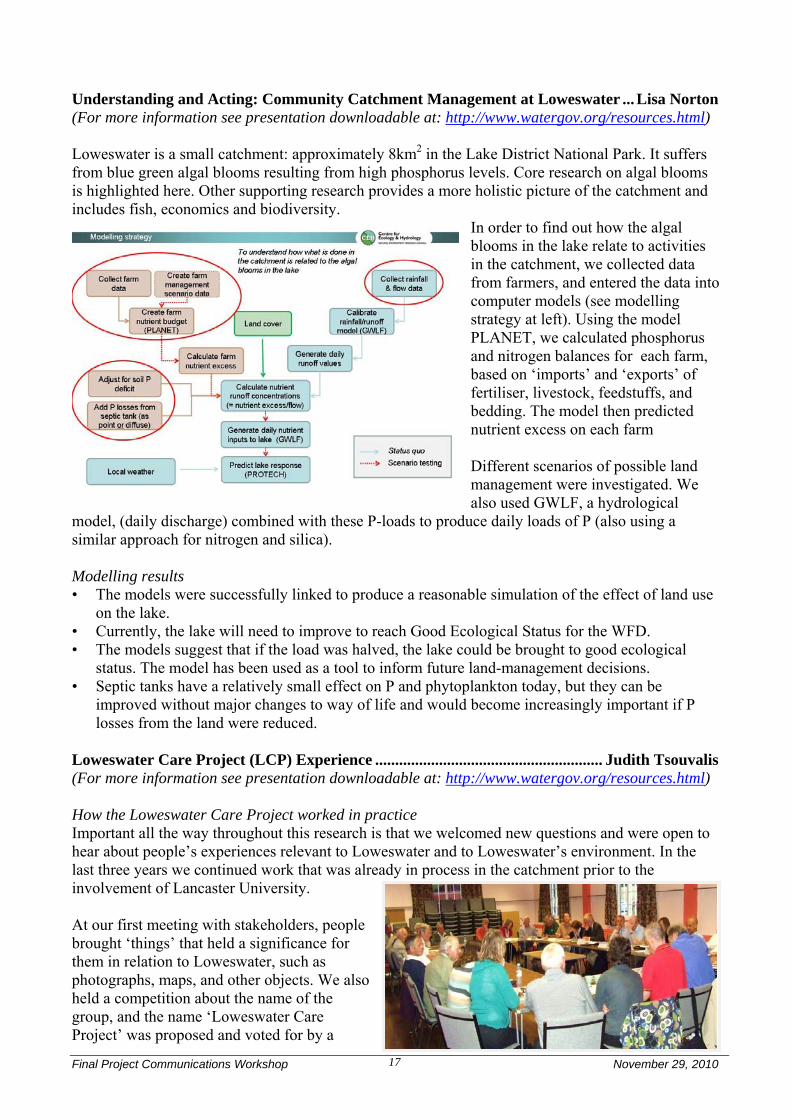
Understanding and Acting: Community Catchment Management at Loweswater ... Lisa Norton (For more information see presentation downloadable at: http://www.watergov.org/resources.html) Loweswater is a small catchment: approximately 8km2 in the Lake District National Park. It suffers from blue green algal blooms resulting from high phosphorus levels. Core research on algal blooms is highlighted here. Other supporting research provides a more holistic picture of the catchment and includes fish, economics and biodiversity.
In order to find out how the algal blooms in the lake relate to activities in the catchment, we collected data from farmers, and entered the data into computer models (see modelling strategy at left). Using the model PLANET, we calculated phosphorus and nitrogen balances for each farm, based on ‘imports’ and ‘exports’ of fertiliser, livestock, feedstuffs, and bedding. The model then predicted nutrient excess on each farm Different scenarios of possible land management were investigated. We also used GWLF, a hydrological
model, (daily discharge) combined with these P-loads to produce daily loads of P (also using a similar approach for nitrogen and silica). Modelling results • The models were successfully linked to produce a reasonable simulation of the effect of land use
on the lake. • Currently, the lake will need to improve to reach Good Ecological Status for the WFD. • The models suggest that if the load was halved, the lake could be brought to good ecological
status. The model has been used as a tool to inform future land-management decisions. • Septic tanks have a relatively small effect on P and phytoplankton today, but they can be
improved without major changes to way of life and would become increasingly important if P losses from the land were reduced.
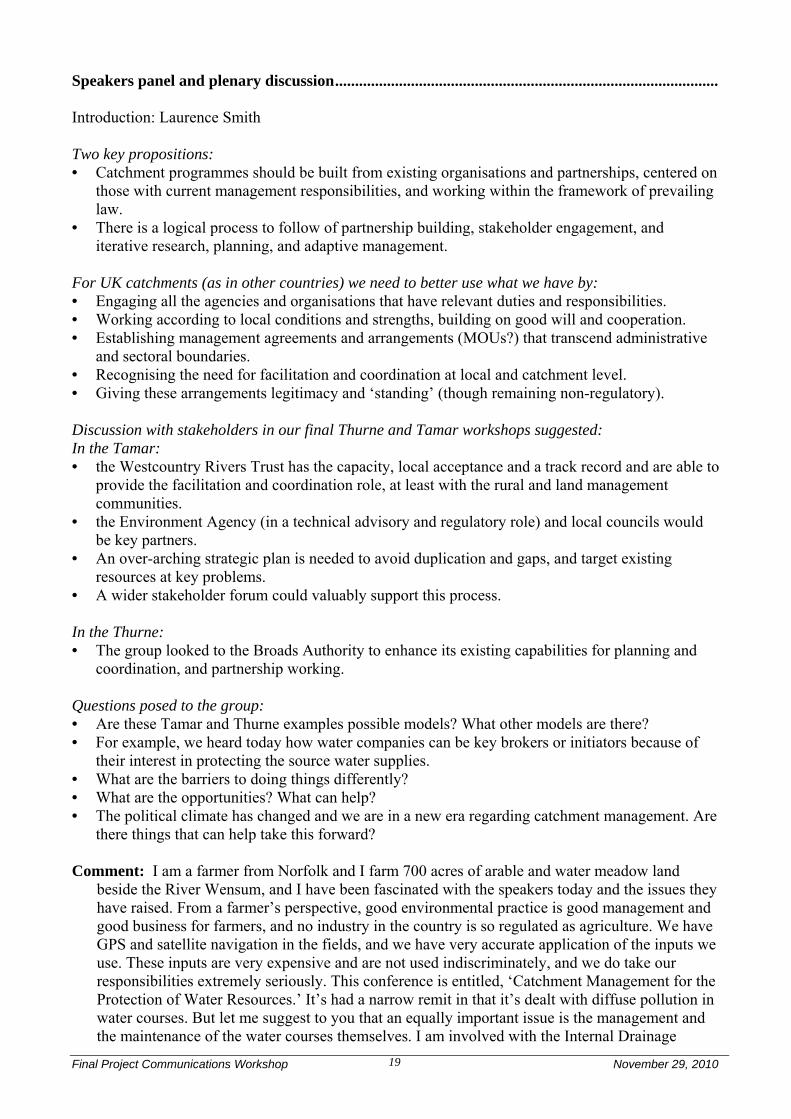
Loweswater Care Project (LCP) Experience ......................................................... Judith Tsouvalis (For more information see presentation downloadable at: http://www.watergov.org/resources.html)
How the Loweswater Care Project worked in practice Important all the way throughout this research is that we welcomed new questions and were open to hear about people’s experiences relevant to Loweswater and to Loweswater’s environment. In the last three years we continued work that was already in process in the catchment prior to the involvement of Lancaster University. At our first meeting with stakeholders, people brought ‘things’ that held a significance for them in relation to Loweswater, such as photographs, maps, and other objects. We also held a competition about the name of the group, and the name ‘Loweswater Care Project’ was proposed and voted for by a

Final Project Communications Workshop November 29, 2010 18
majority. The LCP’s vision is to gain a better understanding of the diverse challenges faced by the Loweswater catchment and together to seek economically, socially and ecologically viable ways forward and to put them into practice. The project resulted in a better understanding of: Lake, land and ecology • Only 37% of the catchment is intensively farmed. • Stocking rates are consistent with the carrying capacity of the land, not big farms, not many
stock. • Fertiliser applied is mostly taken up by grass. • Farmers are not making lots of money in this marginally viable upland agriculture. Without EU
support farmers would be out of business. • Farmers continue to work together and may be able to gain both economic and ecological
benefits within the catchment. • Even though farmers are doing what they can and make a basic living off this rather marginal
agricultural land, there may still be nutrients coming through the soil down to the lake. Community governance • Local people are active, interested, and willing to participate and take action. • Relations between local people and agencies are strengthening – e.g. maintenance actions taken
by the National Trust together with farmers. • Agencies have expressed a willingness to adapt policies to local needs and collaborate with local
people on specified initiatives. An important and innovative participatory mechanism within the project was a budget of £35k to be allocated by the LCP itself on research which it selected. Three important questions • Is the political system as we know it, with its current processes and structures, ready for more
radical approaches to public participation in environmental governance? • Are publics ready and able to participate? • What further needs to be done to empower publics to do so? Comment: This is linked closely to what we are trying to do in Hampshire with our Hampshire
Water Partnership and the Upper Itchen Water Group. We are also trying to raise awareness in the Upper Itchen of phosphorus pollution amongst fish farmers and watercress beds. An annual Water Festival was one way of doing that. Engaging with local people is a key part of the process.
Q. Regarding the budget that was at the disposal of the community for scientific research, how
fundamental was that aspect in the overall project, and do you think the LCP will continue beyond the RELU project?
A. The small amounts given out were enormously important as the local people could make their own decisions about what they thought was important. The empowerment we gave them was significant and some of the locals could actually do some of the work. Even for the work they didn’t do themselves, they were very interested in the results.
A. For the future of LCP, the group has already met once to think about what they want to do, and if they want to join other parishes. They know the nature of the problem and how much they can do, and what actions should be taken to have an effect. They can get together now on any issue, and can lobby in the future.
Final Project Communications Workshop November 29, 2010 19
Speakers panel and plenary discussion ................................................................................................ Introduction: Laurence Smith Two key propositions: • Catchment programmes should be built from existing organisations and partnerships, centered on
those with current management responsibilities, and working within the framework of prevailing law.
• There is a logical process to follow of partnership building, stakeholder engagement, and iterative research, planning, and adaptive management.
For UK catchments (as in other countries) we need to better use what we have by: • Engaging all the agencies and organisations that have relevant duties and responsibilities. • Working according to local conditions and strengths, building on good will and cooperation. • Establishing management agreements and arrangements (MOUs?) that transcend administrative
and sectoral boundaries. • Recognising the need for facilitation and coordination at local and catchment level. • Giving these arrangements legitimacy and ‘standing’ (though remaining non-regulatory). Discussion with stakeholders in our final Thurne and Tamar workshops suggested: In the Tamar: • the Westcountry Rivers Trust has the capacity, local acceptance and a track record and are able to
provide the facilitation and coordination role, at least with the rural and land management communities.
• the Environment Agency (in a technical advisory and regulatory role) and local councils would be key partners.
• An over-arching strategic plan is needed to avoid duplication and gaps, and target existing resources at key problems.
• A wider stakeholder forum could valuably support this process. In the Thurne: • The group looked to the Broads Authority to enhance its existing capabilities for planning and
coordination, and partnership working. Questions posed to the group: • Are these Tamar and Thurne examples possible models? What other models are there? • For example, we heard today how water companies can be key brokers or initiators because of
their interest in protecting the source water supplies. • What are the barriers to doing things differently? • What are the opportunities? What can help? • The political climate has changed and we are in a new era regarding catchment management. Are
there things that can help take this forward? Comment: I am a farmer from Norfolk and I farm 700 acres of arable and water meadow land
beside the River Wensum, and I have been fascinated with the speakers today and the issues they have raised. From a farmer’s perspective, good environmental practice is good management and good business for farmers, and no industry in the country is so regulated as agriculture. We have GPS and satellite navigation in the fields, and we have very accurate application of the inputs we use. These inputs are very expensive and are not used indiscriminately, and we do take our responsibilities extremely seriously. This conference is entitled, ‘Catchment Management for the Protection of Water Resources.’ It’s had a narrow remit in that it’s dealt with diffuse pollution in water courses. But let me suggest to you that an equally important issue is the management and the maintenance of the water courses themselves. I am involved with the Internal Drainage

Final Project Communications Workshop November 29, 2010 20
Boards, and the Environment Agency has responsibility for the main rivers. One will not work without the other. And it’s all a question of balance to keep the interest of the farmer, the recreational use for fishing, and most importantly the agri-environment schemes by DEFRA and the entry level schemes which produce so much benefit for biodiversity working well. It is crucial to keep this balance between the interests of all the stakeholders. The message I would like you to go away with is the farming community are well on board with catchment management and the protection of the water courses. In my particular case we have diversified like many other farmers. Sixty percent of the farmers get their income from other things. We’re no longer farmers, and we’re no longer even land managers. We are now asset managers which embraces buildings, pathways, woodlands, and all the other elements which the public so enjoy and expect to see. I dread the day when support is withdrawn from the hill areas. We’ve seen this in the Lake District and the Peak District which will revert to scrub if we don’t keep the grazing rights in the uplands. There are a lot of messages to be had from this work, and I welcome the opportunity to attend this forum. I hope those in high places in the government will take notice of what you’ve done and we can move forward together.
Q. I work for the OECD and am coming from a completely different angle from the previous
speaker by looking at this internationally. The presentations today on catchment management have been very good as this approach is certainly catching on across most countries. However, there are a few ‘buts’ here. One problem I see is that each presenter talked about a different environment in which farmers operate. In Australia, farmers have very little in the way of subsidies compared with our policies in the UK and Europe. These are important drivers of what farmers are doing in catchments. However, the problem remains that if you go to New Zealand where there are no subsidies to farmers you see pollution mounting. This is because the world price of dairy products is going up and that creates more dairies and more problems. According to the Environment Agency phosphorus and nitrate pollution are mainly coming from agriculture. And most countries share the same problem. My question is to the catchment team for two things: this approach is important because the cost of controlling pollution in agriculture is going up and getting very costly for farmers. An example is the Chesapeake Bay where the government has poured billions of dollars to farmers over the years and nothing much has changed. They are now taking a much harder approach. My question is that we have to think about the politics. In the case of New Zealand, the central government has come in and imposed regulations at the regional catchment level where the local level would not adopt a catchment approach because of local politics. So there can be conflicts in the catchment approach and at the local level. I would be interested to hear what you think about that? The other issue is the economics. While the catchment approach is very sensible it could be very costly. Where will the money come from in the longer term? One of the solutions we’re looking at is water companies paying farmers to put in practices so they don’t pollute (similar to what has been said here). Another issue is water quality trading and I wonder if in any of the research you’ve done if you’ve looked at that? Another question is why would water companies pay farmers not to pollute? Why not go down the regulatory road and maybe prosecute the farmer? This brings in the much broader ‘polluter pays’ principle. This report I’m writing will see the light of day next year, and there are case studies you might be interested in. But I can’t hand it out now. If you are interested I will send you a copy.
A. Regarding trading, we haven’t seen it work because you can’t trade what you should be doing anyway. How do you measure the threshold? Where trading seems to be somewhat attractive is where you are trading a point source against farming. In practice, however, it is very hard to work it out as the farmer has to meet a certain standard first and then trade beyond that. And, what is that standard? You said that the Chesapeake Bay Program is failing, and that is correct. You also said that it was due to farming. I would question that. In southern Pennsylvania, Maryland and Delaware development has occurred at an incredible pace. We recently flew into Philadelphia and we were struck by the huge urban sprawl. The stormwater runoff of that huge sprawling area is very damaging to the Bay, and EPA recognizes that. In New York State there is
Final Project Communications Workshop November 29, 2010 21
a very strong preference for farming rather than development as it is less damaging to water quality. Regarding the ‘polluter pays principle’, in the case of the Chesapeake Bay and in the New York City Watersheds the farmers are being asked to manage their farms in such a sanitary way they are incurring costs way above what a conventional farmer would incur. The point the NY farmers in the headwaters of the Chesapeake Bay make is, why should they incur those costs for the benefit of the wealthy yacht-owners in the Bay 400 miles away?
Comment: In the context of all the public goods and services in the catchment, the ‘polluter pays’
is one way of policing how someone is denigrating one of those services. The reciprocal of that is ‘provider is paid’ and that is a very good mechanism for creating positive feedback into the catchment. One should appreciate in a rural catchment that 80 percent of the land is owned and managed by a very small proportion of the population and they are providing the ecosystem services as well. If you can make a link to those beneficiaries of the ecosystem services, and some of them will be very visible, you will be able to create markets. Other services will be more nebulous and that will have to come from general taxation. ‘Polluter pays’ is a nice alliterative aphorism that has gained a lot of momentum. I would like to put forward the ‘provider is paid’ to counteract it.
Q. What does the panel think about the other contributors of pollution in catchments besides
agriculture? For example, farmers have been estimated to contribute 80 percent of the phosphorus problem but there is uncertainty. What do the panel think is the role of apportionment in this?
A. Apportionment is really crucial, but from my perspective it is about understanding your contribution to the problem. One has to do a characterization of the problem, understand the sources of the problem, then start to understand the mechanisms for the solution. You have to do it in that systematic way and be able to prove it. One of the slides I was unable to show was our ability through our decision support tools to identify nitrogen, phosphorus and sediment, our three problem children, and be able to differentiate the sources of nitrogen from point sources, rural diffuse and urban diffuse pollution as well as natural forest because we have to understand natural systems might be a contribution as well. One of the interesting things in solving this problem is our legacy issues. We have a handle on these issues and can work out the economic mechanisms to resolve and improve management practices for the rural and urban landscapes. In our country we have a 150 year legacy of massive landscape hydrological change which is going to require at least AUS $500M and perhaps closer to AUS $1 billion in investment to resolve. In understanding apportionment we also have to understand legacy issues and understand where it’s going to be a public good outcome as opposed to structural adjustment for an industry, whether it’s urban development or grazing, farming or fishing. It is fair and reasonable to ask of the industry itself public good outcomes. If it is for the public good, then there needs to be public funding support. In our country we are building an emission trading scheme around carbon offsetting that will start to produce a carbon economy. The Australian government has just made a decision that the first investment can go into the agricultural landscape for vegetation and riparian restoration, and start to get multiple benefits. In answering the previous speaker’s question, the economics of industry are really crucial to understand. Many of our farmers are struggling to meet the extra requests. However, the first speaker pointed out that there are win/wins, and there are practices that when followed make good economic sense for farmers. It has been our experience that 25-30 percent of landowners don’t want to do anything, but many are prepared to meet us half-way. We are still arguing with water utilities that investing in catchment management makes good sense. We recently had members out from New York State to argue the case that water treatment costs in our part of the world could actually start to account for catchment investment as part of the water pricing pathway. There are some breakthroughs that others have that we are still a long way from implementing.

Final Project Communications Workshop November 29, 2010 22
Q. I was late given the transportation problems and didn’t hear earlier presentations, but I would like
to mention that there are important factors in mitigating conflict working with stakeholders, and one of them is design. It is important to design your stakeholder arrangements and not do it in an ad hoc way. Another is having stakeholders share in the decision-making and forming of recommendations, and not just sharing information and knowledge for its own sake. I have been curious regarding all relevant RELU projects regarding the extent to which the stakeholder processes were designed in advance, i.e. how many workshops you would have, who should be involved, what is the key focus, and how you would export ideas?
A. I would agree that design is a crucial and participation requires preparation, time and coordination. You cannot have a successful outcome without a good design. We spent a lot of time drafting our process, going through several iterations. But when you are dealing with people you also have to be able to change your engagement when necessary because politics and other factors change. Our design was ‘to design’ and then to have the community take control. We specifically planned for that and it happened within the relatively narrowly defined context of catchment management planning for water quality.
Q. We have heard earlier the role local governments play in Germany, Netherlands, and Denmark,
and we know about Australia and the US. But in Britain catchment issues are under-represented in our governmental structure, particularly in local governments. What should we do in order to balance the role of the voluntary sector with political accountability at the local level?
A. Local government is well represented in Internal Drainage Boards in some of the sensitive environmental areas in the country, particularly on the River Wensum which has special area of conservation status as it is one of the most important chalk rivers in the country. The local authority members out number the elected members and if anything comes up that the local authority members don’t like they can vote it off. They can even actually vote to change what is paid to the Drainage Boards, so they are very much in control. One key factor is to retain input from local people who live and work in the area when it comes commenting and dealing with management of flood defense issues. This government is committed to localism, but the signs from Defra are not good when it comes to dealing with water management issues. The IDBs have been under threat for a considerable amount of time, and we want a period of stability where local people can have their knowledge and experience put to good use. If this is centralized, that very valuable resource will be lost to the detriment of the rural economy.
Q. This question is in response to the group in the Thurne regarding the Broads Authority stepping
up and taking the ideas presented forward. There are two things stopping us. One is the institutional demarcation. As individual officers we try to work to share across those boundaries with other organizations, but the institutions themselves make it very difficult. With the current cuts everybody is pulling back and saying that is not really our work and we are going to have to look after our own resources now. And there is also the reluctance of releasing power to somebody else who may set your priorities. The second thing stopping us is that on the community side regarding involvement of stakeholders, the initial thinking is relatively myopic. For example, I’m sure we can think here of brilliant ways to make the NHS work. But then when you look at it, it doesn’t seem to work, you can’t get that done that way, and you end up with your brilliant idea not making a blind bit of difference. There are many people in the community who are highly motivated and wanting change, but they don’t necessarily have the breadth and depth of vision. The challenge then becomes how you can give them that depth and breadth in the short time we allocate to this process. People say it takes a very long time, or we haven’t done it because we don’t have the resources. Can the panel think of any ways of getting past those two blocks – the institutional demarcation and the community’s potentially myopic approach?

Final Project Communications Workshop November 29, 2010 23
A. One way we deal with this is to talk with provincial authorities. In the Netherlands, the provincial authorities are the managers of the groundwater. If we observe a problem then it is their problem also.
A. Many of our stakeholders in Germany are aware of the problems and are talking to us about difficult affairs. We tried to find solutions for them. It is very important for local government to try to find the time necessary to engage with people and work out manageable solutions. Since recent reforms in administration many duties came down to the local level. Now they are over loaded with work and don’t have the time or capacity to talk about problems in detail. For example, some of the farmers wanted to have their hens outdoors, and they were told what they needed to do, but it wasn’t clear who would control them and see they abide by the rules.
A. In Australia we use the predictive capacity of our models to show scenarios for the future. And we use the consequences of that in terms of ecosystems outcomes. For example, I could show you a slide that has the loadings of sediment to Morton Bay in 20 years time and by turning conditions on and off in our urban and rural landscapes we run future scenarios. Often we are myopic as we are concerned about the here and now, and seldom do we understand the cumulative impact and changes over time of the ecosystem impacts. Our monitoring programme allows us to constantly report back on conditions and trends. We are part of a group of people starting to develop a concept of national environment accounts for Australia, picking up work that is happening for the UN because one of our charges is that we are constantly drawing down our natural capital without understanding the consequences for our socio-economic communities. If we can paint a picture and measure what we are trying to manage, valuing the ecosystem services and understanding conditions and trends, and using tools that can communicate those messages, then people can start to understand the consequences. The other issue is how to get organizations to work together. Because there are many groups – regulators, service providers and so on - with a range of complex relationships, there is a need for a bridging organization. This bridging organization establishes trust and independence and works with everyone. It can also be the third party and facilitate the discussions on issues. By using existing organizations and capturing a nucleus of key people who can act as moderators and facilitators they can be the custodians of the decision support tools; refreshing and renewing the tools as necessary. But it is key that communities and their service providers have ownership and custody of the plans.
A. Our project in Denmark started because we had a problem with pollution and people had to boil water before they could drink or use it. The City Council felt responsible to the people, and they asked what can we do? In our municipality plans one of the most important priorities is to keep the drinking water clean for the future.
Comment: I have chaired the Upper Thurne working group for 10 years for the Broads Authority,
and I’ve currently been working with Defra, the Environment Agency, Anglian Water and a number of other bodies around the idea of sustainable water use and drainage. Many good things have been said here. First, we have to capture the ecosystem services issue. The farmers are sitting on different sets of assets as a whole new bundle of benefits are coming through the ownership of land. That brings up the issue of landscapes and not just catchments. So we have to do multiple catchment work. Secondly, there are important pieces of legislation: an upgrade on the flood water management act which is important for drainage in local authorities; a natural wildlife scheme which is very significant for ecosystem services and community buy-in to nature; and a very important planning and localism bill which will dramatically change the way planning is set up in this country. So a key message is to be aware of is how legislation is moving in this country because of the new government. The big commercial and public interest sectors are beginning to take an interest in ecosystem services, changing the way in which costs are laid out and regulation is managed, and how planning boards fit into that. So a huge new system of delivery is in the offing, and this means that we can find a way for the universities, who are long-term players, to reengage. We need this third party to allow stakeholders to have confidence in the way these changes are taking place and to provide the scientific evidence and decision support tools needed.

Final Project Communications Workshop November 29, 2010 24
List of Delegates
First name Surname Organisation Sebastian ............ Anstruther ............... The Barlavington Estate Office Christina ............. Aue .......................... OOWV, Germany Eddie ................. Balls ........................ Northumbrian Water Ltd (Essex & Suffolk Water) Jenny .................. Bashford .................. National Farmers Union Clare .................. Benskin Lancaster University David ................ Benson .................... University of East Anglia Paul .................... Biggins .................... Environment Agency Michael ............. Bowes ...................... Cornell Law School, USA Dylan ................. Bright ...................... Westcountry Rivers Trust Robert ............... Bulmer .................... Hutchinsons Environmental Services Peter ................... Burgess .................... Devon Wildlife Trust Phil ..................... Burston .................... Royal Society for Protection of Birds John ................... Carrick .................... Norfolk Rivers IDB Terry .................. Carroll ..................... Centre for Rural Economy, Newcastle University Ross ................... Cherrington ............. Westcountry Rivers Trust Andrew .............. Chivers .................... Anglian Water Services Tim..................... Clarke ...................... Pang, Kennet and Lambourn FWAG Richard ............... Cole ......................... DEFRA Hadrian .............. Cook ........................ Harnham Water Meadows Trust Glen ................... Cooper ..................... Natural England Rodney ............... Dibble ...................... Launceston Anglers Mrs ..................... Dibble Julia .................... Dobtsis .................... Cornell Law School, USA Thomas .............. Dolan ....................... Cranfield University Stephen ............. Dury ........................ Somerset County Council Mark ................... Elliott ...................... Devon Wildlife Trust Simon ................. Engler ...................... Natural England Paul ................... Hammett .................. National Union of Farmers Bob..................... Harris ...................... DEFRA (FFG) Eddie ................. Hergerl AO .............. Marine Ecosystem Policy Advisors, Australia Kevin ................ Hiscock ................... University of East Anglia Robert ................ Holland .................... Broads Authority Piers ................... Hooper .................... Environment Agency Simon ................. Hooton .................... Broads Authority Alex .................. Inman ...................... Alex Inman Consulting/Independent RELU Researcher Andy .................. Jordan ...................... University of East Anglia Andrea .............. Kelly ........................ Broads Authority Stuart .................. Kirk ......................... Environment Agency Auke ................... Kooistra ................... Drenthe, NL Tobias ................ Krueger ................... University of East Anglia John .................... Malley ..................... National Trust Phillip ................. Mansfield ................ Natural England Julia .................... Martin-Ortega ......... The Macaulay Land Use Research Institute Claire ................. McCamphill ............ DEFRA Dan..................... McGonigle .............. DEFRA Simon ................. McHugh .................. Devon Wildlife Trust Naho ................... Mirumachi ............... Dept. of Geography and Environment, ........................... ................................ London School of Economics and Political Science Peter ................... Mollinga .................. SOAS, University of London Sarah .................. Mukherjee ............... Water UK Thomas .............. Nisbet ...................... Centre for Forestry and Climate Change Lisa .................... Norton ..................... Centre for Ecology and Hydrology Ejiroghene .......... Ogboru .................... Environment Agency Tim..................... O'Riordan ................ University of East Anglia Liz ...................... Oughton................... Newcastle University Kevin ................. Parris ....................... Trade and Agriculture Directorate, OECD Ana Carolina Passuello ................. Sheffield University Clive ................... Phillips .................... Environment Agency Jeremy ................ Phillipson ................ Assistant Director, RELU

Final Project Communications Workshop November 29, 2010 25
Keith .................. Porter ....................... Cornell Law School, USA Mary Jane .......... Porter ....................... Project Coordinator for SOAS, USA Diana .................. Pound ...................... Dialogue Matters Gitte ................... Ramhǿj .................... Aalborg Municipality Kate ................... Roberts .................... States of Jersey Archie ................ Ruggles-Brise .......... Association of Rivers Trusts Laurence ........... Smith ....................... SOAS, University of London Christian ............ Stamm ..................... EAWAG: Swiss Federal Institute of Aquatic Science and Technology Alastair ............... Stewart .................... Natural England Chris ................... Stoate ...................... The Game and Wildlife Conservation Trust Diane .................. Tarte ........................ Healthy Waterways Partnership, Australia David ................. Trewolla .................. Environment Agency Judith ................. Tsouvalis ................. Lancaster University Alan ................... Turner ...................... Kent County Council Nico ................... van der Moot ........... Waterleidingmaatschappij Drenthe, NL Alice .................. Varkala .................... Environment Agency Tom .................... Walkden .................. DEFRA Alan ................... Woods ..................... RELU policy adviser

Final Project Communications Workshop November 29, 2010 26
End of workshop feedback questionnaire results Forms were returned by 14 delegates. Q1. Did you find today’s event useful?
Yes No Responses 14 0 Percentage 100% 0%
Reasons given for answer: • Understanding the broader picture i.e. US and Australia. Good discussion around • Good overview of catchment management and how other countries are operating • Feedback to input during RELU – interest in uptake of models • Because it gave a good picture of catchment management at all levels and scales • Wide variety of case-studies, all linked by the common theme. Very relevant and thought-
provoking. • Useful contacts and information. • It was interesting to see how other countries tackle catchment problems and the differing results
produced. • Confirmed some interesting aspects that I cover at work (CSF). • International approaches very interesting. • International perspectives are useful. • Interesting to see different approaches to catchment management from across world, e.g. funding
mechanisms. • Good overview of many highly relevant research projects. • Great to hear about RELU projects which have really delivered. Especially the overseas
experience. • Very timely synthesis of catchment management experience and the drawing out of individual
experiences. Q2. Did you get to hear points of view you have not heard before?
Yes No Responses 11 3 Percentage 79% 21%
• German presentation was eye opening. Q3. Do you think that the project’s outputs are of relevance to the future of catchment
management in the UK?
Yes No Responses 14 0 Percentage 100% 0%
Reasons given for answer: • Strengthens body of evidence for practical approaches that need to be considered further. • Provides the tools for local action to manage water – need to get the institutional/cultural change
to deliver.

Final Project Communications Workshop November 29, 2010 27
• With the EA about to present its blueprint for catchment management the subject is of extreme relevance to developing political and legislative agenda – more work needed to develop principles in relation to England and Wales and apply to how we might develop a new approach.
• Stakeholder engagement and trust issues brought to the fore. • Relevant because they would work (or are already) and form a good basic template for others.
All you need now is the powers to be and funding to accept/approve and encourage. • Input from local people. • Production of a template will greatly speed up plans and implementation of those plans at a local
level. • Community engagement, open-ness, trust are all key. But need more focus on urban and
suburban land use. Not every catchment may have sufficiently interested parties? • Absolutely, we will only learn which direction to take by looking at all possibilities and past
projects. • Any research is relevant – especially an international perspective. • Holistic approach is needed, first steps taken. • But catchment management in the UK seems to involve only farmers and phosphates! • Using the stakeholder knowledge to help inform decisions a key theme – very important for
“buy-in” to catchment management at UK level.
Q4. Do you have any other comments or suggestions? • Important that project summaries and slides are made readily available to aid dissemination. • Keep promoting your findings – there is an opportunity for radically changing our top down
nationally driven one solution fits all approach to one driven upwards from local concerns. Need to keep promoting the message.
• What would have happened in the catchments if the money was just spent on physical works and farmer training and not on research – would the water quality improve? Does the phrase too many cooks apply sometimes.
• The Environment Agency is losing 30% of resource, so may lack the resources to engage effectively (just as the Government are promoting ‘Big Society’). Individual and low-level engagement is time consuming and costly. Overall an excellent day.
• Surprising how little Catchment Sensitive Farming (CSF) was mentioned – considering how much of a bridge it is between farming and water quality.
• Closing remarks were made from the floor about discussions between UEA, Broads Authority, Anglian Water and Environment Agency – but farmers not at the table?
• Panel session interesting but tendency for “questions” from audience to turn into a soapbox! – chair need to remind audience to keep questions short and sweet!
• A very cold room. • Turn the heating on in the lecture theatre!