Embed Size (px)
Citation preview

Catastrophe Risk Models for Evaluating Disaster Risk Reduction Investments in Developing Countries
Erwann Michel-Kerjan Stefan Hochrainer-Stigler Howard Kunreuther
The Wharton School International Institute of Applied The Wharton School University of Pennsylvania Systems Analysis (IIASA) University of Pennsylvania
Joanne Linnerooth-Bayer Reinhard Mechler Robert Muir-Wood International Institute of Applied International Institute of Applied Risk Management Solutions
Systems Analysis (IIASA) Systems Analysis (IIASA)
Nicola Ranger Pantea Vaziri Michael Young London School of Economics Risk Management Solutions Risk Management Solutions
March 2012 Working Paper # 2012-07
Forthcoming in Risk Analysis
_____________________________________________________________________ Risk Management and Decision Processes Center The Wharton School, University of Pennsylvania 3730 Walnut Street, Jon Huntsman Hall, Suite 500
Philadelphia, PA, 19104 USA
Phone: 215‐898‐5688 Fax: 215‐573‐2130
www.wharton.upenn.edu/riskcenter ___________________________________________________________________________

THE WHARTON RISK MANAGEMENT AND DECISION PROCESSES CENTER
Established in 1984, the Wharton Risk Management and Decision Processes Center develops and promotes effective corporate and public policies for low‐probability events with potentially catastrophic consequences through the integration of risk assessment, and risk perception with risk management strategies. Natural disasters, technological hazards, and national and international security issues (e.g., terrorism risk insurance markets, protection of critical infrastructure, global security) are among the extreme events that are the focus of the Center’s research.
The Risk Center’s neutrality allows it to undertake large‐scale projects in conjunction with other researchers and organizations in the public and private sectors. Building on the disciplines of economics, decision sciences, finance, insurance, marketing and psychology, the Center supports and undertakes field and experimental studies of risk and uncertainty to better understand how individuals and organizations make choices under conditions of risk and uncertainty. Risk Center research also investigates the effectiveness of strategies such as risk communication, information sharing, incentive systems, insurance, regulation and public‐private collaborations at a national and international scale. From these findings, the Wharton Risk Center’s research team – over 50 faculty, fellows and doctoral students – is able to design new approaches to enable individuals and organizations to make better decisions regarding risk under various regulatory and market conditions.
The Center is also concerned with training leading decision makers. It actively engages multiple viewpoints, including top‐level representatives from industry, government, international organizations, interest groups and academics through its research and policy publications, and through sponsored seminars, roundtables and forums.
More information is available at http://opim.wharton.upenn.edu/risk.

1
Catastrophe Risk Models for Evaluating Disaster Risk Reduction Investments in Developing Countries
Revised version - September 27, 2012
Risk Analysis
Authors
Michel-Kerjan, E., Hochrainer-Stigler, S., Kunreuther, H., Linnerooth-Bayer, J., Mechler,
R., Muir-Wood, R., Ranger, N., Vaziri, P., and Young M.i
Abstract:
Major natural disasters in recent years have had high human and economic costs, and
triggered record high post disaster relief from governments and international donors.
Given the current economic situation worldwide, selecting the most effective disaster risk
reduction (DRR) measures is critical. This is especially the case for low- and middle-
income countries, which have suffered disproportionally more economic and human
losses from disasters. This paper discusses a methodology that makes use of advanced
probabilistic catastrophe models to estimate benefits of DRR measures. We apply such
newly developed models to generate estimates for hurricane risk on residential structures
in the island of St. Lucia, and earthquake risk on residential structures in Istanbul, Turkey
as two illustrative case studies. The costs and economic benefits for selected risk
reduction measures are estimated taking account of hazard, exposure and vulnerability.
We conclude by emphasizing the advantages and challenges of catastrophe model-based
cost-benefit analyses for DRR in developing countries.
Key words: catastrophe modeling; disaster risk reduction; cost-benefit analysis

2
1. INTRODUCTION
The 7.0 Haiti earthquake in January 2010 destroyed a large part of the city of Port-au-
Prince causing nearly 250,000 fatalities and 300,000 injuries mainly as a result of
collapsed buildings. Haiti had no building code in place. International donors pledged
more than $5 billion in disaster relief and rebuilding effort. A few weeks later, populated
areas in Chile experienced a much stronger 8.8 earthquake causing only 450 casualties,
and many not from the earthquake but from the ensuing tsunami. Chilean building codes
are some of the strictest in the world, comparable to the United States and Japan, and are
well enforced (1) .
Chile is an exceptional case. Low- and middle-income countries generally suffer
greater fatalities overall and losses as a proportion of their GDP from climate and
geophysical events. During the period from 1970 to 2008, over 95 percent of recorded
deaths from natural disasters occurred in developing countries. For middle-income
countries, economic losses amounted to about 1 percent of GDP (1970-2006), which can
be compared to losses of less than 0.1 percent of GDP for high income countries. In
highly exposed countries, particularly Small Island Developing States, losses have been
especially high; in the period 1970-2010 they exceeded one percent of GDP in many
cases and eight percent in the most extreme cases (2).
Impacts and losses in developing and developed countries can be reduced
substantially with cost-effective investments. The U.S. Federal Emergency Management
Agency (FEMA) examined investments in 4,000 disaster risk reduction (DRR) programs,
including retrofitting buildings against seismic risk and structural flood defence
measures, and found an average benefit-cost ratio of four (3). In developing countries, a
review of 21 studies on public and private investments as diverse as planting mangrove
forests to protect against tsunamis, relocating schools to non high-hazard areas and
strengthening the roots of banana trees to protect against windstorms, demonstrated with
few exceptions equally high benefit-cost ratios (4).
In spite of potentially high returns, there is limited investment in loss reduction
measures by public officials and by individuals residing in hazard-prone areas. In the
United States, only about 10 percent of earthquake- and flood-prone households have
undertaken cost-effective DRR measures (5). A principal reason for this inaction is a focus

3
on short time horizons: the upfront costs of the investment in DRR loom large relative to
the perceived expected benefits from the measures (6). For similar reasons, policy makers
are also reluctant to commit significant funds to risk reduction. In low-income countries,
decision makers not only face fiscal constraints but also may lack adequate information
on net economic and social benefits of DRR measures.
The failure to undertake measures to reduce disaster losses places pressure on
political leaders to provide assistance after a disaster (7). This is true in OECD countries
and low-income countries alike. A recent study in the United States shows how federal
relief provided after disasters has grown significantly in the past 50 years. In the wake of
Hurricane and Flood Diane in 1955, federal relief spending covered only 6.2 percent of
total damages, but averaged 69 percent for disasters that occurred between 2005 and 2008 (8). In Germany, after the major 2002 Elbe floods, the German government provided the
largest amount of public funds ever paid in the country’s history to compensate uninsured
flood victims, exceeding by far what was paid by insurance companies to insured victims (9).
This disaster relief spiral is even more striking in low-income countries. A recent
joint report by the World Bank and the United Nations shows that bilateral and
multilateral donors currently allocate 99 per cent of their disaster management funds for
relief and reconstruction and only one per cent to reduce future loss exposure and
vulnerability (10). To redress this imbalance, the 2005 United Nations World Conference
on Disaster Reduction and the resulting Hyogo Framework for Action (11) emphasize the
need for pro-active disaster management including cost-effective risk reduction
investments and, where this is not possible, risk transfer through insurance and other
financial instruments (12) (13).
A cornerstone of risk management is access to knowledge on risks and cost effective
risk reduction measures. Cost-benefit analysis (CBA) has particular importance in this
regard. Since the 1950s, CBA has been standard practice in the United States for the
evaluation of risk reduction projects by organizations such as the Federal Emergency
Management Agency and the Army Corps of Engineers. In the United Kingdom the
Department for Environment, Food and Rural Affairs and the Ministry of Agriculture

4
also generally advocate the use of CBA for this purpose (14). France has also used CBA
for public investment and transportation infrastructure projects for many years (15).
CBA for disaster risk management, however, has not been widely applied in
developing countries (4), (16), (17). When undertaken, the analysis typically uses a
deterministic approach based on past disasters in the region of concern. For example, a
study might estimate the costs and benefits of a specified risk reduction measure if the
catastrophe that occurred 10 years ago were to occur again tomorrow -- a form of ”what
if” scenarios at a given point in time (see, for example, Dixit (18)). A challenge in
applying probabilistic CBA for DRR in developing countries is that the local knowledge
on the methodology is often limited. As a result, many countries have not yet developed
the technical capacity to go beyond a simple deterministic approach.
This paper applies CBA to examine DRR investments by using catastrophe modeling
and demonstrates its applicability in developing country contexts. We use a state-of-the-
art probabilistic disaster model to estimate the benefits of DRR measures for houses in
St. Lucia, Caribbean (hurricane risk) and Istanbul, Turkey (earthquake risk). We then
determine the impact of different discount rates and time horizons on the benefit/cost
ratio of these measures. Finally, we discuss some extensions of this methodology and
challenges of carrying out catastrophe model-based CBA on DRR measures in
developing countries.
The paper is organized as follows: Section 2 introduces probabilistic catastrophe
modeling as a tool for evaluating the benefits of selected mitigation measures. We then
apply this approach to two case studies in St. Lucia and Turkey in Section 3. Section 4
concludes with a discussion of the results.
2. THE USE OF PROBABILISTIC CATASTROPHE MODELS IN COST-BENEFIT ANALYSES
A probabilistic catastrophe modeling approach provides more value than a deterministic
approach because it includes all the events that can cause damage, and it generates a
detailed analysis of return period based on advanced hazard models (19), (20), (21).ii A
catastrophe model can be represented by four basic components or modules: hazard,

5
exposure, vulnerability and loss. In the first module, the risk of the hazard phenomenon
is estimated. This module includes two main parts. The first part addresses the occurrence
and frequency of the events. It does this by first developing a stochastic event set, a set of
simulated events characterizing the observed or scientifically modeled events and their
probabilities of occurrence. The second part of the hazard module calculates the severity
of the events at every site of the study region.
For example, in the case of earthquake hazard, the first part of the hazard module
specifies the earthquake size, frequency of occurrence, and location. The second part of
the hazard module then calculates the amount of ground motion at a particular site for
every stochastic event. In case of hurricane hazard, the first part of hazard module
generates the storm tracks for each event in the set and the storm parameters such as wind
speed and central pressure are estimated. The second part of the hazard module then takes
into account the parameters such as surface roughness to calculate the final wind field in
the entire study area.
The second module characterizes the exposure of properties at risk. This can be a
building of specific interest, a dwelling representative of the average construction type in
a given area exposed to the hazard (as we do in this paper and which would be useful to
determine cost effective building codes), or an entire portfolio of buildings with different
characteristics (for example, an entire city). The characteristics specified in this module
include both physical characteristics of the building such as occupancy, construction type
(e.g., wood versus concrete), age of the building, and number of stories as well as the
replacement value of the property. If the impact of disaster on fatalities and injuries is
included, then different scenarios characterizing the number of people in the buildings at
different times of the day should also be devised.
The third module quantifies vulnerability, or how this property at risk (exposure)
will behave physically under events that the hazard module has generated. Vulnerability
functions are the relationships between hazard intensity (e.g. wind speed or ground
motion) at the site and the level of damage experienced. Mean (average) damage
estimates are expressed as a mean damage ratio, or MDR, which is the measure of the
percent of value expected to sustain damage. Certain characteristics of the building affect
its vulnerability. Hence it is important that they are specified in the exposure module as

6
much as possible. Vulnerability of buildings also depends on the study region because of
different construction practices and enforcement of building codes.
The last module is loss. Assume for the moment that the only uncertainty is the
occurrence of an event, i.e. the occurrence follows a Poisson process with its annual rate
that was specified in the first part of hazard module. Given an event has occurred, the
second part of the hazard module calculates the severity of the event at each site of the
study. The vulnerability module then calculates the MDR at each location given the
characteristics specified in exposure module, by taking into account the total value of
damage given the replacement value and calculates the total loss at that location. The
total loss from a single event is then the aggregate of losses in all sites of the study region
due to that event.
These losses are then compiled and collected in a table called Event Loss Table
(ELT). A typical ELT is shown in Table I below. Each row of ELT corresponds to a
catastrophe event taken from a group of credible scenarios (e.g. earthquake, hurricane,
flood) with an identification number (Event IDj), an annual rate of occurrence ( ) and
resulting loss (Lj) for IDj.
Table I. Example of An Event Loss Table
Event ID Annual Rate of Occurrence Loss 1 2 .. .. .. j .. .. .. J
Combining information on frequency and severity of losses, the probabilistic
catastrophe model generates the distribution of the expected losses associated with all
possible scenarios of disasters. This is often expressed in terms of an aggregate loss
exceedance probability (EP) curve. For a given portfolio of structures at risk, an EP curve
is a graphical representation of the probability p that a certain level of aggregated loss $L
will be exceeded in a given year. Figure 1 depicts a hypothetical mean EP curve, where
the x-axis measures the loss in dollars and the y-axis depicts the annual probability that
losses will exceed a particular level. In this figure, the likelihood that losses will exceed
Li is given by pi.

7
Figure 1: Example of An Exceedance Probability Curve and DRR Effect
To illustrate this methodology with an earthquake example, let’s assume that natural
disaster events follow a specific distribution, for instance a Poisson distribution with
annual rate . Multiple events occurring at the same time would then be treated as a
compound Poisson process with a rate ∑ . The corresponding loss distribution is
∑ (1)
If n events occur in this compound process then the distribution of any loss L less
than a particular value is given as
| ⋯∗
. (2)
is the nth power of F evaluated at loss and ∗
is the nth
convolution of F evaluated at that loss. The annual probability pi that the loss is greater
than or equal to a particular value of Li is:
1 1 ∑ .
!
∗ (3)
The reciprocal of this annual probability pi is referred to as the return period of loss Li
for this specific exposure in the study area. Equation (3) determines the EP curve when
secondary uncertainties around loss calculation for a given event are ignored.iii

8
While a major advantage of catastrophe models is generating the range of
probabilistic losses, the main loss metric used in the CBA of this paper is average annual
loss (AAL), the area under the exceedance probability curve. AAL is a single loss metric
that takes into account both severity and frequency of all possible events. Beyond
expected average annual losses, risk averse policy makers may also be concerned with
the right-hand tail of the curve where the largest losses are situated.
As shown in Figure 1, DRR measures would shift the EP curve to the left (the
property would be more resistant to the hazard thus the loss for a given catastrophe
scenario will be lower, all else being equal). There are many reasons why an EP curve is
an improved risk measurement compared to single event or deterministic analysis. As a
start, an EP curve provides information of interest to decision makers, including the full
range of probabilistic estimates and their summary measures, such as the expected value,
the variance and standard deviation (23). Both frequent and infrequent (high-impact)
events are represented, the latter being of special interest. For instance it is possible to
generate the probable maximum loss for the exposure under study. This has important
economic and social implications: in order for policymakers to establish proper
construction codes, they need to know, for example, the possibility that the community or
country could be struck by a Category 5 hurricane (measured on the Saffir-Simpson
scale), or, as another example, that the most severe hurricane will never exceed Category
2. There is no need to spend scarce funds to make new construction resistant to a
massive hurricane if the risk is extremely low. Conversely, if a coastal area is likely to be
hit by hurricanes in the Category 3 to Category 5 range in the next 50 years,
policymakers may wish to discourage new construction in harm’s way. Both decisions
have costs and expected benefits and only a detailed probabilistic catastrophe modeling
process can provide the information necessary to make fully informed decisions.
Similarly, international donors might be more willing to support a large DRR program if
they learn from such a model that a large number of people are likely to die because of
obsolete construction.
Moreover, since catastrophe models estimate the full range of possible hazard impacts
and corresponding probabilities, it is possible to construct portfolios of DRR measures
that are tailored to the specific circumstances of the risk at hand. Some DRR measures

9
may be cost effective or only feasible for high frequency events (e.g., structural
mitigation measures), while others may be effective for low frequency events (e.g.,
insurance or catastrophe bonds) (24).
The first step in a catastrophe model-based CBA is thus the construction of an EP
curve for a given hazard, exposure and location. This can be a house located in a
designated hazard area, as is the case in this paper, or the analysis can focus on measures
across a country or economy, for example, through the development of input-output
models (25), (26). The next step is to simulate changes in the EP curve given selected DRR
measures. In our cases, which examine earthquake and hurricane risk to representative
houses, only the vulnerability module is affected since the likelihood and intensity of the
hazard are not impacted by our selected DRR measures. EP curves with and without DRR
measures in place can then be compared (Figure 1). The final step is an estimate of the
benefit/cost ratio, which captures the complex interactions of the four main components
of the model and the cost of the measure being analyzed. Since the benefits and costs
accrue over multiple periods, the estimates require selecting one or a range of discount
rates and of time horizons. A risk neutral decision maker is concerned about the reduction
of annual average losses within an appropriate time horizon given an appropriate discount
rate while a risk averse decision maker will also be concerned with the variability or
standard deviation of these losses; value at risk may also be of interest to all decision
makers (23).
3. CASE STUDIES IN ST. LUCIA AND ISTANBUL
This section applies a catastrophe model-based cost benefit analysis to two developing
country cases: hurricane risk in St. Lucia and earthquake risk in Istanbul. We focus on a
single residential structure that is representative of the type of construction in the area and
begin by identifying feasible measures and their costs for reducing losses from the
respective hazards. By applying a model of the hazard, we construct EP curves for that
representative building with and without the selected DRR measures in place. Benefits of
the DRR measures are quantified through reductions in the average annual loss (AAL)
discounted over the relevant time horizons employing a range of discount rates. Finally,

10
we compute a benefit-cost ratio for each measure, and undertake a series of sensitivity
analyses of the B/C ratio to variations in the discount rate and selected time horizon. The
first case is St. Lucia for which we undertake a CBA by focusing only on the reduction in
physical damage to the property; in our second case, earthquake risk in Istanbul, we
repeat the same analysis but also extend it to include lives saved by different DRR
measures.
3.1. Hurricane Risk in St. Lucia
St. Lucia is a small Caribbean island state that is highly exposed to hurricanes (Figure 2).
Historically, the frequency and magnitude of the hazard have been greater than what is
usual in the region. Hurricanes can have a devastating impact on St. Lucia’s economy.
For instance, losses from Hurricane Gilbert in 1988 were approximately $1 billion or
more than 350 percent of St. Lucia’s GDP that year. By comparison, economic losses
from Hurricane Katrina in 2005, the most devastating natural disaster in the history of the
United States, represented only 1 percent of the U.S. GDP that year (27).
Hurricanes and storms have caused extensive damage in St. Lucia in large part
because the country has not implemented an updated national building code for all types
of construction. The current code is based on the Organization of Eastern Caribbean
States (OECS) model building code, which uses standards described by CUBiC
(Caribbean Uniform Building Code). Unfortunately, CUBiC is now out of date (last
updated in 1989), which means that the OECS standards also need to be updated (28).iv

11
FIGURE 2. ST. LUCIA IN THE CARIBBEAN
The coastline of St. Lucia generally has a sharp topography, and although there are
locations that can experience significant flooding, experts agree that storm surge does not
create a significant loss potential. Hence, we focus our analysis on wind damage to
housing structures.
While a large portion of St. Lucia’s population is classified as below the poverty
level, there is a rising middle class. This analysis focuses on middle class residential
homes. Over 70 percent of residential buildings are constructed using concrete blocks
(that is, masonry structures) or have wood outer walls such as plywood and wood/timber
walls (29). Two representative houses, one wood frame and the other masonry, were
selected for study. It is assumed that the replacement value of the houses is 100,000 USD,
which is aligned with current market prices. These representative houses are located in
the higher and lower risk cities of Canaries and Patience, respectively.
The hazard for St. Lucia is modeled with the RMS Caribbean Hurricane Model
RiskLink© 9.0. The methodology consists of three main steps:
1. Stochastic storm-track generation. A Monte Carlo set of storm tracks, with associated
rates of occurrence, is generated using a random-walk technique and calibrated against

12
historical track data. The hurricane model’s representation of hurricane frequency and
severity is based on data describing historical storms that have impacted the Atlantic
Basin and coastal regions since 1886. Sources for this catalog include data from the US
National Oceanic and Atmospheric Administration, the U.S. National Hurricane Center,
and the U.S. National Weather Service. The key historical database employed for model
development is the HURDAT catalog, a compilation of tropical cyclones data starting
from 1945.
2. Adding pressure histories to tracks. This process preserves the large-scale behavior of
intensification and decay associated with variations in sea surface temperatures (SSTs)
and topography across the basin, and calibrates the pressure distributions at all locations
of interest within the basin. After the stochastic track set has been generated, pressure
histories are added to the tracks using a second random-walk technique while the storms
are over the ocean. The mean and variance of the rate of change of pressure across the
simulation area are quantified from historical data.
3. Importance sampling to obtain a manageable number of hurricanes. Finally, the
Monte Carlo storm set is importance-sampled to produce a boiled down storm set for loss
calculations. Very large numbers of tracks are generated, equivalent to 100,000 years of
simulated time. As it is not practical to run loss calculations with this number of tracks,
the Monte Carlo event sets are importance-sampled. Tracks with similar paths and
intensities at key locations (landfall or bypassing) are identified and grouped together.
Most of the tracks are discarded and their rates are passed to the small number of tracks
that are retained. Importance sampling is achieved by retaining a greater proportion of
intense events than weaker events, which is a standard procedure. Loss convergence, as
well as file sizes and run-time issues, are all considered when determining the final
number of events retained in the event set. The reduced event set is used by the hurricane
hazard module to compute wind speeds.
The above three steps comprise the first part of the hazard module described in
section 2 where events are simulated and their rate λ is specified. In the second part of
the hazard module, once the parameters of each hurricane in the stochastic set are

13
defined, the wind speed is calculated for each storm at each location in an analyzed
portfolio. A hurricane generally begins to lose strength as soon as it makes landfall. The
loss of strength after landfall is caused by two factors:
As a hurricane progresses over land, the pressure at the center of the storm
decreases due to a loss of the hurricane’s source of energy (the warm ocean
waters). Pressure-filling functions are based on meteorological studies and
observed historical information;
Surface friction from man-made and natural barriers reduces wind speeds as the
hurricane moves inland. Surface friction characteristics at each site are
represented by the eight directional roughness coefficients.
The Caribbean hurricane wind vulnerability model is region-specific to reflect the
(mostly man-made) differences, such as construction quality, quality and enforcement of
building codes, code-stipulated design wind speeds and the hurricane experience of each
island. Within each region, the vulnerability of a building is defined in terms of four
primary characteristics and a set of 25 secondary characteristics. The four primary
characteristics are occupancy type, construction class, number of stories and year of
construction.
Each vulnerability curve in the Caribbean hurricane model represents the average
hazard exposure of a portfolio of buildings. The vulnerability of any particular building
depends upon its specific characteristics, such as improved roof sheathing or the use of
roof anchors. The variation in hurricane performance can be addressed in the RMS
hurricane model through the use of secondary modifiers, which quantify the impact of the
hurricane-sensitive features of a building on its vulnerability. Secondary modifiers can be
used to quantify the impact of structural features or DRR measures.
Once the stochastic event set, associate rate for each event and the key parameters of
each event are specified, the wind speed of the event at the location of representative
houses is calculated. Specific to the wind speed, the vulnerability model calculates the
damage ratio of the building, which is multiplied by the replacement value of the house to
yield the total loss of event j at that location. Combining the information on each event

14
rate λ and the loss it creates L , the EP curves for the representative buildings can be
constructed.
In the absence of DRR measures, the aggregate exceedance probability (AEP) curves
for the representative residential buildings in the two cities are shown in Figure 3. These
curves show that wood frame housing is more vulnerable than masonry, and there is a
significant difference in expected loss between minimum and maximum hazard areas,
e.g., AAL for wood frame structures is 4,070 USD in the Canaries (maximum hazard
area) but only 830 USD in Patience (minimum hazard area).
Figure 3. AEP curves with no DRR - Hurricane Risk in St. Lucia
Three DRR measures were examined for reducing hurricane risk to the representative
wood frame and masonry houses. The DRR costs for the houses have been developed
based on a RMS survey of DRR costs for contractors in Florida in 2009 and from earlier
roofing costs reports (30), which are aligned with contractors’ cost in St. Lucia.
Measure 1: Roof Upgrade: This includes the replacement of the roof material
with thicker sheeting and tighter screw spacing, as well the use of roof anchors.
The total cost of this measure is estimated to be 9,200 USD.

15
Measure 2: Opening Protection: This includes strengthening the resistance of
windows and doors against wind and heavy pressure. The total cost is estimated to
be 6,720 USD.
Measure 3: Roof Upgrade and Opening Protection: Options 1 and 2 can be
combined to provide a more comprehensive level of protection for the structure.
The cost for both is estimated at 15,920 USD.
Applying CBA
Table II below shows the results of the benefit-cost calculations for the three measures.
Not surprisingly, the results are highly sensitive to the choice of the discount rate, the
assumed length of life of the residential structure and the hazard level. The results in
Table II are based on discount rates of 5 percent and 12 percent (which are typical low
and high values used for evaluating development projects, see Mechler (31)) and an
expected life of the structure of 25 and 50 years.
The results show that all three risk-reduction measures for the representative house in
Canaries yield a positive net return when the discount rate is 5 percent for both wood and
masonry structures that have an expected lifetime of 25 or 50 years. For wood frame with
a 12 percent discount rate the B/C ratio is always close or above one, even though not
higher than 1.59.
Table II: Summary of selected B/C ratios (ratios above 1 in bold)
DRR
measure Time
horizon (years)
Masonry Wood Frame
Canaries (Max Hazard)
Patience (Min Hazard)
Canaries (Max Hazard)
Patience (Min Hazard)
Discount rate Discount rate Discount rate
Discount Rate
5% 12% 5% 12% 5% 12% 5% 12%
1. Roof upgrade
25 1.37 0.76 0.29 0.16 1.73 0.96 0.41 0.23
50 1.78 0.81 0.37 0.17 2.24 1.02 0.53 0.24
2. Opening 25 1.14 0.63 0.17 0.09 2.70 1.51 0.46 0.26

16
protection 50 1.47 0.67 0.22 0.10 3.50 1.59 0.60 0.27
3. Combined 25 1.09 0.60 0.20 0.11 1.80 1.00 0.36 0.20
50 1.41 0.64 0.26 0.12 2.34 1.06 0.46 0.21
The highest B/C ratio is exhibited in the case of the opening protection (measure 2) in
the maximum hazard location (Canaries) and for the more vulnerable structure (wood)
(B/C ratios of 2.70 for a 25 year lifetime and of 3.50 for a 50 year lifetime; both at 5
percent discount rate). Note however that none of these measures yields a positive B/C
ratio for representative houses in Patience, which are exposed to lower risk.
To illustrate the sensitivity of our results to the selected discount rate, in Figure 4 we
show how the B/C ratio for strengthening the resistance of windows and doors for a wood
frame house in Canaries varies over a range of rates (from 0 percent discount rate to 15
percent (0.15) on the x-axis) and across three different assumed lifetimes of the structure
(10, 25 and 50 years shown as separate trend lines). By definition the lower the discount
rate and the longer the lifetime of the house, the higher the B/C ratio for a given measure
in a given location. For instance, assuming a 50-year lifetime of the building, the B/C
ratio is a high 9.7 with a zero percent discount rate (upper curve on Figure 4). In other
words, if this DRR measure were put in place this year, the expected benefit over a period
of 50 years would be 9.7 times its cost. But it would only be 1.4 times its cost with a 15
percent discount rate. This example illustrates the critical role that the discount rate plays
in any DRR cost-benefit analysis.

17
Figure 4. Canaries: B/C Ratios for selected discount rates and time horizons for protecting a wood frame structure by improving window and door protection
3.2. Earthquake Risk in Istanbul (Turkey)
Lying on the North Anatolian and the East Anatolian fault lines, Turkey is a hotspot of
seismic activity. Istanbul is a thriving metropolis, with a population that has swelled from
about 1 million in 1960, to currently over 11 million. Since Istanbul has not had a severe
direct hit by an earthquake since 1766, there are fears that the city is due for a major
earthquake. According to experts, there is a 30 to 60 percent chance of a magnitude 7 or
greater earthquake impacting Istanbul in the next 25 years (32). Given Istanbul’s large
population and its contribution to Turkey’s GDP (about 40 percent), there is huge
concern about its preparedness (33), (34).
EP curve and selected DRR measures
The property loss estimation for Istanbul is based on a catastrophe model approach,
namely the RMS® Turkey Earthquake Model in RiskLink© 9.0. The probabilistic event
set includes more than 9,000 stochastic events from 116 seismic sources where multiple

18
segment ruptures are included to account for cascading events. A background zone
covering the whole country is added to account for the possibility of an earthquake
happening outside the geometries of the sources. The seismicity of each seismic source is
based on historical events.
Geophysical models are also used to represent the seismicity where data on slip rate is
available. Turkey has a very long recorded history of earthquakes that was used in
estimating source seismicity. The earthquake catalog was developed in cooperation with
experts from the Kandilli Observatory. The seismicity of Turkey is mainly characterized
by shallow strike-slip type events that occur along the plate boundary. Deeper events (20-
30 kilometers) take place on mainly normal faulting in the southwest part of the country.
Most earthquake sources in the Turkey Earthquake Model are assumed to follow a
Poisson recurrence relationship. However, for the North Anatolian Source Zone and the
Marmara Sea Source Zone, time dependency must be accounted for. Furthermore, for the
Northwest Strand of the Marmara Sea Source Zone, effect of stress migration is taken
into consideration in calculating the probability of stochastic events. Characteristic events
are assumed to occur on the fault segment. Hence, for the Marmara Sea region, the
probability of an event depends on three factors: 1) the source model, 2) the timing of
the last event, and 3) the amount of stress transferred into one segment by an event taking
place in adjacent segments.
To calculate the probability of occurrence of stochastic events in the Marmara Sea
region, a logic tree approach is used where weights are associated with each branch of the
tree. The weights were determined in consultation with Turkish seismic experts as well as
from sensitivity analyses. The background source is modeled as having Poisson
recurrence with the mean rate of occurrence calculated from a spatially smoothed
historical seismicity. The smooth seismicity is obtained using an adaptive Gaussian
Kernel technique.
For the second part of the hazard module, the model analyses the attenuation of
seismic energy for a given event in order to determine ground shaking levels at a
particular site. Attenuation relationships were calibrated against twenty-five historical
events in the last 190 years, and amplification of ground shaking is based on high
resolution soil and liquefaction data.

19
The vulnerability module builds on an estimate of 17 distinct building classes and
four height ranges. The building exposure database is separated according to the year in
which the building is constructed, which reflects revisions in the building codes.
According to the World Housing Encyclopedia report on Turkey (35) approximately 80
percent of Turkey’s urban households live in mid-rise apartment blocks constructed of
reinforced concrete with masonry infill. On average, a typical building has ten apartment
units (two per floor) and five residents per unit. The representative structure selected in
this study is thus a five-story reinforced concrete building with unreinforced masonry
infill (similar to the structure analyzed by Smyth (33) with a replacement value assumed to
be $250,000.
In the aftermath of the 1999 Kocaeli earthquake, most buildings of this type collapsed
because the columns lacked adequate transverse steel reinforcement to resist lateral loads.
Many buildings are designed with an open ground floor to accommodate other uses, such
as parking, and some are characterized by a “soft story,” which means that the ground-
floor space – a window or garage door – is situated where a wall might otherwise be. Soft
story structures with large ground floor openings are at high risk of collapse from
earthquakes with strong ground shaking (36). Another construction detail that contributed
to the breaking of the columns and possible collapse of the buildings is the gap between
the columns and the infill wall, which reduces the effective height of the column (known
as short column) (37).
We selected two case study sites in Istanbul, Camlibahce and Atakoy, which are high-
and low-hazard locations, respectively (Figure 5 shows the different levels of hazard for a
100-year return period).

20
Figure 5: Istanbul 100-year hazard map (Istanbul at Mahalle level resolution) with two study
locations representing high and low hazard locations
As shown in Table III, we analyze three different types of buildings, which are
differentiated according to two characteristics of their construction, soft story, short
column, and whether they need a structural upgrade.
Table III: Type of structures analyzed– unmitigated attributes
Type Soft Story (SS) Short Column (SC) Need Structural Upgrade
Type 1 Yes No Yes
Type 2 No Yes Yes
Type 3 Yes Yes Yes
21
The flexibility of the frame can be increased by adding partial or full shear walls
(structural upgrade) as described in Smyth (33). In the absence of shear walls, risks to soft
story buildings can be reduced through the use of a steel moment frame in the open floor.
We assume that the addition of shear walls will correct for the effect of soft story, and
therefore there is no additional cost for soft story DRR. The short column effect can be
mitigated either through adding masonry inserts at both sides of the column (37) or
separation of the infill wall from the surrounding frame. According to RMS vulnerability
analysis, Type 1 and Type 3 buildings are respectively about 4 percent and 14 percent
more vulnerable than Type 2 structures.
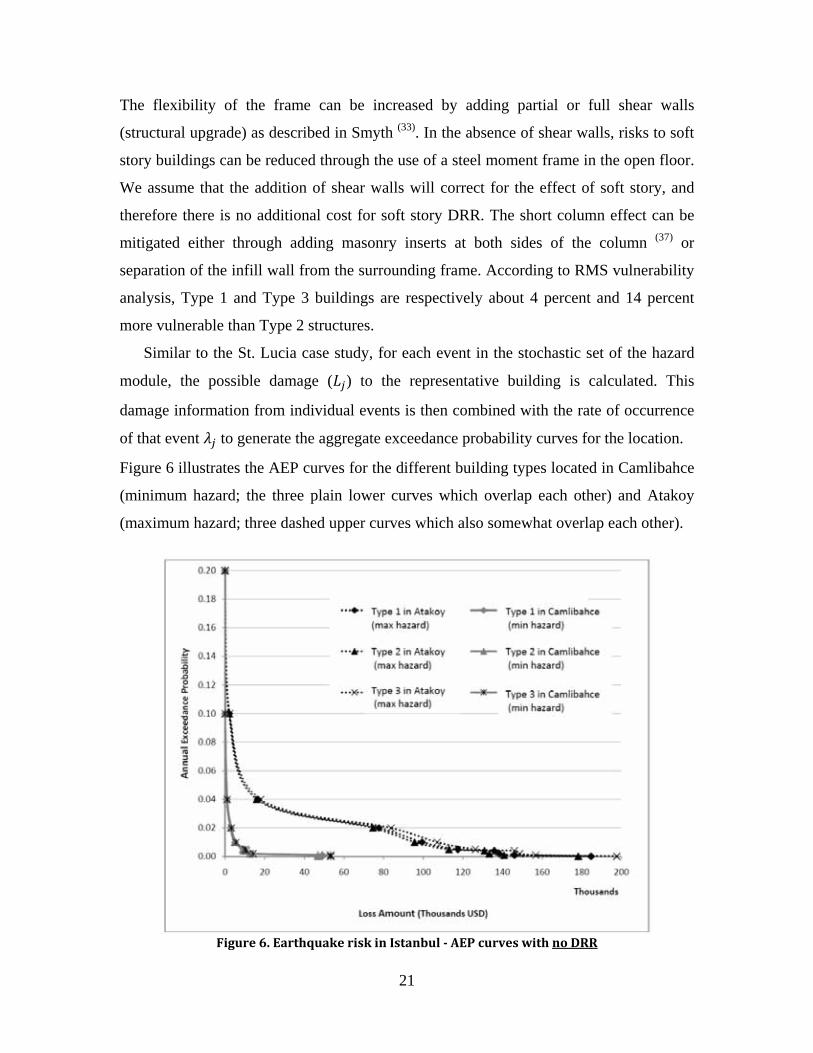
Similar to the St. Lucia case study, for each event in the stochastic set of the hazard
module, the possible damage ( ) to the representative building is calculated. This
damage information from individual events is then combined with the rate of occurrence
of that event to generate the aggregate exceedance probability curves for the location.
Figure 6 illustrates the AEP curves for the different building types located in Camlibahce
(minimum hazard; the three plain lower curves which overlap each other) and Atakoy
(maximum hazard; three dashed upper curves which also somewhat overlap each other).
Figure6.EarthquakeriskinIstanbul‐AEPcurveswithnoDRR

22
Three DRR measures for reducing seismic risk to a representative five-story reinforced
concrete building are analyzed. Measure 1 consists of retrofit short column (SC), and/or
soft story (SS) but no shear walls are added; Measure 2 consists of adding partial shear
walls (PSW) (short columns are mitigated if applicable); Measure 3 consists of adding
full shear walls (FSW) (short columns (SC) are mitigated if applicable).
Based on Smyth (33), Erdik (38) and Burnett (39), Table IV shows the cost of these DRR
measures for each building type.
Table IV. Costs of alternative DRR measures for each baseline type
DRR Option Costs (USD)
Type 1 Costs (USD)
Type 2 Costs (USD)
Type 3
1. Mitigating SC/Mitigating SS 25,000 40,000 65,000
2. Mitigating SC/Adding PSW 80,000 120,000 120,000
3. Mitigating SC/Adding FSW 135,000 175,000 175,000
SS=Soft Story; SC=Short Column; PSW=Partial Shear Wall; FSW=Full Shear Wall. A
Cost-benefit calculations
By undertaking a similar analysis to that carried out for St. Lucia, Table V summarizes
the B/C ratios for the DRR measures with two selected discount rates (5 and 12 percent)
and a building lifetime of 25 and 50 years.
Table V. Earthquake risk in Istanbul: summary of selected B/C ratios DRR
Measure Time
Horizon (years)
Type 1
Type 2
Type 3
Atakoy Max Hazard
Camlibahce Min Hazard
Atakoy Max Hazard
Camlibahce Min Hazard
Atakoy Max Hazard
Camlibahce Min Hazard
Discount Rate
Discount Rate
Discount Rate
Discount Rate
Discount Rate
Discount Rate
5% 12% 5% 12% 5% 12% 5% 12% 5% 12% 5% 12%
Mitigating SC/
Mitigating SS
25 0.22 0.12 0.02 0.01 0.09 0.05 0.01 0.00 0.14 0.08 0.01 0.01
50 0.28 0.13 0.02 0.01 0.12 0.05 0.01 0.00 0.18 0.08 0.01 0.01
Mitigating SC/
Adding PSW
25 0.22 0.12 0.01 0.01 0.09 0.05 0.01 0.00 0.12 0.07 0.01 0.00
50 0.25 0.13 0.02 0.01 0.12 0.05 0.01 0.00 0.16 0.07 0.01 0.00
Mitigating SC/
Adding FSW
25 0.11 0.06 0.01 0.00 0.06 0.03 0.00 0.00 0.11 0.06 0.01 0.00
50 0.15 0.07 0.01 0.00 0.08 0.04 0.01 0.00 0.14 0.06 0.01 0.00
SS=Soft Story; SC=Short Column; PSW=Partial Shear Wall; FSW=Full Shear Wal

23
The B/C ratios range from 0 to 0.28, meaning that – regardless of the hazard level, the
time horizon and discount rate considered here – the costs of the three DRR measures
outweigh the benefits. This means that from a purely financial standpoint, these
measures are not recommended. However, the picture changes when one takes into
account the value of reducing risk to human life as discussed below.
Integrating the value of reducing mortality risk into the CBA
Cost-benefit analyses of projects/investments that reduce mortality risk generally make
use of a value of statistical life (VSL) to quantify the benefits of undertaking these
measures (see Viscusi (40) and Viscusi and Aldy (41) for a review). If a disaster risk
mitigation project reduces the probability that an individual dies, conditional on the
disaster event occurring, the project will save a number of statistical lives equal to the
sum of reductions in the risk of death over the exposed population. The underlying
rationale for estimating the VSL is to price life saving measures according to what people
are willing to pay for a reduction in their mortality risk.
U.S. federal agencies, and some public agencies in the European Union, routinely
make use of a VSL, but in the U.S. it differs greatly across agencies. According to the
2003 Office of Information and Regulatory Affairs guidance a statistical life saved is
valued from USD 1 million to USD 10 million. The Environmental Protection Agency
uses the point estimate of USD 6 million, while the Department of Transportation and the
Department of Health and Human Services tend to use values that range from USD 3 to 5
million (42). These estimates are based on empirical information regarding what people
actually spend to reduce their risk of dying (revealed preferences), or how much they
need be compensated to take on mortality risk (e.g. hedonic wage studies that estimate
compensating wage differentials). Alternatively, the estimates are based on contingent
valuation surveys asking people what they are willing to pay to reduce their risk or how
much compensation they require to accept risk (stated preferences).
Despite this experience, assigning a specific statistical monetary value to a life,
particularly if this value is lower for citizens of developing countries, can be
controversial. For this reason, we undertake a sensitivity analysis using a range of
statistical value of life estimates. As an upper bound of the VSL, we take the highest

24
practical estimate in the United States, USD 6 million (43). As a lower range, we make use
of a method suggested by Cropper and Sahin (43), which scales the VSL (in this case, for
Turkey) according to the country’s per capita income relative to the U.S. This method
yields a Turkish VSL approximately equal to USD 750,000. We use these figures as the
lower and upper range of the VSL for the Istanbul case.
In Table VI we show how the B/C estimates change if we include the value of
reducing mortality risk in the Istanbul analysis based on the assumption that 50 residents
live in the building (10 families of 5 people, since the buildings we study here have 10
units). We take as an example the case of seismic retrofit using steel metal frames for a
Type 1 constructed house in a high-risk area. As can be seen, the B/C ratios when VSL is
not incorporated in the analysis (ranging from 0.12 to 0.28 depending on the discount rate
and time horizon of the building) increase significantly if the value of reducing mortality
risk is included. Even for the lowest VSL (USD 750,000) the DRR measure is now
attractive (B/C ration higher than 1) assuming a discount rate of 5 percent. With the
maximum VSL (USD 6 million) the B/C ratios range from 4.6 to 10.8 as a function of the
discount rates and time horizons that we consider in our analyses, making investment in
that DRR highly attractive.
Table VI: Earthquake risk in Istanbul: B/C ratios taking into account the value of life for baseline
type 1 and measure 1 (ratios above 1 in Bold)
Analysis
Time Horizon (Years)
Atakoy Max Hazard
Discount Rate
5% 12%
Value of statistical life not included 25 0.22 0.12
50 0.13 0.28
VSL= USD 750,000 25 1.3 0.7
50 1.6 0.73
VSL= USD 6 million 25 8.1 4.6
50 10.8 4.9
These findings confirm the result by Smyth (33), who applied a VSL of USD 400,000, that
only by including the value of statistical lives saved do earthquake strengthening
measures for apartment buildings and schools in Istanbul pass the benefit-cost test.

25
4. DISCUSSION
The St. Lucia and Istanbul case studies underline the importance of examining the
hazard, exposure and vulnerability, as well as the costs of the risk reduction measures and
the appropriate discount rates and time horizons, for providing policy relevant
information on DRR. A probabilistic catastrophe model-based CBA can provide valuable
insights to public policy makers considering, for example, legislation on building codes
or requiring building retrofits to protect against earthquake and hurricane hazards. Such
analysis helps determine what DRR measure is effective for a given location and type of
construction given the hazard profile. For instance, in the Istanbul case it is not the most
vulnerable building (Type 3) that exhibits the highest B/C ratio, as one might think a
priori, but rather the least vulnerable (Type 1) because of the lower costs of retrofit. By
better targeting limited resources, probabilistic catastrophe model–based CBA can make
DRR much more effective.
Note, however, that our results are based on several simplifying assumptions. As a
start, as is the case for many developing countries, there is little information available on
physical vulnerability of structures, and as a proxy we made use of information from
developed countries (in the case of St. Lucia). On the benefit side, we did not take
account of the value of household assets and the loss of livelihoods; nor did we include
broader indirect avoided losses from disasters (e.g., health care cost or business
interruption), which could increase the B/C ratio. In the St. Lucia case, we did not
consider mortality risk, which is especially important for DRR in the developing world,
where, as discussed in the introduction, reportedly over 95 percent of deaths from natural
disasters occur.
If mortality and morbidity risk can be estimated it is important to ask how fatalities
and injuries can be valued so as to be commensurate with other benefits and costs of the
project. In the Istanbul case, we described and made use of a methodology for including
this mortality risk based on adjusted values of statistical life (VSL) from available
empirical studies. We noted that applying one specific VSL can be controversial, and for

26
this reason we recommend not making use of a point value, but applying a sensitivity
analysis to the results over a range of VSL estimates.
As another simplification, we assumed that the risk will remain constant over the
period of time for which we evaluated the expected benefits of the DRR measures. In
reality the different components of the risk can change over time. This is particularly
relevant today since climate change is expected to worsen extreme climate events in
terms of duration, frequency and intensity (2) in several parts of the world that are exposed
to natural disasters, which is relevant for our St. Lucia analysis. One challenge of
including climate change into CBAs though is the large uncertainty in the effect of
climate change on hazard levels, given that to date it has not been possible to assign
probabilities to different climate scenarios (44), (45).
Climate change is not the only driver of adjustments in risk over time. Any increase
in hazard intensity might in the future be outweighed by autonomous decreases in asset
vulnerability or exposure (e.g., individuals moving away from high hazard regions).
Other drivers of increasing risk are economic development and urbanisation (46).
These caveats need to be considered by authorities charged with implementing risk
management measures. In many instances, thus, a model-based CBA of disaster risk
management may prove to be the most useful for outlining a process for rigorously
weighing the benefits and costs (see Kull (17)).
Furthermore, while our analysis reveals what DRR measures are cost effective under
a series of assumptions on the risk components, costs, discount rates and time horizons,
this does not mean that such measures will necessarily be implemented. For instance, St.
Lucia has not yet implemented a mandatory national building code, and increasing
demand for houses could result in construction being undertaken without proper attention
being given to its resiliency to future storms. In Turkey, a 2010 report prepared by a
parliamentary research commission indicates that authorities have failed to improve city
planning, reinforce substandard buildings, control urban development, and punish people
who violate building codes. Due to the rapidly increasing population of Istanbul and
resulting housing boom, tens of thousands of buildings are suspected of violating the
existing building code. Overcrowding, poor land use planning, lacking infrastructure and
services, and environmental degradation have all caused the earthquake risk in the city to

27
increase. Experts have recommended demolishing some 40,000 buildings that would
probably collapse in a major earthquake, with hundreds of other buildings in dire need of
reinforcement. Without implementation of DRR measures, Istanbul will likely suffer
severe damage and large numbers of fatalities when the next major earthquake strikes (47).
There are numerous economic and psychological barriers that can help explain why
many countries have not implemented building codes, including the high capital costs of
upfront DRR measures, individuals’ misperception of risk, overconfidence in the ability
to survive disasters, and difficulties in calculating the benefits of DRR. Moreover, recent
studies in psychology show that individuals tend to utilize hyperbolic discounting, which
gives a much higher importance weight to what can happen today (paying for a DRR
measure) than to what can happen 5 or 10 years from now. Note also that our two case
studies did not take risk aversion into account. Losses to housing structures were
expressed in risk-neutral terms as mean damage ratios or expected losses. To take
account of risk aversion, expected utility rather than expected value becomes the basis of
the calculations, where expected utility might be expressed in terms of an equivalent
monetary gain. How risk aversion plays a role for low-probability high consequences
events is important since policymakers, who set policy based only on expected losses,
could undervalue the importance of preparing for low-probability extreme events (48), (49).
One way to potentially increase cost-effective investment in DRR would be for
international organizations and donors to adopt a long time horizon and develop a larger
portfolio of loan and grant mitigation programs. Probabilistic catastrophe model-based
CBA can help them target the more efficient DRR investments and also measure
financially the expected effectiveness of a given DRR program before it is implemented (10).

28
REFERENCES:
1 Rojas F, Lew M, Naeim F. An overview of building codes and standards in Chile at the time of the 27 February 2010 Offshore Maule, Chile earthquake. The Structural Design of Tall and Special Buildings 19(8): 853–865. 2010.
2 IPCC. Summary for Policymakers. In: Intergovernmental Panel on Climate Change Special Report on Managing the Risks of Extreme Events and Disasters to Advance Climate Change Adaptation [Field CB, Barros V, Stocker TF, Qin D, Dokken D, Ebi KL, Mastrandrea MD, Mach KJ, Plattner G-K, Allen S, Tignor M, Midgley PM, (eds.)]. Cambridge University Press, Cambridge, United Kingdom and New York, NY, USA, 2011.
3 Multihazard Mitigation Council (MMC). Natural Hazard Mitigation Saves: An Independent Study to Assess the Future Savings from Mitigation Activities. Volume 2-Study Documentation. Washington DC: Multihazard Mitigation Council. 2005.
4 Mechler, R. Cost-benefit analysis of natural disaster risk management in developing countries. Eschborn: Deutsche Gesellschaft für Technische Zusammenarbeit (GTZ). 2005.
5 Kunreuther H. Disaster Mitigation and Insurance: Learning from Katrina. Annals of the American Academy of Political and Social Science, 2006; 604: 208–227.
6 Kunreuther H, Meyer RJ, Michel-Kerjan E. Strategies for better protection against catastrophic risks. In E. Shafir E, editor., Behavioral Foundations of Policy. Princeton, NJ: Princeton University Press. 2012, forthcoming.
7 Cavallo E, Noy I. The Economics of Natural Disasters. A Survey. IDB working paper series 124. Washington, DC: Inter-American Development Bank. 2010.
8 Michel-Kerjan E, Volkman Wise J. The Risk of Ever-Growing Federal Disaster Relief. Paper presented at the NBER Insurance Group workshop; September 2011. Cambridge, MA.
9 Michel-Kerjan E, Kunreuther H. Redesigning Flood Insurance. Science, 2011; 333, pp.408-409, July 22.
10 World Bank/United Nations. Natural Hazards, UnNatural Disasters. The Economics of Effective Prevention. Washington D.C.: The World Bank, 2010.
11 United Nations International Strategy for Disaster Reduction (UNISDR). Hyogo Framework for Action 2005-2015: Building the Resilience of Nations and Communities to Disasters. Geneva: UNISDR. 2005.
12 Linnerooth-Bayer J, Mechler R, Pflug G. Refocusing Disaster Aid. Science 2005; 309:1044-1046.
13 Linnerooth-Bayer J, Bals C, Mechler R. Insurance as part of a Climate Adaptation Strategy. In: Hulme M, Neufeldt H, editors, Making climate change work for us: European perspectives on adaptation and mitigation strategies. Cambridge: Cambridge University Press, 2010.
14 UK Ministry of Agriculture. Flood and Coastal Defence Project, Appraisal Guidance: Overview. FCDPAPAG1, London: MAFF. 2001.
15 Quinet E. Cost Benefit Analysis of Transport Projects in France. In: Florio M, editor. Cost benefit analysis and incentives in evaluation. Edward Elgar, 2007.
16 Benson C, Twigg J. Measuring mitigation: Methodologies for assessing natural hazard risks and the net benefits of mitigation - A scoping study. Geneva: International Federation of Red Cross and Red Crescent societies / ProVention Consortium. 2004.
17 Kull D, Mechler R, Hochrainer S. Probabilistic Cost-Benefit Analysis of Disaster Risk Management in a Development Context. Disasters, 2012 forthcoming.
18 Dixit A, Pokhrel A,, Moench M. Qualitative Assessment of the Costs and Benefits of Flood Mitigation. In: Moench M, Fajber E, Dixit S, Caspari E, Pokhrel A, editors. 2009. Catalyzing Climate and Disaster Resilience. Kathmandu: ISET.
19 Grossi P, Kunreuther H, eds. Catastrophe Modeling: A New Approach to Managing Risk. New York: Springer, 2005.
29
20 Mechler R, Linnerooth-Bayer J, Hochrainer S, Pflug G.. Assessing Financial Vulnerability and Coping Capacity: The IIASA CATSIM Model. In: Birkmann J, editor. Measuring Vulnerability and Coping Capacity to Hazards of Natural Origin. Concepts and Methods. United Nations University Press, Tokyo: 380-398, 2006.
21 Born P, Martin W. Catastrophe Modeling in the Classroom. Risk Management and Insurance Review, 2006; 9: 219–229.
22 Dong W. Building a More Profitable Portfolio, Modern Portfolio Theory with Application to Catastrophe Insurance, Reactions Publication, 2001.
23 Pflug G, Roemisch W. Modeling, Measuring and Managing Risk. London.: World Scientific Publishing Company, 2007.
24 Hochrainer S. Macroeconomic Risk Management against Natural Disasters. Wiesbaden, Germany: German University Press (DUV). 2006.
25 Hallegatte S, Ghil M. Natural disasters impacting a Macroeconomic Model with Endogenous Dynamics. Ecological Economics, 2008; 68: 582-592.
26 Hochrainer S. Assessing Macroeconomic Impacts of Natural Disasters: Are There Any? Policy Research Working Paper 4968. Washington DC: World Bank. 2009.
27 World Bank. Catastrophe Risk Financing in Developing Countries. Washington, DC.: The World Bank, 2008.
28 Wason A. Status of Building Codes in the Caribbean, USAID/OAS Post-Georges Disaster Mitigation, 2001. http://www.oas.org/pgdm/document/codemtrx.htm Accessed Mar 9, 2012.
29 Kairi Consultants Limited. Trade Adjustment and Poverty in St. Lucia -2006/06. Volume I: Main Report, Submitted to Caribbean Development Bank; June 2007.
30 Louis E. “Damage and Needs Assessment Sub-Committee Assessed Cost of Damages Caused by Hurricane Ivan.” National Emergency Management Organization, September 7th, 2004 [http://www.reliefweb.int/rw/RWB.NSF/db900SID/SODA-6EM5KB?OpenDocument]
31 Mechler R. 2004. Natural Disaster Risk Management and Financing Disaster Losses in Developing Countries. Karlsruhe: Verlag für Versicherungswirtschaft.
32 Barnes K.. Clock ticking for an Istanbul earthquake: A wake-up call for seismic-hazard preparedness in Turkey. Nature, 2010, 12 March, doi:10.1038/news.2010.121
33 Smyth AW Altay G, Deodatis G, Erdik M, Franco G, Gülkan P, Kunreuther H, Lu H, Mete E, Seeber N, Yüzügüllü O. Probabilistic Benefit-Cost Analysis for Earthquake Damage Mitigation: Evaluating Measures for Apartment Houses in Turkey. Earthquake Spectra, 2004; 20(1): 171-203.
34 Erdik M, Demircioglu M, Sesetyan K, Durukal E, Siyahi B. Earthquake hazard in Marmara Region, Turkey. Soil Dynamics and Earthquake Engineering, 2004; 24: 605-63.1
35 Gulkan P, Aschheim M, Spence R. Housing Report Reinforced Concrete Frame Buildings with Masonry Infills. Report Number 64, Country Turkey, World Housing Encyclopedia. 2002.
36 Risk Management Solution (RMS). Event Report Kocaeli, Turkey Earthquake. 2001.
37 Guevara TL, García LE. The captive- and short-column effects. Earthquake Spectra, 2005; 21(1): 141-160.
38 Erdik M. “Earthquake Vulnerability of Buildings and a Mitigation Strategy: Case of Istanbul.” Washington DC: World Bank. 2003.
39 Burnett W. Quake-proof: What S.F. homeowners need to do to be ready for a 7.2 San Andreas shaker. San Francisco Chronicle, 2004, May 8.
40 Viscusi WK. The Value of Risks to Life and Health. Journal of Economic Literature 1993; 31(4): 1912-1946.
41 Viscusi K, Aldy JE. The Value of a Statistical Life: A Critical Review of Market Estimates Throughout the World. Journal of Risk and Uncertainty, 2003; 27 (1): 5–76
42 Graham JD. Saving Lives through Administrative Law and Economics. University of Pennsylvania Law Review, 2008; 157: 395-540.
30
43 Cropper M, Sahin S. Valuing Mortality and Morbidity in the Context of Disaster Risks. Background paper for the joint World Bank – UN assessment on disaster risk reduction. Washington, D.C: World Bank. 2008.
44 Chao H.-P. Managing the Risk of Global Climate Catastrophe: An Uncertainty Analysis. Risk Analysis, 1995; 15: 69–78.
45 Ranger N, Niehörster F. “Deep uncertainty in long-term hurricane risk: scenario generation and implications for future climate experiments.” Global Environmental Change, forthcoming 2012.
46 Nicholls R, Hanson S, Herweijer C, Patmore N, Hallegatte S, Corfee-Morlot J, Chateau J, Muir-Wood R. Ranking port cities with high exposure and vulnerability to climate extremes: Exposure estimates. OECD Environment Working Paper 1, ENV/WK(1)2007. 2007.
47 Turgut P. Turkey's Earthquake Toll a Grim Reminder of Lessons Not Learned. TIME, 2001, October 26.
48 Weitzman ML. On Modelling and Interpreting the Economics of Catastrophic Climate Change. Review of Economics and Statistics, 2009; 91 (1): 1-19.
49 Peterson M. The Limits of Catastrophe Aversion. Risk Analysis, 2002; 22(3): 527-538
i Michel-Kerjan and Kunreuther are with the Wharton School, University of Pennsylvania (USA); Hochrainer-Stigler, Linnerooth-Bayer and Mechler are with IIASA (Austria), Muir-Wood, Vaziri, and Young are with Risk Management Solutions (UK/USA); Ranger is with the London School of Economics (UK). Address for correspondence: Erwann Michel-Kerjan, Center for Risk Management, The Wharton School, University of Pennsylvania, 3730 Walnut Street, Huntsman Hall 556, Philadelphia, PA, 19104, USA; email: [email protected] ii Another important advantage is that probabilistic catastrophe models provide a more explicit and transparent description of the uncertainties in the analysis. iii There is significant variability in loss calculations due to uncertainties associated with the hazard itself, vulnerability calculations and incomplete information on exposure. Catastrophe models can include these secondary uncertainties but for simplification, this paper presents the results without secondary uncertainties. Dong (22) explains the concept of secondary uncertainty in catastrophe models in great detail. iv Not only are the codes out of date, there is also a lack of enforcement of the current codes in place. The Development Control Authority of St. Lucia is responsible for enforcing building codes, but it encounters extreme difficulties in monitoring new settlements. Given the housing shortage in St. Lucia, houses can be shoddily constructed virtually overnight.