Embed Size (px)
Citation preview
Centre for Risk Studies
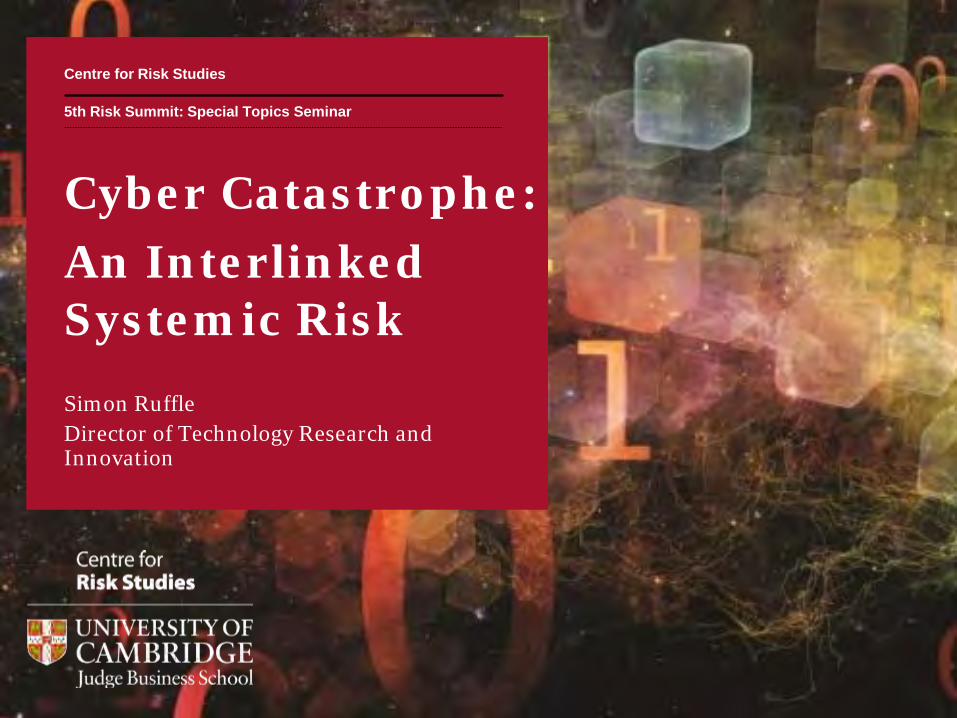
Cyber Catastrophe: An Interlinked Systemic Risk Simon Ruffle Director of Technology Research and Innovation
5th Risk Summit: Special Topics Seminar
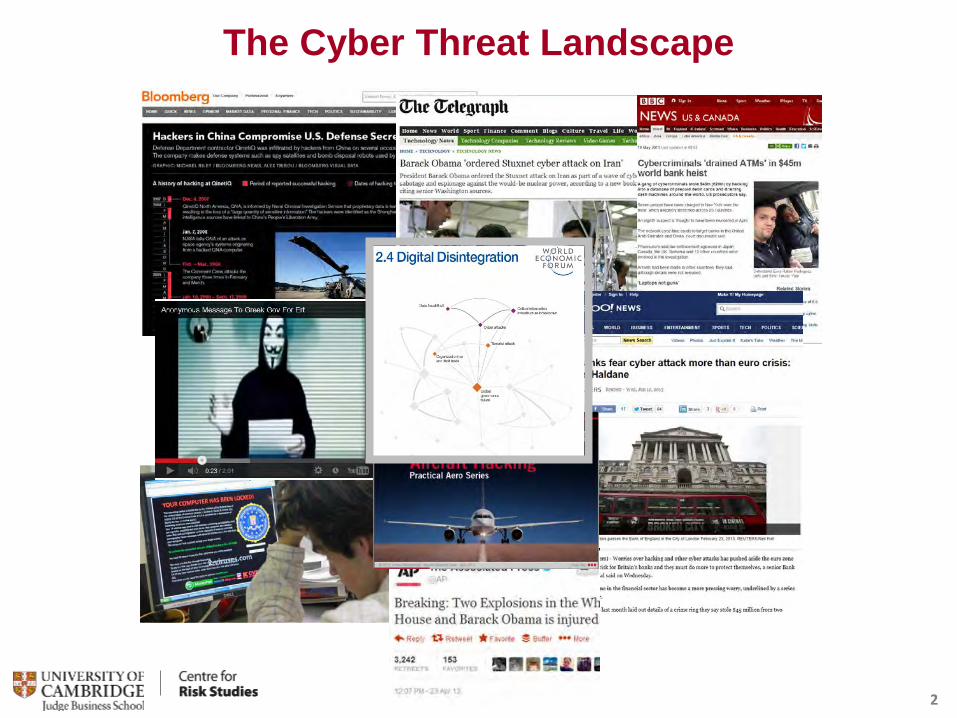
The Cyber Threat Landscape
2
3
Systemically Important Technology Enterprises (SITEs)
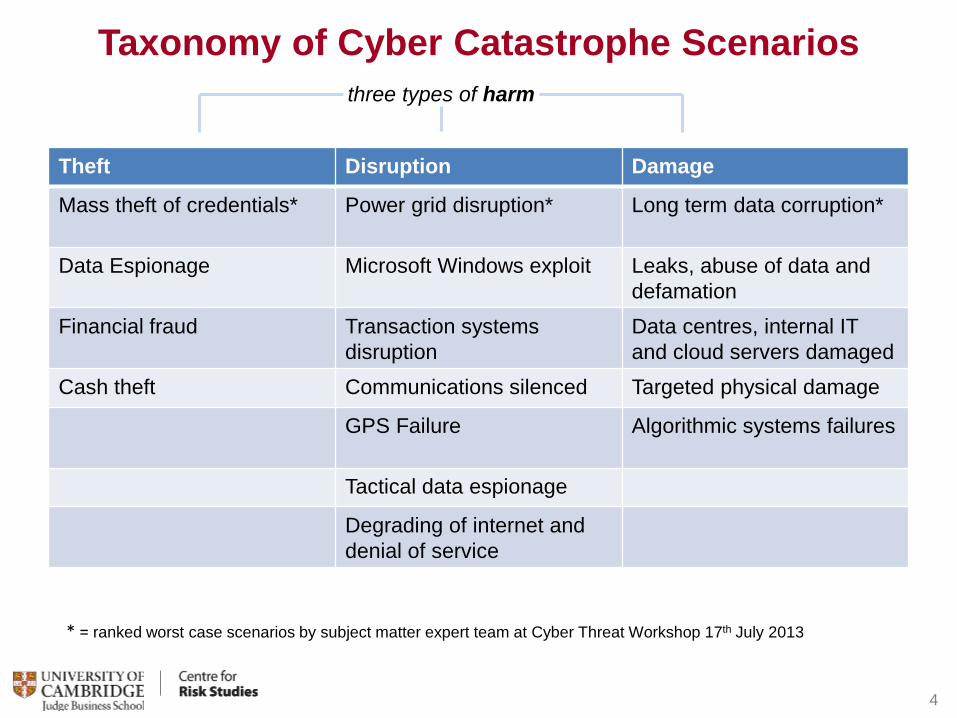
Taxonomy of Cyber Catastrophe Scenarios
4
Theft Disruption Damage
Mass theft of credentials*
Power grid disruption*
Long term data corruption*
Data Espionage
Microsoft Windows exploit Leaks, abuse of data and defamation
Financial fraud Transaction systems disruption
Data centres, internal IT and cloud servers damaged
Cash theft Communications silenced Targeted physical damage
GPS Failure
Algorithmic systems failures
Tactical data espionage
Degrading of internet and denial of service
three types of harm
* = ranked worst case scenarios by subject matter expert team at Cyber Threat Workshop 17th July 2013
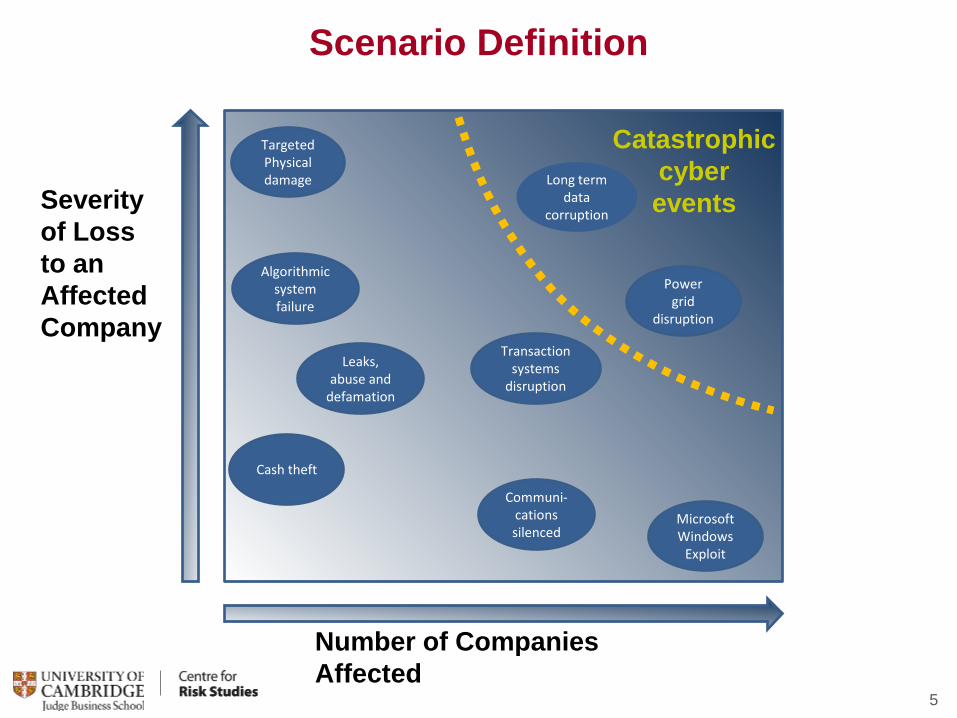
Scenario Definition
5
Severity of Loss to an Affected Company
Number of Companies Affected
Power grid
disruption
Communi-cations silenced
Targeted Physical damage
Algorithmic system failure
Cash theft
Transaction systems
disruption
Long term data
corruption
Leaks, abuse and
defamation
Microsoft Windows
Exploit
Catastrophic cyber events
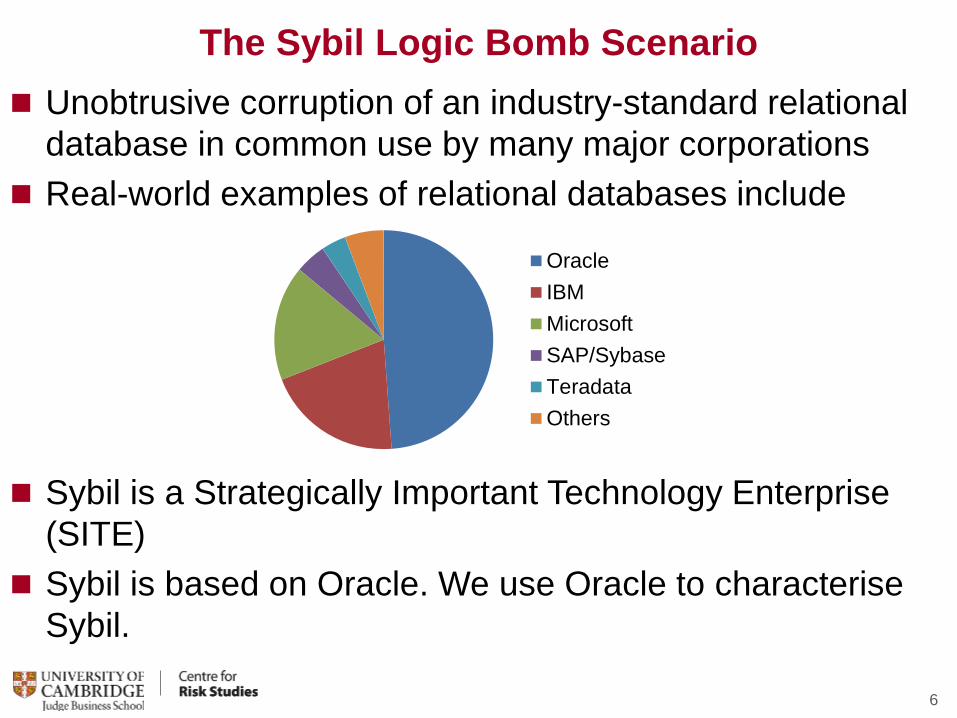
The Sybil Logic Bomb Scenario Unobtrusive corruption of an industry-standard relational
database in common use by many major corporations Real-world examples of relational databases include
Sybil is a Strategically Important Technology Enterprise (SITE)
Sybil is based on Oracle. We use Oracle to characterise Sybil.
6
OracleIBMMicrosoftSAP/SybaseTeradataOthers
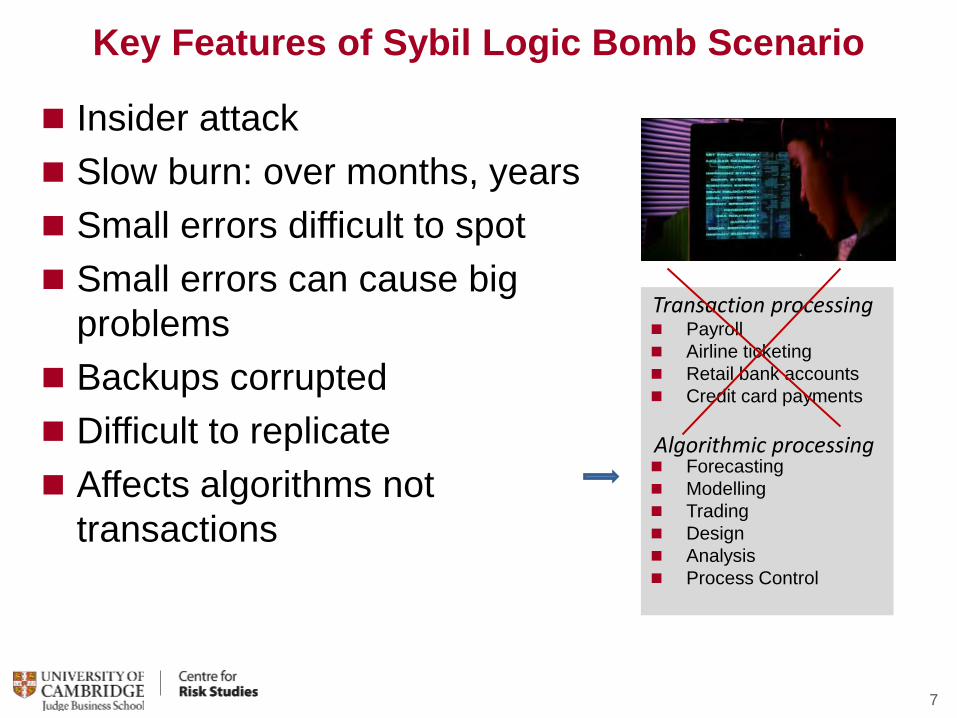
Key Features of Sybil Logic Bomb Scenario
Insider attack Slow burn: over months, years Small errors difficult to spot Small errors can cause big
problems Backups corrupted Difficult to replicate Affects algorithms not
transactions 7
Payroll Airline ticketing Retail bank accounts Credit card payments
Forecasting Modelling Trading Design Analysis Process Control
Transaction processing
Algorithmic processing
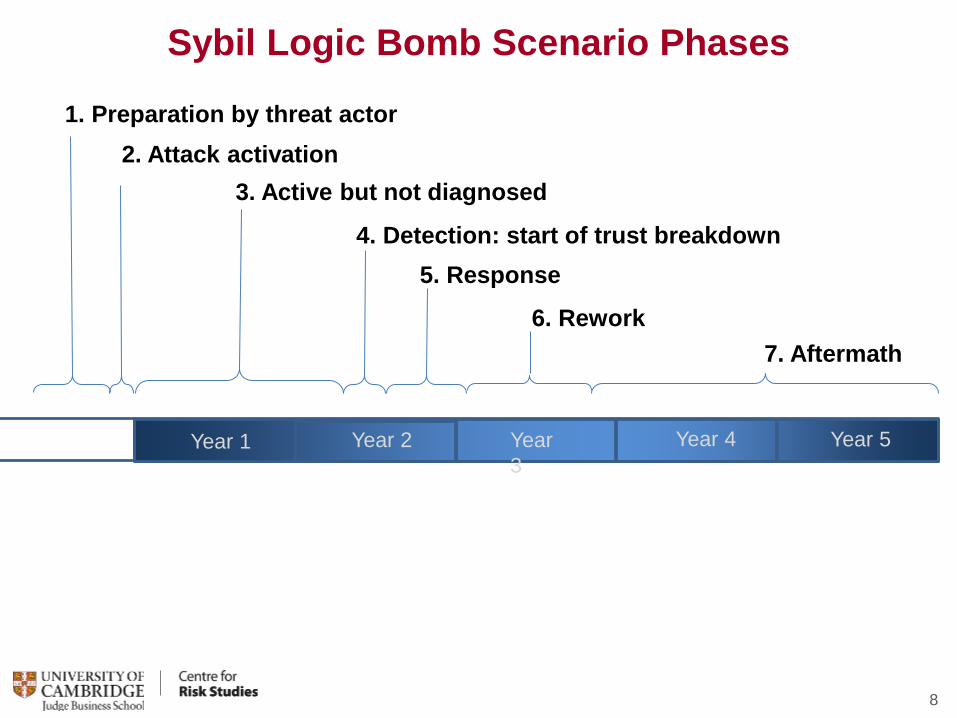
Sybil Logic Bomb Scenario Phases
8
1. Preparation by threat actor 2. Attack activation
3. Active but not diagnosed
4. Detection: start of trust breakdown 5. Response
6. Rework 7. Aftermath
Year 1 Year 2 Year 3
Year 4 Year 5
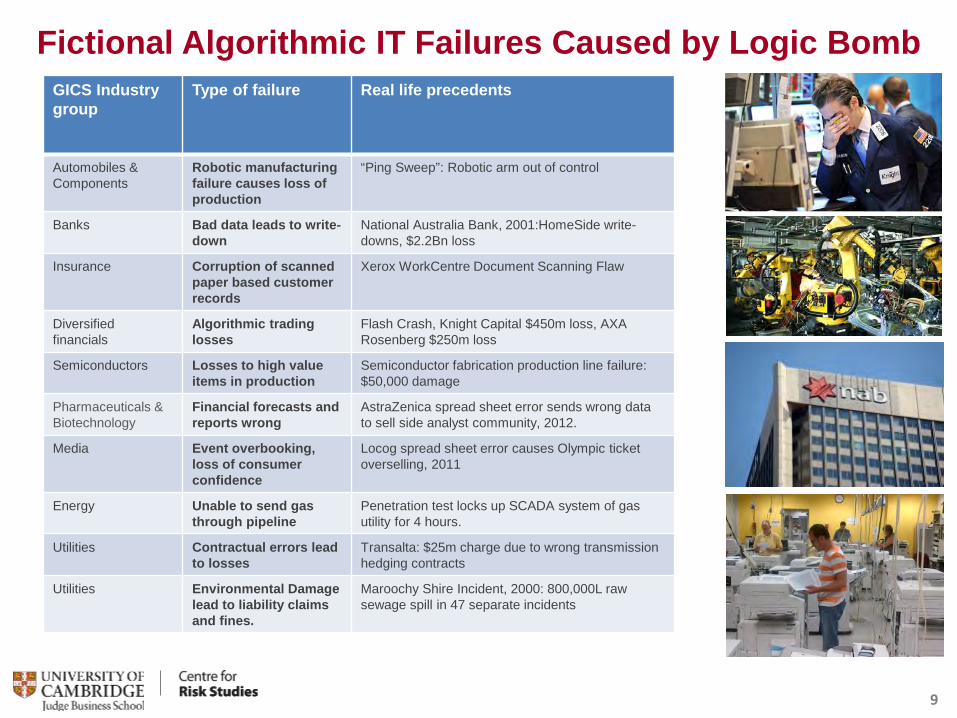
Fictional Algorithmic IT Failures Caused by Logic Bomb
9
GICS Industry group
Type of failure Real life precedents
Automobiles & Components
Robotic manufacturing failure causes loss of production
“Ping Sweep”: Robotic arm out of control
Banks Bad data leads to write-down
National Australia Bank, 2001:HomeSide write-downs, $2.2Bn loss
Insurance Corruption of scanned paper based customer records
Xerox WorkCentre Document Scanning Flaw
Diversified financials
Algorithmic trading losses
Flash Crash, Knight Capital $450m loss, AXA Rosenberg $250m loss
Semiconductors Losses to high value items in production
Semiconductor fabrication production line failure: $50,000 damage
Pharmaceuticals & Biotechnology
Financial forecasts and reports wrong
AstraZenica spread sheet error sends wrong data to sell side analyst community, 2012.
Media Event overbooking, loss of consumer confidence
Locog spread sheet error causes Olympic ticket overselling, 2011
Energy Unable to send gas through pipeline
Penetration test locks up SCADA system of gas utility for 4 hours.
Utilities Contractual errors lead to losses
Transalta: $25m charge due to wrong transmission hedging contracts
Utilities Environmental Damage lead to liability claims and fines.
Maroochy Shire Incident, 2000: 800,000L raw sewage spill in 47 separate incidents
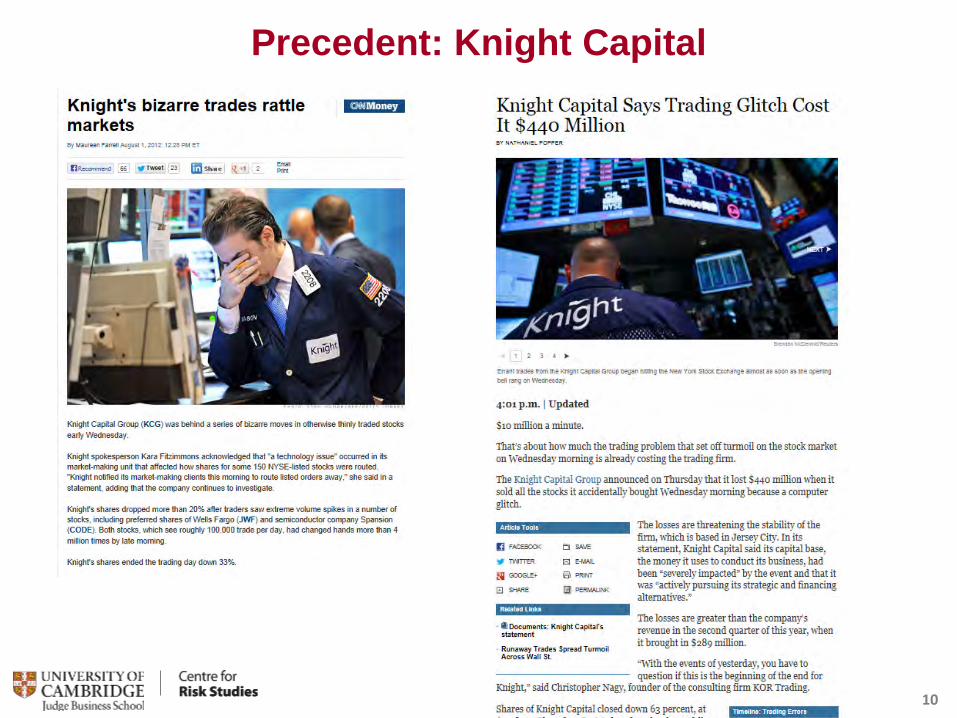
Precedent: Knight Capital
10
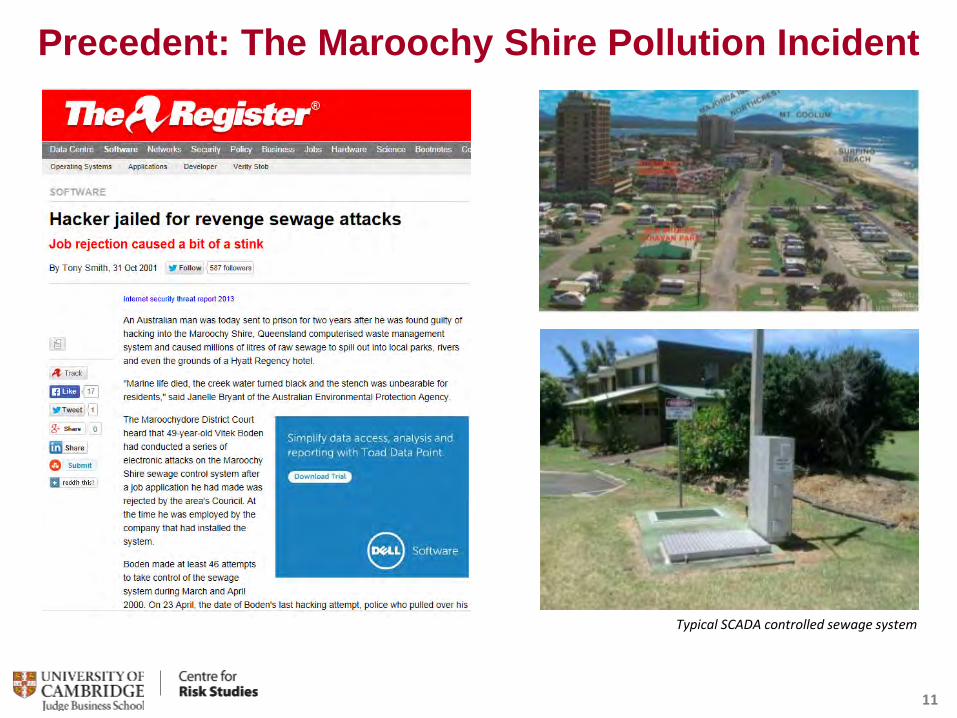
Precedent: The Maroochy Shire Pollution Incident
11
Typical SCADA controlled sewage system
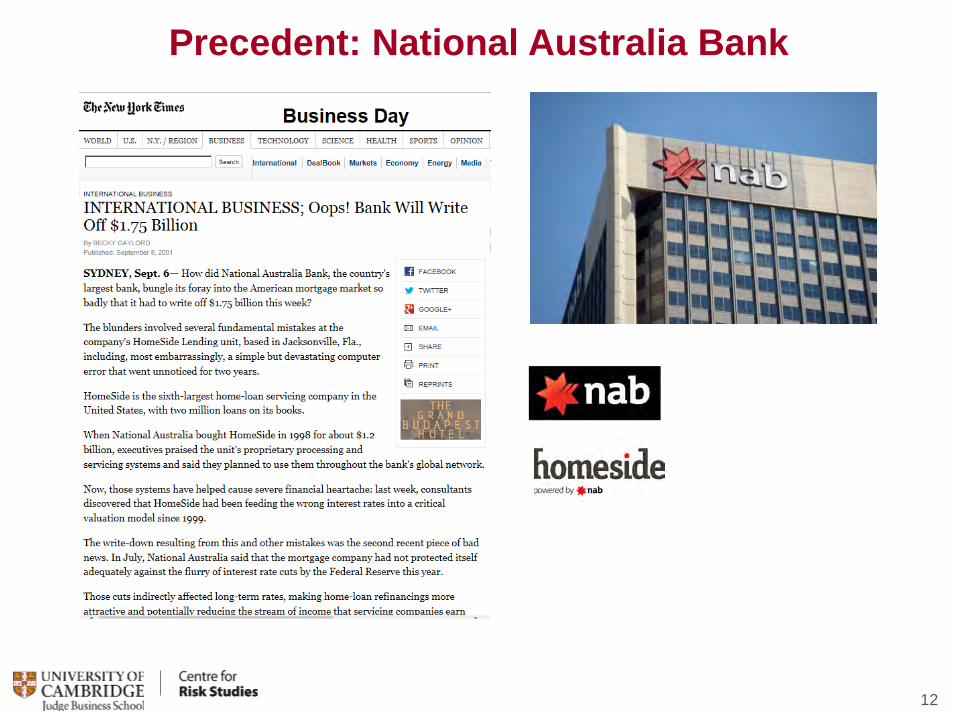
Precedent: National Australia Bank
12
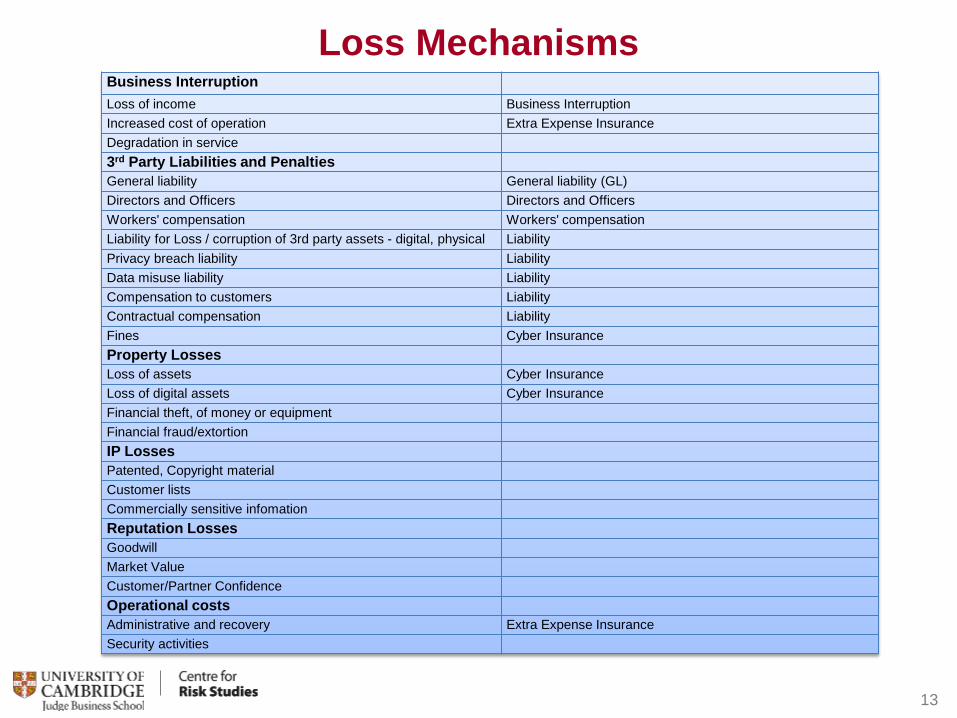
Loss Mechanisms
13
Business Interruption Loss of income Business Interruption Increased cost of operation Extra Expense Insurance Degradation in service 3rd Party Liabilities and Penalties General liability General liability (GL) Directors and Officers Directors and Officers Workers' compensation Workers' compensation Liability for Loss / corruption of 3rd party assets - digital, physical Liability Privacy breach liability Liability Data misuse liability Liability Compensation to customers Liability Contractual compensation Liability Fines Cyber Insurance Property Losses Loss of assets Cyber Insurance Loss of digital assets Cyber Insurance Financial theft, of money or equipment Financial fraud/extortion IP Losses Patented, Copyright material Customer lists Commercially sensitive infomation Reputation Losses Goodwill Market Value Customer/Partner Confidence Operational costs Administrative and recovery Extra Expense Insurance Security activities
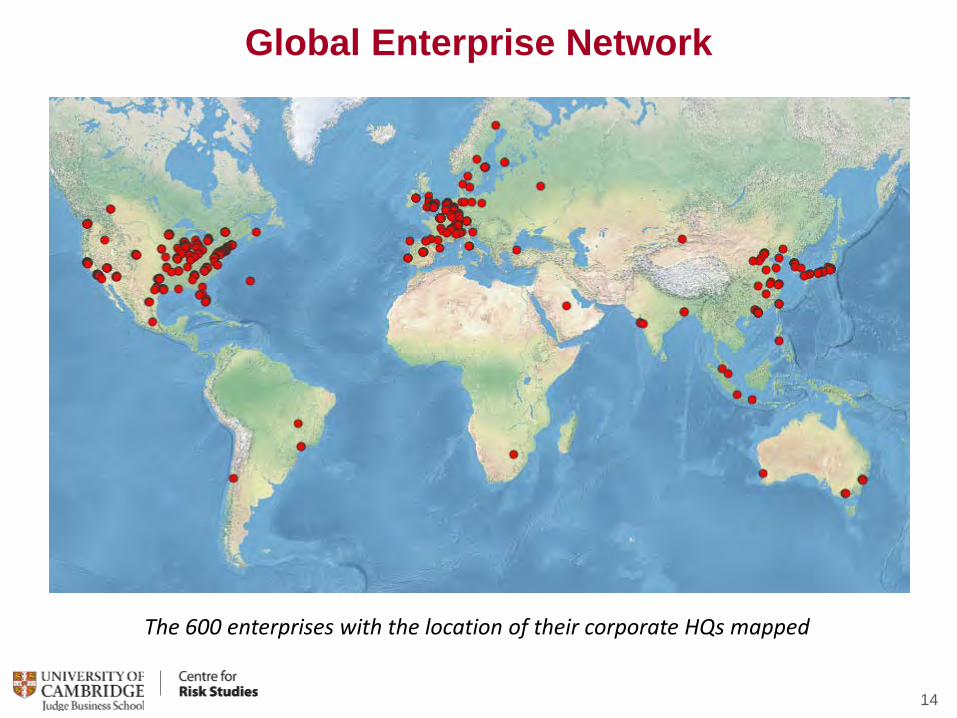
Global Enterprise Network
14
The 600 enterprises with the location of their corporate HQs mapped
15
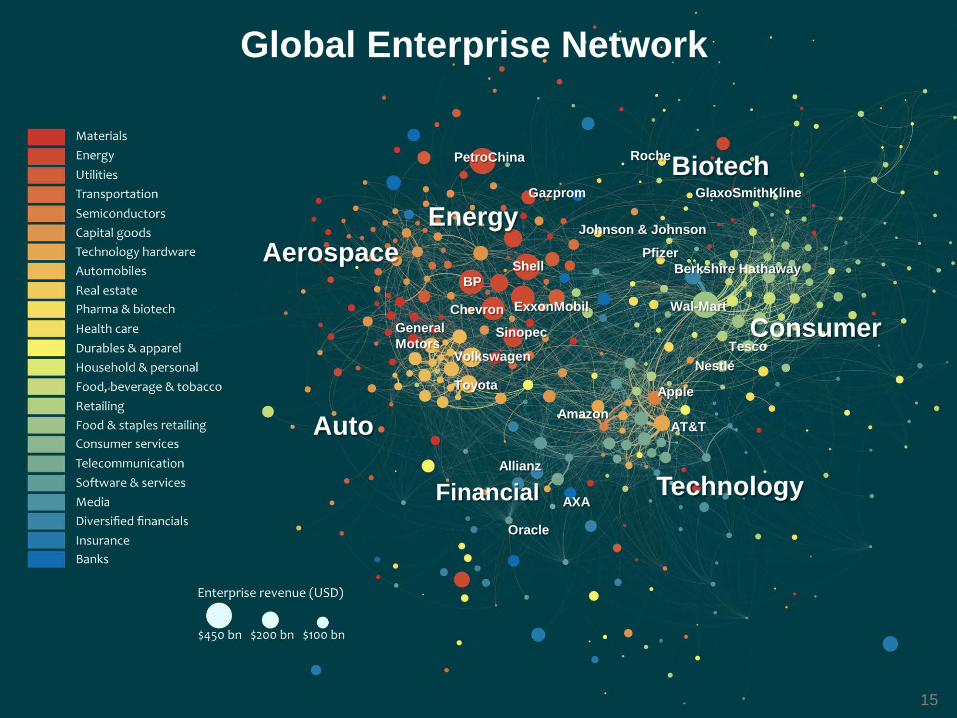
Global Enterprise Network
Wal-Mart
Shell BP
ExxonMobil
PetroChina
Volkswagen
Toyota
Berkshire Hathaway Pfizer
Johnson & Johnson
Roche
GlaxoSmithKline
AT&T
Apple Amazon
Chevron
Gazprom
Sinopec General Motors
Allianz
Oracle
AXA
Tesco Nestlé
Auto
Aerospace Energy
Consumer
Biotech
Technology Financial
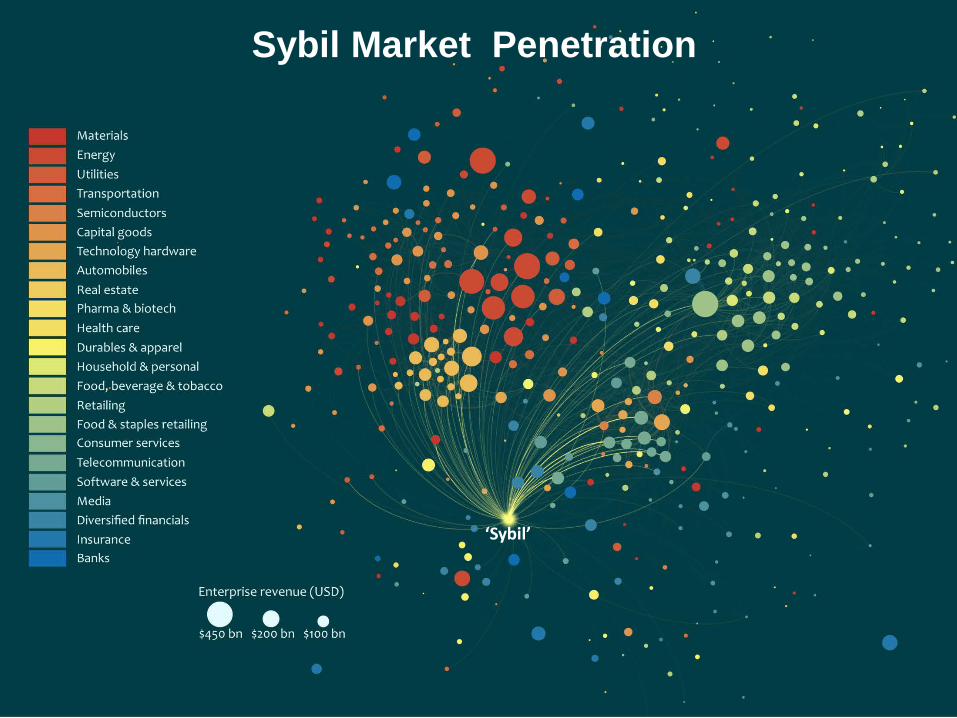
16
‘Sybil’
Sybil Market Penetration
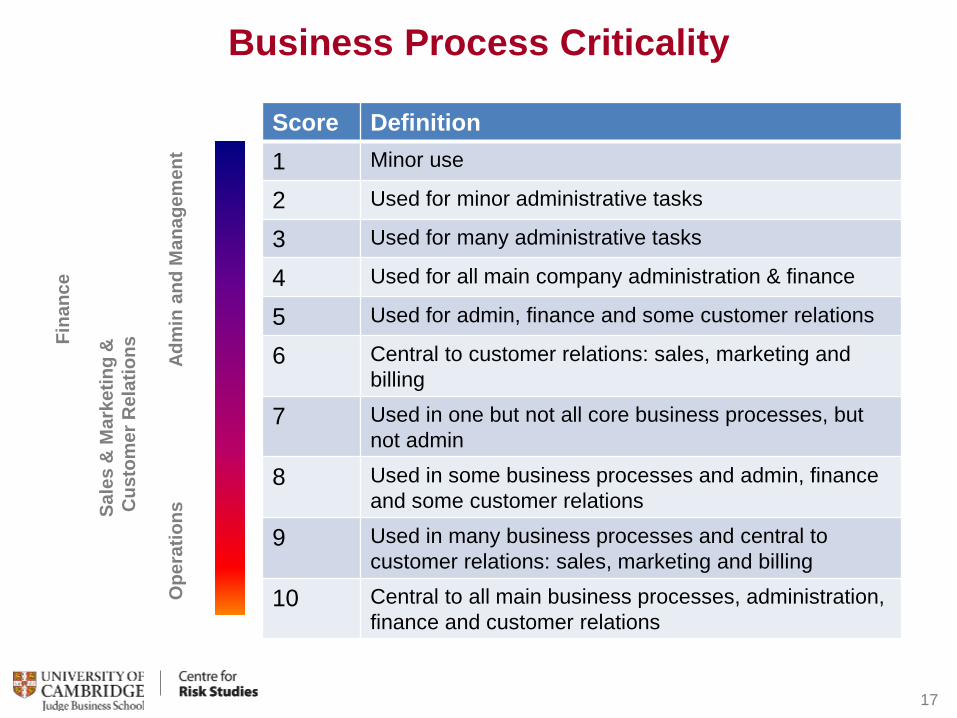
Business Process Criticality
17
Score Definition 1 Minor use
2 Used for minor administrative tasks
3 Used for many administrative tasks
4 Used for all main company administration & finance
5 Used for admin, finance and some customer relations
6 Central to customer relations: sales, marketing and billing
7 Used in one but not all core business processes, but not admin
8 Used in some business processes and admin, finance and some customer relations
9 Used in many business processes and central to customer relations: sales, marketing and billing
10 Central to all main business processes, administration, finance and customer relations
Adm
in a
nd M
anag
emen
t
Fina
nce
Sale
s &
Mar
ketin
g &
C
usto
mer
Rel
atio
ns
Ope
ratio
ns
30%
40%
50%
60%
70%
80%
90%
100%
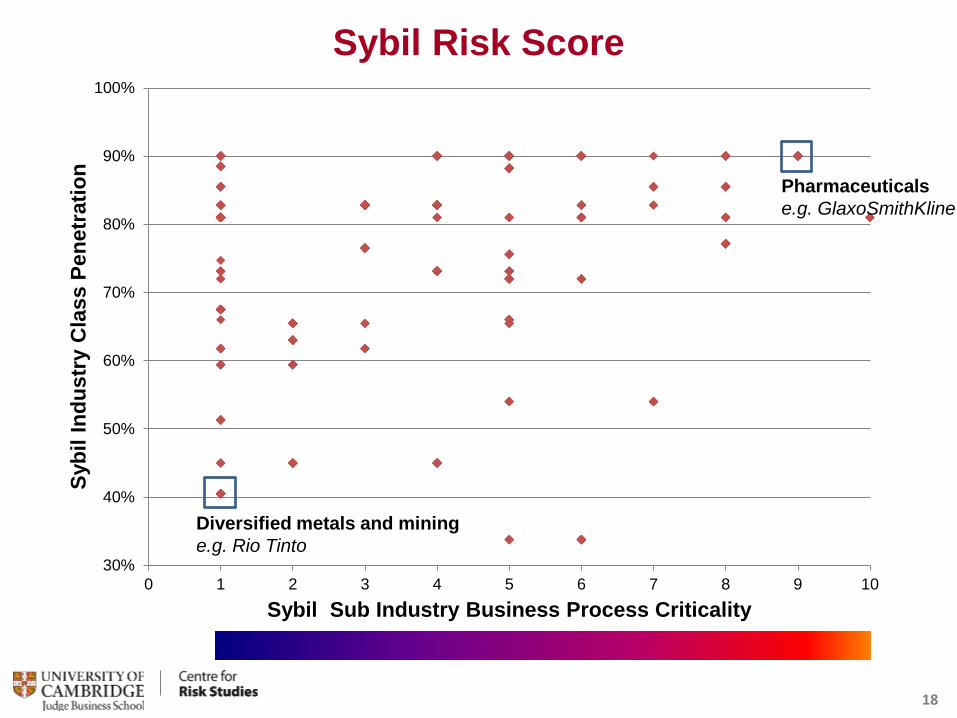
0 1 2 3 4 5 6 7 8 9 10
Sybi
l Ind
ustr
y C
lass
Pen
etra
tion
Sybil Sub Industry Business Process Criticality
Sybil Risk Score
18
Diversified metals and mining e.g. Rio Tinto
Pharmaceuticals e.g. GlaxoSmithKline
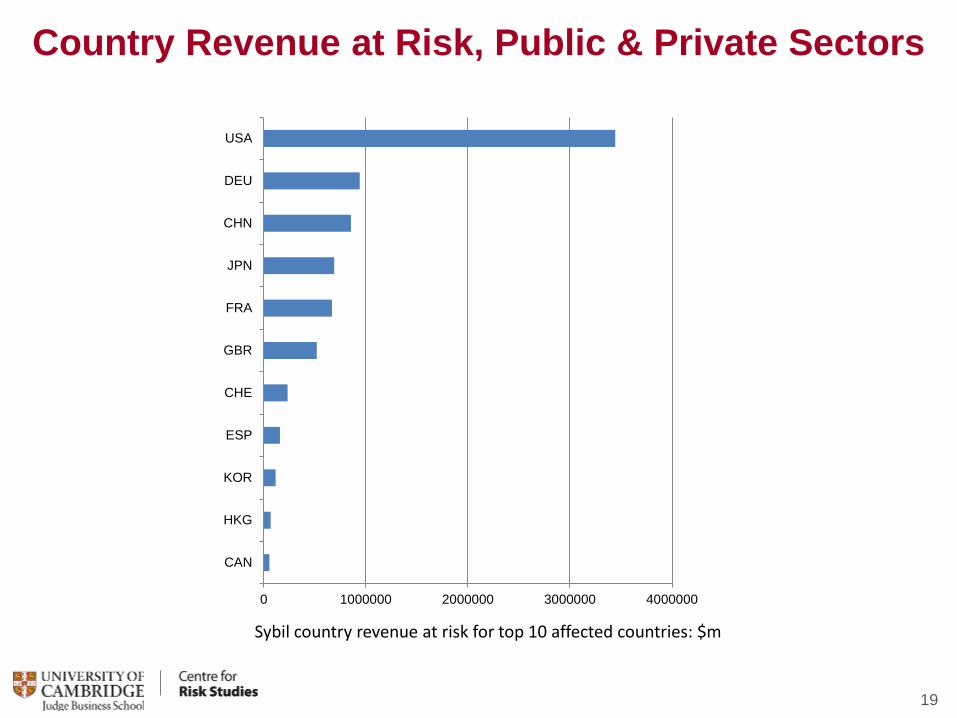
Country Revenue at Risk, Public & Private Sectors
19
Sybil country revenue at risk for top 10 affected countries: $m
0 1000000 2000000 3000000 4000000
CAN
HKG
KOR
ESP
CHE
GBR
FRA
JPN
CHN
DEU
USA
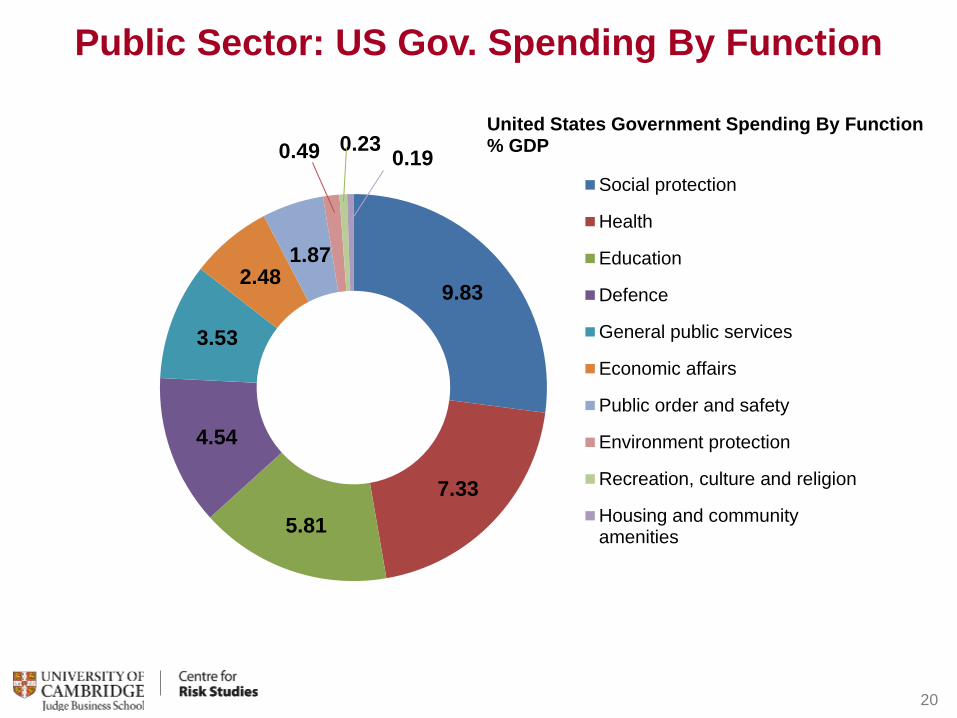
Public Sector: US Gov. Spending By Function
20
9.83
7.33 5.81
4.54
3.53
2.48 1.87
0.49 0.23 0.19 United States Government Spending By Function % GDP
Social protection
Health
Education
Defence
General public services
Economic affairs
Public order and safety
Environment protection
Recreation, culture and religion
Housing and communityamenities
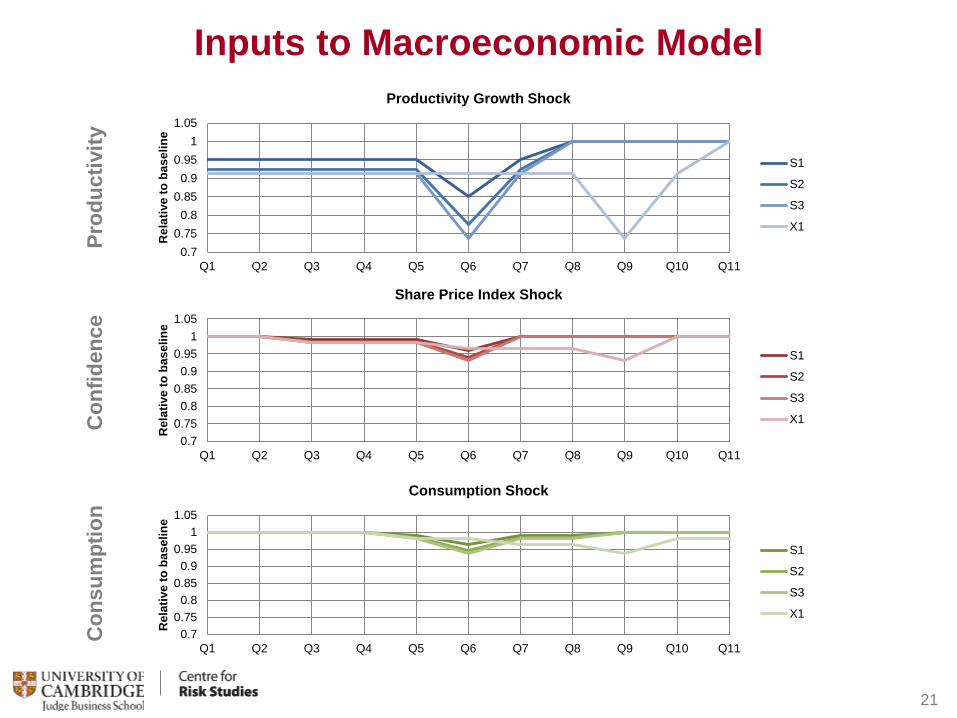
Inputs to Macroeconomic Model
21
Prod
uctiv
ity
Con
fiden
ce
Con
sum
ptio
n
0.70.750.8
0.850.9
0.951
1.05
Q1 Q2 Q3 Q4 Q5 Q6 Q7 Q8 Q9 Q10 Q11
Rel
ativ
e to
bas
elin
e
Productivity Growth Shock
S1
S2
S3
X1
0.70.750.8
0.850.9
0.951
1.05
Q1 Q2 Q3 Q4 Q5 Q6 Q7 Q8 Q9 Q10 Q11
Rel
ativ
e to
bas
elin
e
Share Price Index Shock
S1
S2
S3
X1
0.70.750.8
0.850.9
0.951
1.05
Q1 Q2 Q3 Q4 Q5 Q6 Q7 Q8 Q9 Q10 Q11
Rel
ativ
e to
bas
elin
e
Consumption Shock
S1
S2
S3
X1
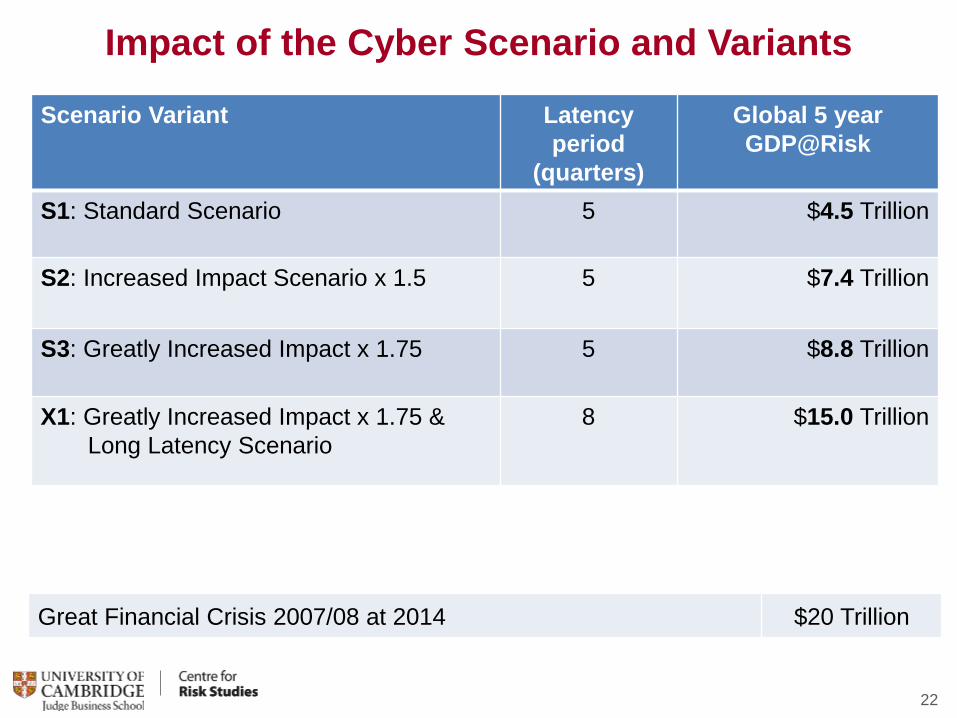
Impact of the Cyber Scenario and Variants
Scenario Variant Latency period
(quarters)
Global 5 year GDP@Risk
S1: Standard Scenario
5 $4.5 Trillion
S2: Increased Impact Scenario x 1.5
5 $7.4 Trillion
S3: Greatly Increased Impact x 1.75
5 $8.8 Trillion
X1: Greatly Increased Impact x 1.75 & Long Latency Scenario
8 $15.0 Trillion
22
Great Financial Crisis 2007/08 at 2014 $20 Trillion
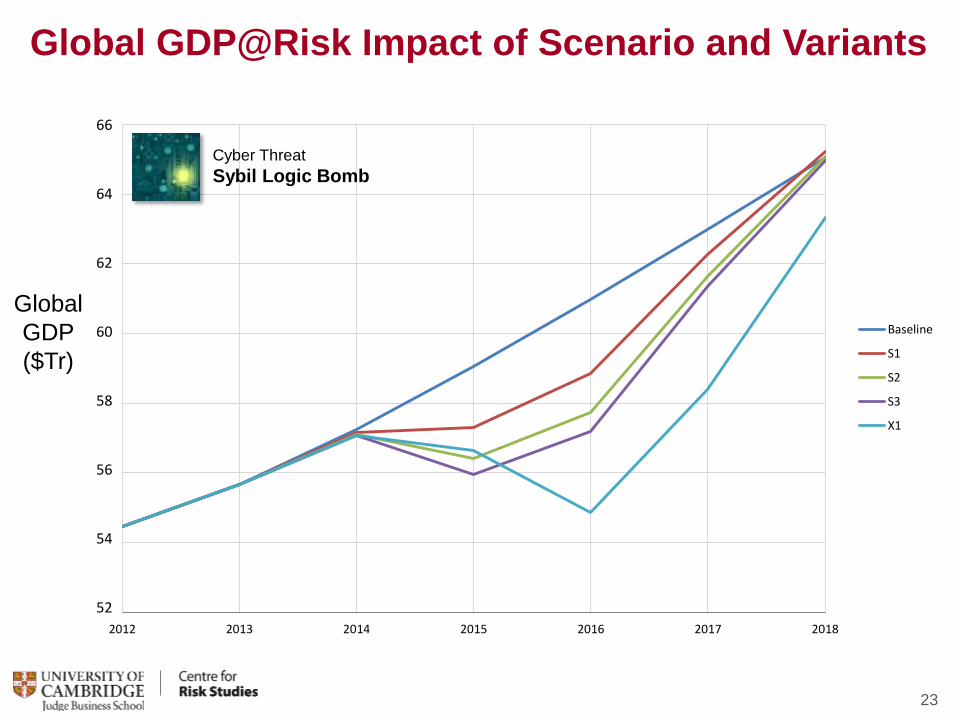
Global GDP@Risk Impact of Scenario and Variants
23
Global GDP ($Tr)
2012 2013 2014 2015 2016 2017 2018
Baseline
S1
S2
S3
X1
Cyber Threat Sybil Logic Bomb
52
54
56
58
60
62
64
66
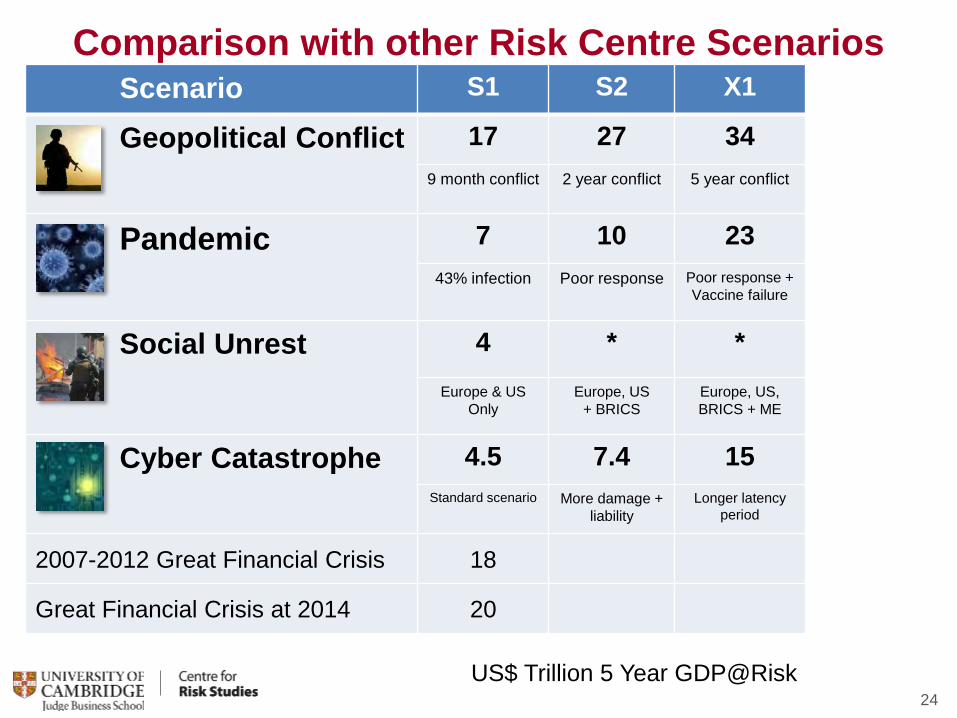
Comparison with other Risk Centre Scenarios
24
Scenario S1 S2 X1
Geopolitical Conflict 17 27 34 9 month conflict 2 year conflict 5 year conflict
Pandemic 7 10 23 43% infection Poor response Poor response +
Vaccine failure
Social Unrest 4 * * Europe & US
Only Europe, US
+ BRICS Europe, US, BRICS + ME
Cyber Catastrophe 4.5 7.4 15 Standard scenario More damage +
liability Longer latency
period
2007-2012 Great Financial Crisis 18
Great Financial Crisis at 2014 20
US$ Trillion 5 Year GDP@Risk
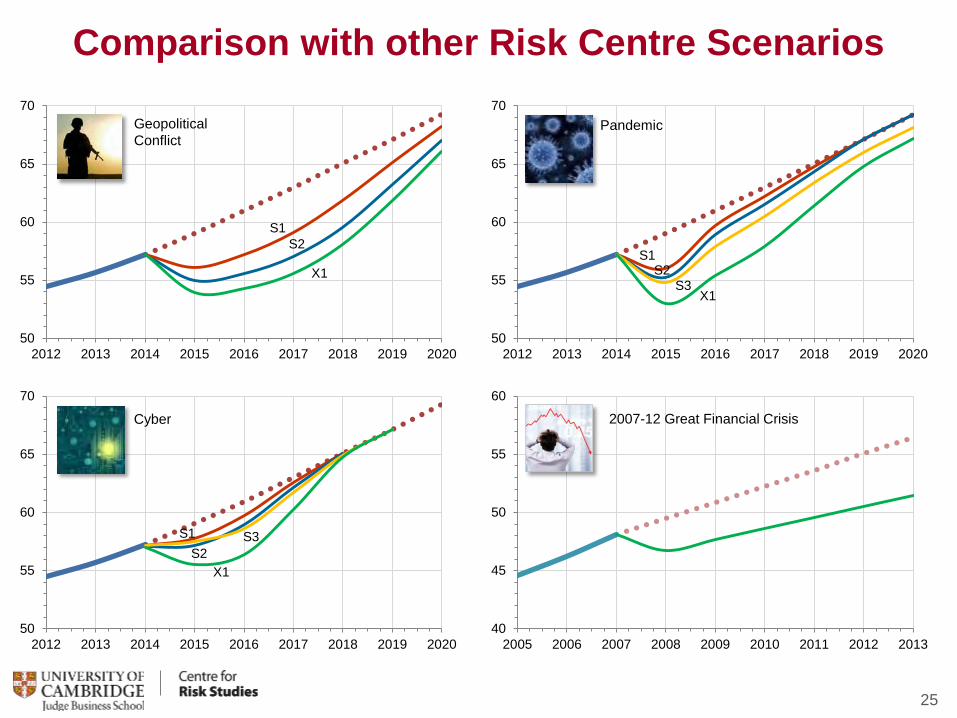
Comparison with other Risk Centre Scenarios
25
50
55
60
65
70
2012 2013 2014 2015 2016 2017 2018 2019 2020
50
55
60
65
70
2012 2013 2014 2015 2016 2017 2018 2019 202050
55
60
65
70
2012 2013 2014 2015 2016 2017 2018 2019 2020
S1 S2
X1
S1 S2
X1
S3
S1 S2
X1 S3
Geopolitical Conflict
Pandemic
Cyber
40
45
50
55
60
2005 2006 2007 2008 2009 2010 2011 2012 2013
2007-12 Great Financial Crisis
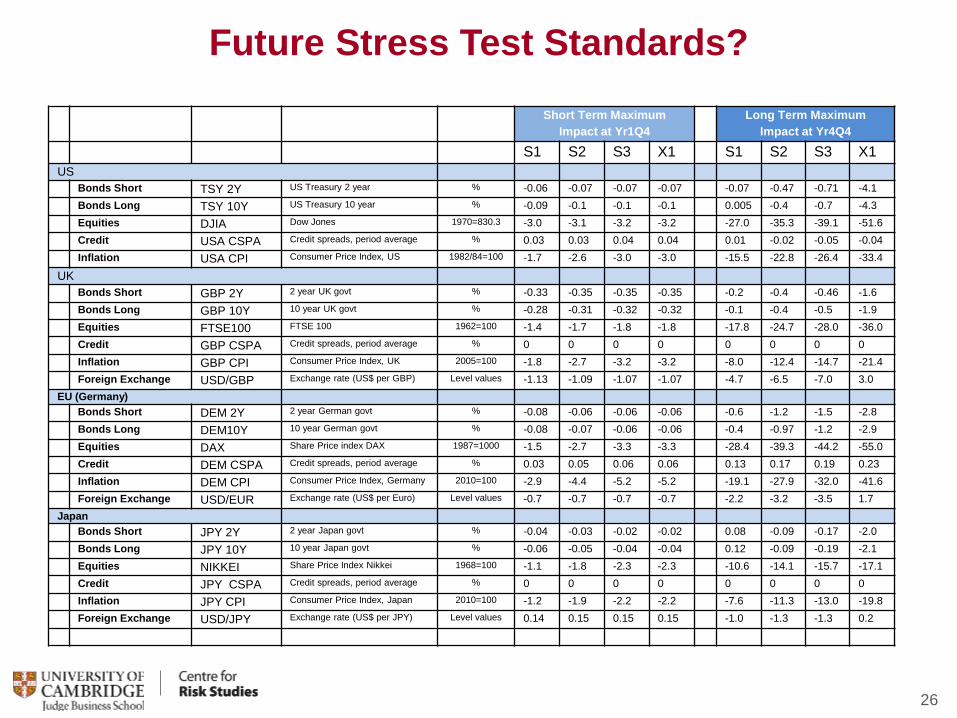
Future Stress Test Standards?
26
Short Term Maximum Impact at Yr1Q4
Long Term Maximum Impact at Yr4Q4
S1 S2 S3 X1 S1 S2 S3 X1 US
Bonds Short TSY 2Y US Treasury 2 year % -0.06 -0.07 -0.07 -0.07 -0.07 -0.47 -0.71 -4.1 Bonds Long TSY 10Y US Treasury 10 year % -0.09 -0.1 -0.1 -0.1 0.005 -0.4 -0.7 -4.3 Equities DJIA Dow Jones 1970=830.3 -3.0 -3.1 -3.2 -3.2 -27.0 -35.3 -39.1 -51.6 Credit USA CSPA Credit spreads, period average % 0.03 0.03 0.04 0.04 0.01 -0.02 -0.05 -0.04 Inflation USA CPI Consumer Price Index, US 1982/84=100 -1.7 -2.6 -3.0 -3.0 -15.5 -22.8 -26.4 -33.4
UK Bonds Short GBP 2Y 2 year UK govt % -0.33 -0.35 -0.35 -0.35 -0.2 -0.4 -0.46 -1.6 Bonds Long GBP 10Y 10 year UK govt % -0.28 -0.31 -0.32 -0.32 -0.1 -0.4 -0.5 -1.9 Equities FTSE100 FTSE 100 1962=100 -1.4 -1.7 -1.8 -1.8 -17.8 -24.7 -28.0 -36.0 Credit GBP CSPA Credit spreads, period average % 0 0 0 0 0 0 0 0 Inflation GBP CPI Consumer Price Index, UK 2005=100 -1.8 -2.7 -3.2 -3.2 -8.0 -12.4 -14.7 -21.4 Foreign Exchange USD/GBP Exchange rate (US$ per GBP) Level values -1.13 -1.09 -1.07 -1.07 -4.7 -6.5 -7.0 3.0
EU (Germany) Bonds Short DEM 2Y 2 year German govt % -0.08 -0.06 -0.06 -0.06 -0.6 -1.2 -1.5 -2.8 Bonds Long DEM10Y 10 year German govt % -0.08 -0.07 -0.06 -0.06 -0.4 -0.97 -1.2 -2.9 Equities DAX Share Price index DAX 1987=1000 -1.5 -2.7 -3.3 -3.3 -28.4 -39.3 -44.2 -55.0 Credit DEM CSPA Credit spreads, period average % 0.03 0.05 0.06 0.06 0.13 0.17 0.19 0.23 Inflation DEM CPI Consumer Price Index, Germany 2010=100 -2.9 -4.4 -5.2 -5.2 -19.1 -27.9 -32.0 -41.6 Foreign Exchange USD/EUR Exchange rate (US$ per Euro) Level values -0.7 -0.7 -0.7 -0.7 -2.2 -3.2 -3.5 1.7
Japan Bonds Short JPY 2Y 2 year Japan govt % -0.04 -0.03 -0.02 -0.02 0.08 -0.09 -0.17 -2.0 Bonds Long JPY 10Y 10 year Japan govt % -0.06 -0.05 -0.04 -0.04 0.12 -0.09 -0.19 -2.1 Equities NIKKEI Share Price Index Nikkei 1968=100 -1.1 -1.8 -2.3 -2.3 -10.6 -14.1 -15.7 -17.1 Credit JPY CSPA Credit spreads, period average % 0 0 0 0 0 0 0 0 Inflation JPY CPI Consumer Price Index, Japan 2010=100 -1.2 -1.9 -2.2 -2.2 -7.6 -11.3 -13.0 -19.8 Foreign Exchange USD/JPY Exchange rate (US$ per JPY) Level values 0.14 0.15 0.15 0.15 -1.0 -1.3 -1.3 0.2
Conclusion: Diversify IT Platforms
Compromise of a Strategically Important Technology Enterprise (SITE)
‘Information Malaise’: Loss of trust in IT by business leaders, investors and consumers
World 5 Year GDP@Risk: $4.5Tr
Efficiency drive towards standardisation in corporate IT platforms contrary to good risk management
Portfolio diversification by companies in their choice of technology platforms
27
Outcomes of Scenario
Implications for Risk Management
Simon Ruffle Director of Technology Research and Innovation [email protected]


![Catastrophe by Design: Destabilizing Wasteful Technologies ... · Catastrophe by Design: Destabilizing Wasteful ... our work is based on bifurcation and catastrophe theory, ... 2008],](https://img.pdfslide.us/doc/110x75/5f0d14817e708231d4389479/catastrophe-by-design-destabilizing-wasteful-technologies-catastrophe-by-design.jpg)