Embed Size (px)
Citation preview
CATALYTIC UP-GRADATION OF
BIO-OIL BY PYROLYSIS OF BIOMASS
A Thesis submitted for partial fulfillment of the requirements
for the degree of Master of Technology in
“Chemical Engineering”
By
Tanvidkar Priya S.
(213CH1127)
Under supervision of
Dr. R. K. Singh
Department of Chemical Engineering
National Institute of Technology Rourkela-769008 (ODISHA)
May-2015
DEPARTMENT OF CHEMICAL ENGINEERING
NATIONAL INSTITUTE OF TECHNOLOGY,
ROURKELA ODISHA, INDIA-769008
CERTIFICATE
This is to certify that the thesis entitled “Catalytic up-gradation of bio-oil by pyrolysis of bio-
mass”, submitted by Tanvidkar Priya Shreedatta (213CH1127) in partial fulfillment of the
requirements for the award of Master of Technology in Chemical Engineering during session
2014-2015 at National Institute of Technology, Rourkela. A bona-fide record of research work
carried out by her under my supervision and guidance.
The candidate have fulfilled all the prescribed requirements.
The Thesis which is based on candidates’ own work, have not been submitted elsewhere for a
degree.
In my opinion, the thesis is of standard required for the award of a master of technology degree in
Chemical Engineering.
Place: Rourkela
Date:
Dept. of Chemical Engineering Dr. R. K. Singh
National Institute of Technology Professor
Rourkela-769008

I
ACKNOWLEDGEMENTS
I have been highly indebted in the preparation of this report to my supervisor, Dr. R. K.
Singh, whose patience and kindness, as well as his academic experience, has been invaluable
to me. I could not have asked for a better role model, inspirational, supportive, and patient
guide. I could not be prouder of my academic roots and hope that I can in turn pass on the
research values and the dreams that he has given to me.
The informal support and encouragement of many friends has been indispensable, and I would
like particularly to acknowledge the contribution of all the students working under
Dr. R. K. Singh.
I would not have contemplated this road if not for my parents, who instilled within me a love
of creative pursuits, science and language, all of which finds a place in this report.
Priya Shreedatta Tanvidkar
(213CH1127)
II
CONTENTS
List of figures ............................................................................................................................................... IV
List of Tables ................................................................................................................................................ V
Abstract ......................................................................................................................................................... 1
1 Introduction ........................................................................................................................................... 2
1.1 Biomass ......................................................................................................................................... 5
1.2 Pyrolysis ........................................................................................................................................ 7
1.3 Bio-oil ........................................................................................................................................... 8
2 Literature Review .................................................................................................................................. 9
2.1 Conversion Techniques ................................................................................................................. 9
2.2 Up-gradation of Bio-oil ............................................................................................................... 11
2.3 Catalytic Up-gradation Pathways and Reactions ........................................................................ 12
3 Experimental Section .......................................................................................................................... 19
3.1 Method ........................................................................................................................................ 19
3.2 Raw Material ............................................................................................................................... 19
3.3 Catalyst ....................................................................................................................................... 19
3.4 Characterization of Raw Material ............................................................................................... 20
3.4.1 Thermal Properties using TGA ........................................................................................... 20
3.4.2 Proximate Analysis ............................................................................................................. 20
3.4.3 Ultimate Analysis ................................................................................................................ 21
3.5 Experimental Set-up .................................................................................................................... 21
3.6 Experimental Procedure .............................................................................................................. 23
3.7 Characterization of Bio-oil.......................................................................................................... 24
3.7.1 Characterization of Physical Properties .............................................................................. 24
3.7.2 Characterization of Chemical Properties ............................................................................ 24
3.8 Bio-char Characterization ........................................................................................................... 25
3.8.1 Proximate Analysis ............................................................................................................. 25
3.8.2 Ultimate Analysis ................................................................................................................ 25
3.8.3 SEM Analysis ..................................................................................................................... 26
4 Result & Discussion ............................................................................................................................ 27
4.1 Raw Material Characterization ................................................................................................... 27
III
4.1.1 Proximate and Ultimate Analysis ....................................................................................... 27
4.1.2 Thermo-gravimetric Analysis using TGA .......................................................................... 28
4.2 Effect of Temperature on Yield Product / Bio-Oil ...................................................................... 29
4.3 Influence of Catalyst on Yield of Product / Bio-Oil ................................................................... 31
4.4 Bio-Oil Characterization ............................................................................................................. 33
4.4.1 Physical and Chemical properties of Bio-oil ...................................................................... 33
4.4.2 FTIR Analysis of Bio-oil .................................................................................................... 34
4.4.3 GC-MS Analysis of Bio-oil ................................................................................................ 39
4.5 Characterization of Bio-char ....................................................................................................... 42
4.5.1 Calorific Value .................................................................................................................... 42
4.5.2 SEM Analysis of Bio-char .................................................................................................. 42
5 Conclusion .......................................................................................................................................... 44
6 Future Work ........................................................................................................................................ 45
Bibliography ............................................................................................................................................... 46
IV
LIST OF FIGURES
Figure 1.1 Schematic illustration of Green-House effect .............................................................................. 2
Figure 1.2 Global renewable energy scenario by 2040 (Estimated) ............................................................. 4
Figure 1.3 Representative pyrolysis reactions .............................................................................................. 7
Figure 1.4 Representative compounds of bio-oil .......................................................................................... 8
Figure 2.1 Schematic of Biomass conversion Techniques .......................................................................... 10
Figure 2.2 Proposed refinery integrations and biorefinery ....................................................................... 11
Figure 2.3 Block diagram for A) ex situ CEP process and B) in situ CEP process ......................................... 13
Figure 2.4 :-Representative catalytic upgrading reactions. ........................................................................ 14
Figure 3.1 Castor seeds which are used as biomass ................................................................................... 19
Figure 3.2 Schematic diagram of experimental setup for pyrolysis of biomass ......................................... 22
Figure 3.3 Experimental setup for Pyrolysis ............................................................................................... 22
Figure 3.4 Bio-oil collected in measuring cylinder ...................................................................................... 23
Figure 4.1 TGA graph for Castor seed ......................................................................................................... 29
Figure 4.2 Effect of Temperature on yield of Product /Bio-oil ................................................................... 30
Figure 4.3 Effect of Temperature on Residence/ Completion Time ........................................................... 30
Figure 4.4 Influence of CaO on Bio-oil yield ................................................................................................ 31
Figure 4.5 Influence of MgO on Bio-oil yield .............................................................................................. 31
Figure 4.6 Influence of ZnO on Bio-oil yield ................................................................................................ 32
Figure 4.7 Influence of Fe2O3 on Bio-oil yield ............................................................................................. 32
Figure 4.8 Influence of TiO2 on Bio-oil yield ................................................................................................ 33
Figure 4.9 FTIR Analysis of castor bio-oil .................................................................................................... 36
Figure 4.10 FTIR analysis for bio-oil with catalyst ratio 1:10 & CaO as catalyst ......................................... 36
Figure 4.11 FTIR analysis for bio-oil with catalyst ratio 1:8 & MgO as catalyst .......................................... 37
Figure 4.12 FTIR analysis for bio-oil with catalyst ratio 1:10 & ZnO as catalyst ......................................... 37
Figure 4.13 FTIR analysis for bio-oil with catalyst ratio 1:10 & Fe2O3 as catalyst ....................................... 38
Figure 4.14 FTIR analysis for bio-oil with catalyst ratio 1:8 & TiO2 as catalyst............................................ 38
Figure 4.15 (a) SEM analysis of castor seed bio-char (b) SEM analysis for up-graded castor seed bio-char
with CaO as catalyst .................................................................................................................................... 42
Figure 4.16 (a) SEM analysis for up-graded castor seed bio-char with MgO (b) ZnO as catalyst ............... 43
Figure 4.17(a) SEM analysis for up-graded castor seed bio-char with Fe2O3O (b) TiO2 as catalyst ............ 43

V
LIST OF TABLES
Table 1.1 Main resources of renewable energy and their usage form ......................................................... 3
Table 2.1Bond dissociation energies (BDE) for oxygenates common to bio-oil, where R= alkyl & Ar=
aryl .............................................................................................................................................................. 12
Table 2.2 Overall Review of Catalyst used in the Different papers. ........................................................... 18
Table 4.1 Proximate Analysis resuls of Castor seed .................................................................................... 27
Table 4.2 Ultimate analysis of Castor seed ................................................................................................. 28
Table 4.3 Physical properties of Bio-oil ....................................................................................................... 34
Table 4.4 Chemical properties of bio-oil ..................................................................................................... 34
Table 4.5 FTIR Analysis of bio-oil ................................................................................................................ 39
Table 4.6 GCMS analysis of castor pyrolytic oil .......................................................................................... 40
Table 4.7 GCMS analysis of catalytic pyrolysis oil of castor oil ................................................................... 41
1
ABSTRACT
The depleting oil reserves impose a threat to ever-increasing energy requirements all over
the world. This necessitates the research on alternative sources of energy. Naturally, biomass is
converted to oil over a period of thousands of years. But to meet the demands, pyrolysis of
biomass to produce bio-oil can be a promising method for generation of alternative energy
sources. Because of high oxygen content is present in the bio-oil, it has low stability. It also has
low heating value. To remove the oxygen, up-gradation of the bio-oil becomes necessary. The
up-gradation of bio-oil helps in improving its chemical and physical properties and makes it
resemble more to the crude oil. There are two widely known methods of bio-oil up-gradation:
hydro-deoxygenation (HDO) and zeolite cracking. The hydro-deoxygenation is done by
pyrolyzing biomass or bio-oil in presence of catalyst, which removes oxygen in the form of
water. In this report study of Catalytic Pyrolysis on biomass viz. castor seed by using CaO, MgO,
Fe2O3, ZnO, and TiO2 as catalyst. Different catalytic ratios such as 1:2, 1:6, 1:8, 1:10 & 1:14
have been employed at pyrolysis temperature of 550°C, with heating rate 20°C/min for
approximately 60 min.
The bio-oil yield, bio-char yield, residence time for different catalysts with different ratios
have been recorded. The maximum yield has obtained by using Fe2O3 in the ratio 1:10 with
lowest char formation. Different physical & chemical tests have done for bio-oil & bio-char.
According to this comparably good yield with upgraded qualities is obtained by using Fe2O3 as
catalyst in ratio 1:10. After Fe2O3, it has noticed good yield is obtained from CaO, TiO2.
2
1 INTRODUCTION
The energy resources can be divided into three types: fossil fuels, nuclear resources and
renewable resources. Among these three, fossil fuels are vastly used in each sector of life. The
demand for fossil fuels has increased rapidly due to increased industrialization and increased
world population. This increased demand has put added load on the fossil fuel reserves, which
are limited. It has also affected the environment adversely and increased threat to global climate
change and health risks.[1]
Global warming or global climate change is a major problem of 21st century. It has various
adverse effects on health and socio-economic issues, for example, increased global temperature,
increase in average sea level, increased droughts and floods, and effects on the risk of calamities
and malnourishment. The higher concentration of greenhouse gases such as N2O, CH4, CO2,
ozone, CFCs and per oxy-acetyl nitrate in the atmosphere is resulting in trapping of heat radiated
from the surface of the Earth and thus increasing the Earth’s surface temperature. A schematic
diagram elaborating the of problem of global climate change is shown in figure1.1.[2]
Figure 1.1 Schematic illustration of Green-House effect
3
Excessive consumption of fossil fuels has resulted in global warming, because burning of
fossil fuels generate carbon dioxide as a byproduct. As many scientific studies divulge, in the
past 200 years, global CO2 levels have increased 31%. From 1800, deforestation added 20 Gt of
carbon to the atmosphere. Also, concentration of another gas, methane, which causes ozone layer
depletion has doubled since 1800[2]. The mean surface temperature has globally increased above
baseline of 140C by 0.4–0.80C in the last century. This increase in global temperature caused the
global sea levels to rise at an average rate of 1–2mm annually. The thickness of Arctic sea ice
has reduced by 42%. Also the total ice has decreased by 10–15% since 1950[3].Thus, it is
necessary to look forward to sustainable methods of producing alternative fuels. It is also
imperative that these alternative fuel options contribute less to air pollution and waste. Thus this
issue goes hand-in-hand with other major issues such as waste minimization, reduction of
greenhouse emission, conservation of forests.
This has aroused great interest in encouraging research on alternative fuels which would be
capable enough to meet world’s ever increasing energy requirements. The renewables are the
primary, domestic and clean or inexhaustible energy resources. These renewable technologies
are also known as non-conventional or alternative energy sources. Some of the examples include
solar energy, tidal energy, geothermal energy and wind energy. As opposed to non-renewable
energy sources, the renewable sources are clean sources of energy and careful use of such
resources reduces the hazardous impacts on the environment, produce less wastes and can be
sustainable models of energy generation based on current socio-economic situations. Currently,
14% of world’s total energy demand is fulfilled by renewable energy sources [4]. Conversion of
various forms of biomass and bio-degradable waste can produce renewable transportation fuels.
Renewable energy sources, like biogas, which are mostly used in domestic applications
definitely have the ability to provide energy with almost no emissions of both air pollutants and
greenhouse gases, thus truthfully it is clean source of energy. The RES energy sources and its
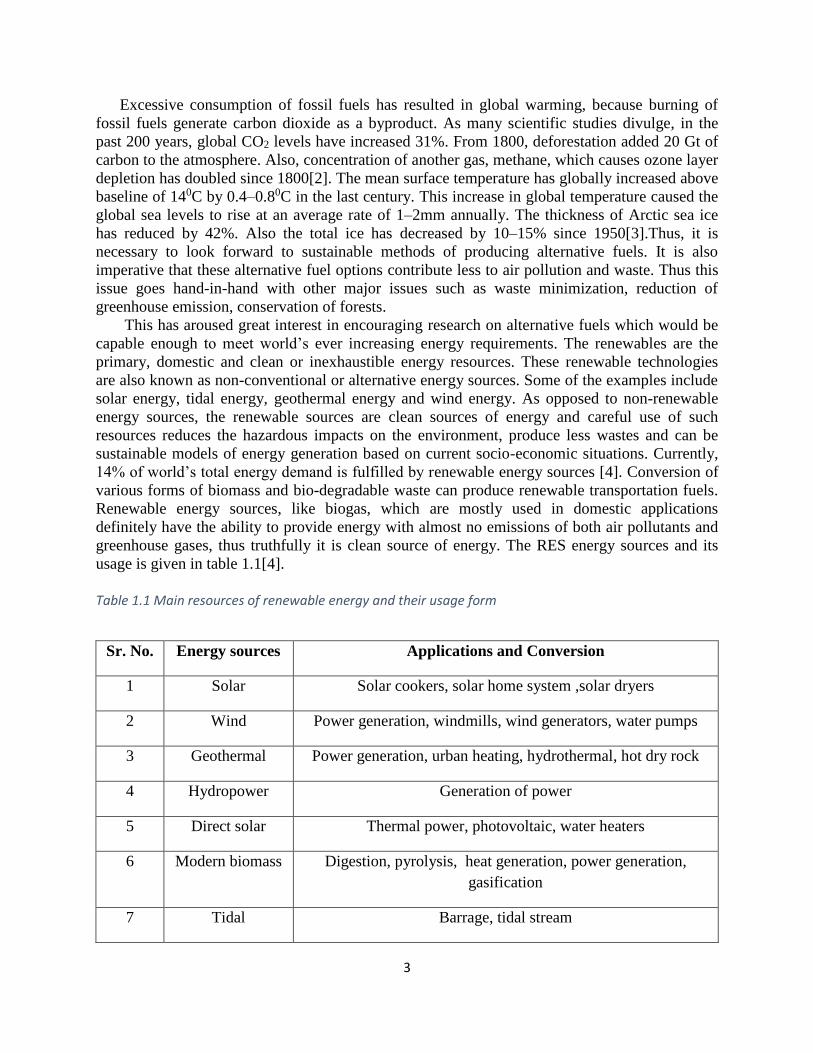
usage is given in table 1.1[4].
Table 1.1 Main resources of renewable energy and their usage form
Sr. No. Energy sources Applications and Conversion
1 Solar Solar cookers, solar home system ,solar dryers
2 Wind Power generation, windmills, wind generators, water pumps
3 Geothermal Power generation, urban heating, hydrothermal, hot dry rock
4 Hydropower Generation of power
5 Direct solar Thermal power, photovoltaic, water heaters
6 Modern biomass Digestion, pyrolysis, heat generation, power generation,
gasification
7 Tidal Barrage, tidal stream
4
Generation of renewable energy will help to deal with the currently most serious tasks like
reliability in improving of fuel economy and supply of energy; solving problems related to local
water and energy supply; improving the living standard and employment level of the local
people; guaranteeing sustainable development of the distant regions of population; employment
of the responsibilities of the countries related to satisfying the agreements regarding
environmental protection and international laws. Development and implementations of different
projects related to renewable energy in rural areas that can create job opportunities, which in turn
can minimize migration towards urban areas. Decentralization of the renewable energy can be
one of the choices to meet the small-scale and rural energy needs in an affordable,
environmentally sustainable and reliable way. The contribution of renewable energy sources is
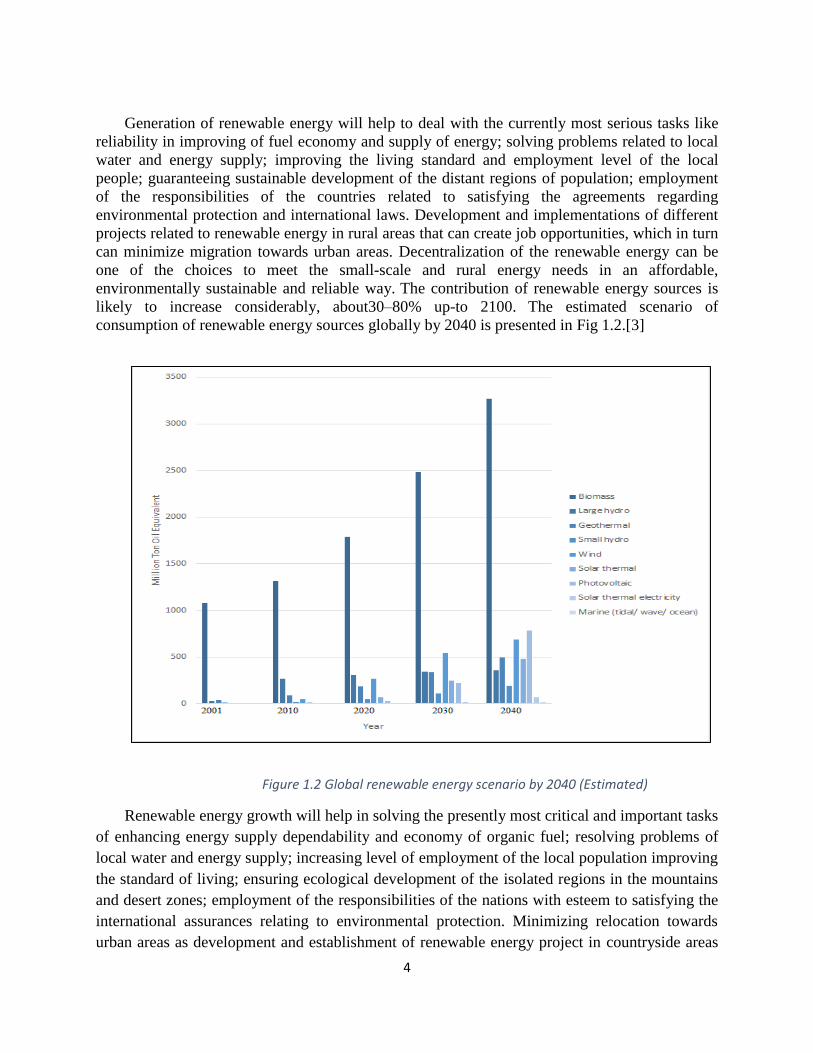
likely to increase considerably, about30–80% up-to 2100. The estimated scenario of
consumption of renewable energy sources globally by 2040 is presented in Fig 1.2.[3]
Figure 1.2 Global renewable energy scenario by 2040 (Estimated)
Renewable energy growth will help in solving the presently most critical and important tasks
of enhancing energy supply dependability and economy of organic fuel; resolving problems of
local water and energy supply; increasing level of employment of the local population improving
the standard of living; ensuring ecological development of the isolated regions in the mountains
and desert zones; employment of the responsibilities of the nations with esteem to satisfying the
international assurances relating to environmental protection. Minimizing relocation towards
urban areas as development and establishment of renewable energy project in countryside areas
5
can create job openings. Congregation of the renewable energy in distributed manner is one of
the options to cope up the rural and small scale energy needs in affordable, reliable and
environmentally bearable way.
1.1 BIOMASS Biomass energy is the form of energy that is confined inside animals and plants. This can
consist of organic matter of all kinds: animals, plants, or waste products from different organic
sources. These natures of energy sources are recognized as bio fuels and typically include wood
chips, sewage, manure, mulch, rotted trees & its components. In the process of photosynthesis,
chlorophyll pigments present in leaves of plants absorbs carbon dioxide (CO2) from the
atmosphere and water from the Earth. This similar energy is then passed to animals when they
consume them. When they are burned, it is considered to be as a renewable source of energy as
water and carbon dioxide confined inside animals and plants are unconfined back in to the
atmosphere. Also, biomass energy can be created by growing more plants and crops. Biomass is
a renewable as well as CO2 neutral resource, thus regarded as key choice to substitute fossil
fuels. This fact has inspired great interest in biomass.
Biomass is organic material resulting from living, or recently living organisms. Most often it
refers to plants or plant-based materials which are precisely called ligno-cellulosic biomass. The
chemical composition of biomass is given ahead. Biomass is carbon based and is comprised of a
mixture of organic molecules containing hydrogen, oxygen, nitrogen and also small quantities of
other atoms, including heavy metals, alkaline earth and alkali metals. Chlorophylls are
porphyrins and contain magnesium. The above metals are found in functional molecules like
chlorophylls or porphyrins. As an energy source, biomass can either be used straight via
combustion to produce heat, or indirectly by converting it to various forms of bio fuel[3].
Types of Biomass are as follows:-
1. Virgin wood: - wood processing, forestry etc.
2. Energy crops:- grass that is use specially for energy application
3. Food Waste:- by preparation, consumption and usage of food
4. Industrial waste and co-products:- industrial manufacturing waste
5. Agricultural residue:- agricultural activity’s residue
Chemical constituents of Bio-mass
Ligno-cellulosic biomass contains cellulose, hemi-cellulose, and lignin, along with minor
amounts of lipids (fats, waxes, and oils), proteins and minerals. Approximately two thirds of the
dry mass of cellulosic materials exist in the form of hemicellulose and cellulose with lignin
making up the bulk of the remaining dry mass.
1. Lignin: -
Lignin is a cross-linked racemic macromolecule. It has molecular mass in excess of 10,000
Daltons. It is aromatic and comparatively hydrophobic in nature. The degree of polymerization is
6
challenging to measure. Polymers get breakdown during extraction. These polymer molecule
contains of various types of sub-arrangements that appear to reprise in an arbitrary manner.
There are three mono-lignol monomers which are methoxylated to various degrees: sinapyl
alcohol, coniferyl alcohol and p coumaryl alcohol. These lignols are integrated into lignin in the
form of the phenylpropanoids guaiacyl (G), syringal (S) and p-hydroxyphenyl (H) respectively.
Lignin are most difficult to pyrolysed [5][6].
2. Cellulose:-
Cellulose is a crucial organic constituent of the biomass cell wall. It is signified by generic
formula (C6H10O5)n. Cellulose is a strong structure of crystal that is unaffected by hydrolysis. It
has long chain of polymer with a high degree of polymerization (∼10,000). Also its molecular
weight is large (∼500,000). Cellulose is principally made up of d-glucose, which is composed
of six carbons (fig. 2.1). Cellulose is extremely insoluble. Although it is carbohydrate is not
consumable by human being. It is a principal component of wood, making up about 42 to 45%
by dry weight. It’s amount differs from 92% (by weight) in cotton to 34% for most other
plants[7]
3. Hemicellulose:-
Hemicelluloses are cell wall components. They are denoted by the generic formula (C5H8O4)n.
It is a group of carbohydrates with a branched chain structure having lower degree of
polymerization (∼100–200). It constitutes nearly 24 to 36% of the dry weight basis for most
wood. The structure and composition of hemicelluloses differs for different types of biomass.
Most of the hemicelluloses contain some simple sugar residues like D-glucose,D-xylose (the
most common), D-galactose, D-mannose, D-glucurnoic acid and D-ababinose. These normally
contain 55 to 210 entities in branched structures. It is soluble in weak alkaline solutions and is
easily hydrolyzed by base or dilute acid. The presence of hemicelluloses produces more gases
and less tar than cellulose during decomposition[7].
Advantages of Biomass Energy
1. No Emissions of Harmful Gases: Biomass energy, generates almost no harmful carbon
dioxide emissions. Presently, many energy sources which are in use, fight to regulate
carbon dioxide emissions. Due to their CO2 emission, result is damage of the ozone layer
which ultimately results in increase in the effects of greenhouse gases, tending to
potentially warming our planet. As biomass is completely natural, has no such carbon
dioxide side effects in its use.
2. Clean Energy: This is good for both business as well as environment. It surely releases
CO2 carbon dioxide but again captures carbon dioxide from atmosphere for its own
growth. Fossil fuels release carbon dioxide but do not recapture it again thus they are
harmful to the environment. It contains very low sulphur which reduces the cause of
creation of acid rain.
7
3. Renewable and Abundant: Biomass products are renewable and abundant. Biomass come
from living sources. Life is phenomenon which is cyclical, thus these biomass products
potentially never run out unless there is something which living on earth.
4. Reduce Dependency on Fossil Fuels: Because of this fuel source alternative has created
for fuel at domestic level. Homeowners are more independent for fuels.
5. Decrease Landfills: In addition to this, advantage of bio-energy is it takes waste which is
unsafe to the environment and converts it into useful fuels. For instance, garbage landfill
can be burned to produce useable biomass energy.
6. Creating Different Product: Biomass energy is also flexible. Here, diverse forms of
organic matter are used to produce different bio-products. Ethanol and similar fuels are
produced from corn and other crops.
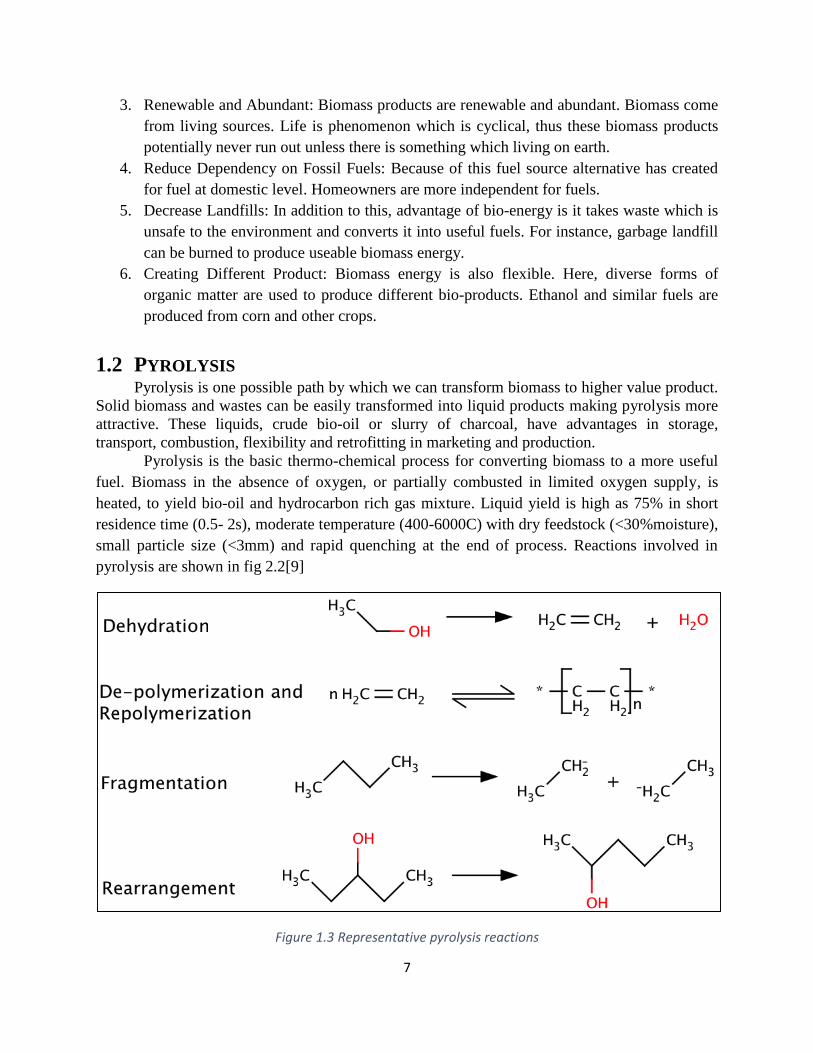
1.2 PYROLYSIS Pyrolysis is one possible path by which we can transform biomass to higher value product.
Solid biomass and wastes can be easily transformed into liquid products making pyrolysis more
attractive. These liquids, crude bio-oil or slurry of charcoal, have advantages in storage,
transport, combustion, flexibility and retrofitting in marketing and production.
Pyrolysis is the basic thermo-chemical process for converting biomass to a more useful
fuel. Biomass in the absence of oxygen, or partially combusted in limited oxygen supply, is
heated, to yield bio-oil and hydrocarbon rich gas mixture. Liquid yield is high as 75% in short
residence time (0.5- 2s), moderate temperature (400-6000C) with dry feedstock (<30%moisture),
small particle size (<3mm) and rapid quenching at the end of process. Reactions involved in
pyrolysis are shown in fig 2.2[9]
Figure 1.3 Representative pyrolysis reactions

8
1.3 BIO-OIL It is viscous dark brown fluid with about 5-20% water. It is complex mixture containing
oxygen, hydrogen and carbon. Bio-oil comprises of alcohols, acids, esters, aldehydes, ketones,
phenols, sugars, lignin, furans, extractible terpene and derived phenols having multifunctional
group. Bio-oil is not a product of thermodynamic equilibrium during pyrolysis, but is produced
with short reactor times and rapid cooling or quenching from pyrolysis temperatures. This
produces condensate that is also not at thermodynamic equilibrium at storage temperatures. The
compound present in bio-oil are as follows.[9]
Figure 1.4 Representative compounds of bio-oil
9
2 LITERATURE REVIEW
2.1 CONVERSION TECHNIQUES Key differences among generations of biofuels is in both raw material and conversion
technology.
First-generation biofuels are prepared by using conventional chemical technology in
which conversion of mainly grains and oil seeds into bio-alcohols and biodiesel
respectively takes place.
Second- generation biofuels are produced from food crops (i.e. Miscanthus) and biomass
residues (from crops and forests). Thus, these type of biomass provides alternative which
is socially accepted. However, conversion technologies to produce Fischer-Tropsch (FT)
diesel, bio-di-methyl ether (Bio-DME) and bio-hydrogen etc. are still under development.
There is also a third-generation evolving, comprising of biofuels from algae. Also, an
emerging fourth-generation which is based on the conversion of biodiesel into gasoline or
on the recycling of carbon dioxide back into gasoline.
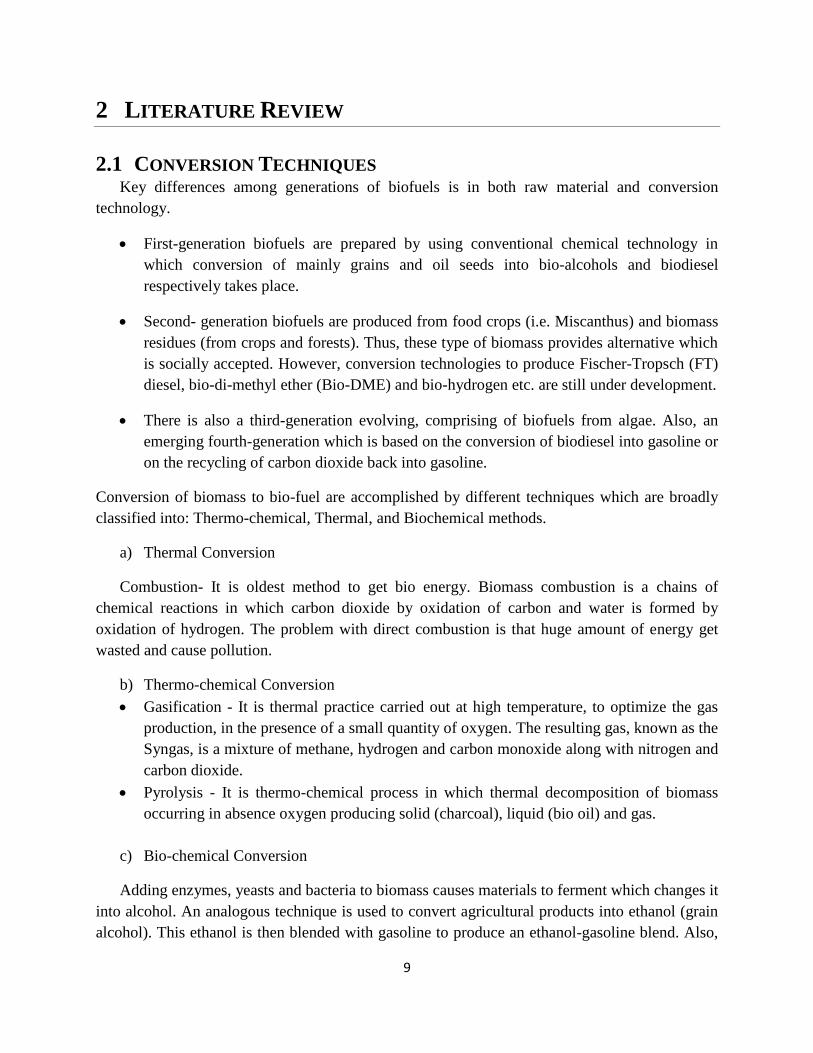
Conversion of biomass to bio-fuel are accomplished by different techniques which are broadly
classified into: Thermo-chemical, Thermal, and Biochemical methods.
a) Thermal Conversion
Combustion- It is oldest method to get bio energy. Biomass combustion is a chains of
chemical reactions in which carbon dioxide by oxidation of carbon and water is formed by
oxidation of hydrogen. The problem with direct combustion is that huge amount of energy get
wasted and cause pollution.
b) Thermo-chemical Conversion
Gasification - It is thermal practice carried out at high temperature, to optimize the gas
production, in the presence of a small quantity of oxygen. The resulting gas, known as the
Syngas, is a mixture of methane, hydrogen and carbon monoxide along with nitrogen and
carbon dioxide.
Pyrolysis - It is thermo-chemical process in which thermal decomposition of biomass
occurring in absence oxygen producing solid (charcoal), liquid (bio oil) and gas.
c) Bio-chemical Conversion
Adding enzymes, yeasts and bacteria to biomass causes materials to ferment which changes it
into alcohol. An analogous technique is used to convert agricultural products into ethanol (grain
alcohol). This ethanol is then blended with gasoline to produce an ethanol-gasoline blend. Also,
10
adding bacteria to break down biomass, methane is formed. Also, biomass can be taken from
landfills and sewage treatment plants to yield fuel for power and heat.
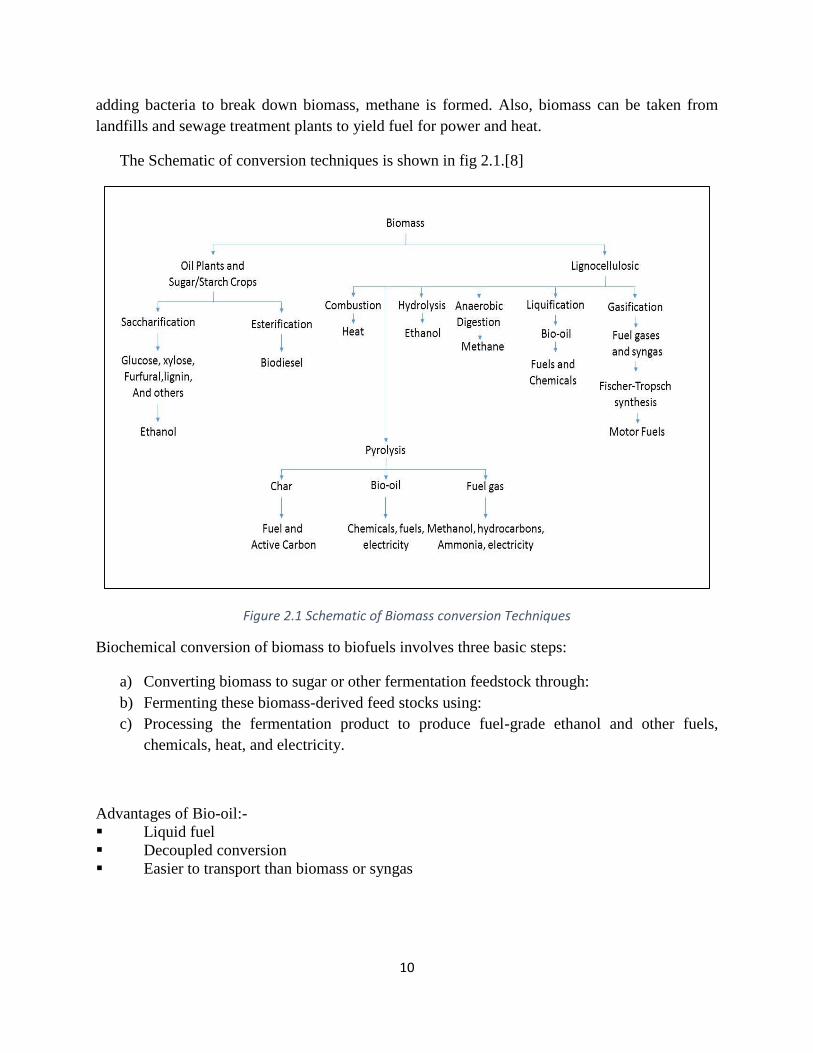
The Schematic of conversion techniques is shown in fig 2.1.[8]
Figure 2.1 Schematic of Biomass conversion Techniques
Biochemical conversion of biomass to biofuels involves three basic steps:
a) Converting biomass to sugar or other fermentation feedstock through:
b) Fermenting these biomass-derived feed stocks using:
c) Processing the fermentation product to produce fuel-grade ethanol and other fuels,
chemicals, heat, and electricity.
Advantages of Bio-oil:-
Liquid fuel
Decoupled conversion
Easier to transport than biomass or syngas
11
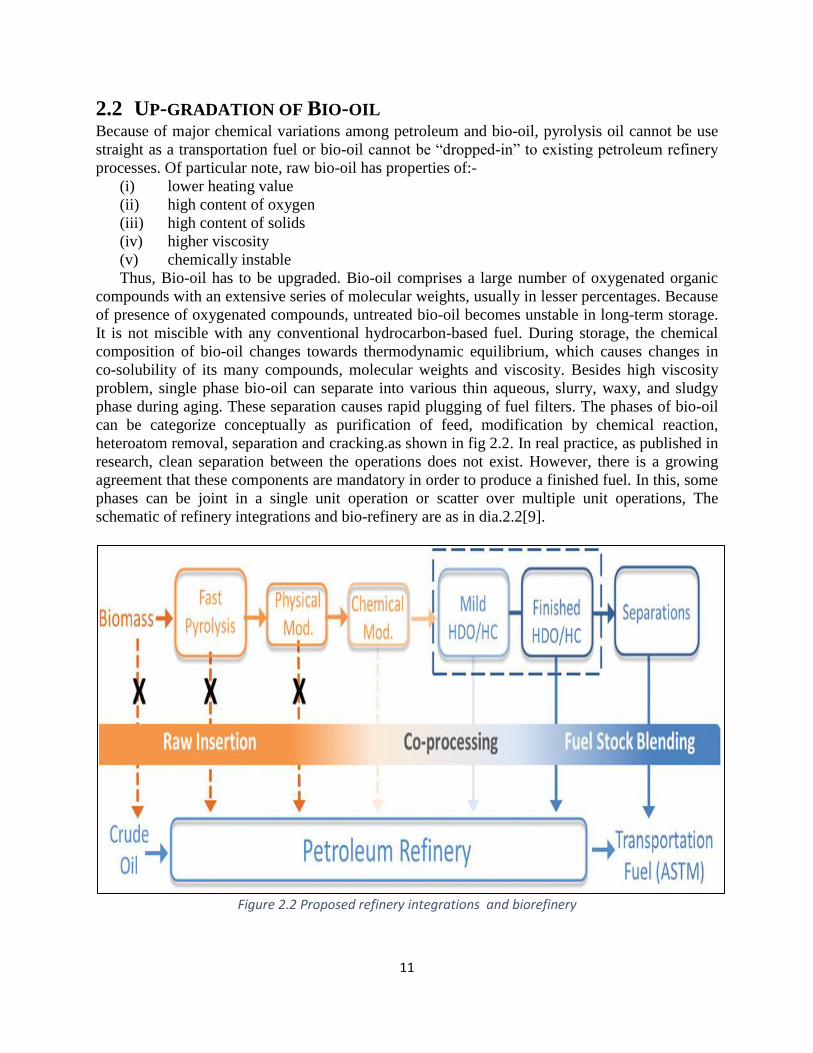
2.2 UP-GRADATION OF BIO-OIL Because of major chemical variations among petroleum and bio-oil, pyrolysis oil cannot be use
straight as a transportation fuel or bio-oil cannot be “dropped-in” to existing petroleum refinery
processes. Of particular note, raw bio-oil has properties of:-
(i) lower heating value
(ii) high content of oxygen
(iii) high content of solids
(iv) higher viscosity
(v) chemically instable
Thus, Bio-oil has to be upgraded. Bio-oil comprises a large number of oxygenated organic
compounds with an extensive series of molecular weights, usually in lesser percentages. Because
of presence of oxygenated compounds, untreated bio-oil becomes unstable in long-term storage.
It is not miscible with any conventional hydrocarbon-based fuel. During storage, the chemical
composition of bio-oil changes towards thermodynamic equilibrium, which causes changes in
co-solubility of its many compounds, molecular weights and viscosity. Besides high viscosity
problem, single phase bio-oil can separate into various thin aqueous, slurry, waxy, and sludgy
phase during aging. These separation causes rapid plugging of fuel filters. The phases of bio-oil
can be categorize conceptually as purification of feed, modification by chemical reaction,
heteroatom removal, separation and cracking.as shown in fig 2.2. In real practice, as published in
research, clean separation between the operations does not exist. However, there is a growing
agreement that these components are mandatory in order to produce a finished fuel. In this, some
phases can be joint in a single unit operation or scatter over multiple unit operations, The
schematic of refinery integrations and bio-refinery are as in dia.2.2[9].
Figure 2.2 Proposed refinery integrations and biorefinery
12
Profitably, the deduction of chemically-bound oxygen to produce a bio-oil more similar
hydrocarbon liquid
(i) Increase in heating value
(ii) Compatibility with petroleum hydrocarbons
(iii) Increase in stability
(iv) Decrease in viscosity
Particularly for the comparatively strong aryl–oxygen bonds, effective deoxygenation has proven
to be exclusively challenging, (Table 2.1)[3]. Thus, deoxygenation is a critical difficulty to
preventing transportation fuel manufacturing from pyrolytic oil at the industrial scale. Therefore,
there is a ongoing need for new chemistries and catalytic processes.
Table 2.1Bond dissociation energies (BDE) for oxygenates common to bio-oil, where R= alkyl & Ar= aryl
Bond Type BDE (Kj mol-1)
R-OR 339
Ar-OR 422
R-OH 385
Ar-OH 468
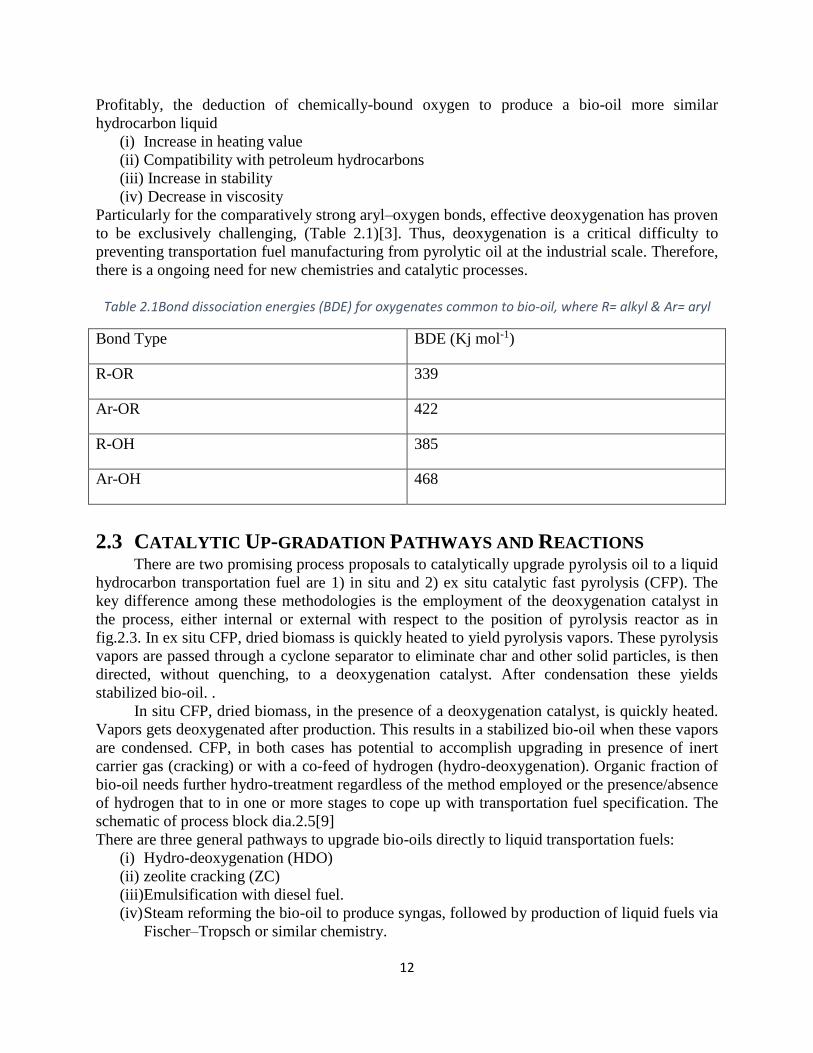
2.3 CATALYTIC UP-GRADATION PATHWAYS AND REACTIONS There are two promising process proposals to catalytically upgrade pyrolysis oil to a liquid
hydrocarbon transportation fuel are 1) in situ and 2) ex situ catalytic fast pyrolysis (CFP). The
key difference among these methodologies is the employment of the deoxygenation catalyst in
the process, either internal or external with respect to the position of pyrolysis reactor as in
fig.2.3. In ex situ CFP, dried biomass is quickly heated to yield pyrolysis vapors. These pyrolysis
vapors are passed through a cyclone separator to eliminate char and other solid particles, is then
directed, without quenching, to a deoxygenation catalyst. After condensation these yields
stabilized bio-oil. .
In situ CFP, dried biomass, in the presence of a deoxygenation catalyst, is quickly heated.
Vapors gets deoxygenated after production. This results in a stabilized bio-oil when these vapors
are condensed. CFP, in both cases has potential to accomplish upgrading in presence of inert
carrier gas (cracking) or with a co-feed of hydrogen (hydro-deoxygenation). Organic fraction of
bio-oil needs further hydro-treatment regardless of the method employed or the presence/absence
of hydrogen that to in one or more stages to cope up with transportation fuel specification. The
schematic of process block dia.2.5[9]
There are three general pathways to upgrade bio-oils directly to liquid transportation fuels:
(i) Hydro-deoxygenation (HDO)
(ii) zeolite cracking (ZC)
(iii)Emulsification with diesel fuel.
(iv) Steam reforming the bio-oil to produce syngas, followed by production of liquid fuels via
Fischer–Tropsch or similar chemistry.
13
Figure 2.3 Block diagram for A) ex situ CEP process and B) in situ CEP process
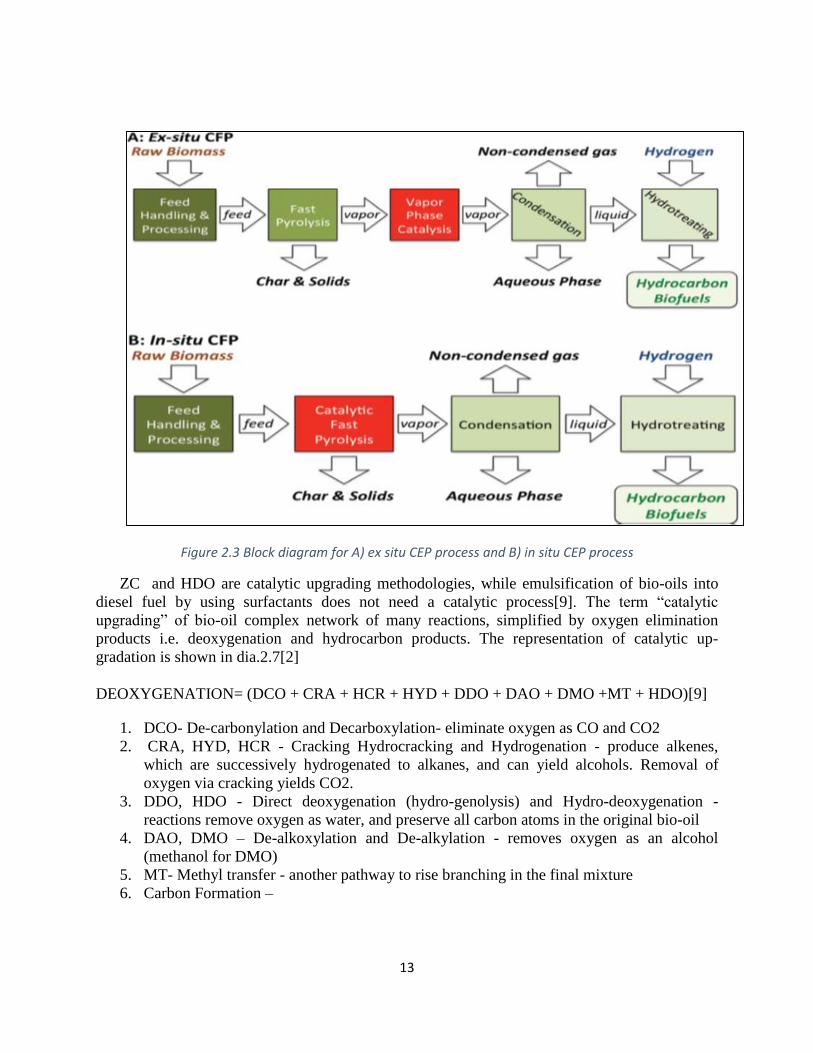
ZC and HDO are catalytic upgrading methodologies, while emulsification of bio-oils into
diesel fuel by using surfactants does not need a catalytic process[9]. The term “catalytic
upgrading” of bio-oil complex network of many reactions, simplified by oxygen elimination
products i.e. deoxygenation and hydrocarbon products. The representation of catalytic up-
gradation is shown in dia.2.7[2]
DEOXYGENATION= (DCO + CRA + HCR + HYD + DDO + DAO + DMO +MT + HDO)[9]
1. DCO- De-carbonylation and Decarboxylation- eliminate oxygen as CO and CO2
2. CRA, HYD, HCR - Cracking Hydrocracking and Hydrogenation - produce alkenes,
which are successively hydrogenated to alkanes, and can yield alcohols. Removal of
oxygen via cracking yields CO2.
3. DDO, HDO - Direct deoxygenation (hydro-genolysis) and Hydro-deoxygenation -
reactions remove oxygen as water, and preserve all carbon atoms in the original bio-oil
4. DAO, DMO – De-alkoxylation and De-alkylation - removes oxygen as an alcohol
(methanol for DMO)
5. MT- Methyl transfer - another pathway to rise branching in the final mixture
6. Carbon Formation –

14
Figure 2.4 :-Representative catalytic upgrading reactions.
The refining process of lingo-cellulosic feed stocks to hydrocarbon biofuels is subdivided into
two general types. First, whole biomass is decomposed and upgradeable to liquid or gaseous
product which is carried out through thermochemical pathways. This produces synthesis gas (by
gasification) or or by hydrolysis paths to produce sugar or bio-oils (by pyrolysis or liquefaction),
monomers which are then deoxygenated to form upgradeable intermediates.[7]
Theodore Dickerson el at have discussed about developing catalyst multifunctional catalysts
used in situ which are useful in both hydro-deoxygenation and zeolite cracking. Study of
different catalyst in comparison is given, which includes CoMoS2/Al2O3, NiMoS2/Al2O3, Pd/C,
ZSM5, Al/MCM41.[8]
D. A. Ruddy et al have discussed advances in heterogeneous catalysis by structure-function
relationship that defines catalyst performance (i.e. activity, selectivity, life time). Applications of
transition metals sulfide catalysts for deoxygenation processes were compared with processes of
noble metals, metal carbide, niride and phosphide catalysts.[9]
A. V. Bridgwater has briefly discussed conversion of biomass and up-gradation. He has briefly
discussed the technologies related to use of catalysts in chemical production and use of catalytic
processes in up-grading primary pyrolysis product to higher quality and higher value fuels and
chemical.[10]
15
Dinesh Mohan et al hve reviewed the literature on woody biomass pyrolysis both fast and slow
with respect to physical and chemical aspects. The effects of wood composition, structure
heating rate and residence time and yield of volatiles[11]
A.V. Bridgwater, in his paper, has discussed the potential of of biomass and solid waste to
convert in the usable energy. He has discussed the techniques of converting biomass to liquid or
gaseous fuel. All these thermochemical processes are influenced by many factor such: catalyst,
feed pretreatment, contact time, heating rate, feed material, moisture content of feed, particle size
of feed, pressure, reactor geometry, temperature and residence time. [12].
J. Wildschut et al. have done experimental study on hydro-treatment of fast pyrolysis oil at 3500
C and 200bar in a batch reactor. It has shown that, performance of Ru/C is a function of number
of recycles. The oil yield (55-30%) and H/C ratio (1.24 to 1.08) has been noticed. The catalyst
has shown lowest decrease in BET area and dispersion after reaction.[13]
Changjun Liu et al estimated catalytic fast pyrolysis is most efficient method for to pyrolyse
lingo-cellulosic biomass which is high in oxygen content. Reactions such as de-carbonylation,
de-carboxylation, de-hydrogenation and ketonization can be employed to remove oxygen and to
produce hydrocarbons with desired carbon backbone. Oxygen removed in the form of CO2 is
most desirable which preserves most of hydrogen in bio-oil.[14]
Douglas C. Elliottet et al have described range of experiments done for range of catalysts and
range of operating parameters like temperature, pressure and flow rate with bio-oil derived from
different bio-mass. Palledium on carbon catalyst was used in bench scale, fixed bed reactor to
hydrogenate bio-oil and produce partially upgraded bio-oil prepared for processing at more
severe hydrocracking processes.[15]
Ofei D. Mante et al have focused on developing understanding of impact of biomass feedstock
and catalytic pyrolysis on physiochemical properties of upgraded bio-oil. Different biomass
feedstock like woody pine, hybrid poplar, pinyon juniper etc. have been treated with are treated
with HZSM5.[16]
Richard French et al in their work evaluated a set of profitable and laboratory-synthesized
catalysts for their hydrocarbon production performance via the pyrolysis/catalytic cracking
means. Three types of biomass feedstocks; cellulose, wood and lignin were pyrolyzed (batch
experiments) in quartz boats in physical contact with the catalyst at temperature ranging from
400°C to 600°C and catalyst-to-biomass ratios of 5– 10 by weight.The highest yield of
hydrocarbons (approximately 16 wt.%, including 3.5 wt.% of toluene) was achieved using
nickel, cobalt, iron, and gallium-substituted ZSM-5. De-oxygenation activity decreases as time
passes because of coke deposition.[17]
Biomass of pine wood was catalytically pyrolysed in A Aho et al in fluidized bed reactor at
4500C with different structures of acidic zeolites like beta Y, ZSM5 mordenite. It was found that
16
ketones and phenols were dominating compounds and smaller quantity of polymerized
hydrocarbons.[18]
Paul T Williams et al have pyrolyzed rice husk in fluidized bed reactor at 400 to 6000C with
500C interval wit zeolite catalyst. The pyrolysed oil were collected in series of condensers and
cold trap and determined the yield as well as composition in relation to process conditions. It was
observed that Polycyclic aromatic hydrocarbons (PAH) were present in low concentration and
increases with increase in temperature.[19]
Qi Dang et al have employed different reaction conditions like initial hydrogen pressure (0.5
MPa- 2.0MPa), mass ratio of ethanol to bio-oil (5:1,3:1, 2:1, 1:1), reaction temperatures (2600C,
2800C, 3000C) and catalysts 5%Pt/SO42-/ZrO2/SBA-15. The hydrogen pressure inhibit coke
formation and increase mass ratio of ethanol to bio-oil (5:1, 3:1).[20]
Jelle Wildschut et al have estimated study of series of experiments using heterogeneous nobel
metals as catalysts (Ru/C, Ru/TiO2, Ru/Al2O3, Pt/C and Pd/C) and results were compared with
typical hydro-treatment catalyst (sulfide NiMo/Al2O3, CoMo/Al2O3). The reactions were carried
out at temperatures of 2500C and 3500C with pressure of 100 and 200bar. The Ru/C were found
to be superior to classical hydro-treatment catalyst in the perspective of bio-oil yield and de-
oxygenation level.[21]
Peng Lim Boey et al have discussed various issues related to CaO catalyzed transesterification.
The diverse performance of CaO in neat, loaded and mixed forms, as well as support for other
catalyst, CaO tolerance are suitably addressed.[22]
The experimental set up consists of Inconel tubular continuous down flow micro reactor with
temperature range of 6500C to 8000C. The product gases essentially consist of H2, CO, C2H4,
C2H6, CH4 and C4+ compounds. The process used can be employed for producing hydrocarbon
and synthesis gas for applications.[23]
Kaiqi Shi et al discussed five types of catalysts such as metal oxide, molecular sieve, mineral,
transitional metals. Molecular sieves such as HZSM-5, ZSM-5, MCM-41, SBA-15 and their
modified forms are mostly used as catalysts. Type of catalyst produces markedly influence on
bio-oil product, variety of catalyst and properties makes generalization difficult.[24]
R.H. Venderbosch et al have employed thermal treatment step/ direct hydro-processing at
temperature 2500C in the presence of H2 and catalyst. The parallel reactions take place including
re-polymerization, decarboxylation and hydro-treating.[25]
Mark Wright et al have developed techno-economical model for biomass pyrolysis and bio-oil
up-gradation. It was done on the basis of 2000 MT/day up-gradation of bio-oil. The results
showed that pyrolysis derived bio-oil is competitive with other alternative fuel. But technology is
relatively immature resulting in higher level of uncertainty.[26]
17
Xuejun et al have done transesterification soybean oil using CaO. The experimental results
showed that a 12:1 molar ratio of methanol to oil, addition of 8% CaO catalyst, 650C reaction
temperature and 2.03% water content in methanol gave the best results, and the biodiesel yield
exceeded 95% at 3 h. CaO maintained sustained activity even after being repeatedly used for 20
cycles and the biodiesel yield at 1.5 h was not affected much in the repeated experiments.[27]
Solid acid 40SiO2/TiO2-SO42- and solid base 30K2CO3/Al2O3-NaOH were prepared and
compared with catalytic esterification activity according to the model reaction. Upgrading bio-oil
by solid acid and solid base catalysts in the accustomed experiment was investigated. The ester
reaction was promoted by both solid acid and base catalysts. [28]
Suping Zhang Et al have done experiment of fast pyrolysis of saw dust with fluidized bed unit
5kg/h. The liquid product formed was separated into water phase and oil phase. The oil phase
was upgraded using sulfided Co-Mo-P catalyst in autoclave. [29]
Michael Nolte et al have showed the pyrolysis oils are emulsion-like fluids, containing aqueous
and phenolic phases, and can be more than 400 times more viscous than water at 250C. A strong
dependence of viscosity upon the temperature showed that the viscosity of poplar and oak 5000C
oils increased over 220-fold between 55 and -50C. Generally, the oils that had higher water
contents had lower viscosities.[30]
Wu jun liu have employed method of catalytic pyrolysing with zero valent metals (Al, Fe, Mg
and Zn) at ambient temperature and pressure. In the upgraded bio-oil, the CvO compounds are
reduced from 9.8 to 3.1 mol%, and the pH value was elevated from 3.53 to 4.85, which
significantly increased the chemical stability and decreased the corrosiveness of bio-oil.[31]
The following table gives the brief idea of some of catalyst used in different papers. Some of
them are transition metal catalyst, some are noble with support. The reaction conditions, reactor,
ratio etc. are given in following table2.2
18
Table 2.2 Overall Review of Catalyst used in the Different papers.
Catalyst Reactor Temp. Pressure Oil
Yield
Oxygen Paper Title
Ru/C 5 wt%
Beech wood
oil
Autoclave
100ml
350°C
16°/min.
4h
N2 flush
H2 -20bar
up to
200bar
55-30
wt.%
up to 85wt%
Catalyst studies on
Hydro-treatement of
fast pyrolysis[13]
Pd/C
Popalar
biomass
Fixed Bed
Catalytic
Reactor
0.28LHSV
300°C
8h
H2-140bar 59
wt.%
up to 60wt% Catalytic Hydro-
processing of biomass
fast pyrolysis oil to
produce
Hydrocarbon[15]
Pt/Al2O3 5
wt%
Autoclave
30 ml
350°C
4h
N2-100bar 81% up to 88-
90wt%
Bio-oil up-gradation
over platinum
catalysts using in situ
generated H2[32]
Ru/TiO3 5
wt%
Beech wood
oil
Autoclave
100ml
450°C
16°/min.
4h
N2 flush
H2 -20bar
up to
350bar
67
wt.%
up to 77 wt.%
Hydro-treatment of
Fast pyrolysis oil
using Heterogeneous
Nobel metal
Catalyst[21]
CoMoS2/Al2O3
Autoclave
100ml
450°C
16°/min.
4h
200bar
26
wt.%
up to 81 wt.%
Hydro-treatment of
Fast pyrolysis Oil
using Heterogeneous
Nobel metal
Catalyst[21]
19
3 EXPERIMENTAL SECTION
3.1 METHOD To study the project and fulfill its objective, experiments were carried on biomass viz.
Castor seed which is oil containing seed. The sample seed i.e. Castor seed is pyrolyzed in semi
batch reactor with different catalysts. Degradation temperature was found by doing TGA. Then
liquid product obtained was characterized by different physical and chemical properties.
Elemental composition were obtained from EDX analysis. Fourier Transform Infrared
Spectroscopy (FTIR) was done to know functional groups present while Gas Chromatography
Mass Spectroscopy (GCMS) for chemical analysis. The physical properties like flash point, fire
point, pour point and calorific value were characterized to know its suitability as fuel. The pore
structure, elemental compositions were investigated from SEM/EDX analysis.
3.2 RAW MATERIAL Castor seeds as shown in fig. 3.1 were used as biomass and obtained from local supplier.
Castor seeds obtained are sundried for 2 days, then dried in oven at temperature 1050 C and used
as feed.
Figure 3.1 Castor seeds which are used as biomass
3.3 CATALYST The catalyst used here were CaO, MgO, Fe2O3, ZnO, TiO2 obtained from Merk. The
catalyst used were supplied as a fine powder.
20
3.4 CHARACTERIZATION OF RAW MATERIAL Raw material was characterized by their proximate, ultimate and thermo-gravimetric
properties.
3.4.1 Thermal Properties using TGA
Thermo-gravimetric analysis or thermal gravimetric analysis is a type of testing for
samples which determines changes in weight to a temperature, programmed in a controlled
atmosphere. Thermal gravimetric analysis is a process which involves heating a mixture to a
high enough temperature so that one of the components decomposes into a gas that dissociates
into the air.
The thermos-gravimetric analysis (TGA) of raw material was done using DTG 60 device.
The analyzer consists of a high-precision balance with a pan of platinum loaded with the sample.
Pan resides in a furnace and gets heated or cooled during the experiment. Different process using
a quartz crystal microbalance is devised for measuring smaller samples on the order of a
microgram versus milligram with conventional TGA. Sample was placed in a small electrically
heated oven with a thermocouple for accurate measurement of the temperature. The atmosphere
may be supplied with an inert gas to prevent oxidation or other undesired reactions. A computer
was employed to control the instrument.
Pyrolysis involves heating of a substance in absence of air at a particular high
temperature. Therefore, the temperature for effective pyrolysis of the castor seeds was
determined using TGA. Around 20-30 milligrams of sample was taken and heated up to a final
temperature of 700°C and a residence time of 1 minute at 700°C was allowed. TGA were
performed at a heating rate of 20°C/Min. Thermo-gravimetric weight loss curve was plotted
against temperature. It provides a range of temperature in which maximum thermal degradation
of castor seed takes place. The TGA analysis of sample depends on the amount of cellulose,
hemicellulose and lignin content of sample.
3.4.2 Proximate Analysis
Proximate analysis (defined by ASTM), is the estimation of %moisture, volatile matter,
fixed carbon (by difference) and ash by prescribed methods. This is primarily carried out to
establish the quality of the feed. It gives speedy and valuable information concerning commercial
classification and determination of suitability for industrial use.
Moisture content:-Moisture content is calculated by measuring a known quantity of air
dried biomass ASTM D-871-82. Finely ground castor seed was taken on petri dish and kept
at a temperature of 1030C for one an hour. Before and after heating weight of sample were
measured and noted. The difference in weight divided by initial sample weight gives
moisture content. Maximum the moisture content, maximum is the transportation cost and
lower is the calorific value. Thus, low moisture content in biomass is preferable.
% moisture content = (Loss in weight / weight of sample taken) *100
21
Volatile matter:-When fuel is heated, volatile matter of a fuel are released in form of
condensable and non-condensable vapor. The amount of released vapors i.e. volatile matter
depends on the rate of heating and the temperature to which it is heated. The applicable
ASTM standard for determination of volatile matter is ASTM D-3157-07. 1g powdered
sample after removing moisture was taken in a crucible covered with lid and kept at 9500C
for seven minutes. Difference of Weight of sample before and after heating divided by
initial sample weight gives the %volatile matter. Volatile matter is a complex mixture of
various organic and inorganic gaseous and liquid products result from thermal
decomposition. Determination of % volatile matter provides us with some fuel properties
related to smoke forming tendency, length of flame and ignition.
% volatile matter = (Loss in weight due to removal of matter / weight of sample taken) *
100
Ash content:-The final residue left after the complete combustion of sample is ash. It was
found out by heating 1 gm of sample at 650-7500C for one and half hour without lid. Ash,
the inorganic solid residue left after the fuel is completely burned, has primary ingredients
such as silica, aluminum, iron, and calcium and sometimes small amounts of magnesium,
titanium, sodium, and potassium. Ash content is determined by ASTM test protocol D-
1102.
% ash = (Weight of ash left / weight of sample taken) * 100
Fixed carbon:-Moisture, volatile matter, ash content together subtracted from 100 gives
the fixed carbon content. Fixed carbon represents the solid carbon in the biomass that
remains in the char in the pyrolysis process after de volatilization. It is determined as:
% Fixed Carbon = 100- (% Moisture - % Volatile matter - % Ash content)
3.4.3 Ultimate Analysis
The ultimate analysis i.e. elemental analysis was done in CHNSO Elemental analyzer
(Vario El Cube Germany) to know elemental compositions.
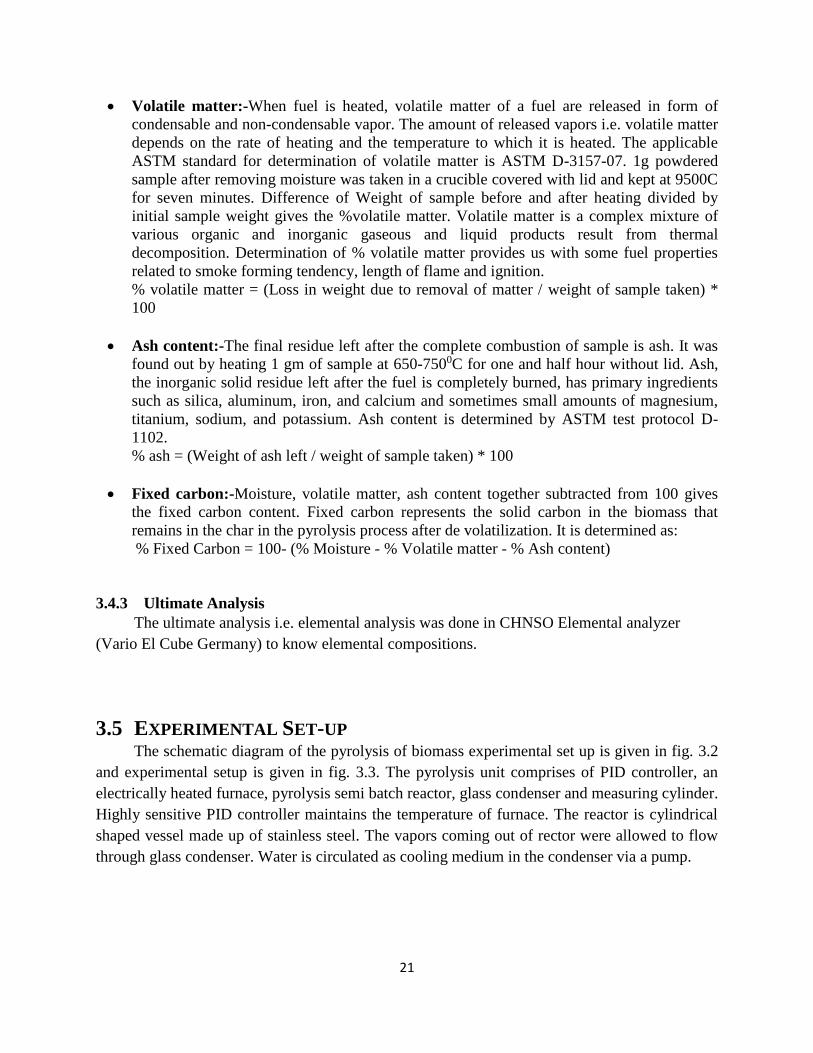
3.5 EXPERIMENTAL SET-UP The schematic diagram of the pyrolysis of biomass experimental set up is given in fig. 3.2
and experimental setup is given in fig. 3.3. The pyrolysis unit comprises of PID controller, an
electrically heated furnace, pyrolysis semi batch reactor, glass condenser and measuring cylinder.
Highly sensitive PID controller maintains the temperature of furnace. The reactor is cylindrical
shaped vessel made up of stainless steel. The vapors coming out of rector were allowed to flow
through glass condenser. Water is circulated as cooling medium in the condenser via a pump.
22
Figure 3.2 Schematic diagram of experimental setup for pyrolysis of biomass
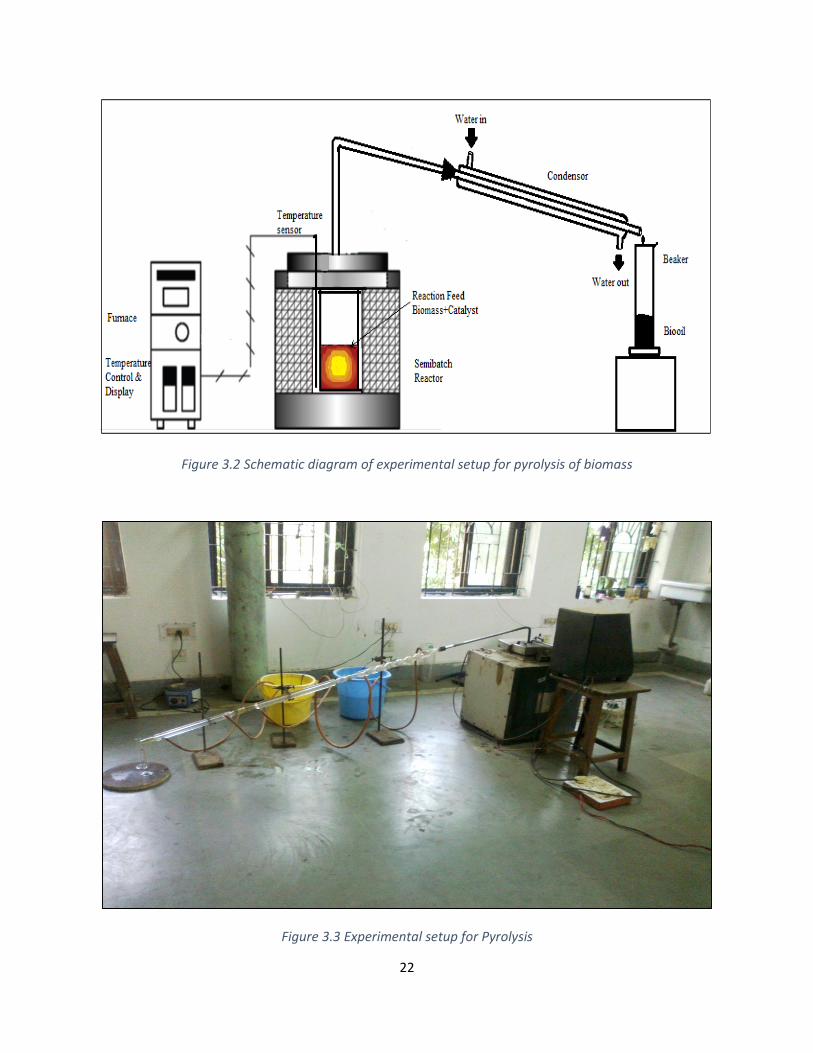
Figure 3.3 Experimental setup for Pyrolysis
23
3.6 EXPERIMENTAL PROCEDURE The seed, raw materials were purchased from market and used, after drying first in sunrays
for 2 days and then in oven at 1050C, as feed to the reactor. Biomass was pyrolyzed at different
temperatures 5000C, 5500C and 6000C at the heating rate of 200C/min. Biomass viz. castor seeds
of 15gm were fed to the semi batch reactor and reactor is then placed vertically in electrically
heated furnace. The temperature of furnace was controlled by PID controller. The vapors
generated in reactor were condensed by water cooled condenser and condensed liquid i.e. bio-oil
was collected in measuring cylinder. As liquid contained two fractions namely; aqueous phase
and oil phase, were separated by gravity separator. The residue i.e. bio-char was collected from
the reactor after cooling. Also series of experiments were conducted to determine the influence
of different catalyst to biomass ratios between 1:14, 1:10, 1:8, 1:6 and 1:2 at 550oC at heating
rate of 200C/min. These series of experiments were conducted with previously mentioned
catalyst. For this series of experiments, pyrolysis of biomass viz. castor seed, 15gm for each run
along with different catalyst with different ratios were done. The liquid i.e. bio-oil was then
collected, weighted and stored in air tight bottles. The sample of residue i.e. bio-char or pyrolytic
char collected after cooling of reactor were collected, weighted and stored in air tight bags.
During sample runs various data like yield of char, reaction time, yield and volume of liquid
product were noted down. Variation in liquid product, yield of char, and gas (volatiles) with
respect to temperature were plotted. Variation in reaction time with respect to temperature was
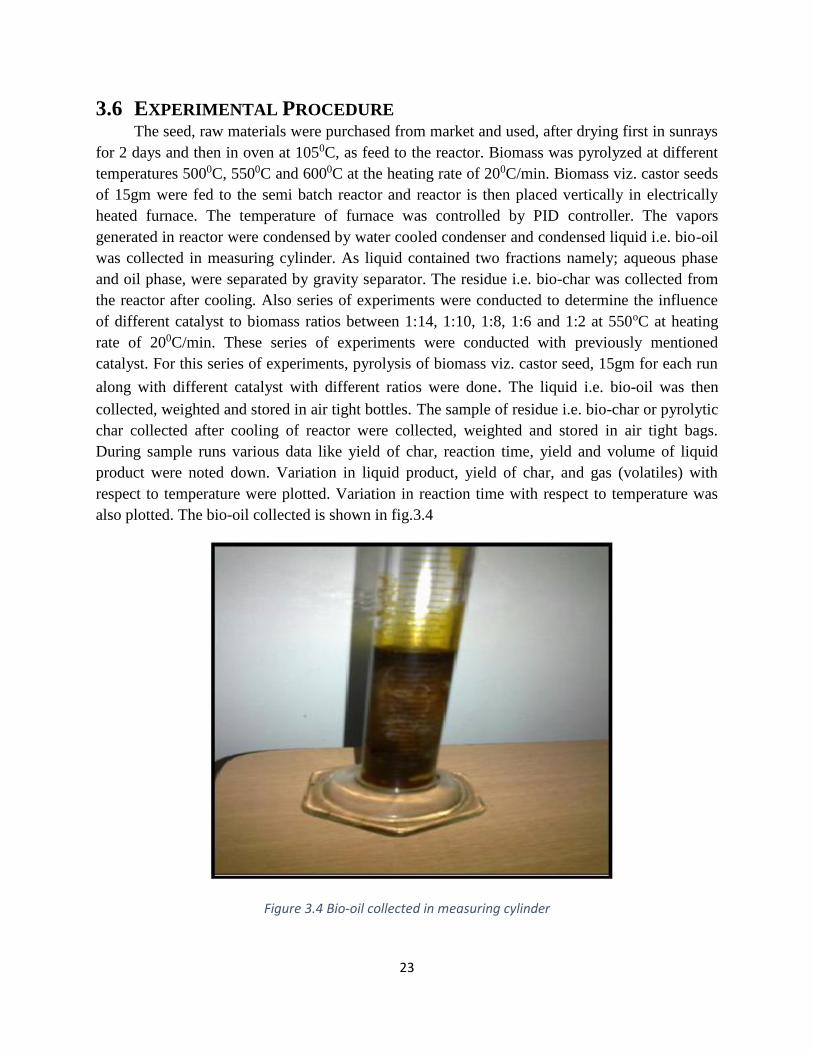
also plotted. The bio-oil collected is shown in fig.3.4
Figure 3.4 Bio-oil collected in measuring cylinder
24
3.7 CHARACTERIZATION OF BIO-OIL
3.7.1 Characterization of Physical Properties
The pyrolytic oils obtained were characterized for their physical and chemical properties.
The physical properties such as color density, viscosity, pH, flash point, fire point, pour point,
calorific value of all pyrolytic oil were determined and stated in the result and discussion part.
The viscosity of bio-oil is measured by using Redwood viscometer while flash point and fire
point using flash point apparatus.
3.7.2 Characterization of Chemical Properties
3.7.2.1 Functional group analysis by FTIR
Fourier Transform Infrared spectroscopy (FTIR) is an essential analysis technique for
identification of various characteristic functional groups present in fuel oil. As interaction of an
infrared light takes place with chemical bond present in oil stretches, contracts, and absorbs
infrared radiation in a specific wave length range in the presence of molecules. The functional
groups existing in the bio/pyrolytic oil were recognized by using this principle. The FTIR spectra
were generally composed in the range of 400-4000 cm-1 region, 8cm-1 resolution. The rotational
and vibrational status of the molecules changes by absorption in infrared region. The absorption
frequency is governed greatly on the vibrational frequency of the molecules. The absorption
intensity depends on the infrared photon energy that can be transferred to the molecule which
ultimately depends on the change in the dipole moment that occurs as a result of molecular
vibration. A molecule will not absorb infrared light unless the absorption causes a change in the
dipole moment. All compounds except for elemental diatomic gases such as N2, H2 and O2 have
infrared spectra. Thus most components present in a flue gas were also analyzed by their
characteristic infrared absorption.
To determine the functional groups present in the pyrolytic oil, Fourier Transform
Infrared spectroscopy of the oil is being analyzed in a Perkin-Elmer infrared spectrometer.
3.7.2.2 Chemical compounds by GC-MS
Gas Chromatography – Mass Spectrometry for the pyrolytic or bio-oil was accomplished
using a GC-MS OP 2010 analyzer [SHIMADZU] to investigate the chemical compounds
existing in the bio-oil i.e. product. Chromatography is specifically designed for components
identification by separating mixtures of chemicals into individual components. After isolation,
evaluation of components is done individually. In nearly all chromatography, after introduction
or injection of sample mixture in mobile phase, separation occurs. In liquid (LC)
chromatography, the mobile phase is solvent whereas in the gas (GC) chromatography, an inert
gas behaves as mobile phase e.g. helium. Mobile phase is the one who carries the sample mixture
across stationary phase. The stationary phase is actually a chemical that can attracts components
present in mixture of a sample. The column tube made up of glass or stainless steel with various
dimensions. The mobile phase comprises mixture of compounds which interacts with the
stationary phase. The rate of interaction for is different for individual compound in a mixture.
The compounds with fastest interaction rate will elute from column first & those with slowest
interaction rate will elute from the column last. With examination of the changing characteristics
25
for the mobile phase as well as the stationary phase, the different mixtures of chemicals are able
to get separated. Additional enhancements to this separation process are also made by altering
the temperature and pressure for the stationary phase and the mobile phase respectively.
GC is equipped with a thin, long column having a thin interior stationary phase solid
coating (5% phenyl-, 95% dimethyl siloxane polymer). The capillary column has 0.25 mm
diameter. This particular column is used for non-polar, semi volatile organic compounds. The
capillary column will be held in an oven which is provided with the system of increasing the
temperature steadily (or in GC terms, ramped). With gradual increase in the temperature, the
compounds with lesser boiling points exit from column faster than those having greater boiling
points. After separation, compounds exit from column and move in a detector. Detector
generates an electronic signal in the presence of a compound. Higher the concentration of
compound in present sample the greater is the signal. Then, the computer processes this signal.
The Retention time (RT) is a time when the sample is injected i.e. time zero to when exit of
sample takes place. Meanwhile the instrument goes on running, the computer produces a graph
by making use of these signals. These peaks of chromatogram are representative of signal
developed at point when compound exits from column of GC into detector. The Retention Time
(RT) is represented by x-axis, and intensity (abundance) of the signal is represented by y-axis.
GC-MS is used for both the qualitative and the quantitative identification and
measurement of semi volatile, volatile organic compounds in complex mixtures. The
pyrolytic oil obtained was characterized by using GC/MS- QP 2010 SHIMADZU. It was
also armed with the flame ionization and the mass spectrometry (GC-FID-MS) detection.
A capillary used here was coated with DB-5 film 0.25 μm thick and has diameter 0.25
mm with length of 30 m. The GS was provided with split injector at 200ºC and with 1:10
as split ratio. The carrier gas used was helium gas with flow rate 1.51 ml/min and having
99.995% purity. The initial temperature in oven was set at 70 ºC for 2 min and increased
up to 300 ºC with rate of 100 ºC/min and maintained for time of 7 min. The NIST library
facilitate the acknowledgement of all compounds. Mass spectrometer was generally
operated for interface temperature about 240ºC & ion source temperature of 200 ºC for
range of 40-1000 m/z.
3.8 BIO-CHAR CHARACTERIZATION
3.8.1 Proximate Analysis
Proximate analysis for bio-char was done according to ASTM D3173-75. In this analysis,
%moisture, volatile matter, ash, fixed carbon was determined.
3.8.2 Ultimate Analysis
Ultimate analysis for bio-char was carried out with the aid of elemental analysis or
CHNSO analyzer. In this analysis elemental percentage was determined.
26
3.8.3 SEM Analysis
Scanning Electron Microscope (SEM) is instrument use to define morphology of material
under view. Energy-dispersive X-ray spectroscopy (EDS or EDX) is the diagnostic technique
which is used for chemical characterization or elemental analysis or of a sample. EDX bank on
the examination of X-ray excitation and interaction of some source with sample. Each
component has a distinctive atomic structure. The representative capabilities are because of this
fundamental principle. This permits distinctive set of peaks for X-ray spectrum which arouses
the emission of typical or characteristic X-rays of specimen. Charged particles such as protons or
electrons a beam of X-rays, with high energy was concentrated into the sample to be examined.
An atom belonging to the sample comprises ground state electrons which were bound to the
nucleus in discrete energy levels. The incident beam excited an electron in from an inner shell
which ejected from shell by generating an electron hole at its site. Then, that hole is filled by an
electron from a higher-energy shell. Difference between the energy of the shell at higher-energy
and that of shell at lower energy was unconfined in X-ray form. The energy and number of the
X-rays discharged from a specimen was measured by using an energy-dispersive spectrometer.
The X-rays energy are representative of the difference in energy among the two shells. The
elemental configuration of the specimen was measured, by atomic structure for elements through
they were allowed. Scanning electron microscopy images were captured by using JEOL
microscope (JSM-6480 LV) and acceleration voltage of 15 kV at altered magnification values to
get the perfect view of pore density and diameter.
27
4 RESULT & DISCUSSION
4.1 RAW MATERIAL CHARACTERIZATION
4.1.1 Proximate and Ultimate Analysis
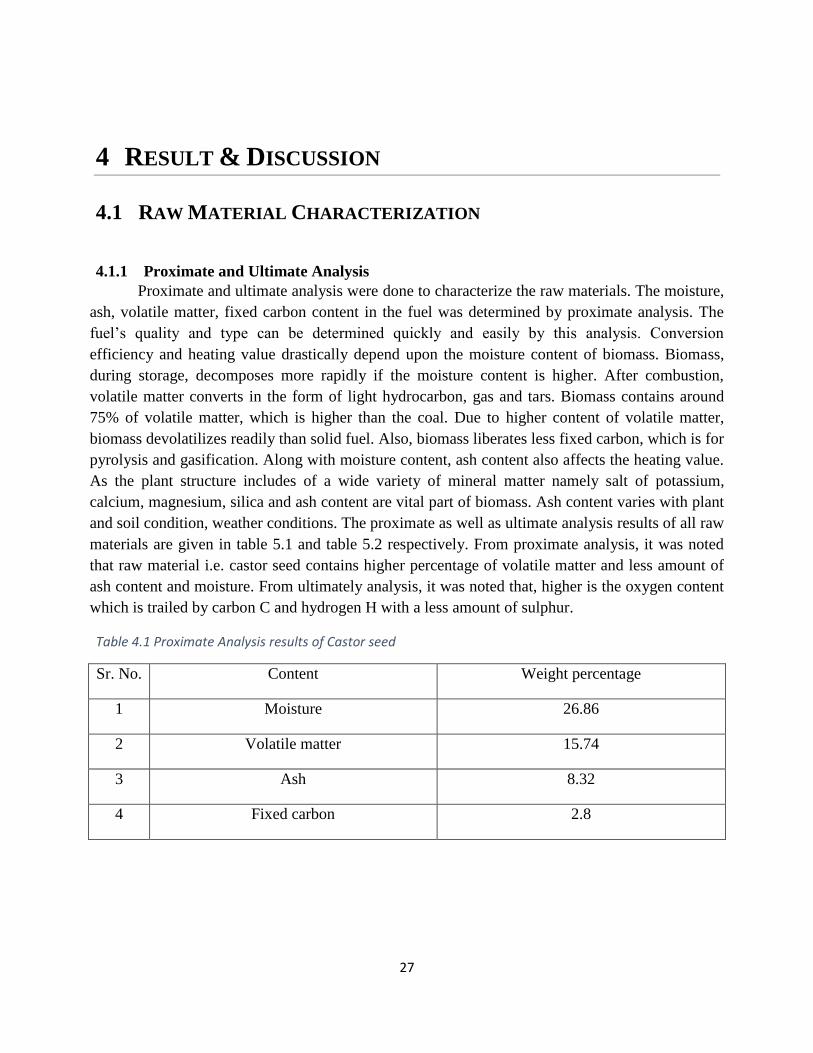
Proximate and ultimate analysis were done to characterize the raw materials. The moisture,
ash, volatile matter, fixed carbon content in the fuel was determined by proximate analysis. The
fuel’s quality and type can be determined quickly and easily by this analysis. Conversion
efficiency and heating value drastically depend upon the moisture content of biomass. Biomass,
during storage, decomposes more rapidly if the moisture content is higher. After combustion,
volatile matter converts in the form of light hydrocarbon, gas and tars. Biomass contains around
75% of volatile matter, which is higher than the coal. Due to higher content of volatile matter,
biomass devolatilizes readily than solid fuel. Also, biomass liberates less fixed carbon, which is for
pyrolysis and gasification. Along with moisture content, ash content also affects the heating value.
As the plant structure includes of a wide variety of mineral matter namely salt of potassium,
calcium, magnesium, silica and ash content are vital part of biomass. Ash content varies with plant
and soil condition, weather conditions. The proximate as well as ultimate analysis results of all raw
materials are given in table 5.1 and table 5.2 respectively. From proximate analysis, it was noted
that raw material i.e. castor seed contains higher percentage of volatile matter and less amount of
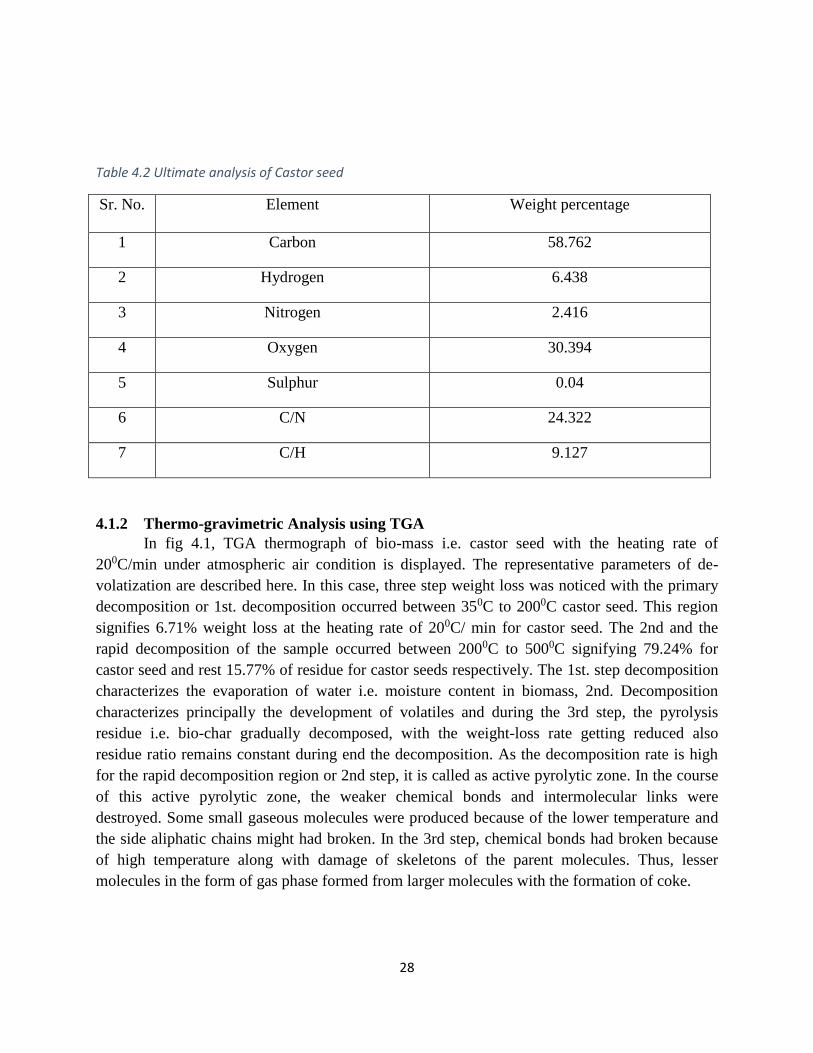
ash content and moisture. From ultimately analysis, it was noted that, higher is the oxygen content
which is trailed by carbon C and hydrogen H with a less amount of sulphur.
Table 4.1 Proximate Analysis results of Castor seed
Sr. No. Content Weight percentage
1 Moisture 26.86
2 Volatile matter 15.74
3 Ash 8.32
4 Fixed carbon 2.8
28
Table 4.2 Ultimate analysis of Castor seed
Sr. No. Element Weight percentage
1 Carbon 58.762
2 Hydrogen 6.438
3 Nitrogen 2.416
4 Oxygen 30.394
5 Sulphur 0.04
6 C/N 24.322
7 C/H 9.127
4.1.2 Thermo-gravimetric Analysis using TGA
In fig 4.1, TGA thermograph of bio-mass i.e. castor seed with the heating rate of
200C/min under atmospheric air condition is displayed. The representative parameters of de-
volatization are described here. In this case, three step weight loss was noticed with the primary
decomposition or 1st. decomposition occurred between 350C to 2000C castor seed. This region
signifies 6.71% weight loss at the heating rate of 200C/ min for castor seed. The 2nd and the
rapid decomposition of the sample occurred between 2000C to 5000C signifying 79.24% for
castor seed and rest 15.77% of residue for castor seeds respectively. The 1st. step decomposition
characterizes the evaporation of water i.e. moisture content in biomass, 2nd. Decomposition
characterizes principally the development of volatiles and during the 3rd step, the pyrolysis
residue i.e. bio-char gradually decomposed, with the weight-loss rate getting reduced also
residue ratio remains constant during end the decomposition. As the decomposition rate is high
for the rapid decomposition region or 2nd step, it is called as active pyrolytic zone. In the course
of this active pyrolytic zone, the weaker chemical bonds and intermolecular links were
destroyed. Some small gaseous molecules were produced because of the lower temperature and
the side aliphatic chains might had broken. In the 3rd step, chemical bonds had broken because
of high temperature along with damage of skeletons of the parent molecules. Thus, lesser
molecules in the form of gas phase formed from larger molecules with the formation of coke.
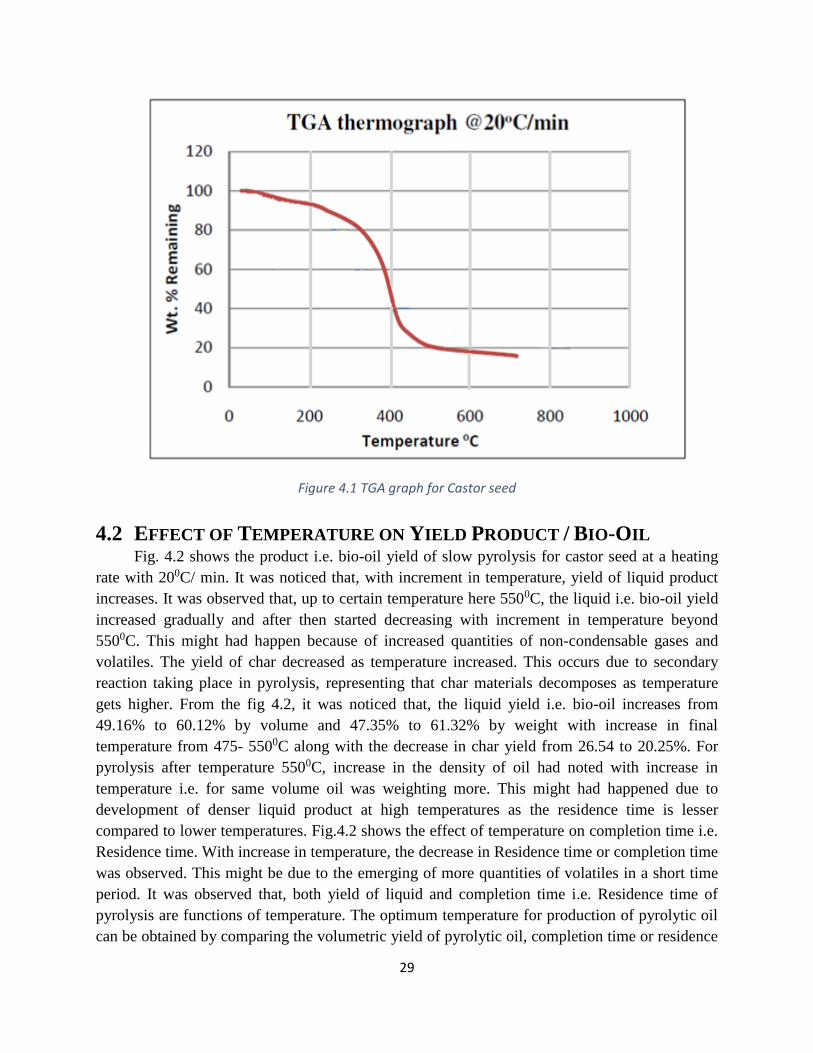
29
Figure 4.1 TGA graph for Castor seed
4.2 EFFECT OF TEMPERATURE ON YIELD PRODUCT / BIO-OIL Fig. 4.2 shows the product i.e. bio-oil yield of slow pyrolysis for castor seed at a heating
rate with 200C/ min. It was noticed that, with increment in temperature, yield of liquid product
increases. It was observed that, up to certain temperature here 5500C, the liquid i.e. bio-oil yield
increased gradually and after then started decreasing with increment in temperature beyond
5500C. This might had happen because of increased quantities of non-condensable gases and
volatiles. The yield of char decreased as temperature increased. This occurs due to secondary
reaction taking place in pyrolysis, representing that char materials decomposes as temperature
gets higher. From the fig 4.2, it was noticed that, the liquid yield i.e. bio-oil increases from
49.16% to 60.12% by volume and 47.35% to 61.32% by weight with increase in final
temperature from 475- 5500C along with the decrease in char yield from 26.54 to 20.25%. For
pyrolysis after temperature 5500C, increase in the density of oil had noted with increase in
temperature i.e. for same volume oil was weighting more. This might had happened due to
development of denser liquid product at high temperatures as the residence time is lesser
compared to lower temperatures. Fig.4.2 shows the effect of temperature on completion time i.e.
Residence time. With increase in temperature, the decrease in Residence time or completion time
was observed. This might be due to the emerging of more quantities of volatiles in a short time
period. It was observed that, both yield of liquid and completion time i.e. Residence time of
pyrolysis are functions of temperature. The optimum temperature for production of pyrolytic oil
can be obtained by comparing the volumetric yield of pyrolytic oil, completion time or residence
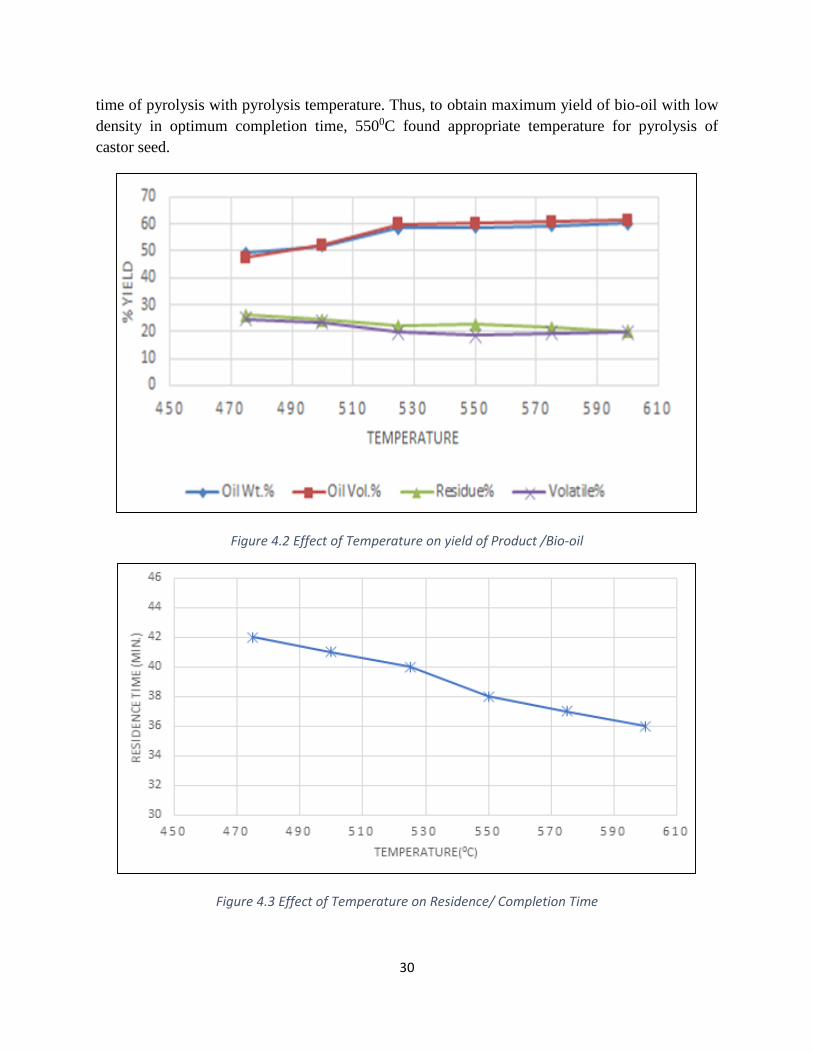
30
time of pyrolysis with pyrolysis temperature. Thus, to obtain maximum yield of bio-oil with low
density in optimum completion time, 5500C found appropriate temperature for pyrolysis of
castor seed.
Figure 4.2 Effect of Temperature on yield of Product /Bio-oil
Figure 4.3 Effect of Temperature on Residence/ Completion Time

31
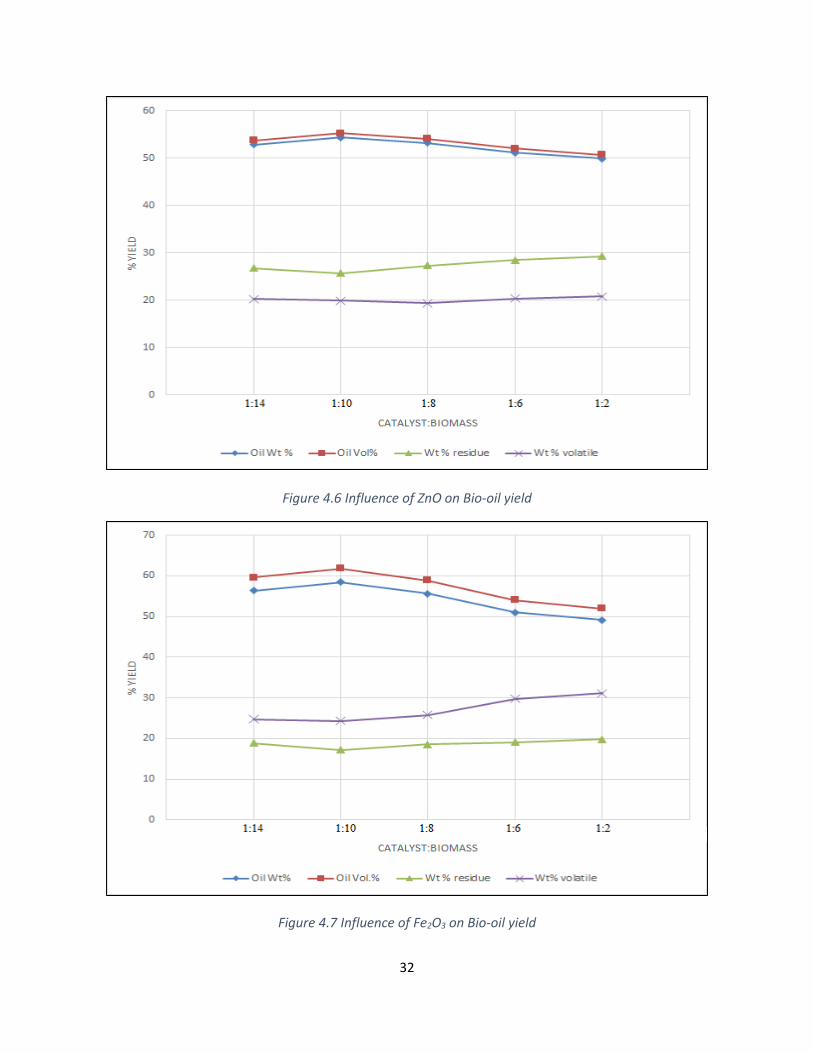
4.3 INFLUENCE OF CATALYST ON YIELD OF PRODUCT / BIO-OIL
Figure 4.4 Influence of CaO on Bio-oil yield
Figure 4.5 Influence of MgO on Bio-oil yield
32
Figure 4.6 Influence of ZnO on Bio-oil yield
Figure 4.7 Influence of Fe2O3 on Bio-oil yield
33
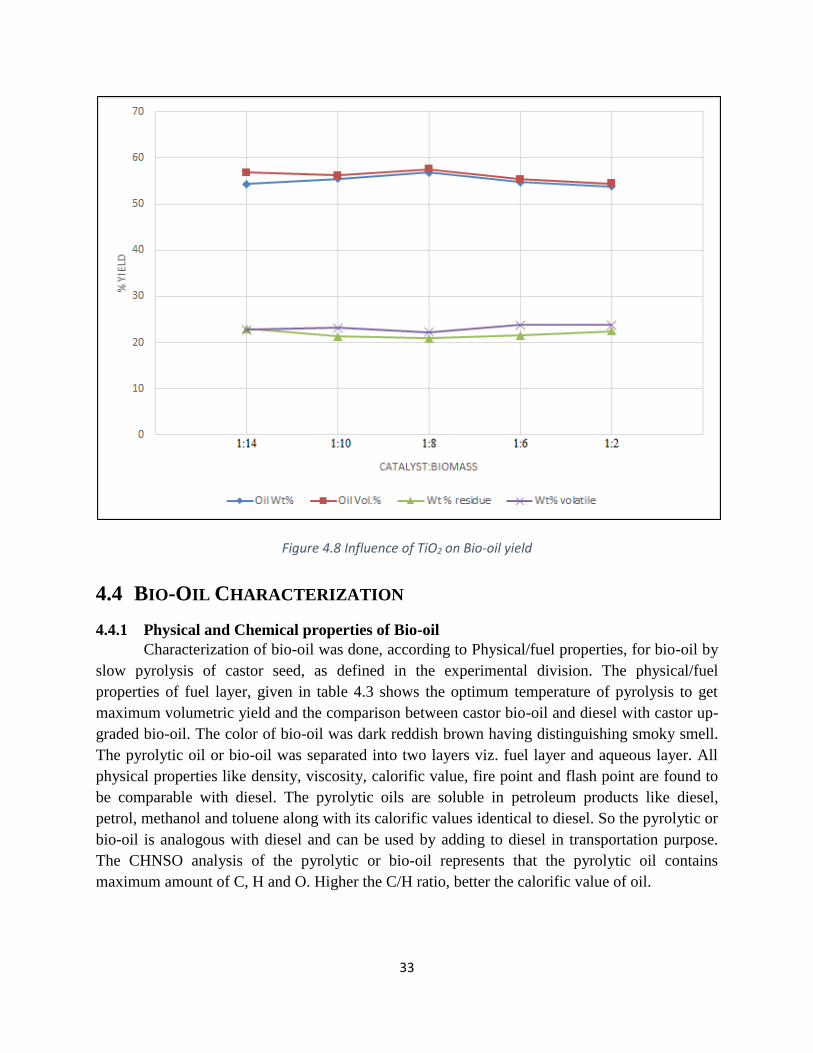
Figure 4.8 Influence of TiO2 on Bio-oil yield
4.4 BIO-OIL CHARACTERIZATION
4.4.1 Physical and Chemical properties of Bio-oil
Characterization of bio-oil was done, according to Physical/fuel properties, for bio-oil by
slow pyrolysis of castor seed, as defined in the experimental division. The physical/fuel
properties of fuel layer, given in table 4.3 shows the optimum temperature of pyrolysis to get
maximum volumetric yield and the comparison between castor bio-oil and diesel with castor up-
graded bio-oil. The color of bio-oil was dark reddish brown having distinguishing smoky smell.
The pyrolytic oil or bio-oil was separated into two layers viz. fuel layer and aqueous layer. All
physical properties like density, viscosity, calorific value, fire point and flash point are found to
be comparable with diesel. The pyrolytic oils are soluble in petroleum products like diesel,
petrol, methanol and toluene along with its calorific values identical to diesel. So the pyrolytic or
bio-oil is analogous with diesel and can be used by adding to diesel in transportation purpose.
The CHNSO analysis of the pyrolytic or bio-oil represents that the pyrolytic oil contains
maximum amount of C, H and O. Higher the C/H ratio, better the calorific value of oil.
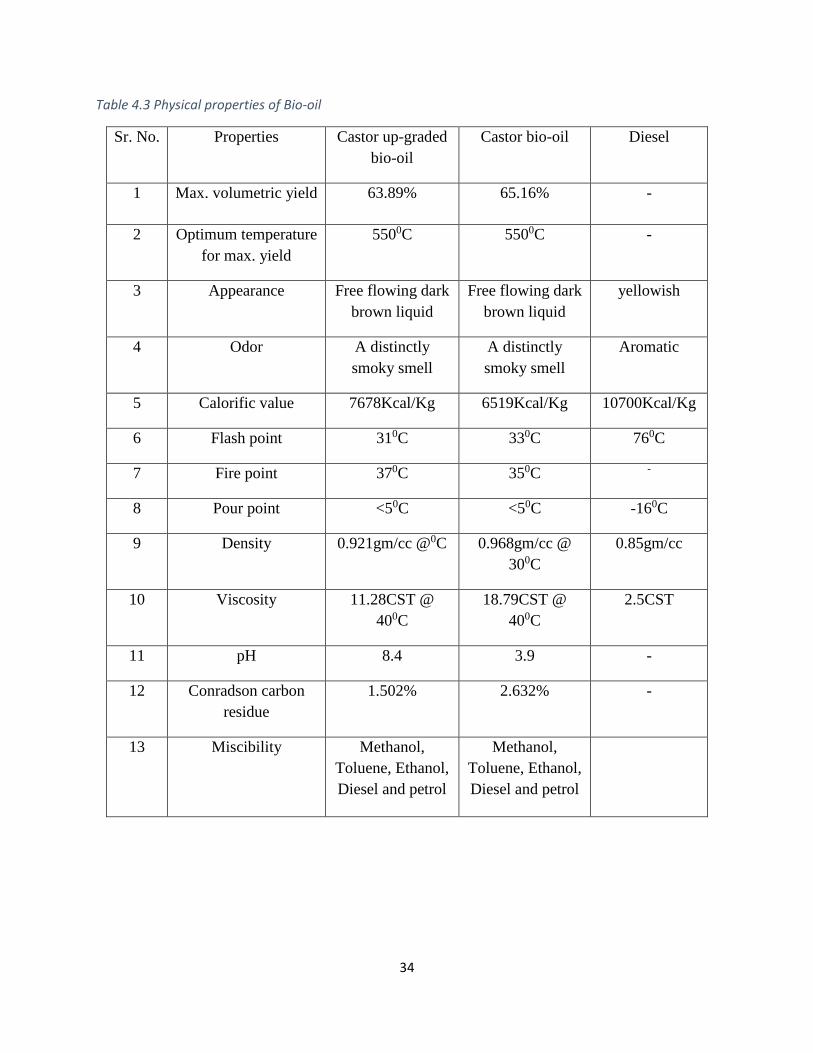
34
Table 4.3 Physical properties of Bio-oil
Sr. No. Properties Castor up-graded
bio-oil
Castor bio-oil Diesel
1 Max. volumetric yield 63.89% 65.16% -
2 Optimum temperature
for max. yield
5500C 5500C -
3 Appearance Free flowing dark
brown liquid
Free flowing dark
brown liquid
yellowish
4 Odor A distinctly
smoky smell
A distinctly
smoky smell
Aromatic
5 Calorific value 7678Kcal/Kg 6519Kcal/Kg 10700Kcal/Kg
6 Flash point 310C 330C 760C
7 Fire point 370C 350C -
8 Pour point <50C <50C -160C
9 Density 0.921gm/cc @0C 0.968gm/cc @
300C
0.85gm/cc
10 Viscosity 11.28CST @
400C
18.79CST @
400C
2.5CST
11 pH 8.4 3.9 -
12 Conradson carbon
residue
1.502% 2.632% -
13 Miscibility Methanol,
Toluene, Ethanol,
Diesel and petrol
Methanol,
Toluene, Ethanol,
Diesel and petrol
35
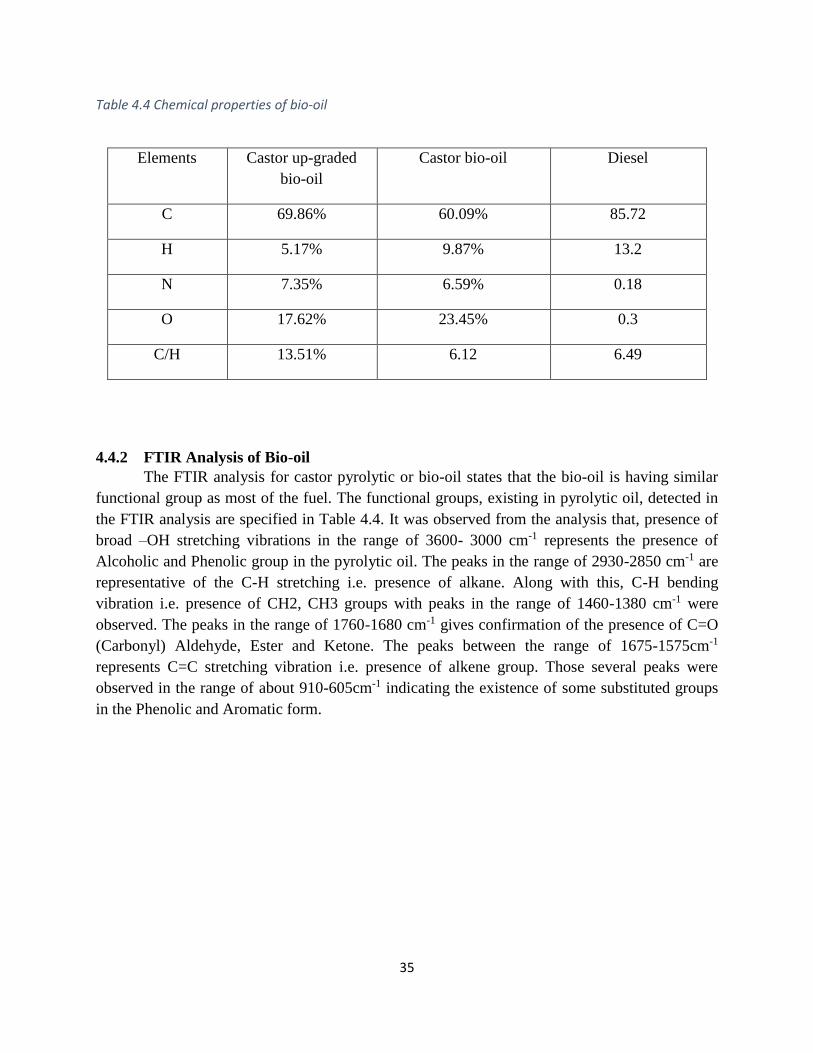
Table 4.4 Chemical properties of bio-oil
4.4.2 FTIR Analysis of Bio-oil
The FTIR analysis for castor pyrolytic or bio-oil states that the bio-oil is having similar
functional group as most of the fuel. The functional groups, existing in pyrolytic oil, detected in
the FTIR analysis are specified in Table 4.4. It was observed from the analysis that, presence of
broad –OH stretching vibrations in the range of 3600- 3000 cm-1 represents the presence of
Alcoholic and Phenolic group in the pyrolytic oil. The peaks in the range of 2930-2850 cm-1 are
representative of the C-H stretching i.e. presence of alkane. Along with this, C-H bending
vibration i.e. presence of CH2, CH3 groups with peaks in the range of 1460-1380 cm-1 were
observed. The peaks in the range of 1760-1680 cm-1 gives confirmation of the presence of C=O
(Carbonyl) Aldehyde, Ester and Ketone. The peaks between the range of 1675-1575cm-1
represents C=C stretching vibration i.e. presence of alkene group. Those several peaks were
observed in the range of about 910-605cm-1 indicating the existence of some substituted groups
in the Phenolic and Aromatic form.
Elements Castor up-graded
bio-oil
Castor bio-oil Diesel
C 69.86% 60.09% 85.72
H 5.17% 9.87% 13.2
N 7.35% 6.59% 0.18
O 17.62% 23.45% 0.3
C/H 13.51% 6.12 6.49

36
Figure 4.9 FTIR Analysis of castor bio-oil
Figure 4.10 FTIR analysis for bio-oil with catalyst ratio 1:10 & CaO as catalyst
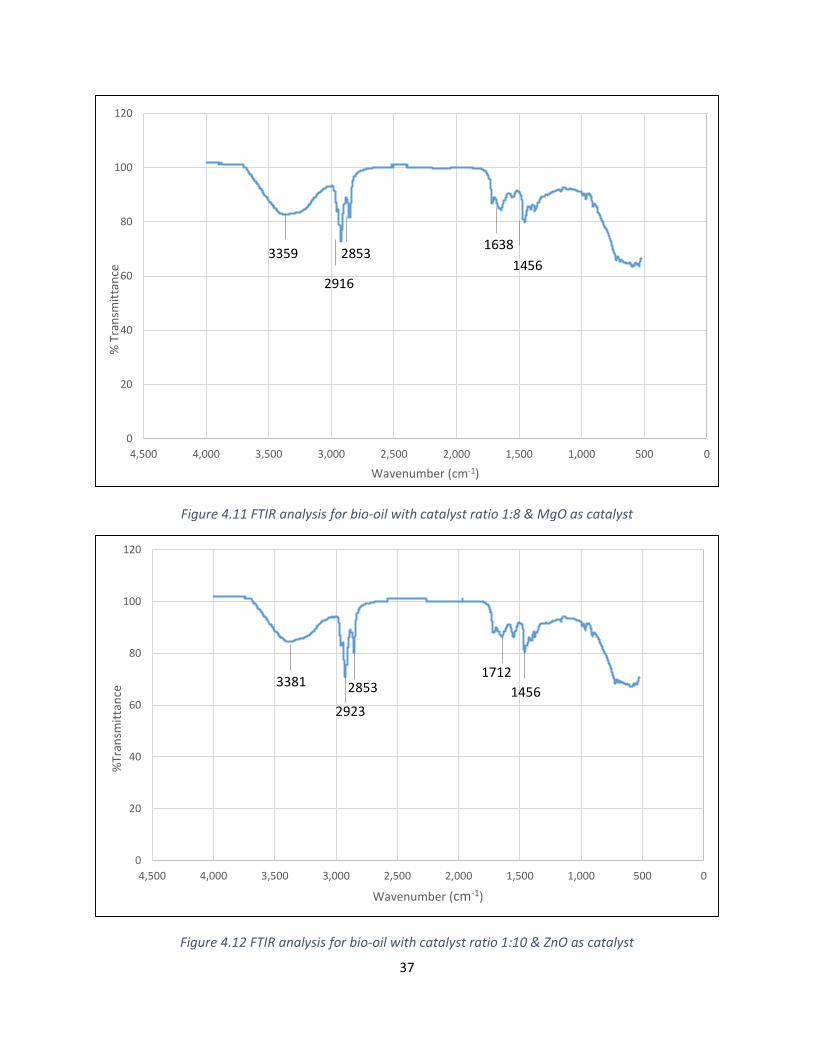
37
Figure 4.11 FTIR analysis for bio-oil with catalyst ratio 1:8 & MgO as catalyst
Figure 4.12 FTIR analysis for bio-oil with catalyst ratio 1:10 & ZnO as catalyst
0
20
40
60
80
100
120
05001,0001,5002,0002,5003,0003,5004,0004,500
% T
ran
smit
tan
ce
Wavenumber (cm-1)
0
20
40
60
80
100
120
05001,0001,5002,0002,5003,0003,5004,0004,500
%Tr
ansm
itta
nce
Wavenumber (cm-1)
3381
2923
28531712
1456
3359
2916
2853 1638
1456
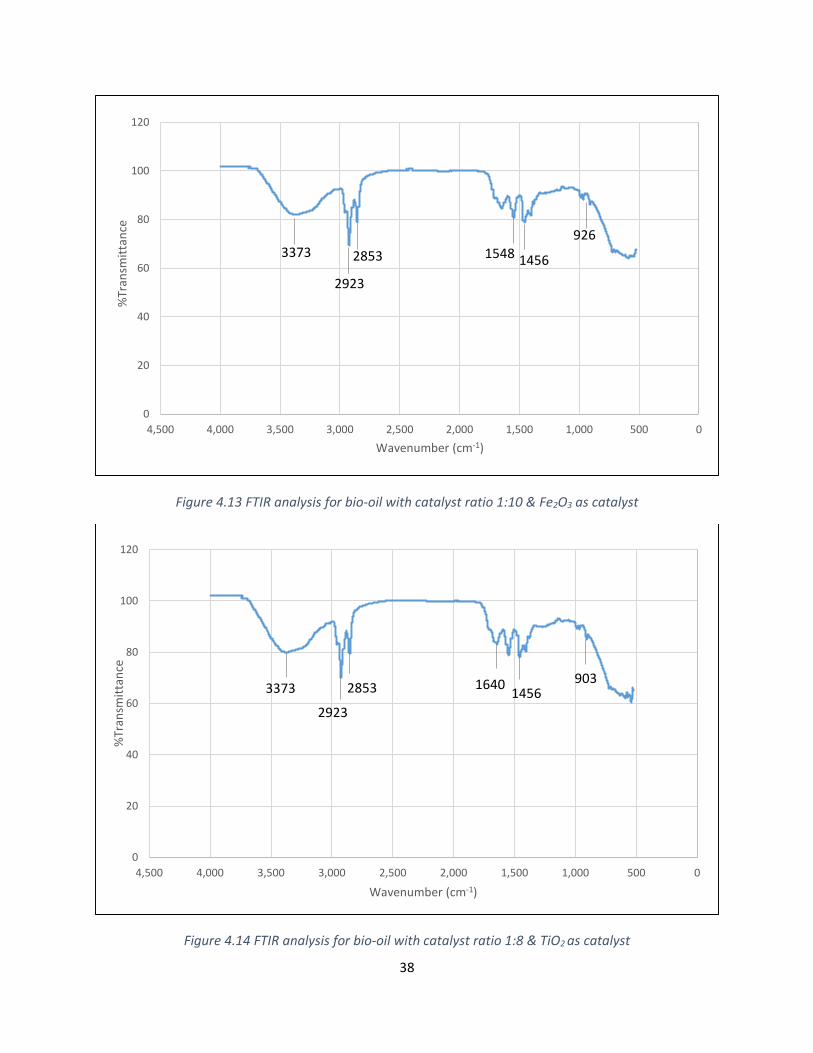
38
Figure 4.13 FTIR analysis for bio-oil with catalyst ratio 1:10 & Fe2O3 as catalyst
Figure 4.14 FTIR analysis for bio-oil with catalyst ratio 1:8 & TiO2 as catalyst
0
20
40
60
80
100
120
05001,0001,5002,0002,5003,0003,5004,0004,500
%Tr
ansm
itta
nce
Wavenumber (cm-1)
3373
2923
2853 1548 1456
926
0
20
40
60
80
100
120
05001,0001,5002,0002,5003,0003,5004,0004,500
%Tr
ansm
itta
nce
Wavenumber (cm-1)
3373
2923
2853 16401456
903
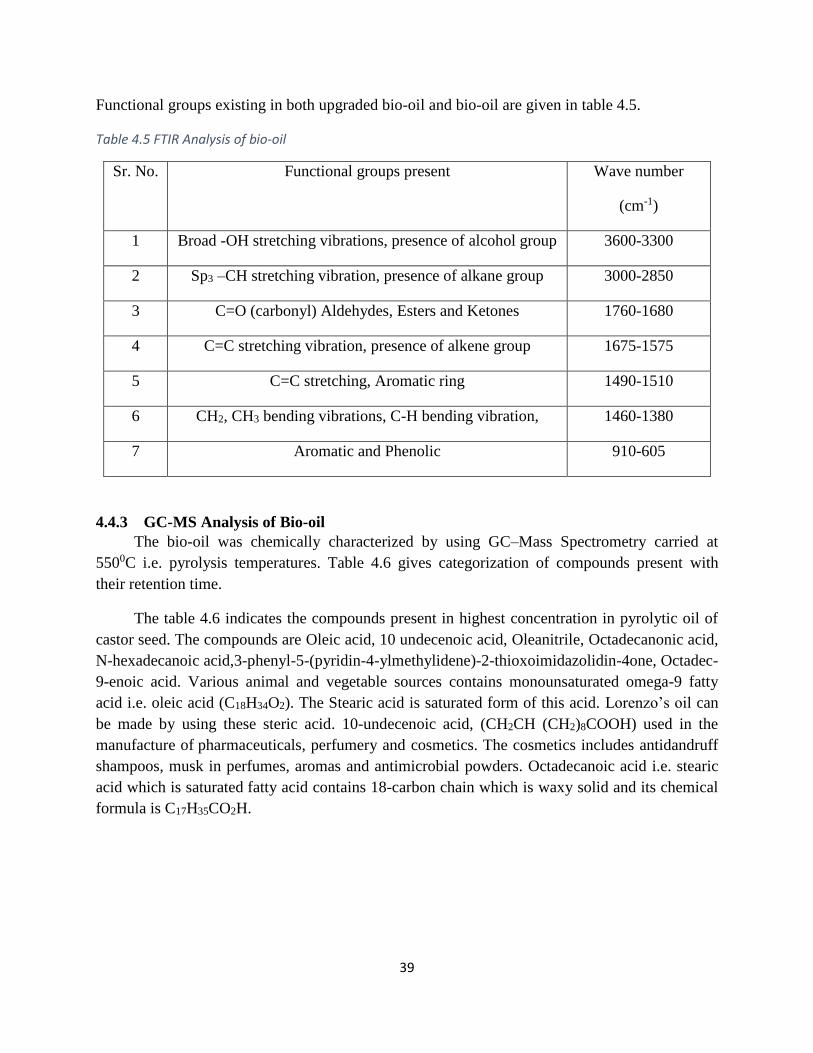
39
Functional groups existing in both upgraded bio-oil and bio-oil are given in table 4.5.
Table 4.5 FTIR Analysis of bio-oil
Sr. No. Functional groups present Wave number
(cm-1)
1 Broad -OH stretching vibrations, presence of alcohol group 3600-3300
2 Sp3 –CH stretching vibration, presence of alkane group 3000-2850
3 C=O (carbonyl) Aldehydes, Esters and Ketones 1760-1680
4 C=C stretching vibration, presence of alkene group 1675-1575
5 C=C stretching, Aromatic ring 1490-1510
6 CH2, CH3 bending vibrations, C-H bending vibration, 1460-1380
7 Aromatic and Phenolic 910-605
4.4.3 GC-MS Analysis of Bio-oil
The bio-oil was chemically characterized by using GC–Mass Spectrometry carried at
5500C i.e. pyrolysis temperatures. Table 4.6 gives categorization of compounds present with
their retention time.
The table 4.6 indicates the compounds present in highest concentration in pyrolytic oil of
castor seed. The compounds are Oleic acid, 10 undecenoic acid, Oleanitrile, Octadecanonic acid,
N-hexadecanoic acid,3-phenyl-5-(pyridin-4-ylmethylidene)-2-thioxoimidazolidin-4one, Octadec-
9-enoic acid. Various animal and vegetable sources contains monounsaturated omega-9 fatty
acid i.e. oleic acid (C18H34O2). The Stearic acid is saturated form of this acid. Lorenzo’s oil can
be made by using these steric acid. 10-undecenoic acid, (CH2CH (CH2)8COOH) used in the
manufacture of pharmaceuticals, perfumery and cosmetics. The cosmetics includes antidandruff
shampoos, musk in perfumes, aromas and antimicrobial powders. Octadecanoic acid i.e. stearic
acid which is saturated fatty acid contains 18-carbon chain which is waxy solid and its chemical
formula is C17H35CO2H.
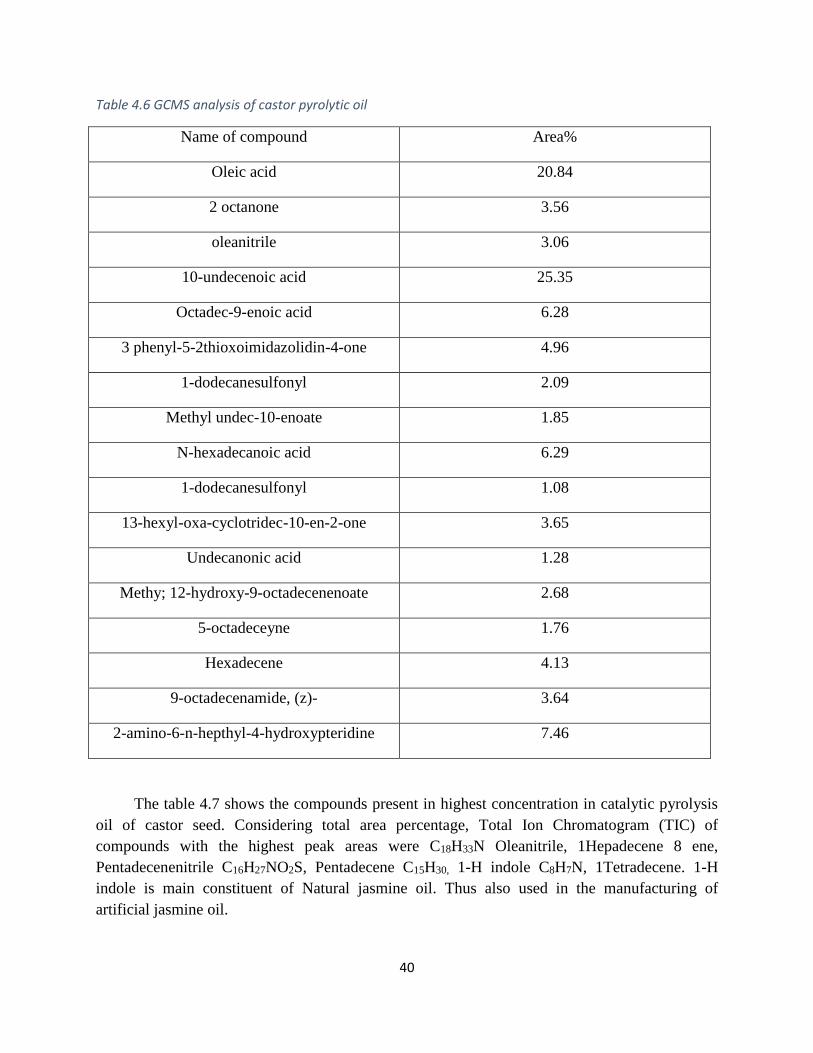
40
Table 4.6 GCMS analysis of castor pyrolytic oil
Name of compound Area%
Oleic acid 20.84
2 octanone 3.56
oleanitrile 3.06
10-undecenoic acid 25.35
Octadec-9-enoic acid 6.28
3 phenyl-5-2thioxoimidazolidin-4-one 4.96
1-dodecanesulfonyl 2.09
Methyl undec-10-enoate 1.85
N-hexadecanoic acid 6.29
1-dodecanesulfonyl 1.08
13-hexyl-oxa-cyclotridec-10-en-2-one 3.65
Undecanonic acid 1.28
Methy; 12-hydroxy-9-octadecenenoate 2.68
5-octadeceyne 1.76
Hexadecene 4.13
9-octadecenamide, (z)- 3.64
2-amino-6-n-hepthyl-4-hydroxypteridine 7.46
The table 4.7 shows the compounds present in highest concentration in catalytic pyrolysis
oil of castor seed. Considering total area percentage, Total Ion Chromatogram (TIC) of
compounds with the highest peak areas were C18H33N Oleanitrile, 1Hepadecene 8 ene,
Pentadecenenitrile C16H27NO2S, Pentadecene C15H30, 1-H indole C8H7N, 1Tetradecene. 1-H
indole is main constituent of Natural jasmine oil. Thus also used in the manufacturing of
artificial jasmine oil.
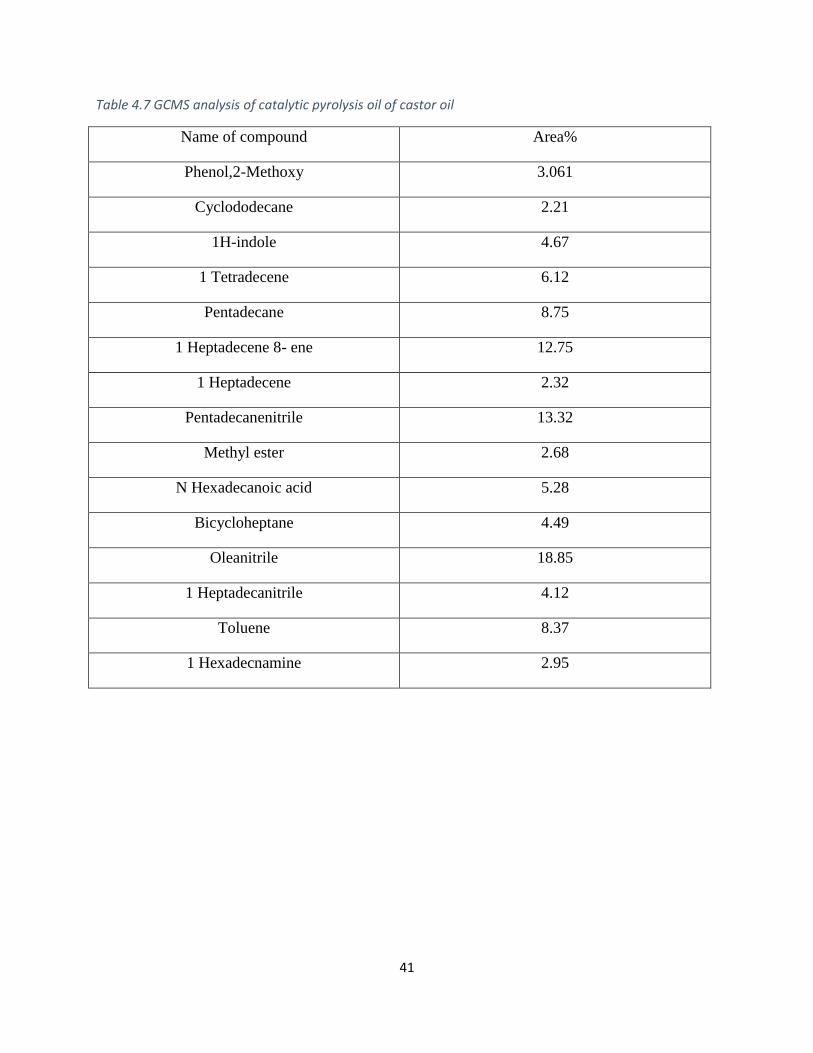
41
Table 4.7 GCMS analysis of catalytic pyrolysis oil of castor oil
Name of compound Area%
Phenol,2-Methoxy 3.061
Cyclododecane 2.21
1H-indole 4.67
1 Tetradecene 6.12
Pentadecane 8.75
1 Heptadecene 8- ene 12.75
1 Heptadecene 2.32
Pentadecanenitrile 13.32
Methyl ester 2.68
N Hexadecanoic acid 5.28
Bicycloheptane 4.49
Oleanitrile 18.85
1 Heptadecanitrile 4.12
Toluene 8.37
1 Hexadecnamine 2.95
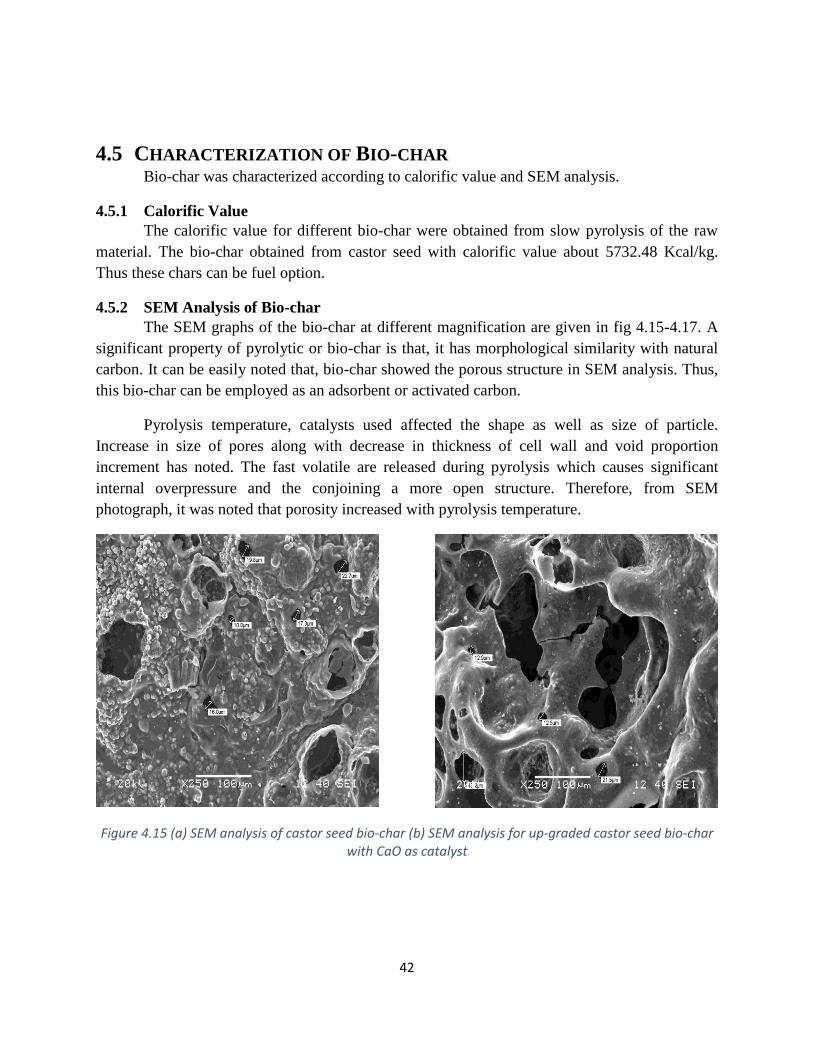
42
4.5 CHARACTERIZATION OF BIO-CHAR Bio-char was characterized according to calorific value and SEM analysis.
4.5.1 Calorific Value
The calorific value for different bio-char were obtained from slow pyrolysis of the raw
material. The bio-char obtained from castor seed with calorific value about 5732.48 Kcal/kg.
Thus these chars can be fuel option.
4.5.2 SEM Analysis of Bio-char
The SEM graphs of the bio-char at different magnification are given in fig 4.15-4.17. A
significant property of pyrolytic or bio-char is that, it has morphological similarity with natural
carbon. It can be easily noted that, bio-char showed the porous structure in SEM analysis. Thus,
this bio-char can be employed as an adsorbent or activated carbon.
Pyrolysis temperature, catalysts used affected the shape as well as size of particle.
Increase in size of pores along with decrease in thickness of cell wall and void proportion
increment has noted. The fast volatile are released during pyrolysis which causes significant
internal overpressure and the conjoining a more open structure. Therefore, from SEM
photograph, it was noted that porosity increased with pyrolysis temperature.
Figure 4.15 (a) SEM analysis of castor seed bio-char (b) SEM analysis for up-graded castor seed bio-char with CaO as catalyst
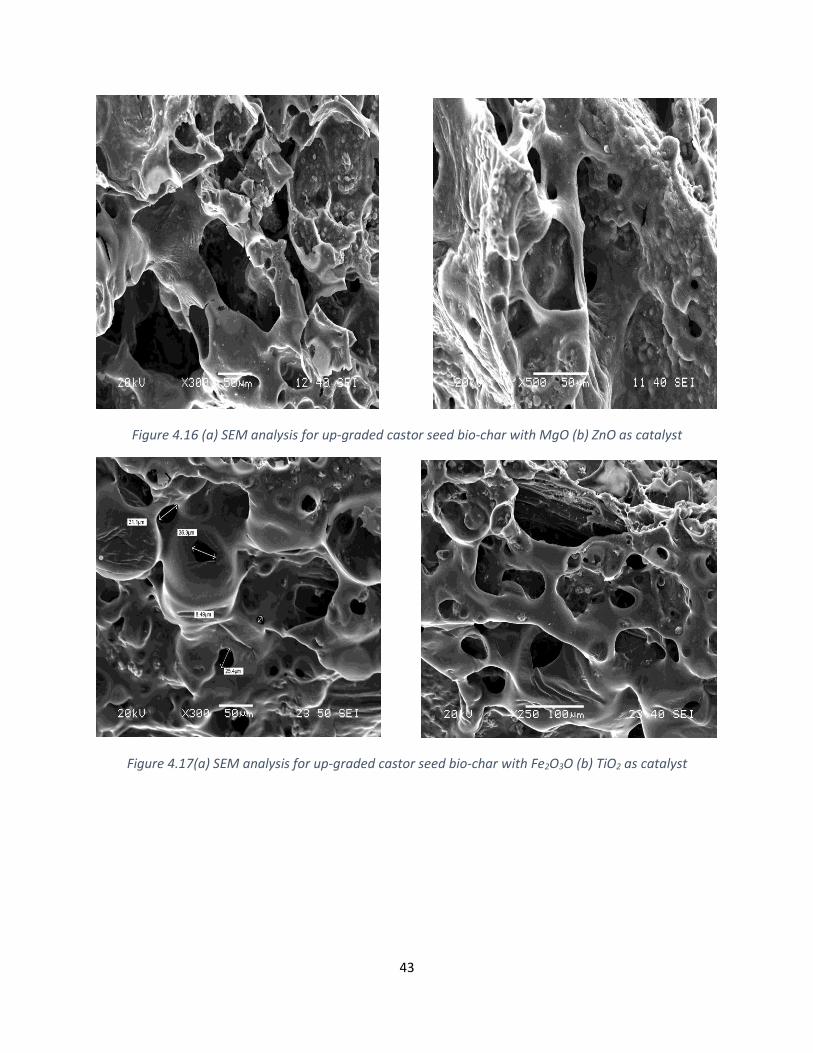
43
Figure 4.16 (a) SEM analysis for up-graded castor seed bio-char with MgO (b) ZnO as catalyst
Figure 4.17(a) SEM analysis for up-graded castor seed bio-char with Fe2O3O (b) TiO2 as catalyst
44
5 CONCLUSION
The characterization raw material i.e. castor seeds was carried. TGA showed degradation
of raw material around 350-5500C accordingly pyrolysis temperature range was decided.
The slow thermal pyrolysis of castor seed was done in semi-batch reactor for
temperatures 4750C to 6000C provided heating rate 200C/min. The reactor is made up of stainless
steel. On volume basis, the maximum yield of 65.16% was obtained for castor seed at 5500C
temperature with less completion time. The solid residue i.e. bio-char quantity decreased
continuously. The non-condensable part decreased first with increase in temperature then after
5500C it remained constant.
Catalytic pyrolysis of castor seeds were carried out at temperature of 5500C with the
heating at the rate of 200C/min, in a semi batch reactor to produce up-graded bio-oil using
calcium oxide (CaO), zinc oxide (ZnO), magnesium oxide (MgO), ferrous oxide (Fe2O3) and
titanium oxide (TiO2) as catalyst. The catalyst to biomass ratio varies in the range of 1:14 to 1:2.
The maximum bio-oil yield was obtained at with Fe2O3 as catalyst for the catalyst to biomass
ratio 1:10. The maximum yield of bio-oil obtained was 58.46% with minimum bio-char
produced i.e. 17.25% and less volatiles released i.e. 22.32%.
Physical and chemical characterization of liquid product i.e. bio-oil was done for both
castor seed bio-oil and up-graded castor seed bio-oil. The difference in viscosity, pH, calorific
value and carbon residue was noted. The viscosity of up-graded bio-oil was found less than bio-
oil. This might had happened because of the de-oxygenation of compound due to catalyst. The
increase in pH value of up-graded oil has been noticed from 3.9 to 9.16, which shows acidic
nature of oil was eliminated due to use of catalysts. The calorific value of up-graded bio-oil
increased from 6519Kcal/kg to7678 Kcal/kg. The carbon residue of bio-oil was found to be
1.0502% which is low, indicating that after ignition it leaves very minute residue.
The notable compounds present in pyrolytic oil of castor seed were Oleic acid, 10
undecenoic acid, Oleanitrile ,Octadecanonic acid, N-hexa-de-canoic acid, Octadec-9-enoic acid,
3-phenyl-5-(pyridin-4-ylmethylidene)-2-thioxoimidazolidin-4-one. It was detected that the bio-
oil comprises compounds with carbon chain length in the series of C4-C24 which is similar to
most of fuels used.
The major compound present in catalytic bio-oil were Oleanitrile, 1Hepadecene 8 ene,
Pentadecenenitrile, Pentadecene, 1Tetradecene, 1-H indole, Bicyclopentane. It was noted that
catalytic pyrolysis oil does not contain Oleic acid, 10 undecenoic acid, octadecenoic acid.The
results obtained from FTIR were found to be in consistent with GCMS results. The functional
groups in both up-graded bio-oil and bio-oil were found analogous to most other bio-oil specified
in literature. Also, calorific value of bio-char was noted sufficiently high, thus can be use as solid fuel.
SEM graphs, from the analysis, showed the presence of pores in solid residue i.e. bio-char, which
indicates its use as adsorbent.

45
6 FUTURE WORK
1. Ex situ up-gradation of biomass- by upgrading bio-oil. By doing both ex situ and in situ
up-gradation, finding the maximum conversion of bio-oil along with its up-graded
properties.
2. For different biomass- optimizing catalyst ratio, pyrolysis temperature with in situ and ex
situ conditions
3. Checking up-graded bio-oil usability in engine.
4. Detailed study of reactions occurring in up-gradation.
46
BIBLIOGRAPHY
[1] S. BILGEN, K. KAYGUSUZ, and A. SARI, “Renewable Energy for a Clean and Sustainable Future,” Energy Sources, vol. 26, no. 12. pp. 1119–1129, 2004.
[2] R. E. H. Sims, “Renewable energy: A response to climate change,” Solar Energy, vol. 76, pp. 9–17, 2004.
[3] N. L. Panwar, S. C. Kaushik, and S. Kothari, “Role of renewable energy sources in environmental protection: A review,” Renewable and Sustainable Energy Reviews, vol. 15, no. 3. Elsevier Ltd, pp. 1513–1524, 2011.
[4] F. Breu, S. Guggenbichler, and J. Wollmann, HE and the challenge of Sustainability. 2008.
[5] P. T. Martone, J. M. Estevez, F. Lu, K. Ruel, M. W. Denny, C. Somerville, and J. Ralph, “Discovery of Lignin in Seaweed Reveals Convergent Evolution of Cell-Wall Architecture,” Current Biology, vol. 19, no. 2, pp. 169–175, 2009.
[6] C. C. Lignin, “ United States Patent ( 10 ) Patent No .: 45 Date of Patent ,” vol. 2, no. 12, 2014.
[7] D. M. Alonso, J. Q. Bond, and J. a. Dumesic, “Catalytic conversion of biomass to biofuels,” Green Chemistry, vol. 12, no. 9, p. 1493, 2010.
[8] T. Dickerson and J. Soria, “Catalytic fast pyrolysis: A review,” Energies, vol. 6, no. 1, pp. 514–538, Jan. 2013.
[9] D. A. Ruddy, J. A. Schaidle, J. R. Ferrell III, J. Wang, L. Moens, and J. E. Hensley, "Recent advances in heterogeneous catalysts for bio-oil upgrading via ex situ catalytic fast pyrolysis”: catalyst development through the study of model compounds, vol. 16, no. 2. 2014.
[10] A. V. Bridgwater, “Production of high grade fuels and chemicals from catalytic pyrolysis of biomass,” Catalysis Today, vol. 29, no. 1–4. pp. 285–295, 1996.
[11] D. Mohan, C. U. Pittman, and P. H. Steele, “Pyrolysis of Wood / Biomass for Bio-oil : A Critical Review,” Energy & Fuesl, vol. 20, no. 4, pp. 848–889, 2006.
[12] A. V. Bridgwater, “Catalysis in thermal biomass conversion,” Applied Catalysis: A General, vol. 116, no. 1–2, pp. 5–47, 1994.
[13] J. Wildschut, I. Melián-Cabrera, and H. J. Heeres, “Catalyst studies on the hydrotreatment of fast pyrolysis oil,” Applied Catalysis B: Environmental, vol. 99, no. 1–2, pp. 298–306, 2010.
47
[14] C. Liu, H. Wang, A. M. Karim, J. Sun, and Y. Wang, “Catalytic fast pyrolysis of lignocellulosic biomass,” Chemical Society Review, vol. 43, no. 22, 2014.
[15] D. C. Elliott, A. Oasmaa, and S. Mu, “Catalytic Hydroprocessing of Biomass Fast Pyrolysis Bio-oil to produce Hydrocarbon Products,” Environmental Progress, vol. 28, no. 3, pp. 404–409, 2009.
[16] O. D. Mante and F. a. Agblevor, “Catalytic pyrolysis for the production of refinery-ready biocrude oils from six different biomass sources,” Green Chemistry, vol. 16, no. 6, p. 3364, 2014.
[17] R. French and S. Czernik, “Catalytic pyrolysis of biomass for biofuels production,” Fuel
Processing Technology, vol. 91, no. 1, pp. 25–32, 2010.
[18] A. Aho, N. Kumar, K. Eränen, T. Salmi, M. Hupa, and D. Y. Murzin, “Catalytic pyrolysis of woody biomass in a fluidized bed reactor: Influence of the zeolite structure,” Fuel, vol. 87, no. 12, pp. 2493–2501, 2008.
[19] P. T. Williams and N. Nugranad, “Comparison of products from the pyrolysis and catalytic pyrolysis of rice husks,” Energy, vol. 25, no. 6, pp. 493–513, 2000.
[20] Q. Dang, Z. Luo, J. Zhang, J. Wang, W. Chen, and Y. Yang, “Experimental study on bio-oil upgrading over Pt/SO42-/ZrO 2/SBA - 15 catalyst in supercritical ethanol,” Fuel, 2013, vol. 103, pp. 683–692.
[21] J. Wildschut, F. H. Mahfud, R. H. Venderbosch, and H. J. Heeres, “Hydrotreatment of Fast Pyrolysis Oil Using Heterogeneous Noble-Metal Catalysts,” Industrial Engineering Chemistry, pp. 10324–10334, 2009.
[22] P.-L. Boey, G. P. Maniam, and S. A. Hamid, “Performance of calcium oxide as a heterogeneous catalyst in biodiesel production: A review,” Chemical Engineering Journal, vol. 168, no. 1. Elsevier B.V., pp. 15–22, 2011.
[23] S. Panigrahi, a. K. Dalai, and N. N. Bakhshi, “Production of syn gas/high BTU gaseous fuel from the pyrolysis of biomass derived oil,” ACS Division of Fuel Chemistry, Preprints, vol. 47, no. 1, pp. 118–122, 2002.
[24] K. Shi, S. Shao, Q. Huang, X. Liang, J. Lan, and L. Ya, “Review of catalytic pyrolysis of biomass for bio-oil,” in ICMREE2011 - Proceedings 2011 International Conference on Materials for Renewable Energy and Environment, 2011, vol. 1, pp. 317–321.
[25] R. H. Venderbosch, a. R. Ardiyanti, J. Wildschut, A. Oasmaa, and H. J. Heeres, “Stabilization of biomass-derived pyrolysis oils,” journal of Chemical Technology and
Biotechnology, vol. 85, no. 5, pp. 674–686, 2010.
48
[26] M. Wright, D. Daugaard, J. Satrio, R. Brown, and D. D. Hsu, “Techno-economic analysis of biomass fast pyrolysis to transportation fuels,” 2010.
[27] X. Liu, H. He, Y. Wang, S. Zhu, and X. Piao, “Transesterification of soybean oil to biodiesel using CaO as a solid base catalyst,” Fuel, vol. 87, no. 2, pp. 216–221, 2008.
[28] Q. Zhang, J. Chang, T. J. Wang, and Y. Xu, “Upgrading bio-oil over different solid catalysts,” Energy and Fuels, vol. 20, no. 6, pp. 2717–2720, 2006.
[29] S. Zhang, Y. Yan, T. Li, and Z. Ren, “Upgrading of liquid fuel from the pyrolysis of biomass,” Bio resource Technology, vol. 96, no. 5, pp. 545–550, 2005.
[30] M. W. Nolte and M. W. Liberatore, “Viscosity of biomass pyrolysis oils from various feedstocks,” Energy and Fuels, vol. 24, no. 12, pp. 6601–6608, 2010.
[31] W.J. Liu, X.-S. Zhang, Y.-C. Qv, H. Jiang, and H.-Q. Yu, “Bio-oil upgrading at ambient pressure and temperature using zero valent metals,” Green Chemistry, vol. 14, no. 8. p. 2226, 2012.
[32] C. A. Fisk, T. Morgan, Y. Ji, M. Crocker, C. Crofcheck, and S. A. Lewis, “Bio-oil upgrading over platinum catalysts using in situ generated hydrogen,” Applied Catalysis A : General,vol. 358, pp. 150–156, 2009.