Embed Size (px)
Citation preview

BERENBERG EQUITY RESEARCH
Catalysts and metal recycling
Expectations are too high
Evgenia Molotova
Analyst
+44 20 3465 2664
Jaideep Pandya
Analyst
+44 20 3207 7890
John Klein
Analyst
+44 20 3207 7930
15 July 2013
Chemicals

Catalysts and metal recycling Chemicals
For our disclosures in respect of section 34b of the German Securities Trading Act (Wertpapierhandelsgesetz – WpHG) and our disclaimer please see the end of this document. Please note that the use of this research report is subject to the conditions and restrictions set forth in the disclosures and the disclaimer at the end of this document.

Catalysts and metal recycling Chemicals
Table of contents
Catalysts and metal recycling: expectations are too high 4
Executive summary 5
Porter’s five forces analysis 8
Catalysts 10
Recycling 53
Umicore: Recycling at risk 85
Umicore: investment thesis 87
Valuation 126
Umicore: company overview 127
Financials 131
Johnson Matthey: Near-term expectations too high 135
Johnson Matthey: investment thesis 137
Johnson Matthey: company overview 156
Valuation 158
Financials 160
Disclosures in respect of section 34b of the German Securities Trading Act (Wertpapierhandelsgesetz – WpHG) 164
Contacts: Investment Banking 167

Catalysts and metal recycling Chemicals
4
Expectations are too high
● With this note, we initiate coverage of Johnson Matthey and Umicore. We rate Johnson Matthey Hold with a price target of £28.00/share and Umicore Sell with a price target of €26/share.
● We have conducted an in-depth, bottom-up analysis of two industries: metal recycling, and automotive and process catalysts. We think that in both industries the market tends to rely on the forecasts of the main players and lacks visibility on key industry drivers, the stakeholders involved in the process and the risks associated with the industry. Medium-term, we are more positive on the prospects of the catalysts industry than we are on the recycling industry. Short-term, we have concerns for both industries.
● Johnson Matthey is the leading company in the area of automotive catalysts; it also has precious metals recycling and production capabilities. We think that in the long term Johnson Matthey is well positioned within the majority of the industries in which it is present; however, in the short term we see some risks to consensus numbers.
● In automotive catalysts, we think that the market is overestimating the effect of Euro VI legislation on the catalyst value per vehicle. We also think that the Chinese heavy-duty diesel (HDD) catalyst market will develop more slowly than consensus expects. Finally, short-term pre-buying of Euro V trucks ahead of Euro VI implementation could slow the penetration of Euro VI in 2013-14.
● Our expectations for Johnson Matthey’s Precious Metal Products division are also below consensus. The loss of the Anglo Platinum distribution contract will result in a £35m loss of EBIT. In our view, the market seems to believe that a similar contract can be signed with another precious metals producer, which will restore divisional profitability to the level of 2011. We view this as unrealistic.
● Umicore is one of the leading companies in the areas of recycling and automotive catalysts. It has unique technical capabilities that allow it to recycle various feedstock streams and recover up to 20 metals. The recent underperformance of the stock reflects, in our view, market concerns about the short-term performance of the largest division – Recycling (c61% of group EBIT in 2012) – due to declining precious metal prices. We expect the competitive dynamics of the recycling industry to deteriorate significantly in the medium term.
● We expect a decrease in the availability of key recycling feedstocks: electronic scrap (e-scrap) and industrial residues. Contrary to market expectations, we do not expect e-scrap availability to increase in the medium term. On the other hand, recent capacity additions in e-scrap treatment have led to significant overcapacity in the market. Industrial residues – PGM-containing slimes of base metals (copper, lead, zinc) – were historically treated by Umicore. Recently, however, a number of metal refiners have invested in their own capacities. For instance, we believe the termination of the company’s supply agreement with Aurubis might lead to around a 10% fall in Umicore’s gold output. The company’s other divisions will not be able to compensate for the deterioration in Recycling.
● We are 9% below Bloomberg consensus for Johnson Matthey’s 2013 EPS and 12% below consensus for 2014 EPS. We are 8% below consensus for Umicore’s 2013 EPS; for 2014 we are 24% below consensus.
Umicore SA
Sell (initiation) Current price
EUR 33.26 Price target
EUR 26.00 11/07/2013 Brussels Close
Johnson Matthey plc
Hold (initiation) Current price
GBp 2,807 Price target
GBp 2,800 11/07/2013 London Close
Rating system: Absolute
15 July 2013
Evgenia Molotova Analyst +44 20 3465 2664 [email protected]
Jaideep Pandya Analyst +44 20 3207 7890 [email protected]
John Klein Analyst +44 20 3207 7930 [email protected]
Catalysts and metal recycling Chemicals
5
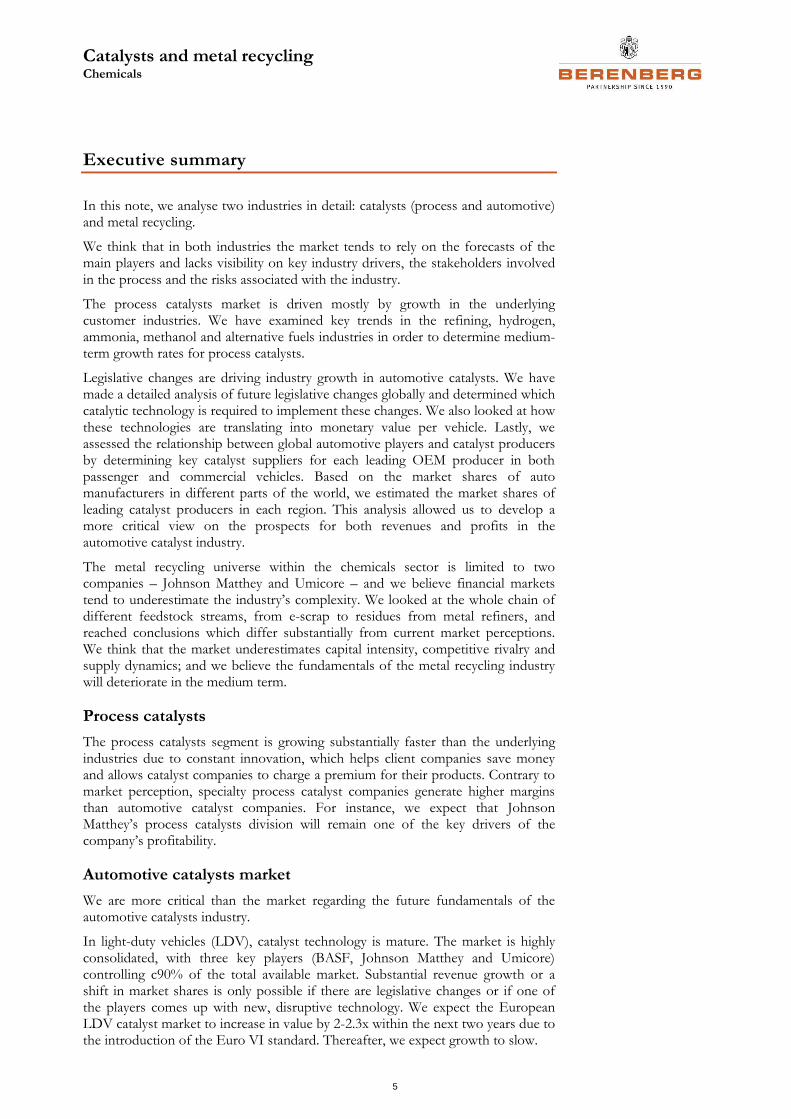
Executive summary
In this note, we analyse two industries in detail: catalysts (process and automotive) and metal recycling.
We think that in both industries the market tends to rely on the forecasts of the main players and lacks visibility on key industry drivers, the stakeholders involved in the process and the risks associated with the industry.
The process catalysts market is driven mostly by growth in the underlying customer industries. We have examined key trends in the refining, hydrogen, ammonia, methanol and alternative fuels industries in order to determine medium-term growth rates for process catalysts.
Legislative changes are driving industry growth in automotive catalysts. We have made a detailed analysis of future legislative changes globally and determined which catalytic technology is required to implement these changes. We also looked at how these technologies are translating into monetary value per vehicle. Lastly, we assessed the relationship between global automotive players and catalyst producers by determining key catalyst suppliers for each leading OEM producer in both passenger and commercial vehicles. Based on the market shares of auto manufacturers in different parts of the world, we estimated the market shares of leading catalyst producers in each region. This analysis allowed us to develop a more critical view on the prospects for both revenues and profits in the automotive catalyst industry.
The metal recycling universe within the chemicals sector is limited to two companies – Johnson Matthey and Umicore – and we believe financial markets tend to underestimate the industry’s complexity. We looked at the whole chain of different feedstock streams, from e-scrap to residues from metal refiners, and reached conclusions which differ substantially from current market perceptions. We think that the market underestimates capital intensity, competitive rivalry and supply dynamics; and we believe the fundamentals of the metal recycling industry will deteriorate in the medium term.
Process catalysts
The process catalysts segment is growing substantially faster than the underlying industries due to constant innovation, which helps client companies save money and allows catalyst companies to charge a premium for their products. Contrary to market perception, specialty process catalyst companies generate higher margins than automotive catalyst companies. For instance, we expect that Johnson Matthey’s process catalysts division will remain one of the key drivers of the company’s profitability.
Automotive catalysts market
We are more critical than the market regarding the future fundamentals of the automotive catalysts industry.
In light-duty vehicles (LDV), catalyst technology is mature. The market is highly consolidated, with three key players (BASF, Johnson Matthey and Umicore) controlling c90% of the total available market. Substantial revenue growth or a shift in market shares is only possible if there are legislative changes or if one of the players comes up with new, disruptive technology. We expect the European LDV catalyst market to increase in value by 2-2.3x within the next two years due to the introduction of the Euro VI standard. Thereafter, we expect growth to slow.

Catalysts and metal recycling Chemicals
6
As there are no considerable legislative changes in LDV until 2015, we expect average annual market growth to be 5-5.5%, still higher than global auto production growth. The maturity of the market in developed countries and the slowdown in legislative changes (as emissions control in these regions is already at a very high level) could lead to an erosion of catalyst producers’ pricing power.
Less than a decade ago, the HDD catalyst market did not exist, but it is now growing very rapidly, driven mostly by the legislative changes discussed above. Johnson Matthey forecasts the HDD catalyst market to reach $2.1bn by 2015 and $3bn by 2020. We are more cautious and expect the HDD catalyst market to reach $1.9bn by 2015 and $2.5bn by 2020.
Short-term growth in the HDD market will be driven by the introduction of the Euro VI standard in Europe and Phase IV (similar to Euro IV) in China. Both are expected to come into force at the beginning of 2014. Based on our analysis, we expect the European HDD catalyst market to double due to this change in legislation.
We see the development of the Chinese market as more problematic. Low-sulphur fuel is necessary for Phase IV implementation and it is not yet clear whether this is available throughout the country. For the last four years, Chinese oil refineries have struggled with the capacity upgrades required for low-sulphur fuel production.
Phase IV does not require sophisticated technology, so the catalyst value per vehicle will be much less than it is in developed countries. Implementation will also attract local competitors to the market, so the catalyst majors’ market share will be smaller in China than in the developed world.
Lastly, it is not clear how the change in legislation will be enforced in China. In Europe or the US, faulty catalysts can result in significant fines for the auto manufacturer. In China, the stakeholders as well as the emissions measurement mechanisms are not clear. We think truck manufacturers will try to avoid additional investments in emissions control, should such an opportunity arise.
We also have certain concerns about the short-term profitability of the HDD catalyst market. Future changes in HDD legislation have prompted all the major players to increase capacity and we think that, in the next two years, the market will be unable to absorb all the capacity additions.
Metal recycling
We think that there are fundamental changes taking place in the recycling industry which will lead to a reduction in refining charges and precious metal yields for the leading player, Umicore. The company has developed a unique technological process which allows it to recover 20 precious and non-ferrous metals from various sources of secondary feedstock. Umicore’s metal extraction rates are much higher than those of its competitors, especially in cases where metal concentration in the feedstock is low.
So far, Umicore has been able to “cherry-pick” its feedstock in order to optimise the input metal mix and increase the metal yield of the output. However, we think that the availability of various platinum group metal (PGM) containing feedstocks will be severely reduced in the medium term.
E-scrap is one of the most important feedstocks for metal recycling, as it has the highest concentration of precious metals per tonne of scrap. The market – mistakenly, in our view – expects very strong growth in the availability of this type of feedstock. Based on our analysis, we expect the growth in e-scrap availability to be considerably lower than the market forecasts. The majority of the materials

Catalysts and metal recycling Chemicals
7
which are available and profitable to recycle are already being recycled (legally or illegally). Radical changes in legislation and changes in product design are required for further growth of the addressable market. On the other hand, capacity growth in e-scrap recycling is considerably outpacing the growth in scrap availability. According to our estimates, global e-scrap recycling capacity currently exceeds 400,000 tonnes, whereas the available e-scrap will only reach 300,000 tonnes by 2015.
We also think that the concentration of PGMs in industrial residues will decrease over time.
Concentrates which metal smelters use as feedstock contain precious and minor metals. In the past, base metal smelters used to outsource the treatment of their PGM-containing production slimes to the likes of Umicore. However, the recent decline in their main revenue streams (treatment charges, free metal sales and by-product sales) has forced them to look for incremental sources of revenue. A number of base metal refiners have made investments in recycling facilities. For instance, Aurubis has a long-term contract with Umicore which is coming to an end in 2013; Aurubis has decided not to renew it. Based on our calculations, the loss of this contract could result in the loss of 10% of Umicore’s gold feedstock. Nyrstar is another company which intends to end its contract with Umicore in 2015-16.
Recycling is a very capital-intensive business. We think that fixed costs represent up to 75% of total cash costs in recycling (excluding the cost of the metal, which is a pass-through). As a result, a recycler has to operate the smelter 24/7, even if the input mix is not optimal. As the metal mix deteriorates, the recycler begins to treat fewer precious metals and more base metals (lead, copper and zinc). As a result, revenues decline significantly, whereas costs remain broadly unchanged or even increase, as the recycler has to process higher volumes in order to reach the same precious metal yields.
We expect that the profitability and returns of Umicore – the leading player in the recycling industry – will fall in the medium term.
Catalysts and metal recycling Chemicals
8
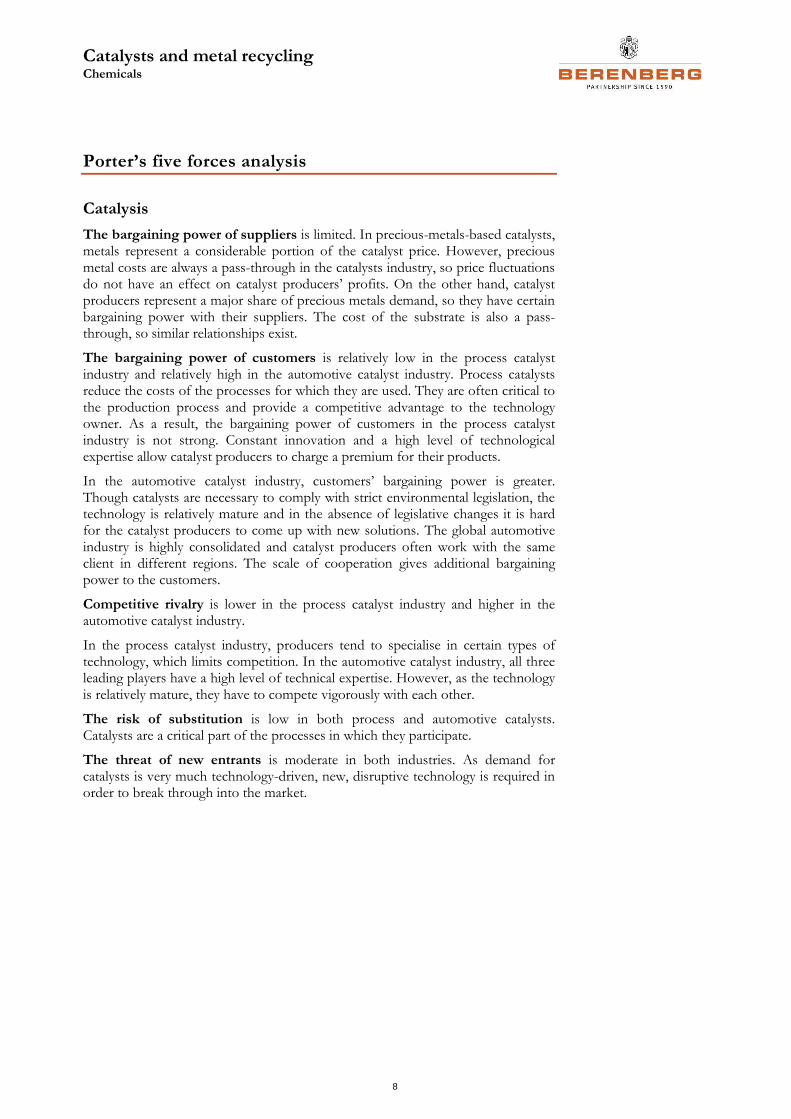
Porter’s five forces analysis
Catalysis
The bargaining power of suppliers is limited. In precious-metals-based catalysts, metals represent a considerable portion of the catalyst price. However, precious metal costs are always a pass-through in the catalysts industry, so price fluctuations do not have an effect on catalyst producers’ profits. On the other hand, catalyst producers represent a major share of precious metals demand, so they have certain bargaining power with their suppliers. The cost of the substrate is also a pass-through, so similar relationships exist.
The bargaining power of customers is relatively low in the process catalyst industry and relatively high in the automotive catalyst industry. Process catalysts reduce the costs of the processes for which they are used. They are often critical to the production process and provide a competitive advantage to the technology owner. As a result, the bargaining power of customers in the process catalyst industry is not strong. Constant innovation and a high level of technological expertise allow catalyst producers to charge a premium for their products.
In the automotive catalyst industry, customers’ bargaining power is greater. Though catalysts are necessary to comply with strict environmental legislation, the technology is relatively mature and in the absence of legislative changes it is hard for the catalyst producers to come up with new solutions. The global automotive industry is highly consolidated and catalyst producers often work with the same client in different regions. The scale of cooperation gives additional bargaining power to the customers.
Competitive rivalry is lower in the process catalyst industry and higher in the automotive catalyst industry.
In the process catalyst industry, producers tend to specialise in certain types of technology, which limits competition. In the automotive catalyst industry, all three leading players have a high level of technical expertise. However, as the technology is relatively mature, they have to compete vigorously with each other.
The risk of substitution is low in both process and automotive catalysts. Catalysts are a critical part of the processes in which they participate.
The threat of new entrants is moderate in both industries. As demand for catalysts is very much technology-driven, new, disruptive technology is required in order to break through into the market.

Catalysts and metal recycling Chemicals
9
Recycling
The bargaining power of suppliers is limited, but increasing. In the majority of cases in the recycling industry, suppliers are also clients. The recycler obtains metal scrap from the client and returns extracted metal. Treatment charges are the key revenue stream for the recycler. In the past, the structure of the treatment charge allowed the recyclers to capture a large proportion of the underlying metal value. However, as recycling technology matures, more players are entering the market, with the suppliers themselves investing in metal treatment facilities. We think that these changes will affect the structure of treatment charges and reduce the value of the metal captured by the supplier.
The bargaining power of customers. See point above.
Competitive rivalry is increasing due to fundamental changes in the industry. We expect scrap availability to decline in the medium term. Recyclers will have to compete with their own suppliers for available feedstock material.
The risk of substitution is low. Metals can be either mined or recycled. Recycling feedstock has much higher metal concentrations than ore does. Recycling is therefore a much more cost-efficient method of metal production than mining.
The threat of new entrants is increasing. Scrap suppliers (mostly base metal refiners) are becoming increasingly involved in metal recycling, as they are reluctant to share a significant portion of the value of the recovered metal with the recycler.

Catalysts and metal recycling Chemicals
10
Catalysts
Catalysts are the “workhorses” of chemical transformations. Approximately 85-90% of the products of the chemicals industry and 20% of all industrial products are made via a catalytic process.
A catalyst accelerates a chemical reaction. Every catalytic reaction is a sequence of elementary steps in which reactant molecules bind to the catalyst, where they react, after which the product detaches from the catalyst, liberating the latter for the next cycle.
Catalysts are required in:
petroleum refining (which consists almost entirely of catalytic processes);
the production of bulk and fine chemicals in all branches of the chemicals industry (for instance, rubber, plastics, methanol etc);
the prevention of pollution by avoiding the formation of waste;
the abatement of pollution in end-of-pipe solutions (automotive and industrial exhausts); and
the production of pharmaceuticals.
A catalyst offers an alternative, energy-efficient mechanism to the non-catalytic reaction, thus enabling processes to be carried out under industrially-feasible conditions (in terms of pressure and temperature, for example). The chemicals industry would not exist without catalysts: they can help substantially decrease costs or develop new, unique product propositions, providing a competitive advantage to a company which owns certain catalytic technology.
Catalysts come in a multitude of forms, varying from atoms and molecules to large structures such as zeolites or enzymes. In addition, they may be employed in various surroundings: in liquids, in gases or on the surface of solids.
Catalytic reaction
Source: Concepts of Modern Catalysis and Kinetics (second edition); I Chorkendorff, JW Niemantsverdriet
Approximately 85-90% of the products of the chemicals industry and 20% of all industrial products are made via a catalytic process

Catalysts and metal recycling Chemicals
11
Catalysts: an integral part of chemicals production
Catalysts accelerate reactions and thus enable industrially-important reactions to be carried out efficiently under conditions that are attainable practically. Very often, catalytic routes can be designed such that raw materials are used efficiently and waste production is minimised. Consequently, the chemicals industry is largely based upon catalysis: roughly 85-90% of all products are made via catalytic processes and this percentage is increasing steadily.
In developed countries, demand growth is driven mostly by legislative changes, while economic growth is the major source in emerging and developing countries. While emissions standards and environmental norms are becoming stricter in developed countries, growth in vehicle production and fuel consumption as well as growth in chemicals production are the key drivers in emerging markets.
The table below describes the main types of catalyst and the companies which specialise in their production.
Key process catalyst types
Reaction Catalysts Company
Catalytic cracking of crude oil (FCC) Zeolites W.R. Grace, BASF, Albemarle, Criterion, Sud-
Chemie, JGC catalysts
Hydrotreating the crude oil Co-Mo, Ni-Mo, Ni-W
W.R. Grace Albermarle, Criterion, BASF
(Engelhard), Chevron Phillips, Criterion, Nikki-
Universal, Axens
Polymerization of olefinsCr, TiClx/MgCl1, Ziegler
catalysts
Albemarle, W.R. Grace, LyondellBasell, Air
Products, BASF, Dow, ExxonMobil, Evonik,
N.E. Chemcat, Nippon shokubai, Sud Chemie
Ethylene epoxidation to etylene oxide Ag Nippon Shokubai
Ammonia, Hydrogen, syngas and Methanol
productionPt-Rh, Fe, Cu-ZnO, Ni JMAT, Criterion, BASF, Sud chemie
Hydrogenation of vegetable oils, oleochemicals
and oxoalcoholsNi JMAT, BASF
Sulfuric acid V Nippon Shokubai
Oxidation of CO & hydrocarbons (car exhaust) Pt, PdJMAT, BASF, Umicore, Catalar, N.E. Chemcat,
Nippon Shokubai
Reduction of Nox (in exhaust) Rh, vanadium oxide JMAT, BASF, Umicore, Catalar
Coal to liquids, Gas to liquids Fischer-Tropsch Albermarle, BASF, JMAT, Criterion
Hydrogenation and oxidation Ni, Pt, Pd, Cu Johnson Matthey, BASF, Evonik, Sud Chemie
Silicon curing Pt BASF, W.R. Grace
Pharmaceuticals Chiral catalysts (Pd, Cu, Ni) JMAT, N.E. Chemcat, BASF
Petroleum desulfurization Ni, Co-Mo, Ni-MoNikki-Universal, Sud-chemie, Albermarle,
Axens, Criterion Source: Company data, Berenberg research
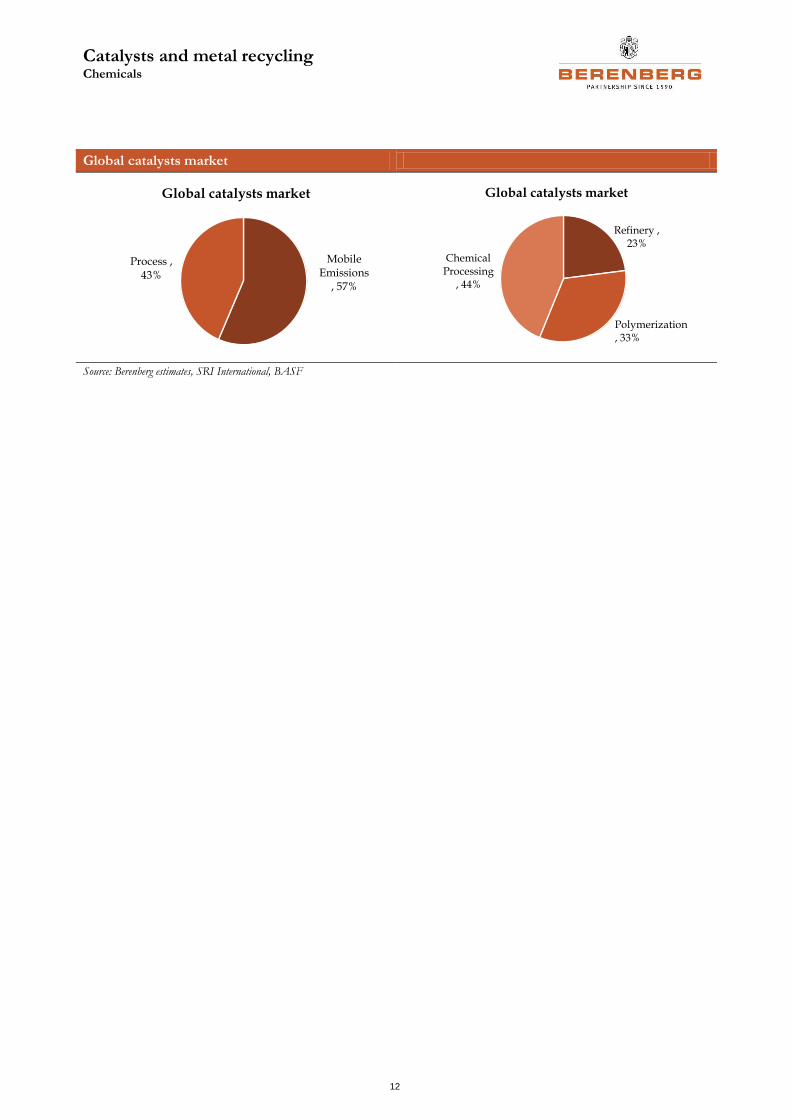
According to SRI International, the value of the mobile emissions catalysts market, including metals, is $16.9bn and the value of the process catalysts market is $13bn.
Catalysts reduce the costs of the processes for which they are used. They are often critical to the production process and provide a competitive advantage to the technology owner
Catalysts and metal recycling Chemicals
12
Global catalysts market
Mobile Emissions
, 57%
Process , 43%
Global catalysts market
Refinery , 23%
Chemical Processing
, 44%
Global catalysts market
Polymerization, 33%
Source: Berenberg estimates, SRI International, BASF

Catalysts and metal recycling Chemicals
13
Process catalysts
Catalysts for refineries represent approximately 23% of process catalysts, with catalytic cracking the largest segment within refining, followed by hydrotreating, reforming and hydrocracking.
Polymerisation catalysts represent 33% of the total market for process catalysts. Major market sub-segments include polyethylene, polypropylene, polyethylene terephthalate, polyvinyl chloride and polystyrene. Polyolefin catalysts are the largest category, accounting for a 60% share of the sub-segment.
The chemicals processing segment represents 44% of the process catalysts market and includes organic synthesis, oxidation/ammoxidation, hydrogen/ammonia/ methanol synthesis and hydrogenation/dehydrogenation. The markets for most of these chemicals have faced slow growth in the last five years. However, growth in the market for catalysts (ex-metals) has been 1.5-2x higher than that of the underlying chemicals due to the following trends:
the need to adapt to new feedstocks (for instance, renewable fuels require a different type of catalyst);
the use of higher-performing catalysts to achieve higher process yields – as well as to prolong catalyst life – favourably affects product mix;
gas-to-liquids and coal-to-liquids;
the development and commercialisation of chiral catalysts for selective hydrogenation to produce fine chemicals/pharmaceuticals for aroma and agrochemicals;
changes in legislation: stricter environmental requirements resulting in higher volumes of catalysts; and
a reduction in the quantity of high-value metals in the catalyst without sacrificing process yields.
We mentioned various players in the process catalysts market in the table above. There are several business models.
Captive manufacturers: as catalysts are critical for the production process, their technology is often highly proprietary in nature. The captive manufacture of catalysts is dominated by large chemicals manufacturers and petroleum refiners that possess both the sophisticated technology and the capital needed to finance expensive catalyst and process development programmes. Companies may also contract with catalyst manufacturers to produce the catalysts they need under secrecy agreements (for example, Exxon, BASF, Chevron, Albemarle etc).
Dedicated catalyst manufacturers, specialised in certain product groups (for example, Criterion).
Companies with divisions specialised in the manufacture of certain types of catalyst (for example, Johnson Matthey, Süd-Chemie).
The process catalysts segment is growing substantially faster than the underlying industries due to constant innovation, which helps client companies save money and allows catalyst producers to charge a premium for their products. R&D can range from 4% of sales for a company producing general-purpose catalysts to 10% of sales for a company which is highly specialised.
Technology-based M&A and technical alliances with client industries are quite common.
Refining catalysts have the largest share by volume, but the smallest by value. Chemical catalysts are highest in value
The market for chemical catalysts has grown 1.5-2x faster than the underlying chemicals markets
As catalysts are critical for the production process, their technology is often proprietary in nature
As innovation is one of the key growth drivers in the process catalysts industry, R&D can reach 10% of the producer’s sales

Catalysts and metal recycling Chemicals
14
The major players in the refinery catalysts business are global companies. Refinery catalysts are characterised by high volume but lower added-value. Customer loyalty is relatively low and competition among the various players is stiff.
In chemical catalysts, the level of specialisation and customer loyalty is higher as changing catalyst supplier is a lengthy and expensive process, which involves extensive testing. Adoption of the new products is normally driven by the improvement in process performance and not by price competition. Adoption is heavily dependent on the supplier’s reputation, depth of expertise and customer relationship. Catalyst companies usually do not reimburse their customers for the losses associated with off-spec products if the catalyst does not perform according to its specification. As potential losses for the customer can be considerable, reliability is one of the key factors during the choice of supplier and technological barriers to entry are high in the industry.
One of the key differences between automotive and process catalysts is the greater predictability of earnings in the case of process catalyst suppliers. Automotive catalysts are placed into the exhaust pipe of the vehicle at the moment of vehicle production and serve throughout the entire life of the vehicle. Process catalysts should be replaced regularly. For instance, Johnson Matthey states that the lifetime of the catalysts in its methanol, ammonia and hydrogen business is three years, after which replacement is required. As no incremental R&D costs are required for the replacement catalysts, replacement revenues are extremely important in terms of the overall profitability of process catalyst producers. They also provide good visibility on future earnings.
Process catalysts at Johnson Matthey
Johnson Matthey’s process catalysts business comprises various types of chemical catalysts. It includes base metal catalysts such as nickel, copper and cobalt for the production of syngas, ammonia, hydrogen, methanol, formaldehyde, oleo chemicals, oxo-alcohols, gas-to-liquids, coal-to-liquids and additives for refining. It also includes Davy Process Technology, which provides licences and know-how for the use of advanced process technologies related to the manufacture of oil and gas and petrochemicals.
In its Fine Chemicals division, Johnson Matthey manufactures base and precious metal catalysts for the fine chemicals and pharmaceuticals industries.
Johnson Matthey does not have direct exposure to high-volume but low-value refinery and hydrotreating catalysts, but concentrates instead on the higher-value, higher-margin field of process catalysts – catalysts for chemical processes. Not only do chemical catalysts often command a higher premium, but their markets have also demonstrated consistently high growth rates.
Johnson Matthey is not in the mainstream refinery catalysts business (such as fluid catalytic cracking – FCC – and hydroprocessing), but it has a leading position in the supply of hydrogen catalysts. Hydrogen is used by the refiners to remove sulphur and improve the quality of fuels. According to our estimates, Johnson Matthey commands a 35-40% market share in hydrogen catalysts (key competitors include Süd-Chemie, BASF and Chinese companies which sometimes satisfy local needs).
In November 2010, Johnson Matthey bought Intercat, a supplier of specialty additives to petroleum refining, further increasing its exposure to the petroleum refining industry. Johnson Matthey is also a major supplier of catalysts for the removal of impurities such as benzene from refinery streams, environmental catalysts for the destruction of volatile organic compounds and the removal of
As off-spec products resulting from faulty catalysts can cause substantial financial losses for the client, the technological barriers to entry in the industry are high
Automotive catalysts are not replaced during the lifetime of the vehicles. Process catalysts should be replaced regularly, which gives much better visibility to catalyst producers
Johnson Matthey makes catalysts for the production of syngas, ammonia, hydrogen and methanol

Catalysts and metal recycling Chemicals
15
organic impurities from caustic streams.
Johnson Matthey has a market share in catalysts for ammonia production of around 30% and in catalysts for methanol production of around 45%. Süd-Chemie is among its main competitors in these areas.
Recently, Johnson Matthey further increased its exposure to the methanol chain by acquiring Formox. The latter is a leading global provider of catalysts, plant designs and licences for the manufacture of formaldehyde. Currently, around 32% of the methanol produced globally is consumed in the production of formaldehyde. The main use of formaldehyde is as a component of resins, which are used in wood adhesives for plywood, particleboard and other reconstituted or engineered wood products. Formaldehyde is also used as a raw material for plastics, elastomers, paints, foams, polyurethane and automotive products. Formox developed a range of metal-oxide-based catalysts for the production of formaldehyde from methanol as well as licensing the technology.
Davy Process Technology increased its sales from £44m in 2009 to £100m in 2012. It won a consistently increasing number of contracts for methanol, oxo-alcohols, syngas and specialty chemicals plants, especially in China. The business is now seeing large chemicals and coal companies placing repeat orders for new plants.
Davy Process Technology growth
Source: Johnson Matthey Annual Report 2011-12
Johnson Matthey’s battery technologies business was formed after the acquisition of Axeon in 2012 and specialises in the design, development and manufacture of integrated battery systems. The business is focused on developing advanced technologies and materials to meet the requirements of high-performance battery applications, such as automotive, e-bikes and power tools.
As we stated above, growth in the chemical catalysts market is 1.5-2x higher than the growth in the underlying chemicals industries. In order to understand the growth outlook for Johnson Matthey’s Process Technologies division, we therefore look at various customer industries.
We expect the growth of Johnson Matthey’s process catalysts business to be 1.5-2x higher than the growth of the underlying industries

Catalysts and metal recycling Chemicals
16
Refining industry
Refinery catalyst production was traditionally a growth business, but in recent years the market has reached maturity in developed countries. Taking into account the wider macroeconomic climate, refinery infrastructure investment continues to face severe challenges in developed regions. Major growth is occurring in developing countries, especially in Asia and the Middle East. Among Asian countries, China is the largest consumer of catalysts, with high growth rates.
Currently, there is refining overcapacity in Europe and North America. In its Statistical Review of World Energy, BP confirmed that in 2010 production in non-OECD countries overtook that in OECD countries for the first time. China accounts for 85-90% of global refining capacity growth. PetroChina states that, while at present a net importer of crude oil, China is determined to become self-sufficient in refining. By 2015, Chinese oil companies aim to boost domestic capacity by 25% to 15mbpd. Growth in India is also expected to remain very strong, albeit the initial base is much smaller. At the 20th World Petroleum Congress, the Indian minister for petroleum and natural gas announced that his country would increase investment in refinery infrastructure. Current refinery capacity in India is 193m mta (metric tonnes annually); by 2014 the target is to raise this to 240m mta. The Indian government plans to reach domestic self-sufficiency by 2020. Brazilian consumption of petroleum products has more than doubled from 1998 to 2009, but refinery capacity stayed flat; Brazil is actively looking at enhancing downstream investment. Additionally, producers in Qatar and Saudi Arabia are targeting not only their respective local markets, but also Southeast Asian ones (for example, the Dow project in Saudi Arabia).
Global refinery capacity growth
-8%-6%-4%-2%0%2%4%6%8%
10%12%14%
1965
196
7
196
9
197
1
197
3
197
5
1977
197
9
198
1
198
3
198
5
198
7
198
9
199
1
199
3
199
5
199
7
1999
200
1
200
3
200
5
200
7
200
9
201
1
global growth OECD growth Non-OECD growth
Source: BP Statistical Review of World Energy 2013
In the last 10 years, global refinery capacity growth averaged 1% per year, with no overall growth in OECD countries and 2% growth in non-OECD countries. We expect global growth to slow in the next five years, as OECD countries will continue to struggle with overcapacity and cheaper alternative sources will take market share from oil (biofuels, natural gas liquids, liquids derived from gas and coal).
Hydrogen consumption growth
We expect hydrogen demand to grow at a much higher rate than refining capacity – 6-8% per year as demand increases, particularly in Asia. According to SRI
Refinery infrastructure investments continue to face severe challenges in developed jurisdictions. The major growth is occurring in developing countries, especially Asia and the Middle East
China accounts for 85-90% of global refining capacity growth

Catalysts and metal recycling Chemicals
17
International, China represents around 23% of global hydrogen consumption and we expect this will reach 30% by 2015.
Key drivers of growth in hydrogen consumption include:
tighter limits on the sulphur content in fuel;
the development of gas- and coal-to-liquids technologies; and
the use of methanol as a fuel.
Worldwide environmental regulations now mandate the production of cleaner fuels. Consequently, refiners are experiencing severe pressure from market forces that demand a change in the product mix, aside from quality (eg the production of low-sulphur fuel). On the regulatory side, stringent product specifications limit sulphur content and determine gasoline and diesel composition. Major technological challenges to refining include the achievement of “zero” or heavily-reduced sulphur content in all types of fuel in almost all countries around the world.
As the global refining industry moves towards cleaner fuels, refiners find themselves being squeezed in terms of hydrogen availability and octane requirements. Gasoline desulphurisation technology has thus advanced to limit hydrogen consumption.
On the diesel side of the clean fuels challenge, a significant increase in hydrogen consumption is forecast to obtain ultra-low-sulphur diesel (ULSD) from straight-run and cracked stocks containing refractory sulphur species.
Catalytic reforming is the technology of choice for the production of high-octane gasoline and is usually the main source of refinery hydrogen. Catalytic reforming and isomerisation continue to grow because of their role in removing lead from gasoline in the developing world. Hydroprocessing is probably growing the fastest, in response to the requirement for lower sulphur levels in gasoline and diesel. Johnson Matthey is one of the leaders in hydrogen catalysts for hydroprocessing, so we expect strong growth in this area to continue.
Gas-to-liquids and coal gasification projects all require extremely large quantities of hydrogen and will boost the size of the market considerably in the next five years.
A surge in hydrogen consumption is also expected as a result of growth in the manufacture of methanol. Substantial consumption of methanol as a direct fuel (ie as motor gasoline) is expected in countries such as China, Russia, South Africa, Venezuela and several Middle Eastern countries.
The main growth in hydrogen consumption is expected to come from China for two reasons: the country is experiencing the strongest growth in auto production as well as changes in environmental legislation.
Johnson Matthey is one of the leaders in hydrogen catalysts for hydroprocessing
The main growth in hydrogen consumption is expected to come from China for two reasons – highest growth in auto production and changes in environmental legislation

Catalysts and metal recycling Chemicals
18
China diesel fuel quality roadmap
Stage Standard Maximum sulphur
level (ppm) Date Standard
Issued Date standard Implemented
- GB 252-2000 2000 27 Oct 2000 1 Jan 2002
- GB/T 19147-2003 500 (voluntary) 23 May 2003 1 Oct 2003
China III GB 19147-2009 350 12 Jun 2009 Phased-in 1 Jan 2010-1 Jul 2011
China IV GB 19147-2013 50 7 Feb 2013 Phased-in by 31
Dec 2014
China V TBD 10 Before 1 Jun 2013 Phased-in by 31
Dec 2017
Source: The International Council on Clean Transportation
China was supposed to implement the China IV (Phase IV) fuel standard in January 2010; however, this was delayed until 2014. China has set a deadline for the Phase IV standard for gasoline to be adopted nationwide by January 2013, and that
for diesel to be adopted by the end of 2014. Delays in the implementation of emissions legislation are not unique to China. The other three BRIC countries (Brazil, Russia and India) have all seen similar delays. The reason for the delay in each case is a recurring theme: the lack of low-sulphur fuel. The successful implementation of advanced diesel after-treatment technologies relies on the availability of low-sulphur diesel. It was originally agreed that 350ppm-sulphur diesel should be made available nationwide in 2010. However, the implementation of low-sulphur fuel was delayed until summer 2011. Yet even now, after almost four years, we are not sure it is available nationwide.
The main issue lies in the costs associated with upgrading diesel refineries and the distribution of this type of diesel. Chinese diesel prices are regulated by the government and refiners were not certain that they would be able to recover the incremental costs. The additional cost is estimated at CNY150-250/mt ($24-40/mt) compared with Phase III gasoline, with the construction cost of a gasoline hydrogenation unit estimated at around CNY200m-300m.
However, as the transition deadline was finally approved in 2012, refineries were given a year to transition to the new legislation. Recently, Sinopec’s chairman, Fu Chengyu, said that the company would complete the upgrade of desulphurisation facilities at its refineries by the end of 2013, and start producing gasoline and diesel that meet the national Phase IV emissions standard from 2014.
Johnson Matthey has a very strong presence in Asia and good relationships with major industrial gas companies that supply hydrogen to petroleum refineries, so in our view it should experience very strong growth in hydrogen catalysts in the next three years.
We expect the use of hydrogen catalysts to grow at a faster rate than hydrogen consumption – 10-12% per year for the next three years.
Ammonia consumption growth
Johnson Matthey is one of the leading producers of the catalysts for ammonia production, along with Süd-Chemie. We are slightly less optimistic about developments in the market for ammonia, but still assume average annual growth of 5-6% for the catalysts.
According to Yara, global ammonia production grew at an average annual rate of 2.6% in 2001-11.
We expect the use of hydrogen catalysts to grow at a faster rate than hydrogen consumption – 10-12% per year for the next three years
China was supposed to implement the China IV fuel standard in January 2010; however, this was delayed until 2014 because of the lack of low-sulphur fuel
Johnson Matthey is one of the leading producers of the catalysts for ammonia production along with Süd-Chemie

Catalysts and metal recycling Chemicals
19
Global ammonia production growth
Million tonsTotal production
2001 2002 2003 2004 2005 2006 2007 2008 2009 2010 2011
60
80
100
120
140
160
180
Source: Yara Fertiliser Industry Handbook, December 2012
We expect this trend to continue; however, we expect ammonia capacity additions to outpace supply and production growth. Capacity is expected to increase in China and in areas where the availability and cost of natural gas is lower, such as the Middle East, North Africa and North America. In 2013-15, the International Fertiliser Association expects global capacity ex-China to grow in line with demand (ie by around 3% per year); however, Chinese capacity is expected to grow by 8% per year. Beyond 2015, various North American capacities should come onstream; almost 8m tonnes pa of nitrogen capacity is expected to start up in 2015-18. However, rising construction costs can cause delays to these projects – Agrium recently postponed its $3bn greenfield nitrogen project and Yara postponed its capacity upgrade in Belle Plaine, Canada.
We expect global capacity growth in ammonia to reach 3.5% per year in the next five years and the production of ammonia catalysts to grow at 5-6%.
Methanol consumption growth
Süd-Chemie is one of Johnson Matthey’s key competitors in methanol catalysts. It not only manufactures catalysts for methanol production, but also has the also technology for converting methanol to propylene.
Methanol is a versatile liquid chemical produced primarily from natural gas (in China, from coal) and used as a chemical feedstock in the manufacture of a wide range of consumer and industrial products such as building materials, foams, resins and plastics. The fastest-growing markets for methanol are in the energy sector, which today represents one-third of methanol demand.
Methanol is used to produce methyl tertiary-butyl ether (MTBE), a gasoline component, and there are growing markets for using methanol in olefins production and energy applications such as direct blending into transportation fuels, dimethyl ether (DME) and biodiesel.
Demand for methanol is driven primarily by levels of industrial production, energy prices and the strength of the global economy.
Methanex expects methanol demand to grow at a 7.6% CAGR during 2012-16, driven mainly by energy applications.
We expect global capacity growth in ammonia to reach 3.5% in the next five years and ammonia catalysts to grow at 5-6%
Demand for methanol is driven primarily by levels of industrial production, energy prices and the strength of the global economy

Catalysts and metal recycling Chemicals
20
Uses and growth of methanol
Source: Methanex Investor Presentation, May 2013
China has now become the world’s leading consumer of methanol and should account for 80% of demand growth through at least 2016. China’s rapid increase in consumption is attributable to its expanding industrial markets, as well as soaring gasoline demand. Traditional, chemical derivative-based methanol demand in China has seen robust growth over the past decade on the back of China’s strong economic expansion, particularly in the industrial and construction sectors. However, future methanol consumption growth in China will likely be driven by the adoption of methanol as an alternative transportation fuel, among other emerging energy applications.
Methanol usage as a fuel
Source: Methanex Investor Presentation, May 2013
We expect the market for methanol catalysts to grow at 10-11% per year in the next five years. Johnson Matthey commands a 45% market share and is well positioned to capture this growth with Apico catalysts and technology.
China has now become the world’s leading consumer of methanol and should account for 80% of demand growth through at least 2016
We expect the market for methanol catalysts to grow at 10-11% per year over the next five years

Catalysts and metal recycling Chemicals
21
GTL, MTO, CTL etc
Gas-to-liquids (GTL) and coal-to-liquids (CTL) processing is an emerging area for catalysts. The growing requirements for ULSD fuel and the not-insignificant investment required by refiners to meet the new fuel specifications in Europe and elsewhere have pushed GTL technology to the forefront of development efforts. One key advantage of GTL processes is that they provide clean fuels. Companies such as Chevron, ExxonMobil, Sasol, Shell, Albemarle, BASF, Süd-Chemie and Johnson Matthey (via Davy Process Technology) are active in liquid fuel synthesis.
China is short of natural gas. As part of the country’s effort to reduce its dependence on crude oil and utilise cheaper feedstock costs, there are several coal-based projects under development in China. The majority of capacity expansion plans in petrochemicals announced beyond 2015 are China’s coal-to-olefins (CTO), methanol-to-olefins (MTO) and US-gas-based cracker projects.
However, we do expect certain difficulties in the development of these projects. Recent cost inflation has contributed to the cancellation or postponement of certain gas-based projects in North America; in China, MTO projects face multiple hurdles, such as lack of infrastructure, water consumption and high carbon emissions.
Johnson Matthey expects double-digit annual growth in these types of project in the next five years, but we are more cautious due to the challenges mentioned above – we think the growth will reach 7-8% per year.
Johnson Matthey is strongly positioned in the sector. Davy Process Technology (which Johnson Matthey acquired from Yukos for $71m in 2006 and which now has sales of $150m) provides licences and know-how to operate advanced process technologies related to oil and gas, MTO and CTL.
One key advantage of GTL processes is that they provide clean fuels
The majority of capacity expansion plans in petrochemicals announced beyond 2015 are China’s CTO, MTO and US-gas-based cracker projects
We think growth in GTL, MTO and CTL projects will reach 7-8% per year in the next five years

Catalysts and metal recycling Chemicals
22
Automotive catalysts
Emissions control catalysts represent c43% of the global catalysts market. We focus on emissions control catalysts for mobile sources, as stationary catalysts do not represent a large part of Johnson Matthey’s or Umicore’s business.
Technology
Emissions control catalysts for mobile sources are based on PGMs that convert vapour emissions into carbon dioxide, nitrogen and water. The catalyst can simultaneously oxidise carbon monoxide and hydrocarbons to carbon dioxide and water while reducing nitrogen oxides to nitrogen.
Automotive catalysts typically consist of a coating of PGMs on a substrate. The earlier oxidation catalysts used only platinum and palladium, but the newer three-way catalysts use various combinations of platinum, palladium and rhodium.
As an automotive catalyst serves throughout the life of the vehicle, its internal surface area is very large. In an average catalytic converter, the internal surface area of the substrate is equal to the size of a typical office and the internal area of the catalyst is equal to the size of three football fields.
During the manufacture of the catalytic convertor, ceramic monoliths are first treated with a wash that consists of alumina with additions of rare earth oxides to increase their surface area. The monoliths are subsequently coated with PGMs.
Structure and production process of automotive catalysts
Source: Johnson Matthey
The properties of automotive catalysts include the following.
Engine size and catalyst volume/weight are fairly proportional. Engine sizes, however, cover a wide range – from about 0.5 to six litres for passenger cars, to three to 18 litres for trucks and buses. An internal combustion engine, regardless of whether gasoline- or diesel-fuelled, requires a catalyst volume of about the same size as the engine.
Four-cylinder engines are equipped with one or two bricks, while large engines utilise more bricks.
Fuel specifications and emissions standards vary from region to region and may require different catalysts for the same auto platform.
Catalyst design, volume and precious metal content differ according to car manufacturer, region of application, engine type and year of production.
Emissions control catalysts represent c43% of the global catalysts market
Emissions control catalysts for mobile sources are based on PGMs that convert vapour emissions into carbon dioxide, nitrogen and water
For an average catalytic converter, the internal surface area of substrate is equal to the size of typical office and internal area of the catalyst is equal to the size of three football fields
Catalyst design, volume and precious metal content vary according to car manufacturer, region of application, engine type and year of production

Catalysts and metal recycling Chemicals
23
Key emissions categories
Carbon dioxide (CO2): an inevitable product of burning a fuel which contains carbon (as all petroleum products do). CO2 does not pollute the air we breathe, but is a main contributor to global warming and therefore has to be reduced.
Carbon monoxide (CO): produced when a carbon-based fuel is burned incompletely. In high concentrations it is poisonous and has to be controlled. It can be reduced by more efficient combustion in the engine (so that CO2 is produced instead of CO) and further reduced by oxidising after combustion, in a catalytic converter.
Hydrocarbons (HC): also known as volatile organic compounds (VOCs), these are really unburned fuel. They can be problematic for individuals with breathing difficulties and can contribute to photochemical smog in certain climatic conditions. They can be reduced by more efficient combustion in the engine and further reduced by oxidising after combustion, in a catalytic converter.
Oxides of nitrogen (NOx): produced when air (which is mainly a mixture of nitrogen and oxygen) is heated, as it is in an engine. NOx is a contributor to both photochemical smog and acid rain and can be an irritant to the lungs. Unlike CO and HC, it cannot be removed by oxidation. The opposite process – the removal of oxygen (known as reduction) – is necessary to convert it back to nitrogen and oxygen.
Particulate matter (PM): very small particles, mostly of unburned carbon.
Main chemical pathways catalysed by an after-treatment system
NO, NO2 N2
CO CO2
Hydrocarbons CO2, H2O
Particulate matter
(mainly carbon)
CO2
Source: Umicore
Why do diesel and gasoline automotive catalysts differ?
Gasoline The amounts of air and fuel burnt in a gasoline engine are usually in chemical balance, there being no excess of either.
Under these conditions, and at the quite high temperatures (350-750°C) of the gasoline exhaust gas, platinum and/or palladium oxidise the pollutants CO and HC, while rhodium catalyses the reduction of NOx (nitric oxide and nitrogen dioxide) to nitrogen.
Automotive companies therefore use catalysts containing platinum and rhodium, palladium and rhodium, or a mixture of all three to meet current gasoline vehicle emissions regulations. These catalytic converters are known as three-way catalysts because they efficiently and simultaneously convert the three pollutants to harmless gases.
Gasoline cars use platinum-, palladium- and rhodium-based three-way catalysts

Catalysts and metal recycling Chemicals
24
Three-way catalyst
Source: Umicore
Diesel By contrast, a diesel engine always operates with a large excess of air (the air-to-fuel ratio is 30:1) and has excess oxygen in its exhaust. An additional complication comes from the operating conditions of diesel engines, which result in low exhaust gas temperatures (120-350°C). Standard three-way catalysts cannot reduce NOx in such a system. Also, the large quantities of particulates emitted by diesel engines can foul existing gasoline-fuelled automobile catalysts, rendering them useless for reducing the levels of other components.
Only platinum- and palladium-based catalysts are able to deliver the required performance under these operating conditions. The low temperature of diesel engine exhaust gas also means diesel oxidation catalysts may have to contain higher loadings of metal than their gasoline equivalents to achieve the necessary conversions of HC and CO.
Catalytic technologies for diesel engines
A diesel oxidation catalyst (DOC) is the key technology for diesel engines. It is used to oxidise HC and CO in the exhaust stream to CO2 and water. All new diesel engines mounted in passenger cars, light-duty and heavy-duty trucks and buses in Europe and North America are now equipped with DOCs.
Improved engine control and combustion engineering can substantially reduce the formation of PM and reduce NOx emissions. These include the use of very high-pressure fuel pumps in sophisticated direct injection systems, which precisely control the volume of fuel injected into the cylinder and produce a finely-atomised spray. The delivery of fuel at very high pressure leads to a lower average combustion temperature that moderates the formation of NOx. To remove the remaining NOx from the exhaust, manufacturers utilise selective catalytic reduction (SCR).
A diesel engine operates with a large excess of air and a low exhaust gas temperature. Standard three-way catalysts cannot be used in diesel engines
A diesel oxidation catalyst is the key technology for diesel engines

Catalysts and metal recycling Chemicals
25
SCR
Source: Johnson Matthey
SCR was originally introduced in stationary power plants, but it is now fitted to most new heavy-duty (ie truck and bus) diesel engines in Europe and the US. In an SCR system, urea (for example, AdBlue, a trademark used by Yara) is sprayed from a separate tank into the exhaust stream ahead of the SCR catalyst. The nature of the diesel combustion process results in the formation of PM, or “soot”. The diesel particulate emissions problem is being addressed by the use of diesel particulate filters (DPFs).
DPF
Source: Turbopacs
Wall flow filters are the most common type of DPF. In these filters, PM is removed from the exhaust by using a honeycomb structure similar to an emissions catalyst substrate but with the channels blocked at alternate ends. The exhaust gas is thus forced to flow through the walls between the channels and the PM is deposited on the walls. Such filters are made of ceramic (cordierite, silicon carbide or aluminium titanate) materials. Diesel partial-flow filters normally use a metallic substrate. The metallic partial-flow filter uses a special perforated metal foil substrate with a metal “fleece” layer, so that the exhaust gas flow is diverted into adjacent channels and the particles are temporarily retained in the fleece before being burnt by a continuous reaction with the nitrogen dioxide (NO2) generated by an oxidation catalyst located upstream in the exhaust.
A catalysed diesel particulate filter (CDPF) or catalysed soot filter (CSF) may also be used. Traditional DPF systems consist of a filter material positioned in the exhaust designed to collect solid and liquid PM emissions while allowing the exhaust gases to pass through the ceramic walls. CDPFs are designed not only to
SCR was originally introduced in stationary power plants, but it is now fitted to most new heavy-duty diesel engines in Europe and in the US
The diesel particulate emissions problem is being addressed by the use of DPF
CDPFs are designed not only to achieve collection efficiencies of 90% or greater in terms of mass, but also to burn off the collected particulate matter into carbon dioxide and water

Catalysts and metal recycling Chemicals
26
achieve collection efficiencies of 90% or greater in terms of mass, but also to burn off the collected particulate matter into carbon dioxide and water.
CDPF
Source: Johnson Matthey
Johnson Matthey was the first to introduce and patent the CRT – continuously regenerating trap. It is now the most widely used DPF in the world. It involves the oxidation of nitric oxide (NO), which is already present in the exhaust gas, to NO2 over a platinum-based catalyst. The NO2 produced is a much more powerful oxidant than oxygen, and it starts to burn PM at temperatures as low as 250°C (the technology has already gone off-patent). It was a very successful product and allowed Johnson Matthey to gain considerable market share in diesel vehicle catalysts (both in light- and heavy-duty).
CRT
Source: Johnson Matthey
CCRT is catalysed CRT. The oxidation catalyst removes CO and HC and oxidises some of the NO in the exhaust gases to NO2. This NO2 then reacts with the PM trapped in the filter, producing NO and CO2. Some of the NO is then re-oxidised to NO2 in the filter, then reacts with more trapped PM. This enables the system to regenerate in applications with very low exhaust gas temperatures or low NOx:PM ratios in the exhaust gases.

Catalysts and metal recycling Chemicals
27
CCRT
Source: Johnson Matthey
Fuel properties
The quality of the fuel used can assist or degrade the performance of emissions control systems. Sulphur in gasoline (or petrol) and diesel fuel has a major negative impact on catalyst performance and in diesel also contributes to the mass of PM. Sulphur competes strongly against pollutants for space on the catalyst surface and thus limits the efficiency of catalyst systems to convert pollutants at any sulphur concentration. Sulphur is a naturally-occurring component of crude oil and is found in both gasoline and diesel. When these fuels are burned, sulphur is emitted as sulphur dioxide (SO2) or sulphate PM. SO2 has been recognised for decades as a major cause of the acid rain and air pollution that affect urban and industrial areas. More recently, it has been recognised that CO2 emissions contribute to the formation of secondary inorganic aerosol gases, fine particles that are harmful to human health.
Increasingly stringent controls on vehicle emissions led petroleum refiners to produce fuels which meet both reformulated gasoline and low-sulphur fuel mandates. These fuels, in combination with emissions control catalysts and engine developments, have enabled the transportation industry to manufacture products that meet government emissions targets.
Global legislation
Air pollution can cause a number of health problems, so various countries have taken policy actions in order to reduce it.
Regulatory authorities in the EU, US and Japan have been under pressure from engine and fuel manufacturers to harmonise worldwide emissions standards, in order to streamline engine development and emission-type approval/certification for the different markets. European standards for emissions control represent the most popular set of standards and are followed by many countries in various parts of the world. The majority of emerging economies are adopting the latest set of Euro emissions and fuel standards, while some smaller nations still comply with an older set of regulations.
The quality of the fuel used can assist or degrade the performance of emissions control systems
Increasingly stringent controls on vehicle emissions led petroleum refiners to produce fuels which meet both reformulated gasoline and low-sulphur fuel mandates
European standards for emissions control represent the most popular set of standards and are followed by many countries in various parts of the world

Catalysts and metal recycling Chemicals
28
Global emissions legislation
Source: Umicore
LDV legislation In most regions, standards apply to all vehicles, regardless of the fuel they use. Gasoline, diesel or alternative-fuel vehicles must therefore all meet the same emissions standards. These standards are defined in grams of regulated emission per mile or kilometre driven. Thus, for similar vehicles with different-sized engines, the vehicle with the larger engine must use more advanced and expensive emissions control technology than the vehicle with the smaller engine, in order to meet the emissions standard.
US
In general, the US has the most advanced regulation in the area of emissions control.
In LDVs, US legislators pay more attention to NOx emissions control than CO2. The chart below shows that US requirements allow for 220 grams of CO2 per kilometre (g/km) and European requirements are close to 120g/km. On the other hand, European NOx emissions standards are more relaxed (the US EPA Tier 2 NOx limit is 44mg/km). This is caused by the need to control NOx emissions without sacrificing the comparatively low fuel consumption of diesel engines.
Global CO2 emissions norms
Source: The International Council on Clean Transportation
In general, the US has the most advanced regulation in the area of emissions control

Catalysts and metal recycling Chemicals
29
Europe
Europe is the only region (except India) where the share of diesel as a fuel is high (it varies between 49% and 54%).
Since the Euro II stage, EU regulations have introduced different emissions limits for diesel and gasoline vehicles. Diesel engines must conform to more stringent CO standards but are allowed higher NOx levels. Gasoline vehicles had been exempt from PM standards through the Euro IV stage.
Euro V introduced PM mass emissions limits for gasoline cars (equal to that of diesel) and a 25% reduction in NOx emissions limits from 80mg/km to 60mg/km. The Euro V PM emissions standards require the use of particulate filters on all diesel cars (the use of filters on Euro IV cars was mostly voluntary).
The Euro VI standards, which will come into effect in 2014, will further tighten the NOx standards for diesel cars and light commercial vehicles by about 55% relative to the Euro V limits.
Japan
All passenger cars and light-duty trucks produced in Japan are equipped with three-way catalysts. New standards came into force in 2009 that added the regulation of PM for gasoline-powered vehicles and further reduced NOx and PM levels for diesel-powered vehicles.
China
Phase III of China’s emissions regulation was introduced in 2007; the requirements are similar to the Euro III legislation. China was supposed to implement the Phase IV (similar to Euro IV) fuel standard in January 2010; however, this was delayed until 2014. China set a January 2013 deadline for the Phase IV standard for
gasoline to be adopted nationwide, and that for diesel by the end of 2014. The reason for the delay is the lack of low-sulphur fuel. The successful implementation of advanced diesel after-treatment technologies relies on the availability of low-sulphur diesel. It was originally agreed that 350ppm-sulphur diesel should be made available nationwide in 2010.
The table below shows the current standards and prospective changes in legislation for LDVs in various regions.
Europe is the only region (except India) where the share of diesel as a fuel is high (it varies between 49% and 54%)
China set a deadline for the Phase IV (similar to Euro IV) standard for gasoline to be adopted nationwide by January 2013

Catalysts and metal recycling Chemicals
30
Summary of the fuel emissions standards for LDV
LDV (g/km) Time frame
CO HC NOx HC&NOx PM
Europe gasoline Now 1 0.1 0.06 0.005
Europe gasoline 2014 1 0.1 0.06 0.005
Europe diesel Now 0.5 0.18 0.23 0.005
Europe diesel 2014 0.5 0.08 0.17 0.005
Japan gasoline Now 1.92 0.08 0.08 0.007
Japan diesel Now 0.84 0.032 0.2 0.01
China gasoline 2014 1 0.1 0.08
China diesel 2014 0.63 0.06 0.33 0.04
US gasoline Now 2.8 0.14 0.07 0.01 Source: Delphi Worldwide Emissions Standards, 2012-13, Berenberg research
LDV emissions standards timeline
Source: Johnson Matthey
HDD legislation Currently, pollution measurement systems vary between countries; hence the units of measurement are different, which makes it difficult to reconcile the requirements on a global basis. The other particularity of this market is that most HDD vehicles worldwide are powered by diesel engines.
US
In the US, the federal regulations do not require that the entire HDD vehicle be certified as conforming to emissions standards. The regulations instead call for the engine to meet the emissions standards. The engine systems, including emission controls, are tested under prescribed engine dynamometer cycles. As a result, the standards are expressed in terms of grams per brake horsepower-hour (g/bhp-hr).
Most HDD vehicles globally are powered by diesel engines

Catalysts and metal recycling Chemicals
31
The US has the most progressive standards in HDD with the strictest requirements regarding HC and NOx emissions as well as levels of PM in the exhaust.
In August 2011, the Environmental Protection Agency (EPA) announced the Heavy-Duty National Program to reduce greenhouse gas emissions – primarily CO2 – and establish fuel consumption standards for medium- and heavy-duty vehicles.
Europe
Europe also addressed seriously the problem of pollution from HDD. European governments use grams per kilowatt-hour as a unit for emissions control measurements.
Over time, a series of standards has been developed. Euro III limits imposed in 2000 were met with the then-current generation of diesel engines, but Euro IV limits, mainly with respect to NOx and PM, required the adoption of catalytic control.
The Euro IV standard has been applied since 2005; Euro V has been mandatory from 2008. Euro VI emissions standards, comparable in stringency to the US 2010 standards, become effective from 2013 (new-type approvals) and 2014 (all registrations). To meet the stricter Euro IV and V regulations, vehicle manufacturers have employed after-treatment technologies such as SCR or exhaust gas recirculation (EGR). The majority of manufacturers in Europe have chosen to use SCR, as this method also allows improved fuel consumption. Euro V was the main reason for starting to use DPFs.
Under Euro VI, heavy-duty vehicles will have to be equipped with DPFs to meet not only particulate mass but also particle number limits.
Japan
In 1997, the Japanese government set new guidelines that require a drastic reduction in the emission of NOx and particulates from diesel-powered vehicles. New standards came into force in 2009 and further reduced NOx and PM levels for diesel-powered vehicles. Japan uses grams per kilometre as a unit for emissions control measurements.
China
Phase IV (similar to Euro IV) is now coming into force and should gradually be implemented by January 2014. China uses grams per kilometre as a unit for emissions control measurements.
Non-road vehicle legislation North America, Europe and Japan have also established standards that apply to non-road vehicles, locomotive and marine engines. These standards are grouped in tiers according to year of manufacture and engine power.
The table below shows current standards and prospective changes in legislation for HDD and non-road vehicles in different regions.
The US has the most progressive standards in HDD with the strictest requirements regarding HC and NOx emissions as well as levels of PM in the exhaust
According to the Euro VI standard all heavy-duty vehicles will have to be equipped with DPFs
North America, Europe and Japan have also established standards that apply to non-road vehicles, locomotive and marine engines

Catalysts and metal recycling Chemicals
32
Summary of fuel emissions standards for HDD
HDD Time frame
CO HC NOx HC&NOx PM Units
Europe Now 1.5 0.46 2 0.02 (gr/KWH) Europe 2014 1.5 0.13 0.4 0.01 (gr/KWH) Japan Now 2.95 0.23 0.9 0.013 gr/km China 2014 1.5 0.46 3.5 0.02 gr/km
US Now 1.55 0.13 0.2 0.14 0.01 gr/bhp-hr Source: Berenberg research
HDD and non-road emissions standards timeline
Source: Johnson Matthey
Value components of the catalyst
The price components of a catalytic converter are shown below.
Price components of a catalytic converter
Substrate, 20%
Chemicals, 20%
Handling, 10%
PGM, 50%
Source: Berenberg research
PGM costs and the costs of the substrate are a pass-through for the catalyst producer. The chemicals portion is where the added value lies; it is the actual catalytic technology, which represents the main part of the catalyst producer’s revenue stream.
PGM costs and the costs of the substrate are a pass-through for the catalyst producer

Catalysts and metal recycling Chemicals
33
Automotive catalysts do not increase the productivity of the process as process catalysts do; however, they are nevertheless critical for auto manufacturers. A catalyst is not a major cost factor, but even slight deficiencies in catalyst performance can cause serious damage to a company’s business. Non-compliance with environmental legislation, caused by the faulty catalyst, can result in substantial financial losses for an auto manufacturer. This is what allows catalyst companies to sustain their operating margin, which is among the highest in the automotive industry.
Operating margins in the auto industry
Sub-sector Average operating margin Auto manufacturers 4.50% Tyres 10% Trunks 8% Diversified 4.50% Catalysts 10% Source: Berenberg research. Diversified includes Lear, Visteon, Johnson Controls, Magna International
Monetary value of the catalyst depends on underlying technology
An internal combustion engine – regardless of whether gasoline- or diesel-fuelled – requires a catalyst volume of roughly the same size as the engine. This means that the monetary value of the catalyst also depends heavily on engine volume. Not only does the volume of PGMs required for the production of the catalyst increase with engine volume, but so does the amount that catalyst companies charge for their services (as normally the complexity of the catalyst also increases with engine volume).
Diesel catalysts require much more sophisticated technology; hence the value of the catalyst for diesel engines is higher than that for gasoline engines. According to Johnson Matthey, a diesel vehicle currently represents 5x the catalyst value of an equivalent gasoline vehicle.
LDVs (independent of legislation and region) require three-way catalysts.
A diesel engine requires different technology depending on the country’s regulation. The chart below illustrates the various technologies used in HDD vehicles.
A diesel vehicle currently represents 5x the catalyst value of an equivalent gasoline vehicle
A catalyst is not a major cost factor, but even slight deficiencies in catalyst performance can cause serious damage to an auto company’s business

Catalysts and metal recycling Chemicals
34
HDD on-/non-road catalyst systems
Source: Umicore
Euro III limits in 2000 were met with the then-current generation of diesel engines but Euro IV limits, mainly with respect to NOx and PM, required the adoption of catalytic control.
A three-way catalyst converts NOx, HC and CO in gasoline applications and contains platinum, palladium and rhodium. Rhodium is as a rule indispensable, while platinum and palladium can be mutually substituted. This substitution effect has led to a considerable increase in the use of palladium in the automotive applications (as palladium is less expensive than platinum). Light-vehicle engine volume varies from 0.7 to four litres, whereas a heavy-duty engine varies from three to eight litres. As a result of the smaller volume and less-favourable product mix, as well as the maturity of the technology, LDV catalysts are the least profitable category for catalyst companies. However, changes in legislation still affect the value of catalyst – for instance, with Euro VI adoption in 2014 we expect the value of gasoline catalysts to increase by c15-20%.
Platinum continues to be the metal of choice for diesel applications because of its higher activity in oxidation reactions under lean conditions.
A DOC oxidises CO and HC into CO2 and H2O; it contains platinum and palladium, although the ratio can vary depending on application.
SCR, which was introduced with Euro V legislation, converts NOX into nitrogen in diesel engines with the help of NH3; it does not require PGMs (ie is PGM-free). Euro V adoption also required a DPF, which traps PM in diesel engines. DPF contains platinum and palladium; the ratio can vary, depending on application.
CDPFs are more complex and require higher PGM content. They contain palladium and platinum. We think that Euro VI legislation will increase the value of the diesel catalyst market in Europe by 2-2.5x.
The relative monetary value of the different types of catalysts is shown in the chart below (CRT is a DPF, patented by Johnson Matthey; CCRT is a CDPF).
Platinum continues to be the metal of choice for diesel applications because of its higher activity in oxidation reactions under lean conditions
LDV catalysts are a less profitable category for the catalyst companies than HDD catalysts
We think that Euro VI legislation will increase the value of diesel catalyst market in Europe by 2-2.5x

Catalysts and metal recycling Chemicals
35
Catalytic technologies for diesel and their value
Source: Johnson Matthey
Catalyst pricing
The technological component is very high in automotive catalysts. The catalyst is not a major cost factor for the auto producer, but even slight deficiencies in catalyst performance can cause serious damage to a company’s business. Non-compliance with environmental legislation, caused by a faulty catalyst, can result in substantial financial losses. Faulty catalysts can also negatively affect fuel efficiency and the functioning of the whole power train.
This gives certain pricing power to the catalyst producers. New catalysts are normally introduced with changes in legislation and producers are able to charge premiums for their products. With time, technology becomes obsolete and competition increases, which pushes the price down.
Catalyst pricing
Source: Johnson Matthey
Catalyst companies therefore need continuous changes in environmental legislation in order to maintain their pricing power.
Catalyst companies need continuous changes in environmental legislation in order to maintain their pricing power

Catalysts and metal recycling Chemicals
36
Precious and rare-earth metals
As precious metals represent around 50% of the catalyst price and the value of the catalytic technology represents only 20%, automotive catalyst producers are not exposed to precious metal price volatility.
Precious metal costs are a pass-through for automotive catalyst producers. Very often, the price of the catalyst is quoted as a certain value plus the value of PGMs at the date of sale. All the automotive catalyst producers hedge 100% of their PGM exposure. They do charge a small handling fee, which is linked to the value of PGMs, but this is insignificant.
All auto manufacturers have the ability to source precious metals directly from the suppliers. In the US, most auto manufacturers work under consignment conditions. They own the precious metals used in catalyst production and the automotive catalyst producer does not even take the PGMs onto its balance sheet.
In Europe and Asia, automotive catalyst companies do have to hold inventories of PGMs but they are 100% hedged.
With rare-earth metals, until recently the situation was different. Cerium oxide is used in three-way gasoline catalysts, chiefly for oxygen storage. As with the majority of rare-earth metals, China is the dominant supplier. In 2010-11, quotas imposed by the Chinese government on exports of rare-earth metals resulted in significant increases in their prices.
As automotive catalyst companies did not have any pass-through agreements with their customers at the time, their margins were hit. In 2010/11, Johnson Matthey’s Environmental Technology division EBIT was negatively affected by £5m (3% of operating profit) and in H1 2011/12 by another £15m (16% of operating profit).
However, since then, not only have the prices of rare-earth metals collapsed, but automotive catalyst manufacturers have also negotiated price surcharges with their customers, so any future increases should no longer affect their business.
Light-duty catalysts market
Catalysts are normally supplied directly to auto manufacturers, so for automotive catalyst producers, relationships with auto producers are essential. Typically, auto manufacturers select two or three automotive catalyst suppliers per platform.
Platform definitions and concepts differ slightly in each auto maker, but in general, they tend to refer to the car body and major parts excluding the superstructure. Platforms allow OEMs to release new models into the market by making modest design changes and innovations to existing platforms, and this helps lower the cost of developing new models.
However, due to the variation in legislation in different countries, there can be different catalyst suppliers even within the same platform.
Auto companies start tendering new platforms two or three years before their commercial launch. The catalyst is a critical part of the power train as it controls emissions, but it is also technologically complex. Automotive catalyst companies spend 5-6% of their sales value on R&D every year.
The catalysts market is very mature in developed countries and market shares are well defined. Changes in market share are only possible if legislation changes or if one of the players comes up with disruptive technology (for instance, a reduction in PGM content in the catalyst).
Precious metal costs are a pass-through for the automotive catalyst producers
In the US, most auto manufacturers work under consignment conditions. They own the precious metals used in catalyst production and the automotive catalyst producer does not even take the PGMs onto its balance sheet
Rare-earth metals are now also a pass-through for the catalyst companies
Catalysts are normally supplied directly to auto producers, so for automotive catalyst companies, relationships with auto producers are essential
Automotive catalyst companies spend 5-6% of their sales value on R&D every year
The catalyst market is very mature in developed countries and market shares are well defined

Catalysts and metal recycling Chemicals
37
In developing countries, the auto market itself is less consolidated and growth is much faster; hence the dynamics for automotive catalysts are very different. Legislation in developing countries tends to lag that in developed countries, and as a result the catalyst value per vehicle is lower in the former.
Globally, there are three leading automotive catalyst companies, each with approximately a 30% market share (Johnson Matthey, Umicore and BASF). Toyota has its own automotive catalyst company, called Catalar. Catalar supplies 75-80% of all Toyota’s automotive catalyst needs, but also works with Fuji, Suzuki, General Motors and Daihatsu.
In 2012, Asia represented c50% of global automotive production, Europe 23% and North America 18%.
Global automotive production
Europe, 23%
Greater China, 22%Japan/Korea,
26%
Middle East/ Africa, 2%
North america, 18%
South america, 5%
South Asia, 3%
Global auto production 2012 (units)
Source: IHS
As emissions legislation in many Asian countries is behind that in western ones, Asia represents a smaller percentage of the automotive catalysts market relative to its share of auto production. For instance, China represented 22% of global auto production in 2012, but only 15% of automotive catalysts production. Europe is by far the most important region for LDV automotive catalysts, as 50-53% of the LDV fleet in Europe is powered by diesel. A diesel vehicle represents 5x the catalyst value of an equivalent gasoline vehicle.
Global automotive production
North America, 23%
Europe, 27%
Japan/Korea, 20%
China, 15%
Latin America, 6%
Other, 9%
Global catalysts market 2012 (value excl metals)
Source: Berenberg research, Company data
Globally there are three leading automotive catalyst companies (Johnson Matthey, Umicore and BASF); each has approximately a 30% market share
Europe is by far the most important region for LDV automotive catalysts, as 50-53% of the LDV fleet in Europe is powered by diesel

Catalysts and metal recycling Chemicals
38
We estimate the global LDV catalysts market was valued at around $4.3bn in 2012 (excluding the value of precious metals). As there are no considerable legislative changes in LDV worldwide until 2015, we expect average annual market growth to be 5-5.5%, still higher than global auto production growth. Euro VI in Europe is mostly relevant for HDD, as LDV diesel cars are already required by Euro V to have DPFs. The maturity of the market in developed countries and the slowdown in legislative changes (as emissions control in the regions is already at a very high level) could lead to an erosion of catalyst producers’ pricing power.
Though the LDV automotive catalysts market is almost evenly split between key players, geographically their presence varies. Relationships with auto manufacturers are key for gaining and maintaining market share. Different car producers will have different requirements. For instance, US producers such as General Motors and Ford are cost-conscious and the reduction of PGM content in the engine is key for them; Toyota on the other hand is less concerned about PGM content, but requires high levels of R&D from the producer.
We looked at key auto manufacturers in order to analyse their preferred suppliers in different regions.
North America The US auto manufacturing industry went through turbulent times, which resulted in higher pricing pressure on the catalysts industry. We think that in the early 2000s there was overcapacity in automotive catalyst production in the US, which also contributed to some price erosion. We estimate that the margins LDV catalyst producers are able to generate in the US are lower than those in Europe (even excluding the diesel effect).
According to our estimates, North America represents 18% of global car production and 22% of the global automotive catalysts market. The North American market shares of the leading auto manufacturers are shown in the chart below.
Automotive production in North America
GM, 20.9%
Ford, 18.4%
Fiat, 15.4%
Toyota, 11.5%
Renault, 8.5%
Others, 25%
North American car production 2012
Source: IHS
Umicore and BASF are the leading automotive catalyst producers in North America, with Johnson Matthey having a somewhat smaller market share.
In 2007, Umicore acquired the automotive catalyst business of Delphi Corporation (formerly part of General Motors). As a result of this deal, according to our estimates, Umicore has 55% of the North American supply of LDV automotive catalysts for General Motors (and around 50% worldwide). The rest is supplied mostly by BASF.
In 2006, BASF acquired Engelhard Corporation, a leading automotive catalyst
We estimate the global LDV catalysts market was valued at around $4.3bn in 2012. As there are no considerable legislative changes until 2015 in LDV, we expect average annual market growth to be 5-5.5% in the medium term
According to our estimates, North America represents 18% of global car production and 22% of the global automotive catalysts market
Umicore and BASF are the leading automotive catalyst producers in North America, with Johnson Matthey having a somewhat smaller market share

Catalysts and metal recycling Chemicals
39
producer in North America. BASF is a leading supplier of Ford, with at least a 50% market share globally. The rest is supplied by Johnson Matthey and Umicore.
Fiat mostly uses BASF and Johnson Matthey catalysts. Johnson Matthey also has a very strong relationship with Renault and BASF with Nissan.
Toyota uses Catalar for the majority of its catalyst needs globally (75-80%); however, it also uses some Johnson Matthey catalysts in North America.
Overall, Umicore and BASF have higher market shares with local manufacturers (General Motors, Ford) and Johnson Matthey satisfies the needs of European producers in North America.
Johnson Matthey has a lower market share in small engines in North America, which is why the recent consumer shift towards smaller engines negatively affected its sales in the region (for Umicore, the opposite is true).
Europe According to our estimates, Europe represents 23% of global car production and 27% of the global automotive catalysts market.
Europe is the most lucrative market for LDV catalysts producers. 50-55% of the cars in the region are powered with diesel, which is associated with a 5x higher catalyst value.
Fluctuations in the proportion of diesel-powered cars are one of the key factors for catalysts companies’ profitability in the region (along with car production). The European market shares of the leading auto manufacturers are shown in the chart below.
Automotive production in Europe
VW, 23.8%
PSA , 10.4%
Ford, 10.0%
Fiat, 7.1%
Daimler , 7.1%
BMW , 7.0%
Others, 20%
European car production 2012
Renault/Nissan, 12.9%
Source: IHS
Volkswagen dominates the market, followed by Renault/Nissan and Peugeot/Citroen.
We think that Johnson Matthey has a higher market share in Europe than the other two players as it is a leading producer of both diesel and gasoline catalysts for Volkswagen. Johnson Matthey also has very strong relationships with Renault, Peugeot and Fiat. We think that Johnson Matthey has around a 55-60% share in the European LDV catalyst market (c63% of Johnson Matthey’s Emission Control Technologies sales come from Europe).
We think that Umicore has around a 30% share of the European LDV catalysts market. According to our information, it is the leading supplier of diesel catalysts for BMW and Daimler. It is also a secondary supplier to Peugeot and Renault. As Umicore has exposure to better selling platforms, it was less affected than its
According to our estimates, Europe represents 23% of global car production and 27% of the global automotive catalyst market
Fluctuations in the proportion of diesel-powered cars are one of the key factors for catalysts companies’ profitability in the region
We think Johnson Matthey has a larger market share in Europe than the other two players, as it is a leading producer of both diesel and gasoline catalysts for Volkswagen
We estimate Johnson Matthey’s share of the European LDV market to be around 45-50% and Umicore’s around 30%. BASF has a somewhat smaller presence in Europe

Catalysts and metal recycling Chemicals
40
competitors by the decline in European car production.
BASF is the number three in Europe; we estimate its market share to be around 15%. It is the leading supplier to Nissan and Ford and secondary supplier to Renault, BMW and Daimler. It also has higher exposure to gasoline cars.
As there is no major LDV legislation in Europe until 2015, we expect automotive catalyst consumption growth to track auto production. We think that the current decline in European auto manufacturing has created the risk of overcapacity in LDV catalysts.
Japan/South Korea According to our estimates, Japan/South Korea represent 26% of global car production and 20% of the global automotive catalysts market. Toyota sources its needs mostly from Catalar, 75% of which belongs to Toyota; hence the market available for other companies is somewhat limited as Toyota has a 30% market share of auto production in the region. Catalar also works with Suzuki, Fuji, Isuzu, Daihatsu and even General Motors.
The Japanese/South Korean market shares of the leading auto manufacturers are shown in the chart below.
Automotive production in Japan/South Korea
Toyota, 30.6%
Hyundai, 24.8%
Honda, 7.4%
Suzuki, 7.4%
Others , 20%
Japan/Korea car production 2012
Renault/Nissan , 8.9%
Source: IHS
NE Chemcat is another player which is very active in the market. It is a 50/50 joint venture between Sumitomo Metal Mining and BASF. Founded in 1964, it has a long history in the market and is a leading supplier of Nissan and Honda. Together with Catalar, NE Chemcat controls the majority of the Japanese market.
Umicore has a joint venture with Nippon Shokubai in Japan. It has strong relationships with Mitsubishi and Nissan and serves as a secondary supplier for Toyota and Honda.
Johnson Matthey has a weaker presence in Japan and South Korea. It is a secondary supplier to Toyota, Honda and other producers. Similarly to the US, it has lower exposure to small-engined cars.
In South Korea, BASF and Umicore have leading positions. BASF has a joint venture with Heesung Group. Umicore also has a joint venture with a local partner. It is a leading supplier of Hyundai and General Motors.
China According to our estimates, China represents 22% of global car production and 15% of the global automotive catalysts market. Chinese environmental legislation is well
According to our estimates, Japan/South Korea represent 26% of global car production and 20% of the global automotive catalyst market
Catalar (75% of which belongs to Toyota) and NE Chemcat (a 50/50 joint venture between BASF and Sumitomo) control the majority of the Japanese LDV market
In South Korea, BASF and Umicore have leading positions
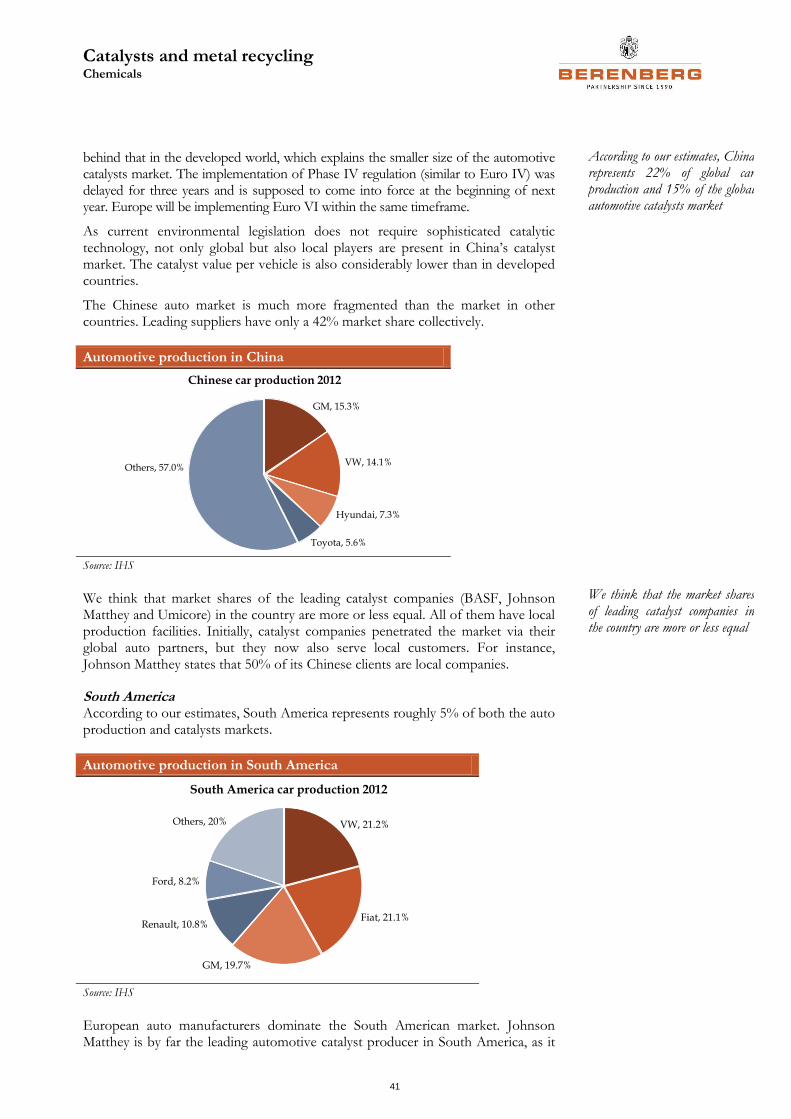
Catalysts and metal recycling Chemicals
41
behind that in the developed world, which explains the smaller size of the automotive catalysts market. The implementation of Phase IV regulation (similar to Euro IV) was delayed for three years and is supposed to come into force at the beginning of next year. Europe will be implementing Euro VI within the same timeframe.
As current environmental legislation does not require sophisticated catalytic technology, not only global but also local players are present in China’s catalyst market. The catalyst value per vehicle is also considerably lower than in developed countries.
The Chinese auto market is much more fragmented than the market in other countries. Leading suppliers have only a 42% market share collectively.
Automotive production in China
GM, 15.3%
VW, 14.1%
Hyundai, 7.3%
Toyota, 5.6%
Others, 57.0%
Chinese car production 2012
Source: IHS
We think that market shares of the leading catalyst companies (BASF, Johnson Matthey and Umicore) in the country are more or less equal. All of them have local production facilities. Initially, catalyst companies penetrated the market via their global auto partners, but they now also serve local customers. For instance, Johnson Matthey states that 50% of its Chinese clients are local companies.
South America According to our estimates, South America represents roughly 5% of both the auto production and catalysts markets.
Automotive production in South America
VW, 21.2%
Fiat, 21.1%
GM, 19.7%
Renault, 10.8%
Ford, 8.2%
Others, 20%
South America car production 2012
Source: IHS
European auto manufacturers dominate the South American market. Johnson Matthey is by far the leading automotive catalyst producer in South America, as it
According to our estimates, China represents 22% of global car production and 15% of the global automotive catalysts market
We think that the market shares of leading catalyst companies in the country are more or less equal

Catalysts and metal recycling Chemicals
42
is the main supplier of Volkswagen, Fiat and Renault. Umicore is the number two as it supplies General Motors, while BASF is the number three.
Diesel fuel in Europe is at risk
Europe is the most lucrative market for LDV catalyst producers. Diesel-powered vehicles, which represent c50% of the total European LDV fleet, are the key reason for the primacy of the European market. Diesel-powered vehicles represent 5x the catalyst value of a comparable gasoline-powered vehicle. The prevalence of diesel as a fuel for LDV cars is a uniquely European phenomenon and is explained by the preferential tax treatment of diesel versus gasoline. India also has a large LDV fleet of diesel vehicles, but as environmental regulations there are largely non-existent, this market is not relevant for catalyst producers at the moment.
The share of diesel vehicles in the European fleet has varied over time.
Diesel as percentage of total LDV in Western Europe
Source: Johnson Matthey
In periods of economic downturn, the proportion of diesel-powered cars seems to fall. This is explained mainly by the technical properties of diesel. With diesel engines, fuel efficiency is much more limited for smaller engine sizes and short journeys. During downturns, the engine mix moves towards smaller sizes, so the share of diesel cars decreases.
Now, however, there is the risk of a more permanent reduction in the diesel fleet in Europe. A litre of diesel contains more energy and more carbon than a litre of gasoline; hence it is taxed at a higher rate than gasoline in most regions. For instance, in the US, the diesel fuel tax is 25% higher than that of gasoline. In Europe, fuel is taxed on the basis of volume, and diesel is cheaper than petrol in nearly all EU states, with Britain a notable exception. On the other hand, there is a shortage of diesel production facilities. Fuel suppliers often have to import diesel and export surplus gasoline, sometimes at a loss. Diesel is the most expensive fuel to refine, but the cheapest to consume in Europe.
In April 2011, the European Commission presented its proposal to overhaul the outdated rules on the taxation of energy products in the EU. The new rules aim to restructure the way energy products are taxed to remove current imbalances and take into account both their CO2 emissions and energy content. The main impact for all member states will be that they will have to end the current distortive tax treatment of petrol and diesel. Since a litre of diesel contains more energy and more carbon than a litre of gasoline, minimum tax rates per litre of diesel should eventually be higher than for gasoline. Most member states will be able to satisfy
Johnson Matthey is by far the leading automotive catalyst producer in South America
Europe is the most lucrative market for LDV catalyst producers due to the high penetration of diesel-powered cars

Catalysts and metal recycling Chemicals
43
the new requirements either through an increase in diesel rates or a reduction in petrol rates.
The proposed tax rates are reflected in the table below.
New tax rates for transport fuel Current rate 01 Jan 13 01 Jan 15 01 Jan 18
Petrol (euro per 1000 litres) 359 359 359 359
Diesel (euro per 1000 litres) 330 359 382 412
Kerosene (euro per 1000 litres) 330 350 370 386
LPG (euro per 1000 kg) 125 125 311 501
Natural gas (euro per GJ) 2.6 2.6 6.6 10.8
Source: European Commission / Taxation and Customs Union
As the table shows, if the new rates are approved, the diesel tax will increase by 80% and diesel will become more expensive than gasoline. The German automotive industry association believes that if the new tax rates are approved, sales of diesel cars could more than halve. This is a serious risk for both Umicore and Johnson Matthey, as in the event of this they could lose a major portion of their European earnings in LDV catalysts.
HDD catalyst market
Great expectations Less than a decade ago, the HDD catalyst market did not exist at all, but it is now growing very rapidly, driven mostly by the legislative changes discussed above. Johnson Matthey forecasts the HDD catalyst market to reach $2.1bn in 2015 and $3bn by 2020.
HDD catalyst market forecast by Johnson Matthey
0
500
1000
1500
2000
2500
3000
3500
2005 2007 2009 2011 2013 2015 2017 2019 2021
North America Western Europe Eastern Europe Japan and Korea Russia
China India Brazil Non-road, 130 – 560 kW Non-road, 56 – 130 kW
Non-road, <56 kW
Sa
les
ex
pm
s($
m)
CAGR 2012 – 2020: 17.3%
Source: Johnson Matthey
We are more cautious than the company. We share Johnson Matthey’s view on short-term prospects (2013-15) but see slower growth thereafter. The company itself has downgraded its forecasts several times. Initially, it expected the HDD catalyst market to reach $3bn by the end of 2014; now, Johnson Matthey expects that it will reach this level only by 2020. Obviously, the 2008/09 financial crisis
An increase in the diesel tax could cause a considerable decline in European sales of diesel-powered passenger cars. We think European LDV sales could more than halve as a result
We think the development of the HDD catalyst market will be below current forecasts
Potential changes in the European fuel tax structure could result in c 80% tax increase on diesel. Diesel will become more expensive than gasoline
Catalysts and metal recycling Chemicals
44
hurt commercial vehicle production growth severely, but we also see various obstacles to greater penetration of HDD catalysts.
The short-term growth of the HDD catalyst market will be driven by the introduction of the Euro VI standard in Europe and Phase IV in China. Both are expected to come into force at the beginning of 2014. Based on our analysis, we expect the European HDD market to double due to this change in legislation.
We see the development of the Chinese market as more problematic. China was supposed to implement the Phase IV fuel standard in January 2010, but this was delayed until 2014. The lack of low-sulphur fuel was the main reason for the delay. Oil refiners were reluctant to invest in desulphurisation facilities. Diesel prices in China are regulated by the government and refineries were uncertain of whether they would be able to recover the investment costs. Finally, in 2012, the refiners announced that the investment had been completed, but it is still not clear whether low-sulphur fuel is available throughout the country and the implementation of HDD regulation is not possible without this type of fuel.
Phase IV does not require sophisticated technology, so the catalyst value per vehicle will be much less than it is in developed countries. Its implementation will also attract local competitors to the market, so the catalyst majors’ market share will be smaller in China than it is in the developed world.
Lastly, it is not clear how the change in legislation will be enforced in China. In Europe or the US, faulty catalysts can result in significant fines for the auto manufacturer. In China the stakeholders as well as the emissions measurement mechanisms are not clear. We think truck manufacturers will try to avoid additional investments in emissions control, should such an opportunity arise.
We also have certain concerns about the short-term profitability of the HDD catalyst market. Future changes in HDD legislation have prompted all the major players to increase capacity and we think that, in the next two years, the market will be unable to absorb all the capacity additions.
Commercial vehicles market dynamics The passenger and commercial vehicles markets have different demand drivers. For passenger cars, the key drivers are population growth and general economic indicators such as consumer confidence, unemployment etc. Corporate investment activity is also important, as vehicles are leased or bought by corporates for their employees, but this is only one of a few factors.
Trucks are a much more discretionary product; hence demand fluctuations are more pronounced. Declines in GDP lead to a fall in the transportation of goods, and surplus trucks are temporarily decommissioned. When demand rises again, companies reactivate these trucks before buying new ones, leading to a time lag between a rise in GDP and growth in demand for trucks.
The market is driven mostly by corporate investment activity. The financial crisis severely affected truck demand, especially in developed countries. Many fleet customers (including logistics/transportation providers and construction firms) cancelled existing orders. Though in 2010 most commercial vehicle markets revived following the decline in sales, truck manufacturers continue to suffer a number of difficulties. Increasingly stringent environmental regulations, the high price of fuel and largely saturated markets are contributing to shrinking commercial vehicles production in developed countries.
Emerging markets are also prone to cycles in commercial vehicle markets, but the overall growth trend is positive.
Short-term growth of the HDD market will be driven by the introduction of the Euro VI standard in Europe and Phase IV in China
We expect the European HDD catalyst market to double due to the change in legislation
We are more sceptical on Chinese market development
Demand for passenger cars is driven by general economic indicators, commercial vehicle demand is driven mostly by corporate investment activity
The commercial vehicles market has more pronounced de-/re-stocking cycles
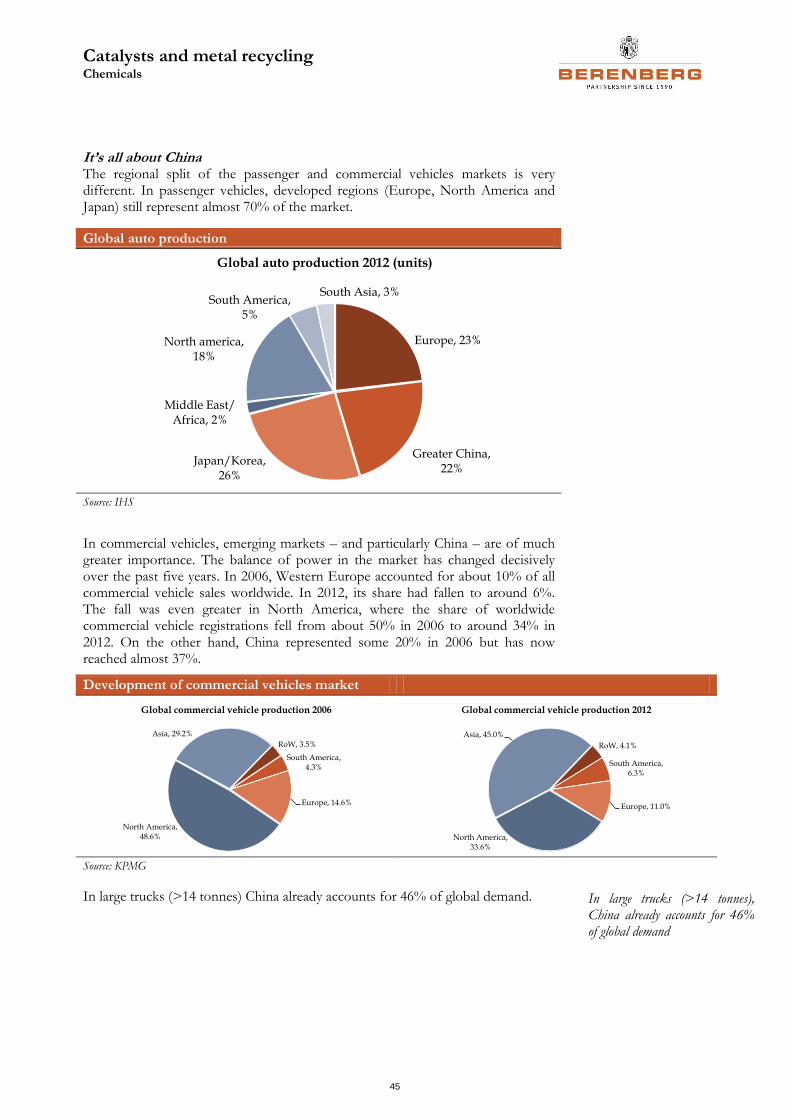
Catalysts and metal recycling Chemicals
45
It’s all about China The regional split of the passenger and commercial vehicles markets is very different. In passenger vehicles, developed regions (Europe, North America and Japan) still represent almost 70% of the market.
Global auto production
Europe, 23%
Greater China, 22%
Japan/Korea, 26%
Middle East/ Africa, 2%
North america, 18%
South America, 5%
South Asia, 3%
Global auto production 2012 (units)
Source: IHS
In commercial vehicles, emerging markets – and particularly China – are of much greater importance. The balance of power in the market has changed decisively over the past five years. In 2006, Western Europe accounted for about 10% of all commercial vehicle sales worldwide. In 2012, its share had fallen to around 6%. The fall was even greater in North America, where the share of worldwide commercial vehicle registrations fell from about 50% in 2006 to around 34% in 2012. On the other hand, China represented some 20% in 2006 but has now reached almost 37%.
Development of commercial vehicles market
RoW, 3.5%
South America, 4.3%
Europe, 14.6%
North America, 48.6%
Asia, 29.2%
Global commercial vehicle production 2006
RoW, 4.1%
South America, 6.3%
Europe, 11.0%
North America, 33.6%
Asia, 45.0%
Global commercial vehicle production 2012
Source: KPMG
In large trucks (>14 tonnes) China already accounts for 46% of global demand.
In large trucks (>14 tonnes), China already accounts for 46% of global demand

Catalysts and metal recycling Chemicals
46
World’s largest truck markets (2011)
Other, 6%
South America 8%
India, 12%
North America, 11%
Europe, 17%
China, 46%
World's largest truck markets > 14 tons
Source: Johnson Matthey
We expect that the market shares of Western Europe and North America will continue to decline relative to sharply-rising demand in emerging markets.
A tough environment for developed-world truck OEMs Truck OEMs in established markets are under increasing pressure. A steady stream of ever-stricter new environmental legislation is gradually coming into force. This means higher costs for truck manufacturers; material costs and fuel prices have been on the rise as well. Against a strong economic backdrop, these factors added a burden that could be absorbed to some extent. However, when economic growth slowed, it became impossible to offset ever-increasing costs with increasing revenues. Truck OEMs were forced to cut costs aggressively.
Another factor is that trucks are becoming increasingly interchangeable – and thus commoditised. When this occurs, product differentiation becomes increasingly difficult. Increased price pressure led to consolidation in the market. With the formation of a large commercial vehicle group under VW’s roof (MAN, Scania, VW CV), we see further consolidation in developed markets as unlikely.
Increased commoditisation of the truck market in developing countries and a spike in demand for cheaper trucks helped emerging-market OEMs (which are historically strong in the low-cost segment) gain market share at the expense of western producers. From 2006 to 2010, the domestic production volumes of China and India consistently exceeded domestic sales volumes.
In today’s market, a considerable proportion of trucks are already sold by manufacturers from emerging markets, such as Dongfeng Motor, FAW and CNHTC (all China) and Tata Motors (India).
In developed markets, truck manufacturers are under constant pressure from tightening environmental regulations and rising costs
Increased commoditisation of the truck market in developing countries allowed local companies to gain market share at the expense of western producers
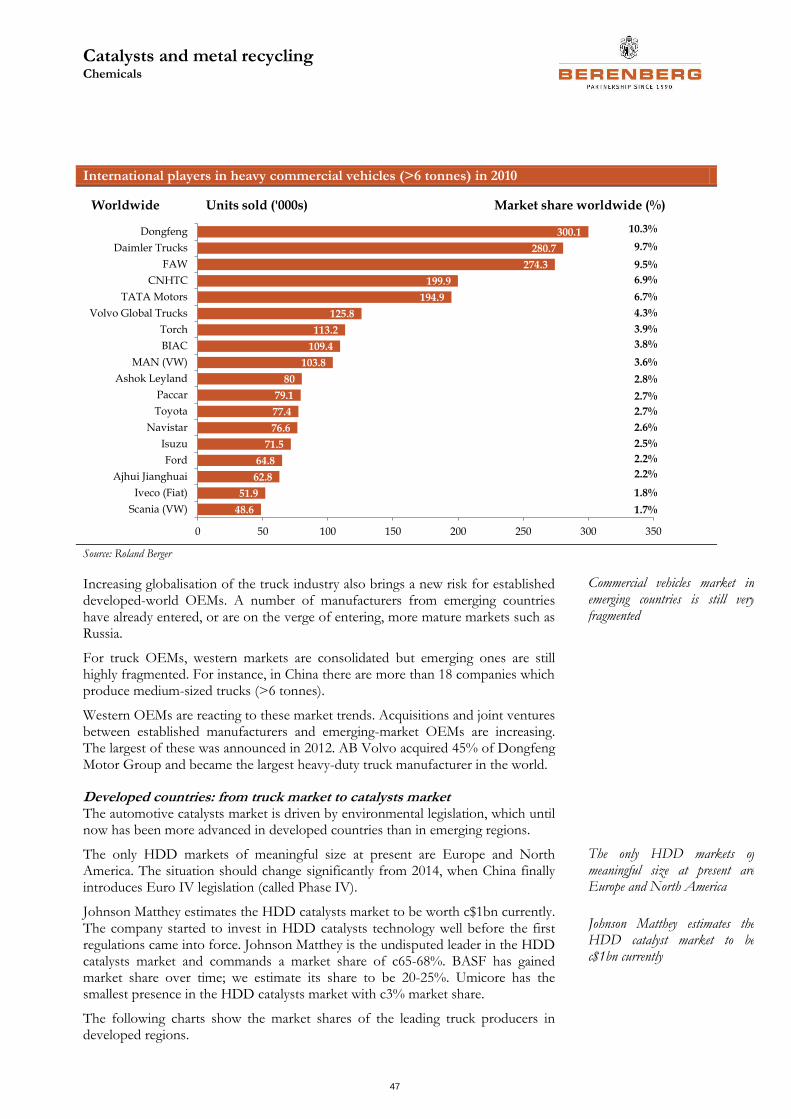
Catalysts and metal recycling Chemicals
47
International players in heavy commercial vehicles (>6 tonnes) in 2010
48.6
51.9
62.8
64.8
71.5
76.6
77.4
79.1
80
103.8
109.4
113.2
125.8
194.9
199.9
274.3
280.7
300.1
0 50 100 150 200 250 300 350
Scania (VW)
Iveco (Fiat)
Ajhui Jianghuai
Ford
Isuzu
Navistar
Toyota
Paccar
Ashok Leyland
MAN (VW)
BIAC
Torch
Volvo Global Trucks
TATA Motors
CNHTC
FAW
Daimler Trucks
Dongfeng
Worldwide Units sold ('000s) Market share worldwide (%)
10.3%
9.7%
9.5%
6.9%
6.7%
4.3%
3.9%
3.8%
3.6%
2.8%
2.7%
2.7%
2.6%
2.5%
2.2%
2.2%
1.8%
1.7%
Source: Roland Berger
Increasing globalisation of the truck industry also brings a new risk for established developed-world OEMs. A number of manufacturers from emerging countries have already entered, or are on the verge of entering, more mature markets such as Russia.
For truck OEMs, western markets are consolidated but emerging ones are still highly fragmented. For instance, in China there are more than 18 companies which produce medium-sized trucks (>6 tonnes).
Western OEMs are reacting to these market trends. Acquisitions and joint ventures between established manufacturers and emerging-market OEMs are increasing. The largest of these was announced in 2012. AB Volvo acquired 45% of Dongfeng Motor Group and became the largest heavy-duty truck manufacturer in the world.
Developed countries: from truck market to catalysts market The automotive catalysts market is driven by environmental legislation, which until now has been more advanced in developed countries than in emerging regions.
The only HDD markets of meaningful size at present are Europe and North America. The situation should change significantly from 2014, when China finally introduces Euro IV legislation (called Phase IV).
Johnson Matthey estimates the HDD catalysts market to be worth c$1bn currently. The company started to invest in HDD catalysts technology well before the first regulations came into force. Johnson Matthey is the undisputed leader in the HDD catalysts market and commands a market share of c65-68%. BASF has gained market share over time; we estimate its share to be 20-25%. Umicore has the smallest presence in the HDD catalysts market with c3% market share.
The following charts show the market shares of the leading truck producers in developed regions.
Commercial vehicles market in emerging countries is still very fragmented
The only HDD markets of meaningful size at present are Europe and North America
Johnson Matthey estimates the HDD catalyst market to be c$1bn currently

Catalysts and metal recycling Chemicals
48
Truck OEMs’ market shares in the developed world
0% 5% 10% 15% 20% 25%
others
Scania (VW)
Iveco (Fiat)
Paccar
MAN
Volvo (incl Renault and MAC)
Daimler trucks
Truck OEM market shares Western Europe (2010)
0% 5% 10% 15% 20% 25% 30%
others
Volvo (incl Renault and MAC)
Ford
Paccar
Navistar
Daimler trucks
Truck OEM market shares North America (2010)
Source: KPMG
According to our data, Johnson Matthey has a long history of being been the preferred supplier of Daimler and Volvo Global Trucks. BASF has very strong relationships with MAN and Iveco. Umicore works with Paccar.
As the truck market in the developed world is mature, it is possible to gain market share only if there is a legislative change or disruptive technology is introduced into the market. All three companies alluded to new contract gains ahead of Euro VI implementation.
Under Euro VI, heavy-duty vehicles will have to be equipped with DPFs to meet not only particulate mass but also particle number limits. In the US, a similar standard was already implemented in 2010 and the HDD catalysts market doubled in value as a result.
Based on truck production data from IHS and Johnson Matthey sales data, as well as our assumptions on the latter’s market share, we have calculated the HDD catalyst value per vehicle.
HDD catalyst value per vehicle Europe and US
HDD production 2010 2011 2012 2013 2014 2015 2016 2017
NA 301 456.8 448.9 444 467 481 495 510
% change 27.7% 51.8% -1.7% -1% 5% 3% 3% 3%
Europe 360 419 370.9 370.9 382.0 393.5 405.3 417.5
% change 0% 3% 3% 3% 3%
Sales
NA 194 295 297 302.94 312 318 328 338
% change 52.1% 0.7% 2% 3% 2% 3% 3%
per unit 0.92 0.92 0.95 0.97 1.03 1.10 1.10 1.10
market share 70% 70% 70% 70% 65% 60% 60% 60%
Europe 91 111 105 109.2 245.7 258.0 258.0 266.0
% change N.A. 22.0% -5.4% 4% 125% 5% 0% 3%
per unit 0.36 0.38 0.40 0.42 0.99 1.09 1.06 1.06
market share 70% 70% 70% 70% 65% 60% 60% 60%
market size 136 146 273 309 309 318
Source: Berenberg estimates, Johnson Matthey
According to our analysis, the catalyst value per car in Europe is now 2.3x lower

Catalysts and metal recycling Chemicals
49
than it is in the US. The difference is explained mainly by different regulations, though it is also affected by the average engine size in the region.
We think that, with Euro VI legislation, the HDD catalyst value per vehicle will increase by 2-2.3x in the next two years.
Further growth in the HDD catalysts market is limited in both North America and Europe. Legislative changes are the main trigger for an increase in catalyst value: in the absence of radical legislative changes, catalytic technology becomes commoditised and catalyst companies’ pricing power weakens. As mature markets have already reached very tight levels of emissions control, we expect catalyst market growth to slow in the medium term.
Another risk factor for the catalyst companies is the technical abilities of the truck manufacturers. The dynamics vary between passenger and truck markets. In passenger vehicles, due to the lower price per unit, sophisticated engine technology does not make much sense. Potential cost savings achieved cannot compensate for the costs associated with the development of the technology. In truck markets, these investments can bring high pay-offs. For instance, Scania is working on a fuel injection system which will allow for a reduction in the required catalyst volume. We think that as catalyst technology matures, auto manufacturers’ pressure on catalyst producers will increase.
Shorter-term, we think that the market is misinterpreting the way current truck supply/demand dynamics translate to the catalysts market.
All the major European truck companies mentioned an improvement in order intake at the Q1 2013 results, albeit from the very low levels seen in Q4 2012. According to the GE European SME Capex Barometer from Q1 2013, which includes data from more than 2,250 small and medium enterprises (SMEs), capital investment will increase in most large Western European economies. SMEs represent the lion’s share of truck buyers in Europe; hence overall market expectations regarding European truck production are positive.
Investment intentions of European SMEs in the next 12 months (€bn)
Source: GE Capital European SME Capex Barometer
The improvement in truck market supply/demand dynamics has triggered higher expectations for catalyst sales. We think these expectations are premature.
The Euro VI standard comes into force in January 2014. Truck companies have
We think that, with Euro VI legislation, the HDD catalyst value per vehicle in Europe will grow 2-2.3x in the next two years
Further HDD catalysts growth in both North America and Europe is limited
We think that as catalyst technology matures, auto manufacturers’ pressure on catalyst producers will increase

Catalysts and metal recycling Chemicals
50
already announced that they expect these legislative changes to increase their costs by c€10,000 per truck. They intend to pass the majority of the price increase through to their customers (the average price per truck is expected to rise from c€100,000 currently to €110,000 after Euro VI is in place). Euro VI not only increases the initial selling price, but also negatively affects the total cost of ownership over the entire lifecycle of the vehicle, as the truck’s fuel efficiency decreases due to the complicated design of the emissions control system.
It therefore makes sense that truck buyers will pull forward purchases ahead of such an increase. According to various estimates, up to 10% of annual truck demand can be affected by pre-buying. This might be good news for truck manufacturers, but for catalyst companies the effect is actually the opposite. The pre-buying of Euro V trucks means a lower catalyst value per vehicle. We therefore do not expect a major increase in the catalyst value per truck in Europe in 2013.
China: from truck market to catalysts market The Chinese passenger car market is also fragmented; however, international producers have more than 50% market share.
Chinese passenger car production
Source: IHS
In trucks, domestic OEMs control c80% of the market; in India, Tata has 60% market share.
Emerging-market OEMs’ market shares
0% 10% 20% 30% 40% 50% 60% 70%
Asia motor works
Others
Swaraj Mazda
Eicher Motors
Ashok Leyland
Tata Motors
Truck OEM market shares India (2010)
0% 5% 10% 15% 20% 25% 30% 35%
Baic
Torch
CNHTC
FAW
Donfeng
others
Truck OEM market shares China (2010)
Source: KPMG
We think pre-buying of Euro V trucks will limit the growth potential of HDD catalysts this year
In the Chinese passenger car market, international producers have c50% market share. In the Chinese commercial vehicle market, local producers control 80%
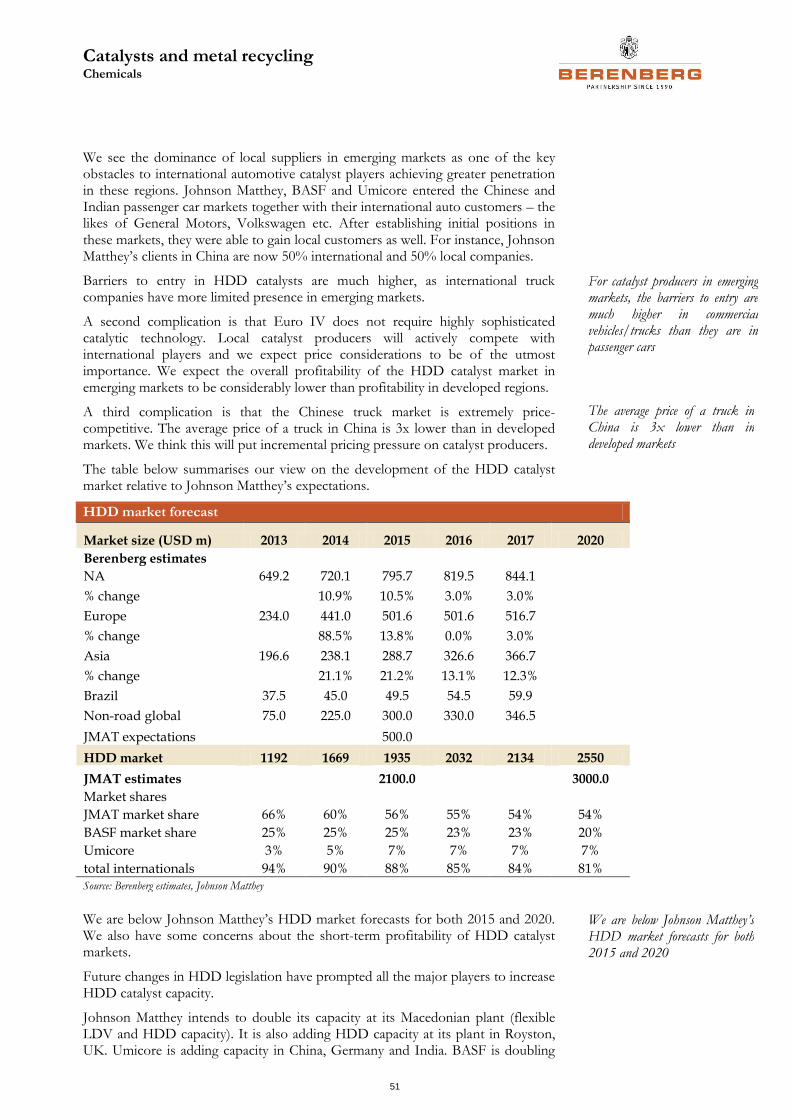
Catalysts and metal recycling Chemicals
51
We see the dominance of local suppliers in emerging markets as one of the key obstacles to international automotive catalyst players achieving greater penetration in these regions. Johnson Matthey, BASF and Umicore entered the Chinese and Indian passenger car markets together with their international auto customers – the likes of General Motors, Volkswagen etc. After establishing initial positions in these markets, they were able to gain local customers as well. For instance, Johnson Matthey’s clients in China are now 50% international and 50% local companies.
Barriers to entry in HDD catalysts are much higher, as international truck companies have more limited presence in emerging markets.
A second complication is that Euro IV does not require highly sophisticated catalytic technology. Local catalyst producers will actively compete with international players and we expect price considerations to be of the utmost importance. We expect the overall profitability of the HDD catalyst market in emerging markets to be considerably lower than profitability in developed regions.
A third complication is that the Chinese truck market is extremely price-competitive. The average price of a truck in China is 3x lower than in developed markets. We think this will put incremental pricing pressure on catalyst producers.
The table below summarises our view on the development of the HDD catalyst market relative to Johnson Matthey’s expectations.
HDD market forecast
Market size (USD m) 2013 2014 2015 2016 2017 2020
Berenberg estimates
NA 649.2 720.1 795.7 819.5 844.1
% change 10.9% 10.5% 3.0% 3.0%
Europe 234.0 441.0 501.6 501.6 516.7
% change 88.5% 13.8% 0.0% 3.0%
Asia 196.6 238.1 288.7 326.6 366.7
% change 21.1% 21.2% 13.1% 12.3%
Brazil 37.5 45.0 49.5 54.5 59.9
Non-road global 75.0 225.0 300.0 330.0 346.5
JMAT expectations 500.0
HDD market 1192 1669 1935 2032 2134 2550
JMAT estimates 2100.0 3000.0
Market shares
JMAT market share 66% 60% 56% 55% 54% 54%
BASF market share 25% 25% 25% 23% 23% 20%
Umicore 3% 5% 7% 7% 7% 7%
total internationals 94% 90% 88% 85% 84% 81% Source: Berenberg estimates, Johnson Matthey
We are below Johnson Matthey’s HDD market forecasts for both 2015 and 2020. We also have some concerns about the short-term profitability of HDD catalyst markets.
Future changes in HDD legislation have prompted all the major players to increase HDD catalyst capacity.
Johnson Matthey intends to double its capacity at its Macedonian plant (flexible LDV and HDD capacity). It is also adding HDD capacity at its plant in Royston, UK. Umicore is adding capacity in China, Germany and India. BASF is doubling
For catalyst producers in emerging markets, the barriers to entry are much higher in commercial vehicles/trucks than they are in passenger cars
The average price of a truck in China is 3x lower than in developed markets
We are below Johnson Matthey’s HDD market forecasts for both 2015 and 2020

Catalysts and metal recycling Chemicals
52
its HDD capacity in Japan. Automotive catalyst production is quite flexible and the majority of the costs (up to 75%) are variable; however, in 2008-09, when Johnson Matthey commissioned its HDD capacity ahead of legislative changes in Europe and the US, the division was loss-making.
We think that automotive catalyst producers are overestimating the development potential of the market, which could negatively affect their margins in 2013-16.

Catalysts and metal recycling Chemicals
53
Recycling
Which metals are being recycled?
Metals are infinitely recyclable in principle, but in practice, recycling is often inefficient or even non-existent because of limits imposed by social norms, product design, recycling technologies and the thermodynamics of separation.
How is the world faring at recycling the diverse mix of elements in modern products? The chart below shows estimates of global end-of-life (EOL) recycling rates for 60 metals and metalloids.
EOL recycling for 60 metals
Source: Metal Recycling, International Resource Panel
Base metals (iron, copper, zinc) have recovery rates above 50%.
The majority of the elements are seldom recycled.
The top 10 metals that are currently being recovered are:
1. lead (main use: batteries);
2. gold (main uses: jewellery, electronics);
3. silver (main uses: electronics, industrial applications (catalysts, batteries, glass/mirrors), jewellery);
4. aluminium (main uses: in construction and transportation);
5. tin (main uses: cans and solders);
6. copper (main uses: conducting electricity and heat);
7. chromium (main use: stainless steels);
8. nickel (main uses: stainless steels and super-alloys);
The majority of metals are seldom recycled

Catalysts and metal recycling Chemicals
54
9. niobium (main uses: high-strength/low-alloy steels and super-alloys); and
10. manganese (main use: steel).
The main reason for such a low rate of recovery of many elements is the lack of technology to recover them on an economically-viable basis. Most of these elements are used in increasingly small quantities for very precise technological purposes; for example, thin-film solar cells or computer chips. In those applications, often involving highly co-mingled specialty metals, recovery can be so technologically and economically challenging that the attempt is seldom made. As an example, a mobile phone can contain more than 40 elements, including base metals such as copper and tin, special metals such as cobalt, indium and antimony, and precious and platinum-group metals including silver, gold, palladium, tungsten and yttrium.
Urban mine
For the scope of this report, we will limit our research to the recycling of PGMs and some minor metals (such as ruthenium, platinum, tellurium, gallium, etc) as those are key metals for Johnson Matthey’s and Umicore’s recycling divisions.
PGMs play a key role in modern society, as they are of specific importance for clean technologies and other high-tech equipment. Important applications beyond the well-known areas of chemical process catalysis and automotive emissions control include information technology (IT), consumer electronics and sustainable energy production such as photovoltaics (PV) and fuel cells, among others.
Important application areas for PGMs
Application area Platinum group metal
Platinum Palladium Rhodium Iridium Ruthenium
Catalysts
Electronics
Fuel cells
Glass, ceramics and pigments
Medical/dental
Pharmaceuticals
Photovoltaic
Super-alloys
Source: Recycling the Platinum Group Metals: A European Perspective
There has been a considerable acceleration in PGM demand in the past 30 years. 85% of mankind’s cumulative PGM mine production (more than 7,000 tonnes) took place from 1980 onwards.
The main reason for such a low rate of recovery of many elements is the lack of technology to recover those elements on an economically-viable basis
85% of mankind’s cumulative PGM mine production (more than 7,000 tonnes) has taken place from 1980 onwards

Catalysts and metal recycling Chemicals
55
Mine production since 1980/since 1900
Re Ga In Ru Pd Rh Ir REE Si Pt Ta Li Se Ni Co Ge Cu Bi Ag Au
0%
10%
20%
30%
40%
50%
60%
70%
80%
90%
100%
% mined in 1980-2010
% mined in 1900-1980
Source: Umicore
The driving forces behind the booming use of PGMs are their extraordinary and sometimes exclusive properties, which make them essential components in a broad range of applications.
Competition between applications leads to increased pressure on supply. The global annual production of PGMs would fit into a small room. However, due to their low concentration, one needs to extract on average one tonne of ore to obtain 10 grams of precious metal. Due to resource depletion, the costs of mining (including energy and water) are constantly increasing
Global production of precious metals
Source: Oko-Institut eV
One way to ensure adequate supply is to increase the exploration and extraction of geological deposits of PGMs. More than 85% of global mine production of PGMs is concentrated in Africa and Russia, where various difficulties severely limit production. The supply of minor metals (indium, bismuth, selenium, tellurium, rhodium, ruthenium, iridium) depends on the mining of major metals (nickel, copper, zinc, lead, platinum), and the growth in demand for minor metals is higher than that for major ones, which creates a supply/demand mismatch. There are no sustainable substitutes, as the minor metals are from the same metal family.
The global production of PGMs would fit into a small room. However, due to their low concentration, one needs to extract on average one tonne of ore to obtain 10 grams of precious metal
More than 85% of global mine production of PGMs is concentrated in Africa and Russia

Catalysts and metal recycling Chemicals
56
Structural scarcity of minor metals
Source: Umicore
The recycling of EOL materials can be a much richer source than the primary mining of ores. The average concentration of precious metals in ores from primary mining is approximately 10g/tonne, whereas “urban mining” can offer substantially higher yields. For instance, the concentration of gold in PC circuit-boards is 200-250g/t, in cell phones 300-350g/t and in automotive catalysts 2,000g/t. The recycling potential is easier to realise than substitution as a lot of high-tech application are based on specific material properties.
The chart below shows key consumer industries for platinum, palladium and rhodium.
PGMs: key consumer industries
Jewellery, 25%
Chemicals, 9%
Other, 14%
Platinum
autocatalysts, 52%
Autocatalysts, 48%
Jewellery, 18%
Electronics, 18%
Dental, 11%
Other, 5%
Palladium
Chemicals, 3%
Others , 7%
Rhodium
Autocatalysts, 90%
Source: Berenberg research
The potential of “urban mining” is high. For instance, automotive catalysts represent the major portion of PGM consumption and we are now mainly recycling automotive catalysts produced at the end of 1990s. However, since that time the consumption of PGMs per car has increased considerably.
The average concentration of precious metals in ores from primary mining is approximately 10g/tonne, whereas “urban mining” can offer substantially higher yields

Catalysts and metal recycling Chemicals
57
Global consumption of PGMs in automotive catalyst production
Global
1980 1984 1988 1992 1996 2000 2004 2008
pgm/t a-1
1980 - 2010
Rh 420 t – 64 t
Pd 2200 t – 285 t
Pd 1900 t – 381 t
4530 t – 730 t
350
300
250
200
150
100
50
0
Pt
Pd
Rh
Source: Umicore
Some applications of critical metals are so new that relevant mass flows of post-consumer materials will not reach the waste management sector until a few years’ time. A good example of such a field is PVs. Depending on solar cell type, indium, tellurium, gallium or germanium are used in increasing amounts in PVs.
Recycling challenges
Recycling levels of metals vary depending on application. For example, the platinum/palladium recovery rate in industrial applications (for instance, oil refinery catalysts) is close to 90%; in automotive applications it is 50-55% and in electronic applications only 5-10%.
PGM-lifecycle efficiency
Source: Oko-institut eV
What are the reasons for the difference in recovery rates? The basic assumption of recycling is that the value of the recovered (and other) material has to pay for all collection, dismantling, sorting and other recycling activities. Currently, there are a number of challenges which prevent recycling from being economically and
The platinum/palladium recovery rate in industrial applications (for instance, oil refinery catalysts) is close to 90%; in automotive applications it is 50-55% and in electronic applications only 5-10%
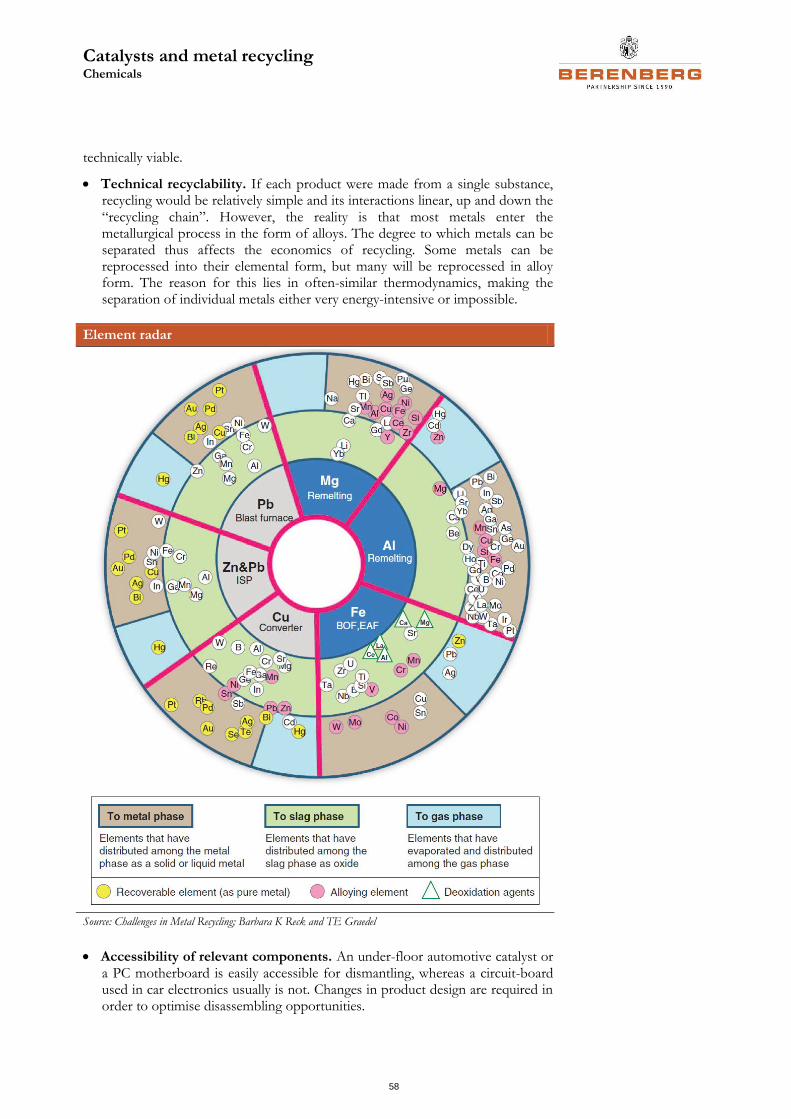
Catalysts and metal recycling Chemicals
58
technically viable.
Technical recyclability. If each product were made from a single substance, recycling would be relatively simple and its interactions linear, up and down the “recycling chain”. However, the reality is that most metals enter the metallurgical process in the form of alloys. The degree to which metals can be separated thus affects the economics of recycling. Some metals can be reprocessed into their elemental form, but many will be reprocessed in alloy form. The reason for this lies in often-similar thermodynamics, making the separation of individual metals either very energy-intensive or impossible.
Element radar
Source: Challenges in Metal Recycling; Barbara K Reck and TE Graedel
Accessibility of relevant components. An under-floor automotive catalyst or a PC motherboard is easily accessible for dismantling, whereas a circuit-board used in car electronics usually is not. Changes in product design are required in order to optimise disassembling opportunities.

Catalysts and metal recycling Chemicals
59
Economic viability. In some cases, the recovery of the precious metal is not economically viable unless it is paid for externally or subsidised. It depends on product design, the concentration of the metal in the product and the complexity of the metallurgical process to separate the PGM from the metal alloy. For instance, a dismantled PC motherboard has a positive net value, but an ultra-thin PGM-coated PC hard disk has a negative net value.
Collection mechanisms. Collection mechanisms remain one of the key reasons for the low level of metal recycling. For instance, the majority of old PCs or mobile phones still end up being stored in households or discarded into the waste bin for landfill or municipal incineration due to the lack of a clear recycling value chain.
The professionalism of the stakeholders is also very important. Collection efficiencies are related to social and governmental factors, but separation and sorting efficiencies relate to recycling technology. For instance, it is very important that precious-metal-containing circuit-boards are removed from the scrap pile prior to shredding, otherwise they lose almost 60% of their value. State-of-the-art pre-processing facilities are often still optimised for mass recovery, at the expense of the recovery of precious and special metals. On the other hand, small, local pre-processors are often more labour-intensive and smaller in size, which makes them less competitive. Targeted disassembly prior to shredding could substantially increase the recovery of precious metals from electronic wastes.
Accessibility of the recycling chain. Many countries do not have the proper infrastructure for recycling at EOL; this can result in precious metals being lost to the recycling chain.
Lack of legislative support. The US has not ratified the Basel Convention. The Basel Convention prohibits the export of hazardous waste from the EU to non-OECD countries for recovery, since these countries usually do not have proper and sufficient treatment capacity. Most consumer electronics fall into the hazardous waste category. However, the lack of legislative support for recycling in the US leads to the largest proportion of electronic scrap being exported to Asia, where it is used in “backyard” recycling. The latter is highly polluting and harmful for human health; however, it is characterised by lower costs (due to lower labour costs and zero investment in environmental protection). As a result, illegal scrap dealers can offer better prices to metal collectors. There are no PGM recycling facilities in the US due to the lack of supply.
The weakest link controls the performance of the system (for instance, 30% x 90% x 60% x 95% = 15%). Currently, the collection and dismantling steps are among the weakest in the chain, and as they occur at the beginning of the process, overall system efficiency is low. This is the case despite the strong technical abilities of metal refiners, which conclude the recycling chain.
Open versus closed loops in recycling
A high PGM recycling ratio is normally achieved when closed (direct) loops exist. For instance, in the case of industrial catalysts, direct relationships exist along the
lifecycle of the product (manufacturer industrial user PGM refiner). There is no change of PGM ownership after initial delivery to the end-user, all the material flows are transparent and the PGM content of the product is known throughout the entire cycle.
The weakest link controls the performance of the system. Currently, the collection and dismantling steps are among the weakest in the chain and as they occur at the beginning of the process, overall system efficiency is low
A high PGM recycling ratio is normally achieved when closed loops exist

Catalysts and metal recycling Chemicals
60
Direct recycling loops
PGM-precursor
PGM-product ChargeUse
(regineration)
Dis-charge
Conditioning
PGM-refining
Product manufacturing Product use in process Product recycling
PGM’s
E.g. Oil-refining catalysts, chemical catalysts, glass-equipment
Source: Oko-institut eV
In open, indirect recycling, the flows are much more complex and are accompanied by losses at almost every step, which leads to much lower recycling yields. PGM ownership changes several times during the lifecycle of the product, there is often a lack of economic incentive for the owner of the EOL product to recycle it, the stakeholders involved in the process are not clearly identified, handling is often not fully professional (“grey” and “black” channels occur) and the PGM content of the product changes through the cycle. In certain instances, the dilution of the PGM in the end-product occurs to such an extent that recycling in not inherently economically viable (for example, in the case of electronics).
Indirect recycling loops
PGM-component
Assembly End-product
PGM-precursor
PGM-refining
Return point/ Collection
Losses / System outflows (component / PGM’s)
Manufacturing Use Recycling-Logistics Physical recycling/ Refining
Lo
sse
s /
Sy
ste
m o
utf
low
s fo
r p
rod
uct
ConditioningComponent collection
(possibly multistep)
Dismantling(possibly multistep)
Coated monolith
User 1 Final user n
Cat. converter Car
Production scrapChange of PGM component
DecanningCar dismantler
No removal of PGM component
E.g. car catalysts, PGM in electronics, (dental)
Source: Oko-institut eV
The majority of recycling still occurs in an open-ended system, which seriously harms process efficiency.
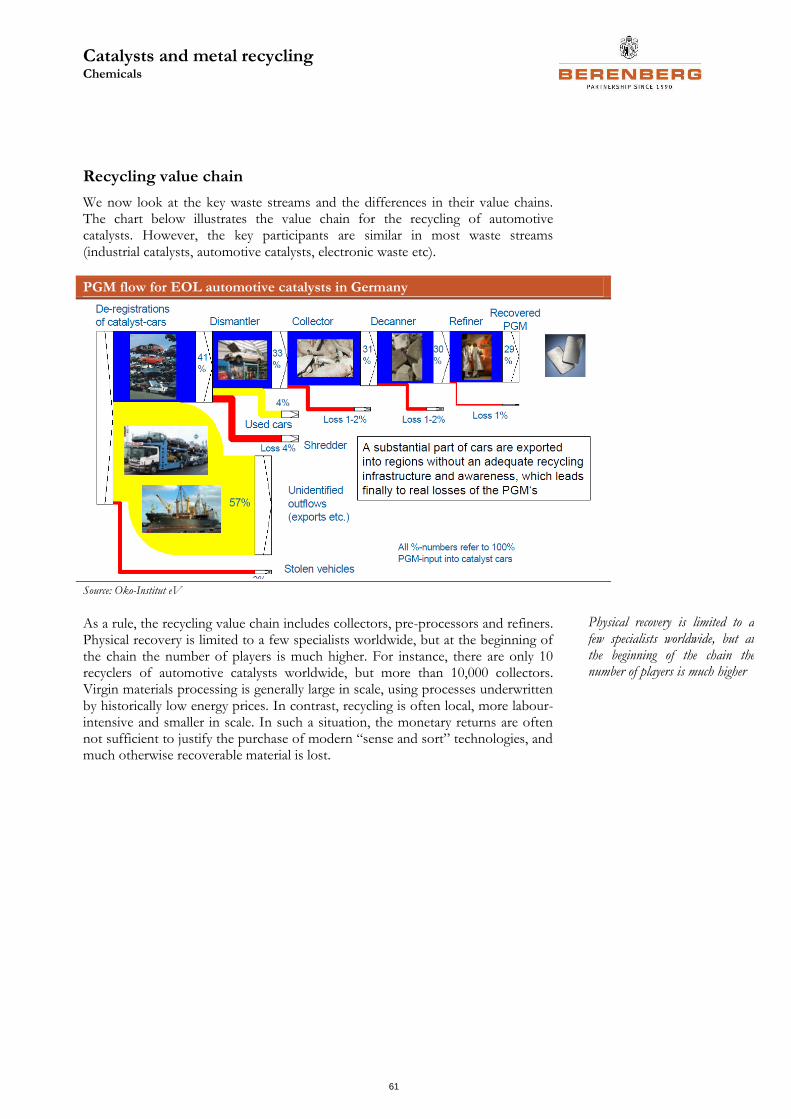
Catalysts and metal recycling Chemicals
61
Recycling value chain
We now look at the key waste streams and the differences in their value chains. The chart below illustrates the value chain for the recycling of automotive catalysts. However, the key participants are similar in most waste streams (industrial catalysts, automotive catalysts, electronic waste etc).
PGM flow for EOL automotive catalysts in Germany
Source: Oko-Institut eV
As a rule, the recycling value chain includes collectors, pre-processors and refiners. Physical recovery is limited to a few specialists worldwide, but at the beginning of the chain the number of players is much higher. For instance, there are only 10 recyclers of automotive catalysts worldwide, but more than 10,000 collectors. Virgin materials processing is generally large in scale, using processes underwritten by historically low energy prices. In contrast, recycling is often local, more labour-intensive and smaller in scale. In such a situation, the monetary returns are often not sufficient to justify the purchase of modern “sense and sort” technologies, and much otherwise recoverable material is lost.
Physical recovery is limited to a few specialists worldwide, but at the beginning of the chain the number of players is much higher

Catalysts and metal recycling Chemicals
62
Example of the recycling of electronic waste
Source: Umicore
Industrial applications (such as catalysts used in fine chemicals production or petrochemical processing and PGM equipment used in the glass industry) have the highest recovery rates (90%). In this case, recycling is solely market-driven and is an integral part of the product lifecycle. This is an example of a closed-loop system, with one of the shortest chains, where the recycler is often also the original producer of the catalyst.
Automotive applications have a recovery rate of 50-55%. Recycling is affected by legislation, but the dominant driver is still economic. Technical recyclability does not present a problem. The main problem is collection, as in this case the catalyst is part of another finished product – a car. Many old cars are exported to countries outside the OECD, which lack an appropriate recycling chain.
Electronic applications have the lowest recovery rate of 5-10%. As the economic viability of recycling is questionable for many metals, legislation plays a key role in determining electronic recycling. Extensive manual disassembly of discarded electronics is typically not economically feasible in industrialised countries but may be advantageous in emerging economies such as India and China. This creates an economic incentive to export electronic waste to those countries; however, as they lack recycling capabilities, the level of losses is very high. Better enforcement of trans-boundary waste shipments is required to prevent illegal recycling. The value chain is least transparent in the case of electronic waste recycling, which results in large quantities of EOL products being stored by consumers or disposed of through municipal waste collection. In electronic applications, legislation (and not the economics of recycling) is the key driver; hence PGM recyclers cannot improve the situation.
Waste electrical and electronic equipment (WEEE)
What is WEEE? The consumption of industrial and automotive catalysts is driven mostly by GDP trends, while electronic waste is growing at a much higher rate than average GDP growth. WEEE is one of the most promising recycling sources, as it demonstrates
Industrial applications have the highest recovery rate (90%)
Electronic applications have the lowest recovery rate (5-10%)
The consumption of industrial and automotive catalysts is driven mostly by GDP trends, while electronic waste is growing at a much higher rate than average GDP growth

Catalysts and metal recycling Chemicals
63
the highest growth among the waste categories and contains many metals which are experiencing rising demand. According to the Environmental Impact Assessment Review, 20m-50m tonnes of electronic waste (e-waste) are generated globally each year.
Electronic scrap (e-scrap) is a complex mix of:
precious metals (Ag, Au, Pd);
base and special metals (Cu, Al, Ni, Sn, Zn, Fe);
potentially hazardous metals (Hg, Be, Pb, Cd, As);
halogens (Br, F, Cl);
plastics and other organics; and
glass, ceramics.
Modern electronic equipment can contain more than 60 elements. There is a high risk of environmental damage if e-scrap is landfilled or if it is not treated in an environmentally sound way. E-scrap is the most complex source of recycling. For instance, circuit-boards contain most toxic and most valuable metals. About 70% of the heavy metals (mercury and cadmium) in US landfills come from e-waste and 40% of lead in landfills comes from electrical and electronic equipment.
What is e-waste?
Source: EMPA Swiss Federal Laboratories for Materials
In e-scrap, plastics and steel dominate by weight, but for the most part precious metals dominate by economic and ecological value.
Modern electronic equipment can contain more than 60 elements

Catalysts and metal recycling Chemicals
64
Composition of e-scrap (weight)
Source: Umicore
Composition of e-scrap (value)
Source: Umicore
E-waste is one of the fastest-growing waste streams today; it is growing at 3x the rate of municipal waste globally. This is largely due to the increasing market penetration of electronic products in developing countries, the development of replacement markets in developed countries and a generally high product obsolescence rate, together with a decrease in prices.
Legislation E-waste is very much a subject dealt with by individual countries, even though the movement of e-waste blurs national boundaries. In order to address the trans-border issue, the United Nations (UN) introduced the Basel Convention on the Control of Trans-Boundary Movements of Hazardous Wastes and their Disposal. So far, 134 countries have recognised this convention. Australia, Canada, New Zealand and the US are yet to ratify it. Nevertheless, ratification of the Basel Convention has not necessarily led to policy or legislative responses.
In the absence of strong legislative practices, voluntary actions appear to guide waste-management – both at global and national levels.
E-waste is one of the fastest-growing waste streams today; it is growing at 3x the rate of municipal waste globally
In the absence of strong legislative practices, voluntary actions appear to guide waste-management – both at global and national levels
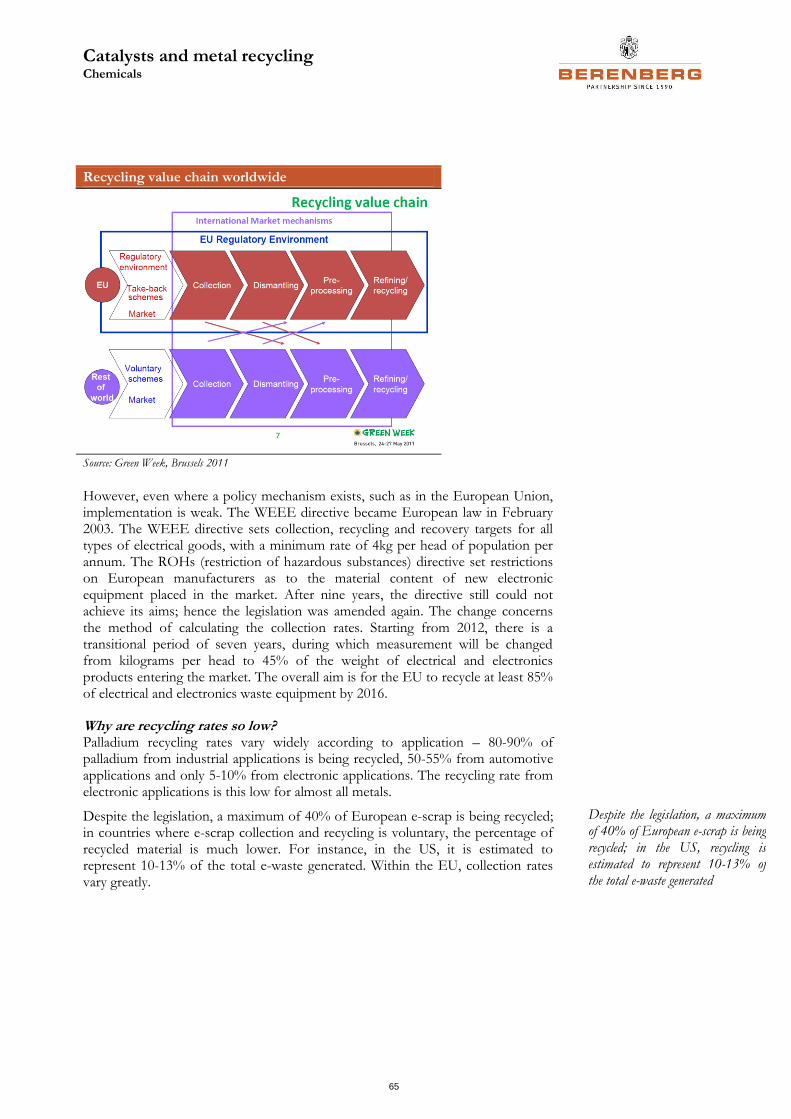
Catalysts and metal recycling Chemicals
65
Recycling value chain worldwide
Source: Green Week, Brussels 2011
However, even where a policy mechanism exists, such as in the European Union, implementation is weak. The WEEE directive became European law in February 2003. The WEEE directive sets collection, recycling and recovery targets for all types of electrical goods, with a minimum rate of 4kg per head of population per annum. The ROHs (restriction of hazardous substances) directive set restrictions on European manufacturers as to the material content of new electronic equipment placed in the market. After nine years, the directive still could not achieve its aims; hence the legislation was amended again. The change concerns the method of calculating the collection rates. Starting from 2012, there is a transitional period of seven years, during which measurement will be changed from kilograms per head to 45% of the weight of electrical and electronics products entering the market. The overall aim is for the EU to recycle at least 85% of electrical and electronics waste equipment by 2016.
Why are recycling rates so low? Palladium recycling rates vary widely according to application – 80-90% of palladium from industrial applications is being recycled, 50-55% from automotive applications and only 5-10% from electronic applications. The recycling rate from electronic applications is this low for almost all metals.
Despite the legislation, a maximum of 40% of European e-scrap is being recycled; in countries where e-scrap collection and recycling is voluntary, the percentage of recycled material is much lower. For instance, in the US, it is estimated to represent 10-13% of the total e-waste generated. Within the EU, collection rates vary greatly.
Despite the legislation, a maximum of 40% of European e-scrap is being recycled; in the US, recycling is estimated to represent 10-13% of the total e-waste generated

Catalysts and metal recycling Chemicals
66
WEEE collection rate, 2010
Source: Eurostat
According to Eurostat data, despite the growth of electronic components’ share in WEEE, the recycling rate of electronic equipment has been falling since 2005.
Eurostat WEEE statistics
33% 33%
28%31%
34%38%
0%
10%
20%
30%
40%
0
1000
2000
3000
4000
2005 2006 2007 2008 2009 2010
'00
0 t
Total WEEE IT + cons. equip.% share of waste
81.7%74.6% 74.8% 74.2% 70.4%
61.5%
0.0%
20.0%
40.0%
60.0%
80.0%
100.0%
0
500
1000
1500
2005 2006 2007 2008 2009 2010
'00
0 t
Collected IT + cons. equip.Recycled IT + cons. equip.% recycled
Source: Eurostat
In our view, the key reason for this is illegal trade. It is estimated that between It is estimated that between 50% and 80% of e-waste collected for recycling in developed countries each year is being exported
According to Eurostat data, despite the growth of electronic components’ share in WEEE, the recycling rate of electronic equipment has been falling since 2005

Catalysts and metal recycling Chemicals
67
50% and 80% of e-waste collected for recycling in developed countries each year is being exported1. Even within the EU, there are many indications that a substantial portion of Europe’s e-waste is exported to areas such as West Africa and Asia, disguised as used goods. China receives the highest proportion of all e-waste – about 70% and rising. Common Asian destinations for e-waste include China, Sri Lanka, Thailand and Vietnam. Exporters of e-waste to China can avoid detection by routing container ships through Hong Kong, Taipei or the Philippines.
Export of e-waste
Source: The global impact of e-waste; International Labour Office
WEEE value chain
E-scrap value chain
Source: Green Week, Brussels, May 2011
Collection systems include producer/retailer take-back systems and municipal collection systems. Since WEEE/e-waste is hazardous in nature, it is collected, sorted, stored and transported under controlled conditions. The business sector was the earliest user of electronic equipment; today it accounts for a sizeable proportion of total installed IT equipment. Dismantlers/recyclers pick up these items via auction or other standard business practices. Most households do not directly sell obsolete WEEE into the scrap market. Preferred practice is to undertake an exchange with the retailer when purchasing a new computer, or pass it to relatives or friends. In the event of the former, it is the retailer’s responsibility to dispose of the computer.
Scrap dealers/traders accumulate industrial quantities of e-scrap, securing it from various sources. They then decide which items ought to be dismantled and which retained for resale. In developed countries, the recycling operations may be
1 The global impact of e-waste, International Labour Office
China receives the highest proportion of all e-waste – about 70% and rising

Catalysts and metal recycling Chemicals
68
combined with dismantling operations in integrated facilities. In developing countries, the chain is much more fragmented.
After segregation, further pre-treatment is needed – for example, small-scale smelting, acid bath or open roasting. Larger scrap dealers like SIMS Metals or Multimetco have this capability; others have to outsource.
Refining is the final stage of the process where metal separation takes place.
Key problems in e-scrap recycling
Competition with low-cost “informal” recycling. 50-80% of global e-waste is being exported to Asia or northern Africa. As labour costs are low in developing countries, informal and formal recyclers apply labour-intensive pre-processing technologies, such as manual dismantling, as the primary treatment to separate the heterogeneous materials and components. A comparative study of pre-processing scenarios revealed that material recovery efficiency improves along with the depth of manual dismantling.2
Purely mechanical treatment options (as typically applied in western countries with high labour costs) lead to major losses of precious metals; in particular, in dust and ferrous fractions. For instance, circuit-boards, cell phones and other small, high-grade devices are highly complex with respect to precious metals distribution; precious-metals-containing parts are closely interlinked and precious metals are highly disseminated. Shredding (a mechanical approach, used by western countries) cannot really liberate the different materials. Sorting of these shredded parts by traditional separation techniques (magnetic etc) can lead to substantial losses of precious metals (palladium and silver, especially, are lost as dust). The pre-treatment of computer boards and circuit-boards from mobile phones should be carried out manually. The more complex/interlinked the material, the less selective are the mechanical processes and the higher the losses by co-separation.
Informal recycling has lower yields at the metallurgical stage; however, it has higher collection rates. Hence, informal recycling can not only be a lower-cost process, but can also have similar yields to formal recycling. Producer-collection schemes have the financial resources (from fees added to the purchase price of new goods) to outbid the illegal sector, but choose not to do so because this does not align with their economic incentives. Informal recycling can be stopped only if international legislation governing the worldwide movement of e-scrap is changed – and we think this is very difficult to achieve, as many countries are struggling with the legislation even at the local level.
2 Insights from a decade of development cooperation in e-waste management, Mathias Schluep, Esther Müller, Lorenz M. Hilty, Daniel Ott, Rolf Widmer, Heinz Böni
Refining is the final stage of the process, where metal separation takes place
Informal recycling has lower yields at the metallurgical stage; however, it has higher collection rates. Informal recycling can not only be a lower-cost process, but can also have similar yields to formal recycling
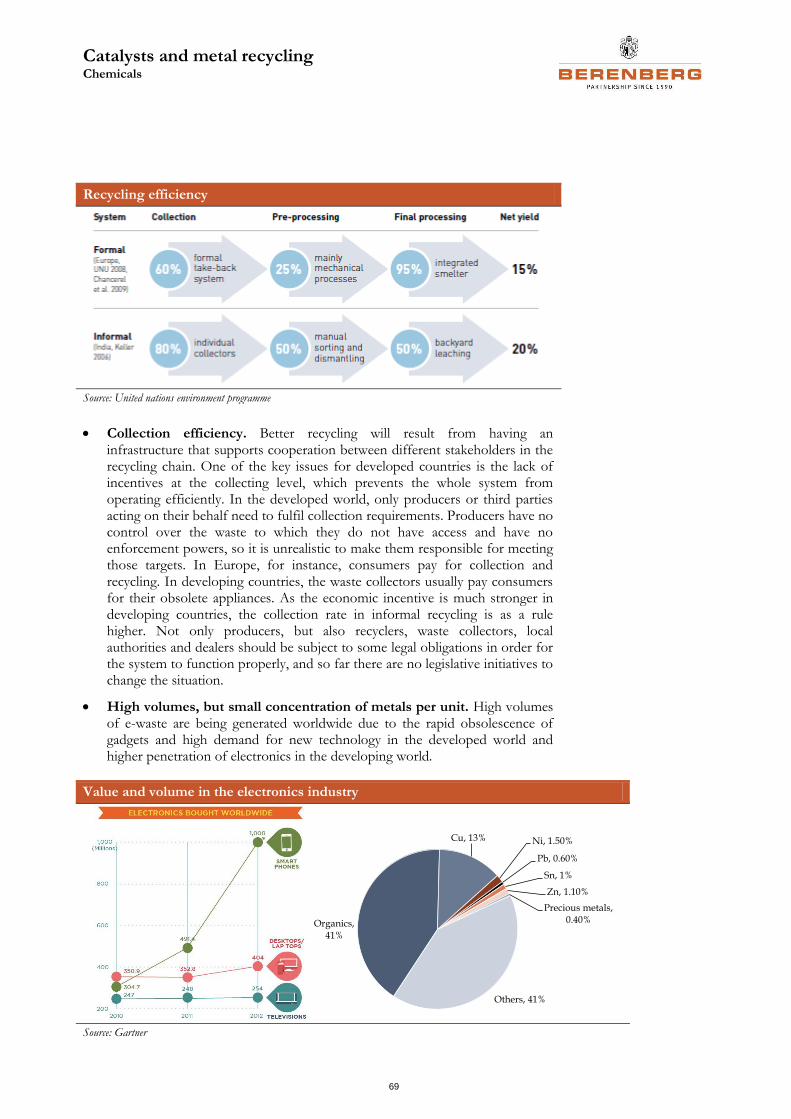
Catalysts and metal recycling Chemicals
69
Recycling efficiency
Source: United nations environment programme
Collection efficiency. Better recycling will result from having an infrastructure that supports cooperation between different stakeholders in the recycling chain. One of the key issues for developed countries is the lack of incentives at the collecting level, which prevents the whole system from operating efficiently. In the developed world, only producers or third parties acting on their behalf need to fulfil collection requirements. Producers have no control over the waste to which they do not have access and have no enforcement powers, so it is unrealistic to make them responsible for meeting those targets. In Europe, for instance, consumers pay for collection and recycling. In developing countries, the waste collectors usually pay consumers for their obsolete appliances. As the economic incentive is much stronger in developing countries, the collection rate in informal recycling is as a rule higher. Not only producers, but also recyclers, waste collectors, local authorities and dealers should be subject to some legal obligations in order for the system to function properly, and so far there are no legislative initiatives to change the situation.
High volumes, but small concentration of metals per unit. High volumes of e-waste are being generated worldwide due to the rapid obsolescence of gadgets and high demand for new technology in the developed world and higher penetration of electronics in the developing world.
Value and volume in the electronics industry
Organics, 41%
Cu, 13% Ni, 1.50%
Pb, 0.60%
Sn, 1%
Zn, 1.10%
Precious metals, 0.40%
Others, 41%
Source: Gartner

Catalysts and metal recycling Chemicals
70
The metal value in one mobile phone is c€1. 100 tonnes of mobile phones contain only 4.1kg of precious metals. Very often, the relatively small weight of precious metal per unit makes recycling uneconomic. This leads to a low level of recycling of small and high-grade devices.
Mobile phones recycling rate in various countries
Source: Gartner
Economic incentive. Many of the world’s existing recycling policies have grown out of environmental policies and are often still under the control of environmental ministries. This sometimes obscures the fact that recycling is primarily an economic activity. In general, there is not enough value in most e-waste to cover the costs of managing it. This is why legislation plays a more dominant role than in the case of recycling industrial or automotive catalysts.
Imperfections of legislation. Current WEEE legislation in the EU and Japan focuses on mass recovery, which favours steel, base metals, plastics or glass used in large quantities, whereas precious and specialty metals, found in small electrical and electronic equipment, are often not recovered. As the targets do not consider metallurgical steps, the high legal recycling targets assume a recycling quality that in reality is not obtained. For instance, the EU’s End of Life Vehicles directive requires an 85% recycling rate. If smelting and refining are included, real recycling rates will be much lower, especially for precious and specialty metals.
Poor design and complexity. E-waste imposes many challenges on the recycling industry, as it contains many different materials that are mixed, bolted, screwed, snapped, glued or soldered together. Hence, responsible recycling requires intensive labour and/or sophisticated and costly technologies that safely separate materials.
Law enforcement. Only one-third of WEEE generated in the EU is officially reported as being treated in line with the WEEE directive. Part of the waste is collected but unreported and treated without appropriate environmental care or shipped illegally to treatment sites outside Europe. Better accountability of stakeholders is required.
Addressable e-scrap market for precious metals recyclers
Key players in the industry have given their assessment of e-scrap availability for precious metals refiners, as shown below.
The metal value in one mobile phone is c€1; 100 tonnes of mobile phones contain only 4.1kg of precious metals. This leads to a low level of recycling of small and high-grade devices

Catalysts and metal recycling Chemicals
71
Availability of computer scrap, tonnes per annum
Source: Umicore, Boliden
Both Umicore and Boliden estimate the e-scrap market will reach 250,000-300,000 tonnes per year by 2016. Note that by “global addressable market” we imply mostly Europe and Japan, as other regions do not have the appropriate legislation to ensure formal e-scrap recycling (for instance, the US recycles only 10-13% of e-scrap). We estimate that other regions will remain closed to formal recycling as long as:
an economic incentive for the illegal export of e-waste exists (non-formal recycling benefits from lower costs and sometimes higher yields); and
there is no clear accountability among the stakeholders in the process.
Below is our analysis of the addressable market reported by the metal refiners versus data from Eurostat.
Addressable e-scrap market
Source: Umicore, Boliden, Eurostat, Berenberg estimates
According to the metal recyclers, the addressable market represents approximately a quarter of the recycled IT and telecoms scrap given by the Eurostat figures. This is due to the fact that approximately 75% of e-scrap’s weight consists of ceramics, glass and plastics, which are not treated by the metal recyclers. Umicore expects average annual growth to be 10% until 2015.
We now examine the global capacity for e-scrap refining.
Both Umicore and Boliden estimate the e-scrap market will reach 250,000-300,000 tonnes per year by 2016
According to our estimates, global e-scrap recycling capacity currently exceeds 400,000 tonnes, whereas available e-scrap will only reach 300,000 tonnes by 2015

Catalysts and metal recycling Chemicals
72
Major smelting and refining companies that have e-scrap refining capabilities
Country Company Profile Capacity (kt)
Canada Xstrata
Copper smelter and refinery in Ontario and a lead smelter in New Brunswick; takes an
assortment of electronic components to recover copper and other metals. The only e-
scrap metal refinery in North America. Increased capacity from 50kt to 100kt per year in
2010. Recycles e-scrap not only from North America, but also Europe 100
Belgium Umicore
Smelter and refinery that can recover 20 metals from a wide range of input materials.
Has widest product offering in the metal recycling industry. Invested over €0.5bn in the
past 15 years 35
Germany Aurubis
Copper company that refines copper containing materials from the waste management
sector, including e-scrap. In 2011 invested €62.5m to increase level of e-scrap capacity
from 75kt to 140kt tonnes per year 110
Sweden,
Norway,
Finland Boliden
Company has 3 smelters and refineries in Europe that recover copper and precious
metals. A new plant was completed in 2011 that expanded e-scrap capacity from 45kt to
120kt per year (Capex $200m) and made Boliden the largest recycler in the world. Treats
e-scrap from East Coast of North America and Europe. Started capacity on 01/06/2012 120
Japan Dowa
A major Japanese metal and mining company with a smelter that specialises in recovery
of PGMs and rare earths from electronics and used autocatalysts N/A
Korea LS-Nikko Copper
Specialised in producing electronic copper cathodes used in various materials. Metal
recycling is one of its 4 major business areas. In addition to copper, its facilities recover
gold, silver, selenium, platinum and palladium. Operates Recytech Korea, a subsidiary
that specialises in the recovery of copper and other metals from scrap and used
electronics N/A
Japan
Nippon Mining and
Metals Group
Recovers 16 different metals, including precious and rare metals by a combination of
hydro and pyro metallurgical processes (similar to Umicore). Recycles auto catalysts
and electronic scrap mainly in Tokyo metropolis. Has built a recycling collection facility
in Taiwan N/A Source: Berenberg estimates, Company data
As the table above shows, a number of producers have dedicated e-scrap treatment capacities. In North America, there is currently only one dedicated recycler – Xstrata. Our conversations with European companies (Aurubis, Boliden, Umicore) indicate that, despite all of them having looked at the North American market, they do not expect any considerable growth in e-scrap availability in the region, as current legislation indirectly incentivises the export of WEEE to Asia. Xstrata’s capacity is more than sufficient to satisfy not only North American recycling needs, but also to treat some of the waste from Europe.
In Europe, several copper refiners (Aurubis, Boliden) have upgraded their capacity recently. This is due to the fact that their main business of copper recycling and refining is facing challenging times, as costs have increased and treatment and refining charges have fallen. As a result, copper refiners are looking for additional revenue streams. They also want to participate in the potential growth of WEEE recycling caused by European directives.
In Japan, the market is being served by local players which are more than able to absorb all the available WEEE.
According to Aurubis, global copper smelting capacity is equal to approximately 4m tonnes per year. Based on our research and conversations with industry experts, we estimate the potential incremental e-scrap treatment capacity to reach up to 100,000 tonnes per year, as primary refiners can add up to 5% of e-scrap to their copper stream without causing disruptions in the technological process.

Catalysts and metal recycling Chemicals
73
International custom smelter output (2012, primary; 000t)
Aurubis
Nippon Mining and Metals
Mitsubishi Materials
LS Nikko
Sumitomo Metal Mining
Jinchuan
Jiangxi Copper Co.
Sterlite Industries
Tongling
Birla Copper
570
480
300
430
390
360
310
470
260
260
Source: Aurubis
According to our estimates, global e-scrap recycling capacity currently exceeds 400,000 tonnes, whereas the available e-scrap will only reach 300,000 tonnes by 2015.
Based on our analysis, we think that the market is overestimating the potential growth in e-scrap availability. The majority of the materials which are available and profitable to recycle are already being recycled. Radical changes in legislation and product design are required for further growth of the addressable market.
We also think that there is currently overcapacity in e-scrap treatment facilities globally, which will lead to stronger competition among the players for the available e-scrap and potentially a decline in treatment charges.
Metal recycling technology
As we have discussed, pre-treatment is required for metal scrap recycling. Recycling technology is not usually the limiting factor for increasing recycling rates. Collection, dismantling and pre-processing are crucial for value generation and toxic control.
Value chain of metal recycling
Source: Umicore

Catalysts and metal recycling Chemicals
74
The diagram above shows the value chain for metal recycling. The pyrometallurgy (smelting) and hydrometallurgy (leaching) steps are normally combined for the treatment of complex materials.
Pyrometallurgy uses thermal energy and the chemical/metallurgical properties of substances to melt down ores or secondary materials in order to concentrate target metals for further processing and separate non-target substances into a slag and/ or volatile phase (for instance, blast furnace or convertor).
Hydrometallurgy uses acidic or alkaline solutions, as well as pressure and temperature and the chemical properties of substances to separate target from non-target substances via a leachate (solution) and a leaching residue (for instance, solvent extraction, cyanide leaching of gold, electro-winning of copper etc).
EOL products – complex materials source
Source: Umicore
Hydrometallurgy cannot provide high yields of complex-composition scrap (for instance, WEEE). Informal recycling of PGMs in Asia and Africa is normally based on leaching. Leaching can be used for the extraction of gold, palladium and silver from scrap with a rich content of PGMs. It allows quick access to PGMs, comes with low investment costs and is often available locally. However, leaching has lower yields than pyrometallurgy, a number of elements (such as lead, tin, nickel, antimony etc) cannot be recovered via leaching, and without necessary precautions it is extremely harmful for human health and the environment (for instance, HC emissions are 370x thresholds).
After pre-processing, materials are normally sent to a smelter (or treated with leaching agents). Both primary and secondary smelters can recover PGMs from the mixture.
The first step involves extracting metals, which are easily re-processed to their elemental form. The remaining elements, which are represented in the form of slag, can sometimes be extracted in subsequent steps. Elements remaining in the metal phase cannot be separated, with the exception of copper and lead smelting, where consecutive processing steps allow for the removal of the alloying elements (a fact benefiting the recovery of precious metals from e-waste).
The pyrometallurgical process normally uses base metals as collectors for precious metals and other “impurities”, such as antimony, bismuth, tin, selenium, tellurium and indium.
Illegal recycling is extremely harmful for human health and for the environment

Catalysts and metal recycling Chemicals
75
Lead/copper and complex materials containing copper and PGMs are the basic feed to the smelter. The smelter’s role is to separate lead slag and impure copper. Impure copper will then be sent for leaching; slimes containing PGMs are subsequently fed to PGM concentration for further treatment. Lead bullion (collecting silver, gold and some palladium) will be treated in the blast furnace. The precious metals will be separated out in a leaching residue.
We think that the market misunderstands metal recycling technology – Umicore (as well Nippon Mining) has a very wide offering of recyclable metals, but copper, zinc and lead smelters also have the ability to recycle precious metals. This is based on the properties of copper, lead and zinc attracting precious metals. The smelters always have precious metals-containing slime as a result of their main production (copper, lead or zinc) and it is their choice whether to sell the slime for further treatment to the likes of Umicore or invest in treatment capabilities themselves.
Umicore recycling
Source: Umicore
Recently, several copper and lead refiners (Aurubis, Boliden) have added e-scrap recycling capacities to their main smelters. It is possible to add these capacities without disturbing the main process – it is simply an incremental feedstock in their main smelter. The key investments a metal refining company will make if e-scrap is being treated are an additional furnace (RC-rotary convertor), a steam boiler for excess heat recovery and gas-cleaning equipment, as process gases from the recycling of electronic equipment contain hazardous substances which primary metal concentrates do not contain.
Copper, zinc and lead smelters also have the ability to recycle precious metals
Recently, several copper and lead refiners (Aurubis, Boliden) have added e-scrap recycling capacities to their main smelters

Catalysts and metal recycling Chemicals
76
Aurubis e-scrap process
Source: Aurubis
Normally, there are considerable synergies between electronic recycling and metal production from concentrate, as in limited quantities e-scrap does not interrupt the metal refining process.
In practice, one of the major limitations to metal recycling lies in the need for metal production to pay for itself. For scarce and valuable metals, the demand and supply volumes of various minor elements are generally too small to justify a dedicated recycling plant for such metals in EOL goods. The processing of recyclate streams currently occurs mostly on the back of large-scale production of base metals with compatible thermodynamic properties; ie carrier metals such as copper, iron, lead, lithium, nickel, rare-earths (oxides), tin, titanium and zinc.
Any metallurgical plant will only process available metal scrap on the back of its normal operations, when economically viable to do so. The capex of metallurgical production plants can be very high, and opex will vary. Opex includes labour costs (markedly different in different parts of the world), energy, waste management, water purification, emissions control, occupational health and safety, and consumables. Technological efficiency plays a key role, and is in turn determined by the level of available expertise and by the degree of innovation in metallurgical and recycling technologies. Because of the high capex, smelters require sufficiently large economies of scale in order to operate. Profitable recycling smelters run well over 100,000 tonnes per year of diverse feed.
Feedstock streams
Feedstock streams vary in metal complexity and difficulty of treatment. Umicore can treat the widest variety of feedstock; it also has an integrated process, which
Normally, there are considerable synergies between electronic recycling and metal production from concentrate, as the use of e-scrap does not interrupt the metal refining process
Capex of metallurgical production plants can be very high, and opex will vary
One of the major limitations of metal recycling lies in the need for metal production to pay for itself

Catalysts and metal recycling Chemicals
77
allows for considerable synergies during the process and low lead times compared to competitors.
Integrated metals smelting
Source: Umicore
One of the key differences between PGM miners, metal refiners and the likes of Umicore and Johnson Matthey is that the former mostly deal with primary feedstock (for example, PGM or copper, zinc concentrates), whereas the latter deal with EOL products and the by-products of metal refineries (automotive catalysts, industrial catalysts, WEEE, residues from the smelting process). For metal refineries and PGM miners, concentrate treatment is the main source of revenues, whereas the treatment of the residues is the secondary stream. They can opt to invest in additional equipment in order to carry this out in-house or outsource it to the likes of Umicore. For Umicore, these residues will be the main revenue source.
In its refining business, Johnson Matthey specialises in platinum-related metals and has the highest exposure to this group (platinum, palladium, silver). Umicore refines a wide variety of precious metals, based on copper, lead, zinc and nickel as carrier metals.

Catalysts and metal recycling Chemicals
78
Feedstock split
JM scrap12%
Mines14%
Glass8%
Refiners11%
Pharma11%
Others9%
JMAT refining feedstocks
Autocat scrap35%
Electronic scrap10%
Umicore refining feedstocks
Automotive catalysts
10%Industrial
by-products80%
Source: Berenberg estimates, Company data
Around 32% of Johnson Matthey’s feedstock in refining comes from the customers which buy Johnson Matthey’s products (closed-loop recycling). This includes industrial catalysts for refiners, pharmaceuticals and glass.
Johnson Matthey has higher exposure to automotive catalysts as a source of feedstock (35% of total raw materials volume, whereas Umicore has only 10% exposure to automotive catalysts). Umicore is able to treat e-scrap, whereas Johnson Matthey does not have this capability. Both companies treat secondary sources of feedstock (EOL products; residues from PGM refineries like Impala, Amplats etc; residues from copper, zinc and nickel smelters).
Umicore has higher exposure to industrial residues, whereas Johnson Matthey has higher exposure to EOL products.
EOL products have higher value per unit of volume, so they are an extremely important source of feedstock.
Feedstock breakdown by volume and value
End of life products
20%
By-products
80%
Umicore feedstocks breakdown by volume
End of life products
37%
By-products
63%
Umicore feedstocks breakdown by value
Source: Berenberg estimates, Company data
Metal recycling: key revenue streams
Recycling is essentially a processing business that achieves a margin on the feedstock treated, while to a large extent the price of the underlying metal is effectively passed through. Both Johnson Matthey and Umicore exclude the value associated with passed-through metal prices from their adjusted revenues.
Catalysts and metal recycling Chemicals
79
The key revenue streams
Treatment charge (€/£ per kg of the incoming concentrate);
refining charge (€/£ per kg of metal credited);
sampling and assay charge (€/£ per lot);
the value of “free” metal (ie refined metal produced by the recycler over and above the metal content the recycler has paid for in concentrates it purchased from the client);
by-products (sulphuric acid in Umicore’s case); and
metal management.
There are two very common types of contractual relationship.
Purchase contract. This is established when the customer does not want the metal to be returned after refining and demands instant payment. As EOL products have quite a long supply chain (for example, automotive catalysts, WEEE), this type of contract is used more frequently with EOLs. The recycler pays the metal price (normally based on an LME reference price) according to the metal yield, determined during the assaying process, subtracting assaying, treatment and refining charges.
Toll manufacturing. In the case of toll manufacturing, the recycler does not take ownership of the metal at any stage of the refining process; ownership stays with the customer. The client has to pay assaying/refining and treatment charges. This mode of treatment is very beneficial for the recycler, as no working capital is required. Sometimes, when a customer does not have metal trading capability/need for refined metal, it will sell the metal to the refiner at the end of the process. There is also a possibility of a metal swap at the end of process (for instance palladium for gold).
Both Johnson Matthey and Umicore have metal management capabilities, where they provide leasing, hedging, trading and physical delivery of metals.
Key determinants of the contract
Treatment price in €/£ (which includes assaying, treatment and refining charges);
metal credit in per cent – technical yield of recovery;
metal availability in days, which determines processing time; and
as metal loses its identity (ie ownership) when it enters the recycling stream, it is possible for the recycler to lease it if the recycling process is finished before the agreed time.
Contract frequency
Spot;
six months to two years; or
“evergreens” (with notice period).
Many suppliers of refining services prefer “evergreen” contracts, as they have continuous streams of residues which need to be treated.
Toll manufacturing is very beneficial for the recycler, as no working capital is required

Catalysts and metal recycling Chemicals
80
Value-add of recyclers versus metal smelters
Base metal smelters (copper, zinc, lead, nickel etc) have similar pricing mechanisms for their products; however, their profitability and ROCE are lower than those of metal recyclers due to the lower value-add associated with base metals processing.
The table below shows five companies’ ROCE. Aurubis is the largest copper smelter in Europe; it is not integrated into mining. Boliden is a copper and zinc mining and smelting company (smelting represents 80% of revenues). Nyrstar was formerly part of Umicore; it mines and refines zinc (smelting represents 77% of revenues).
ROCE of various smelting and recycling businesses
2012 ROCE Aurubis 27% Boliden 18% Nyrstar -0.55% Umicore recycling 88% Johnson Matthey recycling 60% Source: Berenberg estimates, Company data
Johnson Matthey does not report capital employed for its precious metals services business separately, so ROCE is for the precious metals division, which includes manufacturing business. This drags ROCE down.
It is not possible to compare the operating margin of the businesses, as metal smelters do not exclude the value of the metal from their reported revenues.
PGM recyclers have a higher ROCE than metal smelters. This is due to several factors.
Treatment and refining charges in the metal smelting industry are far more standardised and competitive than they are in the recycling industry. Treatment charges in the smelting industry are defined by the supply/demand dynamics between mining and smelting capacity. If smelting capacity exceeds mining production, a greater share of the metal value goes to the miner. Conversely, when concentrates are relatively abundant, a greater share of the value goes to the smelter. In metal recycling, the complexity of treated material is much higher and only a limited number of players are able to extract the metals economically; hence a greater share of metal value goes to the recycler.
The complexity of the input is reflected in the existence of the assaying charge, which is determined separately for each lot in recycling. Assaying charges do not exist in smelting.
Smelters normally buy concentrates from miners, whereas a major part of recycling is carried out on a tolling basis; hence working capital requirements differ dramatically. In 2012, inventory represented 159 days of sales for Nyrstar, 87 days of sales for Boliden and 59 days for Aurubis. We estimate that for Johnson Matthey and Umicore, inventory in the recycling divisions is less than a month of sales.
The treatment charge involves a base charge, which is agreed at a reference metal price. In both smelting and recycling, the treatment charge contains a formula that causes the agreed price to be increased or decreased by a fixed percentage with certain price fluctuations of the underlying metals.
A free metal component exists in both smelting and recycling; however, in recycling, minor metals are often being extracted which are not of interest to
PGM recyclers have higher ROCE than metal smelters

Catalysts and metal recycling Chemicals
81
the client. The recycler therefore does not have to pay the supplier for these metals. The importance of the free metal component is greater in the case of recycling.
Often, incremental value-add is generated because the recycler is capable of extracting metals economically, whereas competitors/customers are not able to do so. This technological superiority allows for significant premiums in treatment charges.
Treatment charges in recycling are determined for each individual lot and can vary with the composition of the underlying metals in the input. Treatment charges in smelting are mostly determined by the supply/demand balance in mining/smelting capacities. Recycling has a higher value-added component, which translates into higher ROCE.
Concentrates used by metal smelters as feedstock contain precious and minor metals, such as tellurium, selenium, antimony, lead etc. When a smelter buys concentrate from a miner, minor metals are often considered as impurities and the miner has to pay penalties if concentrations of these metals are above certain accepted levels. The smelter in turn should pay credits to the miner if PGM concentrations are above defined levels.
During the smelting process, refiners are able to extract certain quantities of precious metals; however, the residues, which have very high concentrations of both precious and minor metals, are normally treated by the recycler. The recycler has the technical capability to extract these metals, which the smelter lacks. In the past, for the smelter the cost of extraction was often higher than the value of the metals. As a result, most of the metal value is transferred to the recycler in the form of treatment and refining charges.
Value-added recycling
Source: Umicore
Effect of metal price fluctuations on revenues and profits
Revenue impact Recyclers normally hedge 100% of the metal exposure within the quantities defined by the metal credit yield in their contracts. Formally, they are exposed to any fluctuations in price between the moment they purchase raw materials (price-in) and the moment they sell the product to the customer (price-out). At any given time, they are likely to hold metal, either as work-in-progress or stock-on-hand, that has been “priced-in” but not “priced-out”; companies normally refer to this metal as “metal at risk”. Normally, all the recyclers (including Johnson Matthey
During the smelting process, refiners are able to extract certain quantities of precious metals; however, the residues, which have very high concentrations of both precious and minor metals, are normally treated by the recycler
Recyclers normally hedge 100% of the metal exposure within the quantities defined by the metal credit yield in their contracts
Recycling has a higher value-added component, which translates into higher ROCE
Catalysts and metal recycling Chemicals
82
and Umicore) hedge 100% of metals at risk (no transactional exposure). The same is true of their transactional currency exposure (as a base, dollar-denominated LME prices are used as a reference).
In Umicore’s case, however, hedging is only possible for seven out of 20 metals, as the market for minor metals lacks liquidity.
The treatment charge also has a metal price component. It includes a base charge, which is agreed at a reference metal price. This charge incorporates a formula that causes the agreed price to be increased or decreased by a fixed percentage with certain price fluctuations of the underlying metals.
Finally, the free metal component (in the event of over-recovery of the metal relative to the quoted metal credit yield) is also subject to metal price fluctuations.
It is industry standard to hedge “metal at risk”; whether or not to hedge treatment charges and free metal exposure is up to the individual company. For instance, Umicore has historically engaged in “structural hedging” or “cash flow” hedging, which is the forward-hedging of metal price exposure that derives from the impact that metal prices have on treatment charges and on free metal recovered from materials supplied for treatment and refining. Specifically, Umicore forward-hedges its forecast exposure to metal prices and its currency risk when metal prices expressed in euros or exchange rates are above their historical averages and are at levels where attractive margins could be secured. This structural hedging includes the use of forward contracts on metals and forward contracts on currencies. Johnson Matthey does not hedge its free metal exposure.
Effect on profits The effect of metal price fluctuations on profits is much greater than it is on revenues, especially in the case of more diversified feedstock streams (as Umicore has).
Recyclers’ metal yields and profitability very much depend on the feedstock mix. In order to achieve maximum process efficiency in recycling, a particular input mix is required. For instance, for Umicore, residues from base metal smelting and precious metal refining represent 80% of volumes but only 63% of value, as the precious metal concentration in EOL products is much higher than it is in the refining slimes.
Recycling often involves smelting (pyrometallurgical treatment). It is essential that a smelter runs at full capacity all the time in order to keep fixed costs per tonne as low as possible. It takes up to a week to idle a smelter. Furthermore, the shutdown of a smelter bears the risk of damage to the refractory material and ultimately, halting the smelter would interrupt the subsequent refining process. We think that fixed costs represent up to 75% of total costs in recycling (excluding the cost of the metal, which is a pass-through). As a result, a recycler has to operate the smelter 24/7, even if the input mix is not optimal.
Recyclers hedge the majority of their metal exposure; scrap collectors normally do not hedge at all. As a result, when metal prices fall, collectors hold onto the scrap and wait until metal prices recover.
This can negatively affect recyclers’ input mix – the share of EOL products in the mix declines and the share of industrial residues rises. As a result, the value of metal per tonne of scrap goes down, whereas costs stay essentially unchanged, as volumes do not fall.
As a result, metal price fluctuations have a disproportionate effect on recyclers’ operating margins.
In Umicore’s case, however, hedging is only possible for seven out of 20 metals, as the market for minor metals lacks liquidity
Johnson Matthey does not hedge its free metal exposure, while Umicore does
The effect of metal price fluctuations on profits is much more dramatic than it is on revenues, especially in the case of more diversified feedstock streams
We think that fixed costs represent up to 75% of total costs in recycling (excluding the costs of the metal)
Recyclers hedge the majority of their metal exposure; scrap collectors normally do not hedge at all

Catalysts and metal recycling Chemicals
83
Traditional base metal refiners entering the recycling market
Base metal refiners always have precious-metals-containing slimes as a result of their main production (copper, lead or zinc) and it is their choice whether to sell the slimes for further treatment to the likes of Umicore or invest in treatment capabilities themselves. Umicore has a unique technology which allows it to recover metals economically, even if their concentration in the residue is small (for instance, minor metals). We do not think that metal smelters will be able to recover minor metals for precisely this reason, but they have the ability to recover precious metals.
Treatment charges in the smelting industry are defined by the supply/demand dynamics between mining and smelting capacity. If smelting capacity exceeds mining production, a greater share of the metal value goes to the miner. Conversely, when concentrates are relatively abundant, a greater share of the value goes to the smelter.
For the last few years, smelting capacity in several base metals (copper, zinc, for example) has exceeded mining capacity, which weakened the treatment charges of the smelters. The price of by-products has also collapsed (in 2013 ytd, the NW European sulphuric acid price has fallen by 76%). Finally, metal prices have fallen consistently, which affects the revenues from free metal.
Base metals price dynamics
Source: Bloomberg
As a result, smelters found all three of their revenue streams (treatment charges, free metal sales and by-product sales) under pressure, which negatively affected their margins and returns. Companies were forced to look for alternative sources of income.
The increase in e-waste treatment capacity by Boliden and Aurubis is one example of such incremental revenue streams.
Another recent trend is to increase the proportion of PGM-containing residues treated in-house instead of outsourcing them to metal recyclers such as Umicore.
Recently, Aurubis announced its intention to increase value-add by processing the group’s internal precious-metal-bearing anode slimes in-house. Project capex to achieve this was about €50m, with operations starting in June 2013.
In 2008, Aurubis bought Cumerio, which allowed it to increase its copper anode production capacity to 1m tonnes annually (from 600,000 tonnes previously). Aurubis’ Hamburg smelter had the ability to treat precious metal slimes; however, the smelter’s capacity was limited and it could only deal with existing quantities of residues. Cumerio had no capacity for slime treatment. As Cumerio was historically part of Umicore, it had a long-term contract with the company.
Base metal smelters have seen all three of their key revenue streams (treatment charges, free metal sales and by-product sales) decline in recent years
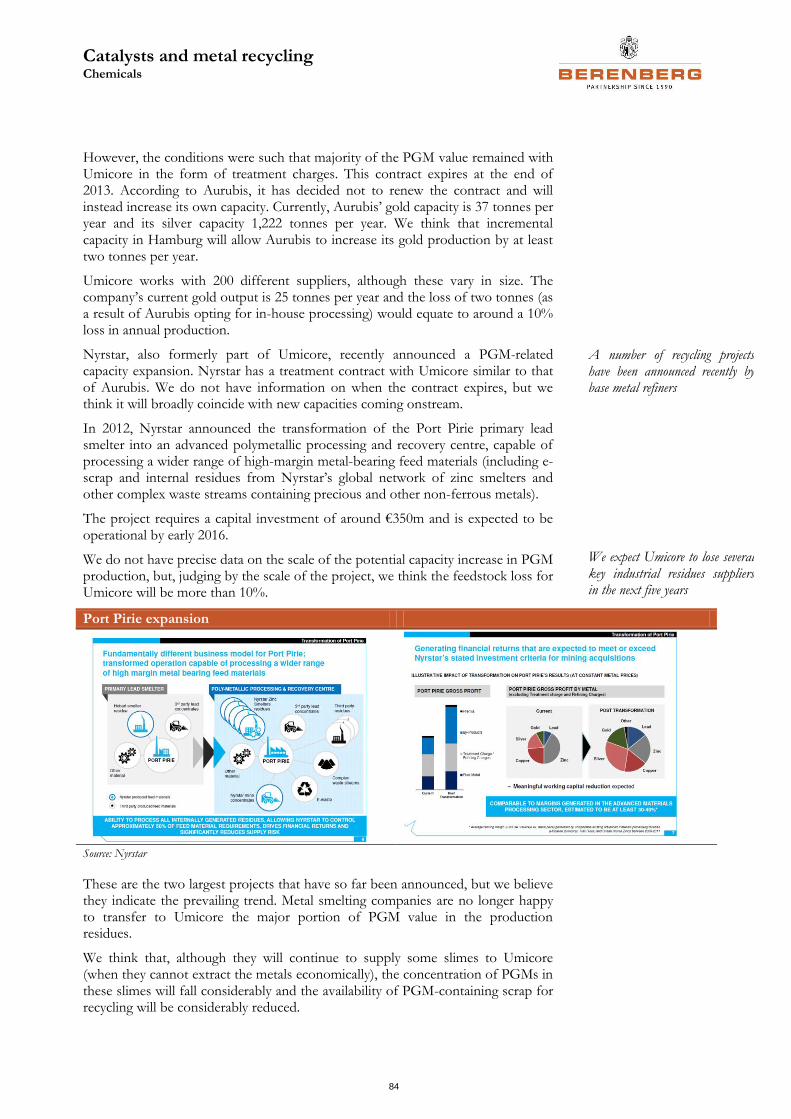
Catalysts and metal recycling Chemicals
84
However, the conditions were such that majority of the PGM value remained with Umicore in the form of treatment charges. This contract expires at the end of 2013. According to Aurubis, it has decided not to renew the contract and will instead increase its own capacity. Currently, Aurubis’ gold capacity is 37 tonnes per year and its silver capacity 1,222 tonnes per year. We think that incremental capacity in Hamburg will allow Aurubis to increase its gold production by at least two tonnes per year.
Umicore works with 200 different suppliers, although these vary in size. The company’s current gold output is 25 tonnes per year and the loss of two tonnes (as a result of Aurubis opting for in-house processing) would equate to around a 10% loss in annual production.
Nyrstar, also formerly part of Umicore, recently announced a PGM-related capacity expansion. Nyrstar has a treatment contract with Umicore similar to that of Aurubis. We do not have information on when the contract expires, but we think it will broadly coincide with new capacities coming onstream.
In 2012, Nyrstar announced the transformation of the Port Pirie primary lead smelter into an advanced polymetallic processing and recovery centre, capable of processing a wider range of high-margin metal-bearing feed materials (including e-scrap and internal residues from Nyrstar’s global network of zinc smelters and other complex waste streams containing precious and other non-ferrous metals).
The project requires a capital investment of around €350m and is expected to be operational by early 2016.
We do not have precise data on the scale of the potential capacity increase in PGM production, but, judging by the scale of the project, we think the feedstock loss for Umicore will be more than 10%.
Port Pirie expansion
Source: Nyrstar
These are the two largest projects that have so far been announced, but we believe they indicate the prevailing trend. Metal smelting companies are no longer happy to transfer to Umicore the major portion of PGM value in the production residues.
We think that, although they will continue to supply some slimes to Umicore (when they cannot extract the metals economically), the concentration of PGMs in these slimes will fall considerably and the availability of PGM-containing scrap for recycling will be considerably reduced.
A number of recycling projects have been announced recently by base metal refiners
We expect Umicore to lose several key industrial residues suppliers in the next five years

Umicore SA Chemicals
85
Recycling at risk
● We initiate coverage of Umicore with a Sell rating and a price target of €26/share (22% downside to the current share price). Umicore is one of the leading companies in the areas of recycling and automotive catalysts. It has unique technical capabilities that allow it to recycle various feedstock streams and recover up to 20 metals. The recent underperformance of the stock reflects, in our view, market concerns about the short-term performance of the largest division – Recycling (c61% of group EBIT in 2012) – due to declining precious metal prices. We have conducted an in-depth analysis of the recycling industry globally and expect the competitive dynamics to deteriorate significantly in the medium term.
● We expect a decrease in the availability of key recycling feedstocks: electronic scrap (e-scrap) and industrial residues. Contrary to market expectations, we do not expect e-scrap availability to increase in the medium term. On the other hand, recent capacity additions in e-scrap treatment have led to significant overcapacity in the market. Industrial residues – PGM-containing slimes of base metals (copper, lead, zinc) – were historically treated by Umicore. Recently, however, a number of metal refiners have invested in their own capacities. For instance, we believe the termination of the company’s supply agreement with Aurubis might lead to around a 10% fall in Umicore’s gold output. The other divisions will not be able to compensate for the deterioration in Recycling.
● Umicore is targeting double-digit annual growth in its Catalysis, Energy Materials and Recycling divisions between 2012 and 2015/20 and 15%+ group ROCE between 2012 and 2015. We assume 7.5% annual sales growth for the Catalysis division; 7% for Energy Materials and -1% for Recycling. We do not think Umicore will be able to reach 15% ROCE earlier than 2016. We are 8% below consensus on 2013 EPS; for 2014 we are 24% below consensus. The main difference comes from the Recycling division, where we are 11.5% below consensus on 2013 EBIT and 40% below on 2014 EBIT.
• Our price target of €26/share is DCF-derived. Umicore is trading on 19.1x 2014 P/E (Berenberg estimate) – a premium of around 50% to its historical average of 12.45x – and on 10.1x 2014 EV/EBITDA (Berenberg estimate) – a premium of around 30% to its historical average of 8x.
Sell (initiation) Rating system
Current price
EUR 33.73
Absolute
Price target
EUR 26.00 11/07/2013 Brussels Close Market cap EUR 4,048 m Reuters UMI.BR Bloomberg UMI BB Share data
Shares outstanding (m) 112 Enterprise value (EUR m) 4,441 Daily trading volume 586,180
Performance data
High 52 weeks (EUR) 43 Low 52 weeks (EUR) 32 Relative performance to SXXP SX4P 1 month -8.5 % -9.9 % 3 months -2.1 % -3.7 % 12 months -22.7 % -27.4 %
15 July 2013
Evgenia Molotova Analyst +44 20 3465 2664 [email protected]
Jaideep Pandya Analyst +44 20 3207 7890 [email protected]
John Klein Analyst +44 20 3207 7930 [email protected]
Y/E 31.12., EUR m 2011 2012 2013E 2014E 2015E
Sales 14,479 12,547 11,522 11,161 11,878
EBITDA 553 524 457 444 505
EBIT 416 372 290 274 327
Net profit 325 234 180 175 211
Y/E net debt (net cash) 267 223 235 220 262
EPS (reported) 2.84 2.08 1.60 1.56 1.88
EPS (recurring) 2.70 2.47 1.87 1.77 2.10
CPS 4.50 3.59 3.28 3.34 2.92
DPS 1.00 1.00 1.00 1.03 1.06
Gross margin 10.9% 12.4% 13.0% 13.0% 13.0%
EBITDA margin 3.8% 4.2% 4.0% 4.0% 4.2%
EBIT margin 2.9% 3.0% 2.5% 2.5% 2.8%
Dividend yield 2.8% 2.4% 2.8% 2.9% 2.9%
ROCE 15.7% 13.3% 9.5% 8.8% 10.0%
EV/sales 0.3 0.4 0.4 0.4 0.4
EV/EBITDA 8.2 9.8 9.7 10.1 8.9
EV/EBIT 10.9 13.8 15.3 16.3 13.7
P/E 12.6 15.8 18.0 19.1 16.1
Cash flow RoEV 9.8% 8.4% 8.5% 8.2% 9.2%
Source: Company data, Berenberg
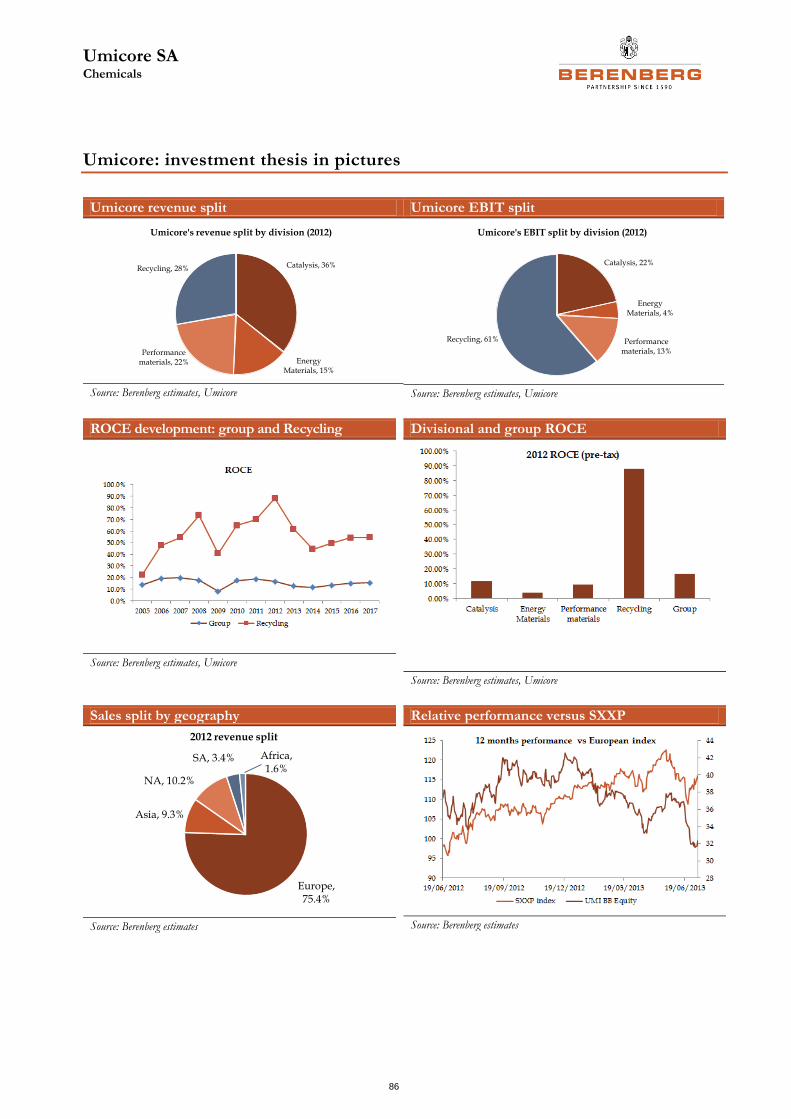
Umicore SA Chemicals
86
Umicore: investment thesis in pictures
Umicore revenue split
Catalysis, 36%
Energy Materials, 15%
Performance materials, 22%
Recycling, 28%
Umicore's revenue split by division (2012)
Source: Berenberg estimates, Umicore
Umicore EBIT split
Catalysis, 22%
Energy Materials, 4%
Performance materials, 13%
Recycling, 61%
Umicore's EBIT split by division (2012)
Source: Berenberg estimates, Umicore
ROCE development: group and Recycling
Source: Berenberg estimates, Umicore
Divisional and group ROCE
Source: Berenberg estimates, Umicore
Sales split by geography
Europe, 75.4%
Asia, 9.3%
NA, 10.2%
SA, 3.4% Africa, 1.6%
2012 revenue split
Source: Berenberg estimates
Relative performance versus SXXP
Source: Berenberg estimates

Umicore SA Chemicals
87
Umicore: investment thesis
We initiate coverage of Umicore with a Sell rating and a price target of €26/share.
Two-minute summary: The company is targeting double-digit growth in its Catalysis, Energy Materials and Recycling divisions between 2012 and 2015/20 and 15%+ group ROCE between 2012 and 2015. We see these targets as unrealistic Our annual sales growth assumption for the Catalysis division is 7.5%; in Energy Materials 7% and in Recycling -1%. We do not think that Umicore will be able to reach 15% ROCE earlier than 2016. Our earnings estimates for 2013 and 2014 are considerably below consensus. Umicore’s guidance for 2013 recurring EBIT is €300m-350m; our forecast is €290m.
Our more conservative view is driven mostly by our expectation of deteriorating fundamentals in Umicore’s metal-recycling division. Recycling accounts for 61% of Umicore’s EBIT; the division’s ROCE reached a record 88% in 2012, whereas the group’s ROCE was 16.7%. Contrary to the market, we expect the availability of high-quality metal scrap to decline in the medium term. This means that Umicore will have to process higher volumes of scrap in order to reach the same metal yields it has now. We expect divisional sales to fall and costs to grow, which will lead to considerable EBIT and ROCE erosion.
Other divisions will not be able to compensate for the deterioration in Recycling. We think the Catalysis division will demonstrate the strongest growth, but this is already in our and consensus numbers. The Performance Materials division has high exposure to the European construction market, which will continue to weigh on its earnings. The Energy Materials division combines a number of cutting-edge technologies where Umicore has leading positions. Unfortunately, the current macroeconomic climate has rendered these business units loss-making and we do not expect major improvements in the medium term.
We do not expect Umicore’s Capex to decline in the medium term, as it is expanding capacity in a number of areas. We see further downside risk to our earnings numbers. Umicore has reached the maximum processing capacity at its recycling smelter. According to our estimates, it will require €150m-170m of capital investment in order to further grow its recycling volumes (versus current group capex of €250m annually). But even without such an expansion project, we expect Umicore’s EV FCF yield to remain around the 2.5% level for the next five years, versus the sector average of 4.5%.
Key investment point 1: Recycling EBIT and ROCE to deteriorate
We think that in 2013, the Recycling division’s ROCE will fall to 61% and the group’s ROCE to 12.7%.
We expect some fundamental changes in the industry which will lead to a decline in the availability of high-quality metal scrap. By contrast, the market expects further improvements in scrap availability in the medium term.
In the past five years, metal smelters’ revenues have come under pressure, forcing them to seek alternative revenue streams. Companies such as Aurubis have therefore made considerable investments in recycling capacity (of both end-of-life – EOL – products and industrial residues).
E-scrap is one of the most profitable categories of EOL products. It has a very

Umicore SA Chemicals
88
high concentration of precious and minor metals relative to other scrap feedstock. According to our estimates, global e-scrap recycling capacity currently exceeds 400,000 tonnes, whereas available e-scrap will only reach 300,000 tonnes by 2015. Based on our analysis, we think that the market is overestimating the potential growth in e-scrap availability. The majority of the materials which are available and profitable to recycle are already being recycled (legally or illegally). Recent capacity additions by a number of players have led to considerable overcapacity in e-scrap treatment.
In the past, base metal smelters used to outsource the treatment of their PGM-containing production slimes to the likes of Umicore. Now, they have the capability to treat them in-house. For instance, Aurubis had a long-term contract with Umicore which is coming to an end in 2013; Aurubis has decided not to renew it. Based on our calculations, the loss of this contract could result in the loss of 10% of Umicore’s gold output. Nyrstar is another company which intends to end its contract in 2015-16.
A deterioration in the availability of high-PGM-containing scrap will lead to a change in the incoming metal mix for Umicore. Until now, Umicore has been able to “cherry-pick” its feedstock streams in order to optimise the incoming scrap mix and maximise PGM output. We think this will become much more difficult in future.
As the metal mix deteriorates, the recycler begins to treat fewer precious metals and more base metals (lead, copper and zinc). As a result, revenues decline significantly, whereas costs remain broadly unchanged or even increase, as the recycler has to process higher volumes in order to reach the same precious metal yields. This will have a negative impact on ROCE and EBIT.
In addition, in the short term declining PGM and minor metal prices will also have a negative effect on the Recycling division.
Key investment point 2: Positive surprise potential in the Catalysis division is limited
Umicore expects double-digit annual growth in its Catalysis division in the next five years; we forecast 7.5% growth.
Growth in Catalysis is driven by legislative changes. In light-duty vehicles (LDV), there are no major legislative changes until 2015 and we expect the sales of Umicore’s Catalysis division to grow in line with the market at 5.5% per year. In heavy-duty diesel (HDD), the catalyst market in Europe should double due to Euro VI legislation coming into force in January 2014. We expect Umicore to increase its global market share to 7% by 2015-16. Johnson Matthey dominates this market with around a 65% share; Umicore currently has around 3%.
We think future developments in the catalyst market are already reflected in consensus numbers and do not see much potential for positive surprise.
Key investment point 3: Cutting-edge technology, but not commercially viable medium term
Umicore’s Performance Materials and Energy Materials divisions combined represent 37% of group sales, but only 17% of EBIT.
In Performance Materials, the company is heavily exposed to European construction, which negatively affects its upside potential.

Umicore SA Chemicals
89
In Energy Materials, the company has a number one market position in several cutting-edge technologies such as cathode materials for electric vehicles (EVs), concentrated photovoltaics (CPV) and thin film. Unfortunately, the current macroeconomic climate makes all three technologies commercially non-viable. At present, Umicore is loss-making in thin film and CPV. We do not expect any considerable improvement in the Energy Materials division in the short term.
Our estimates for the Performance Materials division are broadly in line with consensus. For Energy Materials, we are 11% below consensus on 2013 EBIT and 18% below on 2014.
Berenberg versus consensus
We are 9% below consensus on 2013 EBIT and 8% below on EPS; for 2014 we are 24% below consensus on both EBIT and EPS. The main difference comes from the Recycling division, where we are 11.5% below consensus on 2013 EBIT and 40% below on 2014 EBIT. We are also 7% below consensus estimates for the 2014 dividend.
Relative and absolute valuation
Our target price of €26/share is DCF-derived. The stock is trading on 18x 2013 P/E and 19.1x 2014 P/E (Berenberg estimates) versus its historical average of 12.45x. The stock is trading on 9.7x 2013 EV/EBITDA and 10.1x 2014 EV/EBITDA (Berenberg estimates) – again, at a premium to its historical average of 8x.
Blue sky/doomsday scenario
Our blue sky scenario reflects a recovery in precious metals prices and increasing availability of high-quality metal scrap. In this case, the company will continue to generate CFROI substantially higher than its cost of capital even at the terminal stage of DCF. The scenario also assumes a decrease in the capital intensity of the business.
Under our blue sky scenario, we reach 68% ROCE for the Recycling division by 2017 (versus an average of 67% over the last five years) and group ROCE of 17.8% (versus an average of 11.5% over the last five years). In our base case scenario, 2017 ROCE for the Recycling division is 54.3% and group ROCE is 15.6%.
Running our DCF on the data above, our price target increases from €26/share to €35/share. This scenario implies 4% upside to the current share price.
Under our doomsday scenario, we assume a situation similar to 2009, when the availability of precious metals scrap fell sharply and the profitability of the Recycling division collapsed. In this case, the company’s CFROI equals its cost of capital at the terminal stage of DCF.
Under the doomsday scenario, we reach 43.2% ROCE for the Recycling division by 2017 (versus an average of 67% over the last five years) and group ROCE of 13.8% (versus an average of 11.5% over the last five years). In this case, based on our DCF analysis, our price target would be €20/share, which implies 68% downside to the current share price.

Umicore SA Chemicals
90
Key risks to the investment thesis
1. Greater availability of EOL products. The average concentration of precious metals in ores from primary mining is approximately 10g/tonne, whereas (for instance) the concentration of gold in PC circuit-boards is 200-250g/tonne and in cell phones 300-350g/tonne. Hence EOL product scrap has a much higher concentration of PGMs than any other type of recycling feedstock. Currently, EOL products represent only 20% of Umicore’s feedstock volumes (e-waste accounts for half of these EOL volumes), but almost 40% of the value of the metals treated. Should the volume of EOLs increase, the precious metals yield of Umicore’s output will increase substantially. Only 5-10% of the precious metals from electronic applications are recycled legally at present. It is estimated that between 50% and 80% of e-waste collected each year for recycling in developed countries is being exported and recycled illegally. We regard a change in this trend as unlikely. Radical changes in international legislation and changes in product design are required for further growth of the addressable market in e-scrap.
2. Better availability of industrial residues. In our base case scenario, we assume that many base metal smelters increase their in-house precious metal treatment capabilities and Umicore loses certain feedstock streams. If this trend reverses, Umicore’s returns in the Recycling division will improve. We regard this as unlikely, as base metal smelters have already committed to capex programmes.
3. Strong growth in global industrial production in the short term. A strong recovery in industrial production could result in substantial price increases for Umicore’s key metals. This would lead to an improvement in Recycling division and group ROCE.
4. A higher-than-expected growth rate and share of the HDD catalysts market. A stronger performance of the HDD catalysts market than we currently expect could lead to a positive surprise in the Catalysis division.

Umicore SA Chemicals
91
Stock performance and relative valuation
Umicore has recently underperformed both the SXXP and the chemicals sector.
Stock performance
Source: Bloomberg
However, we still see downside to the share price. The stock is trading on 18x 2013 P/E and 19.1x 2014 P/E (Berenberg estimates) versus its historical average of 12.45x. The chart below shows relative P/E development based on consensus estimates. Our EPS estimates are 8% below consensus for 2013 and 24% below for 2014, but even on consensus numbers the stock is trading at a premium to its historical average P/E.
Umicore’s P/E history
Source: Bloomberg
The stock is trading on 9.7x 2013 EV/EBITDA and 10.1x 2014 EV/EBITDA (Berenberg estimates) – again, at premium to its historical average of 8x. We are 5.5% below consensus for 2013 EBITDA and 17% below 2014 EBITDA; hence on our numbers the stock looks expensive.

Umicore SA Chemicals
92
Umicore’s EV/EBITDA history
Source: Bloomberg

Umicore SA Chemicals
93
Peer group analysis
ROCE EV/Sales EV/EBITDA P/E
Company 2013 2013 2014 2013 2014 2013 2014
Diversified chemicals
Akzo Nobel 8.3% 0.9x 0.8x 7.4x 6.0x 13.9x 11.2x
Arkema SA 13.6% 0.9x 0.8x 5.9x 5.0x 10.4x 9.5x
BASF 16.9% 1.0x 1.0x 6.9x 5.9x 13.0x 11.7x
Clariant 8.2% 1.0x 0.9x 7.4x 6.4x 13.1x 11.0x
Croda 32.8% 3.4x 3.1x 11.6x 10.5x 17.0x 15.5x
DSM 8.3% 1.1x 1.0x 8.4x 7.3x 14.1x 11.8x
Elementis 24.9% 1.9x 1.7x 8.1x 7.0x 12.3x 11.2x
Fuchs Petrolub 41.2% 1.0x 1.0x 5.3x 5.2x 18.2x 18.8x
Givaudan 12.1% 2.9x 2.7x 13.9x 13.0x 25.1x 23.0x
LANXESS 7.0% 0.7x 0.7x 7.1x 5.7x 14.2x 9.4x
Naturex 8.8% 1.7x 1.5x 12.7x 10.8x 16.8x 14.0x
Solvay 7.4% 1.1x 1.0x 7.3x 6.4x 14.3x 11.8x
Symrise 15.3% 2.5x 2.3x 11.6x 10.6x 19.5x 17.9x
Average 15.8% 1.5x 1.4x 8.7x 7.7x 15.5x 13.6x Industrial gases
Air Liquide 11.1% 2.4x 2.3x 9.8x 9.2x 18.0x 16.2x
Linde 9.0% 2.1x 1.9x 9.1x 8.3x 17.0x 15.1x
Catalysts Johnson
Matthey 14.1% 2.5x 2.2x 12.5x 11.3x 19.1x 17.6x
Umicore 9.5% 1.9x 1.9x 9.7x 10.1x 18.0x 19.1x Source: Berenberg estimates

Umicore SA Chemicals
94
Key investment point 1: Recycling EBIT and ROCE to deteriorate
• In 2012, the Recycling division represented 28% of Umicore’s revenue (excluding precious metals) but 61% of its EBIT. The division’s ROCE reached a record 88%, whereas group ROCE was 16.7%.
• We expect the availability of high-quality scrap to decline considerably in the medium term. Base metal refiners are changing their business model in search of incremental revenue streams. They will substantially increase their e-scrap and industrial residues treatment. A number of key customers, such as Aurubis (c10% of Umicore’s gold output on our estimates) and Nyrstar, are commissioning their own recycling capacities in 2013-16 and reviewing their contracts with Umicore.
• Reduced scrap availability means that Umicore will have to process higher volumes of scrap in order to reach the same metal yields it has now. We therefore expect Umicore’s revenues to decline and its costs to rise.
• We are 11.5% below consensus on Recycling EBIT for 2013 and 40% below consensus for 2014. The company is targeting double-digit growth in this division in the next five years; we expect growth to be negative.
Division at a glance
Umicore’s Recycling division consists of four business units.
Precious metals refining can recover 20 precious and non-ferrous metals from a wide range of feedstock streams, including EOL products, industrial residues and e-scrap. It has a unique technology which allows Umicore to recover metals economically, even when their concentration in scrap feedstock is very low. This technology gives Umicore a considerable advantage over competitors.
Precious metals management offers a range of services to internal and external customers, including leasing, hedging and physical delivery of metals.
Battery recycling is a unique technology which works at ultra-high temperatures (UHT) and allows a range of valuable metals to be extracted in a clean and efficient way. Umicore targets primarily car battery recycling, but UHT technology can also be used for other feedstock.
Jewellery and industrial metals produces semi-finished precious-metals-based products for jewellery and industrial applications and is a major recycler of scrap and residues from the jewellery industry.
Five forces analysis of the recycling industry
The bargaining power of suppliers is limited, but increasing. In the majority of cases in the recycling industry, suppliers are also clients. The recycler obtains metal scrap from the client and returns extracted metal. Treatment charges are the key revenue stream for the recycler. In the past, the structure of the treatment charge allowed the recyclers to capture a large proportion of the underlying metal value. However, as recycling technology matures, more players are entering the market, with the suppliers themselves investing in metal treatment facilities. We think that these changes will affect the structure of treatment charges and reduce the value of the metal captured by the supplier.

Umicore SA Chemicals
95
The bargaining power of customers: see point above.
Competitive rivalry is increasing due to fundamental changes in the industry. We expect scrap availability to decline in the medium term. Recyclers will have to compete with their own suppliers for available feedstock material.
The risk of substitution is low. Metals can be either mined or recycled. Recycling feedstock has much higher metal concentrations than ore does. Recycling is therefore a much more cost-efficient method of metal production than mining.
The threat of new entrants is increasing. Scrap suppliers (mostly base metal refiners) are becoming increasingly involved in metal recycling, as they are reluctant to share a significant portion of the value of the recovered metal with the recycler.
Recycling is a key driver of the company’s earnings and ROCE
In 2012, the Recycling division represented 28% of Umicore’s revenue (excluding precious metals) but 61% of its EBIT. The division’s ROCE reached a record 88%, whereas the group’s ROCE was 16.7%.
The company is targeting a 15% ROCE between 2012 and 2015 and Recycling is the key driver of this target. However, we think that in 2013 the division’s ROCE will already drop to 61% and the group’s ROCE to 12.7%.
We expect competitive intensity in recycling to increase, as traditional base metal refiners are entering the metal recycling market. We think this will have a twofold effect on Umicore’s profitability:
1. competition in the recycling market will drive refining charges down; and
2. the availability of precious metal scrap will be reduced.
This will negatively affect the availability of scrap metal for recycling. The metal mix is extremely important for Recycling EBIT and ROCE.
Recycling often involves smelting (pyrometallurgical treatment). It is essential that a smelter runs at full capacity all the time in order to keep fixed costs per tonne as low as possible. It takes up to a week to idle a smelter. Furthermore, the shutdown of a smelter bears the risk of damage to the refractory material, and ultimately a halt at the smelter would interrupt the subsequent refining process. We think that fixed costs represent up to 75% of total costs in recycling (excluding the cost of the metal, which is a pass-through). As a result, a recycler has to operate the smelter 24/7, even if the input mix is not optimal.
As the metal mix deteriorates, the recycler begins to treat fewer precious metals and more base metals (lead, copper and zinc). As a result, revenues decline significantly, whereas costs remain broadly unchanged or even increase, as the recycler has to process higher volumes in order to reach the same precious metal yields.
We think that there are fundamental changes in the recycling industry which will lead to a reduction in refining charges and metal yields for Umicore. This will negatively affect ROCE and EBIT.
We expect the availability of raw materials to decline in both EOL products (such as e-scrap) and industrial residues.
According to our estimates, global e-scrap recycling capacity currently exceeds 400,000 tonnes, whereas available e-scrap will only reach 300,000 tonnes by 2015. Based on our analysis, we think that the market is overestimating the potential

Umicore SA Chemicals
96
growth in e-scrap availability. The majority of the materials which are available and profitable to recycle are already being recycled. Radical changes in legislation and product design are required for further growth of the addressable market.
In the past, base metal smelters used to outsource the treatment of their PGM-containing production slimes to the likes of Umicore. Now, they have the capability to do this in-house. For instance, Aurubis had a long-term contract with Umicore which is coming to an end in 2013; Aurubis has decided not to renew it. Based on our calculations, the loss of this contract could result in the loss of 10% of Umicore’s gold feedstock. Nyrstar is another company which intends to end its contract in 2015-16.
Recycling EBIT and ROCE development
0.0%
10.0%
20.0%
30.0%
40.0%
50.0%
60.0%
70.0%
80.0%
90.0%
100.0%
2002 2004 2006 2008 2010 2012 2014 2016
ROCE EBIT margin
Source: Berenberg estimates, Umicore
In the short term, we see three more negative factors:
1. limited capacity at Umicore’s Hoboken smelter;
2. the decline in precious metal prices; and
3. the decline in minor metal prices.
Umicore’s integrated smelter in Hoboken has refining capacity of 350,000 tonnes per year for more than 200 different types of raw material, ranging from industrial residues to EOL materials. The operation can efficiently recover 20 different metals. According to Umicore, it has invested over €1bn in the Hoboken complex throughout the facility’s existence. However, Umicore cannot increase processing volumes further because it has already reached the smelter’s maximum capacity. In 2012, the company made some investments in upgrading sampling and assaying capabilities, but smelting capacity remains the bottleneck.
Economies of scale are crucial in recycling, and profitable recycling smelters run well over 100,000 tonnes per year of diverse feed. Based on recent investments undertaken by Boliden and Aurubis, we estimate the potential capex for a similar increase in smelting capacity at €150m-170m (versus current divisional capex of €67m). Umicore management has not yet committed to this investment, as competitors’ recycling capacity additions have put the investment return at risk. Our view is that, should Umicore add another smelter now, it will further decrease its ROCE in the medium term. We do not include incremental capex in our model, which limits potential volume growth for the division.
Precious metal prices are very important in determining the availability of raw

Umicore SA Chemicals
97
materials. Recyclers hedge the majority of their metal exposure; scrap collectors normally do not hedge at all. As a result, when metal prices fall, collectors hold onto the scrap and wait until metal prices recover. This can negatively affect recyclers’ input mix – the share of EOL products in the mix declines and the share of industrial residues rises. As a result, the value of metal per tonne of scrap goes down, whereas costs stay essentially unchanged, as volumes do not fall.
Concentrates used by copper, zinc and lead smelters as feedstock always contain minor metals, such as tellurium, selenium, antimony etc. When a smelter buys concentrate from a miner, minor metals are often considered as impurities and the miner has to pay penalties if concentrations of these metals are above certain accepted levels. Hence, when a smelter sells residues to the recycler, the recovery of minor metals is not always required and the recycler obtains them free (if it is able to extract them economically from the residues).
Minor metals are very important for the recycler as a major portion of their value is translated into revenues. We think that minor metals represent 10-12% of Umicore’s revenues excluding metals.
We show our divisional forecast in the table below.
Recycling division summary (€m)
Source: Berenberg estimates
Revenue streams in Recycling
Recycling is essentially a processing business that achieves a margin on the feedstock treated, while to a large extent the price of the underlying metal is effectively passed through. Umicore excludes the value derived from passed-through metal prices from its adjusted revenues.

Umicore SA Chemicals
98
Integrated metals smelting
Source: Umicore
The key revenue streams
Treatment charge (€/£ per kg of the incoming concentrate);
refining charge (€/£ per kg of metal credited);
sampling and assay charge (€/£ per lot);
the value of “free” metal (ie refined metal produced by the recycler over and above the metal content the recycler has paid for in concentrates it purchased from the client);
by-products (sulphuric acid in Umicore’s case); and
metal management.
Very often, metal treatment is carried out on a toll manufacturing basis. Under this arrangement, the recycler does not take ownership of the metal at any stage of the refining process; ownership remains with the customer and the latter has to pay assaying/refining and treatment charges. This mode of treatment is very beneficial for the recycler as no working capital is required.
Treatment and refining charges in the metal-smelting industry are far more standardised and competitive than they are in the recycling industry. In metal recycling, charges are set separately for each batch. The complexity of the input is reflected in the existence of the assaying charge. During the assaying process, the recycler determines a list of the metals that can be extracted from the concentrate, the yield that it can achieve economically and the timeframe within which the process can be completed.
The treatment charge involves a base charge, which is agreed at a reference metal price. It also contains a formula that causes the agreed price to be increased or decreased by a fixed percentage with certain price fluctuations of the underlying metals.

Umicore SA Chemicals
99
Although treatment charges are linked to metal prices, the complexity of the incoming metal mix is a much more important determinant.
For many of Umicore’s competitors, the cost of extracting certain metals from the mixture (especially when their concentration is low) exceeds the metals’ value. As a result, Umicore’s treatment charge is structured such that most of the metals’ value is transferred to the recycler (ie to itself) rather than to a customer.
Value-added recycling
Source: Umicore
We think that with the increase in recycling capacity, the treatment charge will be influenced more by the supply/demand balance. A greater proportion of the metal value will remain with the customer rather than the recycler, which should negatively affect Umicore’s revenues in Recycling.
E-scrap is hard to find
EOL products have a higher value per unit of volume than other recycling feedstocks (with e-waste having the highest value) and as a result are a key factor in the recycler’s profitability. The average concentration of precious metals in ores from primary mining is approximately 10g/tonne, whereas the concentration of gold in PC circuit-boards (for example) is 200-250g/tonne and in in cell phones 300-350 g/tonne.
Feedstock breakdown by volume and value
End of life products,
20%
By-products,
80%
Umicore feedstocks breakdown by volume
End of life products,
37%
By-products,
63%
Umicore feedstocks breakdown by value
Source: Berenberg estimates, Company data
EOL products represent only 20% of Umicore’s feedstock volumes (with e-waste accounting for half of the EOL product volume) but almost 40% of the value of

Umicore SA Chemicals
100
the metals treated. This is due to the higher concentration of precious and minor metals in EOL products. Their availability is crucial for Umicore’s profitability.
Only 5-10% of precious metals used in electronic applications are recycled. Europe is the only region where it is compulsory for the electronic goods producer to recycle e-scrap. Despite the legislation, a maximum of 40% of European e-scrap is being recycled; in countries where e-scrap collection and recycling is voluntary, the percentage of recycled material is much lower. For instance, in the US, it is estimated to represent 10-13% of the total e-waste generated. Within the EU, collection rates vary greatly.
According to Eurostat data, despite the growth of electronic components’ share in WEEE, the recycling rate of electronic equipment has been falling since 2005.
Eurostat WEEE statistics
Source: Eurostat
In our view, the key reason for this is illegal trade. It is estimated that between 50% and 80% of e-waste collected for recycling in developed countries each year is being exported3. Even within the EU, there are many indications that a substantial portion of Europe’s e-waste is exported to areas such as West Africa and Asia, disguised as used goods. China receives the highest proportion of all e-waste – about 70% and rising.
Contrary to the market, we do not expect the availability of e-waste to improve
As labour costs are low in developing countries, informal and formal recyclers apply labour-intensive pre-processing technologies, such as manual dismantling, as the primary treatment to separate the heterogeneous materials and components. Purely mechanical treatment options (as typically applied in western countries with high labour costs) lead to major losses of precious metals; in particular, in dust and ferrous fractions. The more complex/interlinked the material, the less selective are the mechanical processes and the higher the losses by co-separation. Informal recycling has lower yields at the metallurgical stage; however, it has higher collection rates. Hence, informal recycling can not only be a lower-cost process, but can also have similar yields to formal recycling.
3 The global impact of e-waste, International Labour Office

Umicore SA Chemicals
101
Recycling efficiency
Source: United Nations Environment Programme
Due to their lower costs, informal recyclers can offer 10-15% higher prices for e-scrap. Producer-collection schemes have the financial resources (from fees added to the purchase price of new goods) to outbid the illegal sector, but choose not to do so because this does not align with their economic incentives. Informal recycling can be stopped only if international legislation affecting the worldwide movement of e-scrap is changed – and we think this is very difficult to achieve, as many countries are struggling with the legislation even at the local level.
However, many of the world’s existing recycling policies have grown out of environmental policies and are often still under the control of environmental ministries. This sometimes obscures the fact that recycling is primarily an economic activity.
In regions where legislation is in place, such as Europe, it is often imperfect and lacks transparency.
Current WEEE legislation in the European Union (EU) and Japan focuses on mass recovery, which favours steel, base metals, plastics or glass used in large quantities, whereas precious and specialty metals, found in small electrical and electronic equipment, are often not recovered. As the targets do not consider metallurgical steps, the high legal recycling targets assume a recycling quality that in reality is not obtained. For instance, the EU’s End of Life Vehicles directive requires an 85% recycling rate. If smelting and refining are included, real recycling rates will be much lower, especially for precious and special metals.
Legal enforcement is also very low. Only one-third of WEEE generated in the EU is officially reported as being treated in line with the WEEE directive. Part of the waste is collected but unreported and treated without appropriate environmental care or shipped illegally to treatment sites outside Europe.
Key players in the industry have given their assessment of e-scrap availability, as shown below.

Umicore SA Chemicals
102
Availability of computer scrap, tonnes per annum
Source: Umicore, Boliden
Both Umicore and Boliden estimate the e-scrap market will reach 250,000-300,000 tonnes per year by 2016. Note that by “global addressable market” we imply mostly Europe and Japan, as other regions do not have the appropriate legislation to ensure formal e-scrap recycling. Below is our analysis of the addressable market reported by the metal refiners versus data from Eurostat.
Addressable market of e-scrap
Source: Umicore, Boliden, Eurostat, Berenberg estimates
According to the metal recyclers, the addressable market represents approximately a quarter of the recycled IT and telecoms scrap given by the Eurostat figures. This is due to the fact that approximately 75% of e-scrap’s weight consists of ceramics, glass and plastics, which are not treated by the metal recyclers. Umicore expects average annual growth to be 10% until 2015.
We now examine the global capacity for e-scrap refining.
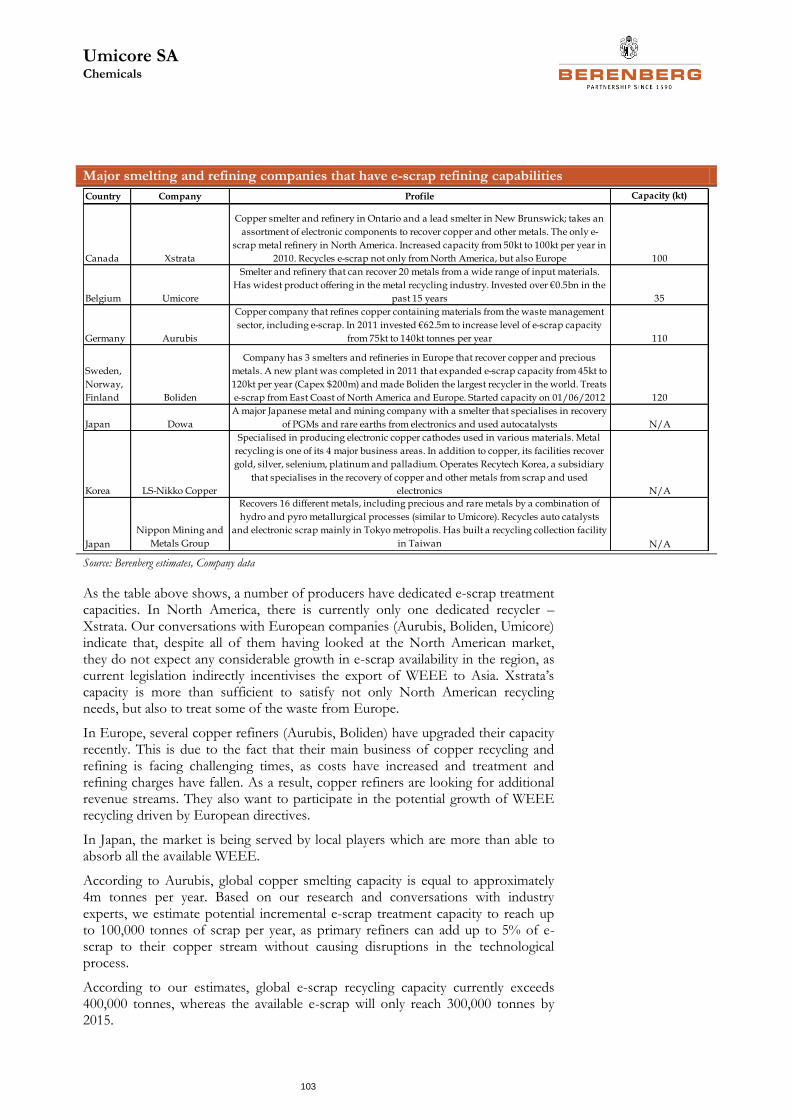
Umicore SA Chemicals
103
Major smelting and refining companies that have e-scrap refining capabilities
Country Company Profile Capacity (kt)
Canada Xstrata
Copper smelter and refinery in Ontario and a lead smelter in New Brunswick; takes an
assortment of electronic components to recover copper and other metals. The only e-
scrap metal refinery in North America. Increased capacity from 50kt to 100kt per year in
2010. Recycles e-scrap not only from North America, but also Europe 100
Belgium Umicore
Smelter and refinery that can recover 20 metals from a wide range of input materials.
Has widest product offering in the metal recycling industry. Invested over €0.5bn in the
past 15 years 35
Germany Aurubis
Copper company that refines copper containing materials from the waste management
sector, including e-scrap. In 2011 invested €62.5m to increase level of e-scrap capacity
from 75kt to 140kt tonnes per year 110
Sweden,
Norway,
Finland Boliden
Company has 3 smelters and refineries in Europe that recover copper and precious
metals. A new plant was completed in 2011 that expanded e-scrap capacity from 45kt to
120kt per year (Capex $200m) and made Boliden the largest recycler in the world. Treats
e-scrap from East Coast of North America and Europe. Started capacity on 01/06/2012 120
Japan Dowa
A major Japanese metal and mining company with a smelter that specialises in recovery
of PGMs and rare earths from electronics and used autocatalysts N/A
Korea LS-Nikko Copper
Specialised in producing electronic copper cathodes used in various materials. Metal
recycling is one of its 4 major business areas. In addition to copper, its facilities recover
gold, silver, selenium, platinum and palladium. Operates Recytech Korea, a subsidiary
that specialises in the recovery of copper and other metals from scrap and used
electronics N/A
Japan
Nippon Mining and
Metals Group
Recovers 16 different metals, including precious and rare metals by a combination of
hydro and pyro metallurgical processes (similar to Umicore). Recycles auto catalysts
and electronic scrap mainly in Tokyo metropolis. Has built a recycling collection facility
in Taiwan N/A Source: Berenberg estimates, Company data
As the table above shows, a number of producers have dedicated e-scrap treatment capacities. In North America, there is currently only one dedicated recycler – Xstrata. Our conversations with European companies (Aurubis, Boliden, Umicore) indicate that, despite all of them having looked at the North American market, they do not expect any considerable growth in e-scrap availability in the region, as current legislation indirectly incentivises the export of WEEE to Asia. Xstrata’s capacity is more than sufficient to satisfy not only North American recycling needs, but also to treat some of the waste from Europe.
In Europe, several copper refiners (Aurubis, Boliden) have upgraded their capacity recently. This is due to the fact that their main business of copper recycling and refining is facing challenging times, as costs have increased and treatment and refining charges have fallen. As a result, copper refiners are looking for additional revenue streams. They also want to participate in the potential growth of WEEE recycling driven by European directives.
In Japan, the market is being served by local players which are more than able to absorb all the available WEEE.
According to Aurubis, global copper smelting capacity is equal to approximately 4m tonnes per year. Based on our research and conversations with industry experts, we estimate potential incremental e-scrap treatment capacity to reach up to 100,000 tonnes of scrap per year, as primary refiners can add up to 5% of e-scrap to their copper stream without causing disruptions in the technological process.
According to our estimates, global e-scrap recycling capacity currently exceeds 400,000 tonnes, whereas the available e-scrap will only reach 300,000 tonnes by 2015.

Umicore SA Chemicals
104
Based on our analysis, we think that the market is overestimating the potential growth in e-scrap availability. The majority of the materials which are available and profitable to recycle are already being recycled. Radical changes in legislation and product design are required for further growth of the addressable market.
We also think that there is currently overcapacity in e-scrap treatment facilities globally, which will lead to stronger competition among the players for the available e-scrap and potentially a decline in treatment charges. We expect that the share of e-scrap treated by Umicore could fall from 10% of total feedstock (in volume) to 5%.
Availability of industrial residues is also worsening
Base metal smelters (copper, zinc, lead, nickel etc) have similar pricing mechanisms for their products; however, their profitability and ROCE are lower than those of metal recyclers due to the lower value-add associated with base metals processing.
The table below shows five companies’ ROCE. Aurubis is the largest copper smelter in Europe; it is not integrated into mining. Boliden is a copper and zinc mining and smelting company (smelting represents 80% of revenues). Nyrstar was formerly part of Umicore; it mines and refines zinc (smelting represents 77% of revenues).
ROCE of various smelting and recycling businesses
2012 ROCE Aurubis 27% Boliden 18% Nyrstar -0.55% Umicore recycling 88% Johnson Matthey recycling 60% Source: Berenberg estimates, Company data Johnson Matthey does not report capital employed for its precious metals services business separately, so ROCE is for the precious metals division, which includes manufacturing business.
PGM recyclers have considerably higher ROCE than metal smelters.
We think that the market misunderstands metal recycling technology – Umicore (as well Nippon Mining) has a very wide offering of recyclable metals, but copper, zinc and lead smelters also have the ability to recycle precious metals. This is based on the properties of copper, lead and zinc attracting precious metals. Concentrates which metal smelters use as feedstock contain precious and minor metals, such as tellurium, selenium, antimony, lead etc.
The smelters always have precious-metals-containing slimes as a result of their main production (copper, lead or zinc) and it is their choice whether to sell the slimes for further treatment to the likes of Umicore or invest in treatment capabilities themselves. Umicore has a unique technology which allows it to recover metals economically, even if their concentration in the residue is small (for instance, minor metals). We do not think that metal smelters will be able to recover minor metals for precisely this reason, but they have the ability to recover precious metals.
Treatment charges in the smelting industry are defined by the supply/demand dynamics between mining and smelting capacity. If smelting capacity exceeds mining production, a greater share of the metal value goes to the miner.

Umicore SA Chemicals
105
Conversely, when concentrates are relatively abundant, a greater share of the value goes to the smelter.
For the last few years, smelting capacity in several base metals (copper, zinc, for example) has exceeded mining capacity, which weakened the treatment charges of the smelters. The price of by-products has also collapsed (in 2013 ytd, the NW European sulphuric acid price has fallen by 76%). Finally, metal prices have fallen consistently, which affects the revenues from free metal.
Base metals price dynamics
Source: Bloomberg
As a result, smelters found all three of their revenue streams under pressure, which negatively affected their margins and returns. Companies were forced to look for alternative sources of income.
The increase in e-waste treatment capacity by Boliden and Aurubis is one example of such incremental revenue streams.
Another recent trend is to increase the proportion of PGM-containing residues treated in-house instead of outsourcing them to metal recyclers such as Umicore.
Recently, Aurubis announced its intention to increase value-add by processing the group’s internal precious-metal-bearing anode slimes in-house. Project capex to achieve this was about €50m, with operations starting in June 2013.
In 2008, Aurubis bought Cumerio, which allowed it to increase its copper anode production capacity to 1m tonnes annually (from 600,000 tonnes previously). Aurubis’ Hamburg smelter had the ability to treat precious metal slimes; however, the smelter’s capacity was limited and it could only deal with existing quantities of residues. Cumerio had no capacity for slime treatment. As Cumerio was historically part of Umicore, it had a long-term contract with the company. However, the conditions were such that the majority of the PGM value remained with Umicore in the form of treatment charges. This contract expires at the end of 2013. According to Aurubis, it has decided not to renew the contract and will instead increase its own capacity. Currently, Aurubis’ gold capacity is 37 tonnes per year and its silver capacity 1,222 tonnes per year. We think that incremental capacity in Hamburg will allow Aurubis to increase its gold production by at least two tonnes per year.
Umicore works with 200 different suppliers, although these vary in size. The company’s current gold output is 25 tonnes per year and the loss of two tonnes (as a result of Aurubis opting for in-house processing) would equate to around a 10% loss in annual production.

Umicore SA Chemicals
106
Nyrstar, also formerly part of Umicore, recently announced a PGM-related capacity expansion. Nyrstar has a treatment contract with Umicore, similar to that of Aurubis. We do not have information on when the contract expires, but we think it will broadly coincide with new capacities coming onstream.
In 2012, Nyrstar announced the transformation of the Port Pirie primary lead smelter into an advanced polymetallic processing and recovery centre, capable of processing a wider range of high-margin metal-bearing feed materials (including e-scrap and internal residues from Nyrstar’s global network of zinc smelters and other complex waste streams containing precious and other non-ferrous metals).
The project requires a capital investment of around €350m and is expected to be operational by early 2016.
We do not have precise data on the scale of the potential capacity increase in PGM production, but, judging by the scale of the project, we think the feedstock loss for Umicore will be more than 10%.
Port Pirie expansion
Source: Nyrstar
These are the two largest projects that have so far been announced, but we believe they indicate the prevailing trend. Metal smelting companies are no longer happy to transfer to Umicore the major portion of PGM value in the production residues. We think that, although they will continue to supply some slimes to Umicore (when they cannot extract the metals economically), the concentration of PGMs in these slimes will fall considerably and the availability of PGM-containing scrap for recycling will be considerably reduced.
Precious and minor metals prices continue to decline
Based on metal capacity data provided by Umicore, we calculated the weighting (by volume and value) of each metal in the mix. Gold is the most important individual metal in Umicore’s metal basket. Minor metals in the mix include antimony, bismuth, indium, selenium and tellurium. According to our estimates, precious and minor metals represent around 3% of volume, but around 90% of value in Umicore’s metal mix, with gold having the highest share of value. Base metals (lead, copper, nickel, tin) represent almost 98% of volume, but only 10% of value.
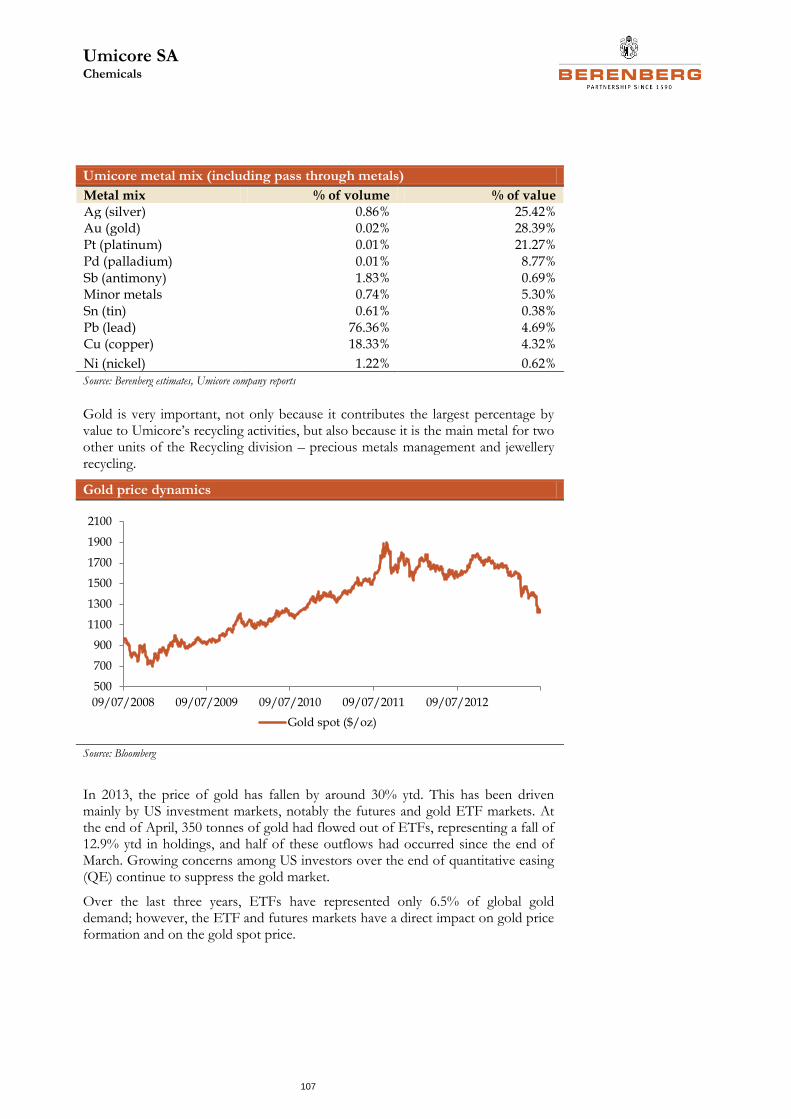
Umicore SA Chemicals
107
Umicore metal mix (including pass through metals)
Metal mix % of volume % of value
Ag (silver) 0.86% 25.42% Au (gold) 0.02% 28.39% Pt (platinum) 0.01% 21.27% Pd (palladium) 0.01% 8.77% Sb (antimony) 1.83% 0.69% Minor metals 0.74% 5.30% Sn (tin) 0.61% 0.38% Pb (lead) 76.36% 4.69% Cu (copper) 18.33% 4.32%
Ni (nickel) 1.22% 0.62% Source: Berenberg estimates, Umicore company reports
Gold is very important, not only because it contributes the largest percentage by value to Umicore’s recycling activities, but also because it is the main metal for two other units of the Recycling division – precious metals management and jewellery recycling.
Gold price dynamics
500
700
900
1100
1300
1500
1700
1900
2100
09/07/2008 09/07/2009 09/07/2010 09/07/2011 09/07/2012
Gold spot ($/oz)
Source: Bloomberg
In 2013, the price of gold has fallen by around 30% ytd. This has been driven mainly by US investment markets, notably the futures and gold ETF markets. At the end of April, 350 tonnes of gold had flowed out of ETFs, representing a fall of 12.9% ytd in holdings, and half of these outflows had occurred since the end of March. Growing concerns among US investors over the end of quantitative easing (QE) continue to suppress the gold market.
Over the last three years, ETFs have represented only 6.5% of global gold demand; however, the ETF and futures markets have a direct impact on gold price formation and on the gold spot price.

Umicore SA Chemicals
108
ETF gold holdings (in tonnes) by region to end-Q1 2013
Source: World Gold Council
Consumer purchases of gold represent 72% of gold demand. The international spot price does not immediately reflect demand in these consumer sectors, given the complex gold supply chain. The consumer sector often perceives strong price declines as buying opportunities and can provide some price support for gold in the medium term.
Sources of gold demand
Source: World Gold Council
We think that QE will be scaled back in the medium term, which should negatively affect the ETF market. As ETFs play an important role in gold price formation, we expect gold prices to remain at the level of c$1,000/oz in 2013-15.
Minor metals are also very important for the recycler as a major portion of their value is translated into revenues.
Concentrates used by copper, zinc and lead smelters as feedstock always contain minor metals, such as tellurium, selenium, antimony etc. When a smelter buys concentrate from a miner, minor metals are often considered as impurities and the miner has to pay penalties if concentrations of these metals are above certain

Umicore SA Chemicals
109
accepted levels. Hence, when a smelter sells residues to a recycler, the recovery of minor metals is not always required and the recycler obtains them free (if it is able to extract them economically from the residues).
Minor metals price dynamics
Source: Datastream
Minor metals price dynamics
Source: Datastream
Key minor metals for Umicore are antimony, indium, selenium, tellurium and germanium.
Bismuth is twice as abundant in the Earth’s crust as gold. Bismuth has traditionally been produced mainly as a by-product of lead refining. Bismuth can be used in cosmetics, pigments and some pharmaceuticals. As the toxicity of lead has become more apparent, bismuth alloys (presently about a third of bismuth production) have increasingly been used as a replacement for lead.
Antimony: in 2010, China accounted for 89% of total antimony production worldwide. About 60% of antimony production is used in flame retardants and 20% is used in alloys for batteries.
Indium is produced mainly from residues generated during zinc ore processing but is also found in iron, lead and copper ores. The amount of indium consumed is largely a function of worldwide LCD production, which now accounts for 50% of indium consumption.
Selenium is most often produced as a by-product of copper. The key commercial uses for selenium today are in glassmaking and pigments.
Tellurium is a by-product of copper and lead production. The primary use of
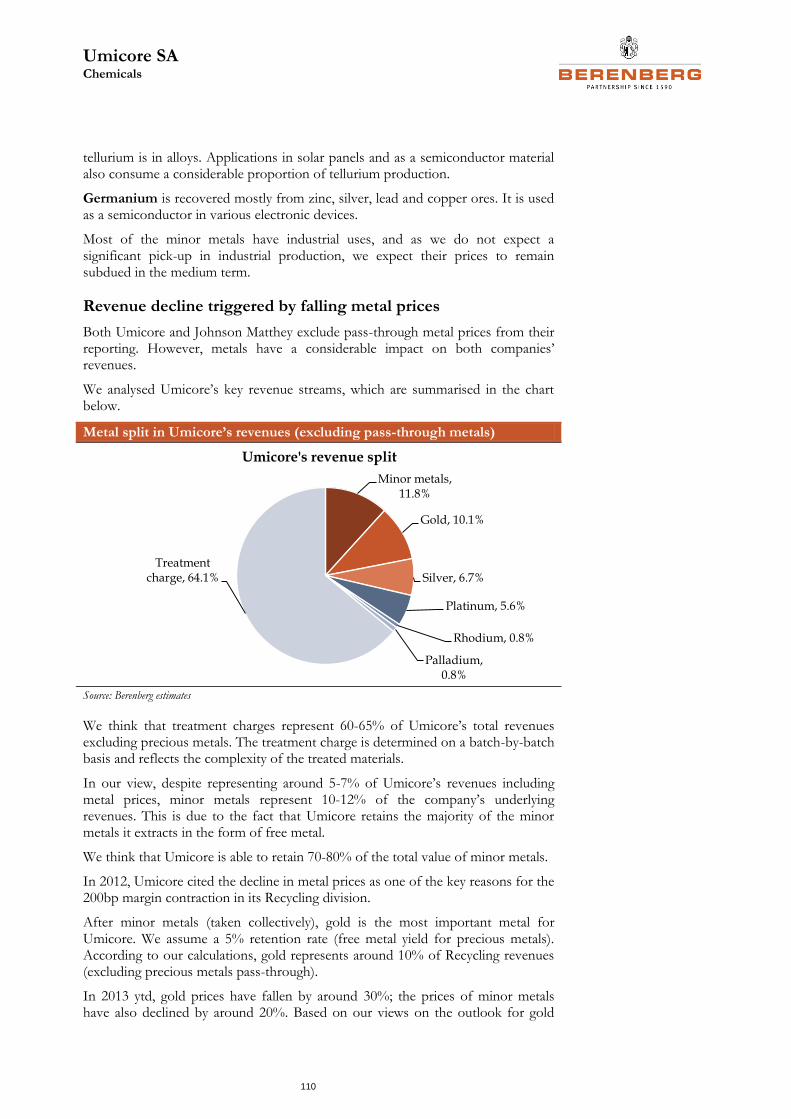
Umicore SA Chemicals
110
tellurium is in alloys. Applications in solar panels and as a semiconductor material also consume a considerable proportion of tellurium production.
Germanium is recovered mostly from zinc, silver, lead and copper ores. It is used as a semiconductor in various electronic devices.
Most of the minor metals have industrial uses, and as we do not expect a significant pick-up in industrial production, we expect their prices to remain subdued in the medium term.
Revenue decline triggered by falling metal prices
Both Umicore and Johnson Matthey exclude pass-through metal prices from their reporting. However, metals have a considerable impact on both companies’ revenues.
We analysed Umicore’s key revenue streams, which are summarised in the chart below.
Metal split in Umicore’s revenues (excluding pass-through metals)
Minor metals, 11.8%
Gold, 10.1%
Silver, 6.7%
Platinum, 5.6%
Rhodium, 0.8%
Palladium, 0.8%
Treatment charge, 64.1%
Umicore's revenue split
Source: Berenberg estimates
We think that treatment charges represent 60-65% of Umicore’s total revenues excluding precious metals. The treatment charge is determined on a batch-by-batch basis and reflects the complexity of the treated materials.
In our view, despite representing around 5-7% of Umicore’s revenues including metal prices, minor metals represent 10-12% of the company’s underlying revenues. This is due to the fact that Umicore retains the majority of the minor metals it extracts in the form of free metal.
We think that Umicore is able to retain 70-80% of the total value of minor metals.
In 2012, Umicore cited the decline in metal prices as one of the key reasons for the 200bp margin contraction in its Recycling division.
After minor metals (taken collectively), gold is the most important metal for Umicore. We assume a 5% retention rate (free metal yield for precious metals). According to our calculations, gold represents around 10% of Recycling revenues (excluding precious metals pass-through).
In 2013 ytd, gold prices have fallen by around 30%; the prices of minor metals have also declined by around 20%. Based on our views on the outlook for gold

Umicore SA Chemicals
111
and minor metals and on our metal mix model, we expect Umicore’s revenues excluding precious metals to be down 13% yoy in 2013 and a further 7.5% in 2014.
Profit contraction triggered by fundamentals
In previous sections of this report we concluded that base metal smelters are changing their business model and looking for additional sources of income. As a result, several smelters are adding metal-recycling capacity, both in smelting residues and e-scrap treatment. We think that, although they will continue to supply some slimes to Umicore (when they cannot extract the metals economically), the concentration of PGMs in these slimes will fall considerably and the availability of PGM-containing scrap for recycling will be considerably reduced.
Metal recycling is a very capital-intensive process. It is essential that a smelter runs at full capacity all the time in order to keep fixed costs per tonne as low as possible. It takes up to a week to idle a smelter. Furthermore, the shutdown of a smelter bears the risk of damage to the refractory material, and ultimately a halt at the smelter would interrupt the subsequent refining process. We think that fixed costs represent up to 75% of total costs in recycling (excluding the cost of the metal, which is a pass-through). As a result, a recycler has to operate the smelter 24/7, even if the input mix is not optimal.
If the share of EOL products in the mix falls and the metal concentration in industrial residues declines, the value of metal produced per tonne of scrap also falls.
Until now, Umicore has been able to “cherry-pick” its feedstock streams in order to optimise the incoming scrap mix and maximise profits per tonne. In our view, Umicore will clearly continue to have a considerable advantage over competitors, as its unique technology allows for the extraction of a wide range of metals, even if the metal concentration in the scrap mixture is relatively low. However, we think that scrap availability will be greatly reduced. It will be much more difficult to optimise the incoming scrap mix; Umicore will have to treat higher volumes of materials in order to obtain the same quantities of precious and minor metals in the output.
We back-calculated Umicore’s EBIT in its Recycling division, based on the assumption that 65% of costs are fixed. In the past, variable costs increased in periods of declining metal prices. The company had to process higher volumes of metals in order to obtain the required precious metal yields.
Recycling EBIT model (€m)
Source: Berenberg estimates, Umicore
We think scrap availability has a very strong impact on the Recycling division’s

Umicore SA Chemicals
112
profits. As we expect scrap availability to deteriorate in the medium term, we assume considerable margin contraction from 2011-12’s high levels. In 2017, we expect an additional step-up in costs as Nyrstar’s precious metals facility is expected to come onstream in 2016 and further reduce feedstock availability for Umicore.
Metal prices put incremental pressure on profits in the short term
Recyclers normally hedge 100% of the metal exposure within the quantities defined by the metal credit yield in their contracts. Formally, they are exposed to any fluctuations in price between the moment they purchase raw materials (price-in) and the moment they sell the product to the customer (price-out). At any given time, they are likely to hold metal, either as work-in-progress or stock-on-hand, that has been “priced-in” but not “priced-out”; companies normally refer to this metal as “metal at risk”. Normally, all the recyclers (including Johnson Matthey and Umicore) hedge 100% of metals at risk (no transactional exposure). Umicore also hedges its free metal exposure (Johnson Matthey does not).
In Umicore’s case, however, hedging is only possible for seven out of 20 metals, as the market for minor metals lacks liquidity.
Because of these hedging activities, metal price fluctuations have limited impact on Umicore’s revenues (as discussed above). However, the impact on profits is much greater. Scrap collectors normally do not hedge their metal exposure. As a result, when metal prices fall, collectors hold onto the scrap and wait until metal prices recover. This reduces scrap availability and has a deleterious effect on profits.
Precious metal prices have been falling since the beginning of the year; we think this could have a negative effect on Umicore’s profits in H2 2013 and 2014.

Umicore SA Chemicals
113
Key investment point 2: Positive surprise potential in the Catalysis division is limited
• Umicore’s Catalysis division represents 36% of the company’s sales and 22% of EBIT.
• Umicore is one of the global leaders in catalysis. In LDV, it has c30% market share globally. In HDD vehicles, Johnson Matthey has a dominant position and controls c65% of the market. We estimate Umicore’s share to be around 3%.
• Growth in catalysis is driven by legislative changes. In LDV, there are no major legislation changes until 2015 and we expect the sales of Umicore’s Catalysis division to grow in line with the market at 5.5% per year. In HDD, the catalyst market in Europe should double due to Euro VI legislation coming into force in January 2014. We expect Umicore to increase its global market share to 7% by 2015-16.
• We think these figures are already reflected in consensus and do not see much potential for positive surprise. Umicore expects double-digit annual growth in this division in the next five years; we expect 7.5% growth.
• Additional downside risk arises as a result of potential overcapacity in HDD catalysts.
• We are broadly in line with consensus on divisional 2013-14 EBIT and sales.
Division at a glance
Umicore’s Catalysis division consists of two business units: automotive catalysts and precious metals chemistry.
Umicore is one of the major players in the emissions control industry. It has around a 30% share of the light-duty diesel catalysts market. The catalysts market is very mature in developed countries and market shares are well defined. Changes in market share are only possible if legislation changes or if one of the players comes up with disruptive technology (for instance, a reduction in PGM content in the catalyst). Strong technical expertise is required in order to retain and increase market share. Umicore spends 7.5% of sales on R&D annually.
In the precious metals chemistry business unit, Umicore produces organic and inorganic PGM-based catalysts for the fine chemicals, life science and pharmaceuticals industries.
Developments in the automotive catalysts market
Umicore and BASF are the leading automotive catalyst producers in North America, with Johnson Matthey having a somewhat smaller market share. In 2007, Umicore acquired the automotive catalyst business of Delphi Corporation (formerly part of General Motors). As a result of this deal, according to our estimates, Umicore has 55% of the North American supply of LDV automotive catalysts for General Motors (and around 50% worldwide). The rest is supplied mostly by BASF.
Europe is the most lucrative market for LDV catalysts. It is the only region where 50-54% of the passenger fleet is powered by diesel. A diesel vehicle currently represents 5x the catalyst value of an equivalent gasoline vehicle. A decline in
Umicore SA Chemicals
114
diesel-powered car production could seriously damage the profitability of all automotive catalyst producers, including Umicore.
Johnson Matthey dominates the European market as it is the main supplier of Volkswagen, Renault, Peugeot and Fiat. We think Johnson Matthey has around a 60% share in the LDV market in Europe. We estimate that Umicore’s market share is around 30%. It is the leading supplier of diesel catalysts for BMW and Daimler. It is also a secondary supplier to Peugeot and Renault. As Umicore has exposure to better selling platforms, it was less affected than its competitors by the decline in European car production
Though Catalar (owned by Toyota) and NE Chemcat (a 50/50 joint venture between Sumitomo Metal Mining and BASF) control the majority of the Japanese LDV market, Umicore also has a relatively strong position. Umicore has a joint venture with Nippon Shokubai in Japan. It has strong relationships with Mitsubishi and Nissan and serves as a secondary supplier for Toyota and Honda.
In South Korea, BASF and Umicore have leading positions. BASF has a joint venture with Heesung Group. Umicore also has a joint venture with a local partner. It is a leading supplier of Hyundai and General Motors.
According to our estimates, China represents 22% of global car production and 15% of the global automotive catalysts market. Chinese environmental legislation is well behind that in the developed world, which explains the smaller size of the automotive catalysts market. As current environmental legislation does not require sophisticated catalytic technology, not only global but also local players are present in China’s catalyst market. The catalyst value per vehicle is also considerably lower than in developed countries. We think that the market shares of leading catalyst companies (Johnson Matthey, Umicore, BASF) in the country are more or less equal.
We estimate the global LDV catalysts market was valued at around $4.3bn in 2012 (excluding the value of precious metals). As there are no considerable legislative changes in LDV until 2015, we expect average annual market growth to be 5-5.5%, still higher than global auto production growth. We expect Umicore’s growth to be in line with the market.
The HDD market is expected to grow much more rapidly. Johnson Matthey expects the HDD market to increase from around $1bn currently to $2.1bn by the end of 2015 and to $3bn by the end of 2020. We are slightly less optimistic and expect the market to be worth around $2bn in 2015 and $2.5bn in 2020.

Umicore SA Chemicals
115
Global HDD market
0
500
1000
1500
2000
2500
3000
3500
2005 2007 2009 2011 2013 2015 2017 2019 2021
North America Western Europe Eastern Europe Japan and Korea Russia
China India Brazil Non-road, 130 – 560 kW Non-road, 56 – 130 kW
Non-road, <56 kW
Sa
les
ex
pm
s($
m)
CAGR 2012 – 2020: 17.3%
Source: Johnson Matthey
Legislation is the driving force behind the strong growth of the HDD market.
The Euro VI standard requires all diesel cars to be equipped with a diesel particulate filter (DPF). This legislation comes into force in January 2014. Passenger cars are already equipped with DPFs; however, the HDD catalysts market in Europe should double as a result of these changes in legislation.
In China, Phase IV (similar to Euro IV) is now coming to force and should gradually be implemented by January 2014. Initially, implementation of the standard was planned for January 2010; however, it was delayed until 2014. Delays in the implementation of emissions legislation are not unique to China. The other three BRIC countries (Brazil, Russia and India) have all seen similar delays. The reason for the delay in each case is a recurring theme: the lack of low-sulphur fuel.
The main issues lie in the costs associated with upgrading diesel refineries and the distribution of this type of diesel. Chinese diesel prices are regulated by the government and refiners were not certain that they would be able to recover the incremental costs. Recently, Sinopec’s chairman, Fu Chengyu, said that the company would complete the upgrade of desulphurisation facilities at its refineries by the end of 2013, and start producing gasoline and diesel that meet the national Phase IV emissions standard from 2014. However, we are still not certain of the fuel’s availability.
Phase IV does not require very sophisticated emissions control technology. We expect not only global catalyst players but also local companies to participate in the market. Johnson Matthey expects the Chinese HDD catalyst market to reach $500m by 2020; we think that it will only reach $250m.
We expect the HDD market to grow at a 15% CAGR between 2012 and 2020. Currently, Johnson Matthey has more than 65% of the global HDD market, while Umicore only has 3%. In the medium term, we expect that Johnson Matthey’s share will fall to around 55%, whereas Umicore’s will increase to 7%.
Future changes in HDD legislation have prompted all the major players to increase HDD catalyst capacity.
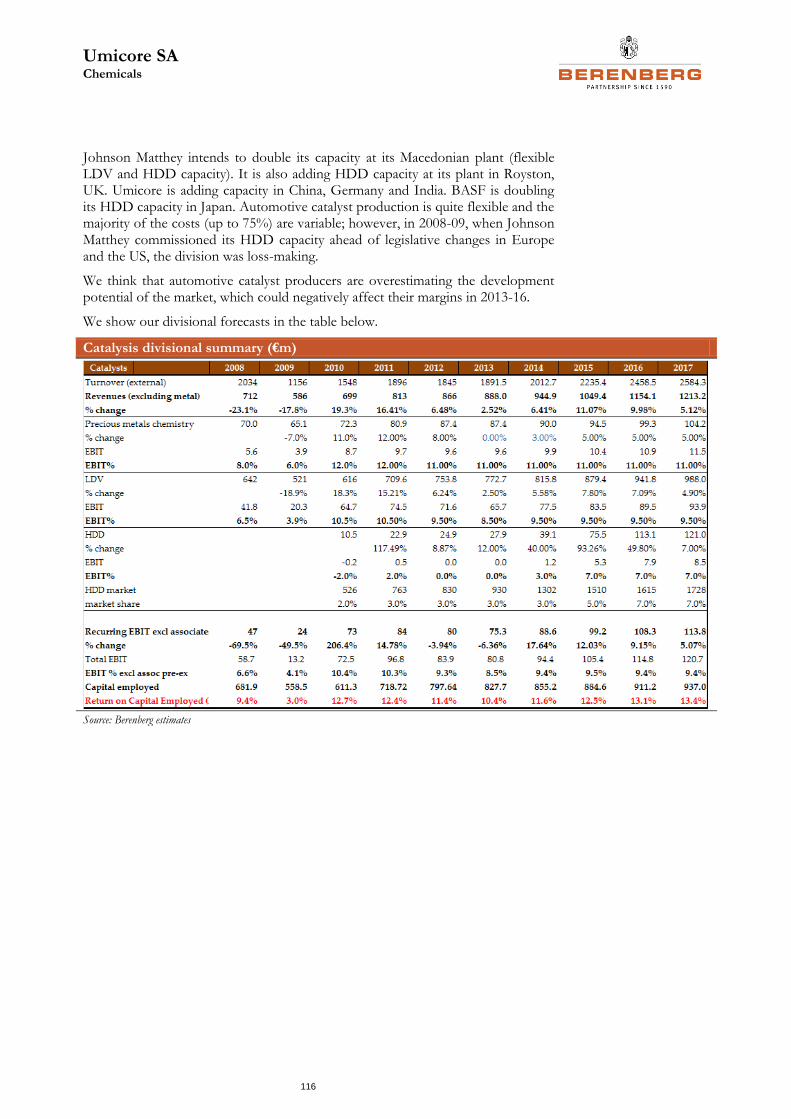
Umicore SA Chemicals
116
Johnson Matthey intends to double its capacity at its Macedonian plant (flexible LDV and HDD capacity). It is also adding HDD capacity at its plant in Royston, UK. Umicore is adding capacity in China, Germany and India. BASF is doubling its HDD capacity in Japan. Automotive catalyst production is quite flexible and the majority of the costs (up to 75%) are variable; however, in 2008-09, when Johnson Matthey commissioned its HDD capacity ahead of legislative changes in Europe and the US, the division was loss-making.
We think that automotive catalyst producers are overestimating the development potential of the market, which could negatively affect their margins in 2013-16.
We show our divisional forecasts in the table below.
Catalysis divisional summary (€m)
Source: Berenberg estimates

Umicore SA Chemicals
117
Key investment point 3: Cutting-edge technology, but not commercially viable in the medium term
• Umicore’s Performance Materials and Energy Materials divisions combined represent 37% of group sales, but only 17% of EBIT.
• In Performance Materials, the company is heavily exposed to the European construction sector, which negatively affects its upside potential.
• In Energy Materials, Umicore has number one market positions in a number of cutting-edge technologies such as cathode materials for EVs, CPV and thin film. Unfortunately, the current macroeconomic climate makes all three technologies commercially non-viable at present. Umicore is currently loss-making in thin film and CPV. We do not expect any considerable improvement in the Energy Materials division in the short term.
• Our estimates for the Performance Materials division are broadly in line with consensus. For Energy Materials, we are 11% below consensus on 2013 EBIT and 18% below on 2014.
Divisions at a glance
Performance Materials The Performance Materials division consists of five business units. It also includes a 40% shareholding in Element Six Abrasives – a joint venture with De Beers.
Building products produces zinc roofing, rainwater and façade systems for the construction industry. It has high exposure to the European construction sector.
Electroplating produces precious metal and base metal electrolytes for electronic, wear protection and decorative applications.
Platinum engineered materials manufactures platinum equipment for the production of high-quality glass and platinum gauzes for fertiliser production, as well as systems for the abatement of nitrous oxide (N2O).
Technical materials has exposure to a wide variety of industries. It produces high-performance functional materials which are based primarily on the properties of silver, special metals and their alloys. The business unit produces contact, brazing and other specialty materials for electrical, automotive and construction applications.
Zinc chemicals produces fine powders and oxides which are used in providing corrosion- or UV-protection properties to paints and other materials. They are also used for their catalytic and chemical properties in applications such as the production of rubber and ceramics.
Energy Materials Umicore’s Energy Materials division is split into four business units.
Cobalt and specialty materials (CSM) is a world leader in nickel chemicals. The main markets and applications served by its products are: plating and surface treatment, various catalytic applications, materials for rechargeable batteries, hard metal and diamond tools, ceramics and glass.
Electro-optic materials (EOM) is a world leader in germanium products. Key products include substrates for PVs and LEDs, materials for photonics and lenses
Umicore SA Chemicals
118
and optical assemblies for night-vision applications. Umicore’s key strengths are its ability to extract germanium from a wide range of supply feeds (including recycling flows), its materials know-how and its focus on product performance at the level of the application.
Rechargeable battery materials (RBM) is the global market leader in cathode materials. Currently, it mainly produces lithium-cobalt oxide cathode materials for electronic devices, power tools and energy storage systems. It is also working on nickel-manganese-cobalt oxide technology for EVs.
Thin film products covers a wide range of highly-effective evaporation materials, sputtering targets and accessories for optics, as well as accessories, wear and decorative coatings, microelectronics and semiconductors, and large-area coatings.
Performance Materials
Our estimates for the Performance Materials division are broadly in line with consensus.
In 2012, Performance Materials represented 22% of group sales and 13% of EBIT. We expect average top-line growth of 3.5% per year for this division. This growth rate is below the group average (5%) due to the division’s high exposure to Europe. Many of its products are linked to European industrial production growth. Without an acceleration in economic growth in Europe, we see downside to our and consensus estimates.
Various activities of the Performance Materials division are related to zinc and zinc products, silver and special metals. The division is also involved in zinc recycling. Building products and platinum engineering materials are the largest business units and according to our estimates represent around 63% of divisional sales and profits.
Platinum engineering revenues are driven by investments in high-purity glass capacity (mostly for electronics) and the production of fertilisers. We do not expect strong growth in either area.
In building materials, Umicore’s exposure to Europe is especially pronounced. Umicore produces zinc and zinc-treated building products. Another business unit – zinc chemicals – also has high European construction exposure as it sells anti-corrosive paint pigments.
Energy Materials
Energy Materials is Umicore’s smallest division, representing 15% of group sales and 4% of profits in 2012. However, according to the company’s plans, it is one of the key sources of future growth.
Umicore expects this division to demonstrate double-digit annual growth in the medium term. We are more conservative and expect 7% average growth in the medium term.
In recent years, divisional capex was considerably above depreciation (2.3x), as Umicore was expanding its capacities in rechargeable batteries (for application in both electronics and EVs) and thin film production.
Umicore has leading positions in a number of potential growth areas: CPVs, cathode material for rechargeable batteries and thin film technology. It began to invest in these areas long before competitors and now has undeniable leadership positions.

Umicore SA Chemicals
119
However, we think that future development in all three areas is currently uncertain. We do not expect any significant growth until 2015. According to our estimates, two business units – cobalt and specialty materials and rechargeable batteries –represent 70% of divisional sales, but 100% of profits, as electro-optic materials and thin film products are currently loss-making.
We are 11% below consensus on 2013 EBIT and 18% below on 2014. We think that PV-related technologies will remain unprofitable in the medium term and rechargeable batteries and cobalt materials will not be able to fully offset this impact.
Rechargeable batteries and electric cars
Umicore’s rechargeable batteries business unit produces cathode material for lithium-ion batteries (LIB). Currently, it produces mainly lithium-cobalt oxide cathode materials for electronic devices. It is also working on nickel-manganese-cobalt oxide technology for EVs. Umicore was one of the first producers to invest in a recycling facility for EV batteries. In 2011, the company inaugurated an ultra-high temperature (UHT) pilot plant in Hoboken (capex of c€25m). This is a unique technology which works at UHTs and allows a range of valuable metals to be extracted in a clean and efficient way. Umicore targets mostly car battery recycling, but UHT technology can also be used for other feedstock.
Cathode material is the key performance driver of batteries. The use of lithium-ion batteries has increased in recent years due to their high energy, cell-voltage, good performance and longer shelf life compared with conventional batteries. This development boosted the growth of Umicore’s rechargeable batteries unit. Gartner expects average annual growth of 20% in global tablet and smartphone shipments during 2012-16, which should translate into strong growth in the production of battery cathode materials.
Global smartphone and tablet shipments (m units)
Source: Soitec
We see the development of EVs as much more problematic. Umicore is the supplier of choice for the majority of existing EV platforms.
Roland Berger expects EVs to capture 8-10% of the global car market by 2020 (from less than 0.5%); we think penetration will be half this level (ie 4-5%). Even our modest assumption implies that the global EV stock will grow from 180,000 in 2012 to more than 20m by 2020 (including hybrids).

Umicore SA Chemicals
120
EV stock targets
Source: International Energy Agency
According to the International Energy Agency, 38% of global EV production takes place in the US (mostly the Chevrolet Volt), with 24% in Japan (mostly plug-in versions of the Prius and EV Nissan Leaf), 6% in China and the rest in Europe. The Nissan Leaf is the first mass-produced EV.
The majority of auto manufacturers have now launched their EV models. However, we believe they use EVs mostly as a marketing tool and are not yet making considerable investments in technological development.
Wider EV penetration is difficult to achieve, for several reasons.
1. While electric motors for road vehicles are standard products, which benefit from mature technology, batteries are the main challenge to broad EV market penetration due to their low energy density and high cost.
2. The development of new technologies requires considerable upfront investment (especially in infrastructure) and government support. We expect macroeconomic pressures on the automotive industry to remain high in the coming years. This should negatively affect the development of the EV market.
3. EVs have higher purchase costs than comparable non-electric vehicles. Economic uncertainty, such as that faced in the wake of the financial crisis, undermines consumer confidence. According to European experts, the key EU markets for new vehicles will recover to pre-crisis levels only by 2020.
4. The political framework, which determines incentive levels, varies from country to country and is generally inconsistent.
5. Wider EV penetration requires the development of charging infrastructure. Currently, stakeholders and their responsibilities are not clear. For instance, utility companies are not yet sufficiently involved, but their participation is key to creating a stable charging system. Charging standards and technology are also different in different countries. Plugs that work in Norway, for example, may not work in Germany. This creates additional difficulties.
Umicore is the leading supplier of the cathode materials for EVs’ lithium-ion batteries. Once the EV market is developed, the company is very well positioned

Umicore SA Chemicals
121
to reap the benefits, in our view. However, we think that EV penetration will remain low in the medium term.
Electro-optic materials and thin film products
Umicore is the world leader in producing germanium substrates used in CPV technology. Originally, the technology was used to provide solar energy for satellites. In the late 2000s, terrestrial applications of CPV started to develop.
CPV systems convert light energy into electricity in the same way that conventional PV technology does. The difference lies in the addition of an optical system that focuses a large area of sunlight onto each cell, which reduces energy costs and improves manufacturability and reliability.
CPV module efficiency is twice that of a standard PV module. However, it is also more expensive than traditional polysilicon.
Module efficiency of different technologies
Source: Soitec
The sharp decline in polysilicon prices over the past three years made terrestrial CPV wholly uncompetitive. Sales of space solar cells also decreased due to the reduction in the number of satellite launch programmes. Umicore’s electro-optic materials business unit is loss-making. The company had to reduce its germanium substrate production and the workforce at its Oklahoma site. Polysilicon prices have started to recover, but they are far below the levels required to revive CPV technology.

Umicore SA Chemicals
122
Polysilicon price dynamics
10
12
14
16
18
20
22
24
09/
07/
2012
30/
07/
2012
20/
08/
2012
10/
09/
2012
01/
10/
2012
22/
10/
2012
12/
11/
2012
03/
12/
2012
24/
12/
2012
14/
01/
2013
04/
02/
2013
25/
02/
2013
18/
03/
2013
08/
04/
2013
29/
04/
2013
20/
05/
2013
10/
06/
2013
01/
07/
2013
BNEF survey spot polysilicon price (USD/Kg)
Source: Bloomberg
We think Umicore’s electro-optic materials business will continue to struggle in the medium term.
Umicore’s thin film products business covers a wide range of highly-effective evaporation materials, sputtering targets and accessories for optics, as well as accessories, wear and decorative coatings, microelectronics and semiconductors, and large-area coatings.
In 2011-12, the company invested €30m in expanding capacities, expecting strong growth in the PV market, which did not materialise. Consequently, Umicore had to discontinue production of AZO targets in Liechtenstein. Its thin film unit is also currently loss-making and we do not expect a speedy recovery.
We show our divisional forecasts in the tables below.
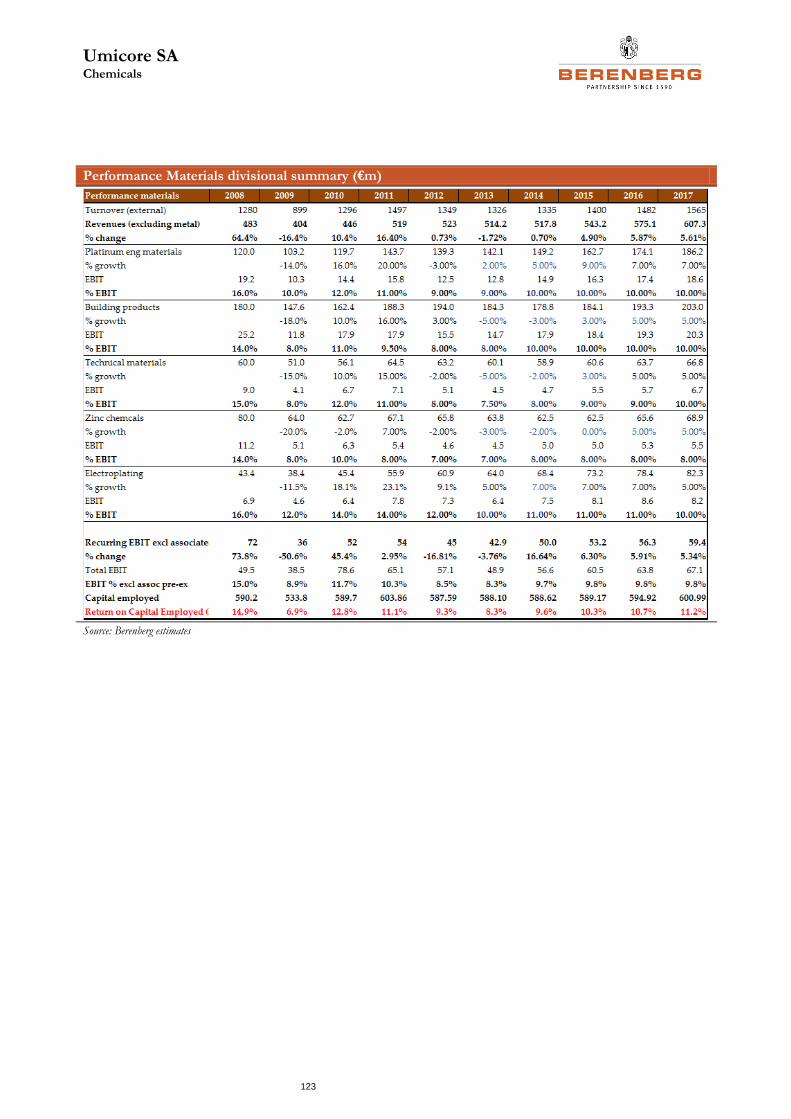
Umicore SA Chemicals
123
Performance Materials divisional summary (€m)
Source: Berenberg estimates

Umicore SA Chemicals
124
Energy Materials divisional summary (€m)
Source: Berenberg estimates

Umicore SA Chemicals
125
Berenberg versus consensus
We are 9% below consensus on 2013 EBIT and 8% below on EPS; for 2014 we are 24% below consensus both on EBIT and EPS. We are also 7% below consensus estimates for the 2014 dividend.
Group estimates versus consensus (€m)
2013 H1 Ber est 2013 cons
Variance %
2013 Ber est 2013 cons
Variance %
Revenue excl metal 1196 1226 -2.5% 2365 2417.00 -2.2%
EBITDA pre-excep inc assoc 235 244 -3.6% 457 483.00 -5.4%
EBIT pre-excep incl assoc 150 163 -8.1% 290 317.90 -8.8%
EPS (diluted) 0.98 1.05 -6.9% 1.87 2.04 -8.1%
DPS 1.00 1.02 -2.0%
2014 Ber
est 2014 cons Variance
% 2015 Ber
est 2015 cons Variance
%
Revenue excl metal 2408 2600.00 -7.4% 2607 2786.00 -6.4%
EBITDA pre-excep inc assoc 443 551.80 -19.7% 503 610.30 -17.7%
EBIT pre-excep incl assoc 274 379.00 -27.8% 325 429.90 -24.3%
EPS (diluted) 1.76 2.44 -27.8% 2.09 2.78 -24.8%
DPS 1.03 1.11 -7.2% 1.06 1.23 -13.7%
Source: Berenberg estimates, Vara
The main difference comes from the Recycling division, where we are 11.5% below consensus on 2013 EBIT and 40% below on 2014 EBIT.
Divisional estimates versus consensus (€m)
2013 Sales Ber Sales cons
Variance % EBIT Ber
EBIT cons
Variance %
Catalysis 888.0 877 1.3% 85.8 85.3 0.6% Energy Materials 373.4 380.3 -1.8% 14.0 15.7 -11.0%
Performance Materials 514.2 509.9 0.9% 48.9 47.8 2.3% Recycling 589.0 653.4 -9.9% 195 219.9 -11.4%
Corporate 2 2.1 -4.8% -53.8 -50.8 5.9%
2014 Sales Ber Sales cons
Variance % EBIT Ber
EBIT cons
Variance %
Catalysis 944.9 958.5 -1.4% 99.4 100.1 -0.7%
Energy Materials 406.4 422.2 -3.7% 21.9 26.6 -17.7% Performance Materials 517.8 528.6 -2.0% 56.6 55.7 1.7% Recycling 545.0 694.9 -21.6% 151 247.8 -39.1% Corporate 2 2.2 -9.1% -54.6 -51.1 6.9%
Source: Berenberg estimates, Vara

Umicore SA Chemicals
126
Valuation
Source: Berenberg estimates

Umicore SA Chemicals
127
Umicore: company overview
Company history
Umicore was founded at the beginning of the 19th century as a mining operation in the then-Belgian Congo (Union Minière) and refining operations in Belgium. In 1968, the company’s assets were nationalised by the Zairian government and Umicore had to transform its activities. In 1989, Union Minière merged Vieille Montagne and Mechim. The company had operations in copper, lead, cobalt, germanium, zinc and precious metals. It positioned itself increasingly as a specialty materials company in the late 1990s, focusing on precious metals, high-margin zinc products and advanced materials based mainly on cobalt and germanium. The group changed its name to Umicore in 2001. In 2003, the company bought PMG (formerly the precious metals unit of the Degussa Group). In 2007, Umicore bought another automotive catalyst company – Delphi (formerly a division of General Motors) – and further increased its presence in the automotive catalyst market.
In 2005, the company spun off its copper smelting assets. As a result, a new company, Cumerio, was listed in Brussels. In 2007, Umicore combined its zinc refining and alloys business with that of Zinifex. The new company, Nyrstar, was also listed in Brussels.
Today, Umicore is a global materials technology and recycling group, with more than 14,000 employees and a turnover of €12.5bn.
Divisional summary
Umicore consists of four divisions: Catalysis, Energy Materials, Performance Materials and Recycling.
Umicore’s divisional split in 2012
Catalysis, 36%
Energy Materials, 15%
Performance materials, 22%
Recycling, 28%
Umicore's revenue split by division (2012)
Catalysis, 22%
Energy Materials, 4%
Performance materials, 13%
Recycling, 61%
Umicore's EBIT split by division (2012)
Source: Umicore
Umicore is present in many areas where a high level of technology and innovation is required; for instance: precious metals recycling, cathode materials for EV batteries and CPVs.

Umicore SA Chemicals
128
Umicore’s divisional structure
Source: Umicore
Umicore derives 75% of its sales from Europe, 9% from Asia and 10% from North America.
2012 sales split by geography
Europe, 75.4%
Asia, 9.3%
NA, 10.2%
SA, 3.4% Africa, 1.6%
2012 revenue split
Source: Umicore
Umicore generates the majority of its revenues from – and dedicates most of its R&D efforts towards – clean technologies, such as emission-control catalysts, materials for rechargeable batteries and PVs, fuel cells and recycling.

Umicore SA Chemicals
129
Catalysis
Umicore’s Catalysis division consists of two business units: automotive catalysts and precious metals chemistry.
Umicore is one of the major players in the emissions control industry. It has around a 30% share of the light-duty diesel catalysts market. The catalysts market is very mature in developed countries and market shares are well defined. Changes in market share are only possible if legislation changes or if one of the players comes up with disruptive technology (for instance, a reduction in PGM content in the catalyst). Strong technical expertise is required in order to retain and increase market share. Umicore spends 7.5% of sales on R&D annually.
In the precious metals chemistry business unit, Umicore produces organic and inorganic PGM-based catalysts for the fine chemicals, life science and pharmaceuticals industries.
Energy Materials
Umicore’s Energy Materials division is split into four business units.
Cobalt and specialty materials (CSM) is a world leader in nickel chemicals. The main markets and applications served by its products are: plating and surface treatment, various catalytic applications, materials for rechargeable batteries, hard metal and diamond tools, ceramics and glass.
Electro-optic materials (EOM) is a world leader in germanium products. Key products include substrates for PVs and LEDs, materials for photonics and lenses and optical assemblies for night-vision applications. Umicore’s key strengths are its ability to extract germanium from a wide range of supply feeds (including recycling flows), its materials know-how and its focus on product performance at the level of the application.
Rechargeable battery materials (RBM) is the global market leader in cathode materials. Currently, it mainly produces lithium-cobalt oxide cathode materials for electronic devices, power tools and energy storage systems. It is also working on nickel-manganese-cobalt oxide technology for EVs.
Thin film products covers a wide range of highly-effective evaporation materials, sputtering targets and accessories for optics, as well as accessories, wear and decorative coatings, microelectronics and semiconductors, and large-area coatings.
Performance Materials
The Performance Materials division consists of five business units. It also includes a 40% shareholding in Element Six Abrasives – a joint venture with De Beers.
Building products produces zinc roofing, rainwater and façade systems for the construction industry. It has high exposure to the European construction sector.
Electroplating produces precious metal and base metal electrolytes for electronic, wear protection and decorative applications.
Platinum engineered materials manufactures platinum equipment for the production of high-quality glass and platinum gauzes for fertiliser production, as well as systems for the abatement of nitrous oxide (N2O).
Technical materials has exposure to a wide variety of industries. It produces high-performance functional materials which are based primarily on the properties

Umicore SA Chemicals
130
of silver, special metals and their alloys. The business unit produces contact, brazing and other specialty materials for electrical, automotive and construction applications.
Zinc chemicals produces fine powders and oxides which are used in providing corrosion- or UV-protection properties to paints and other materials. They are also used for their catalytic and chemical properties in applications such as the production of rubber and ceramics.
Recycling
Umicore’s Recycling division consists of four business units.
Precious metals refining can recover 20 precious and non-ferrous metals from a wide range of feedstock streams, including EOL products, industrial residues and e-scrap. It has a unique technology which allows Umicore to recover metals economically, even when their concentration in scrap feedstock is very low. This technology gives Umicore a considerable advantage over competitors.
Precious metals management offers a range of services to internal and external customers, including leasing, hedging and physical delivery of metals.
Battery recycling is a unique technology which works at ultra-high temperatures (UHT) and allows a range of valuable metals to be extracted in a clean and efficient way. Umicore targets primarily car battery recycling, but UHT technology can also be used for other feedstock.
Jewellery and industrial metals produces semi-finished precious-metals-based products for jewellery and industrial applications and is a major recycler of scrap and residues from the jewellery industry.

Umicore SA Chemicals
131
Financials
Profit and loss account
Source: Company data, Berenberg estimates
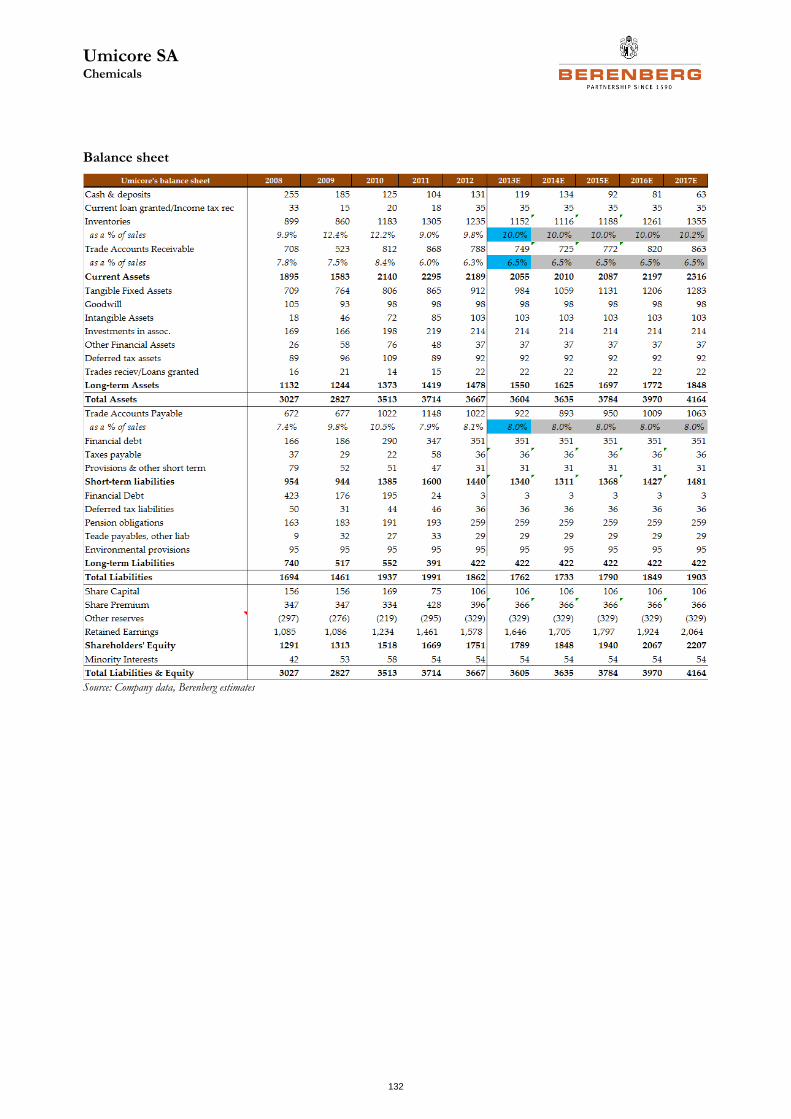
Umicore SA Chemicals
132
Balance sheet
Source: Company data, Berenberg estimates

Umicore SA Chemicals
133
Cash flow statement
Source: Company data, Berenberg estimates

Umicore SA Chemicals
134
DCF
Source: Berenberg estimates

Johnson Matthey plc Chemicals
135
Near-term expectations too high
• We initiate coverage of Johnson Matthey with a Hold rating and a price target of £28/share. Johnson Matthey is the leading company in the area of automotive catalysts; it also has precious metals recycling and production capabilities. We think that in the long term Johnson Matthey is well positioned within the majority of the industries in which it is present; however, in the short term we see some risks to consensus numbers.
• We are more cautious than the market on short- and medium-term estimates. We are 9% below Bloomberg consensus for 2013 EPS and 12% below consensus for 2014 EPS.
• In automotive catalysts, we think that the market is overestimating the effect of Euro VI legislation on the catalyst value per vehicle. We also think that the Chinese HDD catalyst market will develop more slowly than consensus expects. Finally, short-term pre-buying of Euro V trucks ahead of Euro VI implementation could slow the penetration of Euro VI in 2013-14.
• Our expectations for Johnson Matthey’s Precious Metal Products division are also below consensus. The loss of the Anglo Platinum distribution contract will result in a £35m loss of EBIT. In our view, the market seems to believe that a similar contract can be signed with another precious metals producer, which will restore divisional profitability to the level of 2011. We view this as unrealistic. We think the market is underestimating the short-term impact that the decline in precious metal prices will have on the Precious Metal Products division’s profitability.
• Valuation: We base our target price of £28 per share on DCF analysis. The stock is trading on 12.5x 2013 EV/EBITDA and 11.3x 2014 EV/EBITDA (Berenberg estimates) – a premium to its historical average of 9.43x. The stock is trading on 19.1x 2013 P/E and 17.6x 2014 P/E (Berenberg estimates) – again, a premium to its historical average of 15.19x.
Hold (initiation) Rating system
Current price
GBp 2,833
Absolute
Price target
GBp 2,800 11/07/2013 London Close Market cap GBP 5,805 m Reuters JMAT.L Bloomberg JMAT LN Share data
Shares outstanding (m) 205 Enterprise value (GBp m) 6,963 Daily trading volume 617,924
Performance data
High 52 weeks (GBp) 2,834 Low 52 weeks (GBp) 2,080 Relative performance to SXXP SX4P 1 month 8.6 % 7.1 % 3 months 19.2 % 17.6 % 12 months 14.2 % 9.6 %
15 July 2013
Evgenia Molotova Analyst +44 20 3465 2664 [email protected]
Jaideep Pandya Analyst +44 20 3207 7890 [email protected]
John Klein Analyst +44 20 3207 7930 [email protected]
Y/E 31.03., GBP m 2011 2012 2013E 2014E 2015E
Sales 12,023 10,729 11,068 11,766 12,523
EBITDA 573 541 556 606 658
EBIT 450 415 419 452 495
Net profit 315 276 286 312 346
Y/E net debt (net cash) 456 835 802 795 710
EPS (reported, GBp) 148.70 134.60 139.76 152.24 168.74
EPS (recurring, GBp) 156.34 151.00 148.13 160.74 177.37
CPS 2.78 2.16 2.43 2.39 2.81
DPS (GBp) 55.00 57.00 63.70 69.12 76.27
Gross margin 6.3% 7.0% 7.0% 7.0% 7.0%
EBITDA margin 4.8% 5.0% 5.0% 5.1% 5.3%
EBIT margin 3.7% 3.9% 3.8% 3.8% 4.0%
Dividend yield 2.6% 2.6% 2.5% 2.4% 2.7%
ROCE 16.0% 13.9% 13.1% 13.5% 14.2%
EV/sales 0.4 0.5 0.6 0.6 0.5
EV/EBITDA 9.3 10.5 12.5 11.3 10.3
EV/EBIT 11.9 13.7 16.6 15.2 13.7
P/E 13.4 15.1 19.1 17.6 16.0
Cash flow RoEV 8.5% 7.7% 6.8% 7.0% 7.8%
Source: Company data, Berenberg

Johnson Matthey plc Chemicals
136
Johnson Matthey: investment thesis in pictures
Johnson Matthey 2012 sales split
Precious Metal
Products, 14.3%
Fine Chemicals
11.2%
New Business,
1.3%
Process Technologies, 18.6%
Env Technologies, 54.6%
Source: Berenberg estimates
Johnson Matthey 2012 EBIT split
Precious Metal
Products, 27.2%
Fine Chemicals
16.8%
Process Technologies 20.2%
Env Technologies, 35.8%
Source: Berenberg estimates
2012 divisional EBIT margin
11%
18%
25%
29%
0%
5%
10%
15%
20%
25%
30%
35%
Emissions ControlTechnologies
Process Technology Fine Chemicals Precious MetalProducts
Source: Berenberg estimates
2012 divisional ROCE (pre-tax)
16.4% 15.8%17.5%
44.3%
0%
5%
10%
15%
20%
25%
30%
35%
40%
45%
50%
Emissions ControlTechnologies
Process Technology Fine Chemicals Precious MetalProducts
Source: Berenberg estimates
Regional sales split
China, 10%
Rest of Asia, 11%
Rest of World,
12%
Europe, 33%
North America,
34%
Johnson Matthey regional sales split
Source: Berenberg estimates
Sales by key market
PGM Services,
5% Other, 11%
HDD, 18%
LDV, 38%
Sales by key market
Pharmaceutical, 13%
Petrochemical, 15%
Source: Berenberg estimates

Johnson Matthey plc Chemicals
137
Johnson Matthey: investment thesis
What’s new: We initiate coverage of Johnson Matthey with a Hold rating and a price target of £28/share.
Two-minute summary: We are below consensus for both 2013 and 2014. Over the past five years, Johnson Matthey has demonstrated one of the strongest average EPS growth rates in the chemicals sector (average annual rate of 13%). It holds leading positions in a number of markets (for example, automotive, hydrogen and methanol catalysts). We agree that in the long term Johnson Matthey is well positioned within the majority of the industries in which it is present; however, in the short term we see some risks to consensus numbers.
Catalysts
In automotive catalysts, we believe the market is overestimating the effect of Euro VI legislation on the catalyst value per vehicle. We also think that the Chinese HDD catalysts market will develop more slowly than consensus expects. Finally, short-term pre-buying of Euro V trucks ahead of Euro VI implementation could slow the penetration of Euro VI in 2013-14. Further risk to our numbers could come from changes in the European fuel tax regime. Currently, diesel is taxed at a much lower rate than gasoline. This has led to a unique situation whereby diesel-powered cars represent c50% of passenger car sales in Europe. The European Commission has proposed changes to the tax structure which would considerably increase the tax on diesel fuel. Should this proposal be accepted, we believe the production of diesel-powered passenger cars in Europe will fall sharply and the European LDV catalysts market could halve.
Precious Metal Products
Our expectations for Johnson Matthey’s Precious Metal Products (PMP) division are below consensus. The loss of the Anglo Platinum distribution contract will result in a £35m loss of EBIT. In our view, the market seems to believe that a similar contract can be signed with another precious metals producer, thus restoring divisional profitability to the 2011 level. We regard this as unrealistic. We think the market underestimates the short-term impact the decline in precious metal prices will have on the PMP division’s profitability.
Fine Chemicals
We are slightly below consensus for the Fine Chemicals division. Until recently Johnson Matthey was the only government-approved importer of opiate-based pain management substances in the UK. Recently, however, one of Johnson Matthey’s customers received an import licence for these products, which has led to pricing power erosion. Johnson Matthey reacted by cutting divisional costs by £5m annually (c7% of divisional EBIT). We do not assume a radical deterioration in the current competitive situation; however, we are more cautious than consensus on potential growth rates.

Johnson Matthey plc Chemicals
138
Berenberg versus consensus
We are 9% below Bloomberg consensus for 2013 EPS and 12% below consensus for 2014 EPS.
13/14 Ber
13/14
Bloomberg
cons Variance %
Revenue excl met 2,798.7
EBIT 419.3 443 -5.4%
Net profit 303.5 329 -7.7%
EPS (diluted) 148.1 163.2 -9.2%
DPS 63.7 64 -0.5%
14/15 Ber
14/15
Bloomberg
cons Variance %
Revenue 3,108.2
EBIT 451.9 485.7 -7.0%
Net profit 329.4 369 -10.7%
EPS (diluted) 160.7 182 -11.7%
DPS 69.1 71 -2.7% Source: Berenberg estimates, Bloomberg
Relative and absolute valuation
We base our price target of £28 per share on DCF analysis. The stock has recently outperformed both the market and the SXXP chemicals index, with the outperformance triggered by better-than-expected FY results (announced in June) and the pick-up in European truck producers’ order books in Q1.
1-year performance versus SX4P and SXXP
Source: Bloomberg
The stock is trading on 12.5x 2013 EV/EBITDA and 11.3x 2014 EV/EBITDA (Berenberg estimates) – a premium to its historical average of 9.43x.
Historical EV/EBITDA multiples
Source: Datastream

Johnson Matthey plc Chemicals
139
The stock is trading on 19.1x 2013 P/E and 17.6x 2014 P/E (Berenberg estimates) – again, a premium to its historical average of 15.19x.
Historical P/E multiples
Source: Datastream
What will make us a buyer/seller?
As Johnson Matthey is strongly exposed to European auto production, a faster-than-expected recovery of the European automotive industry will make us more positive on the stock. A reversal of the decline in precious metal prices will also help the investment case. An increase in the proportion of diesel passenger cars in Europe will be highly beneficial for LDV catalyst sales and profits. Finally, if Johnson Matthey finds a replacement for the Anglo Platinum distribution contract, the PMP division’s profitability could improve significantly.
In our base case scenario, we expect a slow improvement in European auto production. However, if production continues to deteriorate, Johnson Matthey’s earnings will be at risk. Another delay in the implementation of Phase IV environmental legislation in China will be highly negative for sentiment towards the stock. A further decline in precious metals prices could also make us a seller.
Key risks
1. A change in the fuel tax structure in Europe. Europe is the most lucrative market for LDV catalysts because of the high penetration of diesel-powered passenger cars. Currently, diesel is taxed at a lower rate than gasoline, but a new European Commission proposal aims to reverse this. We believe that, should the proposal be approved, the European LDV catalysts market will halve.
2. FX. According to Johnson Matthey management, each change of 0.01 in the $/£ exchange rate affects EBIT by £0.2m. Further strengthening of the dollar would negatively affect earnings.
3. A further decline in precious metal prices. According to Johnson Matthey management, a 10% decline in the platinum price results in a £10m fall in EBIT (£5m once the Anglo Platinum contract is phased out).
4. A deterioration of the macroeconomic backdrop in Europe would negatively affect consumer confidence, putting additional strain on the European auto manufacturing industry.
5. Lack of availability of low-sulphur fuel could further delay Phase IV implementation in China.
6. Decentralisation of the European medical opiates market could negatively affect Johnson Matthey’s margins in Fine Chemicals.

Johnson Matthey plc Chemicals
140
Peer group analysis
ROCE EV/Sales EV/EBITDA P/E
Company 2013 2013 2014 2013 2014 2013 2014
Diversified chemicals
Akzo Nobel 8.3% 0.9x 0.8x 7.4x 6.0x 13.9x 11.2x
Arkema SA 13.6% 0.9x 0.8x 5.9x 5.0x 10.4x 9.5x
BASF 16.9% 1.0x 1.0x 6.9x 5.9x 13.0x 11.7x
Clariant 8.2% 1.0x 0.9x 7.4x 6.4x 13.1x 11.0x
Croda 32.8% 3.4x 3.1x 11.6x 10.5x 17.0x 15.5x
DSM 8.3% 1.1x 1.0x 8.4x 7.3x 14.1x 11.8x
Elementis 24.9% 1.9x 1.7x 8.1x 7.0x 12.3x 11.2x
Fuchs Petrolub 41.2% 1.0x 1.0x 5.3x 5.2x 18.2x 18.8x
Givaudan 12.1% 2.9x 2.7x 13.9x 13.0x 25.1x 23.0x
LANXESS 7.0% 0.7x 0.7x 7.1x 5.7x 14.2x 9.4x
Naturex 8.8% 1.7x 1.5x 12.7x 10.8x 16.8x 14.0x
Solvay 7.4% 1.1x 1.0x 7.3x 6.4x 14.3x 11.8x
Symrise 15.3% 2.5x 2.3x 11.6x 10.6x 19.5x 17.9x
Average 15.8% 1.5x 1.4x 8.7x 7.7x 15.5x 13.6x Industrial gases
Air Liquide 11.1% 2.4x 2.3x 9.8x 9.2x 18.0x 16.2x
Linde 9.0% 2.1x 1.9x 9.1x 8.3x 17.0x 15.1x
Catalysts Johnson
Matthey 14.1% 2.5x 2.2x 12.5x 11.3x 19.1x 17.6x
Umicore 9.5% 1.9x 1.9x 9.7x 10.1x 18.0x 19.1x Source: Berenberg estimates

Johnson Matthey plc Chemicals
141
Catalysts
• In 2012, Johnson Matthey’s Emissions Control Technology division (automotive catalysts) represented 55% of group sales and 36% of EBIT. Its Process Technologies division represented 18% of group sales and 20% of profits.
• Our estimates for the automotive catalysts market are below consensus. We believe consensus is overestimating the increase in catalyst value per vehicle that will result from the introduction of Euro VI. We believe the development of China’s HDD catalysts market will be slower than consensus expects. Finally, we think pre-buying of Euro V trucks might slow the penetration of high-value Euro VI trucks.
Division at a glance
The ECT division manufactures automotive and process catalysts. Johnson Matthey has c32% global market share in LDV catalysts and c65% in HDD. In process catalysts, it produces catalysts for stationary sources. The Process Technologies division includes base metal catalysts such as nickel, copper and cobalt for the production of syngas, ammonia, hydrogen, methanol, formaldehyde, oleo chemicals, oxo-alcohols, GTL, CTL and additives for refining. It also includes Davy Process Technology, which provides licences and know-how for the use of advanced process technologies related to the manufacture of oil and gas and petrochemicals. The company also manufactures base and precious metal catalysts for the fine chemicals and pharmaceuticals industries, as well as catalysts and components for emerging fuel cell markets.
Investment summary
In the process catalyst industry, producers tend to specialise in certain types of technology, which limits competition. In the automotive catalyst industry, all three leading players (Johnson Matthey, Umicore and BASF) have a high level of technical expertise. However, as the technology is relatively mature, they have to compete vigorously with each other. This is why margins in process catalysts are higher than in automotive catalysts.
In the medium term, we expect Johnson Matthey’s process catalyst sales to grow at c8% annually (a similar level to average growth excluding acquisitions in the past five years).
However, we are below consensus for automotive catalyst growth. We think that the market tends to overestimate both the short- and medium-term growth of the HDD catalysts market.
We think the market is overestimating the growth in the HDD catalysts industry associated with Euro VI implementation. We compared the current catalyst value per truck in the US (where emissions regulation similar to Euro VI has been in place since 2010) with the current catalyst value per truck in Europe. Based on our analysis, the average catalyst value per truck should increase by 2-2.5x as a result of Euro VI implementation.
In the short term, pre-buying of cheaper Euro V trucks ahead of the introduction of Euro VI in January 2014 could, in our view, account for up to 10% of European truck demand this year. The market seems to view pre-buying as a

Johnson Matthey plc Chemicals
142
positive event. However, we expect the catalyst value per truck to increase by 2-2.5x with Euro VI implementation. The pre-buying of Euro V trucks will pull demand away from high-value catalysts to lower-value ones, and thus be negative for catalyst producers.
Longer-term, we think the potential growth of the Chinese HDD catalysts market is being overestimated. The implementation of Phase IV (similar to Euro IV) in China is one of the key drivers of growth in the HDD catalysts market in the next five years. Johnson Matthey forecasts China’s HDD catalysts market to reach c$500m by 2020. We think it will reach $250m.
Johnson Matthey, BASF and Umicore entered the Chinese and Indian passenger car markets together with their international auto customers – the likes of General Motors, Volkswagen etc. Barriers to entry in HDD catalysts are much higher, as international truck companies have more limited presence in emerging markets.
A second complication is that Euro IV does not require highly sophisticated catalytic technology. Local catalyst producers will actively compete with international players and we expect price considerations to be of the utmost importance. We expect the overall profitability of the catalyst market in emerging regions to be considerably lower than profitability in developed regions.
A third complication is that the Chinese truck market is extremely price-competitive. The average price of a truck in China is 3x lower than in developed markets. We think this will put incremental pricing pressure on catalyst producers.
Further risk to our numbers could come from changes in the European fuel tax regime. Currently, diesel is taxed at a much lower rate than gasoline. This has led to a unique situation whereby diesel-powered cars represent c50% of passenger car sales in Europe. The European Commission has proposed changing the regime in a way that considerably increases the tax on diesel fuel. Should this proposal be accepted, we believe the production of diesel-powered cars in Europe will fall sharply and the European LDV catalyst market could halve.
Emissions Control Technology
LDV market In 2012, Johnson Matthey’s Emissions Control Technology (ECT) division represented 55% of group sales, but only 36% of EBIT. ECT has the lowest EBIT margin of all divisions (excluding the loss-making new products and eliminations).
Johnson Matthey is one of the three leading players in LDV catalysts (Umicore and BASF are the other two); each company has c30% market share. In HDD catalysts, Johnson Matthey is the clear market leader, commanding a share of c65-68%. BASF has gained market share over time; we estimate its share of the HDD catalyst market at 20-25%. Umicore has the smallest presence in the HDD catalysts market with c3% market share.
Growth in automotive catalysts (both HDD and LDV) is driven mostly by legislative changes. Developed countries have more stringent environment standards and the automotive catalysts market there is quite mature. In most developing countries, environmental standards are five to seven years behind those in Europe or North America.

Johnson Matthey plc Chemicals
143
Market shares of catalyst producers in LDV and HDD markets
Johnson Matthey,
32%
BASF, 31%
Umicore, 31%
Others, 6%
LDV catalysts market
Johnson Matthey,
68%
BASF, 23%
Umicore, 3%
others, 6%
HDD catalysts market
Source: Berenberg estimates, Johnson Matthey
In LDV catalysts, Johnson Matthey derives 58% of its sales from Europe, 22% from Asia and 19% from North America. As there are no significant legislative changes in LDV until 2015, we expect average annual market growth to be 5-5.5%, still higher than global auto production growth.
According our estimates, Europe represents c30% of the global automotive catalysts market and Johnson Matthey has around 60% market share in the region. Johnson Matthey is a leading producer of both gasoline and diesel catalysts for Volkswagen, Renault, Peugeot and Fiat, which together account for more than 50% of the automotive market in Europe.
European LDV market
North America,
19%
Europe, 58%
Asia, 23%
Johnson Matthey's European sales split
VW, 23.8%
Renault, 12.9%
PSA, 10.4%
Ford, 10.0%
Fiat, 7.1%
Daimler, 7.1% BMW,
7.0%
Others, 20.0%
European car production 2012
Source: Berenberg estimates, Johnson Matthey
Europe is the most lucrative market for LDV catalyst producers. 50-55% of cars in the region are diesel-powered. A diesel vehicle represents 5x the catalyst value of an equivalent gasoline vehicle. However, in the past two years the profitability of the European LDV catalysts market was limited by two factors.
1. Overcapacity in automotive catalysts. In 2011, Johnson Matthey closed a manufacturing facility in Belgium in order to reduce overcapacity in the European automotive catalysts business. Since then, automotive production in Europe has fallen by around 10% and we think there is still overcapacity in the system, which negatively affects the margins of catalyst producers in the region.
2. A reduction in the proportion of diesel vehicles. In periods of economic downturn, the proportion of diesel-powered cars seems to fall. This is explained mainly by the technical properties of diesel. With diesel engines, fuel

Johnson Matthey plc Chemicals
144
efficiency is minimal for smaller engine sizes and short journeys. During downturns, the engine mix moves towards smaller sizes, so the share of diesel cars decreases.
Diesel as a percentage of total LDV engines in Western Europe
46%
48%
50%
52%
54%
56%
2007 2008 2009 2010 2011 2012
Diesel as % of total LDVs in Western Europe
Diesel as % of total in Western Europe
Source: Johnson Matthey
The impact of Euro VI on LDV catalysts is much lower than on HDD; we estimate it at around 15-20%. The majority of auto manufacturers in Europe have already installed CCRT in their diesel-powered passenger vehicles with Euro V implementation, so we do not expect that Euro VI will have a significant incremental effect on the catalyst value per vehicle.
The US auto manufacturing industry went through turbulent times, which resulted in higher pricing pressure on the catalysts industry. We think that in the early 2000s there was overcapacity in automotive catalyst production in the US, which also contributed to some price erosion. We estimate that the margins LDV catalyst producers are able to generate in the US are lower than those in Europe (even excluding the diesel effect). Umicore and BASF are the leading producers in North America, with Johnson Matthey having a somewhat smaller market share.
Due to its higher European exposure, Johnson Matthey has higher profitability in LDV catalysts than its peers. Overall, Umicore and BASF have higher market shares with local manufacturers (General Motors, Ford) and Johnson Matthey satisfies the needs of European producers in North America.
Johnson Matthey has a lower market share in small engines in North America, which is why the recent consumer shift towards smaller engines negatively affected the company’s sales in the region.
Johnson Matthey came to Asia somewhat later than its competitors and has a lower market share with local producers, though it has been winning market share continuously over the past three years.
The Japanese market is dominated by Catalar (75% owned by Toyota) and NE Chemcat (a 50/50 joint venture between Sumitomo Metal Mining and BASF. Umicore has a joint venture with Nippon Shokubai in Japan. It has strong relationships with Mitsubishi and Nissan and serves as a secondary supplier for Toyota and Honda.
Johnson Matthey plc Chemicals
145
In South Korea, BASF and Umicore have leading positions. BASF has a joint venture with Heesung Group. Umicore also has a joint venture with a local partner. It is a leading supplier of Hyundai and General Motors. Johnson Matthey has a weaker presence in Japan and South Korea. It is a secondary supplier to Toyota, Honda and other producers. Similarly to the US, it has lower exposure to small-engined cars.
South America is a somewhat smaller market and represents 5% of global catalyst production. European auto manufacturers dominate the South American market. Johnson Matthey is by far the leading automotive catalyst producer in the region, as it is the main supplier of Volkswagen, Fiat and Renault. Umicore is the number two as it supplies General Motors, while BASF is the number three.
According to our estimates, China represents 22% of global car production and 15% of the global automotive catalysts market. Chinese environmental legislations are well behind those in the developed world, which explains the smaller size of the automotive catalysts market.
We think that the market shares of the leading catalyst companies (BASF, Johnson Matthey and Umicore) in the country are more or less equal. All of them have local production facilities. Initially, catalyst companies penetrated the market via their global auto partners, but they now also serve local customers. For instance, Johnson Matthey states that 50% of its Chinese clients are local companies.
As Johnson Matthey has higher exposure to the European LDV catalysts markets than its competitors and Europe is the most profitable region, we think that Johnson Matthey has the highest profitability in LDV catalysts (relative to its peers).
We think that European auto production is approaching its trough and expect some recovery in 2013, although a more pronounced recovery will take some time. We are therefore more cautious on LDV catalyst growth for Johnson Matthey than for its competitors. We expect the average annual growth rate in the next five years to reach 4.5% (versus average growth in the LDV catalyst industry of 5.5%).
Potential fuel tax changes in Europe will also affect Johnson Matthey more than other players. If the proposed new tax structure is approved, we expect Johnson Matthey’s sales in European LDV catalysts to more than halve.
The prevalence of diesel as a fuel for LDV cars in Europe is unique to that region and is explained by the preferential tax treatment of diesel versus gasoline. India also has a large LDV fleet of diesel vehicles, but as environmental regulations there are largely non-existent, this market is not relevant for catalyst producers at the moment.
In Europe, fuel is taxed on the basis of volume and diesel is cheaper than petrol in nearly all EU states, with Britain a notable exception. On the other hand, there is a shortage of diesel production facilities. Fuel suppliers often have to import diesel and export surplus gasoline, sometimes at a loss. Diesel is the most expensive fuel to refine, but the cheapest to consume in Europe.
In April 2011, the European Commission presented its proposal to overhaul the outdated rules on the taxation of energy products in the EU. The new rules aim to restructure the way energy products are taxed to remove current imbalances and take into account both their CO2 emissions and energy content. Since a litre of diesel contains more energy and more carbon than a litre of gasoline, minimum tax rates per litre of diesel should eventually be higher than for gasoline.

Johnson Matthey plc Chemicals
146
The proposed tax rates are reflected in the table below.
New tax rates for transport fuel Current rate 01 Jan 13 01 Jan 15 01 Jan 18
Petrol (euro per 1000 litres) 359 359 359 359
Diesel (euro per 1000 litres) 330 359 382 412
Kerosene (euro per 1000 litres) 330 350 370 386
LPG (euro per 1000 kg) 125 125 311 501
Natural gas (euro per GJ) 2.6 2.6 6.6 10.8
Source: European Commission / Taxation and Customs Union
HDD catalysts market Our view on the HDD catalysts market is the main reason we are below consensus estimates for Johnson Matthey’s Environmental Technologies division. We are more cautious than consensus on both short-term and medium-term market development.
The only HDD markets of meaningful size at present are Europe and North America. This situation should change significantly from 2014, when China finally introduces Euro IV legislation (called Phase IV).
Less than a decade ago, the HDD catalyst market did not exist, but it is now growing very rapidly, driven mostly by the legislative changes discussed above. Johnson Matthey forecasts the HDD catalyst market to reach $2.1bn in 2015 and $3bn by 2020.
We share Johnson Matthey’s view on short-term prospects (2013-15) but see slower growth thereafter. The company itself has downgraded its forecasts several times. Initially, it expected the HDD catalyst market to reach $3bn by the end of 2014; now, Johnson Matthey expects that it will reach this level only by 2020. Obviously, the 2008/09 financial crisis hurt commercial vehicle production growth severely, but we also see various obstacles to greater penetration of HDD catalysts. We expect the HDD catalysts market to reach $1.9bn in 2015 and $2.5bn in 2020.
Based on our analysis, we expect the European HDD catalysts market to grow by 2-2.5x as a result of Euro VI regulation.
Under Euro VI, heavy-duty vehicles will have to be equipped with DPFs to meet not only particulate mass but also particle number limits. In the US, a similar standard was already implemented in 2010 and the HDD catalysts market doubled in value as a result.
Based on truck production data from IHS and Johnson Matthey sales data, as well as our assumptions on the latter’s market share, we have calculated the HDD catalyst value per vehicle.

Johnson Matthey plc Chemicals
147
HDD catalyst value per vehicle Europe and US (£)
HDD production 2010 2011 2012 2013 2014 2015 2016 2017
NA 301 456.8 448.9 444 467 481 495 510
% change 27.7% 51.8% -1.7% -1% 5% 3% 3% 3%
Europe 360 419 370.9 370.9 382.0 393.5 405.3 417.5
% change 0% 3% 3% 3% 3%
Sales
NA 194 295 297 302.94 312 318 328 338
% change 52.1% 0.7% 2% 3% 2% 3% 3%
per unit 0.92 0.92 0.95 0.97 1.03 1.10 1.10 1.10
market share 70% 70% 70% 70% 65% 60% 60% 60%
Europe 91 111 105 109.2 245.7 258.0 258.0 266.0
% change N.A. 22.0% -5.4% 4% 125% 5% 0% 3%
per unit 0.36 0.38 0.40 0.42 0.99 1.09 1.06 1.06
market share 70% 70% 70% 70% 65% 60% 60% 60%
market size 136 146 273 309 309 318
Source: Berenberg estimates, Johnson Matthey
Further growth in the HDD catalysts market is limited in both North America and Europe. Legislative changes are the main trigger for an increase in catalyst value: in the absence of radical legislative changes, catalytic technology becomes commoditised and catalyst companies’ pricing power weakens. As mature markets have already reached very tight levels of emissions control, we expect catalyst growth to slow in the medium term.
Shorter-term, we think that the market is misinterpreting the way current truck supply/demand dynamics translate to the catalysts market.
All the major European truck companies mentioned an improvement in order intake at the Q1 2013 results, albeit from the very low levels seen in Q4 2012. According to the GE European SME Capex Barometer from Q1 2013, which includes data from more than 2,250 small and medium enterprises (SMEs), capital investment will increase in most large Western European economies. SMEs represent the lion’s share of truck buyers in Europe; hence overall market expectations regarding European truck production are positive.

Johnson Matthey plc Chemicals
148
Investment intentions of European SMEs in the next 12 months (€bn)
Source: GE Capital European SME Capex Barometer
The improvement in truck market supply/demand dynamics has triggered higher expectations for catalyst sales. We think these expectations are premature.
The Euro VI standard comes into force in January 2014. Truck companies have already announced that they expect these legislative changes to increase their costs by c€10,000 per truck. They intend to pass the majority of the price increase through to their customers (the average price per truck is expected to rise from c€100,000 currently to €110,000 after Euro VI is in place). Euro VI not only increases the initial selling price, but also negatively affects the total cost of ownership over the entire lifecycle of the vehicle, as the truck’s fuel efficiency decreases due to the complicated design of the emissions control system.
It therefore makes sense that truck buyers will pull forward purchases ahead of such an increase. According to various estimates, up to 10% of annual truck demand can be affected by pre-buying. This might be good news for truck manufacturers, but for catalyst companies the effect is actually the opposite. The pre-buying of Euro V trucks means a lower catalyst value per vehicle.
We therefore do not expect a significant increase in catalyst value per truck in Europe in 2013.
We see the implementation of Chinese regulation as more problematic than that in Europe. Implementation of the Phase IV standard was delayed for four years due to the lack of low-sulphur fuel (which is necessary for Phase IV engines). We are still not certain whether low-sulphur fuel is available throughout the country.
We see the dominance of local suppliers in emerging markets as one of the key obstacles to international automotive catalyst players achieving greater penetration in these regions. Johnson Matthey, BASF and Umicore entered the Chinese and Indian passenger car markets together with their international auto customers – the likes of General Motors, Volkswagen etc. After establishing initial positions in these markets, they were able to gain local customers as well.
Barriers to entry in HDD catalysts are much higher, as international truck companies have more limited presence in emerging markets.

Johnson Matthey plc Chemicals
149
A second complication is that Euro IV does not require highly sophisticated catalytic technology. Local catalyst producers will actively compete with international players and we expect price considerations to be of the utmost importance. We expect the overall profitability of the catalyst market in emerging regions to be considerably lower than profitability in developed regions.
A third complication is that the Chinese truck market is extremely price-competitive. The average price of a truck in China is 3x lower than in developed markets. We think this will put incremental pricing pressure on catalyst producers.
Johnson Matthey expects China’s HDD catalysts market to reach c$500m in 2020; we think it will reach $250m. The company also expects to lose market share somewhat as HDD technology matures.
The table below summarises our view on the development of the HDD catalyst market relative to Johnson Matthey’s expectations.
HDD market forecast
Market size (USD m) 2013 2014 2015 2016 2017 2020
Berenberg estimates
NA 649.2 720.1 795.7 819.5 844.1
% change 10.9% 10.5% 3.0% 3.0%
Europe 234.0 441.0 501.6 501.6 516.7
% change 88.5% 13.8% 0.0% 3.0%
Asia 196.6 238.1 288.7 326.6 366.7
% change 21.1% 21.2% 13.1% 12.3%
Brazil 37.5 45.0 49.5 54.5 59.9
Non-road global 75.0 225.0 300.0 330.0 346.5
JMAT expectations 500.0
HDD market 1192 1669 1935 2032 2134 2550
JMAT estimates 2100.0 3000.0
Market shares
JMAT market share 66% 60% 56% 55% 54% 54%
BASF market share 25% 25% 25% 23% 23% 20%
Umicore 3% 5% 7% 7% 7% 7%
total internationals 94% 90% 88% 85% 84% 81% Source: Berenberg estimates, Johnson Matthey
We also have some concerns about the short-term profitability of HDD catalyst markets. Future changes in HDD legislation have prompted all the major players to increase HDD catalyst capacity.
Johnson Matthey intends to double capacity at its Macedonian plant (flexible LDV and HDD capacity). It is also adding HDD capacity at its plant in Royston, UK. Umicore is adding capacity in China, Germany and India. BASF is doubling its HDD capacity in Japan. Automotive catalyst production is quite flexible and the majority of costs (up to 75%) are variable; however, in 2008-09, when Johnson Matthey commissioned its HDD capacity ahead of legislative changes in Europe and the US, the division was loss-making.
We think that automotive catalyst producers are overestimating the development potential of the market, which could negatively affect their margins in 2013-16.

Johnson Matthey plc Chemicals
150
Process Technologies
We think that the market underestimates the importance of the process catalysts segment to Johnson Matthey. The process catalysts segment is growing faster than underlying industries due to constant innovation, which helps client companies save money and allows catalyst companies to charge a premium for their products. Contrary to market perception, specialty process catalyst companies generate higher margins than automotive catalyst companies.
Johnson Matthey’s process catalysts business comprises various types of chemical catalysts. It includes base metal catalysts such as nickel, copper and cobalt for the production of syngas, ammonia, hydrogen, methanol, formaldehyde, oleo chemicals, oxo-alcohols, gas-to-liquids, coal-to-liquids and additives for refining. It also includes Davy Process Technology, which provides licences and know-how for the use of advanced process technologies related to the manufacture of oil and gas and petrochemicals. The company also manufactures base and precious metal catalysts for the fine chemicals and pharmaceuticals industries.
The company expects double-digit annual growth in this division. We are more conservative and assume 8% annual growth for the next five years.
Hydrogen Johnson Matthey is the largest producer of catalysts for hydrogen consumption. We estimate its market share at c40%.
As the global refining industry moves towards cleaner fuels, refiners are aggressively increasing the consumption of hydrogen. Hydroprocessing is probably growing the fastest, in response to the requirement for lower sulphur levels in gasoline and diesel. Johnson Matthey is one of the leaders in hydrogen catalysts for hydroprocessing, so we expect strong growth in this area to continue. Gas-to-liquids and coal gasification projects all require extremely large quantities of hydrogen and will boost the size of the market considerably in the next five years.
A surge in hydrogen consumption is also expected as a result of growth in the manufacture of methanol. Substantial consumption of methanol as a direct fuel (ie as motor gasoline) is expected in countries such as China, Russia, South Africa, Venezuela and several Middle Eastern countries.
The main growth in hydrogen consumption is expected to come from China for two reasons: the country is experiencing the strongest growth in auto production as well as changes in environmental legislation.
Johnson Matthey has a very strong presence in Asia and good relationships with major industrial gas companies that supply hydrogen to petroleum refineries, so in our view it should experience very strong growth in hydrogen catalysts in the next three years.
We expect the use of hydrogen catalysts to grow at a faster rate than hydrogen consumption – 10-12% per year for the next three years.
Ammonia Johnson Matthey is one of the leading producers of the catalysts for ammonia production, along with Süd-Chemie. We are slightly less optimistic about developments in the market for ammonia, but still assume average annual growth of 5-6% for the catalysts.
According to Yara, global ammonia production grew at an average annual rate of 2.6% in 2001-11. We expect this trend to continue. We expect global capacity
Johnson Matthey plc Chemicals
151
growth in ammonia to reach 3.5% per year in the next five years and the production of ammonia catalysts to grow at 5-6%.
Methanol Methanol is a versatile liquid chemical produced primarily from natural gas (in China, from coal) and used as a chemical feedstock in the manufacture of a wide range of consumer and industrial products such as building materials, foams, resins and plastics. The fastest-growing markets for methanol are in the energy sector, which today represents one-third of methanol demand.
Demand for methanol is driven primarily by levels of industrial production, energy prices and the strength of the global economy.
Methanex expects methanol demand to grow at a 7.6% CAGR during 2012-16, driven mainly by energy applications.
China has now become the world’s leading consumer of methanol and should account for 80% of demand growth through at least 2016. We expect the market for methanol catalysts to grow at 10-11% per year in the next five years. Johnson Matthey commands a 45% market share and is well positioned to capture this growth with Apico catalysts and technology.
GTL, MTO, CTL Gas-to-liquids (GTL) and coal-to-liquids (CTL) processing is an emerging area for catalysts. One key advantage of GTL processes is that they provide clean fuels. China is short of natural gas. As part of the country’s effort to reduce its dependence on crude oil and utilise cheaper feedstock costs, there are several coal-based projects under development in China. The majority of capacity expansion plans in petrochemicals announced beyond 2015 are China’s coal-to-olefins (CTO), methanol-to-olefins (MTO) and US-gas-based cracker projects.
However, we do expect certain difficulties in the development of these projects. Recent cost inflation has contributed to the cancellation or postponement of certain gas-based projects in North America; in China, MTO projects face multiple hurdles, such as lack of infrastructure, water consumption and high carbon emissions.
Johnson Matthey expects double-digit annual growth in these types of project in the next five years, but we are more cautious due to the challenges mentioned above – we think growth will reach 7-8% per year.
Johnson Matthey is strongly positioned in the sector. Davy Process Technology provides licences and know-how to operate advanced process technologies related to oil and gas, MTO and CTL. Davy Process Technology increased its sales from £44m in 2009 to £100m in 2012. It won a consistently increasing number of contracts for methanol, oxo-alcohols, syngas and specialty chemicals plants, especially in China. The business is now seeing large chemicals and coal companies placing repeat orders for new plants.

Johnson Matthey plc Chemicals
152
Precious Metal Products
• In 2012, Johnson Matthey’s Precious Metal Products (PMP) division represented 14% of group sales but 27% of EBIT.
• Our expectations for the division are below consensus.
• The loss of the Anglo Platinum distribution contract will result in a £35m loss of EBIT. We believe the EBIT margin on this contract was c80%.
• The market seems to believe that a similar contract can be signed with another precious metals producer, thus restoring divisional profitability to the 2011 level. We regard this as unrealistic.
• We think the market is underestimating the short-term impact the decline in precious metal prices will have on the PMP division’s profitability.
Division at a glance
The PMP division can be split into services (c33% of divisional sales) and production (c67%). In the services business unit, Johnson Matthey provides global marketing and distribution of PGMs. The refining and recycling unit recycles spent automotive and process catalysts, residues from the precious metal mining industry and jewellery scrap.
The noble metals unit produces a wide range of precious metals products for industrial and medical applications. The colour technologies unit manufactures PGM-containing decorative coatings and silver conductive materials for automotive glass. The catalysts and chemicals unit produces precious- and base-metal-based catalysts for the chemicals and pharmaceuticals industries.
A tough environment for the services business unit
Services include platinum marketing, distribution and refining. Services activities were traditionally dominated by the supply agreement with Anglo American Platinum. Refining activities include the recycling of industrial and automotive catalysts, gold and silver refining from mining residues as well as jewellery scrap.
Anglo American Platinum is the largest single source of precious metals for Johnson Matthey (meeting c30% of its PGM needs). Historically, Johnson Matthey served as Anglo American Platinum’s sole platinum distributor, as well as providing research and market development for the company. The Anglo Platinum operations were Johnson Matthey’s most profitable, with c80% EBIT margin (based on our estimates).
In 2013, Johnson Matthey announced new contract conditions for its cooperation with Anglo Platinum, which come into force at the beginning of 2014. Anglo Platinum will continue to supply precious metals to Johnson Matthey; however, Johnson Matthey will no longer serve as a distributor. The company estimates the full-year impact on EBIT to be c£35m.
Johnson Matthey intends to seek similar contracts in the field of business intelligence with other PGM miners and the market seems to support this view, and is including such contracts in divisional profits.
However, we do not regard this as realistic. Even if such a partner is found, we believe the terms and conditions will be much less favourable than those of the old Anglo Platinum contract. The old contract was signed when the platinum market

Johnson Matthey plc Chemicals
153
was much less liquid and transparent, and we do not think PGM-producing customers will be willing to outsource the distribution of the product to their client.
We expect lower EBIT and ROA for the division looking ahead.
Return on assets and operating margin of the PMP division
Source: Berenberg estimates, Johnson Matthey
Negative impact of PGM price decline underestimated
Precious metal prices have a significant effect on divisional profits and a direct impact on the profits of Johnson Matthey’s metal management activities. The company does not take unhedged positions and most of the profits in the business units come from the bid/offer spread. Spreads increase in periods of precious metal price volatility; hence Johnson Matthey benefits from these.
Precious metal prices also have an indirect effect on the availability of metals for recycling. As scrap collectors do not hedge their metal exposure, when metal prices decline, they hold onto the scrap and wait for the price trend to change. The profitability of the refining business is affected by loading rates; fixed costs in refining represent up to 75% of total cash costs and low loading rates can significantly reduce refining profits.
Ultimately, as for any other metal refiner, the key revenue streams in refining include the treatment charge and sales of free metal (in the event of over-recovery of the metal relative to the quoted metal credit yield). Umicore hedges its free metal exposure; Johnson Matthey does not.
According to the company, each 10% decline in the platinum price results in a £10m decline in group EBIT (5% of 2012 EBIT). With the loss of the Anglo Platinum contract, this impact should halve.
We believe that the market is underestimating the current negative margin pressure arising as a result of declining precious metal prices.

Johnson Matthey plc Chemicals
154
Precious metals price dynamics
1300
1400
1500
1600
1700
1800
1900
2000
12/07/2010 12/07/2011 12/07/2012 12/07/2013
platinum spot ($/troy ounce)
platinum spot ($/troy ounce)
1518212427303336394245
12/07/2010 12/07/2011 12/07/2012 12/07/2013
silver spot ($/troy ounce)
silver ($/ Troy ounce)
1000
1200
1400
1600
1800
2000
12/07/2010 12/07/2011 12/07/2012 12/07/2013
gold spot ($/troy ounce)
gold spot ($/ Troy ounce)
Source: Bloomberg
Production unit performance also subdued
The production unit of the PMP division includes noble metals, colour technologies and catalysts and chemicals. We expect the performance of this business unit to remain subdued. In noble metals, Johnson Matthey develops a wide range of precious metal products. As industrial products account for approximately 67% of noble metal sales (with medical products accounting for the other 33%), sales growth in this division is heavily linked to industrial production growth. We do not expect a strong recovery in industrial production in the near term.
In 2006, Johnson Matthey signed a marketing agreement with Yara for N2O abatement catalysts. Yara is the world’s largest producer of nitrogen fertilisers. It also has an industrial division which is a leading supplier of nitrogen-based NOx abatement products.
The use of N2O abatement technology is very sensitive to the carbon price, which has recently collapsed. This should have a negative impact on noble products sales in 2014.
Colouring technologies has very high exposure to the automotive industry (c60% of sales), as it manufactures silver conductive materials for automotive glass. As mentioned above, we do not expect a fast recovery in automotive production.

Johnson Matthey plc Chemicals
155
Fine Chemicals: no longer a monopoly
• In 2012, the Fine Chemicals division represented 11% of group sales and 17% of profits.
• The loss of its monopolistic position in opiate-based pain management will limit sales growth in the near term.
• We expect the cost-cutting programme to boost the EBIT margin by 100bp.
Division at a glance
The Fine Chemicals division consists of two business units: API manufacturing and research chemicals. API manufacturing produces active pharmaceutical ingredients (APIs) for pain management. Research chemicals supplies specialty inorganic and organic chemicals for various research and development activities.
Changes in competitive dynamics
Together, Europe and North America account for 90% of the Fine Chemicals division’s sales. Through its wholly-owned subsidiary, Macfarlan Smith, Johnson Matthey is the world’s leading producer of opiates used mainly for pain management.
This year, Macfarlan Smith’s business has been negatively affected by fundamental changes. Previously, the company benefited from being the only UK government-approved importer of certain controlled substances, such as opiate-based pain management. However, one of Johnson Matthey’s clients was recently granted an import licence for the same products. The monopoly that Johnson Matthey previously enjoyed was therefore disrupted, which led to some loss in pricing power. The UK government is now reviewing the regulation of the market.
The company reacted to the changing dynamics in this division by cutting costs. It reduced divisional personnel by 10% and expects to generate £5m of annual savings (7% of current EBIT) starting from H2 of this financial year.
In our model, we do not assume a radical deterioration of the current competitive situation; however, we are more cautious than consensus on potential growth rates.

Johnson Matthey plc Chemicals
156
Johnson Matthey: company overview
Johnson Matthey has operations in over 30 countries and employs around 11,000 people worldwide.
Johnson Matthey sales split (2012)
China, 10%
Rest of Asia, 11%
Rest of World,
12%
Europe, 33%
North America,
34%
Johnson Matthey regional sales split
PGM Services,
5% Other, 11%
HDD, 18%
LDV, 38%
Sales by key market
Pharmaceutical, 13%
Petrochemical, 15%
Source: Johnson Matthey
The ECT division manufactures automotive and process catalysts. Johnson Matthey has c32% global market share in LDV catalysts and c65% in HDD. In process catalysts, it produces catalysts for stationary sources. The Process Technologies division includes base metal catalysts such as nickel, copper and cobalt for the production of syngas, ammonia, hydrogen, methanol, formaldehyde, oleo chemicals, oxo-alcohols, GTL, CTL and additives for refining. It also includes Davy Process Technology, which provides licences and know-how for the use of advanced process technologies related to the manufacture of oil and gas and petrochemicals. The company also manufactures base and precious metal catalysts for the fine chemicals and pharmaceuticals industries, as well as catalysts and components for emerging fuel cell markets.
The battery technology business unit was formed in 2012/13 and comprises Johnson Matthey’s R&D programmes in advanced battery materials and Axeon, which specialises in the design, development and manufacture of integrated battery systems. The business is focused on developing advanced technologies for automotive batteries.
The PMP division can be split into services (c33% of PMP sales) and production (c67%). It is the longest established part of Johnson Matthey, having existed when the company was founded in 1817.
In the services business unit, Johnson Matthey provides global marketing and distribution of PGMs. The refining and recycling unit recycles spent automotive and process catalysts, residues from the precious metal mining industry and jewellery scrap. The noble metals unit produces a wide range of precious metals products for industrial and medical applications.
The colour technologies unit manufactures PGM-containing decorative coatings and silver conductive materials for automotive glass. The catalysts and chemicals unit produces precious- and base-metal-based catalysts for the chemicals and pharmaceuticals industries.
The Fine Chemicals division consists of two business units: API manufacturing and research chemicals. API manufacturing produces active pharmaceutical ingredients (APIs) for pain management. Research chemicals supplies specialty inorganic and organic chemicals for various research and development activities.

Johnson Matthey plc Chemicals
157
New businesses include a number of new technologies which Johnson Matthey is currently developing. The company is constantly looking for markets which offer strong growth and present an opportunity for new market entry positions through a new technology solution.
Johnson Matthey is already well positioned with technology to combat vehicle emissions. Now the company is also targeting the indoor air pollutants market. Johnson Matthey estimates that demand for new air purification technologies will represent a market of around £1bn per annum by 2020.
Advanced food packaging is another area of prospective development for Johnson Matthey. Increased international food transportation requires an overall improvement in products’ shelf life. According to Johnson Matthey, advanced food applications will represent a market of around £3bn per annum by 2020.
There is a clear need for more effective technological solutions in water purification. Johnson Matthey focuses on niche areas with the most attractive and urgent opportunities; the corresponding markets are estimated to reach £500m per annum by 2020.
Johnson Matthey has a number of R&D programmes in battery materials EVs. The company is also considering potential acquisitions in the area. The first of these acquisitions took place in 2012, when Johnson Matthey acquired Axeon. By 2020, Johnson Matthey intends to have significant sales of battery materials together with continued growth from the Axeon business.
Reorganisation. The company has recently reorganised its divisional reporting. Process Technologies, which previously represented part of ECT, now reports separately.
A new businesses division was also created. It includes the fuel cells and battery technology business units, which were preciously reported under the ECT division, as well as some new business units such as water purification.

Johnson Matthey plc Chemicals
158
Valuation
Source: Company data, Berenberg estimates

Johnson Matthey plc Chemicals
159
DCF analysis
Source: Berenberg estimates

Johnson Matthey plc Chemicals
160
Financials
Profit and loss account
Source: Company data, Berenberg estimates

Johnson Matthey plc Chemicals
161
Balance sheet
Source: Company data, Berenberg estimates

Johnson Matthey plc Chemicals
162
Cash flow statement
Source: Company data, Berenberg estimates

Johnson Matthey plc Chemicals
163
Divisional split (before restatement)
Source: Company data, Berenberg estimates
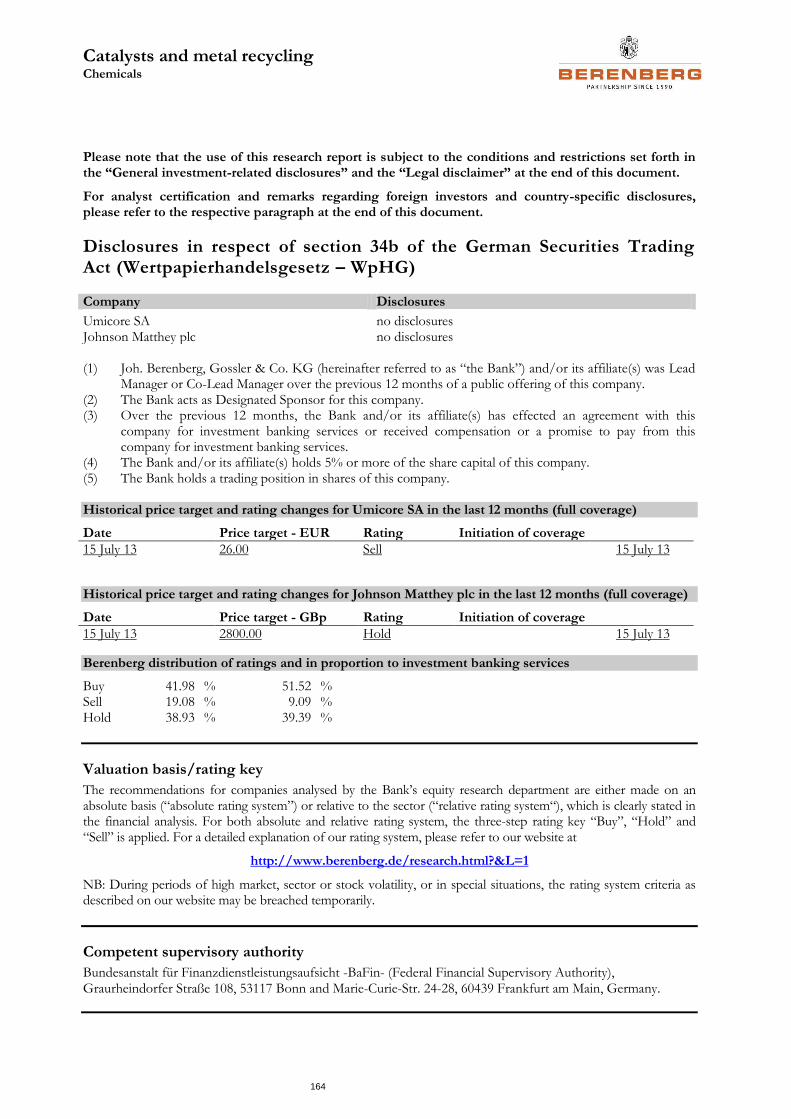
Catalysts and metal recycling Chemicals
164
Please note that the use of this research report is subject to the conditions and restrictions set forth in the “General investment-related disclosures” and the “Legal disclaimer” at the end of this document.
For analyst certification and remarks regarding foreign investors and country-specific disclosures, please refer to the respective paragraph at the end of this document.
Disclosures in respect of section 34b of the German Securities Trading Act (Wertpapierhandelsgesetz – WpHG)
Company Disclosures Umicore SA no disclosures Johnson Matthey plc no disclosures (1) Joh. Berenberg, Gossler & Co. KG (hereinafter referred to as “the Bank”) and/or its affiliate(s) was Lead
Manager or Co-Lead Manager over the previous 12 months of a public offering of this company. (2) The Bank acts as Designated Sponsor for this company. (3) Over the previous 12 months, the Bank and/or its affiliate(s) has effected an agreement with this
company for investment banking services or received compensation or a promise to pay from this company for investment banking services.
(4) The Bank and/or its affiliate(s) holds 5% or more of the share capital of this company. (5) The Bank holds a trading position in shares of this company. Historical price target and rating changes for Umicore SA in the last 12 months (full coverage)
Date Price target - EUR Rating Initiation of coverage
15 July 13 26.00 Sell 15 July 13
Historical price target and rating changes for Johnson Matthey plc in the last 12 months (full coverage)
Date Price target - GBp Rating Initiation of coverage
15 July 13 2800.00 Hold 15 July 13
Berenberg distribution of ratings and in proportion to investment banking services
Buy 41.98 % 51.52 % Sell 19.08 % 9.09 % Hold 38.93 % 39.39 %
Valuation basis/rating key
The recommendations for companies analysed by the Bank’s equity research department are either made on an absolute basis (“absolute rating system”) or relative to the sector (“relative rating system“), which is clearly stated in the financial analysis. For both absolute and relative rating system, the three-step rating key “Buy”, “Hold” and “Sell” is applied. For a detailed explanation of our rating system, please refer to our website at
http://www.berenberg.de/research.html?&L=1
NB: During periods of high market, sector or stock volatility, or in special situations, the rating system criteria as described on our website may be breached temporarily.
Competent supervisory authority
Bundesanstalt für Finanzdienstleistungsaufsicht -BaFin- (Federal Financial Supervisory Authority), Graurheindorfer Straße 108, 53117 Bonn and Marie-Curie-Str. 24-28, 60439 Frankfurt am Main, Germany.

Catalysts and metal recycling Chemicals
165
General investment-related disclosures Joh. Berenberg, Gossler & Co. KG (hereinafter referred to as „the Bank“) has made every effort to carefully research all information contained in this financial analysis. The information on which the financial analysis is based has been obtained from sources which we believe to be reliable such as, for example, Thomson Reuters, Bloomberg and the relevant specialised press as well as the company which is the subject of this financial analysis. Only that part of the research note is made available to the issuer (who is the subject of this analysis) which is necessary to properly reconcile with the facts. Should this result in considerable changes a reference is made in the research note.
Opinions expressed in this financial analysis are our current opinions as of the issuing date indicated on this document. The companies analysed by the Bank are divided into two groups: those under “full coverage” (regular updates provided); and those under “screening coverage” (updates provided as and when required at irregular intervals).
The functional job title of the person/s responsible for the recommendations contained in this report is “Equity Research Analyst” unless otherwise stated on the cover.
The following internet link provides further remarks on our financial analyses: http://www.berenberg.de/research.html?&L=1&no_cache=1
Legal disclaimer This document has been prepared by Joh. Berenberg, Gossler & Co. KG (hereinafter referred to as „the Bank“). This document does not claim completeness regarding all the information on the stocks, stock markets or developments referred to in it. On no account should the document be regarded as a substitute for the recipient procuring information for himself/herself or exercising his/her own judgements. The document has been produced for information purposes for institutional clients or market professionals. Private customers, into whose possession this document comes, should discuss possible investment decisions with their customer service officer as differing views and opinions may exist with regard to the stocks referred to in this document.
This document is not a solicitation or an offer to buy or sell the mentioned stock.
The document may include certain descriptions, statements, estimates, and conclusions underlining potential market and company development. These reflect assumptions, which may turn out to be incorrect. The Bank and/or its employees accept no liability whatsoever for any direct or consequential loss or damages of any kind arising out of the use of this document or any part of its content.
The Bank and/or its employees may hold, buy or sell positions in any securities mentioned in this document, derivatives thereon or related financial products. The Bank and/or its employees may underwrite issues for any securities mentioned in this document, derivatives thereon or related financial products or seek to perform capital market or underwriting services.
Analyst certification I, Evgenia Molotova, hereby certify that all of the views expressed in this report accurately reflect my personal views about any and all of the subject securities or issuers discussed herein.
In addition, I hereby certify that no part of my compensation was, is, or will be, directly or indirectly related to the specific recommendations or views expressed in this research report, nor is it tied to any specific investment banking transaction performed by the Bank or its affiliates.
I, Jaideep Pandya, hereby certify that all of the views expressed in this report accurately reflect my personal views about any and all of the subject securities or issuers discussed herein.
In addition, I hereby certify that no part of my compensation was, is, or will be, directly or indirectly related to the specific recommendations or views expressed in this research report, nor is it tied to any specific investment banking transaction performed by the Bank or its affiliates.

Catalysts and metal recycling Chemicals
166
I, John Klein, hereby certify that all of the views expressed in this report accurately reflect my personal views about any and all of the subject securities or issuers discussed herein.
In addition, I hereby certify that no part of my compensation was, is, or will be, directly or indirectly related to the specific recommendations or views expressed in this research report, nor is it tied to any specific investment banking transaction performed by the Bank or its affiliates.
Remarks regarding foreign investors The preparation of this document is subject to regulation by German law. The distribution of this document in other jurisdictions may be restricted by law, and persons into whose possession this document comes should inform themselves about, and observe, any such restrictions.
United Kingdom This document is meant exclusively for institutional investors and market professionals, but not for private customers. It is not for distribution to or the use of private investors or private customers.
United States of America This document has been prepared exclusively by the Bank. Although Berenberg Capital Markets LLC, an affiliate of the Bank and registered US broker-dealer, distributes this document to certain customers, Berenberg Capital Markets LLC does not provide input into its contents, nor does this document constitute research of Berenberg Capital Markets LLC. In addition, this document is meant exclusively for institutional investors and market professionals, but not for private customers. It is not for distribution to or the use of private investors or private customers.
This document is classified as objective for the purposes of FINRA rules. Please contact Berenberg Capital Markets LLC (+1 617.292.8200), if you require additional information.
Third-party research disclosures
Company Disclosures Umicore SA no disclosures Johnson Matthey plc no disclosures (1) Berenberg Capital Markets LLC owned 1% or more of the outstanding shares of any class of the subject
company by the end of the prior month.* (2) Over the previous 12 months, Berenberg Capital Markets LLC has managed or co-managed any public
offering for the subject company.* (3) Berenberg Capital Markets LLC is making a market in the subject securities at the time of the report. (4) Berenberg Capital Markets LLC received compensation for investment banking services in the past 12
months, or expects to receive such compensation in the next 3 months.* (5) There is another potential conflict of interest of the analyst or Berenberg Capital Markets LLC, of which
the analyst knows or has reason to know at the time of publication of this research report.
* For disclosures regarding affiliates of Berenberg Capital Markets LLC please refer to the ‘Disclosures in respect of section 34b of the German Securities Trading Act (Wertpapierhandelsgesetz – WpHG)’ section above.
Copyright The Bank reserves all the rights in this document. No part of the document or its content may be rewritten, copied, photocopied or duplicated in any form by any means or redistributed without the Bank’s prior written consent.
© May 2013 Joh. Berenberg, Gossler & Co. KG

Catalysts and metal recycling Chemicals
167
Contacts: Investment Banking
Equity Research E-mail: [email protected]; Internet www.berenberg.de
BANKS ECONOMICS MID-CAP GENERAL
Nick Anderson +44 (0) 20 3207 7838 Dr. Holger Schmieding +44 (0) 20 3207 7889 Gunnar Cohrs +44 (0) 20 3207 7894
James Chappell +44 (0) 20 3207 7844 Dr. Christian Schulz +44 (0) 20 3207 7878 Bjoern Lippe +44 (0) 20 3207 7845
Andrew Lowe +44 (0) 20 3465 2743 Robert Wood +44 (0) 20 3207 7822 Anna Patrice +44 (0) 20 3207 7863
Eoin Mullany +44 (0) 20 3207 7854 Stanislaus von Thurn und Taxis +44 (0) 20 3465 2631
Eleni Papoula +44 (0) 20 3465 2741 FOOD MANUFACTURING
Michelle Wilson +44 (0) 20 3465 2663 Fintan Ryan +44 (0) 20 3465 2748 OIL & GAS
Andrew Steele +44 (0) 20 3207 7926 Asad Farid +44 (0) 20 3207 7932
BEVERAGES James Targett +44 (0) 20 3207 7873 Jaideep Pandya +44 (0) 20 3207 7890
Philip Morrisey +44 (0) 20 3207 7892
Josh Puddle +44 (0) 20 3207 7881 GENERAL RETAIL & LUXURY GOODS REAL ESTATE
Bassel Choughari +44 (0) 20 3465 2675 Kai Klose +44 (0) 20 3207 7888
BUSINESS SERVICES John Guy +44 (0) 20 3465 2674 Estelle Weingrod +44 (0) 20 3207 7931
William Foggon +44 (0) 20 3207 7882
Simon Mezzanotte +44 (0) 20 3207 7917 HEALTHCARE TECHNOLOGY
Arash Roshan Zamir +44 (0) 20 3465 2636 Scott Bardo +44 (0) 20 3207 7869 Adnaan Ahmad +44 (0) 20 3207 7851
Konrad Zomer +44 (0) 20 3207 7920 Alistair Campbell +44 (0) 20 3207 7876 Sebastian Grabert +44 (0) 20 3207 7834
Charles Cooper +44 (0) 20 3465 2637 Daud Khan +44 (0) 20 3465 2638
CAPITAL GOODS Louise Hinds +44 (0) 20 3465 2747 Ali Khwaja +44 (0) 20 3207 7852
Frederik Bitter +44 (0) 20 3207 7916 Tom Jones +44 (0) 20 3207 7877 Tammy Qiu +44 (0) 20 3465 2673
Benjamin Glaeser +44 (0) 20 3207 7918
William Mackie +44 (0) 20 3207 7837 HOUSEHOLD & PERSONAL CARE TELECOMMUNICATIONS
Margaret Paxton +44 (0) 20 3207 7934 Jade Barkett +44 (0) 20 3207 7895 Wassil El Hebil +44 (0) 20 3207 7862
Alexander Virgo +44 (0) 20 3207 7856 Seth Peterson +44 (0) 20 3207 7891 Usman Ghazi +44 (0) 20 3207 7824
Felix Wienen +44 (0) 20 3207 7915 Stuart Gordon +44 (0) 20 3207 7858
INSURANCE Laura Janssens +44 (0) 20 3465 2639
CHEMICALS Tom Carstairs +44 (0) 20 3207 7823 Paul Marsch +44 (0) 20 3207 7857
John Philipp Klein +44 (0) 20 3207 7930 Peter Eliot +44 (0) 20 3207 7880 Barry Zeitoune +44 (0) 20 3207 7859
Evgenia Molotova +44 (0) 20 3465 2664 Kai Mueller +44 (0) 20 3465 2681
Jaideep Pandya +44 (0) 20 3207 7890 Matthew Preston +44 (0) 20 3207 7913 TOBACCO
Sami Taipalus +44 (0) 20 3207 7866 Erik Bloomquist +44 (0) 20 3207 7870
CONSTRUCTION Kate Kalashnikova +44 (0) 20 3465 2665
Chris Moore +44 (0) 20 3465 2737 MEDIA
Robert Muir +44 (0) 20 3207 7860 Robert Berg +44 (0) 20 3465 2680 UTILITIES
Michael Watts +44 (0) 20 3207 7928 Emma Coulby +44 (0) 20 3207 7821 Robert Chantry +44 (0) 20 3207 7861
Laura Janssens +44 (0) 20 3465 2639 Andrew Fisher +44 (0) 20 3207 7937
DIVERSIFIED FINANCIALS Sarah Simon +44 (0) 20 3207 7830 Oliver Salvesen +44 (0) 20 3207 7818
Pras Jeyanandhan +44 (0) 20 3207 7899 Lawson Steele +44 (0) 20 3207 7887
Sales E-mail: [email protected]; Internet www.berenberg.de
Specialist Sales Sales Sales Trading
BANKS LONDON HAMBURG
Iro Papadopoulou +44 (0) 20 3207 7924 John von Berenberg-Consbruch +44 (0) 20 3207 7805 Paul Dontenwill +49 (0) 40 350 60 563
Matt Chawner +44 (0) 20 3207 7847 Alexander Heinz +49 (0) 40 350 60 359
CONSUMER Toby Flaux +44 (0) 20 3465 2745 Gregor Labahn +49 (0) 40 350 60 571
Rupert Trotter +44 (0) 20 3207 7815 Karl Hancock +44 (0) 20 3207 7803 Chris McKeand +49 (0) 40 350 60 798
Sean Heath +44 (0) 20 3465 2742 Fin Schaffer +49 (0) 40 350 60 596
INSURANCE David Hogg +44 (0) 20 3465 2628 Lars Schwartau +49 (0) 40 350 60 450
Trevor Moss +44 (0) 20 3207 7893 Zubin Hubner +44 (0) 20 3207 7885 Marvin Schweden +49 (0) 40 350 60 576
Ben Hutton +44 (0) 20 3207 7804 Tim Storm +49 (0) 40 350 60 415
HEALTHCARE James Matthews +44 (0) 20 3207 7807 Philipp Wiechmann +49 (0) 40 350 60 346
Frazer Hall +44 (0) 20 3207 7875 David Mortlock +44 (0) 20 3207 7850
Peter Nichols +44 (0) 20 3207 7810 LONDON
INDUSTRIALS Richard Payman +44 (0) 20 3207 7825 Mike Berry +44 (0) 20 3465 2755
Chris Armstrong +44 (0) 20 3207 7809 George Smibert +44 (0) 20 3207 7911 Stewart Cook +44 (0) 20 3465 2752
Kaj Alftan +44 (0) 20 3207 7879 Anita Surana +44 (0) 20 3207 7855 Simon Messman +44 (0) 20 3465 2754
Paul Walker +44 (0) 20 3465 2632 Stephen O'Donohoe +44 (0) 20 3465 2753
MEDIA
Julia Thannheiser +44 (0) 20 3465 2676 PARIS PARIS
Miel Bakker (London) +44 (0) 20 3207 7808 Sylvain Granjoux +33 (0) 1 5844 9509
TECHNOLOGY Dalila Farigoule +33 (0) 1 5844 9510
Jean Beaubois +44 (0) 20 3207 7835 Clémence La Clavière-Peyraud +33 (0) 1 5844 9521 SOVEREIGN WEALTH FUNDS
Olivier Thibert +33 (0) 1 5844 9512 Max von Doetinchem +44 (0) 20 3207 7826
TELECOMMUNICATIONS
Julia Thannheiser +44 (0) 20 3465 2676 ZURICH CORPORATE ACCESS
Stephan Hofer +41 (0) 44 283 2029 Patricia Nehring +44 (0) 20 3207 7811
UTILITIES Carsten Kinder +41 (0) 44 283 2024
Benita Barretto +44 (0) 20 3207 7829 Gianni Lavigna +41 (0) 44 283 2038 EVENTS
Benjamin Stillfried +41 (0) 44 283 2033 Natalie Meech +44 (0) 20 3207 7831
Sales Charlotte Kilby +44 (0) 20 3207 7832
FRANKFURT BENELUX Charlotte Reeves +44 (0) 20 3465 2671
Michael Brauburger +49 (0) 69 91 30 90 741 Miel Bakker (London) +44 (0) 20 3207 7808 Hannah Whitehead +44 (0) 20 3207 7922
Nina Buechs +49 (0) 69 91 30 90 735 Susette Mantzel (Hamburg) +49 (0) 40 350 60 694
André Grosskurth +49 (0) 69 91 30 90 734 Alexander Wace (London) +44 (0) 20 3465 2670 CRM
Boris Koegel +49 (0) 69 91 30 90 740 Greg Swallow +44 (0) 20 3207 7833
Joerg Wenzel +49 (0) 69 91 30 90 743 SCANDINAVIA Laura Cooper +44 (0) 20 3207 7806
Ronald Bernette (London) +44 (0) 20 3207 7828
Marco Weiss (Hamburg) +49 (0) 40 350 60 719
US Sales E-mail: [email protected]
BERENBERG CAPITAL MARKETS LLC
Member FINRA & SIPC
Andrew Holder +1 (617) 292 8222 Julie Doherty +1 (617) 292 8228 Emily Mouret +1 (646) 445 7204
Colin Andrade +1 (617) 292 8230 Kelleigh Faldi +1 (617) 292 8288 Jonathan Saxon +1 (646) 445 7202
Cathal Carroll +1 (646) 445 7206 Kieran O'Sullivan +1 (617) 292 8292
Burr Clark +1 (617) 292 8282 Jonathan Paterson +1 (646) 445 7212