Embed Size (px)
Citation preview
CASTOR CROP SURVEY: 2015-16
THE SOLVENT EXTRACTORS’ ASSOCIATION OF INDIA
Co
pyr
igh
t ©
2013
Th
e N
iels
en C
om
pan
y. C
on
fid
enti
al a
nd
pro
pri
etar
y.
2
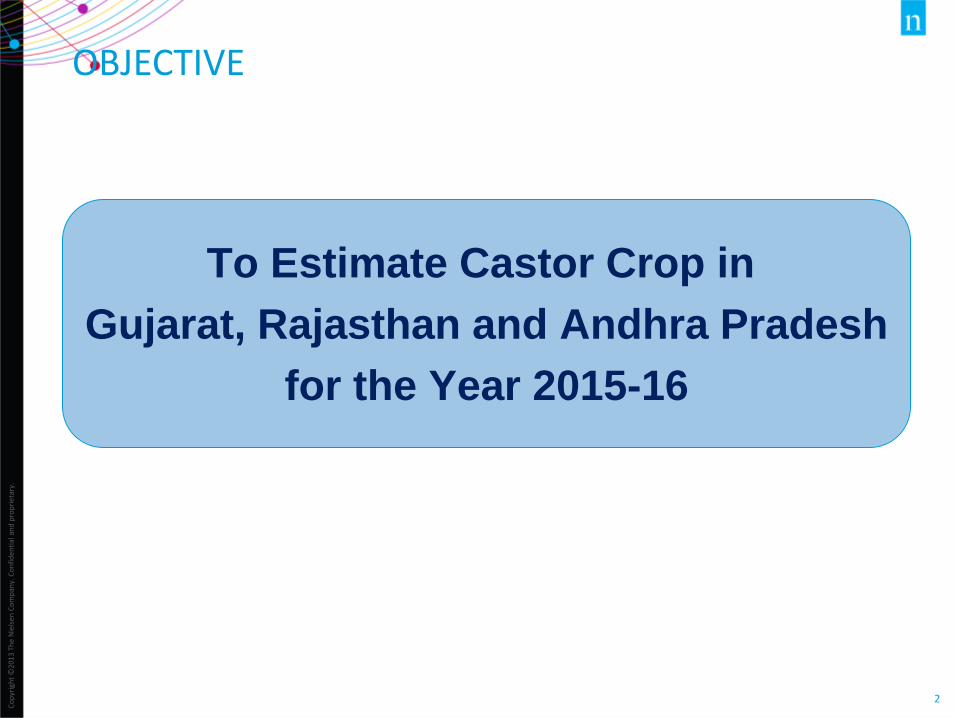
OBJECTIVE
To Estimate Castor Crop in
Gujarat, Rajasthan and Andhra Pradesh
for the Year 2015-16
Co
pyr
igh
t ©
2012
Th
e N
iels
en C
om
pan
y. C
on
fid
enti
al a
nd
pro
pri
etar
y.
3
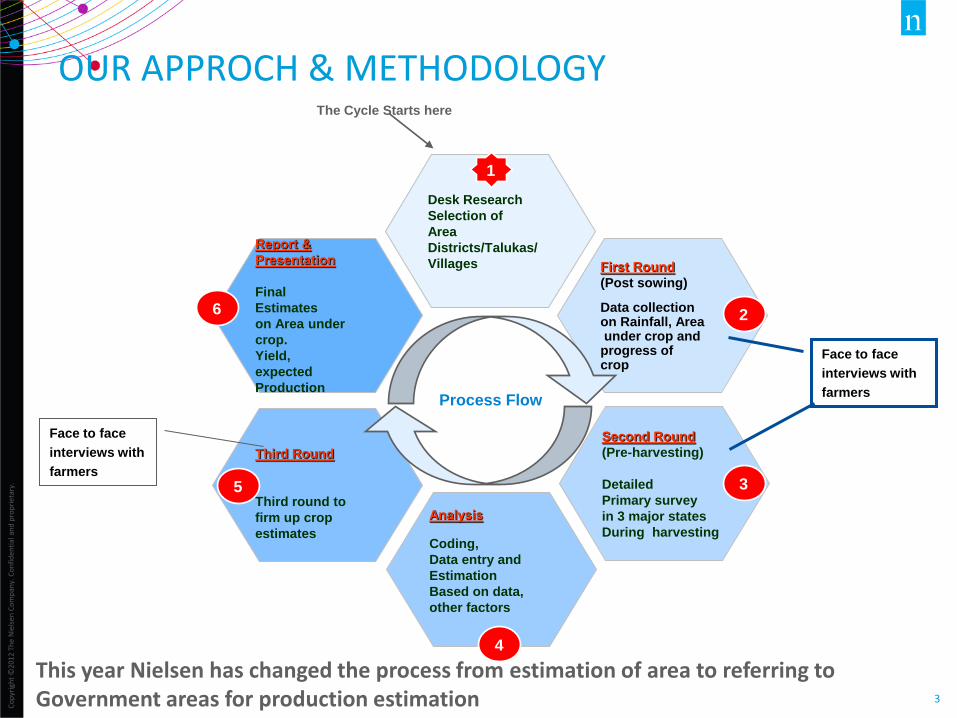
OUR APPROCH & METHODOLOGY The Cycle Starts here
Desk Research
Selection of
Area
Districts/Talukas/
Villages
First Round
(Post sowing)
Data collection on Rainfall, Area under crop and progress of crop
Analysis
Coding,
Data entry and
Estimation
Based on data,
other factors
Second Round
(Pre-harvesting)
Detailed
Primary survey
in 3 major states
During harvesting
Report &
Presentation
Final
Estimates
on Area under
crop.
Yield,
expected
Production
Third Round
Third round to
firm up crop
estimates
Process Flow
1
2
3
4
5
6
Face to face
interviews with
farmers
Face to face
interviews with
farmers
This year Nielsen has changed the process from estimation of area to referring to Government areas for production estimation

Co
pyr
igh
t ©
2013
Th
e N
iels
en C
om
pan
y. C
on
fid
enti
al a
nd
pro
pri
etar
y.
4
BACKGROUND
Castor Seed crop Survey to be conducted in 5 rounds of which 3 rounds have been
completed
Gujarat & Rajasthan
Round 1
• To understand the crop progress
• Area under crop and growth / de-growth
• Conducted during the month of October
Gujarat, Rajasthan & Andhra Pradesh
Round 2
• Area under crop, Expected yield
• Expected number of rounds
• Price expectation and disposal plan
• 1st and 2nd week of January (Gujarat) & 1st & 2nd week of Oct (AP)
Gujarat, Rajasthan & Andhra Pradesh
Round 3
• To recheck the crop estimates in draft report
• 50% face to face interview & 50% telephonic interview (with 2nd round farmer)
• 1st week of February
Gujarat & Rajasthan
Round 4
• To recheck the crop estimates in draft report with 20% 2nd round farmers
• 50% face to face interview & 50% telephonic interview (with 2nd round farmer)
• 2nd week of March
Gujarat & Rajasthan
Round 5
• To firm up the final crop estimates with 20% 2nd round farmers
• 50% face to face interview & 50% telephonic interview (with 2nd round farmer)
• 1st week of May

Co
pyr
igh
t ©
2012
Th
e N
iels
en C
om
pan
y. C
on
fid
enti
al a
nd
pro
pri
etar
y.
5
SAMPLE COVERED
Sample Plan
1484 farmers were covered during
the detailed field survey for Gujarat
500 farmers were covered during
the detailed field survey for
Rajasthan
651 farmers were covered during
the detailed field survey for Andhra
Pradesh and Telengana
Rajasthan
Andhra Pradesh/
Telangana
18%
69%
10%
Gujarat
Castor Area contribution by covered states
Type of Contacts Gujarat Rajasthan Andhra Pradesh
Total
Farmers 1484 500 651 2641
Traders 40 15 20 70
Others (APMCs, Agri Dept. etc.)
20 5 10 37
Total 1544 520 681 2745

GUJARAT
Co
pyr
igh
t ©
2012
Th
e N
iels
en C
om
pan
y. C
on
fid
enti
al a
nd
pro
pri
etar
y.
7
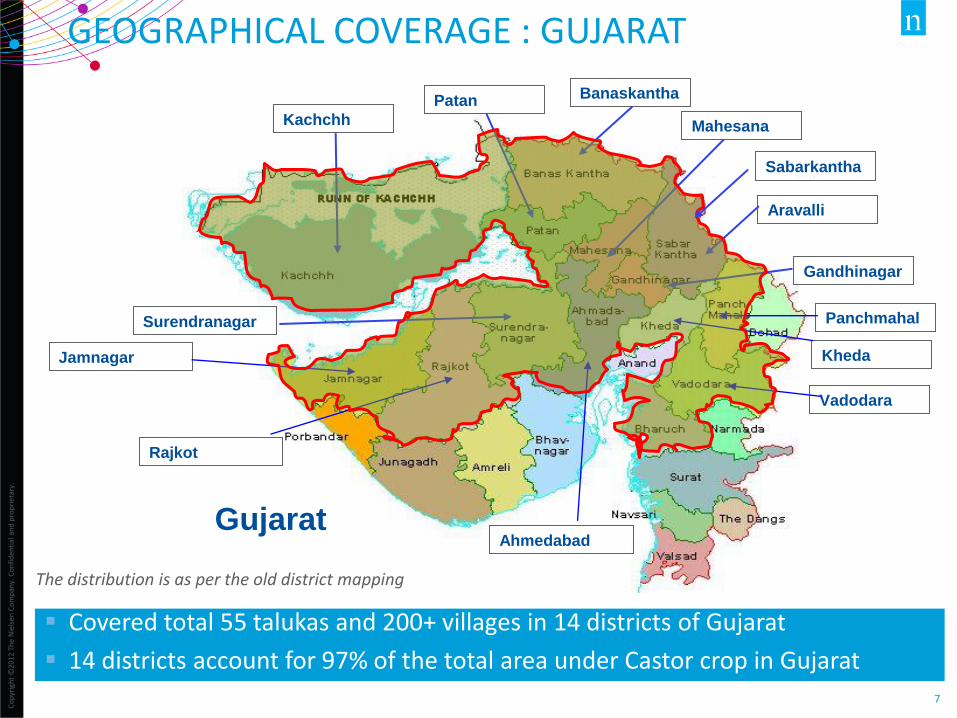
GEOGRAPHICAL COVERAGE : GUJARAT
Aravalli
Gandhinagar
Mahesana
Banaskantha Patan
Kachchh
Surendranagar Panchmahal
Kheda
Vadodara
Jamnagar
Rajkot
Ahmedabad Gujarat
Sabarkantha
Covered total 55 talukas and 200+ villages in 14 districts of Gujarat
14 districts account for 97% of the total area under Castor crop in Gujarat
The distribution is as per the old district mapping
Co
pyr
igh
t ©
2013
Th
e N
iels
en C
om
pan
y. C
on
fid
enti
al a
nd
pro
pri
etar
y.
8
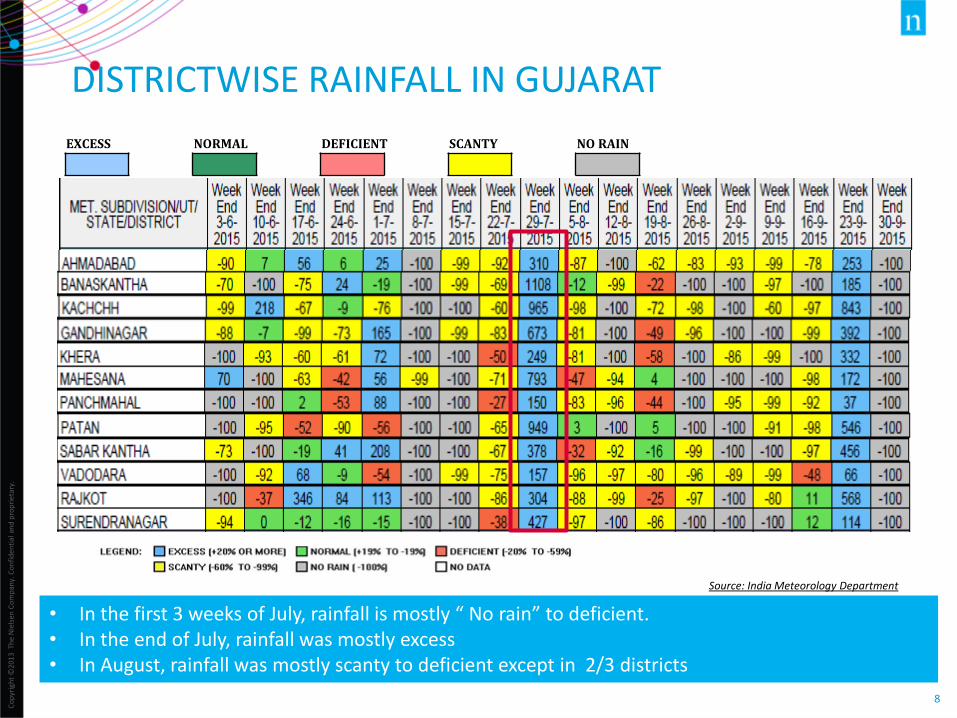
EXCESS NORMAL DEFICIENT SCANTY NO RAIN
Source: India Meteorology Department
DISTRICTWISE RAINFALL IN GUJARAT
• In the first 3 weeks of July, rainfall is mostly “ No rain” to deficient. • In the end of July, rainfall was mostly excess • In August, rainfall was mostly scanty to deficient except in 2/3 districts
Co
pyr
igh
t ©
2014
Th
e N
iels
en C
om
pan
y. C
on
fid
enti
al a
nd
pro
pri
etar
y.
9
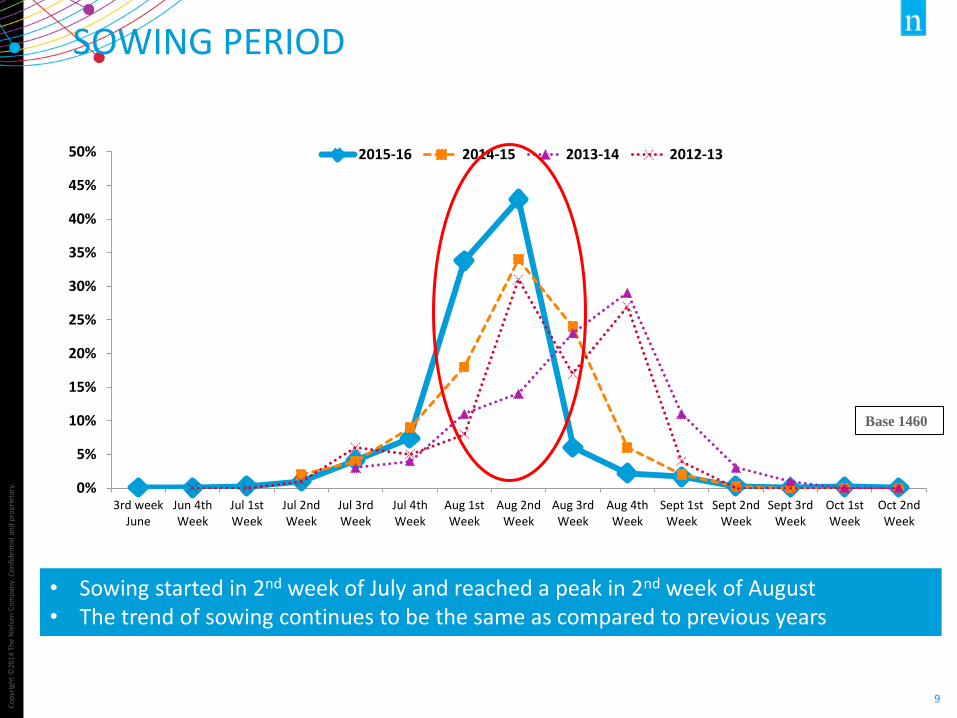
SOWING PERIOD
0%
5%
10%
15%
20%
25%
30%
35%
40%
45%
50%
3rd weekJune
Jun 4thWeek
Jul 1stWeek
Jul 2ndWeek
Jul 3rdWeek
Jul 4thWeek
Aug 1stWeek
Aug 2ndWeek
Aug 3rdWeek
Aug 4thWeek
Sept 1stWeek
Sept 2ndWeek
Sept 3rdWeek
Oct 1stWeek
Oct 2ndWeek
2015-16 2014-15 2013-14 2012-13
• Sowing started in 2nd week of July and reached a peak in 2nd week of August • The trend of sowing continues to be the same as compared to previous years
Base 1460
Co
pyr
igh
t ©
2014
Th
e N
iels
en C
om
pan
y. C
on
fid
enti
al a
nd
pro
pri
etar
y.
10
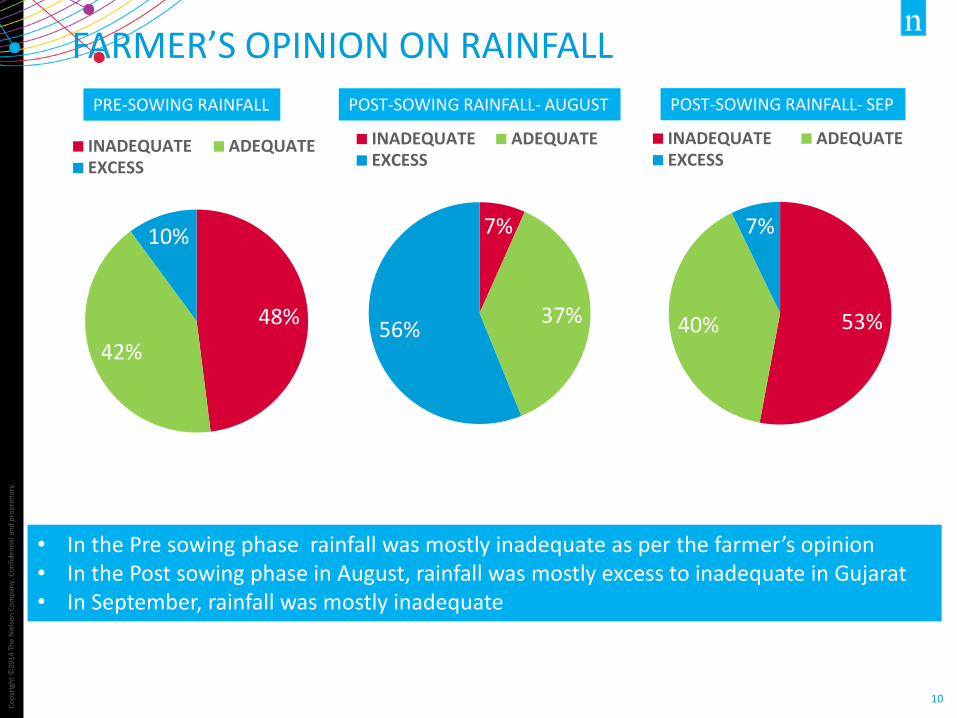
FARMER’S OPINION ON RAINFALL
48%
42%
10%
INADEQUATE ADEQUATEEXCESS
PRE-SOWING RAINFALL
7%
37% 56%
INADEQUATE ADEQUATEEXCESS
POST-SOWING RAINFALL- AUGUST POST-SOWING RAINFALL- SEP
53% 40%
7%
INADEQUATE ADEQUATEEXCESS
• In the Pre sowing phase rainfall was mostly inadequate as per the farmer’s opinion • In the Post sowing phase in August, rainfall was mostly excess to inadequate in Gujarat • In September, rainfall was mostly inadequate
Co
pyr
igh
t ©
2012
Th
e N
iels
en C
om
pan
y. C
on
fid
enti
al a
nd
pro
pri
etar
y.
11
7%
31%
1%
2%
1%
1%
2%
12%
3%
0%
25%
Bajra
Cotton
Ground Nut
Jeera
Jowar
Sesame
Coriander
Guar
Vagetable
Maize
Empty Land
Gujarat
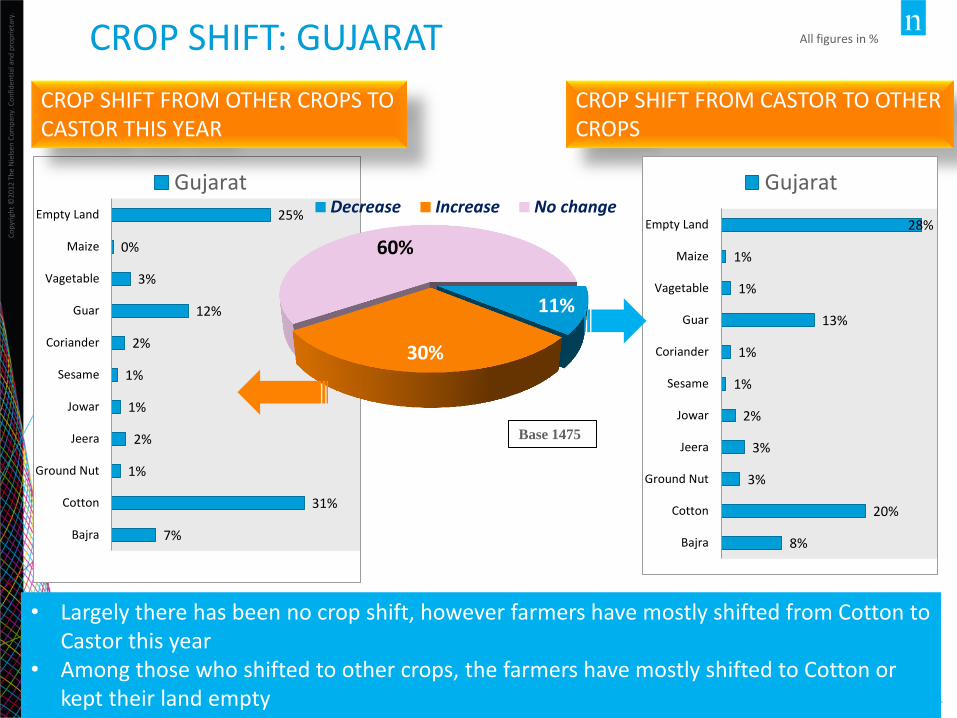
CROP SHIFT: GUJARAT
CROP SHIFT FROM OTHER CROPS TO CASTOR THIS YEAR
CROP SHIFT FROM CASTOR TO OTHER CROPS
8%
20%
3%
3%
2%
1%
1%
13%
1%
1%
28%
Bajra
Cotton
Ground Nut
Jeera
Jowar
Sesame
Coriander
Guar
Vagetable
Maize
Empty Land
Gujarat
11%
30%
60%
Decrease Increase No change
All figures in %
Base 1475
• Largely there has been no crop shift, however farmers have mostly shifted from Cotton to Castor this year
• Among those who shifted to other crops, the farmers have mostly shifted to Cotton or kept their land empty

Co
pyr
igh
t ©
2014
Th
e N
iels
en C
om
pan
y. C
on
fid
enti
al a
nd
pro
pri
etar
y.
12
District Area Under Crop*
('000 ha.) 2014-15 2015-16 E % Change
Banaskantha 135 141 4%
Sabarkantha 63 65 4% Mehsana 78 84 8%
Patan 117 112 -4%
Gandhinagar 26 23 -13%
Kachchh 93 119 28% Surendranagar 68 78 14%
Jamnagar 8 9 9%
Rajkot 10 8 -17% Vadodara 27 33 23%
Kheda 13 5 -61%
Ahmedabad 48 59 22%
Others 47 45 -5%
Total area 734 781 6%
AREA UNDER CASTOR CROP IN GUJARAT:2015-16
* Government estimates
• Area under castor has increased by 6% in 2015-16 as compared to 2014-15 as per Government estimates

Co
pyr
igh
t ©
2014
Th
e N
iels
en C
om
pan
y. C
on
fid
enti
al a
nd
pro
pri
etar
y.
13
District Yield *
(Kg/ha.) 2014-15 2015-16 % Change
Banaskantha 1789 1835 3%
Sabarkantha 1989 2022 2% Mehsana 1362 1437 6%
Patan 1605 1631 2%
Gandhinagar 1960 2010 3%
Kachchh 475 561 18% Surendranagar 865 960 11%
Jamnagar 1030 1110 8%
Rajkot 1315 1415 8% Vadodara 1691 1721 2%
Kheda 1980 1943 -2%
Ahmedabad 1860 1944 5%
Others 1454 1472 1%
Total 1454 1472 1%
* Nielsen estimates
• Yield of castor has increased by 1% in 2015-16 as compared to 2014-15
YIELD OF CASTOR CROP IN GUJARAT:2015-16
Co
pyr
igh
t ©
2014
Th
e N
iels
en C
om
pan
y. C
on
fid
enti
al a
nd
pro
pri
etar
y.
14
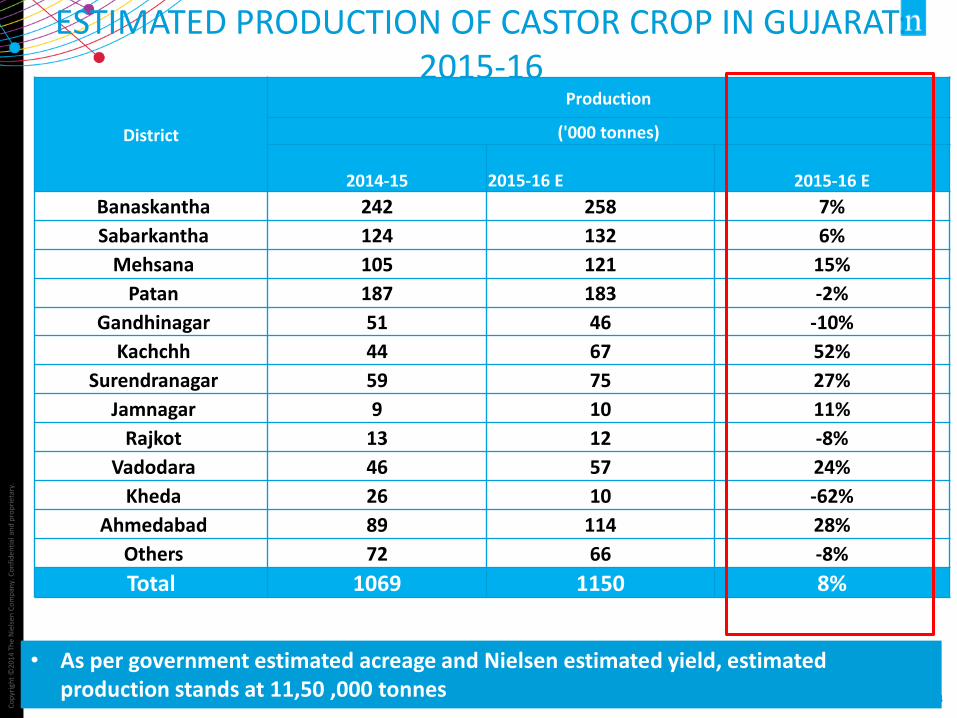
District
Production
('000 tonnes)
2014-15 2015-16 E 2015-16 E
Banaskantha 242 258 7%
Sabarkantha 124 132 6%
Mehsana 105 121 15%
Patan 187 183 -2%
Gandhinagar 51 46 -10%
Kachchh 44 67 52%
Surendranagar 59 75 27%
Jamnagar 9 10 11%
Rajkot 13 12 -8%
Vadodara 46 57 24%
Kheda 26 10 -62%
Ahmedabad 89 114 28%
Others 72 66 -8%
Total 1069 1150 8%
ESTIMATED PRODUCTION OF CASTOR CROP IN GUJARAT: 2015-16
• As per government estimated acreage and Nielsen estimated yield, estimated production stands at 11,50 ,000 tonnes
Co
pyr
igh
t ©
2013
Th
e N
iels
en C
om
pan
y. C
on
fid
enti
al a
nd
pro
pri
etar
y.
15
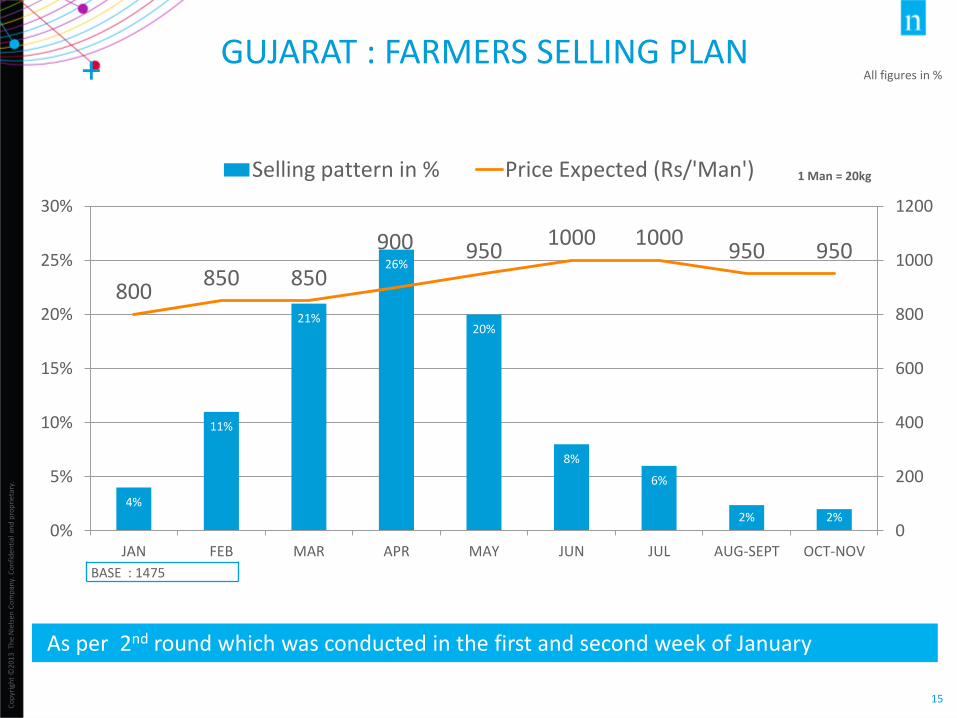
+
4%
11%
21%
26%
20%
8%
6%
2% 2%
800 850 850
900 950 1000 1000
950 950
0
200
400
600
800
1000
1200
0%
5%
10%
15%
20%
25%
30%
JAN FEB MAR APR MAY JUN JUL AUG-SEPT OCT-NOV
Selling pattern in % Price Expected (Rs/'Man')
BASE : 1475
GUJARAT : FARMERS SELLING PLAN All figures in %
1 Man = 20kg
As per 2nd round which was conducted in the first and second week of January

Co
pyr
igh
t ©
2014
Th
e N
iels
en C
om
pan
y. C
on
fid
enti
al a
nd
pro
pri
etar
y.
16
Taluka: Mehsana District – Mehsana Date – 07/01/2016
FIELD PHOTOGRAPHS - GUJARAT
Taluka: Mehsana District – Mehsana Date – 07/01/2016
Co
pyr
igh
t ©
2014
Th
e N
iels
en C
om
pan
y. C
on
fid
enti
al a
nd
pro
pri
etar
y.
17
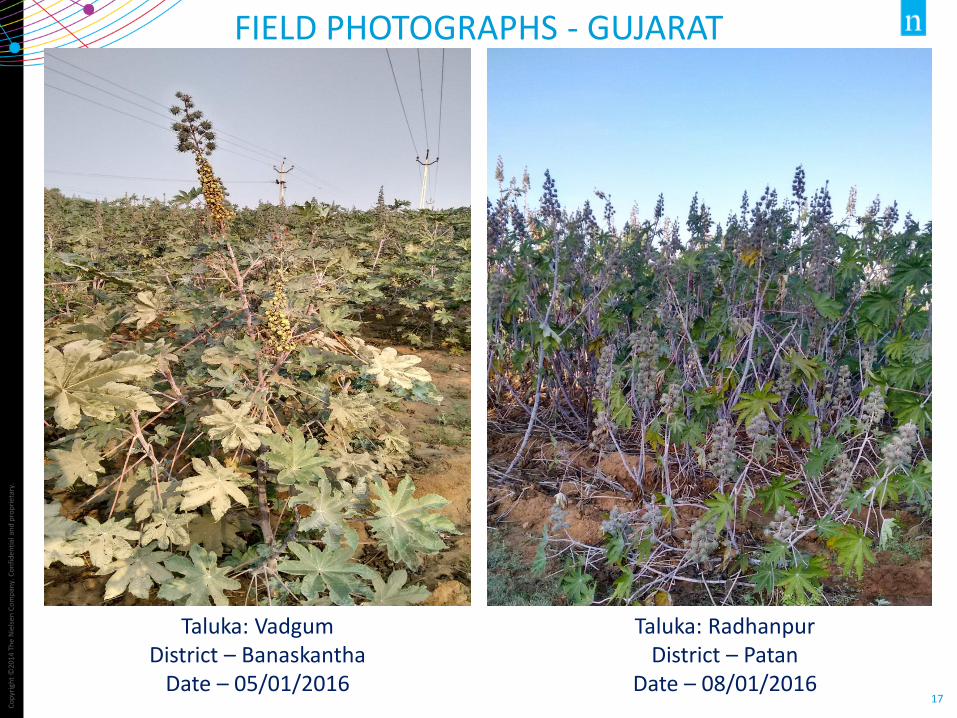
FIELD PHOTOGRAPHS - GUJARAT
Taluka: Vadgum District – Banaskantha
Date – 05/01/2016
Taluka: Radhanpur District – Patan
Date – 08/01/2016
RAJASTHAN

Co
pyr
igh
t ©
2014
Th
e N
iels
en C
om
pan
y. C
on
fid
enti
al a
nd
pro
pri
etar
y.
19
GEOGRAPHICAL COVERAGE
Total 5 districts of Rajasthan were covered
Jalor
Sirohi
Rajasthan Pali
Barmer
Jodhpur
Co
pyr
igh
t ©
2014
Th
e N
iels
en C
om
pan
y. C
on
fid
enti
al a
nd
pro
pri
etar
y.
20
0%
5%
10%
15%
20%
25%
30%
35%
40%
45%
50%
Jun 4thWeek
Jul 1stWeek
Jul 2ndWeek
Jul 3rdWeek
Jul 4thWeek
Aug 1stWeek
Aug 2ndWeek
Aug 3rdWeek
Aug 4thWeek
Sept 1stWeek
Sept 2ndWeek
Sept 3rdWeek
2015-16 2014-15 2013-14 2012-13
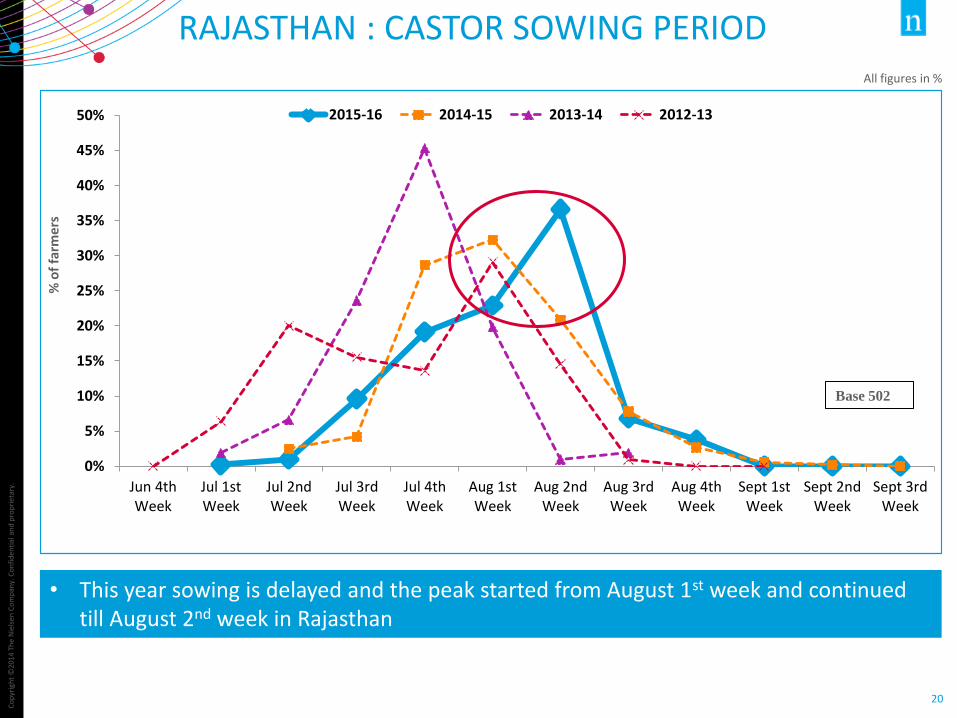
RAJASTHAN : CASTOR SOWING PERIOD
• This year sowing is delayed and the peak started from August 1st week and continued till August 2nd week in Rajasthan
% o
f fa
rme
rs
All figures in %
Base 502
Co
pyr
igh
t ©
2013
Th
e N
iels
en C
om
pan
y. C
on
fid
enti
al a
nd
pro
pri
etar
y.
21
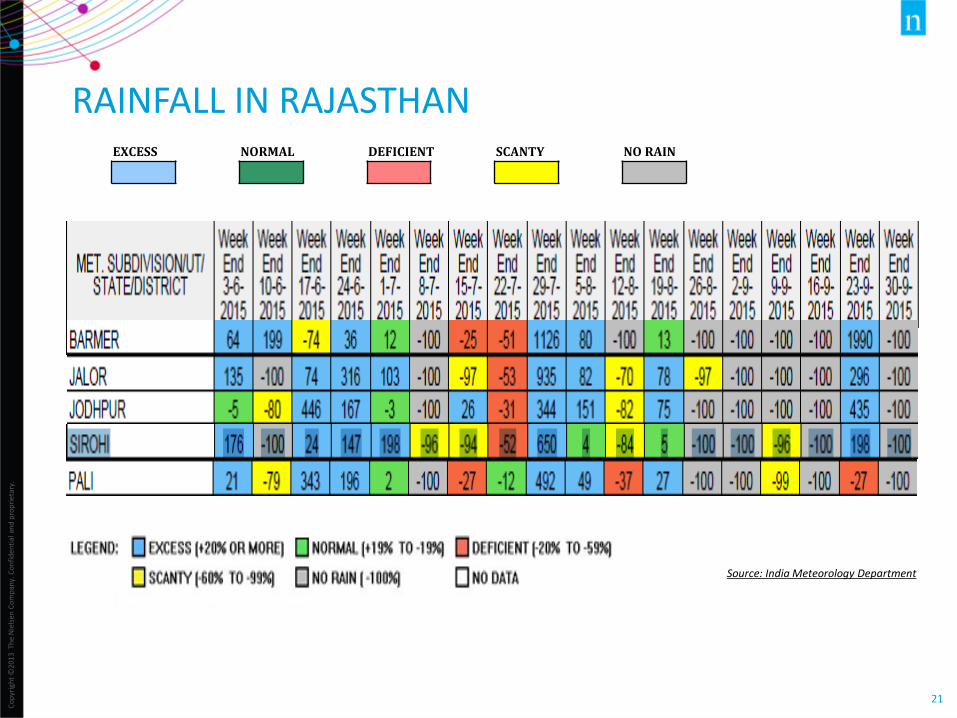
RAINFALL IN RAJASTHAN EXCESS NORMAL DEFICIENT SCANTY NO RAIN
Source: India Meteorology Department
Co
pyr
igh
t ©
2014
Th
e N
iels
en C
om
pan
y. C
on
fid
enti
al a
nd
pro
pri
etar
y.
22
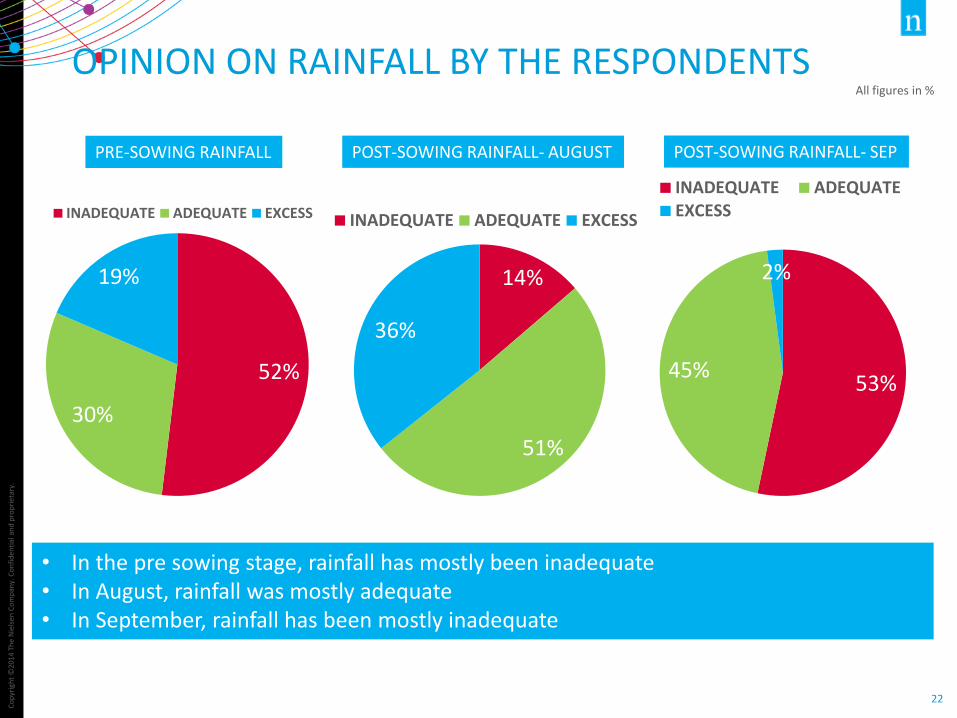
OPINION ON RAINFALL BY THE RESPONDENTS
52%
30%
19%
INADEQUATE ADEQUATE EXCESS
PRE-SOWING RAINFALL POST-SOWING RAINFALL- AUGUST POST-SOWING RAINFALL- SEP
14%
51%
36%
INADEQUATE ADEQUATE EXCESS
53% 45%
2%
INADEQUATE ADEQUATEEXCESS
• In the pre sowing stage, rainfall has mostly been inadequate • In August, rainfall was mostly adequate • In September, rainfall has been mostly inadequate
All figures in %
Co
pyr
igh
t ©
2012
Th
e N
iels
en C
om
pan
y. C
on
fid
enti
al a
nd
pro
pri
etar
y.
23
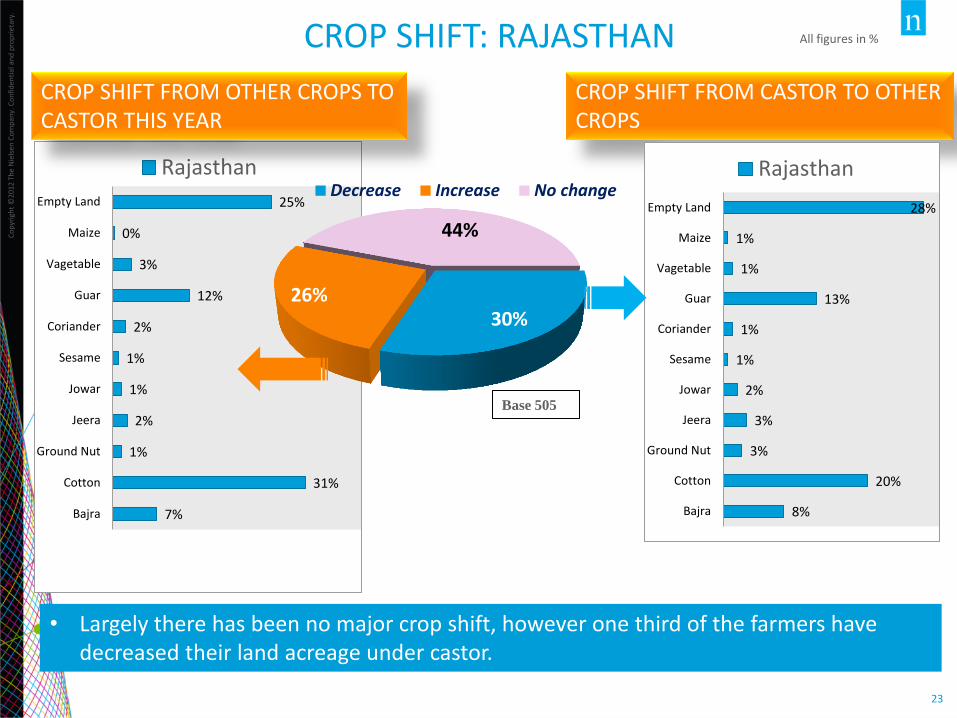
7%
31%
1%
2%
1%
1%
2%
12%
3%
0%
25%
Bajra
Cotton
Ground Nut
Jeera
Jowar
Sesame
Coriander
Guar
Vagetable
Maize
Empty Land
Rajasthan
CROP SHIFT: RAJASTHAN
CROP SHIFT FROM OTHER CROPS TO CASTOR THIS YEAR
CROP SHIFT FROM CASTOR TO OTHER CROPS
8%
20%
3%
3%
2%
1%
1%
13%
1%
1%
28%
Bajra
Cotton
Ground Nut
Jeera
Jowar
Sesame
Coriander
Guar
Vagetable
Maize
Empty Land
Rajasthan
30% 26%
44%
Decrease Increase No change
All figures in %
Base 505
• Largely there has been no major crop shift, however one third of the farmers have decreased their land acreage under castor.
Co
pyr
igh
t ©
2014
Th
e N
iels
en C
om
pan
y. C
on
fid
enti
al a
nd
pro
pri
etar
y.
24
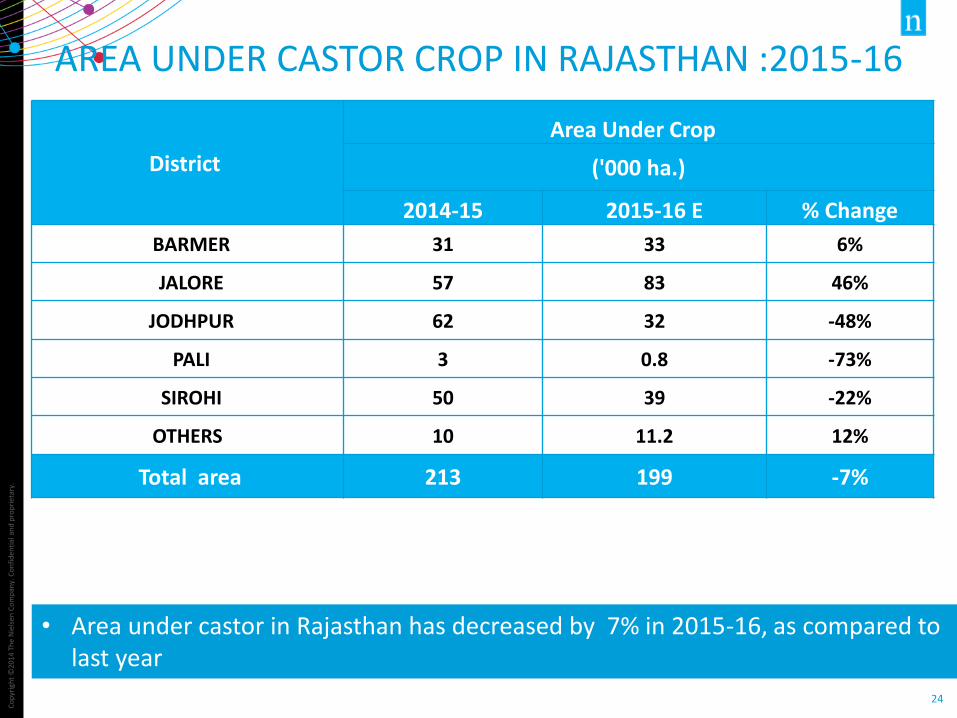
District
Area Under Crop
('000 ha.)
2014-15 2015-16 E % Change
BARMER 31 33 6%
JALORE 57 83 46%
JODHPUR 62 32 -48%
PALI 3 0.8 -73%
SIROHI 50 39 -22%
OTHERS 10 11.2 12%
Total area 213 199 -7%
AREA UNDER CASTOR CROP IN RAJASTHAN :2015-16
• Area under castor in Rajasthan has decreased by 7% in 2015-16, as compared to last year
Co
pyr
igh
t ©
2014
Th
e N
iels
en C
om
pan
y. C
on
fid
enti
al a
nd
pro
pri
etar
y.
25
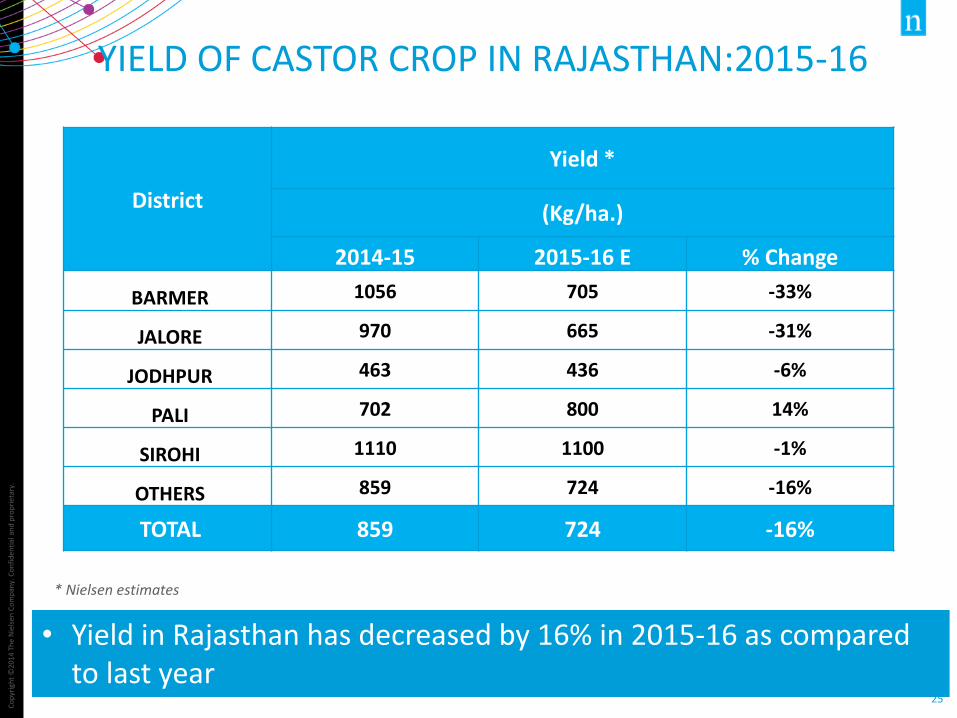
District
Yield *
(Kg/ha.)
2014-15 2015-16 E % Change
BARMER 1056 705 -33%
JALORE 970 665 -31%
JODHPUR 463 436 -6%
PALI 702 800 14%
SIROHI 1110 1100 -1%
OTHERS 859 724 -16%
TOTAL 859 724 -16%
* Nielsen estimates
• Yield in Rajasthan has decreased by 16% in 2015-16 as compared to last year
YIELD OF CASTOR CROP IN RAJASTHAN:2015-16
Co
pyr
igh
t ©
2014
Th
e N
iels
en C
om
pan
y. C
on
fid
enti
al a
nd
pro
pri
etar
y.
26
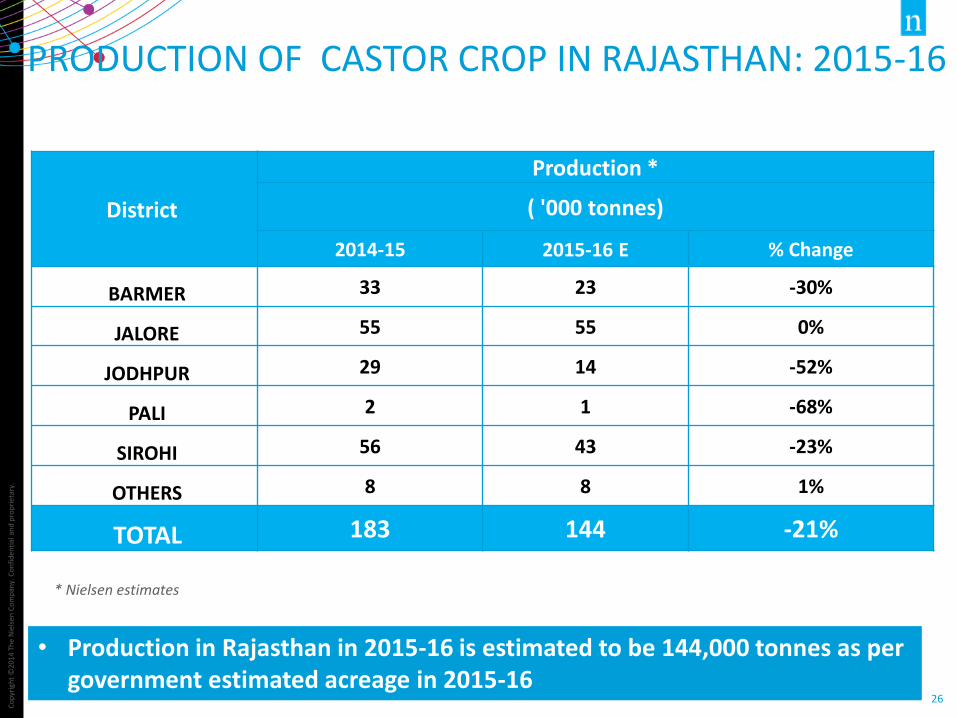
District
Production *
( '000 tonnes)
2014-15 2015-16 E % Change
BARMER 33 23 -30%
JALORE 55 55 0%
JODHPUR 29 14 -52%
PALI 2 1 -68%
SIROHI 56 43 -23%
OTHERS 8 8 1%
TOTAL 183 144 -21%
• Production in Rajasthan in 2015-16 is estimated to be 144,000 tonnes as per government estimated acreage in 2015-16
PRODUCTION OF CASTOR CROP IN RAJASTHAN: 2015-16
* Nielsen estimates

Co
pyr
igh
t ©
2013
Th
e N
iels
en C
om
pan
y. C
on
fid
enti
al a
nd
pro
pri
etar
y.
27
+
11%
18%
26%
17%
13%
7%
5%
2% 1%
750 800 850
900 900 950
900 900 900
0
100
200
300
400
500
600
700
800
900
1000
0%
5%
10%
15%
20%
25%
30%
JAN FEB MAR APR MAY JUN JUL AUG-SEPT OCT-NOV
Plan To Sell Price Expected (Rs/'Man')
BASE : 505
RAJASTHAN : FARMERS SELLING PLAN All figures in %
1 Man = 20kg
This data is collected as per the 2nd round conducted in January 1st and 2nd week
Co
pyr
igh
t ©
2014
Th
e N
iels
en C
om
pan
y. C
on
fid
enti
al a
nd
pro
pri
etar
y.
28
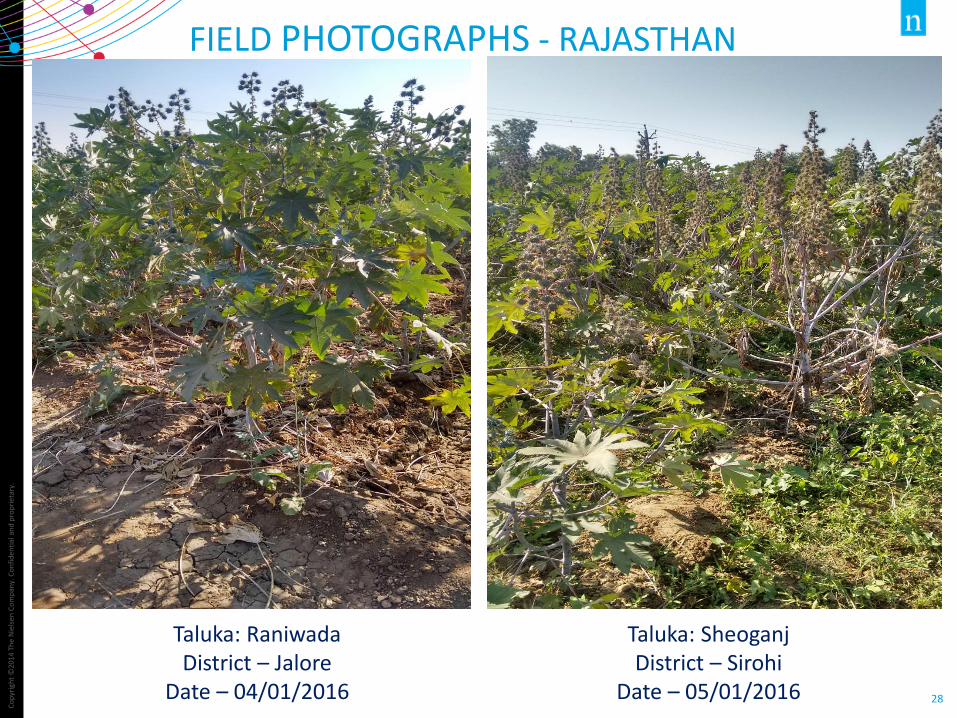
FIELD PHOTOGRAPHS - RAJASTHAN
Taluka: Raniwada District – Jalore
Date – 04/01/2016
Taluka: Sheoganj District – Sirohi
Date – 05/01/2016
Co
pyr
igh
t ©
2014
Th
e N
iels
en C
om
pan
y. C
on
fid
enti
al a
nd
pro
pri
etar
y.
29
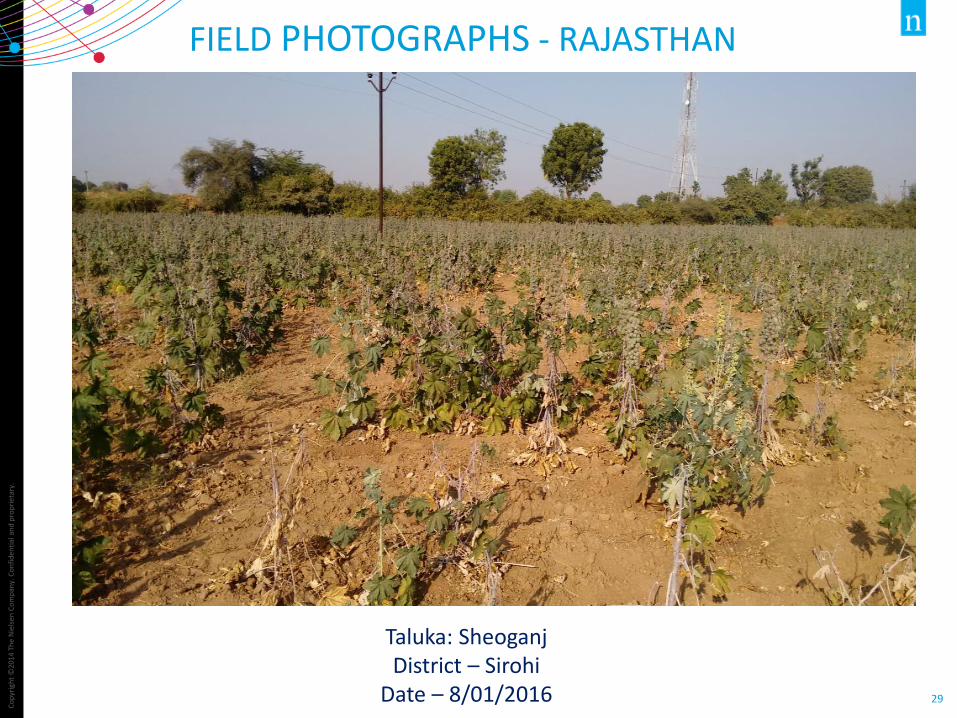
FIELD PHOTOGRAPHS - RAJASTHAN
Taluka: Sheoganj District – Sirohi
Date – 8/01/2016
Co
pyr
igh
t ©
2014
Th
e N
iels
en C
om
pan
y. C
on
fid
enti
al a
nd
pro
pri
etar
y.
30
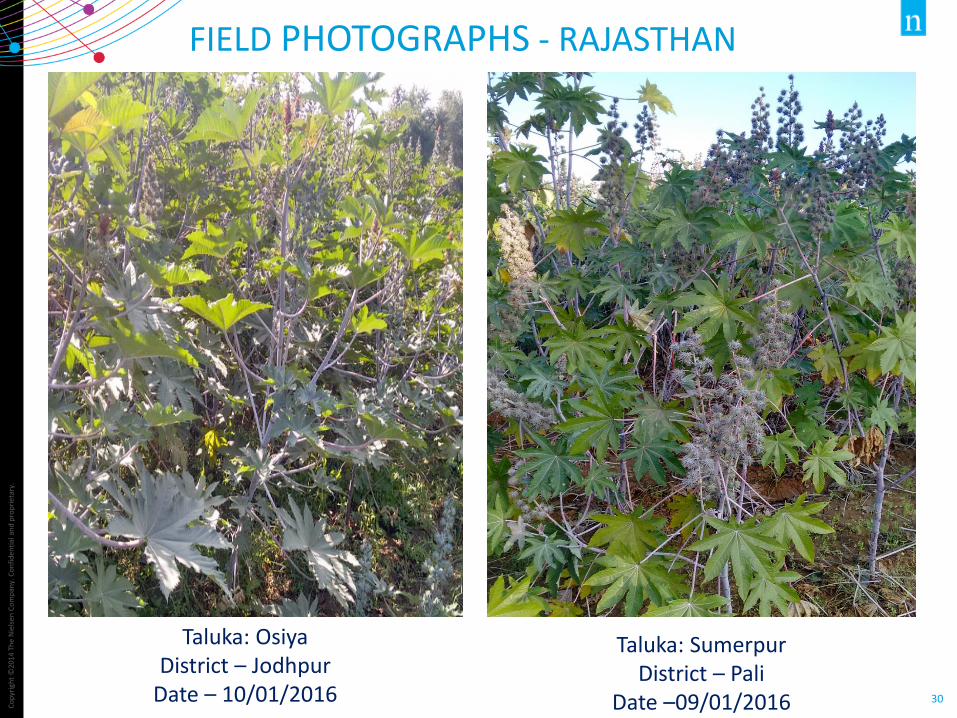
FIELD PHOTOGRAPHS - RAJASTHAN
Taluka: Osiya District – Jodhpur
Date – 10/01/2016
Taluka: Sumerpur District – Pali
Date –09/01/2016
ANDHRA PRADESH

Co
pyr
igh
t ©
2012
Th
e N
iels
en C
om
pan
y. C
on
fid
enti
al a
nd
pro
pri
etar
y.
32
Mahbubnagar
Kurnool
Covered 5 districts of Telangana and Andhra Pradesh
COVERAGE
Nalgonda
All figures in %
Rangareddy
Ananthpur
Co
pyr
igh
t ©
2012
Th
e N
iels
en C
om
pan
y. C
on
fid
enti
al a
nd
pro
pri
etar
y.
33
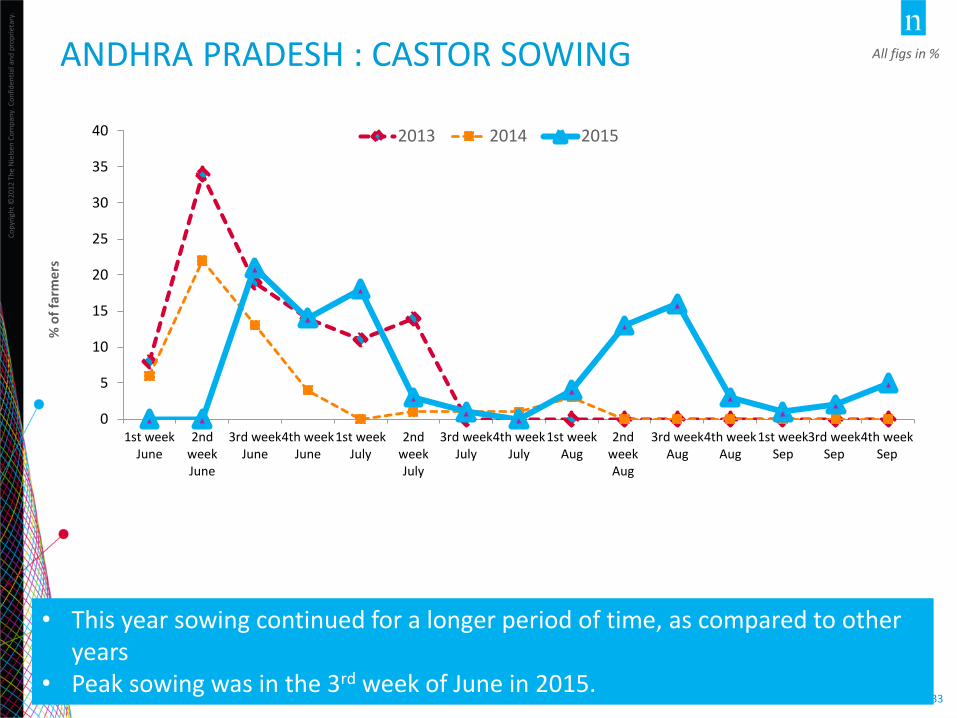
ANDHRA PRADESH : CASTOR SOWING All figs in %
• This year sowing continued for a longer period of time, as compared to other years
• Peak sowing was in the 3rd week of June in 2015.
1st weekJune
2ndweekJune
3rd weekJune
4th weekJune
1st weekJuly
2ndweekJuly
3rd weekJuly
4th weekJuly
1st weekAug
2ndweekAug
3rd weekAug
4th weekAug
1st weekSep
3rd weekSep
4th weekSep
0
5
10
15
20
25
30
35
40 2013 2014 2015
% o
f fa
rme
rs
Co
pyr
igh
t ©
2012
Th
e N
iels
en C
om
pan
y. C
on
fid
enti
al a
nd
pro
pri
etar
y.
34
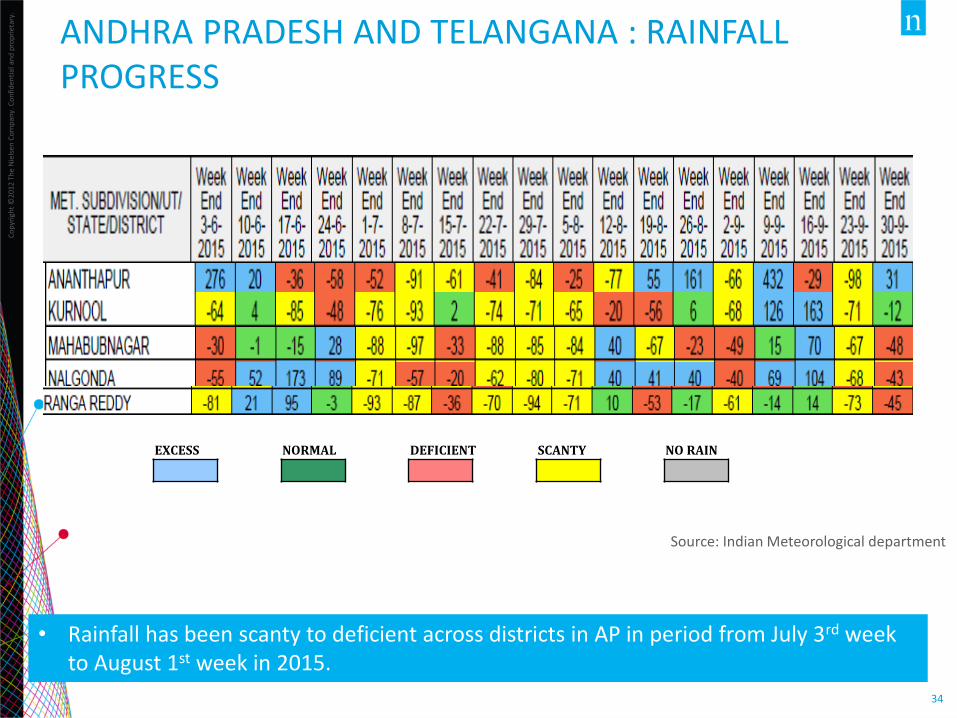
ANDHRA PRADESH AND TELANGANA : RAINFALL PROGRESS
Source: Indian Meteorological department
EXCESS NORMAL DEFICIENT SCANTY NO RAIN
• Rainfall has been scanty to deficient across districts in AP in period from July 3rd week to August 1st week in 2015.
Co
pyr
igh
t ©
2012
Th
e N
iels
en C
om
pan
y. C
on
fid
enti
al a
nd
pro
pri
etar
y.
35
70%
22%
4%
4%
1%
Cotton
Rice
Groundnut
Red gram
Bajra
Andhra Pradesh
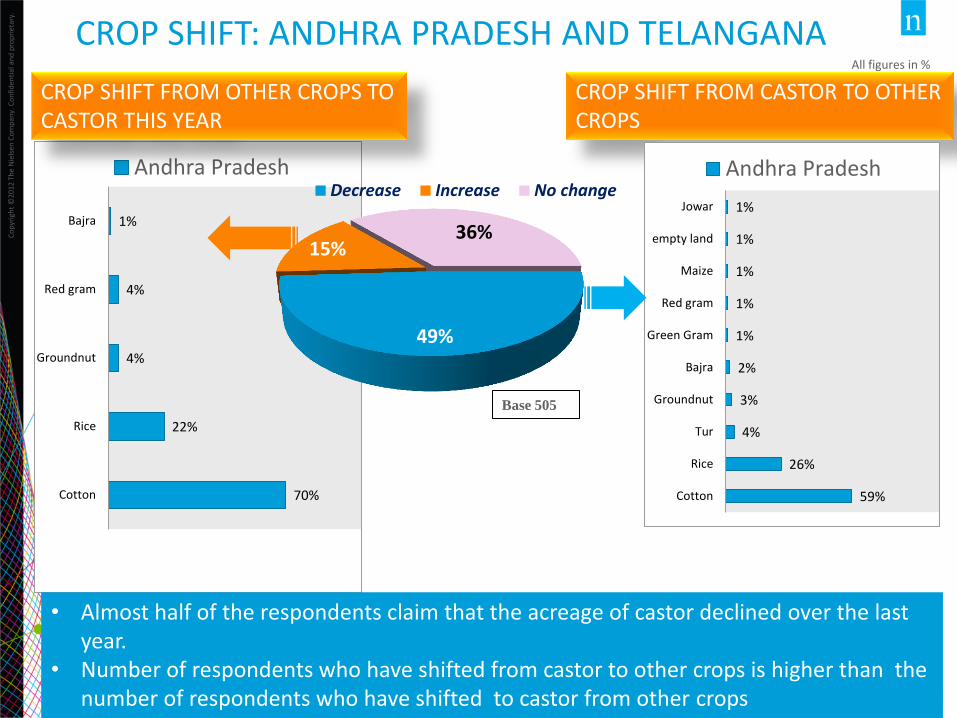
CROP SHIFT: ANDHRA PRADESH AND TELANGANA
CROP SHIFT FROM OTHER CROPS TO CASTOR THIS YEAR
CROP SHIFT FROM CASTOR TO OTHER CROPS
59%
26%
4%
3%
2%
1%
1%
1%
1%
1%
Cotton
Rice
Tur
Groundnut
Bajra
Green Gram
Red gram
Maize
empty land
Jowar
Andhra Pradesh
49%
15% 36%
Decrease Increase No change
All figures in %
Base 505
• Almost half of the respondents claim that the acreage of castor declined over the last year.
• Number of respondents who have shifted from castor to other crops is higher than the number of respondents who have shifted to castor from other crops
Co
pyr
igh
t ©
2014
Th
e N
iels
en C
om
pan
y. C
on
fid
enti
al a
nd
pro
pri
etar
y.
36
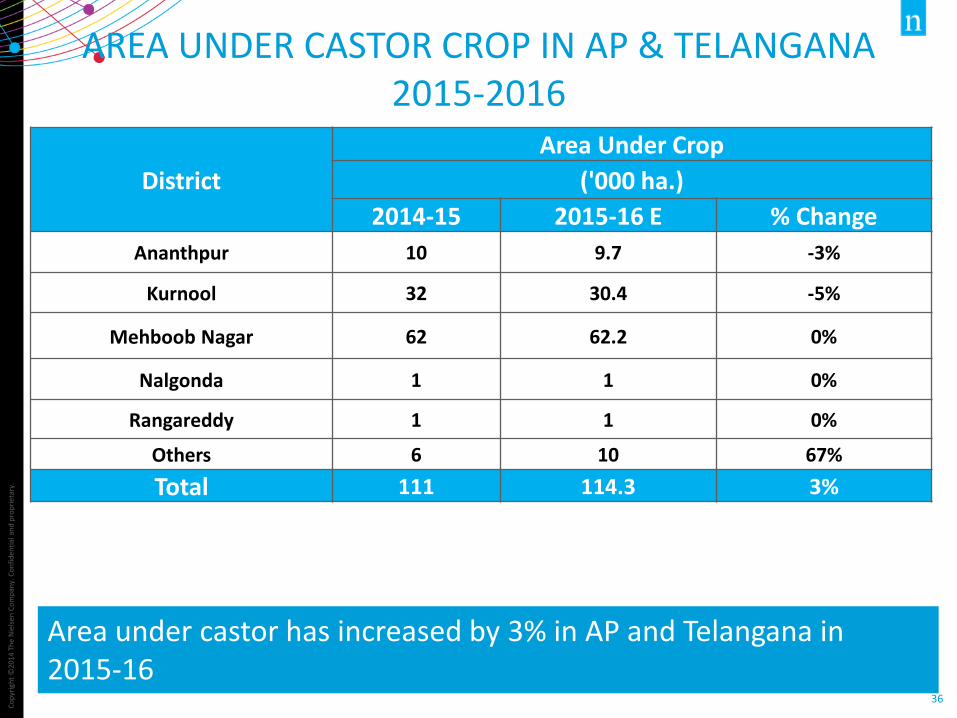
District
Area Under Crop
('000 ha.)
2014-15 2015-16 E % Change
Ananthpur 10 9.7 -3%
Kurnool 32 30.4 -5%
Mehboob Nagar 62 62.2 0%
Nalgonda 1 1 0%
Rangareddy 1 1 0%
Others 6 10 67%
Total 111 114.3 3%
Area under castor has increased by 3% in AP and Telangana in 2015-16
AREA UNDER CASTOR CROP IN AP & TELANGANA 2015-2016
Co
pyr
igh
t ©
2014
Th
e N
iels
en C
om
pan
y. C
on
fid
enti
al a
nd
pro
pri
etar
y.
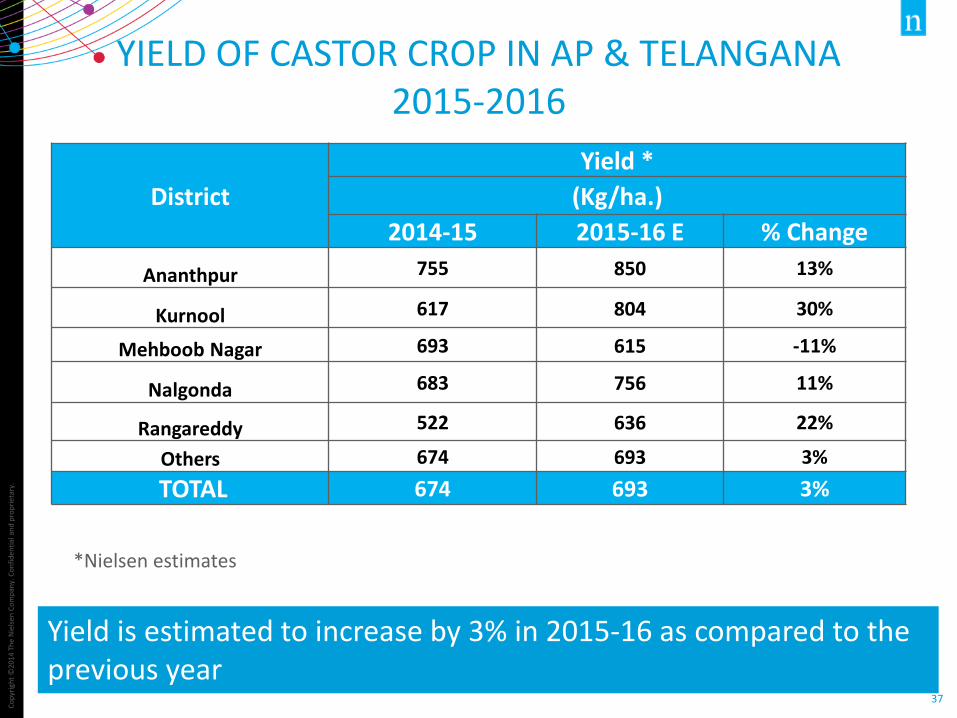
37
District
Yield *
(Kg/ha.)
2014-15 2015-16 E % Change
Ananthpur 755 850 13%
Kurnool 617 804 30%
Mehboob Nagar 693 615 -11%
Nalgonda 683 756 11%
Rangareddy 522 636 22%
Others 674 693 3%
TOTAL 674 693 3%
Yield is estimated to increase by 3% in 2015-16 as compared to the previous year
YIELD OF CASTOR CROP IN AP & TELANGANA 2015-2016
*Nielsen estimates
Co
pyr
igh
t ©
2014
Th
e N
iels
en C
om
pan
y. C
on
fid
enti
al a
nd
pro
pri
etar
y.
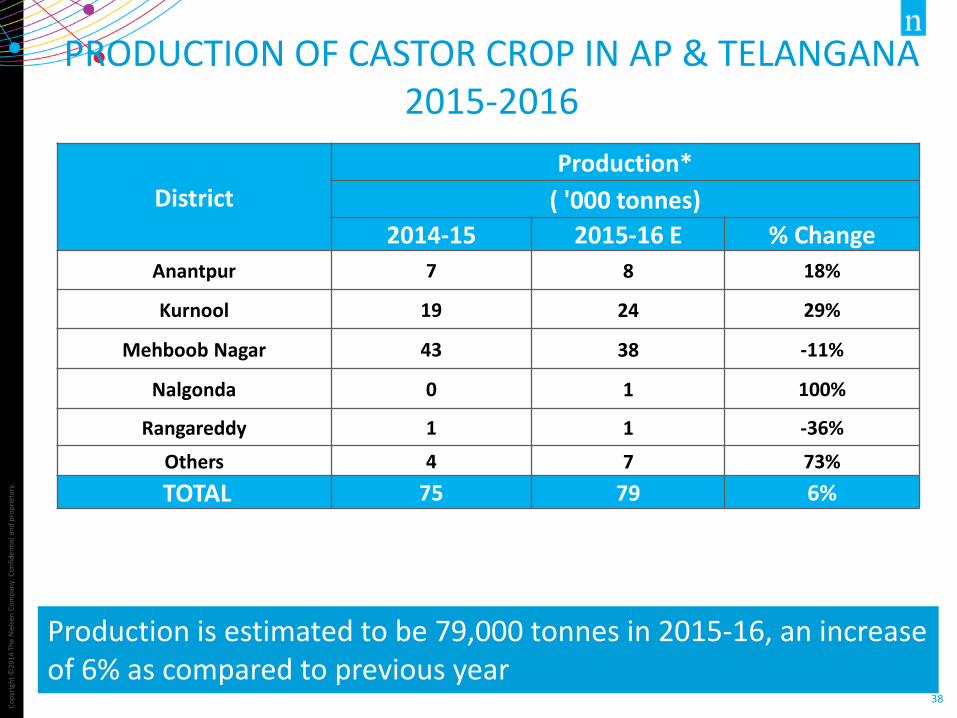
38
District
Production*
( '000 tonnes)
2014-15 2015-16 E % Change
Anantpur 7 8 18%
Kurnool 19 24 29%
Mehboob Nagar 43 38 -11%
Nalgonda 0 1 100%
Rangareddy 1 1 -36%
Others 4 7 73%
TOTAL 75 79 6%
Production is estimated to be 79,000 tonnes in 2015-16, an increase of 6% as compared to previous year
PRODUCTION OF CASTOR CROP IN AP & TELANGANA 2015-2016

Co
pyr
igh
t ©
2014
Th
e N
iels
en C
om
pan
y. C
on
fid
enti
al a
nd
pro
pri
etar
y.
39
FIELD PHOTOGRAPHS – AP / TELANGANA
Taluka - Adakal District – Mahboobnagar
Date – Oct 2015
District – Kurnool Date – Oct 2015

Co
pyr
igh
t ©
2014
Th
e N
iels
en C
om
pan
y. C
on
fid
enti
al a
nd
pro
pri
etar
y.
40
OVERALL AREA, YIELD AND PRODUCTION OF CASTOR
The all India Production of castor stands at 13,97,000 tonnes, which is a 3% increase as compared to last year
State
Area('000 hec) Govt Area
Yield (Kg/Hect) Nielsen Yield
Production ('000 MT) As per Govt Area
Production ('000 MT)
2014-15 2015-16 E % Change 2014-15 2015-16 E % Change 2014-15 2015-16 E % Change 2014-15 As per Nielsen
Area
2015-16 As per Govt
Area % Change
Gujarat 734 781 6% 1454 1472 1% 1069 1150 8% 1007 1150 14%
Rajasthan 213 199 -7% 859 724 -16% 183 144 -21% 165 144 -13%
AP / Telangana
111 114 3% 674 693 3% 75 79 5% 75 79 5%
Others 42 42 0% 560 569 2% 24 24 0% 24 24 0%
Total 1100 1136 3% 1226 1229 0.24% 1351 1397 3% 1271 1397 10%
Co
pyr
igh
t ©
2012
Th
e N
iels
en C
om
pan
y. C
on
fid
enti
al a
nd
pro
pri
etar
y.
41
NOTE
• This report is on the basis of 3 rounds undertaken so far .
• Nielsen is yet to undertake the 4th and 5th Round to be conducted in March and
May respectively. The final numbers of estimates would be basis the 4th and 5th
Round.