Embed Size (px)
Citation preview

7/21/2019 Castillo Etal 2014 Wrr
http://slidepdf.com/reader/full/castillo-etal-2014-wrr 1/13
RESEARCH ARTICLE10.1002/2013WR013900
The role of the ENSO cycle in the modulation of moisture
transport from major oceanic moisture sources
Rodrigo Castillo1, Raquel Nieto1, Anita Drumond1, and Luis Gimeno1
1EPhysLab (Environmental Physics Laboratory), Facultade de Ciencias, Universidade de Vigo, Ourense, Spain
Abstract The influence that the evolution of the ENSO cycle has on the moisture transport from the
major oceanic moisture sources is investigated using a sophisticated Lagrangian approach informed by
ERA-interim data, together with composites of ENSO phases. When maintaining the sources of moisture
defined for the climatological period 1980–2012, the variations in the moisture sinks associated with each
of these evaporative sources throughout the ENSO cycle reproduce the known patterns of variations of the
large-scale atmospheric and precipitation systems over this cycle. Such variations include those observed in
rainfall over the equatorial Pacific, in the major Summer monsoon systems, and in subtropical rainfall. When
the areas of the sources were redefined according to the phase of ENSO, most of them remained stationary
over the period of interest, nevertheless four of them showed notable differences in terms of their extents,namely the South Pacific and the Coral Sea (Pacific Ocean); the Mexican Caribbean (Atlantic), and the
Arabian Sea (Indian).
1. Introduction
The atmospheric branch of the hydrological cycle plays a fundamental role in the climate system.
Evaporation from the oceanic moisture sources to the continents and subsequent precipitation over
terrestrial regions has for some years been of key interest at both local [e.g., Nieto et al ., 2006;
Drumond et al ., 2008; Ord o~nez et al ., 2012] and global scales [e.g., Gimeno et al . 2010a; Dirmeyer and
Brubaker , 2007; Knippertz et al ., 2013]. In recent studies, sophisticated and robust Lagrangian
approaches were used to link oceanic evaporation with continental precipitation in an attempt at least
to detect the major oceanic moisture sources areas [Gimeno et al ., 2010a]. The resulting 12 evaporative
sources obtained by analyzing a 5 year period of data (2000–2004) showed the supply of moisture to
the continents to be highly asymmetrical with a strong seasonal variability. A subsequent study for a
21 year period (1980–2000) using a higher precision mode of calculation of E-P [ Gimeno et al ., 2013]
found similar patterns. The North and South Atlantic source regions are generally thought to be the
most significant sources of moisture for precipitation over the continents, and it would appear that
they also contribute to the seasonal structure of the Intertropical Convergence Zone (ITCZ). The
subtropical Atlantic Ocean in the North Hemisphere has a larger impact over the continents than the
Indian (Southern Hemisphere) and Pacific (Northern Hemisphere) sources of moisture. In terms of the
influence on precipitation over continental regions, the subtropical Atlantic provides moisture for vast
areas, particularly during DJF when its influence extends toward Mexico, Eurasia, and the Amazon;
however, its influence on Europe diminishes greatly during JJA. The smaller moisture sources of the
Mediterranean and Red Seas are important for relatively large continental areas such as Europe or
Africa, and the Arabian Peninsula, respectively. The Indian subcontinent receives moisture from six
different oceanic sources, while there are sizeable areas, such as Europe, South America, or Australia
that receive moisture mainly from a single source. The American, African, and Asian-Australian
monsoonal systems are fed by moisture provided from a larger number of source regions.
Previous studies have characterized the general pattern of moisture transport from a climatological
perspective; however, no analysis of the variability of these major oceanic moisture sources due the main
global teleconnection modes such as El Ni~no-Southern Oscillation (ENSO) has yet been undertaken. The
ENSO has an effect on regional climate impacts throughout the world, including important aspects of
interannual variability in patterns of global weather and precipitation. There is a vast literature on the
influence of ENSO on the changes in precipitation patterns and the interested reader can approach the
topic via the summaries of the IPCC [IPCC , 2013]. In this paper, we aim to evaluate the evolution of the
Special Section:Oceanic Sources of Continental Precipitation
Key Points:
ENSO modulates the transport of
moisture from the major oceanic
sources
Coherence with variations of the
large-scale atmospheric and
precipitation systems
Most of moisture sources keep
position and extension stationary
along the ENSO cycle
Supporting Information:
info_auxiliary_material
Figures S1 and S2
Correspondence to:
L. Gimeno,
Citation:
Castillo, R., R. Nieto, A. Drumond, and
L. Gimeno (2014), The role of the ENSO
cycle in the modulation of moisture
transport from major oceanic moisture
sources, Water Resour. Res., 50,
doi:10.1002/2013WR013900.
Received 2 APR 2013
Accepted 19 JAN 2014
Accepted article online 24 JAN 2014
CASTILLO ET AL. VC 2014. American Geophysical Union. All Rights Reserved. 1
Water Resources Research
PUBLICATIONS

7/21/2019 Castillo Etal 2014 Wrr
http://slidepdf.com/reader/full/castillo-etal-2014-wrr 2/13
ENSO cycle with regard to the transport of moisture from the major oceanic moisture sources using the
Lagrangian methodology of Gimeno et al . [2013].
2. Methods
The main moisture source regions were identified as the annual maxima of vertically integrated moisture
flux divergence (threshold of 750 mm/yr). The vertically integrated moisture transport H is defined as:
51g
Ð ps
0 qVdp, where g is the acceleration due to gravity, q is the specific humidity, p
s is the surface pressure,
and V is the horizontal wind vector. The divergence of this flux is equivalent to the net evaporation (E)
minus precipitation (P) [Trenberth and Guillemot , 1998]; here we consider a 33 year period, making use of
ECMWF reanalysis (ERA-interim) data on a 13 1 grid and 60 vertical levels (from the surface to 0.1 hPa)
from January 1980 to December 2012 (Figure 1) following the criteria of Gimeno et al . [2010a]. The method
identified 10 oceanic moisture source regions, namely NPAC, North Pacific; SPAC, South Pacific; NATL, North
Atlantic; SATL, South Atlantic; MEXCAR, Mexico Caribbean; ARAB, Arabian Sea; ZAN, Zanzibar Current; AGU,
Agulhas Current; IND, Indian Ocean; and CORALS, Coral Sea. Two additional sources were included, defined
using the physical boundaries of oceanic basins, namely MED, Mediterranean Sea and REDS, Red Sea. A
schematic representation of the oceanic sources of moisture considered is included in the figures shown in
this paper.
In order to identify the sinks for the moisture evaporated from the 12 oceanic sources, we based our
analysis on the method developed by Stohl and James [2004], which uses the latest version of the freely
available Lagrangian particle dispersion model FLEXPART v9.0 [Stohl et al ., 2005]. Lagrangian techniques are
one of two types of method that make use of numerical water vapor tracers (WVT); the other type is
Eulerian tagging. There are two other methods used to establish source-sink relationships for atmospheric
water vapor, namely ‘‘analytical and box models’’ and ‘‘physical water vapor tracers’’ (isotopes); however,
nowadays most workers agree that the most recently developed Lagrangian techniques are the most
suitable for evaluating the origin of the water that precipitates over a continental area [Gimeno et al ., 2012].
The Lagrangian approach uniquely provides realistic traces of air parcels, enabling the trajectories to be
followed and source-receptor relationships to be established. Using these models alone, it is possible to
Figure 1. Major oceanic moisture sources: Climatological annual vertically integrated moisture flux divergence (mm/yr) for the period
1980–2012 using data from ERA-Interim. Values greater than 250 mm/yr are shown in gray scale, with intervals between isolines of 250
mm/yr. Areas inside the red contour lines indicate the regions considered as moisture sources in the forward integrations following the
criteria of Gimeno et al . [2010]. Ten of these source regions were defined using the threshold of 750 mm/yr of the annual vertically
integrated moisture flux calculated for the oceanic sources: NPAC, North Pacific; SPAC, South Pacific; NATL, North Atlantic; SATL, South
Atlantic; MEXCAR, Mexico Caribbean; MED, Mediterranean Sea; REDS, Red Sea; ARAB, Arabian Sea; ZAN, Zanzibar Current; AGU, Agulhas
Current; IND, Indian Ocean and CORALS, Coral Sea. The Mediterranean Sea (MED) and the Red Sea (REDS) were defined using their
physical boundaries.
Water Resources Research 10.1002/2013WR013900
CASTILLO ET AL. VC 2014. American Geophysical Union. All Rights Reserved. 2

7/21/2019 Castillo Etal 2014 Wrr
http://slidepdf.com/reader/full/castillo-etal-2014-wrr 3/13
identify the geographical origin of moisture that reaches a continental area. Of course, the other
methodologies provide other types of useful and interesting information that also aids the analysis. The
Eulerian methodology, for example, is widely used due its simplicity but it is far from easy to extract the link
between the precipitation over a region and the moisture source using this method. While the ‘‘box
models’’ allow the identification of the moisture inflow and outflow given defined lateral boundaries, they
give no information about the physical processes that occur within the box itself. The use of isotopes
depends on the sensitivity of the isotopic signal. An intercomparison of the source-receptor methods,
including the advantages and disadvantages of each, is given in the recent comprehensive review of this
topic by Gimeno et al . [2012]. Despite the range of methods available, the robustness of the Lagrangian
trajectory method was demonstrated in a number of previous studies assessing global sources of moisture
[e.g., Stohl and James, 2005; Dirmeyer and Brubaker , 2007; Gimeno et al ., 2010a; Knippertz et al ., 2013], and in
regional analyses using FLEXPART, including for the great Mississippi River [ Stohl and James, 2005], the
Sahel [Nieto et al ., 2006], the Norwegian west coast [Stohl et al ., 2008], the South American Monsoon System
[Drumond et al ., 2008], the areas over ice-cores in the Antarctic [Nieto et al ., 2010], Central America
[Dur an-Quesada et al ., 2010], the Iberian Peninsula [Gimeno et al ., 2010b], the Ethiopian highlands [Viste and
Sorteberg, 2011], and the Indian Peninsula [Ord o~nez et al ., 2012].
In the context of the studies described above, the ERA-interim reanalysis from January 1980 to December
2012 of the European Centre for Medium-Range Weather Forecasts [Dee et al ., 2011] was used to run theLagrangian FLEXPART model. The ERA-interim data set represents the latest and best reanalysis for
reproducing and interpreting the atmospheric branch of the hydrological cycle [Trenberth et al ., 2011;
Lorenz and Kunstmann, 2012]. The usefulness of the data from before 1980 is somewhat limited for two
reasons: (i) the FLEXPART model uses derived variables as input data such as U-wind, V-wind, and q (specific
humidity), which were not reliable before 1980, and these are highly sensitive to errors, so the model
outputs might be erroneous [Stohl et al ., 2005] and (ii) it is impossible to work with data obtained before the
incorporation of satellite imagery in the reanalysis from 1979 onward. Prior to this date, there were
insufficient observations over large oceanic areas and the data sets are considerably less reliable [ Bengtsson
et al ., 2004; Uppala et al ., 2005].
Based on the Lagrangian approach proposed by Stohl and James, we computed the increases (e) and
decreases (p) in moisture by analyzing changes in specific humidity (q) along trajectories, i.e.,
e2p5m(dq/dt), where m is the mass of each particle. We computed these changes for all the particles
selected previously and the results were integrated in the atmospheric column over a given area, therebyobtaining E2P, the surface freshwater flux, where E and P are the rates of evaporation and precipitation
per unit area, respectively. FLEXPART can calculate and track the trajectories of atmospheric moisture
backward and forward in time to produce information on the spatial distribution of moisture sources. From
a Lagrangian perspective, this estimation, made for a large number of trajectories, links the source regions
to their respective sinks.
We initialized the model in forward mode to track around approximately 2.0 million ‘‘particles’’ (the highest
limit allowed by the model) of equal mass distributed in the global atmosphere along 3-D trajectories. Each
particle represents a fraction of the total atmospheric mass. The particles moved by the wind are
considered as air parcels with internal negligible motion and unique thermodynamic properties. It is
assumed that they do not interact or mix with neighboring particles and that they remain whole over time.
Data were retrieved every 6 h (00, 06, 12, and 18 UTC). Changes in specific humidity (q), together with the
positions of each particle, were recorded for each particle along its trajectory, limited to 10 days (the
average residence time of water vapor in the atmosphere [Numaguti , 1999]). In order to derive the
Lagrangian estimation of evaporation minus precipitation, the (E-P) values were integrated over each 1 3
1 column over the gridded area. The analysis of (E-P) values can tell us where the air particles from a given
source area either received (E-P>0) or lost moisture (E-P<0). (E-P) values integrated along 10 day forward
trajectories were analyzed in order to investigate the main moisture sinks observed along trajectories
starting in each of the 12 evaporative sources considered.
To analyze the influence of the ENSO cycle on the transport of moisture from the oceanic sources, we
obtained composite differences between the positive and negative phases of ENSO, which were obtained
from the NOAA/CPC Oceanic Ni~no Index (ONI) in the El Ni~no region 3.4 (5N–5S, 120W–170W), Smith
et al . [2008]. ONI is defined by overlapping seasons, so to select a whole year as El Ni~no or La Ni~na we
Water Resources Research 10.1002/2013WR013900
CASTILLO ET AL. VC 2014. American Geophysical Union. All Rights Reserved. 3
7/21/2019 Castillo Etal 2014 Wrr
http://slidepdf.com/reader/full/castillo-etal-2014-wrr 4/13
considered those years when the phase repeated itself a minimum of five times consecutively from June in
year 0 to May in year 1 (for a given ENSO cycle).
The eight highest intensity episodes for El Ni~no (1982–1983, 1986–1987, 1991–1992, 1994–1995, 1997–
1998, 2002–2003, 2004–2005, and 2009–2010) and for La Ni~na (1984–1985, 1988–1989, 1995–1996, 1998–
1999, 1999–2000, 2007–2008, 2010–2011, and 2011–2012) were selected. It must be stressed that we
assumed that the boundaries of each oceanic source remained stationary throughout the years considered
(Figure 1).
A bootstrap method was used to test the statistical significance of the composite differences. The
methodology follows that proposed by Wei et al . [2012]. We tested the significance of the difference
between the El Ni~no and the La Ni~na composites at a 90% confidence level by selecting two 8 year periods
at random (a total of 16 years) from the 33 year climatology and calculating their difference 1000 times. To
be considered significant, the absolute value of the composite of the differences must be larger than 90%
of the 1000 differences.
3. Results
In order to gain a better understanding of the role of ENSO in moisture transport, it is useful to identify the
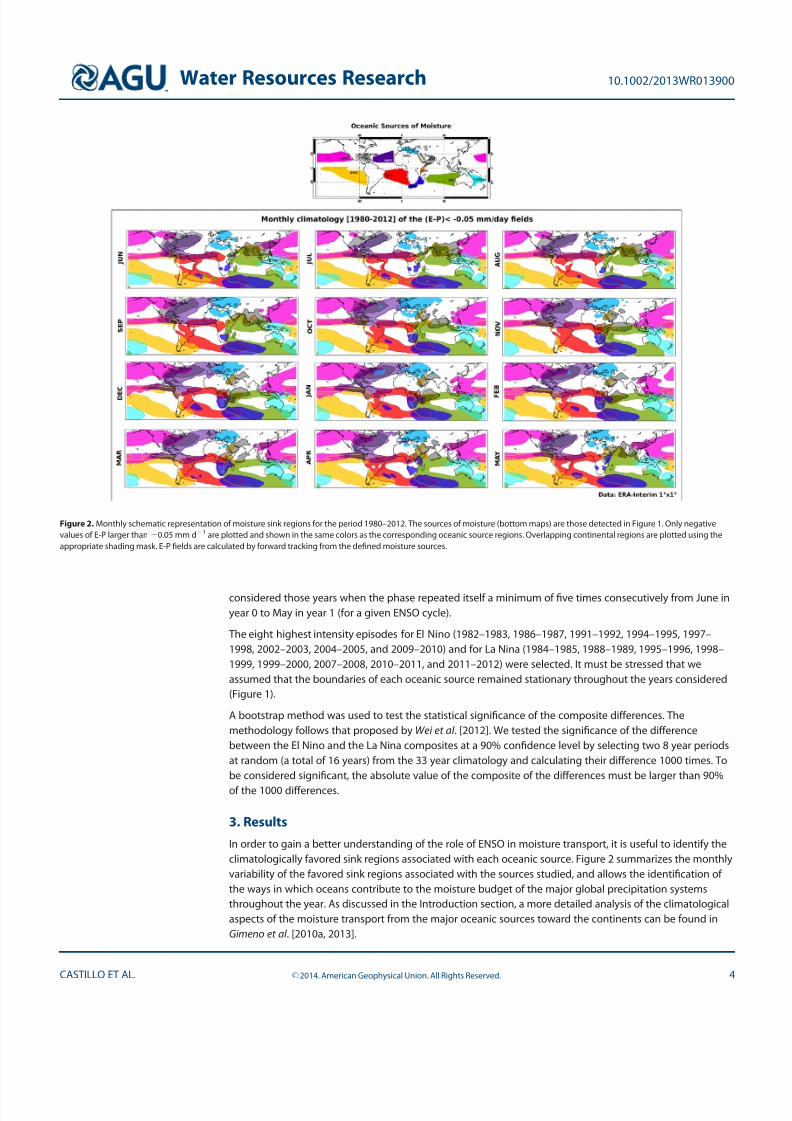
climatologically favored sink regions associated with each oceanic source. Figure 2 summarizes the monthly
variability of the favored sink regions associated with the sources studied, and allows the identification of
the ways in which oceans contribute to the moisture budget of the major global precipitation systems
throughout the year. As discussed in the Introduction section, a more detailed analysis of the climatological
aspects of the moisture transport from the major oceanic sources toward the continents can be found in
Gimeno et al . [2010a, 2013].
Figure 2. Monthly schematic representation of moisture sink regions for the period 1980–2012. The sources of moisture (bottom maps) are those detected in Figure 1. Only negative
values of E-P larger than 20.05 mm d21 are plotted and shown in the same colors as the corresponding oceanic source regions. Overlapping continental regions are plotted using the
appropriate shading mask. E-P fields are calculated by forward tracking from the defined moisture sources.
Water Resources Research 10.1002/2013WR013900
CASTILLO ET AL. VC 2014. American Geophysical Union. All Rights Reserved. 4

7/21/2019 Castillo Etal 2014 Wrr
http://slidepdf.com/reader/full/castillo-etal-2014-wrr 5/13
Concerning the Inter Tropical Convergence Zone (ITCZ), Figure 2 shows the contribution of different
oceanic sources according to the subregion considered. While the Atlantic ITCZ receives moisture from the
North and South Atlantic oceans, the Indian ITCZ may receive contributions from up to four different
sources throughout the year (IND, ZAN, ARAB, and AGU). It must be remembered that the present
discussion is limited only to the sources investigated and contributions from other regions may also be
important. For instance, throughout the year NPAC and SPAC feed moisture to the Pacific ITCZ, which may
also receive some moisture from MEXCAR and CORALS in its eastern and western domains, respectively.
Consideration of Figure 2 shows some aspects of the moisture contribution to the annual cycle of the
continental summer monsoon systems. For example, there are important contributions from the ARAB,
ZAN, REDS, and IND sources during the Indian summer, but there is no moisture transport from these
sources to the region during the winter months. On the other hand, the NATL and SATL are the only of the
investigated oceanic sources that contribute to the moisture observed in the region of the South America
Monsoon System [Drumond et al ., 2008, and references therein]. The sources NATL, NPAC, and MEXCAR are
important oceanic contributors to the region of the North American Monsoon System. As far as the
precipitation in southern Africa is concerned [Cook , 2000; D’Abreton and Tyson, 1995; Todd et al ., 2004],
while the AGU source contributes throughout the year, the additional sources SATL, ARAB, and ZAN are
important during the austral Summer. The Indian-Pacific Warm Pool can receive moisture from different
sources throughout the year, including NPAC, SPAC, IND, CORALS, and ARAB.
The rest of the oceanic areas that were not considered in Figure 2 (in white) also contribute for the
precipitations around the world. Their influence is mainly restricted to a narrow tropical strip and two large
high latitudinal bands (Figure S2).
Among the preferred climatological sink regions shown in Figure 2, it is also possible to identify the main
transport moisture export (TME) paths discussed by Knippertz et al . [2013]. Differently from the approach applied
here, they used another Lagrangian analysis tool (LAGRANTO) [Wernli and Davies, 1997] to construct a
climatology of TMEs on the basis of 7 day forward trajectories, begun daily in the tropical lower troposphere,
and required to reach a certain amount in terms of the water vapor flux somewhere outside the tropical
latitudes. The authors identified four preferential activity centers in the Northern Hemisphere, these are: (i) The
‘‘pineapple express’’ (PE), which connects tropical moisture sources near Hawaii with precipitation near the North
American west coast; (ii) The west Pacific maximum (WP), which contributes significantly to the global annual
TME and is linked to the East Asian monsoon and the Meiyu-Baiu front; (iii) The narrow TME maximum over the
Great Plains (GP) of North America, which originates over the Gulf of Mexico and the Caribbean Sea and has
therefore been referred to as the ‘‘Maya express’’; and (iv) TME over the western North Atlantic (the Gulf Stream
maximum (GS)). These four paths each have a distinct seasonal cycle, ranging from warm-season maxima
related to monsoon-type circulations over East Asia and central North America (WP and GP regions), to oceanic
activity with a small annual cycle (GS), and winter maxima over the eastern North Pacific (PE).
In the Southern Hemisphere, Knippertz et al . [2013] also identified four major paths, these are: (i) the central
and eastern South Pacific Ocean (170W–90W); (ii) eastern South America and the adjacent South Atlantic
Ocean (60W–0W); (iii) the western South Indian Ocean south of Madagascar (30E–80E); and (iv) a rather
weak maximum over western Australia and adjacent waters (110E–140E). The first three are located in the
western parts of austral subtropical oceanic anticyclones. Analysis of Figure 2 reveals that the annual cycle
of expansion of the sink areas over these export paths agrees with the findings of Knippertz et al . [2013],
according to which maximum (minimum) transport moisture exports via these four paths occurs during the
Austral Summer (Winter), when the sink domains expand (shrink).
Following this climatological analysis of the conditions of the moisture transport from the oceanic sources,
we studied the fingerprint of ENSO in this process. To assess the potential influence of ENSO, as discussed
we evaluated the composite of the 8 years characterized by the extreme phases of the mode (representing
the lower and upper quartile of the year set). Supporting information Figure S1 shows the monthly
composite analysis for El Ni~no and La Ni~na years. Simple visual inspection does not easily allow any great
differences between the two ENSO phases patterns to be seen, and it is therefore necessary to study the
differences between the composites of the two phases.
Figures 3–6 show the seasonal variations in the moisture sinks associated with each of the oceanic moisture
sources studied throughout the ENSO cycle. The left-hand columns illustrate the differences in the
Water Resources Research 10.1002/2013WR013900
CASTILLO ET AL. VC 2014. American Geophysical Union. All Rights Reserved. 5

7/21/2019 Castillo Etal 2014 Wrr
http://slidepdf.com/reader/full/castillo-etal-2014-wrr 6/13
precipitation and the second columns show the divergence of the vertically integrated moisture transport,
both between the composites of the two ENSO phases, while the third and right-hand columns show the
favored sink regions observed during El Ni~no and La Ni~na events, respectively. Following a bootstrap test
for the precipitation figures and the favored sink region plots, we show only those areas where the absolute
value of differences greater than 0.05 mm/d are significant at the 90% confidence level.
In general, the changes in the sink regions identified through the Lagrangian analysis agree with the mainvariations in vertically integrated moisture transport H observed with ENSO. During El Ni~no (La Ni~na)
Figure 4. The monthly influence of the evolution of the ENSO cycle during boreal autumn (September, October, and November; SON) over the moisture transport of the main oceanic
sources of precipitation. As Figure 3, for SON.
Figure 3. The monthly influence of the evolution of the ENSO cycle during its early stages (June, July, and August; JJA) over the moisture transport of the main oceanic sources of
precipitation for 1980–2012. (top) Schematic representation of the main oceanic sources of moisture. (bottom, left-hand column) Monthly differences in precipitation (in mm per day)
between the composites for El Ni~no events and those for La Ni~na episodes. Data from GPCP. (bottom, second column) Monthly differences in divergence of the vertically integrated
moisture flux (measured in mm per year) between the composites for El Ni ~no and La Ni~na episodes, shown as cool and warm colors, respectively. Data obtained from ERA-Interim.
(bottom, third and right-hand columns) The composite differences in E-P generated by each moisture source between El Ni~no and La Ni~na events. (third column) Schematic
representation of the favored receptor regions of precipitation during the El Ni~no phase; (right-hand column) during La Ni~na phase. Only areas where the absolute value of differences
greater than 0.05 mm/d are significant at the 90% confidence level are plotted, according to a bootstrap test permuting the original time series 1000 times.
Water Resources Research 10.1002/2013WR013900
CASTILLO ET AL. VC 2014. American Geophysical Union. All Rights Reserved. 6

7/21/2019 Castillo Etal 2014 Wrr
http://slidepdf.com/reader/full/castillo-etal-2014-wrr 7/13
episodes, the blue (red) areas where the convergence of H is higher (Figures 3–6, second columns) coincide
with the favored sink areas indicated in the third columns (right-hand columns). Keeping in mind that
increased convergence of H is associated with enhanced precipitation over a region (left-hand columns
show the monthly differences in the composites of precipitation between the two ENSO phases), the results
suggest that the variations in moisture sinks associated with these evaporative sources reproduce the
major patterns of variation of large-scale atmospheric and precipitation systems under ENSO.
Displacements of the Walker Cell system over the Equatorial Pacific and consequent alterations in the
Hadley cell system during extreme ENSO phases are accompanied by changes in precipitation patterns. In
general terms, such variations observed during El Ni~no episodes may include the displacement of
equatorial Pacific rainfall toward the eastern basin, the weakening of the major Summer monsoon systems
(e.g., Australia/Southeast Asia, South America, Central America, and tropical Africa), and enhanced
Figure 6. The monthly influence of the evolution of the ENSO cycle during boreal spring (March, April, and May; MAM) over the moisture transport of the main oceanic sources of
precipitation. As Figure 3, for MAM.
Figure 5. The monthly influence of the evolution of the ENSO cycle during its mature stage (December, January, and February; DJF) over the moisture transport of the main oceanic
sources of precipitation. As Figure 3, for DJF.
Water Resources Research 10.1002/2013WR013900
CASTILLO ET AL. VC 2014. American Geophysical Union. All Rights Reserved. 7

7/21/2019 Castillo Etal 2014 Wrr
http://slidepdf.com/reader/full/castillo-etal-2014-wrr 8/13
subtropical rainfall. In contrast, during La Ni~na episodes equatorial Pacific rainfall is concentrated over the
western basin, the major summer monsoon systems are enhanced, and precipitation over the subtropics
weakens. In terms of moisture transport from the tropics toward the extratropics, Knippertz et al . [2013]
confirmed that during warm events there is a reduction in activity over the South Pacific and eastern North
Pacific, while activity increases further east over the South and North Atlantic. According to these authors,
these variations are most likely to be connected to more zonally elongated jets over the Pacific during
ENSO warm events, which act as a stronger waveguide and reduce tropical-extratropical and
interhemispheric interactions.
More detailed analysis of Figures 3–6 (third and right-hand columns) may indicate the regions where the
transport of moisture from the sources investigated is enhanced during an ENSO cycle. No increase in
precipitation is implied, however, because this depends on the interaction of the moisture transported from
a source with the other air particles present in the atmospheric column at a given time. Because we are
considering the contribution of moisture from specific sources, precipitation may not occur at the surface if
dry air predominates in the atmospheric column and dynamical conditions do not favor the generation of
rain. In any case, a joint analysis of the preferred sinks (shaded) and the enhanced convergence of H
(contours) may reveal where anomalous moisture transport is associated with enhanced precipitation
(left-hand columns).
During JJA, the early stages of El Ni~no events (Figure 3, second column), enhanced convergence of H (blue
contours) and increased precipitation (blue areas in left-hand columns) were observed over the central part
of the Eastern Equatorial Pacific, the region receiving the enhanced moisture contribution from NPAC,
SPAC, MEXCAR, and NATL. Increased moisture transport from MEXCAR was also verified over the region of
enhanced convergence of H in the eastern USA. Concerning the development of the Indian Summer
monsoon, although the moisture contribution from REDS and ZAN increases to the region, it is interesting
to observe the inhibition of precipitation (left-hand columns) and the displacement of the convergence of
H eastward. This finding suggests that there was no dynamical support for the occurrence of precipitation
over India during the Monsoon Season. Nevertheless, the increased displacement of the convergence of H
over southeastern Asia was associated with the enhanced contribution of moisture from REDS, ARAB, ZAN,
and IND. Over the Southern Pacific and Atlantic Oceans, the results also suggest an increasing moisture
contribution from SPAC and SATL to the enhanced convergence of H and to the regions of increased
precipitation (left-hand columns).
In contrast, during the early stages (JJA) of La Ni~na events (Figure 3, right-hand column), enhanced
convergence of H (red contours in the second columns) and increased precipitation (red areas in left-hand
columns) were observed over India, associated with the enhanced moisture contribution from the REDS,
ZAN, and ARAB sources. Convergence of H and precipitation were also enhanced over the India-Pacific
Warm Pool, a region receiving a higher moisture contribution from the IND and CORALS sources. Other
regions that showed an intensification of the convergence of H are Central America (with higher
contributions from NATL, MEXCAR, NPAC, and SPAC) and the Atlantic ITCZ (with enhanced contributions
from NATL and SATL and increased precipitation).
The development stages of El Ni~no events during SON (Figure 4, center column) may be characterized by a
spatial expansion of the enhanced convergence of H, together with increased precipitation over the central
part of the eastern Equatorial Pacific, a region that receives an enhanced moisture transport from NPAC,
SPAC, and MEXCAR. The Western Indian Ocean was also characterized by an enhanced convergence of H,
as well as an increasing supply of moisture from the ARAB, ZAN, and IND sources. In continental areas, theincreased convergence of H and enhanced precipitation were observed over the subtropics of North and
South America, regions receiving enhanced moisture contribution from MEXCAR and NATL, and SATL,
SPAC, and IND, respectively.
Considering SON during La Ni~na events (Figure 4, right-hand column), the enhanced convergence of H and
increased precipitation were still seen over India during September; these are associated with increased
moisture transport from the IND, ARAB, and ZAN sources. The Indian-Pacific Warm Pool and the Western
Pacific were both characterized by an intensification of the convergence of H and enhanced precipitation,
and by an increased moisture transport from the ARAB, IND, CORALS, NPAC, and SPAC sources. An
enhanced convergence of H occurred over Central America, with the intensification of moisture transport
Water Resources Research 10.1002/2013WR013900
CASTILLO ET AL. VC 2014. American Geophysical Union. All Rights Reserved. 8

7/21/2019 Castillo Etal 2014 Wrr
http://slidepdf.com/reader/full/castillo-etal-2014-wrr 9/13
from NATL and MEXCAR. The Atlantic ITCZ (NATL and SATL were intensified) and Tropical South America
(contribution from SATL intensified) showed enhanced convergence of H and increased precipitation.
During the mature phases (DJF) of El Ni~no episodes (Figure 5, third column), there is an enhanced transport
of moisture toward the central part of the eastern Equatorial Pacific, with increased contributions from the
NPAC, SPAC, NATL, and CORALS sources. In the western Indian Ocean, there is also an intensification of theconvergence of H and increased precipitation (particularly in December), associated with an increased
moisture contribution from the IND, ZAN, and ARAB sources. An enhanced convergence of H and increased
precipitation were seen over subtropical South America, a region that receives intensified moisture
transport from the SATL and SPAC sources. The transport from the NPAC, NATL, and MEXCAR sources was
intensified toward the southeastern part of North America, where enhanced convergence of H and
increased precipitation can be seen. Enhanced exports of moisture to subtropical North and South America
during El Ni~no events were similarly observed by Knippertz et al . [2013]. Their correlation analyses revealed
enhanced TME over the subtropical South Atlantic during El Ni~no years, particularly during the austral
summer. An inhibited convergence of H and precipitation can be seen over Tropical Southern Africa, even
with the intensification of the moisture transport from IND, ZAN, and AGU to the region.
The mature stages (DJF) of La Ni~na events (Figure 5, right-hand column) are characterized by the enhanced
convergence of H and precipitation over the regions of Tropical Summer Monsoon Systems, such as South
America (accompanied by the intensification of moisture transport from NATL, SATL, and SPAC) and
Southern Africa (with enhanced transport from ZAN, AGU, and IND). The Indian-Pacific Warm Pool also
received intensified moisture transport from the NPAC, SPAC, IND, and CORALS sources, associated with
enhanced convergence of H and precipitation.
There was a reduction in the extent of the enhanced convergence of H and precipitation over the central
part of the Eastern Equatorial Pacific and the western Indian Ocean during the dismissal stages of El Ni~no
events (MAM, Figure 6). However, these two regions still received enhanced moisture contribution from
NPAC and SPAC, and ARAB, IND, and ZAN, respectively. Subtropical South America was characterized by the
enhanced convergence of H, higher precipitation, and intensified moisture transport from the SPAC and
SATL sources.
In MAM during La Ni~na episodes (Figure 6, right-hand column), the reduction in the tropical domains of the
enhanced convergence of H and intensified precipitation were probably associated with the dismiss stage
of the tropical Summer precipitation systems. Tropical South America still received enhanced moisturecontributions from the NATL, SATL, and SPAC sources, as did tropical Southern Africa from ZAN, AGU, IND,
and SATL.
To quantify the role of ENSO in the transport of moisture, we assume that the annual climatological oceanic
moisture sources are defined according to Gimeno et al . [2010a] and as shown in Figure 1. It is well known
that the moisture sources are not stationary, and that they follow an annual cycle as well as interannual
variability. Table 1 shows the annual climatology of the vertically integrated moisture divergence for each
oceanic source of moisture with values shown in bold, together with the values obtained from the
composites of El Ni~no (blue) and La Ni~na (red). For example, over the NATL source the maximum is reached
during January (1581 mm/yr) and the minimum during September (730.3 mm/yr). In addition, there exist
sources of moisture that during some months show values of vertically integrated moisture divergence that
are very low or even negative. This is the case for MEXCAR in August (31.7 mm/yr) and September (2236.5
mm/yr), for CORALS in February (253.6 mm/yr), and for ZAN in April and May (2492 and 292.6 mm/yr,
respectively). While not going negative, some other sources show reductions of up to 50%; for example, the
SPAC source reaches a maximum in August (1347 mm/yr) and a minimum in March (618.2 mm/yr, a
reduction of 54%). A brief comparison with the intensity of the sources during extreme ENSO phases (Table
1) highlights some interannual variability, particularly in those with a marked climatological annual cycle as
described previously. While the ZAN and SPAC sources weakened during El Ni~no events (ZAN became
negative during OND, reaching a value of 2311.3 mm/yr in October), CORALS weakened during La Ni~na
episodes (becoming negative during DJF while reaching more than three times its climatological value of
128.4 mm/yr in January of the El Ni~no cycle). It is interesting to note that the anomalies in the intensity of
MEXCAR varied during the La Ni~na cycle: the source weakened with respect to the climatological mean
from June to October and intensified from November to May.
Water Resources Research 10.1002/2013WR013900
CASTILLO ET AL. VC 2014. American Geophysical Union. All Rights Reserved. 9

7/21/2019 Castillo Etal 2014 Wrr
http://slidepdf.com/reader/full/castillo-etal-2014-wrr 10/13
In addition to the interannual variations in intensity [Gimeno et al ., 2013], we must also consider the
variability in their areal extent. This points to another possible influence of ENSO, in that the sources of
moisture change in size and position for the two phases. We therefore redefined the 12 oceanic sources of
moisture using the composite of the highest and lowest years of the ENSO mode. Figure 7 shows the 750
mm/d threshold of the annual vertically integrated moisture flux for El Ni~no (blue contour) and La Ni~na (red
contour) years. Most of the sources maintain their positions, with little change, but there are some that
exhibit a notable modification in
their extents. SPAC reduces in size
toward the coast of South America
during El Ni~no, MEXCAR shows a
northward displacement during La
Ni~na, ARAB expands toward theeast coast of Africa during La Ni~na,
and CORALS extends it influence
eastward during El Ni~no. We do not
consider MED and REDS because
these sources are defined following
their coastlines.
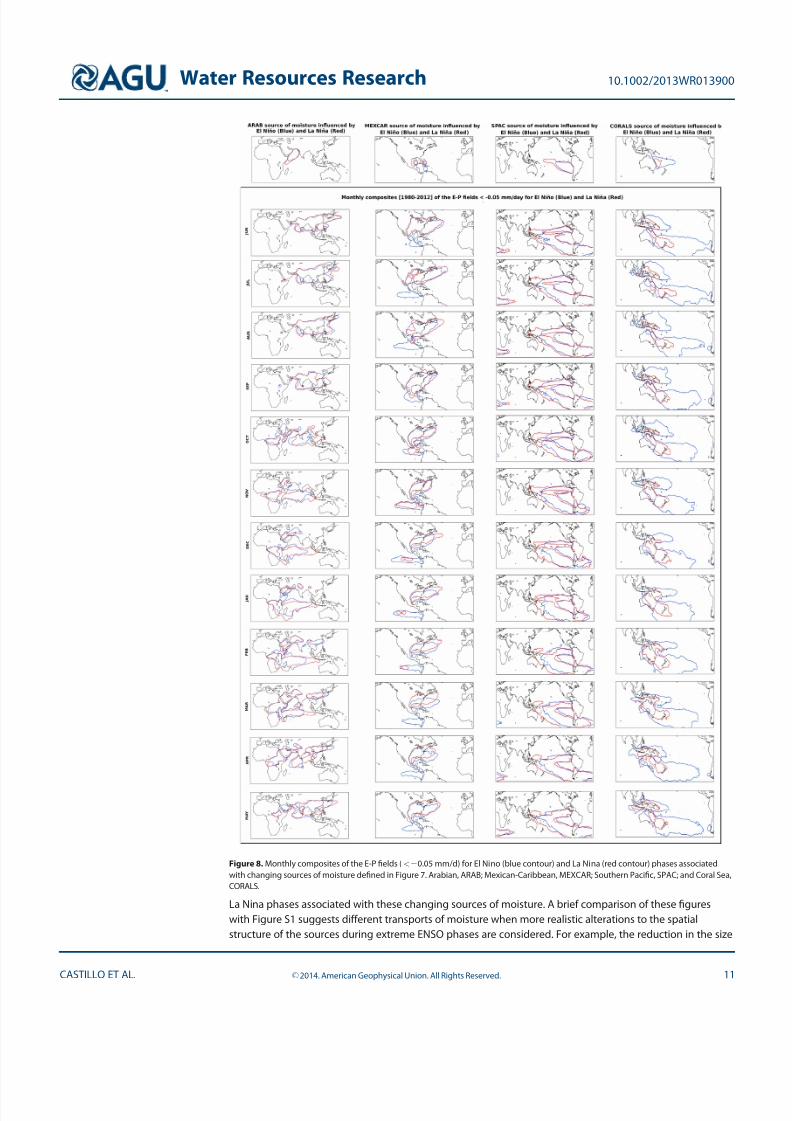
Figure 8 shows the monthly
composites of the E-P fields
(<20.05 mm/d) for the El Ni~no and
Figure 7. Oceanic moisture sources for El Ni~no and La Ni~na years: Climatological
annual vertically integrated moisture flux divergence (mm per year) for the composite
of the eight highest and lowest years of the ENSO mode for 1980–2012 using data
from ERA-Interim and following the criteria of Gimeno et al . [2010]. Contours were
defined using the threshold of 750 mm/yr, in blue for El Ni ~no composite and in red for
La Ni~na.
Table 1. Monthly Vertically Integrated Moisture Flux Divergence (mm per year) for Each of the Stationary Sources of Moisture Defined in Figure 1 a
AGU ARAB CORALS IND MED MEXCAR NATL NPAC REDS SATL SPAC ZAN
Jun 1143 769.7 1278 1708 524.8 58.7 1238 1040 947.1 1562 1210 1115
1068 821.4 1366 1802 485.9 56.1 1254 1040 878.3 1595 1185 894.6
1082 722.2 1111 1681 520.9 3.3 1253 1061 1020 1538 1289 1020
Jul 1125 788.3 1555 1770 711.7 280.5 1230 817.4 875.8 1521 1324 1264
1095 890.2 1686 1851 663.1 419.3 1276 751.3 832.4 1486 1256 1156
1190 698.5 1510 1691 723.4 103.4 1210 832.9 772.5 1639 1285 1286
Aug 1035 686.6 1451 1753 781 31.7 908.5 646.6 1022 1454 1347 1160
917.5 722.8 1617 1792 732.2 222.5 1004 524.7 988.2 1427 1307 1259
1112 637.2 1178 1727 793.5 2209.7 850.8 780.8 1073 1492 1394 996.9
Sep 1047 621 1296 1620 763.4 2236.5 730.3 768.9 1041 1344 1347 963.9
1023 648.9 1411 1586 672.8 2185.5 765.5 714.1 1007 1277 1294 881.8
1140 591.8 1028 1595 800.6 2447.4 685.8 844.6 1085 1414 1348 996.5
Oct 1028 678.7 1102 1461 557.7 278.8 859.7 1034 824 1335 1285 349.2
1112 658.6 1306 1398 494.7 484.3 774.7 1091 636.2 1311 1189 2135.1
1037 663.5 842.5 1420 632.1 61.4 911.3 1050 902.8 1381 1306 540.9
Nov 924.5 959.1 902.2 1298 475.9 973.9 1123 1281 1061 1328 1223 82.4
952.8 815.8 1181 1230 444.3 882.6 1191 1405 1110 1318 1039 2311.3
983.8 1033 697 1299 514.8 1066 1041 1189 1178 1359 1277 247.8
Dec 835.1 1365 460.5 1118 388.1 1366 1438 1345 1205 1242 1139 345.7
914.1 1424 783.9 1015 374.9 1273 1418 1524 1320 1189 836.7 254.9
802.3 1374 2173.8 1111 440.7 1462 1463 1244 1143 1237 1208 539.8Jan 756.4 1429 128.4 834.3 387.5 1356 1581 1257 1237 1183 1030 1129
876 1418 411.5 899.3 459.3 1367 1426 1435 1142 1150 647.7 966.9
514.8 1407 2142.2 793.5 353 1485 1608 1145 1273 1173 1114 1238
Feb 832 1218 253.6 618.2 358.7 1201 1487 1170 1203 1176 840.7 1293
1013 1146 331 411.5 360 995.4 1282 1252 1215 1210 514 1297
833 1306 2449.5 589.4 394.8 1321 1671 1081 1287 1111 900 1281
Mar 958.7 978.5 419 816.2 312.6 1081 1357 1258 952.2 1133 618.2 569.9
965.6 1042 658 681 421.1 924.8 1151 1343 973.6 1198 439 635.1
797.7 989.7 73.4 860.5 256.4 1113 1404 1138 969.7 1101 678.7 523.9
Apr 1145 817.4 1005 1083 240.1 887.4 1276 1272 543.2 1208 719.2 2492
1219 832.6 1049 983.9 271.6 826.1 1193 1336 558.4 1325 544.1 2564.1
1282 780 484.4 1059 235.8 899.4 1403 1133 555.3 1037 765.2 2313.8
May 1084 679.1 1233 1491 276.7 270.6 1201 1131 756.2 1456 1022 292.6
1045 634.6 1159 1518 261.8 319.7 1,118 1189 721.3 1491 901.5 2236
993.3 637.7 1242 1482 280 388 1125 1073 819.7 1399 1045 2152.8
aData from ERA-Interim. In black (bold) for the whole period 1980–2012. In blue for El Ni ~no years, red for La Ni~na years.
Water Resources Research 10.1002/2013WR013900
CASTILLO ET AL. VC 2014. American Geophysical Union. All Rights Reserved. 10
7/21/2019 Castillo Etal 2014 Wrr
http://slidepdf.com/reader/full/castillo-etal-2014-wrr 11/13
La Ni~na phases associated with these changing sources of moisture. A brief comparison of these figures
with Figure S1 suggests different transports of moisture when more realistic alterations to the spatial
structure of the sources during extreme ENSO phases are considered. For example, the reduction in the size
Figure 8. Monthly composites of the E-P fields (<20.05 mm/d) for El Ni~no (blue contour) and La Ni~na (red contour) phases associated
with changing sources of moisture defined in Figure 7. Arabian, ARAB; Mexican-Caribbean, MEXCAR; Southern Pacific, SPAC; and Coral Sea,
CORALS.
Water Resources Research 10.1002/2013WR013900
CASTILLO ET AL. VC 2014. American Geophysical Union. All Rights Reserved. 11

7/21/2019 Castillo Etal 2014 Wrr
http://slidepdf.com/reader/full/castillo-etal-2014-wrr 12/13
of the SPAC source during El Ni~no events implies less moisture transport toward Indonesia (Figure 8, third
column) compared to the moisture transport from the SPAC stationary source (Figure S1). The reduced
moisture transport toward Indonesia agrees with the displacement of the tropical convection from the
western Pacific toward the central part of the Eastern basin observed during these episodes (Figures 3–6,
first and second columns). Therefore, the reduced precipitation over the western Pacific during El Ni~no may
also be associated with the expansion of the CORALS source and the respective transport of moisture
eastward (Figure S8, fourth column). At the same time, the increased precipitation over Indonesia during La
Ni~na may be associated with a reduction in the CORALS source, and consequently with a confinement of its
transport toward the western Pacific. This anomalous pattern of CORALS during La Ni~na is not captured if
we only consider a stationary source (Figure S1) that expands its influence toward Indonesia and the central
Pacific.
A further example of changes in moisture transport is seen in the northward displacement of MEXCAR
during La Ni~na (Figure S8, second column). With this pattern, there is a reduction in the moisture transport
toward the Pacific ITCZ that is not evident in the results obtained if a stationary source is considered (Figure
S1). MEXCAR influence in Figure 8 accords more with the displacement of precipitation toward the western
Pacific observed during La Ni~na episodes (Figures 3–6, first and second columns).
Finally, in the Indian Ocean the expansion of ARAB toward the eastern African coast during La Ni~na (Figure
S8, first column) is associated with enhanced moisture transport toward the basin particularly during the
months from December to March. The results obtained when only the stationary source is considered
(Figure S1) do not reproduce these changes so clearly.
4. Concluding Remarks
We have herein investigated the influence of the evolution of the ENSO cycle on the moisture transport
from the major oceanic moisture sources using the Lagrangian FLEXPART data set fed by ERA-interim
Reanalysis data. We calculated differences between the composites of the vertically integrated moisture
transport divergence, the precipitation, and of the favored sink regions observed during the two ENSO
phases. Our results suggest that in maintaining the sources of moisture defined for the climatological
period 1980–2012, there are significant differences between the two phases. In general terms, the
variations in the moisture sinks associated with the evaporative sources coincide with the known patterns
of variation of H associated with large-scale atmospheric systems throughout ENSO cycles. Such variations
include those observed over equatorial Pacific rainfall, the major Summer monsoon systems, and
subtropical rainfall. During the mature stage of ENSO (DJF) contributions from SPAC, NPAC, MEXCAR, and
CORALS to the equatorial Pacific are enhanced for El Ni~no years, while IND, NPAC, and SPAC contribute
more to the western equatorial Pacific during La Ni~na. This pattern reproduces the known ‘‘see-saw’’
characteristic associated with ENSO over this region. The subtropical areas receive more moisture from the
nearest sources during El Ni~no, for example southern North America from NATL and MEXCAR, South
America from SATL and SPAC, or southern Africa from IND, AGU, and ZAN. The Indian Monsoon regime
exhibits an inhibition of convergence associated with a lack of moisture uptake from its typical (own)
sources during El Ni~no episodes. However, from June to November the region is a preferred sink for
moisture from IND, ZAN, and ARAB during La Ni~na, and the convergence is favored.
When the areas of the sources are redefined according to the phase of ENSO, most remain stationary, but
four of the sources show notable differences in their extent. Two of them are more involved in the region of ENSO occurrence, i.e., SPAC and CORALS in the Pacific; the others are MEXCAR in the Atlantic and ARAB in
Indian Ocean. A Lagrangian sensitivity analysis performed for these four sources considering the new areas
defined according to the ENSO composites of the vertically integrated moisture transport divergence
suggest some changes related to the results as far as the stationary sources are concerned. For example,
the reduction in the SPAC source in size during El Ni~no events implies less moisture transport toward
Indonesia compared with the moisture transport from the stationary SPAC source. The reduction in CORALS
during La Ni~na and the confinement of its transport toward the western Pacific is not captured when we
consider the stationary CORALS source, which extends its influence toward Indonesia and Central Pacific.
The northward displacement of MEXCAR observed during La Ni~na and the associated reduction in the
moisture transport toward the Pacific ITCZ during this phase is not evident in the results obtained when
Water Resources Research 10.1002/2013WR013900
CASTILLO ET AL. VC 2014. American Geophysical Union. All Rights Reserved. 12

7/21/2019 Castillo Etal 2014 Wrr
http://slidepdf.com/reader/full/castillo-etal-2014-wrr 13/13
only the stationary source is considered. The expansion of ARAB toward the eastern African coast during La
Ni~na associated with enhanced moisture transport toward the Indian Ocean, particularly during DJFM, was
not reproduced in the results for the stationary source. In any case, apart from these four specific sources,
the small changes in the spatial structure of the remaining sources during different ENSO phases allowed
the use of stationary sources in our analysis and the consequent evaluation and comparison of the impacts
of both phases of ENSO over these prespecified regions.
References
Bengtsson, L., S. Hagemann, and K. I. Hodges (2004), Can climate trends be calculated from reanalysis data? J. Geophys. Res., 109, D11111,
doi:10.1029/2004JD004536.
Cook, K. H. (2000), The South Indian convergence zone and interannual rainfall variability over southern Africa, J. Clim., 13, 3789–3804.
D’Abreton, P. C., and P. D. Tyson (1995), Divergent and nondivergent water vapour transport over southern Africa during wet and dry
conditions, Meteorol. Atmos. Phys., 55, 47–59.
Dee, D., et al. (2011), The ERA Interim reanalysis: Configuration and performance of the data assimilation system, Q. J. R. Meteorol. Soc., 137 ,
553–597, doi:10.1002/qj.828.
Dirmeyer, P. A., and K. L. Brubaker (2007), Characterization of the global hydrologic cycle from a back-trajectory analysis of atmospheric
water vapor, J. Hydrometeorol., 8(1), 20–37.
Drumond, A., R. Nieto, L. Gimeno, and T. Ambrizzi (2008), A Lagrangian identification of major sources of moisture over Central Brazil and
La Plata Basin, J. Geophys. Res., 113, D14128, doi:10.1029/2007JD009547.
Duran-Quesada, A. M., L. Gimeno, J. A. Amador, and R. Nieto (2010), Moisture sources for Central America: Identification of moisture
sources using a Lagrangian analysis technique, J. Geophys. Res., 115, D05103, doi:10.1029/2009JD012455.Gimeno, L., A. Drumond, R. Nieto, R. M. Trigo, and A. Stohl (2010a), On the origin of continental precipitation, Geophys. Res. Lett., 37 ,
L13804, doi:10.1029/2010GL043712.
Gimeno, L., R. Nieto, R. M. Trigo, S. M. Vicente-Serrano, and J. I. Lopez-Moreno (2010b), Where does the Iberian Peninsula moisture come
from? An answer based on a Lagrangian approach, J. Hydrometeorol., 11, 421–436, doi:10.1175/2009JHM1182.1.
Gimeno, L., et al. (2012), Oceanic and terrestrial sources of continental precipitation, Rev. Geophys., 50, RG4003, doi:10.1029/
2012RG000389.
Gimeno, L., R. Nieto, A. Drumond, R. Castillo, and R. M. Trigo (2013), Influence of the intensification of the major oceanic moisture sources
on continental precipitation, Geophys. Res. Lett., 40, 1443–1450, doi:10.1002/grl.50338.
Intergovernmental Panel on Climate Change, Climate Change 2013 (2013), The assessment report of the Intergovernmental Panel on Climate
Change, 5th Report, Cambridge Univ. Press, Cambridge, U. K.
Knippertz, P., H. Wernli, and G. Gl€aser (2013), A global climatology of tropical moisture, J. Clim., 26, 3031–3045, doi:10.1175/JCLI-D-12–
00401.1.
Lorenz, C., and H. Kunstmann (2012), The hydrological cycle in three state-of-the-art reanalyses: Intercomparison and performance
analysis, J. Hydrometeorol , 13, 1397–1420, doi:10.1175/jhm-d-11–088.1.
Nieto, R., L. Gimeno, and R. M. Trigo (2006), A Lagrangian identification of major sources of Sahel moisture, Geophys. Res. Lett., 33, L18707,
doi:10.1029/2006GL027232.
Nieto, R., A. M. Duran-Quesada, and L. Gimeno (2010), Major sources of moisture over Antarctic ice-core sites identified through aLagrangian approach, Clim. Res., 41, 45–49, doi:10.3354/cr00842.
Numaguti, A. (1999), Origin and recycling processes of precipitating water over the Eurasian continent: Experiments using an atmospheric
general circulation model, J. Geophys. Res., 104, 1957–1972.
Ordo~nez, P., P. Ribera, D. Gallego, and C. Pe~na-Ortiz (2012), Major moisture sources for Western and Southern India and their role on
synoptic-scale rainfall events, Hydrol. Processes, 26, 3886–3895, doi:10.1002/hyp.8455.
Smith, T. M., et al. (2008), Improvements to NOAA’s historical merged land-ocean surface temperature analysis (1880–2006), J. Clim., 21,
2283–2293.
Stohl, A., and P. James (2004), A Lagrangian analysis of the atmospheric branch of the global water cycle: Part I: Method description,
validation, and demonstration for the August 2002 flooding in central Europe, J. Hydrometeorol , 5, 656–678.
Stohl, A., and P. James (2005), A Lagrangian analysis of the atmospheric branch of the global water cycle: Part II: Earth’s river catchments,
ocean basins, and moisture transports between them, J. Hydrometeorol., 6, 961–984, doi:10.1175/JHM470.1.
Stohl, A., C. Forster, A. Frank, P. Seibert, and G. Wotawa (2005), Technical note: The Lagrangian particle dispersion model FLEXPART version
6.2, Atmos. Chem. Phys., 5, 2461–2474.
Stohl, A., C. Forster, and H. Sodemann (2008), Remote sources of water vapor forming precipitation on the Norwegian west coast at 60 N:
A tale of hurricanes and an atmospheric river, J. Geophys. Res., 113, D05102, doi:10.1029/2007JD009006.
Todd, M. C., R. Washington, and P. Palmer (2004), Water vapour transport associated with tropical-temperate trough systems over
southern Africa and the southwest Indian Ocean, Int. J. Climatol., 24, 555–568.
Trenberth, K. E., and C. J. Guillemot (1998), Evaluation of the atmospheric moisture and hydrological cycle in the NCEP/NCAR reanalyses,Clim. Dyn., 14, 213–231.
Trenberth, K. E., J. T. Fasullo, and J. Mackaro (2011), Atmospheric moisture transports from ocean to land and global energy flows in
reanalyses, J. Clim., 24, 4907–4924, doi:10.1175/2011jcli4171.1.
Uppala, S. M., et al. (2005), The ERA-40 re-analysis, Q. J. R. Meteorol. Soc., 131, 2961–3012.
Viste, E., and A. Sorteberg (2011), Moisture transport into the Ethiopian highlands, Int. J. Climatol., 33, 249–263, doi:10.1002/joc.3409.
Wei, J., P. A. Dirmeyer, M. G. Bosilovich, and R. Wu (2012), Water vapor sources for Yangtze River Valley rainfall: Climatology, variability, and
implications for rainfall forecasting, J. Geophys. Res., 117 , D05126, doi:10.1029/2011JD016902.
Wernli, H., and H. C. Davies (1997), A Lagrangian-based analysis of extratropical cyclones: I: The method and some applications, Q. J. R.
Meteorol. Soc., 123, 467–489.
Acknowledgments
The authors would like to thank the
‘‘Xunta de Galicia’’ for partially funding
this research through the CHEGA
project, and the Spanish Government
through the TRAMO project. Both
projects were cofunded by FEDER.
Water Resources Research 10.1002/2013WR013900
CASTILLO ET AL VC 2014 A i G h i l U i All Ri ht R d 13