Embed Size (px)
Citation preview
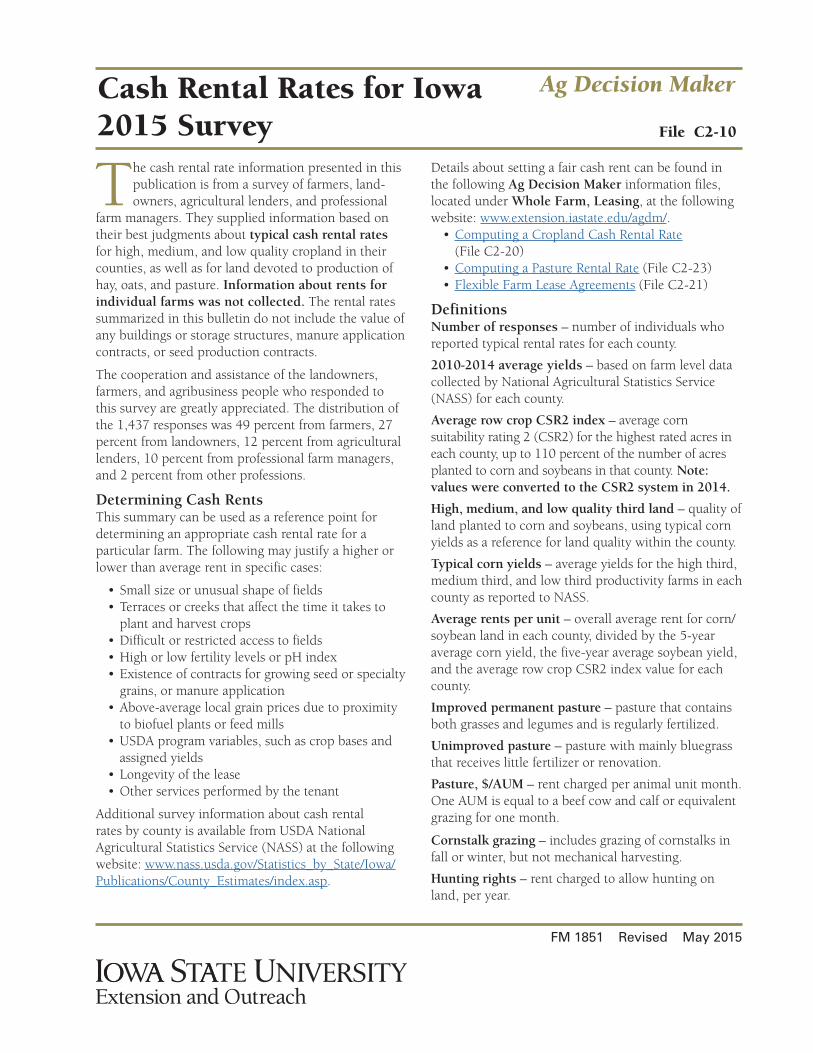
Cash Rental Rates for Iowa 2015 Survey File C2-10
FM 1851 Revised May 2015
Ag Decision Maker
The cash rental rate information presented in this publication is from a survey of farmers, land-owners, agricultural lenders, and professional
farm managers. They supplied information based on their best judgments about typical cash rental rates for high, medium, and low quality cropland in their counties, as well as for land devoted to production of hay, oats, and pasture. Information about rents for individual farms was not collected. The rental rates summarized in this bulletin do not include the value of any buildings or storage structures, manure application contracts, or seed production contracts.
The cooperation and assistance of the landowners, farmers, and agribusiness people who responded to this survey are greatly appreciated. The distribution of the 1,437 responses was 49 percent from farmers, 27 percent from landowners, 12 percent from agricultural lenders, 10 percent from professional farm managers, and 2 percent from other professions.
Determining Cash RentsThis summary can be used as a reference point for determining an appropriate cash rental rate for a particular farm. The following may justify a higher or lower than average rent in specific cases:
• Small size or unusual shape of fields• Terraces or creeks that affect the time it takes to
plant and harvest crops• Difficult or restricted access to fields• High or low fertility levels or pH index• Existence of contracts for growing seed or specialty
grains, or manure application• Above-average local grain prices due to proximity
to biofuel plants or feed mills• USDA program variables, such as crop bases and
assigned yields• Longevity of the lease• Other services performed by the tenant
Additional survey information about cash rental rates by county is available from USDA National Agricultural Statistics Service (NASS) at the following website: www.nass.usda.gov/Statistics_by_State/Iowa/Publications/County_Estimates/index.asp.
Details about setting a fair cash rent can be found in the following Ag Decision Maker information files, located under Whole Farm, Leasing, at the following website: www.extension.iastate.edu/agdm/.
• Computing a Cropland Cash Rental Rate (File C2-20)
• Computing a Pasture Rental Rate (File C2-23)• Flexible Farm Lease Agreements (File C2-21)
DefinitionsNumber of responses – number of individuals who reported typical rental rates for each county.
2010-2014 average yields – based on farm level data collected by National Agricultural Statistics Service (NASS) for each county.
Average row crop CSR2 index – average corn suitability rating 2 (CSR2) for the highest rated acres in each county, up to 110 percent of the number of acres planted to corn and soybeans in that county. Note: values were converted to the CSR2 system in 2014.
High, medium, and low quality third land – quality of land planted to corn and soybeans, using typical corn yields as a reference for land quality within the county.
Typical corn yields – average yields for the high third, medium third, and low third productivity farms in each county as reported to NASS.
Average rents per unit – overall average rent for corn/soybean land in each county, divided by the 5-year average corn yield, the five-year average soybean yield, and the average row crop CSR2 index value for each county.
Improved permanent pasture – pasture that contains both grasses and legumes and is regularly fertilized.
Unimproved pasture – pasture with mainly bluegrass that receives little fertilizer or renovation.
Pasture, $/AUM – rent charged per animal unit month. One AUM is equal to a beef cow and calf or equivalent grazing for one month.
Cornstalk grazing – includes grazing of cornstalks in fall or winter, but not mechanical harvesting.
Hunting rights – rent charged to allow hunting on land, per year.
DRA
FT
Prepared by Alejandro Plastina, extension economistWilliam Edwards, retired extension economist
Ann Johanns, extension program specialist
. . . and justice for all The U.S. Department of Agriculture (USDA) prohibits discrimination in all its programs and activities on the basis of race, color, national origin, gender, religion, age, disability, political beliefs, sexual orientation, and marital or family status. (Not all prohibited bases apply to all programs.) Many materials can be made available in alternative formats for ADA clients. To file a complaint of discrimination, write USDA, Office of Civil Rights, Room 326-W, Whitten Building, 14th and Independence Avenue, SW, Washington, DC 20250-9410 or call 202-720-5964.
Issued in furtherance of Cooperative Extension work, Acts of May 8 and July 30, 1914, in cooperation with the U.S. Department of Agriculture. Cathann A. Kress, director, Cooperative Extension Service, Iowa State University of Science and Technology, Ames, Iowa.
Farm Management Field Specialistswww.extension.iastate.edu/ag/farm-management-0
www.extension.iastate.edu/agdmstore.extension.iastate.edu
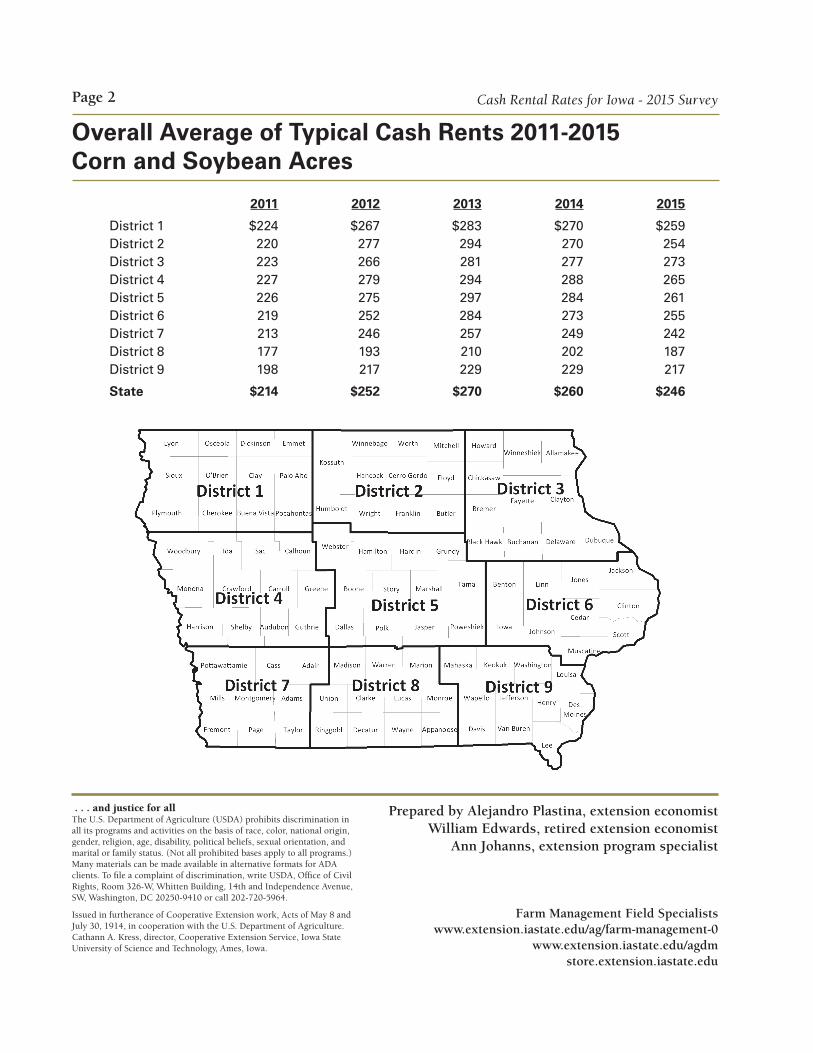
Overall Average of Typical Cash Rents 2011-2015Corn and Soybean Acres
2011 2012 2013 2014 2015
District 1 $224 $267 $283 $270 $259 District 2 220 277 294 270 254 District 3 223 266 281 277 273 District 4 227 279 294 288 265 District 5 226 275 297 284 261 District 6 219 252 284 273 255 District 7 213 246 257 249 242 District 8 177 193 210 202 187 District 9 198 217 229 229 217
State $214 $252 $270 $260 $246
Page 2 Cash Rental Rates for Iowa - 2015 Survey

Page 3Cash Rental Rates for Iowa - 2015 Survey
* Number of responses is the number of individuals who provided information about typical rental rates in the county. Rental data was not collected by individual farm.** No values are reported if fewer than five responses were received.
2015 CASH RENTAL SURVEY FOR CROP REPORTING DISTRICT 1
CountyDistrict Average
BuenaVista
Cher-okee Clay
Dickin-son Emmet Lyon O’Brien Osceola Palo Alto Plymouth
Poca-hontas Sioux
Number of responses* 224 11 15 22 12 9 10 27 14 13 52 17 22 2010 - 2014 avg. corn yield 174 168 178 173 166 170 181 182 181 171 167 172 180 2010 - 2014 avg. bean yield 50 47 54 49 47 46 54 54 51 47 51 46 57 Avg. row crop CSR2 index 87 90 91 88 89 85 80 95 88 84 83 84 89
Typical Cash Rent for Corn and Soybeans, $ per tillable acre
Overall average $259 $260 $294 $233 $213 $223 $279 $258 $265 $249 $277 $260 $297 Irrigated land average $279 High quality third Average response $296 $291 $328 $284 $249 $255 $315 $304 $301 $285 $318 $291 $334 Range of responses 225-375 240-400 224-375 185-290 190-300 198-400 110-400 230-350 250-350 189-500 225-350 203-425 Medium quality third Average response $261 $260 $289 $236 $218 $221 $285 $256 $269 $252 $276 $267 $301 Range of responses 230-300 220-375 145-300 171-270 175-275 183-350 100-350 195-340 215-310 150-420 210-300 182-400 Low quality third Average response $220 $228 $264 $178 $172 $195 $238 $214 $226 $212 $237 $220 $257 Range of responses 200-275 195-340 100-250 125-200 168-250 158-325 80-325 150-315 180-270 125-315 165-255 157-350
Typical Corn Yield, bu. per acre High third 194 191 202 195 185 187 198 200 197 190 189 192 203 Middle third 178 175 183 178 171 172 183 186 182 173 168 177 182 Low third 156 153 161 150 155 158 158 166 165 153 143 157 157
Average Rents per 5 Year Average Yield or CSR2 Rent per bu. of corn yield $1.49 $1.55 $1.65 $1.35 $1.28 $1.31 $1.54 $1.42 $1.46 $1.46 $1.66 $1.51 $1.65 Rent per bu. of bean yield $5.15 $5.53 $5.44 $4.76 $4.53 $4.85 $5.17 $4.78 $5.20 $5.30 $5.43 $5.65 $5.21 Rent per CSR2 index point $2.98 $2.89 $3.23 $2.65 $2.39 $2.62 $3.49 $2.72 $3.01 $2.96 $3.34 $3.10 $3.34
Typical Cash Rent for Oats, Hay, and Pasture, $ per acre** Alfalfa hay, established $192 $172 Grass hay, established $129 $126 Oats $186 $174 Improved perm. pasture $80 $56 $63 $86 Unimproved perm. pasture $52 $37 $77 $45 $60 Pasture, $/AUM NA Cornstalk grazing $7 $4 Hunting rights NA
DRA
FT
Page 4Cash Rental Rates for Iowa - 2015 Survey
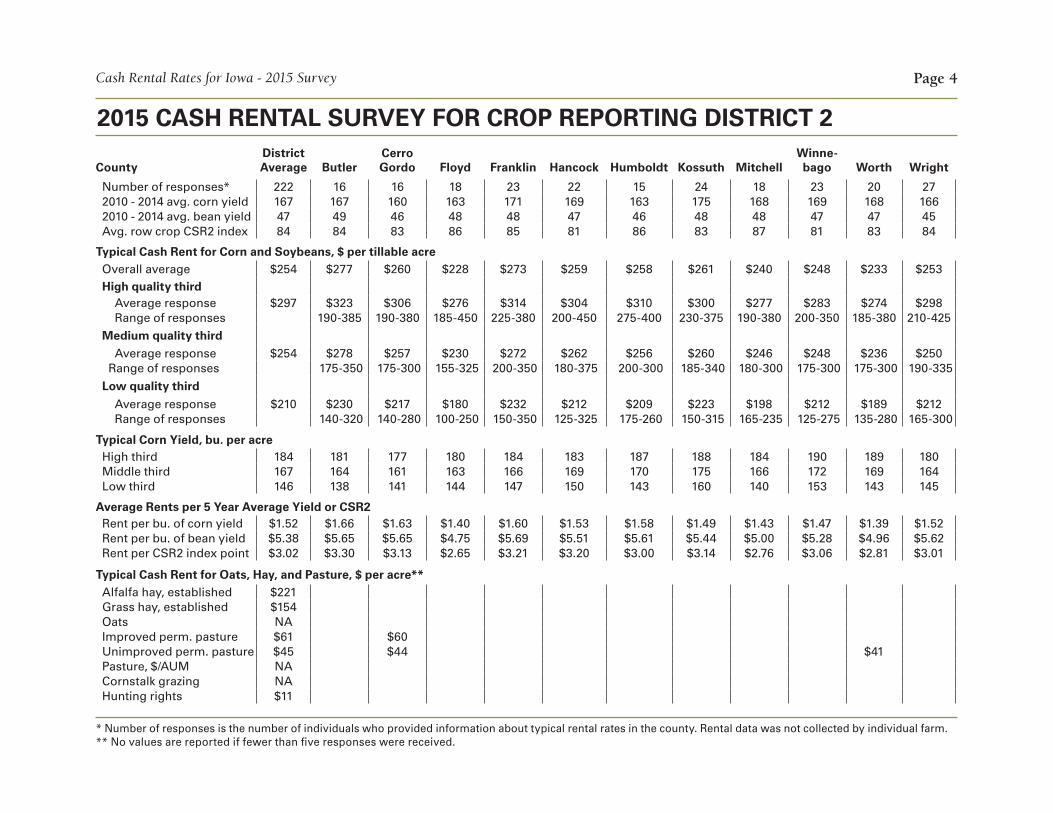
* Number of responses is the number of individuals who provided information about typical rental rates in the county. Rental data was not collected by individual farm.** No values are reported if fewer than five responses were received.
CountyDistrictAverage Butler
CerroGordo Floyd Franklin Hancock Humboldt Kossuth Mitchell
Winne-bago Worth Wright
Number of responses* 222 16 16 18 23 22 15 24 18 23 20 27 2010 - 2014 avg. corn yield 167 167 160 163 171 169 163 175 168 169 168 166 2010 - 2014 avg. bean yield 47 49 46 48 48 47 46 48 48 47 47 45 Avg. row crop CSR2 index 84 84 83 86 85 81 86 83 87 81 83 84
Typical Cash Rent for Corn and Soybeans, $ per tillable acre Overall average $254 $277 $260 $228 $273 $259 $258 $261 $240 $248 $233 $253 High quality third Average response $297 $323 $306 $276 $314 $304 $310 $300 $277 $283 $274 $298 Range of responses 190-385 190-380 185-450 225-380 200-450 275-400 230-375 190-380 200-350 185-380 210-425 Medium quality third Average response $254 $278 $257 $230 $272 $262 $256 $260 $246 $248 $236 $250 Range of responses 175-350 175-300 155-325 200-350 180-375 200-300 185-340 180-300 175-300 175-300 190-335
Low quality third
Average response $210 $230 $217 $180 $232 $212 $209 $223 $198 $212 $189 $212 Range of responses 140-320 140-280 100-250 150-350 125-325 175-260 150-315 165-235 125-275 135-280 165-300
Typical Corn Yield, bu. per acre High third 184 181 177 180 184 183 187 188 184 190 189 180 Middle third 167 164 161 163 166 169 170 175 166 172 169 164 Low third 146 138 141 144 147 150 143 160 140 153 143 145
Average Rents per 5 Year Average Yield or CSR2 Rent per bu. of corn yield $1.52 $1.66 $1.63 $1.40 $1.60 $1.53 $1.58 $1.49 $1.43 $1.47 $1.39 $1.52 Rent per bu. of bean yield $5.38 $5.65 $5.65 $4.75 $5.69 $5.51 $5.61 $5.44 $5.00 $5.28 $4.96 $5.62 Rent per CSR2 index point $3.02 $3.30 $3.13 $2.65 $3.21 $3.20 $3.00 $3.14 $2.76 $3.06 $2.81 $3.01
Typical Cash Rent for Oats, Hay, and Pasture, $ per acre** Alfalfa hay, established $221 Grass hay, established $154 Oats NA Improved perm. pasture $61 $60 Unimproved perm. pasture $45 $44 $41 Pasture, $/AUM NA Cornstalk grazing NA Hunting rights $11
2015 CASH RENTAL SURVEY FOR CROP REPORTING DISTRICT 2

Page 5Cash Rental Rates for Iowa - 2015 Survey
* Number of responses is the number of individuals who provided information about typical rental rates in the county. Rental data was not collected by individual farm.** No values are reported if fewer than five responses were received.
CountyDistrictAverage
Alla-makee
BlackHawk Bremer Buchanan
Chick-asaw Clayton Delaware Dubuque Fayette Howard
Winne-shiek
Number of responses* 140 8 13 10 17 13 11 16 8 11 20 13 2010 - 2014 avg. corn yield 170 168 163 168 167 165 175 170 177 171 168 175 2010 - 2014 avg. bean yield 51 52 50 51 50 49 55 53 56 52 48 50 Avg. row crop CSR2 index 81 79 85 87 84 85 74 79 71 83 83 80
Typical Cash Rent for Corn and Soybeans, $ per tillable acre
Overall average $273 $223 $290 $300 $279 $279 $260 $281 $311 $290 $237 $252 High quality third Average response $325 $271 $352 $353 $322 $337 $332 $336 $359 $342 $277 $301 Range of responses 210-375 275-450 290-400 200-475 275-400 270-400 250-400 300-400 300-385 165-400 200-425 Medium quality third Average response $274 $218 $294 $302 $286 $282 $253 $281 $313 $295 $235 $253 Range of responses 175-275 249-380 260-350 225-325 200-350 200-300 200-350 260-375 250-325 155-320 175-300 Low quality third Average response $220 $181 $225 $246 $230 $219 $194 $227 $262 $233 $198 $202 Range of responses 150-200 175-255 180-300 166-290 175-300 150-250 170-300 200-300 150-290 120-275 125-250
Typical Corn Yield, bu. per acre High third 186 184 187 191 185 182 191 184 189 184 185 189 Middle third 165 165 162 171 164 161 164 164 166 168 163 168 Low third 134 140 131 139 137 139 124 138 135 126 135 135
Average Rents per 5 Year Average Yield or CSR2 Rent per bu. of corn yield $1.61 $1.33 $1.78 $1.79 $1.67 $1.69 $1.49 $1.65 $1.76 $1.70 $1.41 $1.44 Rent per bu. of bean yield $5.31 $4.29 $5.80 $5.88 $5.58 $5.69 $4.73 $5.30 $5.55 $5.58 $4.94 $5.04 Rent per CSR2 index point $3.39 $2.82 $3.41 $3.45 $3.32 $3.28 $3.51 $3.56 $4.38 $3.49 $2.86 $3.15
Typical Cash Rent for Oats, Hay, and Pasture, $ per acre** Alfalfa hay, established $290 Grass hay, established $188 $141 Oats $219 Improved perm. pasture $89 $110 $79 Unimproved perm. pasture $64 $80 $47 $39 Pasture, $/AUM $17 Cornstalk grazing $7 Hunting rights $24
2015 CASH RENTAL SURVEY FOR CROP REPORTING DISTRICT 3

DRA
FT
Page 6Cash Rental Rates for Iowa - 2015 Survey
* Number of responses is the number of individuals who provided information about typical rental rates in the county. Rental data was not collected by individual farm.** No values are reported if fewer than five responses were received.
2015 CASH RENTAL SURVEY FOR CROP REPORTING DISTRICT 4
CountyDistrictAverage
Audu-bon Calhoun Carroll Crawford Greene Guthrie Harrison Ida Monona Sac Shelby
Wood-bury
Number of responses* 163 10 18 11 13 10 16 15 9 12 16 19 14 2010 - 2014 avg. corn yield 162 159 162 159 168 159 146 160 179 155 165 170 163 2010 - 2014 avg. bean yield 48 50 45 49 52 45 46 46 53 46 49 51 48 Avg. row crop CSR2 index 79 78 87 83 76 86 83 74 83 69 89 73 71
Typical Cash Rent for Corn and Soybeans, $ per tillable acre Overall average $265 $256 $245 $267 $291 $252 $226 $263 $301 $269 $256 $259 $293 Irrigated land average $316 $312 High quality third Average response $309 $298 $272 $312 $335 $298 $260 $308 $341 $341 $297 $301 $347 Range of responses 265-352 185-330 275-350 300-375 225-350 140-360 250-425 300-375 250-400 195-375 220-350 300-425 Medium quality third Average response $266 $252 $246 $271 $288 $260 $224 $267 $303 $266 $259 $258 $294 Range of responses 200-319 175-300 225-310 250-350 200-310 136-300 230-350 260-350 140-350 180-300 200-300 230-375 Low quality third Average response $220 $219 $216 $218 $251 $200 $194 $215 $259 $199 $212 $218 $239 Range of responses 190-280 160-270 135-295 180-300 125-295 130-250 120-275 220-300 120-225 145-280 175-280 185-275
Typical Corn Yield, bu. per acre High third 187 178 188 186 197 181 166 185 202 180 193 193 193 Middle third 169 165 171 168 178 165 149 166 182 160 174 175 174 Low third 144 143 147 144 152 140 121 143 161 138 143 152 145
Average Rents per 5 Year Average Yield or CSR2 Rent per bu. of corn yield $1.63 $1.61 $1.51 $1.68 $1.73 $1.58 $1.55 $1.64 $1.68 $1.74 $1.55 $1.52 $1.80 Rent per bu. of bean yield $5.48 $5.12 $5.44 $5.45 $5.60 $5.60 $4.91 $5.72 $5.68 $5.85 $5.22 $5.08 $6.10 Rent per CSR2 index point $3.37 $3.28 $2.82 $3.22 $3.83 $2.93 $2.72 $3.55 $3.63 $3.90 $2.88 $3.55 $4.13
Typical Cash Rent for Oats, Hay, and Pasture, $ per acre** Alfalfa hay, established $190 $115 $220 Grass hay, established $140 $183 Oats $161 Improved perm. pasture $94 $80 $99 $106 Unimproved perm. pasture $64 $59 $71 $69 Pasture, $/AUM $23 Cornstalk grazing $7 $6 Hunting rights $12

Page 7Cash Rental Rates for Iowa - 2015 Survey
* Number of responses is the number of individuals who provided information about typical rental rates in the county. Rental data was not collected by individual farm.** No values are reported if fewer than five responses were received.
2015 CASH RENTAL SURVEY FOR CROP REPORTING DISTRICT 5
CountyDistrictAverage Boone Dallas Grundy Hamilton Hardin Jasper Marshall Polk
Powe-shiek Story Tama Webster
Number of responses* 246 21 20 25 18 23 12 17 21 27 26 19 17 2010 - 2014 avg. corn yield 165 165 157 178 159 172 165 172 155 166 158 168 167 2010 - 2014 avg. bean yield 50 47 47 56 46 51 50 55 48 51 47 53 47 Avg. row crop CSR2 index 86 88 90 88 86 86 80 85 91 82 87 86 85
Typical Cash Rent for Corn and Soybeans, $ per tillable acre
Overall average $261 $245 $250 $316 $267 $273 $227 $250 $258 $248 $263 $270 $259 High quality third Average response $304 $280 $291 $373 $312 $321 $269 $295 $305 $286 $307 $320 $293 Range of responses 225-335 180-400 300-500 250-400 250-400 220-350 194-415 250-430 180-395 220-425 180-400 225-375 Medium quality third Average response $261 $251 $254 $314 $265 $278 $223 $254 $253 $253 $261 $270 $260 Range of responses 200-300 150-325 270-390 200-340 200-350 175-280 170-350 200-350 150-340 200-375 160-350 200-285 Low quality third Average response $216 $204 $206 $262 $223 $220 $188 $203 $216 $205 $220 $220 $224 Range of responses 150-250 120-275 200-325 175-275 150-300 155-240 140-275 150-300 100-280 170-325 140-290 175-255
Typical Corn Yield, bu. per acre High third 186 181 176 204 183 194 183 193 174 183 184 192 187 Middle third 167 164 157 181 163 173 167 172 154 164 170 168 170 Low third 140 145 134 138 138 146 141 144 133 136 142 136 151
Average Rents per 5 Year Average Yield or CSR2 Rent per bu. of corn yield $1.58 $1.48 $1.59 $1.78 $1.68 $1.59 $1.38 $1.45 $1.66 $1.49 $1.66 $1.61 $1.55 Rent per bu. of bean yield $5.24 $5.21 $5.32 $5.64 $5.80 $5.35 $4.54 $4.55 $5.38 $4.86 $5.60 $5.09 $5.51 Rent per CSR2 index point $3.02 $2.78 $2.78 $3.59 $3.10 $3.17 $2.84 $2.94 $2.84 $3.02 $3.02 $3.14 $3.05
Typical Cash Rent for Oats, Hay, and Pasture, $ per acre** Alfalfa hay, established $176 $138 $210 $151 $232 Grass hay, established $118 $98 Oats $147 Improved perm. pasture $74 $77 $58 $77 $75 Unimproved perm. pasture $47 $54 $40 $42 $49 Pasture, $/AUM NA Cornstalk grazing $16 Hunting rights $20

DRA
FT
Page 8Cash Rental Rates for Iowa - 2015 Survey
* Number of responses is the number of individuals who provided information about typical rental rates in the county. Rental data was not collected by individual farm.** No values are reported if fewer than five responses were received.
CountyDistrictAverage Benton Cedar Clinton Iowa Jackson Johnson Jones Linn Muscatine Scott
Number of responses* 172 23 22 16 18 14 16 14 18 15 16 2010 - 2014 avg. corn yield 166 163 174 175 165 162 164 165 164 162 164 2010 - 2014 avg. bean yield 53 51 56 55 51 52 50 54 51 52 56 Avg. row crop CSR2 index 82 85 87 73 80 71 86 79 87 84 89
Typical Cash Rent for Corn and Soybeans, $ per tillable acre Overall average $255 $280 $247 $263 $226 $258 $234 $264 $271 $230 $273 Irrigated land average $250 High quality third Average response $307 $329 $303 $309 $267 $312 $275 $328 $331 $289 $328 Range of responses 245-400 180-400 200-400 170-315 250-350 160-350 245-450 275-400 175-350 200-425 Medium quality third Average response $255 $281 $242 $265 $229 $257 $241 $260 $271 $232 $271 Range of responses 195-360 145-300 170-350 145-350 200-300 150-275 200-350 225-325 145-290 180-350 Low quality third Average response $202 $230 $196 $216 $181 $205 $187 $205 $210 $169 $221 Range of responses 125-325 112-250 150-300 105-245 150-260 110-245 175-280 175-290 105-215 150-300
Typical Corn Yield, bu. per acre High third 182 183 195 191 176 172 172 180 181 182 186 Middle third 161 164 176 169 158 150 147 161 158 156 169 Low third 132 135 153 139 129 126 110 131 132 131 137
Average Rents per 5 Year Average Yield or CSR2 Rent per bu. of corn yield $1.54 $1.72 $1.42 $1.50 $1.37 $1.59 $1.43 $1.60 $1.65 $1.42 $1.66 Rent per bu. of bean yield $4.83 $5.49 $4.41 $4.78 $4.43 $4.96 $4.68 $4.89 $5.31 $4.42 $4.88 Rent per CSR2 index point $3.12 $3.29 $2.84 $3.60 $2.83 $3.63 $2.72 $3.34 $3.11 $2.74 $3.07
Typical Cash Rent for Oats, Hay, and Pasture, $ per acre** Alfalfa hay, established $198 $205 $156 $241 $245 Grass hay, established $142 $162 $101 $179 Oats $169 $150 Improved perm. pasture $88 $72 $108 Unimproved perm. pasture $56 $54 $53 $50 $47 $72 $57 Pasture, $/AUM $20 Cornstalk grazing $12 Hunting rights $15
2015 CASH RENTAL SURVEY FOR CROP REPORTING DISTRICT 6
Page 9Cash Rental Rates for Iowa - 2015 Survey
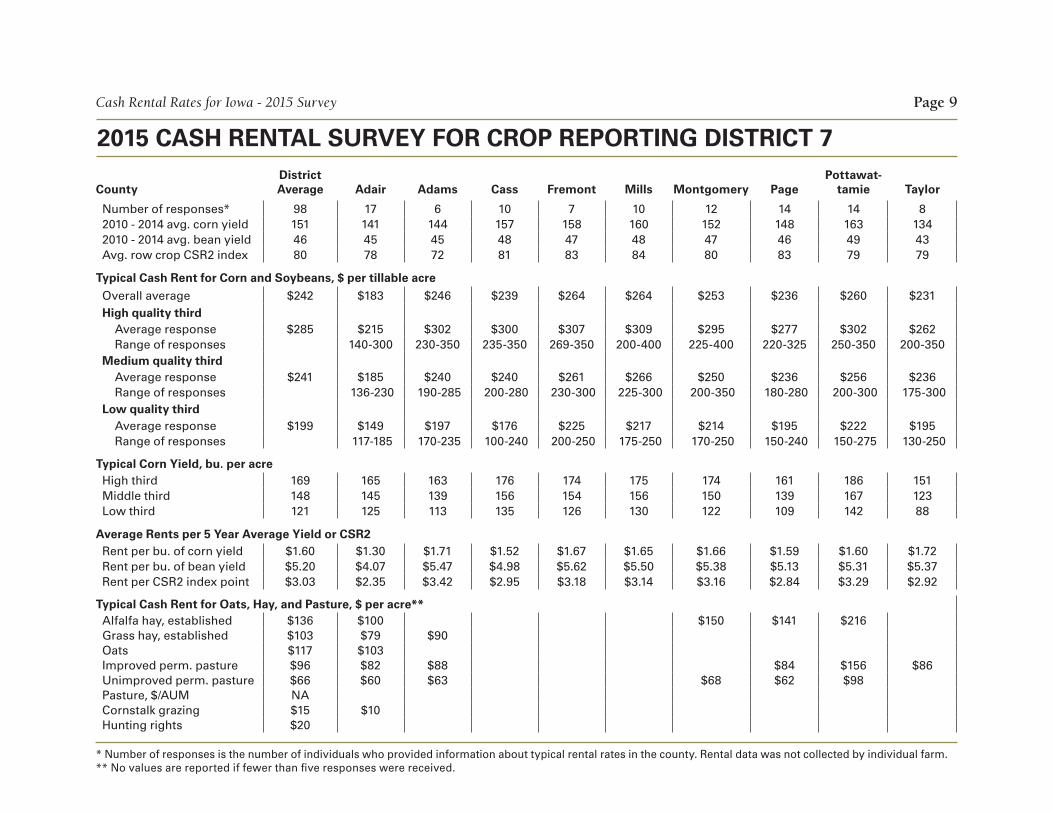
* Number of responses is the number of individuals who provided information about typical rental rates in the county. Rental data was not collected by individual farm.** No values are reported if fewer than five responses were received.
CountyDistrictAverage Adair Adams Cass Fremont Mills Montgomery Page
Pottawat-tamie Taylor
Number of responses* 98 17 6 10 7 10 12 14 14 8 2010 - 2014 avg. corn yield 151 141 144 157 158 160 152 148 163 134 2010 - 2014 avg. bean yield 46 45 45 48 47 48 47 46 49 43 Avg. row crop CSR2 index 80 78 72 81 83 84 80 83 79 79
Typical Cash Rent for Corn and Soybeans, $ per tillable acre
Overall average $242 $183 $246 $239 $264 $264 $253 $236 $260 $231 High quality third Average response $285 $215 $302 $300 $307 $309 $295 $277 $302 $262 Range of responses 140-300 230-350 235-350 269-350 200-400 225-400 220-325 250-350 200-350 Medium quality third Average response $241 $185 $240 $240 $261 $266 $250 $236 $256 $236 Range of responses 136-230 190-285 200-280 230-300 225-300 200-350 180-280 200-300 175-300 Low quality third Average response $199 $149 $197 $176 $225 $217 $214 $195 $222 $195 Range of responses 117-185 170-235 100-240 200-250 175-250 170-250 150-240 150-275 130-250
Typical Corn Yield, bu. per acre High third 169 165 163 176 174 175 174 161 186 151 Middle third 148 145 139 156 154 156 150 139 167 123 Low third 121 125 113 135 126 130 122 109 142 88
Average Rents per 5 Year Average Yield or CSR2 Rent per bu. of corn yield $1.60 $1.30 $1.71 $1.52 $1.67 $1.65 $1.66 $1.59 $1.60 $1.72 Rent per bu. of bean yield $5.20 $4.07 $5.47 $4.98 $5.62 $5.50 $5.38 $5.13 $5.31 $5.37 Rent per CSR2 index point $3.03 $2.35 $3.42 $2.95 $3.18 $3.14 $3.16 $2.84 $3.29 $2.92
Typical Cash Rent for Oats, Hay, and Pasture, $ per acre** Alfalfa hay, established $136 $100 $150 $141 $216 Grass hay, established $103 $79 $90 Oats $117 $103 Improved perm. pasture $96 $82 $88 $84 $156 $86 Unimproved perm. pasture $66 $60 $63 $68 $62 $98 Pasture, $/AUM NA Cornstalk grazing $15 $10 Hunting rights $20
2015 CASH RENTAL SURVEY FOR CROP REPORTING DISTRICT 7

DRA
FT
Page 10Cash Rental Rates for Iowa - 2015 Survey
* Number of responses is the number of individuals who provided information about typical rental rates in the county. Rental data was not collected by individual farm.** No values are reported if fewer than five responses were received.
CountyDistrictAverage
Appanoose, Decatur, Wayne Clarke Lucas Madison Marion Monroe Ringgold Union Warren
Number of responses* 77 15 7 8 14 8 5 6 6 8 2010 - 2014 avg. corn yield 121 110 112 109 137 142 110 114 129 130 2010 - 2014 avg. bean yield 41 38 40 40 43 47 40 41 44 45 Avg. row crop CSR2 index 78 72 76 77 87 81 79 73 84 86
Typical Cash Rent for Corn and Soybeans, $ per tillable acre
Overall average $187 $169 $169 $178 $207 $206 $151 $187 $210 $205 High quality third Average response $228 $201 $208 $214 $243 $256 $205 $225 $247 $256 Range of responses 180-225 180-240 160-260 144-360 180-300 170-250 185-300 215-315 200-308 Medium quality third Average response $187 $171 $167 $181 $206 $209 $143 $183 $208 $216 Range of responses 150-210 140-200 135-220 122-300 140-250 125-150 150-235 162-260 158-250 Low quality third Average response $145 $133 $132 $139 $171 $151 $106 $153 $174 $145 Range of responses 110-175 90-170 120-190 92-250 110-200 100-125 125-225 121-220 109-200
Typical Corn Yield, bu. per acre High third 138 126 123 124 160 156 130 122 153 147 Middle third 112 95 98 96 136 131 102 98 127 122 Low third 84 71 71 76 102 102 82 75 90 87
Average Rents per 5 Year Average Yield or CSR2 Rent per bu. of corn yield $1.54 $1.54 $1.51 $1.63 $1.51 $1.45 $1.37 $1.64 $1.63 $1.58 Rent per bu. of bean yield $4.44 $4.45 $4.23 $4.45 $4.81 $4.38 $3.78 $4.56 $4.77 $4.56 Rent per CSR2 index point $2.35 $2.35 $2.22 $2.31 $2.38 $2.54 $1.91 $2.56 $2.50 $2.38
Typical Cash Rent for Oats, Hay, and Pasture, $ per acre** Alfalfa hay, established $101 $78 $115 Grass hay, established $73 $54 $84 Oats $113 Improved perm. pasture $72 $65 $76 $67 $80 $51 $73 $101 Unimproved perm. pasture $46 $40 $43 $47 $57 Pasture, $/AUM $26 Cornstalk grazing $12 $17 Hunting rights $15 $21
2015 CASH RENTAL SURVEY FOR CROP REPORTING DISTRICT 8

Page 11Cash Rental Rates for Iowa - 2015 Survey
* Number of responses is the number of individuals who provided information about typical rental rates in the county. Rental data was not collected by individual farm.** No values are reported if fewer than five responses were received.
CountyDistrictAverage
Davis & Van Buren
DesMoines Henry Jefferson
Keokuk & Mahaska Lee Louisa Wapello
Wash-ington
Number of responses* 95 10 9 13 9 14 11 10 7 12 2010 - 2014 avg. corn yield 142 120 153 144 132 150 134 157 133 154 2010 - 2014 avg. bean yield 47 41 50 49 44 48 45 49 44 51 Avg. row crop CSR2 index 81 75 84 82 81 82 78 79 81 83
Typical Cash Rent for Corn and Soybeans, $ per tillable acre
Overall average $217 $158 $235 $226 $208 $241 $178 $208 $222 $276 High quality third Average response $271 $196 $288 $275 $264 $309 $229 $261 $270 $345 Range of responses 145-250 220-350 220-350 150-350 250-400 135-300 200-385 225-325 300-450 Medium quality third Average response $224 $158 $236 $225 $199 $241 $180 $201 $235 $279 Range of responses 95-200 180-260 150-275 125-225 200-300 100-225 150-250 200-300 220-350 Low quality third Average response $169 $119 $182 $179 $162 $174 $127 $161 $160 $204 Range of responses 90-175 150-225 125-200 100-205 135-200 65-175 125-185 150-190 160-275
Typical Corn Yield, bu. per acre High third 162 128 170 160 152 166 159 176 142 170 Middle third 135 103 147 134 118 143 127 152 118 143 Low third 101 71 119 100 87 113 92 123 81 95
Average Rents per 5 Year Average Yield or CSR2 Rent per bu. of corn yield $1.55 $1.32 $1.54 $1.57 $1.58 $1.61 $1.33 $1.32 $1.67 $1.79 Rent per bu. of bean yield $4.71 $3.85 $4.70 $4.61 $4.73 $5.02 $3.96 $4.24 $5.05 $5.41 Rent per CSR2 index point $2.76 $2.11 $2.80 $2.76 $2.57 $2.94 $2.28 $2.63 $2.74 $3.33
Typical Cash Rent for Oats, Hay, and Pasture, $ per acre**
Alfalfa hay, established $132 $132 Grass hay, established $93 $57 $105 Oats $107 Improved perm. pasture $73 $71 $73 Unimproved perm. pasture $46 $40 $50 Pasture, $/AUM NA Cornstalk grazing $11 Hunting rights $17
2015 CASH RENTAL SURVEY FOR CROP REPORTING DISTRICT 9

DRA
FT
Page 12Cash Rental Rates for Iowa - 2015 Survey
* Number of responses is the number of individuals who provided information about typical rental rates in the county. Rental data was not collected by individual farm.** No values are reported if fewer than five responses were received.
CountyState
Average
NorthwestDistrict 1Average
North Central District 2Average
NortheastDistrict 3Average
West CentralDistrict 4Average
CentralDistrict 5Average
East CentralDistrict 6Average
SouthwestDistrict 7Average
South CentralDistrict 8Average
SoutheastDistrict 9Average
Number of responses* 1,437 224 222 140 163 246 172 98 77 95 2010 - 2014 avg. corn yield 163 174 167 170 162 165 166 151 121 142 2010 - 2014 avg. bean yield 49 50 47 51 48 50 53 46 41 47 Avg. row crop CSR2 index 82 87 84 81 79 86 82 80 78 81
Typical Cash Rent for Corn and Soybeans, $ per tillable acre
Overall average $246 $259 $254 $273 $265 $261 $255 $242 $187 $217 Irrigated land average $279 $316 $250 High quality third Average response $292 $296 $297 $325 $309 $304 $307 $285 $228 $271 Medium quality third Average response $247 $261 $254 $274 $266 $261 $255 $241 $187 $224 Low quality third Average response $200 $220 $210 $220 $220 $216 $202 $199 $145 $169
Typical Corn Yield, bu. per acre
High third 176 194 184 186 187 186 182 169 138 162 Middle third 156 178 167 165 169 167 161 148 112 135 Low third 129 156 146 134 144 140 132 121 84 101
Average Rents per 5 Year Average Yield or CSR2
Rent per bu. of corn yield $1.56 $1.49 $1.52 $1.61 $1.63 $1.58 $1.54 $1.60 $1.54 $1.55 Rent per bu. of bean yield $5.08 $5.15 $5.38 $5.31 $5.48 $5.24 $4.83 $5.20 $4.44 $4.71 Rent per CSR2 index point $3.00 $2.98 $3.02 $3.39 $3.37 $3.02 $3.12 $3.03 $2.35 $2.76
Typical Cash Rent for Oats, Hay, and Pasture, $ per acre**
Alfalfa hay, established $182 $192 $221 $290 $190 $176 $198 $136 $101 $132 Grass hay, established $127 $129 $154 $188 $140 $118 $142 $103 $73 $93 Oats $156 $186 NA $219 $161 $147 $169 $117 $113 $107 Improved perm. pasture $81 $80 $61 $89 $94 $74 $88 $96 $72 $73 Unimproved perm. pasture $54 $52 $45 $64 $64 $47 $56 $66 $46 $46 Pasture, $/AUM $22 NA NA $17 $23 NA $20 NA $26 NA Cornstalk grazing $13 $7 NA $7 $7 $16 $12 $15 $12 $11 Hunting rights $16 NA $11 $24 $12 $20 $15 $20 $15 $17
2015 CASH RENTAL SURVEY SUMMARY BY CROP REPORTING DISTRICT