Embed Size (px)
Citation preview
Case Study: UK Drinks Sector
Resource efficiency in the UK soft
drinks sector
Reducing water, material and packaging use in the soft drinks and
fruit juice sector.
Resource efficiency in the UK soft drinks sector 2
WRAP’s vision is a world without waste, where resources are used sustainably. We work with businesses, individuals and communities to help them reap the benefits of reducing waste, developing sustainable products and using resources in an efficient way. Find out more at www.wrap.org.uk
Document reference: [e.g. WRAP, 2006, Report Name (WRAP Project TYR009-19. Report prepared by…..Banbury, WRAP]
Front cover photography: [Add description or title of image.]
While we have tried to make sure this is accurate, we cannot accept responsibility or be held legally responsible for any loss or damage arising out of or in connection
with this information being inaccurate, incomplete or misleading. This material is copyrighted. You can copy it free of charge as long as the material is accurate and
not used in a misleading context. You must identify the source of the material and acknowledge our copyright. You must not use material to endorse or suggest we
have endorsed a commercial product or service. For more details please see our terms and conditions on our website at www.wrap.org.uk
Resource efficiency in the UK soft drinks sector 3
Contents
Contents .................................................................................... 3
Research Review ....................................................................... 4
Water use ........................................................................................ 6
Waste water ..................................................................................... 7
Organic resource .............................................................................. 8
Conclusions .................................................................................... 10
Resource efficiency in the UK soft drinks sector 4
Research Review
Soft drinks1 production in the UK is dominated by two global giants,
Coca-Cola Enterprises (CCE) and Britvic Soft Drinks. Through the British
Soft Drinks Association Sustainability Strategy both companies have
reported improvements in resource efficiency. Progress has also been
made by many other of the Association’s member companies.
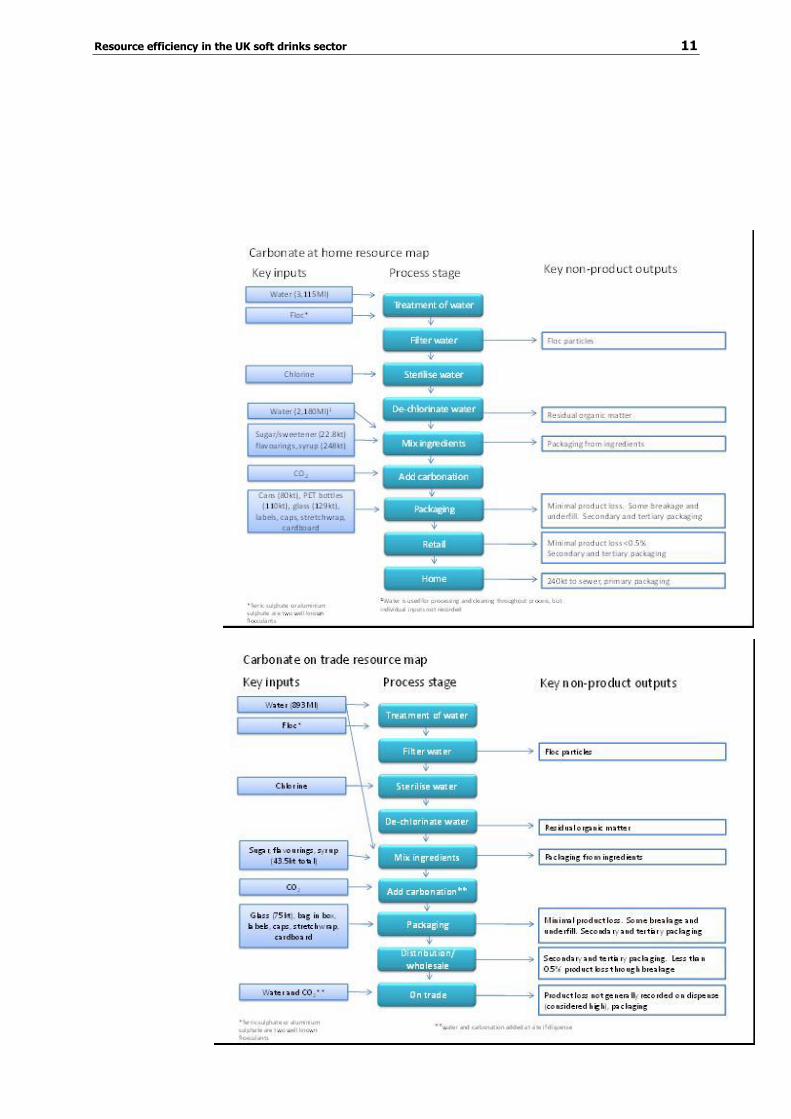
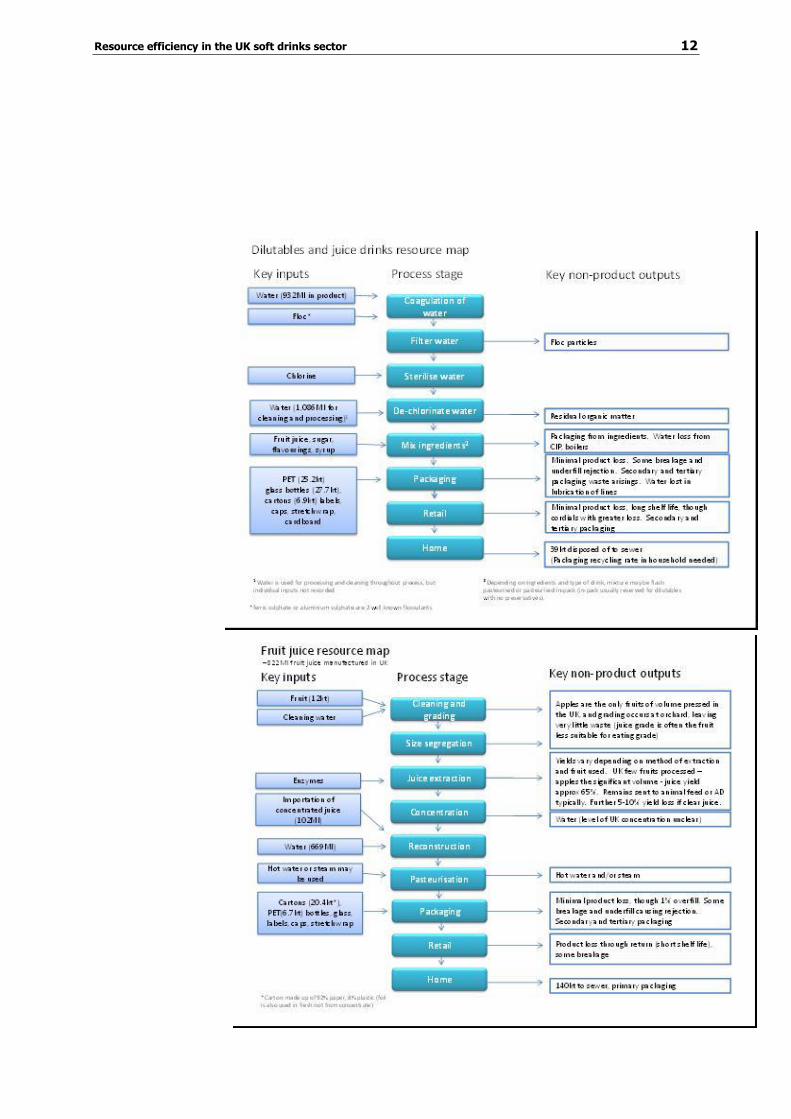
Four Resource Maps have been produced covering carbonated soft
drinks (one for the off-trade and one for the on-trade), still and soft
drinks and fruit juices. Each map shows the key inputs for different
production stages and the waste and loss streams that result. These
maps are included at the end of this review.
The Soft Drinks industry is now producing a ‘Road Map’ to further drive
its work on improving resource efficiency.
This document highlights some of the hotspots of resource consumption
and provides guidance for improving resource efficiency.
Key opportunities
2,380 tonnes of shrink-wrap conserved equates to a sector saving of
£3.4m
Average yield loss of raw ingredients, within the production process
is 7%
Exploring collaborative opportunities with customers to prevent
waste and improve supply chain efficiency
Product losses
Unlike the raw ingredients used for alcoholic drinks, the cost of
ingredients for some soft drinks can be modest and hence production
throughput and on-time delivery are often given priority over yield rates.
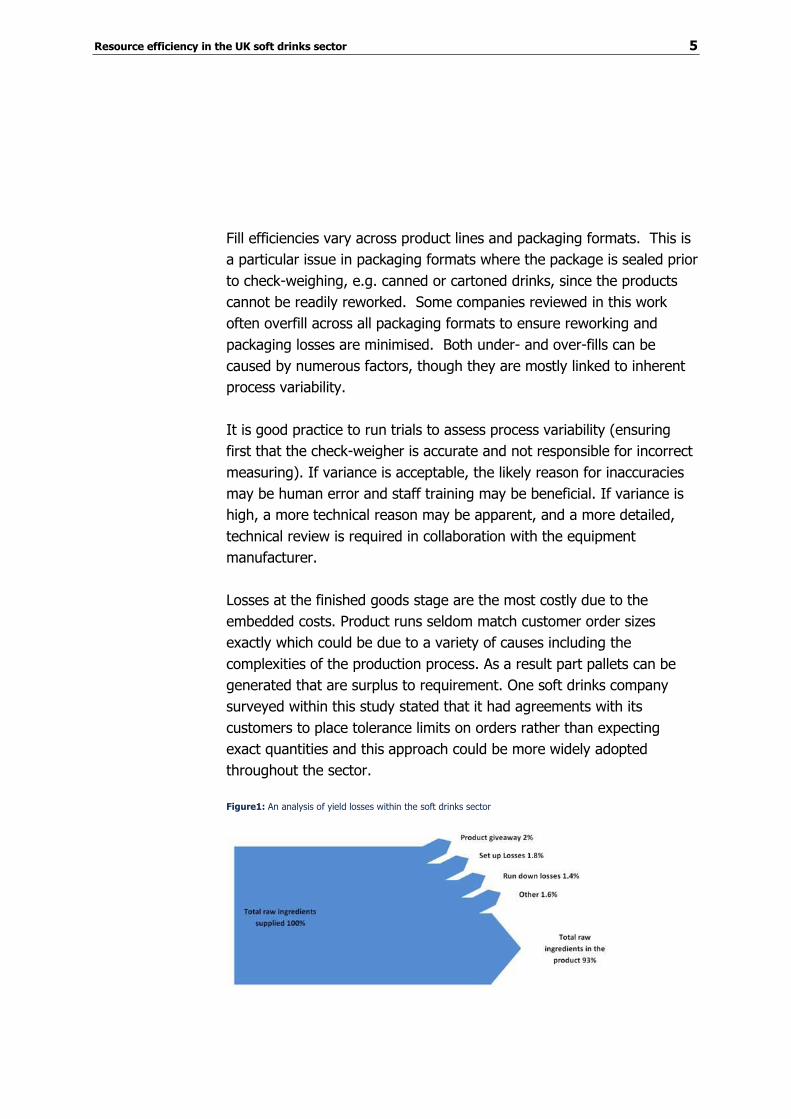
Figure below shows that the average yield loss of raw ingredients, within
the production process is 7%, with the three significant causes of yield
losses being: product giveaway, set-up losses and run-down losses.
1 For the purposes of this document, the term ‘soft drinks’ refers to carbonates, juice drinks and
dilutable drinks (squash and cordial). Bottled water is not included in the figures, unless
otherwise stated, but many of the guidance points may be relevant.
Resource efficiency in the UK soft drinks sector 5
Fill efficiencies vary across product lines and packaging formats. This is
a particular issue in packaging formats where the package is sealed prior
to check-weighing, e.g. canned or cartoned drinks, since the products
cannot be readily reworked. Some companies reviewed in this work
often overfill across all packaging formats to ensure reworking and
packaging losses are minimised. Both under- and over-fills can be
caused by numerous factors, though they are mostly linked to inherent
process variability.
It is good practice to run trials to assess process variability (ensuring
first that the check-weigher is accurate and not responsible for incorrect
measuring). If variance is acceptable, the likely reason for inaccuracies
may be human error and staff training may be beneficial. If variance is
high, a more technical reason may be apparent, and a more detailed,
technical review is required in collaboration with the equipment
manufacturer.
Losses at the finished goods stage are the most costly due to the
embedded costs. Product runs seldom match customer order sizes
exactly which could be due to a variety of causes including the
complexities of the production process. As a result part pallets can be
generated that are surplus to requirement. One soft drinks company
surveyed within this study stated that it had agreements with its
customers to place tolerance limits on orders rather than expecting
exact quantities and this approach could be more widely adopted
throughout the sector.
Figure1: An analysis of yield losses within the soft drinks sector
Resource efficiency in the UK soft drinks sector 6
To meet customers’ needs for smaller pack sizes innovation will be
required across the supply chain to ensure that overall packaging use
does not increase.
Typically, primary packaging accounts for over 70% of all the packaging
used within the drinks sector and the light-weighting of primary
packaging is a well proven resource efficiency initiative. However, as in
many sectors, there is typically less focus on secondary and tertiary
packaging than on primary.
Stretch-wrap is used across all sectors to stabilise pallet loads, yet little
attention is given to efficient usage, resulting in excessive plastic
consumption. Within the soft drinks sector, an estimated 2,380 tonnes
of stretch wrap could be saved by improved working practices,
achievable by ensuring the correct equipment is used, staff are trained
and machinery is set up correctly. Based on the April 2011 price of
virgin plastic film, 2,380 tonnes of wrap conserved equates to a sector
saving of £3.4 million.
Water use
Britvic and CCE consume water at approximately 1.4 litres per litre of
product, but outside of these ‘leaders’ the typical water use is currently
2.3l/l (with the exception of fruit juice, which can range between 0.5-
5l/l, largely depending on whether ‘not from concentrate’ (NFC) or
‘concentrate’ is used. Some smaller companies consumed more than
three times the water used by the ‘leaders’, though ‘best in class’ is not
always feasible on a smaller scale. Small companies may still offer a
wide product range but have to manufacture on fewer lines and with
smaller production runs. This requires more frequent wash downs and
lower efficiency than achieved with dedicated lines.
Differentiation has led to the development of large ranges. Where these
exist it is recommended that, to ensure efficiency of production, a
Pareto analysis of sales (quantity of units sold) by stock keeping unit
(SKU) is carried out. If this analysis shows a long ‘tail’, then a large
Resource efficiency in the UK soft drinks sector 7
number of lower-selling SKUs are responsible for a small percentage of
overall sales turn-over (e.g. the top 20 SKUs may cover 80% of sales, so
any SKUs outside this group should be reviewed for their contribution to
overall waste). This may indicate that there is possible scope for product
rationalisation, allowing longer run times, fewer changeovers and less
waste.
Clean In Place (CIP)
CIP is a critical use of water, with organic materials present in fruit juice
in particular requiring more intense cleaning, requiring about 1-2l/l of
product2. Areas to review include:
optimising plant process design;
removing product and gross soiling prior to cleaning;
incorporating the internal recycling of water and chemicals;
staff training;
carefully setting operating programmes, which coincide with the real
cleaning requirements of the process;
minimising detergent loss to drain; and
using water-efficient spray devices.
CIP systems can be complex, especially if multiple systems are in place.
It is recommended that a CIP engineer visit the site to ensure current
systems are working at their optimum to avoid unnecessary investment
in retrofitting newer systems.
Waste water
Wastewater in soft drinks is a heterogeneous mixture of sugars, artificial
sweetener, fruit juice concentrates, flavouring agents, carbon dioxide,
bicarbonates, colouring agents, preservatives and mineral salts used in
manufacturing operations, giving high Chemical Oxygen Demand (COD)
levels. It should be treated or diluted before discharge to sewer as
onsite recovery can offer value through anaerobic digestion and
reducing discharge costs.
2 Industry input, 2011
Resource efficiency in the UK soft drinks sector 8
Organic resource
Fruits and vegetable juices for soft drink and fruit juice manufacture are
largely imported, and there is little waste associated with blending
carried out in the UK. For example, UK fruit juice manufacture is largely
based on the importation of fruit juice which is either supplied in
concentrated form to improve transportation efficiencies, with the water
added back in the UK, or in NFC form.
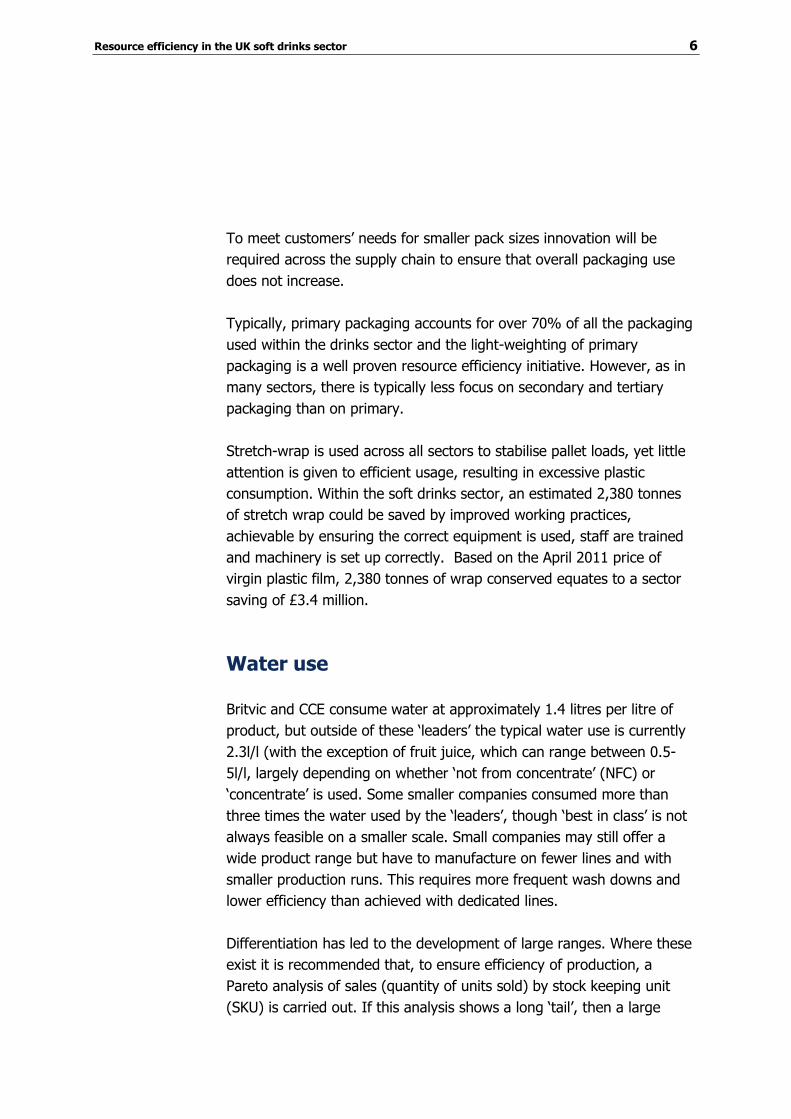
Figure 2: Apples for pressing. Few juices are pressed in the UK, with import of juice or concentrate used for
most soft drinks consumed in the country. Image courtesy of NACM.
The main exception to this is apple juice, where the fruit is grown in the
UK and pressed by several companies within the UK.
The 36,000 tonnes of pulpy remains, or pomace, generated during the
pressing process as a by-product has value as animal feed (some 31,000
tonnes including cider pomace are used this way) or as feedstock for
anaerobic digestion (AD) plants. No pomace is sent to landfill.
The typical yield when pressing harvested apples is around 65%
(although this can be 5-10% lower if clear juice is produced). Yield
rates can be improved with more advanced equipment, with some
companies claiming 70% yields, though this was feasible only on a large
scale, or through more expensive technology such as heat exchangers
or enzyme treatment. Typically, SMEs achieve yields of between 55-65%
for apples, with other fruit and vegetable yields varying, though the
scales of pressing are small.
Resource efficiency in the UK soft drinks sector 9
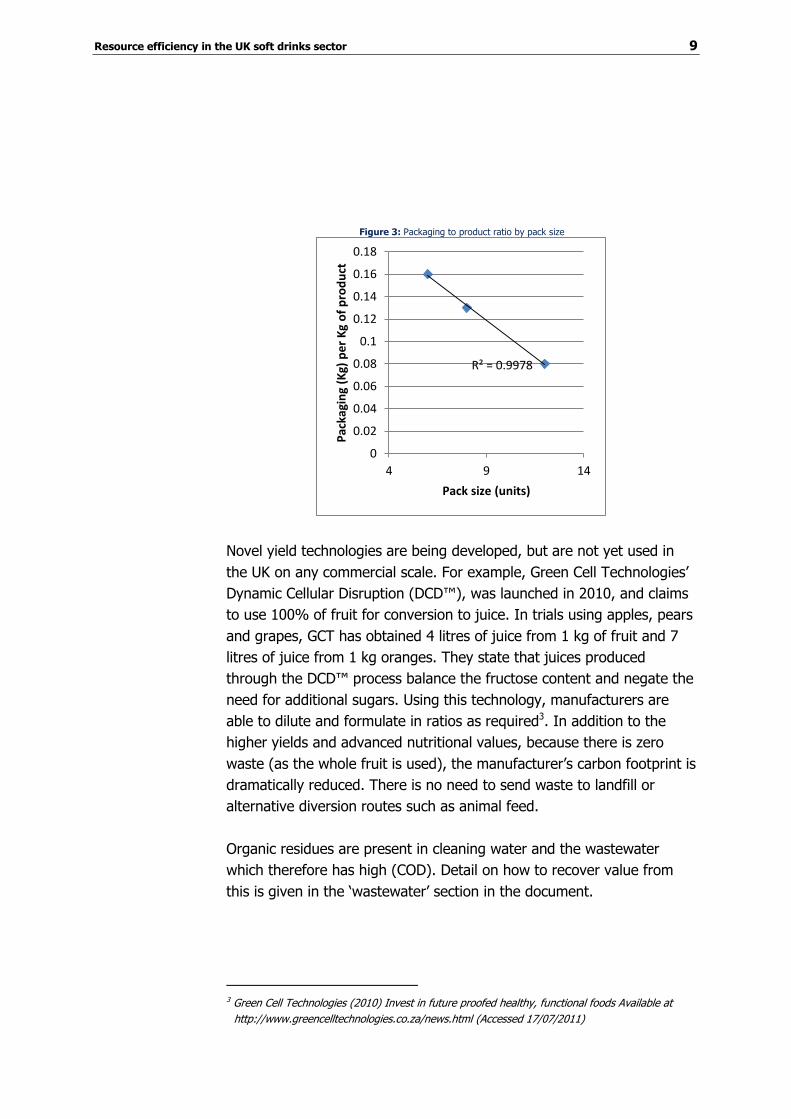
Figure 3: Packaging to product ratio by pack size
Novel yield technologies are being developed, but are not yet used in
the UK on any commercial scale. For example, Green Cell Technologies’
Dynamic Cellular Disruption (DCD™), was launched in 2010, and claims
to use 100% of fruit for conversion to juice. In trials using apples, pears
and grapes, GCT has obtained 4 litres of juice from 1 kg of fruit and 7
litres of juice from 1 kg oranges. They state that juices produced
through the DCD™ process balance the fructose content and negate the
need for additional sugars. Using this technology, manufacturers are
able to dilute and formulate in ratios as required3. In addition to the
higher yields and advanced nutritional values, because there is zero
waste (as the whole fruit is used), the manufacturer’s carbon footprint is
dramatically reduced. There is no need to send waste to landfill or
alternative diversion routes such as animal feed.
Organic residues are present in cleaning water and the wastewater
which therefore has high (COD). Detail on how to recover value from
this is given in the ‘wastewater’ section in the document.
3 Green Cell Technologies (2010) Invest in future proofed healthy, functional foods Available at
http://www.greencelltechnologies.co.za/news.html (Accessed 17/07/2011)
R² = 0.9978
0
0.02
0.04
0.06
0.08
0.1
0.12
0.14
0.16
0.18
4 9 14
Pac
kagi
ng
(Kg)
pe
r K
g o
f p
rod
uct
Pack size (units)
Resource efficiency in the UK soft drinks sector 10
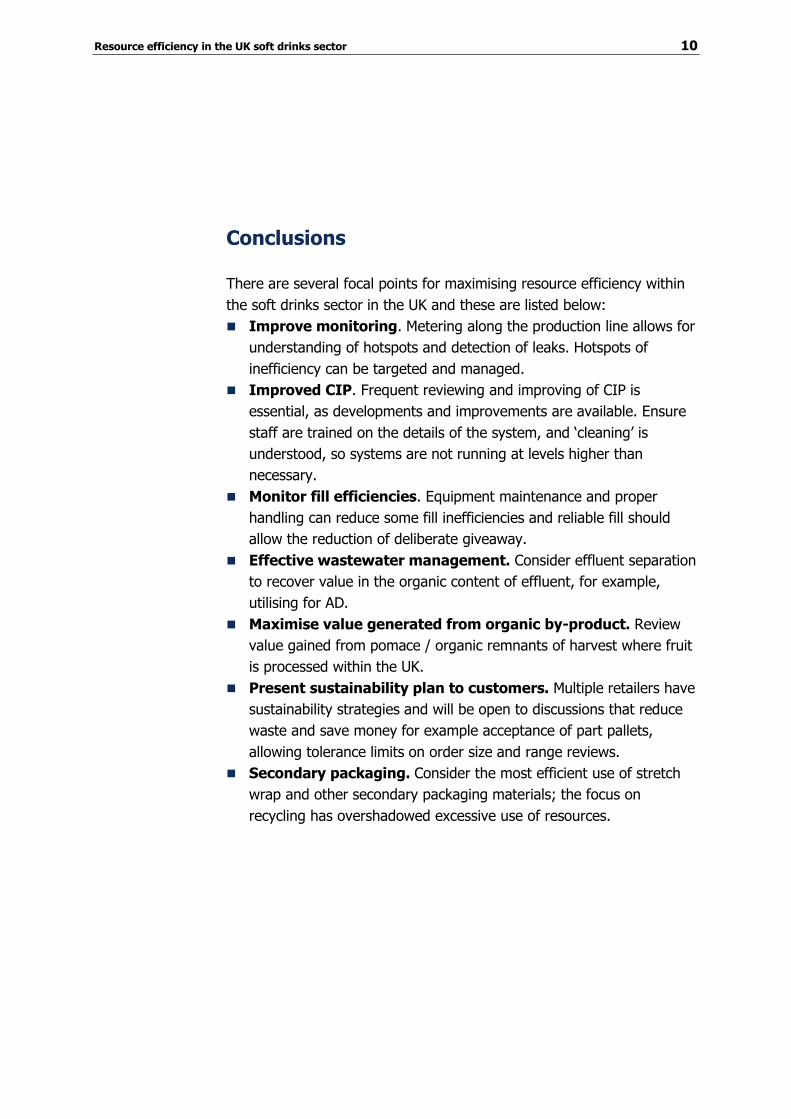
Conclusions
There are several focal points for maximising resource efficiency within
the soft drinks sector in the UK and these are listed below:
Improve monitoring. Metering along the production line allows for
understanding of hotspots and detection of leaks. Hotspots of
inefficiency can be targeted and managed.
Improved CIP. Frequent reviewing and improving of CIP is
essential, as developments and improvements are available. Ensure
staff are trained on the details of the system, and ‘cleaning’ is
understood, so systems are not running at levels higher than
necessary.
Monitor fill efficiencies. Equipment maintenance and proper
handling can reduce some fill inefficiencies and reliable fill should
allow the reduction of deliberate giveaway.
Effective wastewater management. Consider effluent separation
to recover value in the organic content of effluent, for example,
utilising for AD.
Maximise value generated from organic by-product. Review
value gained from pomace / organic remnants of harvest where fruit
is processed within the UK.
Present sustainability plan to customers. Multiple retailers have
sustainability strategies and will be open to discussions that reduce
waste and save money for example acceptance of part pallets,
allowing tolerance limits on order size and range reviews.
Secondary packaging. Consider the most efficient use of stretch
wrap and other secondary packaging materials; the focus on
recycling has overshadowed excessive use of resources.
Resource efficiency in the UK soft drinks sector 11
Resource efficiency in the UK soft drinks sector 12

www.wrap.org.uk/retail


![Defense department-strategic-guidance-010512[1]](https://img.pdfslide.us/doc/110x75/5561860bd8b42ace7d8b4574/defense-department-strategic-guidance-0105121.jpg)