Embed Size (px)
Citation preview

Case Study Fall 2021 Group & Health Finance & Valuation, Segment A Exam
Copyright © 2021 Society of Actuaries
GHFVA

Society of Actuaries – Case Study, Group & Health Finance & Valuation US Exam
Page | 2
Contents Introduction ................................................................................................................................................... 3
Firm Description ........................................................................................................................................... 3
Quantum Health Insurance Company (Quantum) ........................................................................................ 4
Casino Royale Health & Life Insurance Company (Royale Health) ........................................................ 122
Goldfinger Insurance Company (GIC) ...................................................................................................... 20
The Thunderball Corporation (Thunderball) ........................................................................................... 288
Live Twice, Inc. (Live Twice) .................................................................................................................. 333
Another Day, Inc. (Another Day) ............................................................................................................. 344

Society of Actuaries – Case Study, Group & Health Finance & Valuation US Exam
Page | 3
Case Study – Group & Health Finance & Valuation Exam Introduction In this case study, you are the President at the Skyfall Actuarial Consulting firm (Skyfall or Firm). The case study will outline the characteristics of the Firm and provide details regarding the various current clients and prospective clients of Skyfall.
All numbers found in this case study are for illustrative purposes only and are not representative of true costs or actual relationships. Any similarities with actual company results are coincidental. Plan design and plan limitations for a given plan year may not be in compliance with current year guidance, regulations, or laws.
Firm Description Skyfall is a medium-sized consulting firm that was founded in London, Texas and provides actuarial services to life and health insurance companies, state and federal regulatory agencies, and employers. The Firm’s staff consists of over 50 actuaries that are located in the United States. The firm employs several actuarial students, who assist in daily tasks and client management. Skyfall is committed to the development and training of future actuaries, and this can be seen in the level of training and types of projects that actuarial students assist with.
Additionally, Skyfall has a location in London, Ontario, which provides actuarial services to clients, employers and insurance carriers in Canada. The Canadian office consists of over 25 actuaries that are located throughout Canada.
The Firm’s areas of expertise include:
• Individual and Small Group Major Medical Plans • Large Group Major Medical Plans • Medicare Advantage and Part D Plans • Medicaid Plans • Retiree Health Benefit Plans • Group Disability Plans • Individual and Small Group Dental Plans • Large Group Dental Plans • Group Life • Group Long-Term Care.
The corporate goal is to provide affordable and quality actuarial services to its clients to ensure that they have the tools to be successful in their business endeavors. Skyfall aims to build long-lasting client relationships and strives to provide excellent services for its clients. Due to its size, the Firm caters to individual client’s unique needs and aims to exceed the client’s expectations.

Society of Actuaries – Case Study, Group & Health Finance & Valuation US Exam
Page | 4
Skyfall’s Clients Quantum Health Insurance Company (Quantum) Quantum Health Insurance Company provides individual and small group coverage to its policyholders. Since its inception, Quantum has provided health care services to individuals and small groups and actively seeks to improve the overall health of its members. Skyfall’s services include the development and pricing of its products, regulatory compliance guidance, and valuation services.
Individual and Small Group Major Medical Plans Quantum is actively selling individual and small group health insurance products in most states in the US. Quantum offers various benefit plan design structures; some of which are compliant with the Affordable Care Act (ACA). The products are sold through brokers and agents.
Quantum offers several types of major medical plans, such as HMOs, PPOs, and High Deductible Health Plans (HDHP), and some are still available for new business, while others are not. The closed block (no longer actively sold) is called Quantum Legacy III. The products that are actively being sold are the HMO and PPO products that are ACA-compliant.
Skyfall has been the opining actuary for Quantum and has been calculating the reserves for all blocks of business. The following exhibits are various tables used in the last reserve calculation exercise. The Company provided the paid claims data incurred between July Year 3 and December Year 4 with paid data through December Year 4. These exhibits are various steps in the reserve calculation process.

Society of Actuaries – Case Study, Group & Health Finance & Valuation US Exam
Page | 5
Exhibit 1 - Monthly Claims Experience
Paid MonthJul-Year 3 Aug-Year 3 Sep-Year 3 Oct-Year 3 Nov-Year 3 Dec-Year 3 Jan-Year 4 Feb-Year 4 Mar-Year 4 Apr-Year 4 May-Year 4 Jun-Year 4 Jul-Year 4 Aug-Year 4 Sep-Year 4 Oct-Year 4 Nov-Year 4 Dec-Year 4 Total
Jul-Year 3 31,000 725,000 590,000 217,000 152,000 38,000 23,000 20,000 24,000 11,000 10,000 2,000 0 0 0 0 0 0 1,843,000Aug-Year 3 0 54,000 652,000 749,000 246,000 80,000 17,000 16,000 12,000 19,000 14,000 7,000 5,000 0 0 0 0 0 1,871,000Sep-Year 3 0 0 56,000 763,000 965,000 338,000 74,000 33,000 34,000 14,000 9,000 3,000 4,000 5,000 0 0 0 0 2,298,000Oct-Year 3 0 0 0 44,000 755,000 920,000 287,000 31,000 61,000 44,000 12,000 3,000 2,000 8,000 18,000 0 0 0 2,185,000
Nov-Year 3 0 0 0 0 43,000 844,000 1,035,000 214,000 160,000 67,000 14,000 19,000 9,000 19,000 8,000 4,000 0 0 2,436,000Dec-Year 3 0 0 0 0 0 47,000 725,000 668,000 216,000 75,000 16,000 11,000 1,000 5,000 5,000 11,000 2,000 0 1,782,000Jan-Year 4 0 0 0 0 0 0 31,000 625,000 591,000 258,000 290,000 23,000 8,000 7,000 39,000 6,000 1,000 9,000 1,888,000Feb-Year 4 0 0 0 0 0 0 0 19,000 483,000 398,000 97,000 42,000 15,000 16,000 46,000 9,000 1,000 5,000 1,131,000Mar-Year 4 0 0 0 0 0 0 0 0 19,000 810,000 521,000 156,000 50,000 15,000 16,000 33,000 2,000 7,000 1,629,000Apr-Year 4 0 0 0 0 0 0 0 0 0 34,000 367,000 383,000 226,000 137,000 29,000 50,000 13,000 13,000 1,252,000
May-Year 4 0 0 0 0 0 0 0 0 0 0 23,000 432,000 432,000 405,000 133,000 32,000 17,000 15,000 1,489,000Jun-Year 4 0 0 0 0 0 0 0 0 0 0 0 29,000 306,000 306,000 338,000 138,000 188,000 16,000 1,321,000Jul-Year 4 0 0 0 0 0 0 0 0 0 0 0 0 43,000 349,000 375,000 283,000 76,000 40,000 1,166,000
Aug-Year 4 0 0 0 0 0 0 0 0 0 0 0 0 0 42,000 451,000 453,000 200,000 84,000 1,230,000Sep-Year 4 0 0 0 0 0 0 0 0 0 0 0 0 0 0 73,000 527,000 568,000 232,000 1,400,000Oct-Year 4 0 0 0 0 0 0 0 0 0 0 0 0 0 0 0 37,000 383,000 560,000 980,000
Nov-Year 4 0 0 0 0 0 0 0 0 0 0 0 0 0 0 0 0 66,000 803,000 869,000Dec-Year 4 0 0 0 0 0 0 0 0 0 0 0 0 0 0 0 0 0 499,000 499,000
Total 31,000 779,000 1,298,000 1,773,000 2,161,000 2,267,000 2,192,000 1,626,000 1,600,000 1,730,000 1,373,000 1,110,000 1,101,000 1,314,000 1,531,000 1,583,000 1,517,000 2,283,000 27,269,000
Quantum Legacy III - Individual
Incu
rred
Mon
th
Exhibit 1 (con't) - Monthly Claims Experience
Paid MonthJul-Year 3 Aug-Year 3 Sep-Year 3 Oct-Year 3 Nov-Year 3 Dec-Year 3 Jan-Year 4 Feb-Year 4 Mar-Year 4 Apr-Year 4 May-Year 4 Jun-Year 4 Jul-Year 4 Aug-Year 4 Sep-Year 4 Oct-Year 4 Nov-Year 4 Dec-Year 4 Total
Jul-Year 3 14,000 321,000 299,000 102,000 49,000 19,000 9,000 9,000 6,000 5,000 14,000 1,000 0 0 0 0 0 0 848,000Aug-Year 3 0 32,000 427,000 364,000 177,000 50,000 15,000 12,000 7,000 15,000 13,000 3,000 1,000 0 0 0 0 0 1,116,000Sep-Year 3 0 0 21,000 276,000 389,000 128,000 30,000 14,000 9,000 6,000 4,000 4,000 1,000 5,000 0 0 0 0 887,000Oct-Year 3 0 0 0 13,000 240,000 301,000 94,000 9,000 23,000 16,000 6,000 1,000 1,000 3,000 4,000 0 0 0 711,000
Nov-Year 3 0 0 0 0 14,000 312,000 354,000 67,000 74,000 27,000 6,000 7,000 4,000 11,000 5,000 2,000 0 0 883,000Dec-Year 3 0 0 0 0 0 17,000 331,000 312,000 100,000 17,000 7,000 5,000 3,000 1,000 4,000 7,000 1,000 0 805,000Jan-Year 4 0 0 0 0 0 0 14,000 304,000 295,000 125,000 162,000 11,000 3,000 4,000 21,000 4,000 1,000 5,000 949,000Feb-Year 4 0 0 0 0 0 0 0 13,000 297,000 277,000 67,000 15,000 7,000 3,000 9,000 10,000 1,000 4,000 703,000Mar-Year 4 0 0 0 0 0 0 0 0 11,000 450,000 292,000 84,000 25,000 7,000 6,000 14,000 8,000 3,000 900,000Apr-Year 4 0 0 0 0 0 0 0 0 0 18,000 220,000 244,000 151,000 113,000 16,000 33,000 16,000 10,000 821,000
May-Year 4 0 0 0 0 0 0 0 0 0 0 13,000 241,000 250,000 254,000 72,000 12,000 11,000 10,000 863,000Jun-Year 4 0 0 0 0 0 0 0 0 0 0 0 19,000 183,000 213,000 237,000 103,000 140,000 8,000 903,000Jul-Year 4 0 0 0 0 0 0 0 0 0 0 0 0 28,000 246,000 280,000 208,000 58,000 28,000 848,000
Aug-Year 4 0 0 0 0 0 0 0 0 0 0 0 0 0 27,000 317,000 346,000 151,000 49,000 890,000Sep-Year 4 0 0 0 0 0 0 0 0 0 0 0 0 0 0 41,000 324,000 352,000 153,000 870,000Oct-Year 4 0 0 0 0 0 0 0 0 0 0 0 0 0 0 0 18,000 205,000 339,000 562,000
Nov-Year 4 0 0 0 0 0 0 0 0 0 0 0 0 0 0 0 0 70,000 882,000 952,000Dec-Year 4 0 0 0 0 0 0 0 0 0 0 0 0 0 0 0 0 0 470,000 470,000
Total 14,000 353,000 747,000 755,000 869,000 827,000 847,000 740,000 822,000 956,000 804,000 635,000 657,000 887,000 1,012,000 1,081,000 1,014,000 1,961,000 14,981,000
HMO - Individual (ACA-Compliant)
Incu
rred
Mon
th

Society of Actuaries – Case Study, Group & Health Finance & Valuation US Exam
Page | 6
Exhibit 2 - Monthly Claims ExperiencePPO - Individual (ACA-Compliant)
Paid Claims PaidThrough Dec Year 4 Enrollment PMPM
Jul-Year 3 409,000 1,980 206.57 Aug-Year 3 491,000 1,980 247.98 Sep-Year 3 382,000 1,860 205.38 Oct-Year 3 294,000 1,620 181.48
Nov-Year 3 362,000 1,620 223.46 Dec-Year 3 347,000 1,620 214.20 Jan-Year 4 403,000 1,620 248.77 Feb-Year 4 289,000 2,040 141.67 Mar-Year 4 371,000 2,100 176.67 Apr-Year 4 357,000 2,040 175.00
May-Year 4 370,000 2,040 181.37 Jun-Year 4 400,000 2,100 190.48 Jul-Year 4 371,000 2,100 176.67
Aug-Year 4 395,000 2,100 188.10 Sep-Year 4 376,000 2,280 164.91 Oct-Year 4 246,000 2,280 107.89
Nov-Year 4 203,000 2,400 84.58 Dec-Year 4 102,000 2,640 38.64
Total 6,168,000
Incu
rred
Mon
th
Exhibit 3 - Enrollment - Individual
MonthQuantum Legacy
IIIHMO (ACA -Compliant)
PPO (ACA -Compliant)
Jul-Year 3 11,100 4,000 1,980Aug-Year 3 11,700 3,800 1,980Sep-Year 3 11,400 3,750 1,860Oct-Year 3 11,400 3,750 1,620
Nov-Year 3 11,400 3,750 1,620Dec-Year 3 11,400 4,050 1,620Jan-Year 4 11,800 4,100 1,620Feb-Year 4 11,800 4,050 2,040Mar-Year 4 12,000 4,100 2,100Apr-Year 4 12,000 4,150 2,040
May-Year 4 12,700 4,200 2,040Jun-Year 4 12,700 4,150 2,100Jul-Year 4 11,700 4,450 2,100
Aug-Year 4 11,900 4,450 2,100Sep-Year 4 12,100 4,600 2,280Oct-Year 4 12,300 4,850 2,280
Nov-Year 4 12,300 4,850 2,400Dec-Year 4 12,500 4,600 2,640

Society of Actuaries – Case Study, Group & Health Finance & Valuation US Exam
Page | 7
Exhibit 4 - Percent of Ultimate Losses by Lag Month
Lag Month1 2 3 4 5 6 7 8 9 10 11 12
Jul-Year 3 0.016 0.465 0.694 0.804 0.910 0.924 0.934 0.944 0.963 0.969 0.999 1.000Aug-Year 3 0.036 0.356 0.835 0.922 0.953 0.964 0.969 0.977 0.977 0.993 0.998 1.000Sep-Year 3 0.026 0.447 0.783 0.879 0.916 0.933 0.966 0.973 0.979 0.989 0.992 1.000Oct-Year 3 0.029 0.445 0.790 0.959 0.946 0.957 0.971 0.980 0.982 0.986 0.993 1.000Nov-Year 3 0.029 0.397 0.856 0.904 0.948 0.962 0.966 0.975 0.980 0.985 0.994 1.000Dec-Year 3 0.041 0.451 0.739 0.880 0.957 0.967 0.971 0.974 0.980 0.989 0.999 1.000Jan-Year 4 0.027 0.416 0.711 0.836 0.947 0.964 0.970 0.979 0.990 0.994 0.994 1.000Feb-Year 4 0.017 0.422 0.758 0.809 0.865 0.880 0.911 0.988 0.998 0.999 1.000Mar-Year 4 0.006 0.483 0.739 0.876 0.905 0.920 0.946 0.973 0.997 1.000Apr-Year 4 0.040 0.411 0.592 0.755 0.923 0.948 0.980 0.998 1.000May-Year 4 0.030 0.413 0.705 0.865 0.970 0.987 0.993 1.000
Quantum Legacy III - Small GroupIn
curre
d M
onth
Exhibit 4 (con't) - Percent of Ultimate Losses by Lag Month
Lag Month1 2 3 4 5 6 7 8 9 10 11 12
Jul-Year 3 0.017 0.375 0.740 0.862 0.931 0.961 0.973 0.984 0.991 0.998 0.999 1.000Aug-Year 3 0.025 0.385 0.727 0.889 0.948 0.959 0.971 0.978 0.995 0.997 0.999 1.000Sep-Year 3 0.023 0.306 0.760 0.932 0.966 0.980 0.986 0.992 0.995 0.995 0.999 1.000Oct-Year 3 0.019 0.329 0.780 0.891 0.927 0.963 0.986 0.991 0.992 0.993 0.995 1.000Nov-Year 3 0.013 0.350 0.763 0.841 0.928 0.967 0.973 0.984 0.987 0.993 0.995 1.000Dec-Year 3 0.020 0.426 0.836 0.946 0.973 0.986 0.994 0.993 0.994 0.994 0.999 1.000Jan-Year 4 0.012 0.316 0.628 0.768 0.950 0.960 0.964 0.966 0.991 0.994 0.995 1.000Feb-Year 4 0.017 0.445 0.797 0.908 0.937 0.950 0.954 0.978 0.991 0.992 1.000Mar-Year 4 0.015 0.517 0.858 0.938 0.967 0.976 0.979 0.995 0.996 1.000Apr-Year 4 0.022 0.275 0.630 0.818 0.896 0.920 0.968 0.985 1.000May-Year 4 0.013 0.266 0.558 0.870 0.956 0.971 0.988 1.000
HMO - Small Group (ACA-Compliant)
Incu
rred
Mon
th

Society of Actuaries – Case Study, Group & Health Finance & Valuation US Exam
Page | 8
Exhibit 5 - Age-to-Age FactorsPPO - Small Group (ACA-Compliant)
Incurred Lag MonthMonth 1 2 3 4 5 6 7 8 9 10 11 12
Jul-Year 3 12.039 1.655 1.299 1.090 1.114 1.013 1.004 1.027 1.014 1.116 1.003 - Aug-Year 3 12.231 2.112 1.199 1.200 1.015 1.013 1.020 1.002 1.026 1.037 1.057 - Sep-Year 3 23.283 1.894 1.191 1.190 1.020 1.021 1.014 1.011 1.028 1.044 1.037 - Oct-Year 3 5.845 1.593 1.171 1.183 1.025 1.031 1.013 1.001 1.014 1.070 1.078 - Nov-Year 3 11.674 2.469 1.806 1.033 1.086 1.004 1.050 1.001 1.109 1.026 1.071 - Dec-Year 3 12.605 1.516 1.163 1.117 1.093 1.022 1.002 1.004 1.032 1.056 1.005 - Jan-Year 4 14.917 1.581 1.121 1.240 1.022 1.004 1.031 1.025 1.026 1.019 1.048 - Feb-Year 4 17.920 1.936 1.173 1.115 1.014 1.022 1.124 1.029 1.024 1.031 - - Mar-Year 4 42.812 1.940 1.152 1.011 1.017 1.004 1.005 1.009 1.005 - - - Apr-Year 4 7.140 2.985 1.104 1.174 1.021 1.031 1.009 1.008 - - - - May-Year 4 5.167 1.936 1.301 1.106 1.258 1.046 1.009 - - - - -

Society of Actuaries – Case Study, Group & Health Finance & Valuation US Exam
Page | 9
**Quantum Email 1**
From: Dominic Greene <[email protected]> To: You <[email protected]> Sent: April 20, Year 5 Subject: Year 4 YE Financial Statements
We have finished our financial statements. I have enclosed several of the key pages. Let me know if you have any questions.
Dominic
Enclosures:

Society of Actuaries – Case Study, Group & Health Finance & Valuation US Exam
Page | 10
(In thousands) For the Years Ending December 31,Revenue Year 4 Year 3
Premiums 85,128 94,429 Individual HMO 22,637 18,257 Individual PPO 6,407 5,377 Individual Grandfathered 18,780 32,298
Total Individual 47,823 55,932 Small Group HMO 14,860 11,750 Small Group PPO 7,699 6,013 Small Group Grandfathered 14,747 20,734
Total Small Group 37,305 38,497 Administrative fees Income 32 22 Miscellaneous income 1,703 1,889 Total operating revenue 86,863 96,340 Net investment income 1,340 1,079 Total Revenues 88,203$ 97,419$
ExpensesBenefit expense 71,916 76,845
Individual HMO 19,500 14,372 Individual PPO 5,574 4,799 Individual Grandfathered 15,860 25,950
Total Individual 40,934 45,120 Small Group HMO 11,363 9,354 Small Group PPO 6,164 4,820 Small Group Grandfathered 13,455 17,551
Total Small Group 30,983 31,725 Commissions 1,541 757 General insurance expenses 9,534 10,293 Insurance taxes, licenses, and fees, excluding federal income tax 1,703 1,889 Write-in 752 576 Total expenses 85,446$ 90,359$ Income before income tax expense 2,757 7,059 Income tax expense 937 2,400
Net Income 1,820$ 4,659$
Exhibit 6 - Financial StatementsIncome Statement

Society of Actuaries – Case Study, Group & Health Finance & Valuation US Exam
Page | 11
(In thousands)
Assets December 31, Year 4 December 31, Year 3Current Assets
Cash and cash equivalents 11,931 11,308 Bonds 2,535 2,695 Real Estate 2,835 2,748 Investment income due and accrued 201 159 Premium Receivables 13 11 Other receivables 995 995 Other 1,712 1,712 Electronic data processing equipment 859 859
Total current assets 21,081 20,487 Long-term investments 17,505 17,831 Net property, plant, and equipment 906 880 Goodwill 151 163 Other intangible assets 395 396 Other noncurrent assets 253 245 Total Assets 40,291$ 40,002$
Liabilities and Shareholder's EquityLiabilitiesCurrent Liabilities:
Policy liabilities:Accident and health contracts 9,535 9,478 Reserves for future policy benefits 59 59 Other policyholder liabilities 201 202
Total policy liabilities 9,795 9,739 Unearned Income 82 81 Accounts payable and accrued expenses 3,129 3,299 Current portion of long-term debt 67 84 Other current liabilities 1,594 1,594
Total current liabilities 14,667 14,797 Drafts outstanding 533 632 Payable for securities 655 938 Remittances 3,102 2,987 Other noncurrent liabilities 815 787 Total Liabilities 19,772 20,141 Shareholder's EquityCommon capital stock 6,500 6,500 Retained earnings 13,597 12,951 Unassigned funds (surplus) 422 410 Total Shareholder's Equity 20,519 19,861 Total Liabilities and Owner's Equity 40,291$ 40,002$
Exhibit 6 (continued) - Financial StatementsBalance Sheet

Society of Actuaries – Case Study, Group & Health Finance & Valuation US Exam
Page | 12
Casino Royale Health & Life Insurance Company (Royale Health) Large Group Products/Administrative Services Only Royale Health offers coverage options for large group employers, including fully insured options and administrative services only (ASO) options. Health coverage plan options offered by Royale Health include medical and prescription plans, which are marketed primarily through agents and brokers. Royale Health has been successful in establishing its own preferred provider networks in the Midwestern states and has the second largest market share in the large group market of the Midwest Region. The medical plan portfolio includes PPO plans and qualified high deductible health plans (HDHP), which can be combined with a Health Savings Account (HSA). Royale Health also administers Health Reimbursement Arrangements (HRA) offered by employers. Royale Health’s Board has expressed interest in expanding the company into new product markets. Royale Health has recently participated in preliminary discussions with a Canadian company, Pinewood Insurance Company about a potential merger.

Society of Actuaries – Case Study, Group & Health Finance & Valuation US Exam
Page | 13
**Royale Health Email 1**
From: Le Chiffre <[email protected]> To: You <[email protected]> Sent: March 9, Year 4 Subject: Potential Merger
I have been approached by the CEO of Pinewood Insurance Company (Pinewood), located in Canada, for a possible merger. They are interested in expanding into the U.S., and we could gain from their product expertise. While we do have some overlap in product offerings, Pinewood has experience in some additional markets that we have no experience with.
As you can imagine, this potential merger is highly confidential. As we begin to explore this opportunity, I would like your help through the due diligence and, if necessary, negotiations of this possible merger. I have attached Pinewood’s financial information for your review. To provide you with some background, I have also summarized below some of the information on Pinewood that I have thus far:
Pinewood is a large insurance company operating exclusively in Canada. Its corporate vision is similar to ours: to be a leader in the insurance industry, to earn a competitive return for its stockholders, to offer good value to its policyholders while operating in a financially sustainable way, and to attract and retain valuable employees.
Pinewood’s primary product offerings include:
• Supplemental medical benefits.• Group life,• Disability insurance, and• Ancillary products, including dental and vision.
Pinewood employs 2,000 people throughout Canada. From what I have gathered so far, Pinewood seems to have a strong reputation in their markets. However, they are interested in growing into other markets and possibly internationally.
I have attached Pinewood’s financial information for your review. Please let me know what additional information you think we should seek out.
Thanks, Le Chiffre

Society of Actuaries – Case Study, Group & Health Finance & Valuation US Exam
Page | 14
Pinewood Insurance Company Consolidated Statement of Operations(In thousands, except per share data) For the Years Ending December 31,
Revenue Year 4 Year 3 Year 2Premium Income Supplemental Medical 4,023 3,784 3,129 Group Life 5,888 6,071 6,211 Disability 2,572 3,420 5,280 Ancillary Products 1,234 967 957Administrative fees Income 2,553 3,118 3,011 Other revenue - - - Total operating revenue 16,270 17,360 18,588 Net investment income 3,178 5,348 5,707 Net realized gains (losses) on investments - - - Total Revenues $19,448 $22,708 $24,295
[42]
ExpensesBenefit expense Supplemental Medical 3,359 3,123 2,583 Group Life 3,592 3,946 3,913 Disability 1,517 2,120 3,326 Ancillary Products 963 725 794Commissions 1,941 2,233 2,671 General and administrative expense 4,084 4,315 4,859 Premium Taxes 274 285 312 Interest Expense 350 323 345 Amortization of other intangible assets 265 274 260 Total Expenses $16,345 $17,344 $19,063Income before income tax expense 3,103 5,364 5,232 Income tax expense 621 1,073 1,046
Net Income $2,482 $4,291 $4,186
Net income per shareBasic $2.66 $4.33 $3.73Diluted $2.70 $4.73 $3.84
Average Exchange Rates*U.S. dollars 0.74 0.76 0.80 Euro 0.69 0.67 0.66 * e.g., on 12/31/Year 2, $1 Can = $0.80 US
Exhibit 1 - Year 4 Annual Report

Society of Actuaries – Case Study, Group & Health Finance & Valuation US Exam
Page | 15
Pinewood Insurance Company Consolidated Balance Sheet(In thousands)
Assets December 31, Year 4 December 31, Year 3Current Assets
Cash and cash equivalents $9,880 $8,770Premium Receivables 8 8 Investments available-for-sale, at fair value
Fixed maturity securities (amortized cost) 1,169 1,097 Equity securities 256 242 Other invested assets, current 693 722 Other receivables 827 745 Income taxes receivable 53 54 Net due from subsidiaries 867 1,197 Securities lending collateral 583 854 Deferred tax assets, net 250 248 Other current assets 1 1
Total Current Assets $14,587 $13,938
Long-term investmentsFixed maturity securities $534 $234Equity securities $6 $7Other invested assets, long-term $456 $495Property and equipment, net 4 3 Deferred tax assets, net, non-current 234 227 Investment in subsidiaries 5,544 3,456 Other noncurrent assets 114 37
Total Assets $21,479 $18,397
Liabilities and Shareholder's Equity December 31, Year 4 December 31, Year 3Liabilities
Actuarial and Policy Liabilities $8,230 $7,564Amounts on deposit 678 876 Deferred Gains 4 5 Long-term debt 345 456 Other Liabilities 795 856
Total Liabilities $10,052 $9,757
Shareholder's EquityPreferred stock 0 0Common stock 5 5Additional paid-in capital 326 109Retained earnings 1,865 1,777Accumulated Income 9,231 6,749Total Shareholder's Equity $11,427 $8,640
Total Liabilities and Owner's Equity $21,479 $18,397{42}
Exhibit 1 - Year 4 Annual Report (continued)

Society of Actuaries – Case Study, Group & Health Finance & Valuation US Exam
Page | 16
**Royale Health Email 2**
From: Le Chiffre <[email protected]> To: You <[email protected]> Sent: March 17, Year 5 Subject: Royale Health Financial Information
Hi – I have attached our latest financial information for this past year. Also of note, Royale Health had 444,902,956 common/preferred shares outstanding at YEYear4. Our current tax rate is 21.0%.
Please let me know if you need anything else or need help finding anything.
Thanks, Le Chiffre

Society of Actuaries – Case Study, Group & Health Finance & Valuation US Exam
Page | 17
Royale Life Insurance Company Income Statement(In thousands) For the Years Ending December 31,
Revenue Year 4 Year 3Premiums $66,599 $57,686Administrative fees Income 5,050 4,152 Other revenue 45 79 Total operating revenue 71,694 61,917 Net investment income 749 755 Net realized gains (losses) on investments 321 423 Total Revenues $72,764 $63,095
[42]
ExpensesBenefit expense $57,230 $49,252Commissions 1,541 1,591 General and administrative expense 9,246 8,143 Premium Taxes 1,332 1,154 Interest Expense 752 598 Amortization of other intangible assets 298 287 Total Expenses $70,399 $61,025Income before income tax expense 2,365 2,070 Income tax expense 1,251 1,253
Net Income $1,114 $817
Exhibit 2 - Financial Statements

Society of Actuaries – Case Study, Group & Health Finance & Valuation US Exam
Page | 18
Royale Life Insurance Company Balance Sheet(In thousands)
Assets December 31, Year 4 December 31, Year 3Current Assets
Cash and cash equivalents $1,729 $2,210Investments available-for-sale, at fair value
Fixed maturity securities (amortized cost) 16,950 15,913 Equity securities 1,835 1,515
Accrued investment income 159 149 Premium Receivables 3,858 3,748 Other receivables 995 897 Other current assets 1,712 1,829 Assets held for sale 859 901
Total Current Assets $28,097 $27,162
Long-term investments $2,102 $2,055Net property, plant, and equipment 1,811 1,729 Goodwill 15,971 15,942 Other intangible assets 7,931 7,955 Other noncurrent assets 458 299 Total Assets $56,370 $55,142
Liabilities and Shareholder's Equity December 31, Year 4 December 31, Year 3LiabilitiesCurrent Liabilities
Policy Liabilities:Medical claims payable $6,058 $6,095Reserves for future policy benefits 59 55 Other policyholder liabilities 2,023 2,125
Total Policy Liabilities $8,140 $8,275Unearned Income 811 875 Accounts payable and accrued expenses 3,299 2,975 Short-term borrowings 389 212 Current portion of long-term debt 467 489 Other current liabilities 1,594 1,647
Total Current Liabilities $14,700 $14,473Long-term debt, less current portion 11,253 12,121 Reserves for future policy benefits, noncurrent 655 661 Deferred tax liabilities, net 2,987 2,857 Other noncurrent liabilities 787 895 Total Liabilities $30,382 $31,007
Shareholder's EquityPaid-in capital - Common Stock $12,094 $11,976Retained earnings 13,513 11,950 Accumulate other comprehensive income 381 209 Total Shareholder's Equity $25,988 $24,135
Total Liabilities and Owner's Equity $56,370 $55,142{42}
Exhibit 2 - Financial Statements (continued)

Society of Actuaries – Case Study, Group & Health Finance & Valuation US Exam
Page | 19
**Royale Health Email 3**
From: Le Chiffre <[email protected]> To: You <[email protected]> Sent: July 17, Year 5 Subject: Royale Health Financial Information
Hello! As per your request, I have attached experience data for our 5 clients that have the Shared Return product. This data covers the period of 1/1/Year 3 – 6/30/Year 5.
Thanks, Le Chiffre
Exhibit 3 – Royale Health Shared Return Client Data ($ in thousands) Client A Client B Client C Client D Client E
Contract Effective Date 1/1/Year 3 1/1/Year 3 1/1/Year 3 1/1/Year 3 1/1/Year 3
Year 3 Annual Earned Premium $1,000 $1,500 $2,000 $2,500 $3,000
Year 4 Annual Earned Premium $1,200 $1,700 $2,200 $2,700 $3,200
Year 5 Annual Earned Premium $1,400 $1,900 $2,400 $2,900 $3,400
Claims: 1Q'Year 3 $215 $300 $1,000 $750 $800 2Q'Year 3 $215 $300 $500 $750 $800 3Q'Year 3 $215 $300 $500 $750 $900 4Q'Year 3 $215 $300 $500 $750 $900 1Q'Year 4 $250 $275 $250 $600 $1,000 2Q'Year 4 $250 $275 $250 $600 $1,000 3Q'Year 4 $250 $275 $250 $600 $1,000 4Q'Year 4 $250 $275 $250 $600 $1,000 1Q'Year 5 $275 $275 $250 $600 $1,000 2Q'Year 5 $275 $275 $250 $600 $1,000

Society of Actuaries – Case Study, Group & Health Finance & Valuation US Exam
Page | 20
Goldfinger Insurance Company (GIC) Medicare Advantage/Part D Goldfinger Insurance Company provides Medicare Advantage Plans and Part D Plans (MAPD), Medicaid and CHIP plans to the applicable target groups. GIC is domiciled in Fort Knox, Kentucky. The only MAPD offering is a Dual-Eligible Special Needs Plan (SNP). Total membership in the MAPD program is roughly 50,000 members. Until recently, this product was available only in Kentucky; however, the program was expanded into parts of Tennessee in Year 4. Membership in Tennessee is very low and little claims experience is available.
Skyfall provides actuarial support for GIC’s Medicare products and aids in product design and bid submission, as necessary. The following are selections from the email correspondence between Goldfinger and Skyfall regarding the latest round of pricing.
**Goldfinger Email 1** From: Jill Masterson <[email protected]> To: You <[email protected]> Sent: February 25th, Year 5 Subject: Medicare Advantage Cost Sharing
Hello again, we can’t thank you enough for performing so many “odd jobs” related to our Medicare Advantage products. You have certainly been essential to our success with the MAPD plan.
Our product development team has proposed waiving the skilled nursing facility (SNF) copay for the first four days and applying it instead to days five through eight. This is more in line with our primary competitor, and they believe it will increase new enrollment. However, I’m a little worried it might be too expensive. Please take a look at that and let us know whether we can make this change without losing too much on the profit side.
I wasn’t sure what information you’d need, but I had Auric pull some historical information on the SNF benefit. I attached a summary of our historical experience with SNF length-of-stay, as well as the Year 4 experience by benefit. The attached trend tables were published by a respected research group and they might be a good starting point for prospective trend estimates going forward. If you need anything else, don’t hesitate to ask.
Thanks again, Jill Masterson Chief Financial Officer Goldfinger Insurance Company
Enclosures:

Society of Actuaries – Case Study, Group & Health Finance & Valuation US Exam
Page | 21
Goldfinger Insurance SNF Continuance (MAPD):
Length of Stay (Days)
Cumulative Frequency
1 0.102 0.173 0.234 0.285 0.336 0.367 0.388 0.40
100 1.00
Exhibit 1 - Skilled Nursing Facility
Medical
Inpatient Facility Days 750 $6,000 $375.00 $360.00 $15.00Skilled Nursing Facility Days 600 $1,000 $50.00 $49.50 $0.50
Home Health Visits 200 $210 $3.50 $3.50 $0.00Ambulance Trips 120 $700 $7.00 $6.65 $0.35
DME/Prosthetics/Supplies Other 600 $240 $12.00 $10.80 $1.20Emergency Room Visits 300 $1,200 $30.00 $26.10 $3.90
Outpatient Surgery Procedures 150 $3,000 $37.50 $33.75 $3.75Professional Visits 6000 $200 $100.00 $97.00 $3.00
Other Medicare Part B Other 1000 $1,500 $125.00 $106.25 $18.75Total $740.00 $693.55 $46.45
Prescription
Preferred Generic 3000 $18 $4.50 $4.50 $0.00Non-Preferred Generic 20000 $21 $35.00 $29.16 $5.84
Preferred Brand 2600 $430 $93.17 $80.37 $12.79Non-Preferred Brand 700 $510 $29.75 $19.93 $9.82
Specialty 120 $4,800 $48.00 $37.33 $10.67Total $210.42 $171.30 $39.11
Cost Share PMPM
Scripts /1000 Unit Cost
Allowed PMPM
Net Paid PMPM
Exhibit 2 - Medicare Advantage Kentucky - Year 4 Experience Utilization
UnitsUtilization
/1000 Unit CostAllowed PMPM
Net Paid PMPM
Cost Share PMPM

Society of Actuaries – Case Study, Group & Health Finance & Valuation US Exam
Page | 22
Exhibit 3 shows the publicly-available prospective trends for Kentucky and Tennessee.
Unit Utilization/ Unit Utilization/Service Category Cost 1000 Cost 1000Inpatient Hospital 3.00% -0.50% 1.00% 0.00%
Skilled Nursing and Home Health 1.50% 0.00% 0.25% 0.25%Outpatient Hospital 2.00% 0.00% 2.00% 0.50%
Physician 0.00% 2.00% 0.50% 3.50%Other -1.00% 0.00% 0.50% 1.00%
Exhibit 3 - Medicare Advantage Annual Trend Factors - KentuckyYear 4 -Year 5 Year 5 -Year 6
Unit Utilization/ Unit Utilization/Service Category Cost 1000 Cost 1000Inpatient Hospital 3.00% -0.50% -5.50% 0.00%
Skilled Nursing and Home Health 1.50% 0.00% -0.50% 0.25%Outpatient Hospital 2.00% 0.00% 2.00% 0.50%
Physician 0.00% 2.00% -2.00% 3.50%Other -1.00% 0.00% 0.50% 1.00%
Year 4 -Year 5 Year 5 -Year 6Exhibit 3 (con't) - Medicare Advantage Annual Trend Factors - Tennessee

Society of Actuaries – Case Study, Group & Health Finance & Valuation US Exam
Page | 23
**Goldfinger Email 2**
From: Jill Masterson <[email protected]> To: You <[email protected]> Sent: March 15, Year 5 Subject: Dual-Eligible (DE) Inpatient Costs
Hello again! As you know, one important element of our Medicare Advantage bid development pertains to projected population changes. Because different demographics have very different costs, we have to project as accurately as possible the changes in both our revenue and our expenses due to aging, new enrollees, and other factors that represent a change in the demographic mix. The reviewers usually expect detailed documentation of our process, so make sure to keep that in mind as we develop those projections.
Since we are continually expanding, we want to keep a close eye on any major shifts in membership. Auric suggested that maybe our factors for some of those demographic characteristics might be too simplistic and recommended we look at the cost differentials for inpatient costs separately from other costs. He is still working on getting all of the data from the providers across the state, but below is our
MA Benefit Category Year 4 Year 5 Year 6$200 $200 $200 20% 20% 20%
$6,500 $6,500 $6,000 No cost sharing for
first three days, then $150 copay per day.
No cost sharing for first three days, then $150 copay per day.
No cost sharing for first three days, then $150 copay per day.
$50 copay per day for first five days, no cost
sharing afterwards
$50 copay per day for first five days, no cost
sharing afterwards
$40 copay per day for first four days, no cost
sharing afterwardsNo cost sharing No cost sharing No cost sharing
$75 $75 $50 $30 $35 $35 $55 $50 $50
Deductible/ Coinsurance
Deductible/ Coinsurance
Deductible/ Coinsurance
PD Benefit Category Year 4 Year 5 Year 6$275 $275 $300
$0 Copay $5 Copay $0 Copay$5 Copay $7 Copay $5 Copay
$45 Copay $25 Copay $45 Copay30% Coinsurance 30% Coinsurance 30% Coinsurance20% Coinsurance 20% Coinsurance 20% Coinsurance
Non-Preferred Generic RxPreferred Brand RxNon-Preferred Brand RxSpecialty Rx
Primary Care CopaySpecialist Copay
Other Medicare-Covered
Annual DeductiblePreferred Generic Rx
Maximum Out-of-Pocket
Inpatient
Skilled Nursing Facility
Home Health ServicesEmergency Care Copay
Exhibit 4 - Cost Sharing for Goldfinger MAPD Plans
DeductibleGeneral Coinsurance

Society of Actuaries – Case Study, Group & Health Finance & Valuation US Exam
Page | 24
admission experience for last year for one of our hospitals. Hopefully, this will help you get a head start on projecting changes in cost. I have also included the factors we have used in the past for projected new enrollees, along with enrollment projections from our sales team.
Please start looking at this data, and we will get you the data from our other providers as soon as possible.
Thanks, Jill
Enclosures:
Member Age GenderDual Eligible (DE) Status Admit Date
Discharge Date DRG
George 68 Male DE 8/14/Year 4 9/5/Year 4 4Auric 81 Male DE 2/7/Year 4 2/26/Year 4 7Auric 81 Male DE 3/1/Year 4 3/31/Year 4 7Ian 65 Male Non-DE 4/5/Year 4 5/5/Year 4 6Tilly 71 Female Non-DE 3/15/Year 4 4/5/Year 4 3Tilly 71 Female Non-DE 5/4/Year 4 5/30/Year 4 1Tilly 71 Female Non-DE 10/4/Year 4 10/19/Year 4 1Q 66 Male DE 11/27/Year 4 11/28/Year 4 5Olivia 70 Female Non-DE 6/6/Year 4 6/12/Year 4 5Moneypenny 91 Female Non-DE 6/7/Year 4 6/27/Year 4 2Felix 68 Male Non-DE 8/23/Year 4 8/30/Year 4 4Bonita 74 Female Non-DE 9/2/Year 4 9/11/Year 4 3Shirley 66 Female DE 4/4/Year 4 4/13/Year 4 1
Exhibit 5 - Goldfinger Inpatient Claims at Fort Knox Hospital, Year 4
Year 4 MAPD Year 5 MAPDRegion Factor Members MembersNorth 1.09 15,124 17,145 East 0.98 16,745 15,977
South 1.05 8,235 10,542 West 0.82 7,896 7,336
Exhibit 6 - Regional Factors
Year 4 MAPD Year 5 MAPDAge Factor Members Members
Under 70 0.93 24,804 31,524 70 to 74 1.04 15,331 14,112 75 to 79 1.08 4,450 4,852
80+ 1.22 3,415 512
Exhibit 7 - Age Factors

Society of Actuaries – Case Study, Group & Health Finance & Valuation US Exam
Page | 25
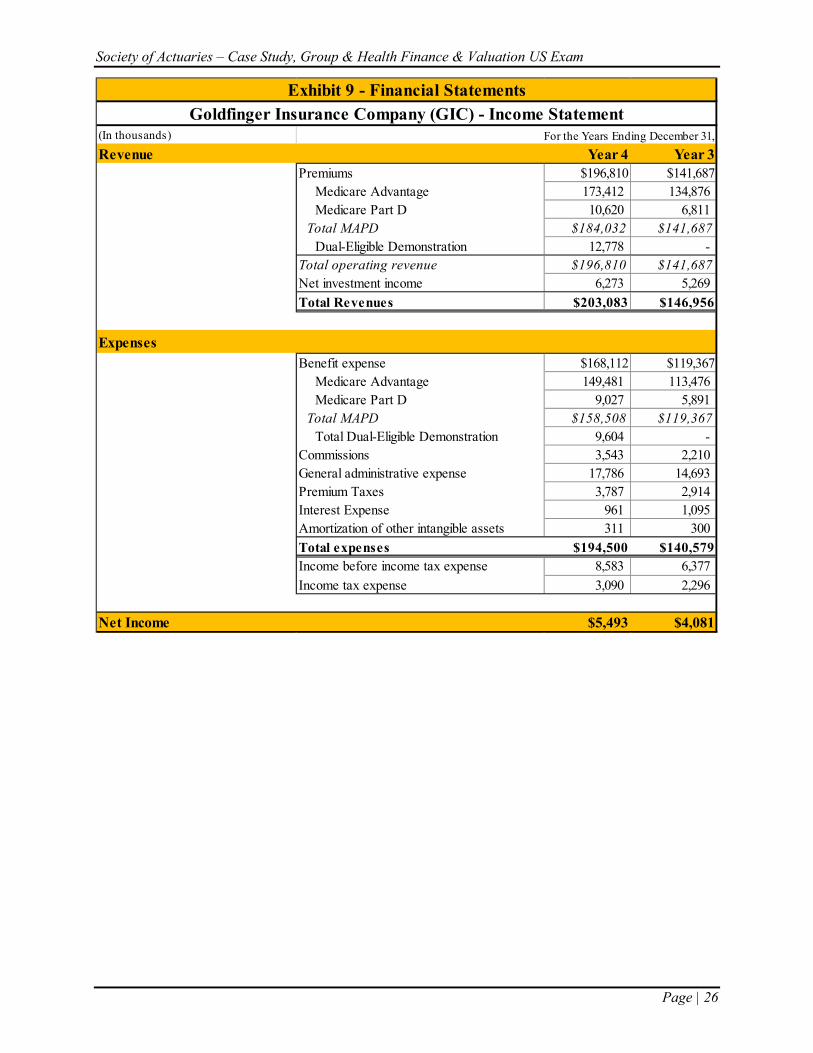
Medicaid GIC also participates in a Financial Alignment Demonstration contract with Kentucky and CMS, which began on July 1st, Year 4. This demonstration will be carried out under the Capitated Model. The target population of the demonstration is limited to dual-eligible beneficiaries over the age of 80. As a result, the per-member per-month (PMPM) costs for the demonstration members are expected to be materially higher than average for the MAPD plan. The primary source of enrollment is pre-existing Goldfinger members. The majority of Goldfinger’s members over the age of 80 have elected to participate in the demonstration due to its more generous benefits. Skyfall was asked to assist in the calculation of prospective capitation payments over the life of the demonstration. The past two years of income statements and balance sheets for GIC is provided below:
Year 4 MAPD Year 5 MAPDGender Factor Members MembersMale 1.03 20,546 21,213
Female 0.98 27,454 29,787
Exhibit 8 - Gender Factors
Society of Actuaries – Case Study, Group & Health Finance & Valuation US Exam
Page | 26
(In thousands) For the Years Ending December 31,Revenue Year 4 Year 3
Premiums $196,810 $141,687Medicare Advantage 173,412 134,876 Medicare Part D 10,620 6,811
Total MAPD $184,032 $141,687Dual-Eligible Demonstration 12,778 -
Total operating revenue $196,810 $141,687Net investment income 6,273 5,269 Total Revenues $203,083 $146,956
ExpensesBenefit expense $168,112 $119,367
Medicare Advantage 149,481 113,476 Medicare Part D 9,027 5,891
Total MAPD $158,508 $119,367Total Dual-Eligible Demonstration 9,604 -
Commissions 3,543 2,210 General administrative expense 17,786 14,693 Premium Taxes 3,787 2,914 Interest Expense 961 1,095 Amortization of other intangible assets 311 300 Total expenses $194,500 $140,579Income before income tax expense 8,583 6,377Income tax expense 3,090 2,296
Net Income $5,493 $4,081
Exhibit 9 - Financial StatementsGoldfinger Insurance Company (GIC) - Income Statement

Society of Actuaries – Case Study, Group & Health Finance & Valuation US Exam
Page | 27
(In thousands)
Assets December 31, Year 4 December 31, Year 3Current Assets $82,982 $86,983Long-term investments 9,524 6,165 Net property, plant, and equipment 4,865 5,187 Net Intangible Assets 31,969 27,109 Total Assets $129,340 $125,444
Liabilities and Shareholder's EquityLiabilitiesPolicy liabilities:
Claims unpaid $16,965 $17,066Reserves for future policy benefits 321 154 Other policyholder liabilities 4,789 5,746
Total policy liabilities $22,075 $22,966Unearned Premium 3,456 2,651 Premiums received in advance 18,014 14,904 Long-term debt 29,785 33,938 Reserves for future policy benefits, noncurrent 345 290 Deferred tax liabilities, net 3,129 4,524 Payable for securities 2,203 2,506 Total Liabilities $35,462 $41,258
Shareholder's EquityCommon capital stock $25,521 $20,945Retained earnings 68,357 63,241 Total Shareholder's Equity $93,878 $84,186
Total Liabilities and Owner's Equity $129,340 $125,444{42}
Goldfinger Insurance Company (GIC) - Balance SheetExhibit 9 (con't) - Financial Statements

Society of Actuaries – Case Study, Group & Health Finance & Valuation US Exam
Page | 28
The Thunderball Corporation (Thunderball) The Thunderball Corporation is a large insurance company operating in the United States and Canada. The corporate vision is to be a comprehensive provider of long term insurance products. Thunderball seeks to offer competitive products earning reasonable return for stockholders while growing at a financially sustainable rate. Thunderball offers Group Long-Term Disability, Group Life, and Group and Individual Long-Term Care.
Long-Term Disability Thunderball has experienced steady growth in Long-Term Disability sales. The following tables show the reserve factors for various ages and durations. Tables 1 & 2 are the newest tables created by the internal team, and Tables 3 & 4 are the tables that have been used for many years.

Society of Actuaries – Case Study, Group & Health Finance & Valuation US Exam
Page | 29
Exhibit 1 - Claim Reserve Factors$3,000 Indexed Gross Monthly Benefit to Age 65, Reserves per $1 Benefit, No Diagnosis,Three Month Elimination Period, 24 Month Own Occupation Period, 5.0% Discount Rate
AgeDuration (Months) Male Female Age
Duration (Months) Male Female Age
Duration (Months) Male Female
27 4 24.70 27.90 35 4 34.22 37.74 43 4 40.68 42.48 27 9 42.20 46.40 35 9 53.96 58.00 43 9 59.66 61.74 27 18 60.60 64.90 35 18 71.40 77.06 43 18 74.16 78.54 27 27 70.10 74.50 35 27 79.62 86.02 43 27 80.02 85.24 27 48 100.60 105.20 35 48 103.08 111.04 43 48 94.04 100.74 27 60 106.10 110.20 35 60 106.26 114.04 43 60 94.24 100.78 28 4 25.89 29.13 36 4 35.41 38.97 44 4 41.36 42.86 28 9 43.67 47.85 36 9 55.43 59.45 44 9 60.12 61.88 28 18 61.95 66.42 36 18 72.75 78.58 44 18 74.17 78.28 28 27 71.29 75.94 36 27 80.81 87.46 44 27 79.69 84.63 28 48 100.91 105.93 36 48 103.39 111.77 44 48 92.43 98.78 28 60 106.12 110.68 36 60 106.28 114.52 44 60 92.23 98.41 29 4 27.08 30.36 37 4 36.60 40.20 45 4 42.04 43.24 29 9 45.14 49.30 37 9 56.90 60.90 45 9 60.58 62.02 29 18 63.30 67.94 37 18 74.10 80.10 45 18 74.18 78.02 29 27 72.48 77.38 37 27 82.00 88.90 45 27 79.36 84.02 29 48 101.22 106.66 37 48 103.70 112.50 45 48 90.82 96.82 29 60 106.14 111.16 37 60 106.30 115.00 45 60 90.22 96.04 30 4 28.27 31.59 38 4 37.28 40.58 46 4 42.72 43.62 30 9 46.61 50.75 38 9 57.36 61.04 46 9 61.04 62.16 30 18 64.65 69.46 38 18 74.11 79.84 46 18 74.19 77.76 30 27 73.67 78.82 38 27 81.67 88.29 46 27 79.03 83.41 30 48 101.53 107.39 38 48 102.09 110.54 46 48 89.21 94.86 30 60 106.16 111.64 38 60 104.29 112.63 46 60 88.21 93.67 31 4 29.46 32.82 39 4 37.96 40.96 47 4 43.40 44.00 31 9 48.08 52.20 39 9 57.82 61.18 47 9 61.50 62.30 31 18 66.00 70.98 39 18 74.12 79.58 47 18 74.20 77.50 31 27 74.86 80.26 39 27 81.34 87.68 47 27 78.70 82.80 31 48 101.84 108.12 39 48 100.48 108.58 47 48 87.60 92.90 31 60 106.18 112.12 39 60 102.28 110.26 47 60 86.20 91.30 32 4 30.65 34.05 40 4 38.64 41.34 48 4 42.58 42.95 32 9 49.55 53.65 40 9 58.28 61.32 48 9 59.79 60.36 32 18 67.35 72.50 40 18 74.13 79.32 48 18 71.50 74.47 32 27 76.05 81.70 40 27 81.01 87.07 48 27 75.32 79.03 32 48 102.15 108.85 40 48 98.87 106.62 48 48 82.39 87.22 32 60 106.20 112.60 40 60 100.27 107.89 48 60 80.29 84.91 33 4 31.84 35.28 41 4 39.32 41.72 49 4 41.76 41.90 33 9 51.02 55.10 41 9 58.74 61.46 49 9 58.08 58.42 33 18 68.70 74.02 41 18 74.14 79.06 49 18 68.80 71.44 33 27 77.24 83.14 41 27 80.68 86.46 49 27 71.94 75.26 33 48 102.46 109.58 41 48 97.26 104.66 49 48 77.18 81.54 33 60 106.22 113.08 41 60 98.26 105.52 49 60 74.38 78.52 34 4 33.03 36.51 42 4 40.00 42.10 50 4 40.94 40.85 34 9 52.49 56.55 42 9 59.20 61.60 50 9 56.37 56.48 34 18 70.05 75.54 42 18 74.15 78.80 50 18 66.10 68.41 34 27 78.43 84.58 42 27 80.35 85.85 50 27 68.56 71.49 34 48 102.77 110.31 42 48 95.65 102.70 50 48 71.97 75.86 34 60 106.24 113.56 42 60 96.25 103.15 50 60 68.47 72.13

Society of Actuaries – Case Study, Group & Health Finance & Valuation US Exam
Page | 30
Exhibit 2 - Claim Reserve Factors$3,000 Indexed Gross Monthly Benefit to Age 65, Reserves per $1 Benefit, No Diagnosis,Six Month Elimination Period, 24 Month Own Occupation Period, 5.0% Discount Rate
AgeDuration (Months) Male Female Age
Duration (Months) Male Female Age
Duration (Months) Male Female
27 7 40.80 45.30 35 7 52.24 56.50 43 7 57.74 60.02 27 9 45.80 50.20 35 9 57.40 61.80 43 9 62.46 65.00 27 18 62.30 66.80 35 18 72.94 78.72 43 18 75.30 79.84 27 27 74.60 79.20 35 27 83.40 90.16 43 27 82.54 88.10 27 48 100.60 105.20 35 48 103.08 111.04 43 48 94.04 100.74 27 60 106.10 110.20 35 60 106.26 114.04 43 60 94.24 100.78 28 7 42.23 46.70 36 7 53.67 57.90 44 7 58.18 60.14 28 9 47.25 51.65 36 9 58.85 63.25 44 9 62.82 65.05 28 18 63.63 68.29 36 18 74.27 80.21 44 18 75.25 79.53 28 27 75.70 80.57 36 27 84.50 91.53 44 27 82.03 87.30 28 48 100.91 105.93 36 48 103.39 111.77 44 48 92.43 98.78 28 60 106.12 110.68 36 60 106.28 114.52 44 60 92.23 98.41 29 7 43.66 48.10 37 7 55.10 59.30 45 7 58.62 60.26 29 9 48.70 53.10 37 9 60.30 64.70 45 9 63.18 65.10 29 18 64.96 69.78 37 18 75.60 81.70 45 18 75.20 79.22 29 27 76.80 81.94 37 27 85.60 92.90 45 27 81.52 86.50 29 48 101.22 106.66 37 48 103.70 112.50 45 48 90.82 96.82 29 60 106.14 111.16 37 60 106.30 115.00 45 60 90.22 96.04 30 7 45.09 49.50 38 7 55.54 59.42 46 7 59.06 60.38 30 9 50.15 54.55 38 9 60.66 64.75 46 9 63.54 65.15 30 18 66.29 71.27 38 18 75.55 81.39 46 18 75.15 78.91 30 27 77.90 83.31 38 27 85.09 92.10 46 27 81.01 85.70 30 48 101.53 107.39 38 48 102.09 110.54 46 48 89.21 94.86 30 60 106.16 111.64 38 60 104.29 112.63 46 60 88.21 93.67 31 7 46.52 50.90 39 7 55.98 59.54 47 7 59.50 60.50 31 9 51.60 56.00 39 9 61.02 64.80 47 9 63.90 65.20 31 18 67.62 72.76 39 18 75.50 81.08 47 18 75.10 78.60 31 27 79.00 84.68 39 27 84.58 91.30 47 27 80.50 84.90 31 48 101.84 108.12 39 48 100.48 108.58 47 48 87.60 92.90 31 60 106.18 112.12 39 60 102.28 110.26 47 60 86.20 91.30 32 7 47.95 52.30 40 7 56.42 59.66 48 7 57.91 58.67 32 9 53.05 57.45 40 9 61.38 64.85 48 9 62.05 63.10 32 18 68.95 74.25 40 18 75.45 80.77 48 18 72.35 75.50 32 27 80.10 86.05 40 27 84.07 90.50 48 27 76.85 80.85 32 48 102.15 108.85 40 48 98.87 106.62 48 48 82.39 87.22 32 60 106.20 112.60 40 60 100.27 107.89 48 60 80.29 84.91 33 7 49.38 53.70 41 7 56.86 59.78 49 7 56.32 56.84 33 9 54.50 58.90 41 9 61.74 64.90 49 9 60.20 61.00 33 18 70.28 75.74 41 18 75.40 80.46 49 18 69.60 72.40 33 27 81.20 87.42 41 27 83.56 89.70 49 27 73.20 76.80 33 48 102.46 109.58 41 48 97.26 104.66 49 48 77.18 81.54 33 60 106.22 113.08 41 60 98.26 105.52 49 60 74.38 78.52 34 7 50.81 55.10 42 7 57.30 59.90 50 7 54.73 55.01 34 9 55.95 60.35 42 9 62.10 64.95 50 9 58.35 58.90 34 18 71.61 77.23 42 18 75.35 80.15 50 18 66.85 69.30 34 27 82.30 88.79 42 27 83.05 88.90 50 27 69.55 72.75 34 48 102.77 110.31 42 48 95.65 102.70 50 48 71.97 75.86 34 60 106.24 113.56 42 60 96.25 103.15 50 60 68.47 72.13

Society of Actuaries – Case Study, Group & Health Finance & Valuation US Exam
Page | 31
Exhibit 3 - Claim Reserve Factors$3,000 Indexed Gross Monthly Benefit to Age 65, Reserves per $1 Benefit, No Diagnosis,Three Month Elimination Period, 24 Month Own Occupation Period, 5.0% Discount Rate
AgeDuration (Months) Male Female Age
Duration (Months) Male Female Age
Duration (Months) Male Female
27 4 44.40 47.20 35 4 52.80 55.52 43 4 58.50 60.54 27 9 68.70 76.00 35 9 76.22 82.72 43 9 78.52 83.32 27 18 95.00 110.80 35 18 98.28 111.12 43 18 94.36 103.40 27 27 108.30 127.50 35 27 109.34 124.62 43 27 101.26 111.72 27 48 127.50 146.40 35 48 121.34 136.00 43 48 105.34 114.92 27 60 133.70 151.10 35 60 123.54 137.10 43 60 103.96 112.72 28 4 45.45 48.24 36 4 53.85 56.56 44 4 59.10 61.03 28 9 69.64 76.84 36 9 77.16 83.56 44 9 78.59 83.14 28 18 95.41 110.84 36 18 98.69 111.16 44 18 93.57 102.10 28 27 108.43 127.14 36 27 109.47 124.26 44 27 99.87 109.69 28 48 126.73 145.10 36 48 120.57 134.70 44 48 102.93 111.84 28 60 132.43 149.35 36 60 122.27 135.35 44 60 101.12 109.24 29 4 46.50 49.28 37 4 54.90 57.60 45 4 59.70 61.52 29 9 70.58 77.68 37 9 78.10 84.40 45 9 78.66 82.96 29 18 95.82 110.88 37 18 99.10 111.20 45 18 92.78 100.80 29 27 108.56 126.78 37 27 109.60 123.90 45 27 98.48 107.66 29 48 125.96 143.80 37 48 119.80 133.40 45 48 100.52 108.76 29 60 131.16 147.60 37 60 121.00 133.60 45 60 98.28 105.76 30 4 47.55 50.32 38 4 55.50 58.09 46 4 60.30 62.01 30 9 71.52 78.52 38 9 78.17 84.22 46 9 78.73 82.78 30 18 96.23 110.92 38 18 98.31 109.90 46 18 91.99 99.50 30 27 108.69 126.42 38 27 108.21 121.87 46 27 97.09 105.63 30 48 125.19 142.50 38 48 117.39 130.32 46 48 98.11 105.68 30 60 129.89 145.85 38 60 118.16 130.12 46 60 95.44 102.28 31 4 48.60 51.36 39 4 56.10 58.58 47 4 60.90 62.50 31 9 72.46 79.36 39 9 78.24 84.04 47 9 78.80 82.60 31 18 96.64 110.96 39 18 97.52 108.60 47 18 91.20 98.20 31 27 108.82 126.06 39 27 106.82 119.84 47 27 95.70 103.60 31 48 124.42 141.20 39 48 114.98 127.24 47 48 95.70 102.60 31 60 128.62 144.10 39 60 115.32 126.64 47 60 92.60 98.80 32 4 49.65 52.40 40 4 56.70 59.07 48 4 59.59 61.03 32 9 73.40 80.20 40 9 78.31 83.86 48 9 76.27 79.76 32 18 97.05 111.00 40 18 96.73 107.30 48 18 87.38 93.83 32 27 108.95 125.70 40 27 105.43 117.81 48 27 91.06 98.32 32 48 123.65 139.90 40 48 112.57 124.16 48 48 89.77 96.07 32 60 127.35 142.35 40 60 112.48 123.16 48 60 86.09 91.72 33 4 50.70 53.44 41 4 57.30 59.56 49 4 58.28 59.56 33 9 74.34 81.04 41 9 78.38 83.68 49 9 73.74 76.92 33 18 97.46 111.04 41 18 95.94 106.00 49 18 83.56 89.46 33 27 109.08 125.34 41 27 104.04 115.78 49 27 86.42 93.04 33 48 122.88 138.60 41 48 110.16 121.08 49 48 83.84 89.54 33 60 126.08 140.60 41 60 109.64 119.68 49 60 79.58 84.64 34 4 51.75 54.48 42 4 57.90 60.05 50 4 56.97 58.09 34 9 75.28 81.88 42 9 78.45 83.50 50 9 71.21 74.08 34 18 97.87 111.08 42 18 95.15 104.70 50 18 79.74 85.09 34 27 109.21 124.98 42 27 102.65 113.75 50 27 81.78 87.76 34 48 122.11 137.30 42 48 107.75 118.00 50 48 77.91 83.01 34 60 124.81 138.85 42 60 106.80 116.20 50 60 73.07 77.56

Society of Actuaries – Case Study, Group & Health Finance & Valuation US Exam
Page | 32
Exhibit 4 - Claim Reserve Factors$3,000 Indexed Gross Monthly Benefit to Age 65, Reserves per $1 Benefit, No Diagnosis,Six Month Elimination Period, 24 Month Own Occupation Period, 5.0% Discount Rate
AgeDuration (Months) Male Female Age
Duration (Months) Male Female Age
Duration (Months) Male Female
27 7 67.80 74.40 35 7 76.44 82.48 43 7 78.36 82.70 27 9 74.40 82.90 35 9 82.16 89.62 43 9 82.78 88.18 27 18 96.90 113.10 35 18 100.02 113.18 43 18 95.58 104.80 27 27 111.60 130.90 35 27 111.76 126.98 43 27 102.50 112.80 27 48 127.50 146.40 35 48 121.34 136.00 43 48 105.34 114.92 27 60 133.70 151.10 35 60 123.54 137.10 43 60 103.96 112.72 28 7 68.88 75.41 36 7 77.52 83.49 44 7 78.32 82.40 28 9 75.37 83.74 36 9 83.13 90.46 44 9 82.56 87.66 28 18 97.29 113.11 36 18 100.41 113.19 44 18 94.71 103.40 28 27 111.62 130.41 36 27 111.78 126.49 44 27 100.95 110.60 28 48 126.73 145.10 36 48 120.57 134.70 44 48 102.93 111.84 28 60 132.43 149.35 36 60 122.27 135.35 44 60 101.12 109.24 29 7 69.96 76.42 37 7 78.60 84.50 45 7 78.28 82.10 29 9 76.34 84.58 37 9 84.10 91.30 45 9 82.34 87.14 29 18 97.68 113.12 37 18 100.80 113.20 45 18 93.84 102.00 29 27 111.64 129.92 37 27 111.80 126.00 45 27 99.40 108.40 29 48 125.96 143.80 37 48 119.80 133.40 45 48 100.52 108.76 29 60 131.16 147.60 37 60 121.00 133.60 45 60 98.28 105.76 30 7 71.04 77.43 38 7 78.56 84.20 46 7 78.24 81.80 30 9 77.31 85.42 38 9 83.88 90.78 46 9 82.12 86.62 30 18 98.07 113.13 38 18 99.93 111.80 46 18 92.97 100.60 30 27 111.66 129.43 38 27 110.25 123.80 46 27 97.85 106.20 30 48 125.19 142.50 38 48 117.39 130.32 46 48 98.11 105.68 30 60 129.89 145.85 38 60 118.16 130.12 46 60 95.44 102.28 31 7 72.12 78.44 39 7 78.52 83.90 47 7 78.20 81.50 31 9 78.28 86.26 39 9 83.66 90.26 47 9 81.90 86.10 31 18 98.46 113.14 39 18 99.06 110.40 47 18 92.10 99.20 31 27 111.68 128.94 39 27 108.70 121.60 47 27 96.30 104.00 31 48 124.42 141.20 39 48 114.98 127.24 47 48 95.70 102.60 31 60 128.62 144.10 39 60 115.32 126.64 47 60 92.60 98.80 32 7 73.20 79.45 40 7 78.48 83.60 48 7 75.68 78.68 32 9 79.25 87.10 40 9 83.44 89.74 48 9 79.06 82.91 32 18 98.85 113.15 40 18 98.19 109.00 48 18 88.19 94.73 32 27 111.70 128.45 40 27 107.15 119.40 48 27 91.44 98.51 32 48 123.65 139.90 40 48 112.57 124.16 48 48 89.77 96.07 32 60 127.35 142.35 40 60 112.48 123.16 48 60 86.09 91.72 33 7 74.28 80.46 41 7 78.44 83.30 49 7 73.16 75.86 33 9 80.22 87.94 41 9 83.22 89.22 49 9 76.22 79.72 33 18 99.24 113.16 41 18 97.32 107.60 49 18 84.28 90.26 33 27 111.72 127.96 41 27 105.60 117.20 49 27 86.58 93.02 33 48 122.88 138.60 41 48 110.16 121.08 49 48 83.84 89.54 33 60 126.08 140.60 41 60 109.64 119.68 49 60 79.58 84.64 34 7 75.36 81.47 42 7 78.40 83.00 50 7 70.64 73.04 34 9 81.19 88.78 42 9 83.00 88.70 50 9 73.38 76.53 34 18 99.63 113.17 42 18 96.45 106.20 50 18 80.37 85.79 34 27 111.74 127.47 42 27 104.05 115.00 50 27 81.72 87.53 34 48 122.11 137.30 42 48 107.75 118.00 50 48 77.91 83.01 34 60 124.81 138.85 42 60 106.80 116.20 50 60 73.07 77.56

Society of Actuaries – Case Study, Group & Health Finance & Valuation US Exam
Page | 33
Live Twice, Inc. (Live Twice) Live Twice, incorporated in Florida, is a mature firm that offers a generous retiree medical and pharmacy package to its union employees. The plan is fully insured with the employer fully subsidizing the premium for its retirees. Active employees, pre-Medicare retirees, and Medicare-eligible retirees pay the same premium. Live Twice’s Year 5 monthly rates and census data are given below:
Summary of active employees and retirees are provided in Exhibit 2 and Exhibit 3.
Skyfall assists Live Twice in preparation of its financial statements for post-retirement benefits. The average cost of the retiree medical plan in Year 3, as per Skyfall’s estimates, is given in Exhibit 4 below:
Active & Retiree $455.00Exhibit 1 - Monthly Rate
Headcount Age (years) Service (years)225 30 8110 40 1470 50 22
Exhibit 2 - Active Employee Data
Headcount Age (years) Family Status Spouse Age (years)40 70 Married 6530 70 Single n/a70 80 Single n/a
Exhibit 3 - Retiree Data
Age (years)Annual Cost Per Person
($)*60-64 10,20065-69 2,60070-74 2,95075-79 3,25080 + 3,750
Exhibit 4 - Retiree Medical Data

Society of Actuaries – Case Study, Group & Health Finance & Valuation US Exam
Page | 34
Another Day, Inc. (Another Day) Another Day, located in Toronto, Ontario offers medical and pharmacy coverage to its 400 active employees and 200 retirees. The plan is fully insured with the employer fully subsidizing the premium for its retirees.
A summary of the benefits plan is provided in Exhibit 2 below:
Summaries of the employees and retirees of Another Day are provided in Exhibit 3 and Exhibit 4 below.
Another Day employs Skyfall Canada to assist with preparation of its financial statements for the post-retirement benefit plan.
Active & Retiree $185.00Exhibit 1 - Monthly Rate
Benefit Coverage LevelLife Insurance $10,000Drugs 80% ($1,000 annual OOP max)Hospital 100% (semi-private)Paramedical 100% ($500 per calendar year per practioner max)Vision 100% ($200/24 mth max)Dental No coverageEmergency out of country 60 day max ($500,000 lifetime max)Other Medical 100%
Exhibit 2 - Plan Provisions
Headcount Age (years) Service (years)Average Annual
Salary ($)100 30 10 50,000200 40 15 80,000100 50 25 100,000
Exhibit 3 - Active Employee Data
Headcount Age (years)Average Annual
Salary at Retirement($)
Family Status Spouse Age (years)
50 70 80,000 Married 6550 70 80,000 Single n/a100 80 80,000 Single n/a
Exhibit 4 - Retiree Data

Society of Actuaries – Case Study, Group & Health Finance & Valuation US Exam
Page | 35
The average cost of the retiree medical plan in Year 5 was determined by the consulting firm as follows:
∗ Includes administration costs and taxes
Skyfall Canada also determined the actuarial present value of medical and life insurance benefits for active employees as follows:
Age (years) Annual Cost Per Person ($)*
60-64 2,00065-69 1,00070-74 1,10075-79 1,30080 + 1,500
Exhibit 5 - Retiree Medical Data
Age (years) Medical Costs ($) Life Insurance ($)30 5,000 1,00040 10,000 1,50050 20,000 2,000
Exhibit 6 - PV Future Benefits for Medical and Life Insurance Companies