Embed Size (px)
Citation preview
1
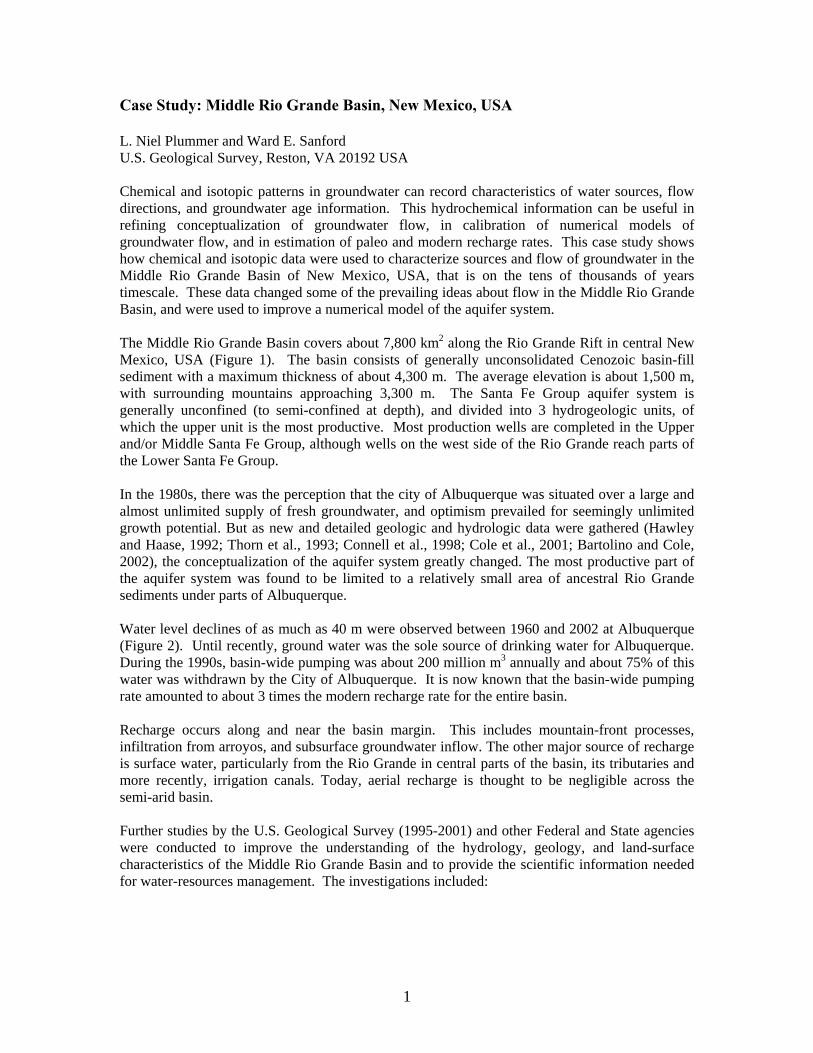
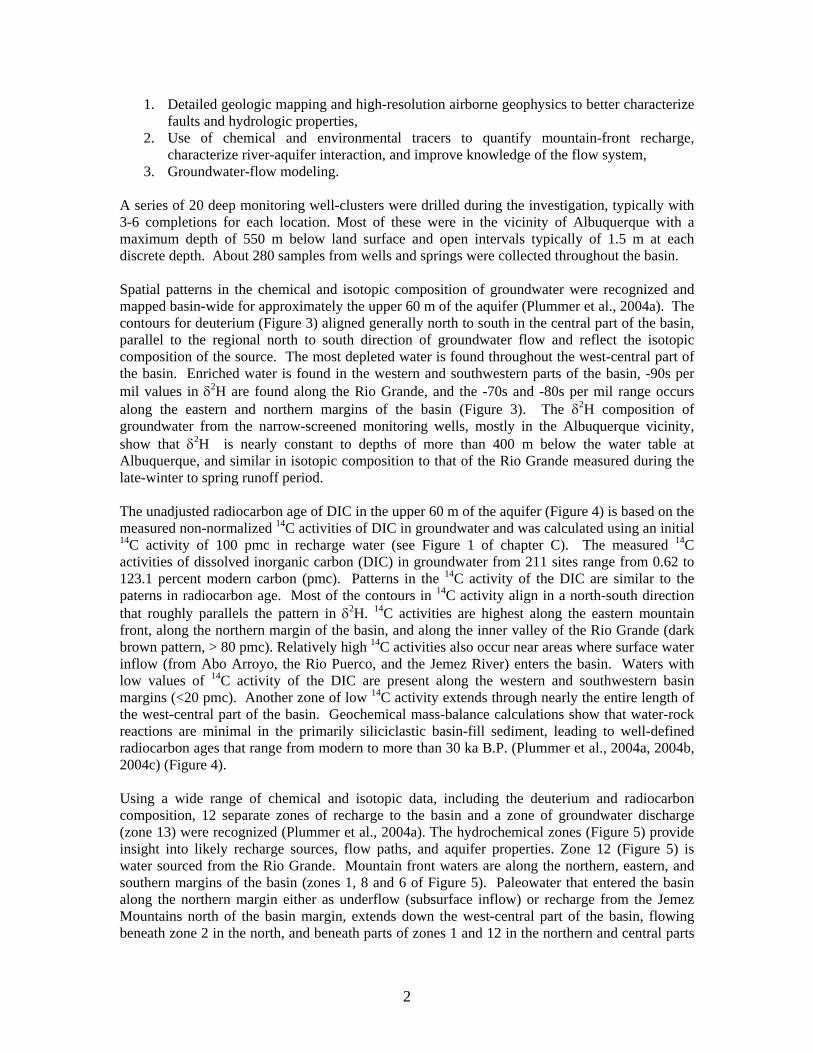
Case Study: Middle Rio Grande Basin, New Mexico, USA L. Niel Plummer and Ward E. Sanford U.S. Geological Survey, Reston, VA 20192 USA Chemical and isotopic patterns in groundwater can record characteristics of water sources, flow directions, and groundwater age information. This hydrochemical information can be useful in refining conceptualization of groundwater flow, in calibration of numerical models of groundwater flow, and in estimation of paleo and modern recharge rates. This case study shows how chemical and isotopic data were used to characterize sources and flow of groundwater in the Middle Rio Grande Basin of New Mexico, USA, that is on the tens of thousands of years timescale. These data changed some of the prevailing ideas about flow in the Middle Rio Grande Basin, and were used to improve a numerical model of the aquifer system. The Middle Rio Grande Basin covers about 7,800 km2 along the Rio Grande Rift in central New Mexico, USA (Figure 1). The basin consists of generally unconsolidated Cenozoic basin-fill sediment with a maximum thickness of about 4,300 m. The average elevation is about 1,500 m, with surrounding mountains approaching 3,300 m. The Santa Fe Group aquifer system is generally unconfined (to semi-confined at depth), and divided into 3 hydrogeologic units, of which the upper unit is the most productive. Most production wells are completed in the Upper and/or Middle Santa Fe Group, although wells on the west side of the Rio Grande reach parts of the Lower Santa Fe Group. In the 1980s, there was the perception that the city of Albuquerque was situated over a large and almost unlimited supply of fresh groundwater, and optimism prevailed for seemingly unlimited growth potential. But as new and detailed geologic and hydrologic data were gathered (Hawley and Haase, 1992; Thorn et al., 1993; Connell et al., 1998; Cole et al., 2001; Bartolino and Cole, 2002), the conceptualization of the aquifer system greatly changed. The most productive part of the aquifer system was found to be limited to a relatively small area of ancestral Rio Grande sediments under parts of Albuquerque. Water level declines of as much as 40 m were observed between 1960 and 2002 at Albuquerque (Figure 2). Until recently, ground water was the sole source of drinking water for Albuquerque. During the 1990s, basin-wide pumping was about 200 million m3 annually and about 75% of this water was withdrawn by the City of Albuquerque. It is now known that the basin-wide pumping rate amounted to about 3 times the modern recharge rate for the entire basin. Recharge occurs along and near the basin margin. This includes mountain-front processes, infiltration from arroyos, and subsurface groundwater inflow. The other major source of recharge is surface water, particularly from the Rio Grande in central parts of the basin, its tributaries and more recently, irrigation canals. Today, aerial recharge is thought to be negligible across the semi-arid basin. Further studies by the U.S. Geological Survey (1995-2001) and other Federal and State agencies were conducted to improve the understanding of the hydrology, geology, and land-surface characteristics of the Middle Rio Grande Basin and to provide the scientific information needed for water-resources management. The investigations included:
2
1. Detailed geologic mapping and high-resolution airborne geophysics to better characterize faults and hydrologic properties,
2. Use of chemical and environmental tracers to quantify mountain-front recharge, characterize river-aquifer interaction, and improve knowledge of the flow system,
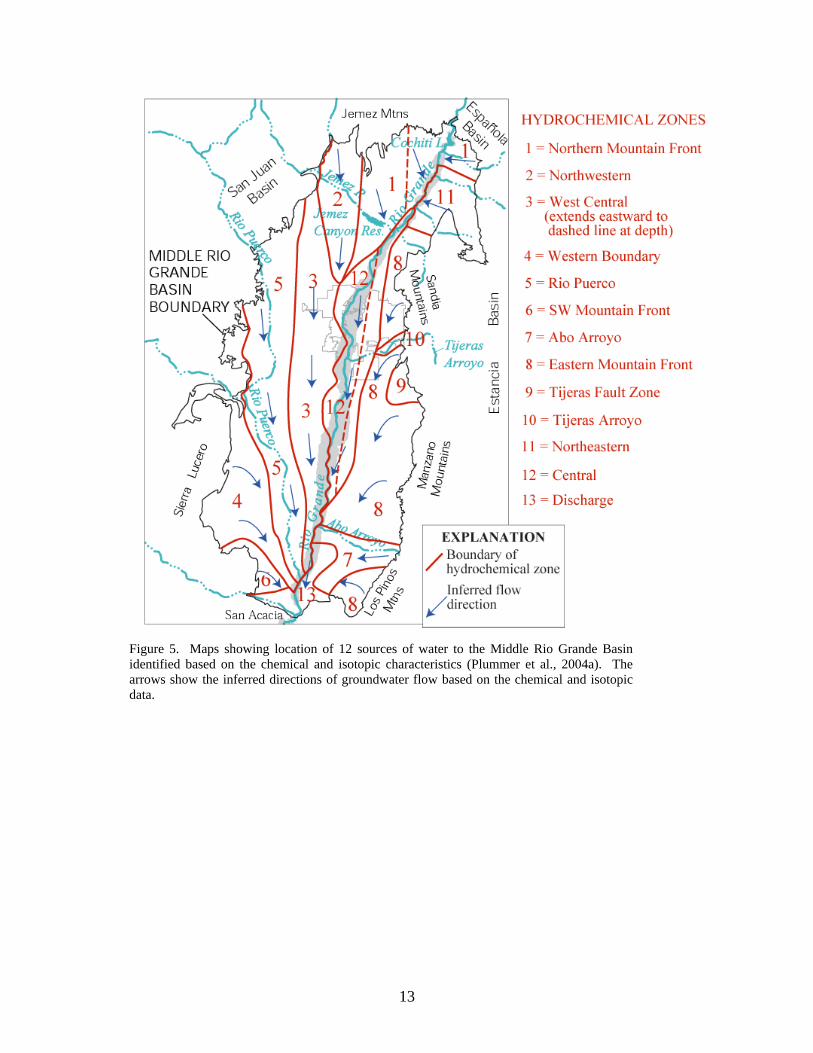
3. Groundwater-flow modeling. A series of 20 deep monitoring well-clusters were drilled during the investigation, typically with 3-6 completions for each location. Most of these were in the vicinity of Albuquerque with a maximum depth of 550 m below land surface and open intervals typically of 1.5 m at each discrete depth. About 280 samples from wells and springs were collected throughout the basin. Spatial patterns in the chemical and isotopic composition of groundwater were recognized and mapped basin-wide for approximately the upper 60 m of the aquifer (Plummer et al., 2004a). The contours for deuterium (Figure 3) aligned generally north to south in the central part of the basin, parallel to the regional north to south direction of groundwater flow and reflect the isotopic composition of the source. The most depleted water is found throughout the west-central part of the basin. Enriched water is found in the western and southwestern parts of the basin, -90s per mil values in δ2H are found along the Rio Grande, and the -70s and -80s per mil range occurs along the eastern and northern margins of the basin (Figure 3). The δ2H composition of groundwater from the narrow-screened monitoring wells, mostly in the Albuquerque vicinity, show that δ2H is nearly constant to depths of more than 400 m below the water table at Albuquerque, and similar in isotopic composition to that of the Rio Grande measured during the late-winter to spring runoff period. The unadjusted radiocarbon age of DIC in the upper 60 m of the aquifer (Figure 4) is based on the measured non-normalized 14C activities of DIC in groundwater and was calculated using an initial 14C activity of 100 pmc in recharge water (see Figure 1 of chapter C). The measured 14C activities of dissolved inorganic carbon (DIC) in groundwater from 211 sites range from 0.62 to 123.1 percent modern carbon (pmc). Patterns in the 14C activity of the DIC are similar to the paterns in radiocarbon age. Most of the contours in 14C activity align in a north-south direction that roughly parallels the pattern in δ2H. 14C activities are highest along the eastern mountain front, along the northern margin of the basin, and along the inner valley of the Rio Grande (dark brown pattern, > 80 pmc). Relatively high 14C activities also occur near areas where surface water inflow (from Abo Arroyo, the Rio Puerco, and the Jemez River) enters the basin. Waters with low values of 14C activity of the DIC are present along the western and southwestern basin margins (<20 pmc). Another zone of low 14C activity extends through nearly the entire length of the west-central part of the basin. Geochemical mass-balance calculations show that water-rock reactions are minimal in the primarily siliciclastic basin-fill sediment, leading to well-defined radiocarbon ages that range from modern to more than 30 ka B.P. (Plummer et al., 2004a, 2004b, 2004c) (Figure 4). Using a wide range of chemical and isotopic data, including the deuterium and radiocarbon composition, 12 separate zones of recharge to the basin and a zone of groundwater discharge (zone 13) were recognized (Plummer et al., 2004a). The hydrochemical zones (Figure 5) provide insight into likely recharge sources, flow paths, and aquifer properties. Zone 12 (Figure 5) is water sourced from the Rio Grande. Mountain front waters are along the northern, eastern, and southern margins of the basin (zones 1, 8 and 6 of Figure 5). Paleowater that entered the basin along the northern margin either as underflow (subsurface inflow) or recharge from the Jemez Mountains north of the basin margin, extends down the west-central part of the basin, flowing beneath zone 2 in the north, and beneath parts of zones 1 and 12 in the northern and central parts
3
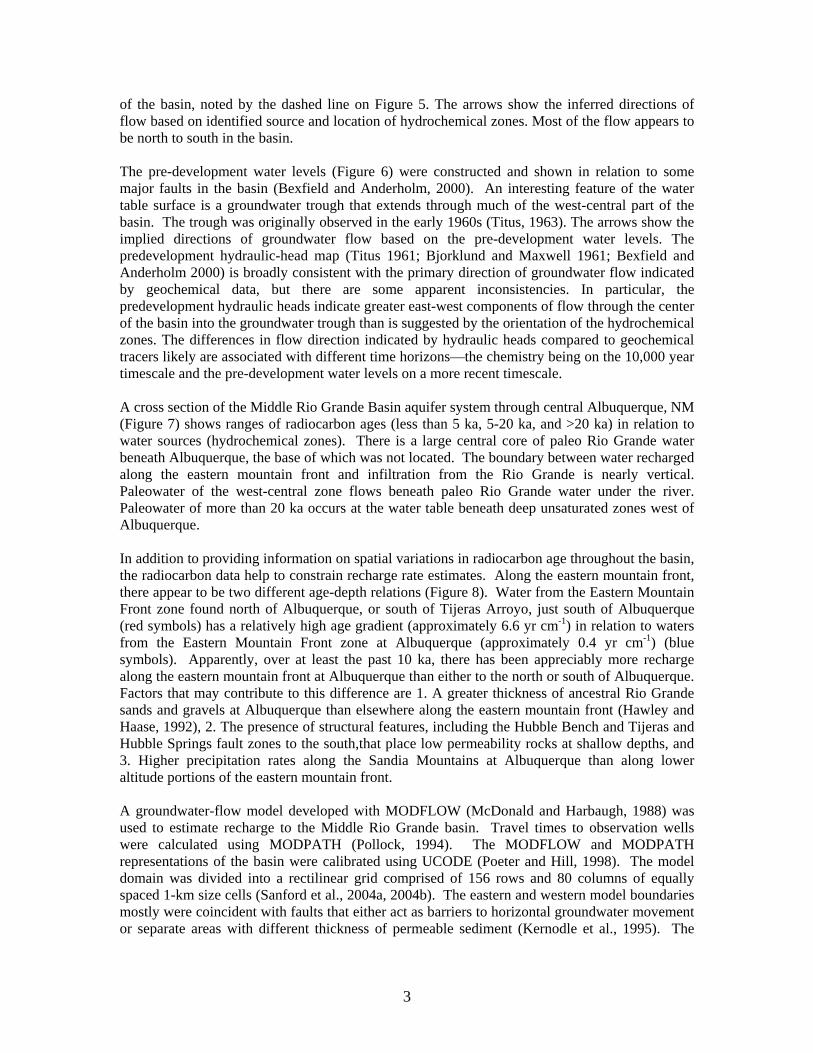
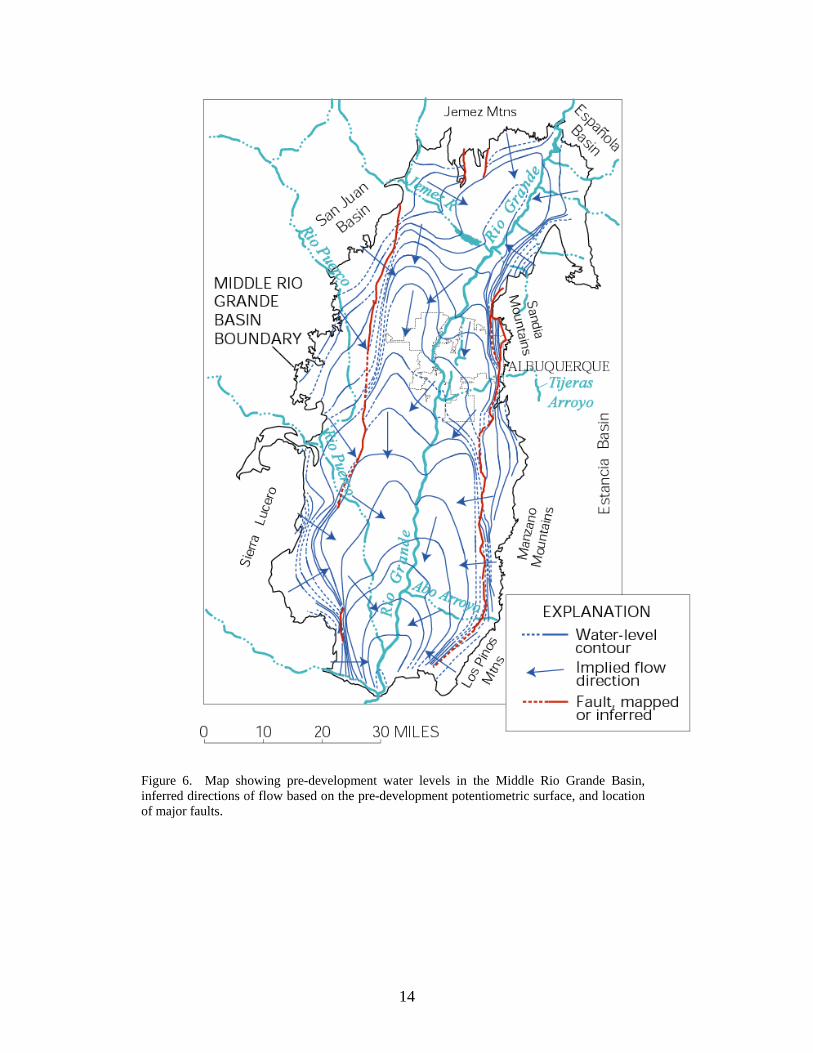
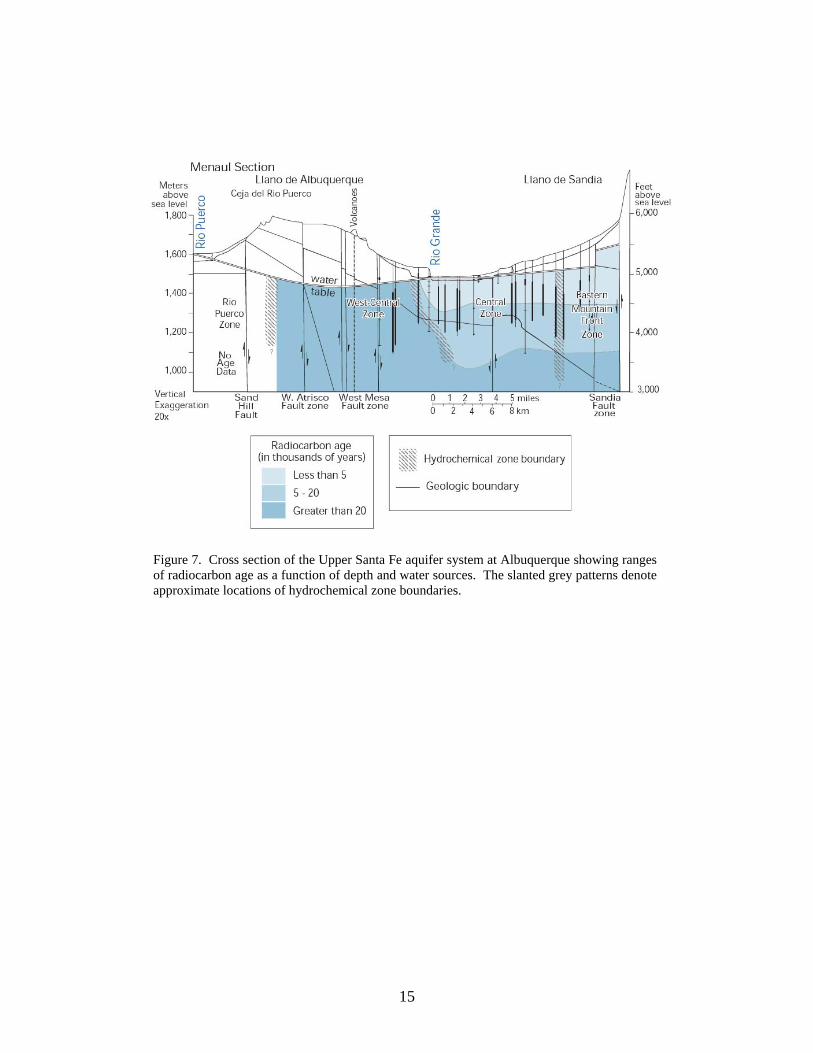
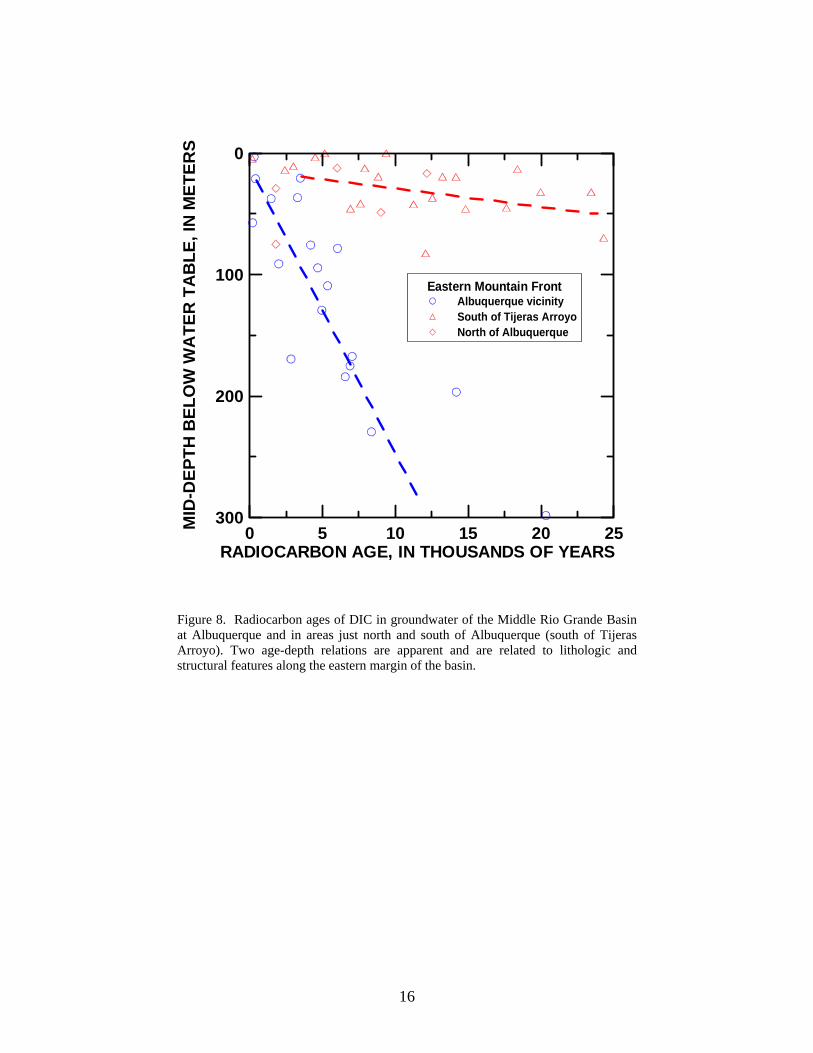
of the basin, noted by the dashed line on Figure 5. The arrows show the inferred directions of flow based on identified source and location of hydrochemical zones. Most of the flow appears to be north to south in the basin. The pre-development water levels (Figure 6) were constructed and shown in relation to some major faults in the basin (Bexfield and Anderholm, 2000). An interesting feature of the water table surface is a groundwater trough that extends through much of the west-central part of the basin. The trough was originally observed in the early 1960s (Titus, 1963). The arrows show the implied directions of groundwater flow based on the pre-development water levels. The predevelopment hydraulic-head map (Titus 1961; Bjorklund and Maxwell 1961; Bexfield and Anderholm 2000) is broadly consistent with the primary direction of groundwater flow indicated by geochemical data, but there are some apparent inconsistencies. In particular, the predevelopment hydraulic heads indicate greater east-west components of flow through the center of the basin into the groundwater trough than is suggested by the orientation of the hydrochemical zones. The differences in flow direction indicated by hydraulic heads compared to geochemical tracers likely are associated with different time horizons—the chemistry being on the 10,000 year timescale and the pre-development water levels on a more recent timescale. A cross section of the Middle Rio Grande Basin aquifer system through central Albuquerque, NM (Figure 7) shows ranges of radiocarbon ages (less than 5 ka, 5-20 ka, and >20 ka) in relation to water sources (hydrochemical zones). There is a large central core of paleo Rio Grande water beneath Albuquerque, the base of which was not located. The boundary between water recharged along the eastern mountain front and infiltration from the Rio Grande is nearly vertical. Paleowater of the west-central zone flows beneath paleo Rio Grande water under the river. Paleowater of more than 20 ka occurs at the water table beneath deep unsaturated zones west of Albuquerque. In addition to providing information on spatial variations in radiocarbon age throughout the basin, the radiocarbon data help to constrain recharge rate estimates. Along the eastern mountain front, there appear to be two different age-depth relations (Figure 8). Water from the Eastern Mountain Front zone found north of Albuquerque, or south of Tijeras Arroyo, just south of Albuquerque (red symbols) has a relatively high age gradient (approximately 6.6 yr cm-1) in relation to waters from the Eastern Mountain Front zone at Albuquerque (approximately 0.4 yr cm-1) (blue symbols). Apparently, over at least the past 10 ka, there has been appreciably more recharge along the eastern mountain front at Albuquerque than either to the north or south of Albuquerque. Factors that may contribute to this difference are 1. A greater thickness of ancestral Rio Grande sands and gravels at Albuquerque than elsewhere along the eastern mountain front (Hawley and Haase, 1992), 2. The presence of structural features, including the Hubble Bench and Tijeras and Hubble Springs fault zones to the south,that place low permeability rocks at shallow depths, and 3. Higher precipitation rates along the Sandia Mountains at Albuquerque than along lower altitude portions of the eastern mountain front. A groundwater-flow model developed with MODFLOW (McDonald and Harbaugh, 1988) was used to estimate recharge to the Middle Rio Grande basin. Travel times to observation wells were calculated using MODPATH (Pollock, 1994). The MODFLOW and MODPATH representations of the basin were calibrated using UCODE (Poeter and Hill, 1998). The model domain was divided into a rectilinear grid comprised of 156 rows and 80 columns of equally spaced 1-km size cells (Sanford et al., 2004a, 2004b). The eastern and western model boundaries mostly were coincident with faults that either act as barriers to horizontal groundwater movement or separate areas with different thickness of permeable sediment (Kernodle et al., 1995). The
4
vertical extent of the aquifer system was represented by nine model layers of variable thickness down to the base of the Santa Fe Group sediments at 2,400 m below sea level at the deepest point.
River-cell boundaries were implemented over the width of the inner valley of the Rio Grande, and along the Jemez River and Rio Puerco to represent the groundwater/surface-water interaction along those waterways. The recharge was divided into segments along the eastern and southern mountain fronts and arroyos. Several underflow segments were specified, extending the length of the northern and western model boundaries. The hydraulic conductivity zones for the basin were based on the three-dimensional geologic model of Cole (2001; see also Bartolino and Cole, 2002). A total of 18 hydraulic conductivity zones were defined within the groundwater-flow model (Sanford et al., 2004a, 2004b). Vertical conductances in the groundwater-flow model were divided into twelve zones—the associated parameters were represented as values of vertical anisotropy. Two fault zones, representative of the Cat Mesa fault zone in the southwestern part of the basin and the Sandia Fault zone along the eastern mountain front at Albuquerque were added to the groundwater-flow model as discrete (low) hydraulic conductivity zones (Figure 6).
Porosity for the unconsolidated sediment of the basin was estimated from field measurements (Stone et al., 1998; Haneberg, 1995) and assigned separately for the model layers beginning with 36 percent for model layer 1 and decreasing 2 percent per layer down to 20 percent for layer 9.
Hydrochemical tracer data were used as a part of the calibration of the groundwater-flow model. Groundwater ages obtained from 14C activities were one set of these data. Simulated ages were obtained by using MODPATH to track the line of travel of a parcel of water from the observation well backward to its recharge location. Hydrodynamic dispersion in these calculations was neglected, as the effect of dispersion on the concentrations from a nearly invariant source over a 100 km basin would be negligible for values of longitudinal dispersivity less than 1 km (Phillips et al., 1989; Johnson and DePaolo, 1996).
Another source of tracer information that was used for model calibration was the delineation of the hydrochemical zones (Figure 5), representing different water sources. MODPATH was used to simulate the locations of the boundaries between hydrochemical zones, which were compared to the observed locations (Figure 5). The groundwater model was calibrated using a combination of a nonlinear least-squares regression method as it is implemented in the computer code UCODE (Poeter and Hill, 1998), and manual adjustment of individual parameters. The groundwater model first was set up to simulate steady-state groundwater flow prior to the development of groundwater as a resource within the basin. The head data were compiled by Bexfield and Anderholm (2000) from many sources (Figure 6), and the hydraulic heads from the final simulation matched relatively well with the observed heads (Sanford et al., 2004a, 2004b).
The final model configuration reproduced the groundwater trough that extends north to south through the west-central part of the basin, although not as far north as some of the measured water levels indicate (Figure 6). Earlier models (e.g. Kernodle et al., 1995) did not manage to reproduce this feature. Attempts also were made by Tiedeman et al. (1998) to investigate different conceptual models of what was creating the trough, including a high permeability zone or a north-south trending fault. Sanford et al. (2004b), however, demonstrated that by lowering the basin boundary recharge in the model, the aquifer system changed from one dominated by the movement of water from the boundaries toward the Rio Grande to one dominated by water leaking from and back into the Rio Grande. The latter conceptual system results in heads to the west of the Rio Grande that are lower than the river, and is consistent with the presence of the trough and the relatively low recharge values estimated with the model. The final model configuration also reproduces the losing section of the Rio Grande that occurs just north of Albuquerque (Figure 6). Additional details of the groundwater flow model and calibration procedure are given in Sanford et al. (2004a, 2004b), and Plummer et al. (2004c).
5
From the water-level contours (Figure 6), one can see that groundwater moves away from the Rio Grande both to the west toward the trough, and to the south beneath the city of Albuquerque, as also is shown by the predevelopment water-table map (Figure 6). This zone of Rio Grande water beneath the city also is corroborated by the hydrochemical zone delineation (Figures 5 and 7).
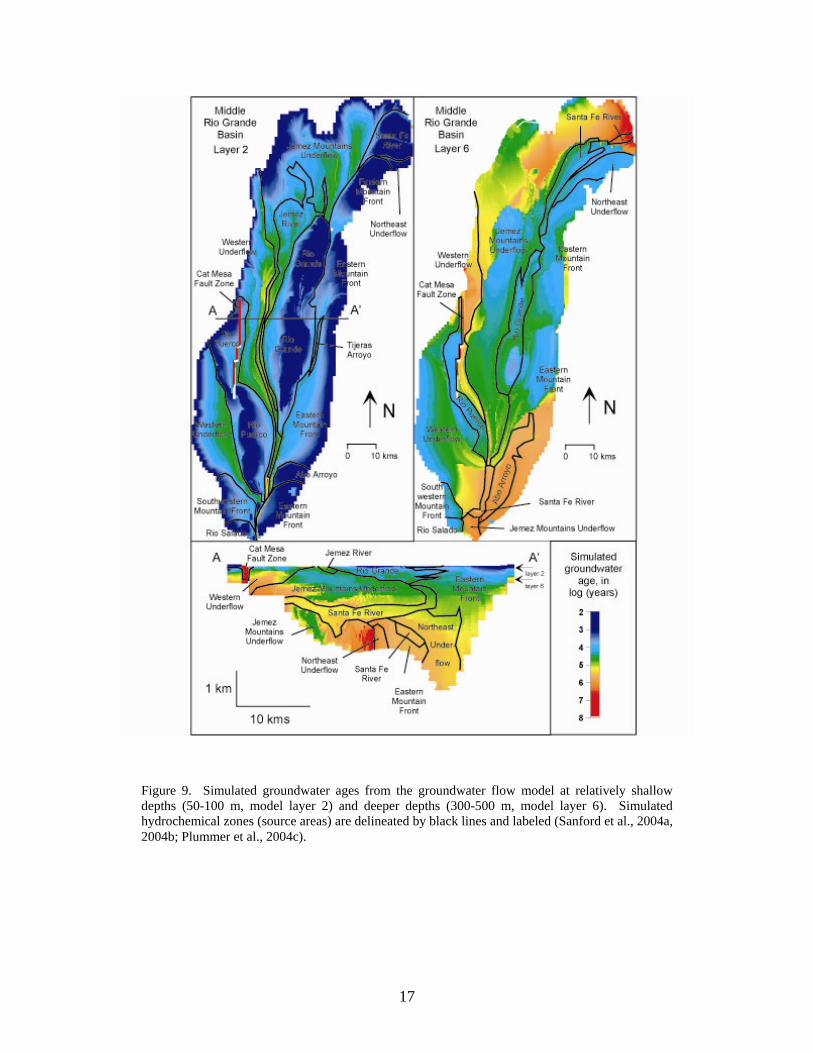
Simulated ages are shown in Figure 9 for two of the model layers. Young water (< 3,000 years), represented by the dark blue areas in layer 2, is present near the mountain fronts where recharge occurs at the land surface, and along the Rio Grande and Rio Puerco near where the rivers are losing water to the aquifer system. Modeled ages in layer 6 at depths of 300-500 m below the water table are shown in the right panel of Figure 9. A cross section of the simulated ages reveals a general pattern of increasing simulated age with depth, but the heterogeneity of the system in some places creates local inversions where old water is simulated above younger water moving through a more permeable zone. The hydrochemical zones also were simulated using MODPATH using source-area delineation of path lines, as shown on Figure 9.
Recharge was not specified directly for the Rio Puerco and the Jemez River in the model, but was calculated through their riverbed conductance values. The calculated recharge rates were 0.14 m3
s-1 for the Rio Puerco and 0.01 m3 s-1 for the Jemez River (Sanford et al., 2004a, 2004b; Plummer et al., 2004c). The recharge for the Rio Puerco was similar to values used in earlier models, but the Jemez River recharge value was much lower. Recharge from the eastern mountain front was estimated to be 0.33 m3s-1, with 0.04 m3s-1 of additional recharge from Abo Arroyo. These numbers are appreciably lower than previous estimates that were based on rainfall-runoff equations (Kernodle et al., 1995), but are similar to estimates of recharge of 0.35 and 0.05 m3s-1 along the eastern mountain front and Abo Arroyo and vicinity, respectively, made from a field study of chloride mass-balance (Anderholm, 2001). McAda and Barroll (2002) created a groundwater-flow model of the basin partially incorporating preliminary results from this study. They used a combination of some higher recharge values used in the earlier studies, and lower values estimated by Anderholm (2001), and in Sanford et al. (2004a, 2004b).
Total recharge to the basin was estimated by Sanford et al. (2004a, 2004b) to be 2.14 m3s-1, with 0.78 m3 s-1 of the total attributed to infiltration from the Rio Grande. The basin-margin recharge estimated from the model, 1.37 m3 s-1, is one-fourth of the 5.45 m3 s-1 estimate used in the Kernodle et al. (1995) model and one-half of that used by McAda and Barroll (2002). Overall, the lower recharge values are consistent with the presence of the groundwater trough and zone of Rio Grande water in the central basin. McAda and Barroll (2002) partially reproduced these features by adding N-S trending fault barriers in the center of the basin.
Some of the results of Plummer et al., (2004a, 2004b, 2004c) and Sanford et al. (2004a, 2004b) helped change conceptualization of groundwater flow in the Middle Rio Grande basin, as follows: 1. The Kernodle et al. (1995) model obtained a modern basin-scale recharge rate of 5.45 m3 s-1,
which was mostly derived from mountain front and arroyo recharge, with no net recharge from the Rio Grande. In comparison, the Sanford et al. (2004a, 2004b) model found a basin-scale recharge rate, 2.14 m3 s-1, which is only about 39% of the previous model, with mountain front recharge at Albuquerque only about 20% of the previous model. Further, the Sanford et al. model shows that there is much more recharge from Rio Grande than previously thought (36% of the basin recharge is from the Rio Grande). From a water-management perspective, the results show that there is even less modern recharge to the aquifer in the vicinity of Albuquerque than previously thought.
2. The Sanford et al. model and hydrochemical data show that groundwater flow paths are generally parallel to the Rio Grande, rather than perpendicular, near the eastern mountain front, and especially beneath Albuquerque.
6
3. Most of the locations of the hydrochemical zones are consistent with the pre-development surface, but the groundwater trough is not, and may represent a recent lowering of recharge along the basin margins.
4. Large age gradients with depth indicate most flow occurs in upper parts of the aquifer (large vertical anisotropy); spatial differences in age gradients indicate differences in geologic and hydrologic conditions. A recharge rate of 3 cm yr-1 was found along the mountain front at Albuquerque and beneath Rio Grande at Albuquerque.
5. There appears to be relatively large amounts of groundwater inflow into the northern part of the basin, either under or from the Jemez Mts.
Finally, a transient groundwater-flow simulation was performed using twelve 2,500-year time steps (Sanford et al., 2004a, 2004b; Plummer et al., 2004c) to investigate the effect of time-varying recharge rates over the past 30 ka. Results from the transient simulation indicate that recharge was greater before 15,000 years ago than today. The optimal values for the recharge multipliers are greater than 10 for the period between 20 ka and 25 ka B.P. Evidence for a wetter climate during this period is present in the Estancia Basin, just east of the Sandia Mountains, in the form of playa lake deposits (Bachhuber, 1992; Allen and Anderson, 2000). Although precipitation may have increased by a factor of approximately 2.5 during the Last Glacial Maximum relative to today (Thompson et al., 1999), a small percentage increase in rainfall in arid regions can easily lead to a much larger percentage increase in recharge. The paleorecharge rates from the transient simulation were accompanied by high degrees of uncertainty. Underflows 10 times modern rates also would require hydraulic gradients 10 times greater, and this rate is highly unlikely, if not physically impossible in some regions. Also, vertical transverse dispersivity likely contributes additional 14C to some older waters of the basin, leading to ages that are younger than advective travel times, and, in turn, higher paleorecharge rates. The highest values of paleorecharge predicted should, therefore, be seen as maximum rates, and likely greater than the actual rates. The results consistently point to an amount of recharge just before or at the beginning of the Holocene that was lower than modern values.
The overall lesson from the Middle Rio Grande Basin study is that geochemical and isotopic data were of considerable value in refining the conceptual model of groundwater flow and improving the calibration of numerical models of groundwater flow in the basin. The model was aided by new hydrogeologic data collected as a part of this study. The modeling exercise is viewed as an iterative process of data gathering and model refinement (as discussed in Chapter 2). References Cited Allen, B. D., and R. Y. Anderson, A continuous, high-resolution record of late Pleistocene
climate variability from the Estancia basin, New Mexico, Geol. Soc. Am. Bull., 112, 1444-1458, 2000.
Anderholm, S. K., Mountain-front recharge along the east side of the Albuquerque Basin, Central New Mexico (revised), U.S. Geol. Surv. Water-Resour. Invest. Rep. 00-4010, 36 pp., 2001.
Bachhuber, F. W., A pre-late Wisconsin paleolimnologic record from the Estancia Valley, central New Mexico, in The Last Interglacial-Glacial Transition in North America, edited by P. U. Clark and P. D. Lea, pp. 289-307, Geol. Soc. Am. Spec. Pap. 270, 1992.
7
Bartolino, J.R., and Cole, J.C. 2002, Ground-water Resources of the Middle Rio Grande Basin, New Mexico, U.S. Geological Survey Circular 1222, 132p, http://pubs.usgs.gov/circ/2002/circ1222/
Bexfield, L. M., and S. K. Anderholm, S.K., Predevelopment water-level map of the Santa Fe Group aquifer system in the Middle Rio Grande Basin between Cochiti Lake and San Acacia, New Mexico, U.S. Geol. Surv. Water-Resour. Invest. Rep. 00-4249, 1 sheet, 2000.
Bexfield, L. M., and S. K. Anderholm., Estimated water-level declines in the Santa Fe Group aquifer system in the Albuquerque area, central New Mexico, predevelopment to 2002, U.S. Geol. Surv. Water-Resour. Invest. Rep. 02-4233, 1 sheet, 2002.
Bjorklund, L. J., and B. W. Maxwell, Availability of groundwater in the Albuquerque area, Bernalillo and Sandoval Counties, New Mexico, New Mexico State Engineer Tech. Rep. 21, 117 pp., 1961.
Cole, J. C., 3-D geologic modeling of regional hydrostratigraphic units in the Albuquerque segment of the Rio Grande rift, in U. S. Geological Survey Middle Rio Grande Basin Study--Proceedings of the Fourth Annual Workshop, Albuquerque, New Mexico, February 15-16, 2000, U. S. Geol. Surv. Open-File Rep. 00-488, edited by J.C. Cole, pp. 26-28, 2001. http://pubs.usgs.gov/of/2000/ofr-00-0488/
Connell SD, Allen BD, Hawley JW (1998) Subsurface stratigraphy of the Santa Fe Group from borehole geophysical logs, Albuquerque area, New Mexico. New Mexico Geology 17:79-87
Haneberg, W. C., Depth-porosity relationships and virgin specific storage estimates for the upper Santa Fe Group aquifer system, central Albuquerque Basin, New Mexico, New Mexico Geol., 17, 62-71, 1995.
Hawley, J. W., and C. S. Haase, Hydrogeologic framework of the northern Albuquerque Basin, New Mexico Bur. Mines and Mineral Resour., Open-File Report 387, variously paged, Socorro, 1992.
Johnson, T. M., and D. J. DePaolo, Reaction-transport models for radiocarbon in groundwater: The effects of longitudinal dispersion and the use of Sr isotope ratios to correct for water-rock interaction, Water Resour. Res., 32, 2,203-2,212, 1996.
Kernodle, J. M., D. P. McAda, and C. R. Thorn, Simulation of ground-water flow in the Albuquerque Basin, central New Mexico, 1901-1994, with projections to 2020, U.S. Geol. Surv. Water-Resour. Invest. Rep. 94-4251, 114 pp., 1995.
McAda, D. P., and P. Barroll, Simulation of ground-water flow in the Middle Rio Grande Basin between Cochiti and San Acacia, New Mexico, U.S. Geol. Surv. Water-Resour. Invest. Rep. 02-4200, 81pp., 2002.
McDonald, M. G., and A. W. Harbaugh, A modular three-dimensional finite-difference ground-water flow model, U. S. Geol. Surv. Tech.Water-Resour. Invest., bk 6, chap. A1, variously paged, 1988.
Phillips, F. M., M. K. Tansey, and L. A, Peeters, An isotopic investigation of groundwater in the central San Juan Basin, New Mexico: Carbon 14 dating as a basis for numerical flow modeling, Water Resour. Res., 25, 2259-2273, 1989.
Plummer, L. Niel, Bexfield, Laura M., Anderholm, Scott K., Sanford, Ward E., and Busenberg, Eurybiades, 2004a, Geochemical characterization of ground-water flow in the Santa Fe Group aquifer system, Middle Rio Grande Basin, New Mexico. U.S. Geological Survey Water-Resources Investigations Report 03-4131 395p, http://pubs.usgs.gov/wri/wri034131/.
8
Plummer, L. N., Bexfield, L. M., Anderholm, S. K., Sanford, W. E., and Busenberg, E., 2004b, Hydrochemical tracers in the Middle Rio Grande Basin, USA: 1. Conceptualization of groundwater flow. Hydrogeology Journal, v. 12(4), p. 359-388.
Plummer, L.N., W.E. Sanford, L.M. Bexfield, S.K. Anderholm, and E. Busenberg, 2004c, Using geochemical data and aquifer simulation to characterize recharge and groundwater flow in the Middle Rio Grande Basin, New Mexico, in Groundwater Recharge in a Desert Environment: The Southwestern United States, edited by J.F. Hogan, F.M. Phillips, and B.R. Scanlon, Water Science and Applications Series, vol. 9, American Geophysical Union, Washington, D.C., 185-216.
Poeter, E. P., and M. C. Hill, Documentation of UCODE, a computer code for universal inverse modeling, U. S. Geol. Surv. Water-Resour. Invest. Rep. 98-4080, 116 pp., 1998.
Pollock, D. W., User’s guide for MODPATH/MODPATH-PLOT, version 3: A particle tracking post-processing package for MODFLOW, the U. S. Geological Survey finite-difference ground-water flow model, U. S. Geol. Surv. Open-File Rep. 94-464, variously paged, 1994.
`Sanford, W. E., Plummer, L. N., McAda, D. P., Bexfield, L. M., and Anderholm, S. K., 2004a, Hydrochemical Tracers in the Middle Rio Grande Basin, USA: 2. Calibration of a Ground-water Flow Model. Hydrogeology Journal, v. 12(4), p. 389-407.
Sanford, W.E., Plummer, L.N., McAda, D.P., Bexfield, L.M., and Anderholm, S.K., 2004b, Use of environmental tracers to estimate parameters for a predevelopment-ground-water-flow model of the Middle Rio Grande Basin, New Mexico: U. S. Geological Survey Water-Resources Investigations Report 03-4286, 102 p.
Stone, B. D., B. D. Allen, M. Mikolas, J. W. Hawley, W. C. Haneberg, P. S. Johnson, B. Allred, and C. R. Thorn, Preliminary lithostratigraphy, interpreted geophysical logs, and hydrogeologic characteristics of the 98th Street core hole, Albuquerque, New Mexico, U.S. Geol. Surv. Open-File Rep. 98-210, 82 pp., 1998.
Thompson, R. S., K. H. Anderson, and P. J. Bartlein, Quantitative paleoclimatic reconstructions from late Pleistocene plant macrofossils of the Yucca Mountain Region, U.S. Geol. Surv. Open-File Rep. 99-338, 38 pp., 1999.
Thorn, C. R., D. P. McAda, and J. M. Kernodle, Geohydrologic framework and hydrologic conditions in the Albuquerque Basin, central New Mexico, U.S. Geol. Surv. Water-Resour. Invest. Rep. 93-4149, 106 pp., 1993.
Tiedeman, C. R., J. M. Kernodle, and D. P. McAda, Application of nonlinear-regression methods to a ground-water flow model of the Albuquerque Basin, New Mexico, U.S. Geol. Surv. Water-Resour. Invest. Rep. 98-4172, 90 pp., 1998.
Titus FB (1963) Geology and ground-water conditions in eastern Valencia County, New Mexico. New Mexico Bureau of Mines and Mineral Resources Ground-Water Report 7, Socorro, NM.
Titus, F. B., Ground-water geology of the Rio Grande trough in north-central New Mexico, with sections on the Jemez Caldera and Lucero Uplift, in Guidebook of the Albuquerque country, edited by S. A. Northrop, pp. 186-192, New Mexico Geol. Soc., 12th Field Conf., 1961.
9
A′ A A
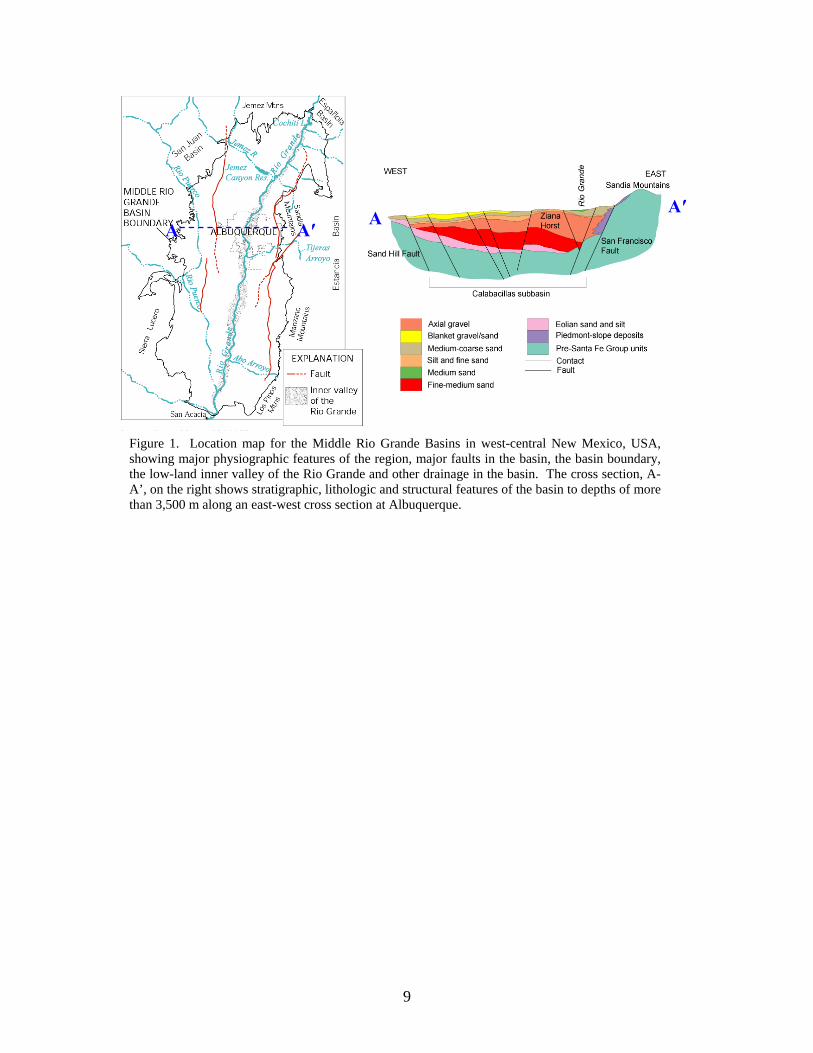
Figure 1. Location map for the Middle Rio Grande Basins in west-central New Mexico, USA, showing major physiographic features of the region, major faults in the basin, the basin boundary, the low-land inner valley of the Rio Grande and other drainage in the basin. The cross section, A-A’, on the right shows stratigraphic, lithologic and structural features of the basin to depths of more than 3,500 m along an east-west cross section at Albuquerque.
A′
10
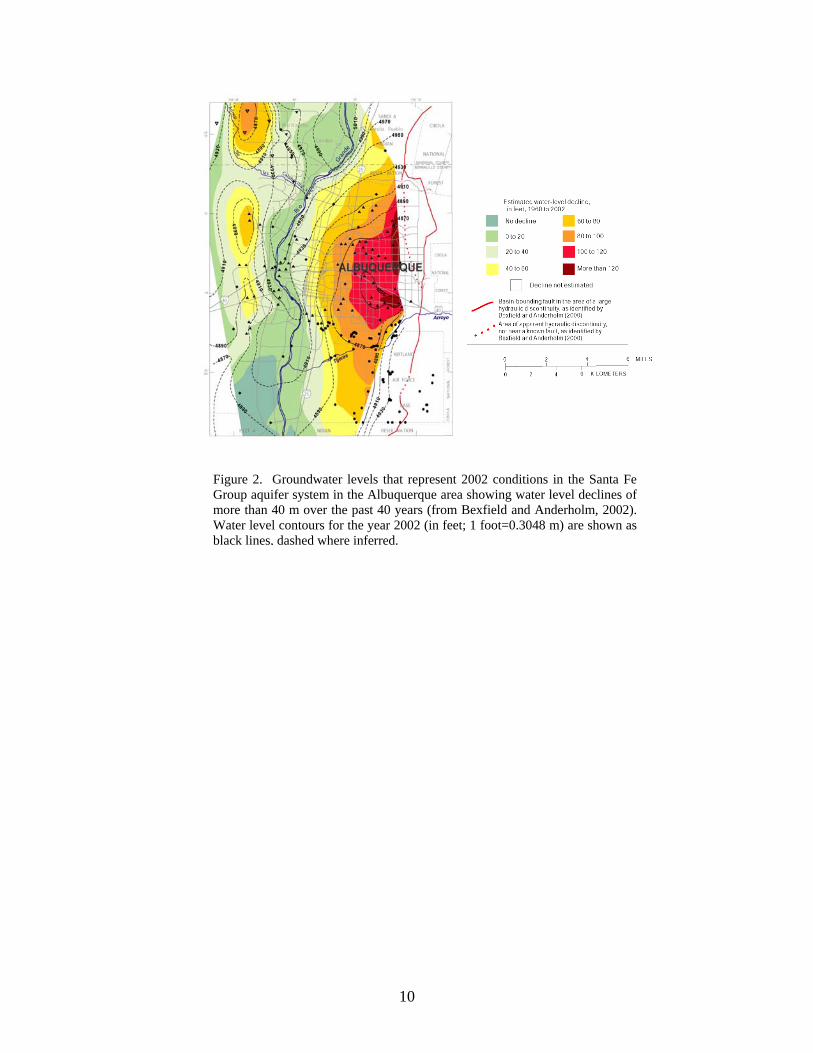
Figure 2. Groundwater levels that represent 2002 conditions in the Santa Fe Group aquifer system in the Albuquerque area showing water level declines of more than 40 m over the past 40 years (from Bexfield and Anderholm, 2002). Water level contours for the year 2002 (in feet; 1 foot=0.3048 m) are shown as black lines, dashed where inferred.
11
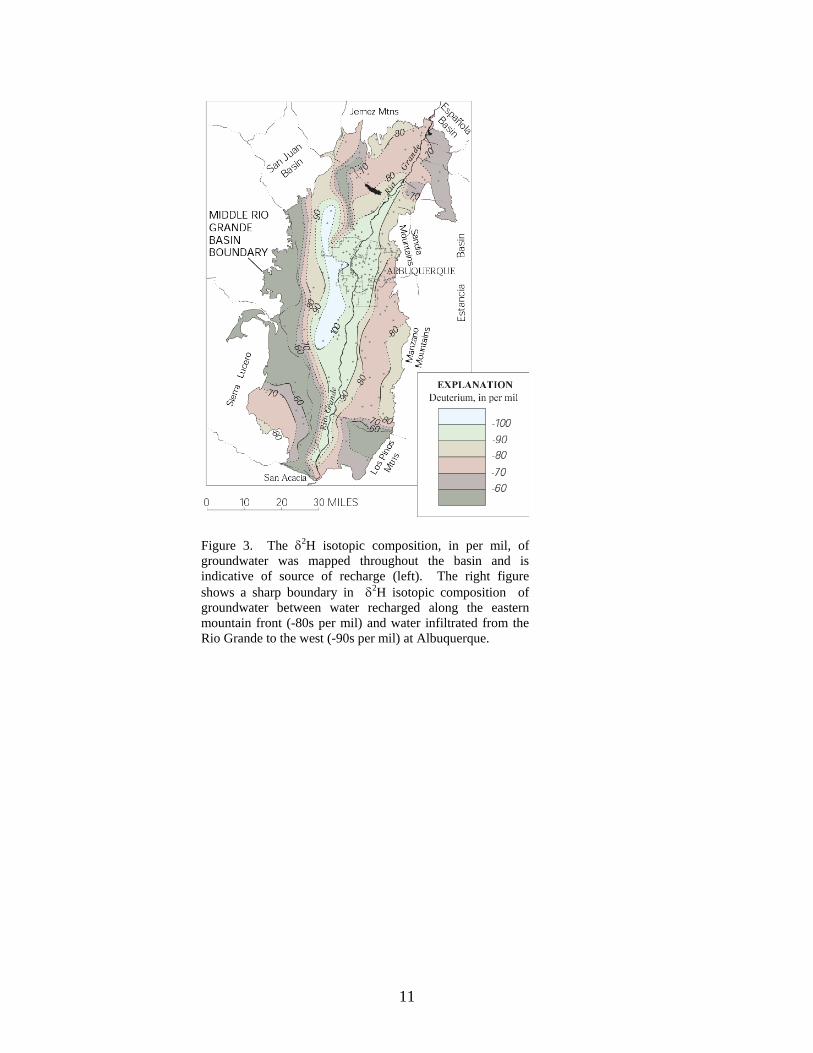
Figure 3. The δ2H isotopic composition, in per mil, of groundwater was mapped throughout the basin and is indicative of source of recharge (left). The right figure shows a sharp boundary in δ2H isotopic composition of groundwater between water recharged along the eastern mountain front (-80s per mil) and water infiltrated from the Rio Grande to the west (-90s per mil) at Albuquerque.
12
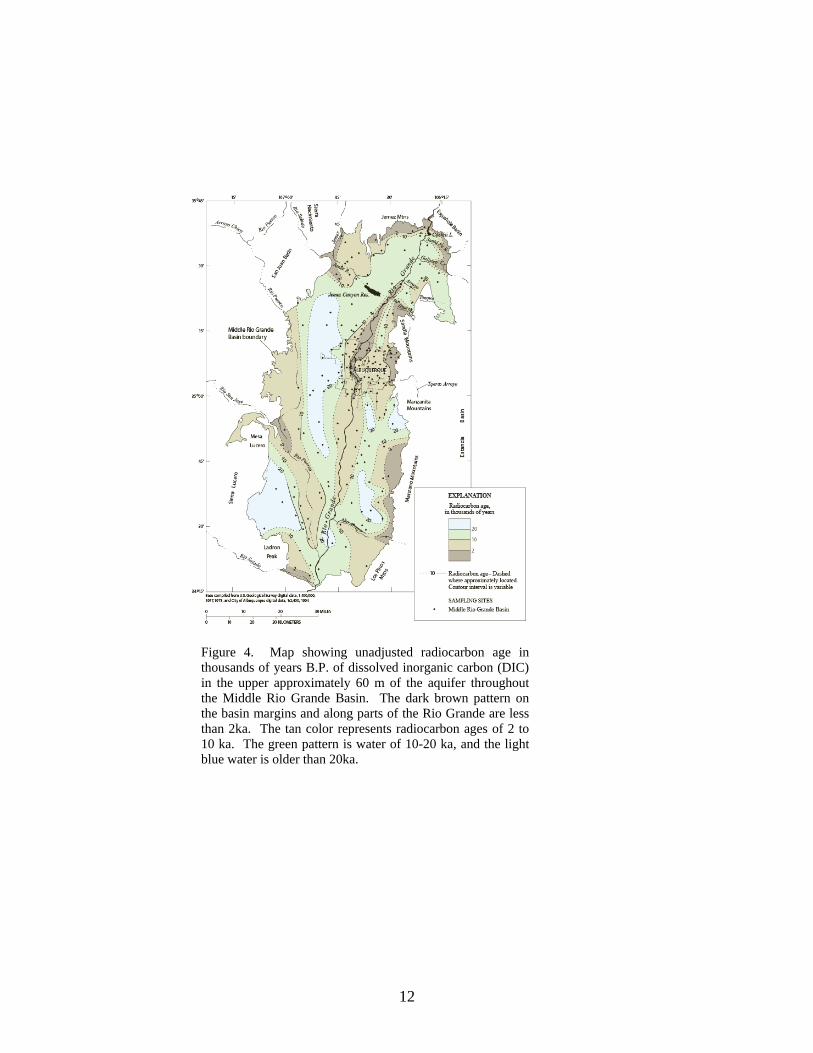
Figure 4. Map showing unadjusted radiocarbon age in thousands of years B.P. of dissolved inorganic carbon (DIC) in the upper approximately 60 m of the aquifer throughout the Middle Rio Grande Basin. The dark brown pattern on the basin margins and along parts of the Rio Grande are less than 2ka. The tan color represents radiocarbon ages of 2 to 10 ka. The green pattern is water of 10-20 ka, and the light blue water is older than 20ka.
13
Figure 5. Maps showing location of 12 sources of water to the Middle Rio Grande Basin identified based on the chemical and isotopic characteristics (Plummer et al., 2004a). The arrows show the inferred directions of groundwater flow based on the chemical and isotopic data.
14
Figure 6. Map showing pre-development water levels in the Middle Rio Grande Basin, inferred directions of flow based on the pre-development potentiometric surface, and location of major faults.
15
Figure 7. Cross section of the Upper Santa Fe aquifer system at Albuquerque showing ranges of radiocarbon age as a function of depth and water sources. The slanted grey patterns denote approximate locations of hydrochemical zone boundaries.
16
0 5 10 15 20 25RADIOCARBON AGE, IN THOUSANDS OF YEARS
300
200
100
0
MID
-DEP
TH B
ELO
W W
ATE
R T
AB
LE, I
N M
ETER
S
Eastern Mountain FrontAlbuquerque vicinitySouth of Tijeras ArroyoNorth of Albuquerque
Figure 8. Radiocarbon ages of DIC in groundwater of the Middle Rio Grande Basin at Albuquerque and in areas just north and south of Albuquerque (south of Tijeras Arroyo). Two age-depth relations are apparent and are related to lithologic and structural features along the eastern margin of the basin.
17
Figure 9. Simulated groundwater ages from the groundwater flow model at relatively shallow depths (50-100 m, model layer 2) and deeper depths (300-500 m, model layer 6). Simulated hydrochemical zones (source areas) are delineated by black lines and labeled (Sanford et al., 2004a, 2004b; Plummer et al., 2004c).
![Chapter 2: The Middle Rio Grande Basin - USGS · hapter 2: The Middle Rio Grande Basin ... study of rocks and their features, ... Weather Service Field Office; —, still in operation]](https://img.pdfslide.us/doc/110x75/5b435ece7f8b9a38048b5054/chapter-2-the-middle-rio-grande-basin-usgs-hapter-2-the-middle-rio-grande.jpg)