Embed Size (px)
Citation preview

1
February 2018 E.B 2018-02
CASE STUDIES OF SUPERMARKETS AND FOOD SUPPLY CHAINS IN LOW-INCOME AREAS OF THE NORTHEAST:
A CROSS CASE COMPARISON OF 11 CASE STUDIES
Kristen S. Park, Miguel I. Gómez, Kate Clancy
Food Industry Management Program Charles H. Dyson School of Applied Economics and Management College of Agriculture and Life Sciences Cornell University, Ithaca, NY 14853
This research was supported by USDA-NIFA AFRI Grant #2011-68004-30057: Enhancing Food Security in the Northeast through Regional Food Systems, a joint project of 11 institutions led by the Northeast Regional Center for Rural Development.

It is the policy of Cornell University actively to support equality of educational and
employment opportunity. No person shall be denied admission to any educational program or activity or be denied employment on the basis of any legally prohibited discrimination involving, but not limited to, such factors as race, color, creed, religion, national or ethnic origin, sex, age or handicap. The University is committed to the maintenance of affirmative action programs which will assure the continuation of such equality of opportunity.

i
Case Studies of Supermarkets and Food Supply Chains in Low-Income Areas of the Northeast: A Cross Case Comparison of 11 Case Studies. By Kristen S. Park1,4, Miguel Gómez2, Kate Clancy3, Extension Bulletin 2018-02 Charles H. Dyson School and Applied Economics and Management, College of Agriculture and Life Sciences, Cornell University, Ithaca, NY 14853.
Acknowledgements The authors would like to acknowledge the enormous contributions of the store participants and their supply chain partners. In addition we would like to thank the EFSNE project investigators for their support developing important ongoing relationships with store personnel and project participants and conducting many interviews. This work was supported by USDA grant #2011-68004-30057
1 Extension Associate, Charles H. Dyson School of Applied Economics and Management, Cornell University 2 Associate Professor, Charles H. Dyson School of Applied Economics and Management, Cornell University 3 Food Systems Consultant 4 Author contact: 475C Warren Hall, Charles H. Dyson School of Applied Economics and Management, Cornell University, Ithaca, NY 14853- 7801, [email protected], +1-607-255-7215

ii
Table of Contents Introduction ................................................................................................................................................ 1 Methods ....................................................................................................................................................... 1 Key Lessons................................................................................................................................................. 2
Store Environment: The effects of ownership, size and economies of scale .............................. 2 Regional Production of Market Basket Items .................................................................................. 4 Effect of Geography/Distance ............................................................................................................ 6 Extent of Regional Value-Added Activity ..................................................................................... 11
Discussion ................................................................................................................................................................. 12
List of Tables Table 1: Percent of Stores’ Market Basket Items Produced in the Northeast .................................... 5 Table 2: Estimates of the Percent of Value-Added Activities Performed in the Region ............... 12
List of Figures Figure 1: Average Transportation Miles for Market Basket Items, Regional versus Non-Regional
Supply Chains ............................................................................................................................ 7 Figure 2: Total Fuel Use per Hundredweight, Regional versus Non-Regional Supply Chains .... 8 Figure 3: Figure 3. Transportation as a Percent of Retail Price ........................................................... 9 Figure 4: Producer Price Margins as a Percent of Retail Price, Regional versus Non-Regional
Supply Chains .......................................................................................................................... 10

1
Introduction Researchers conducted a series of 11 case studies as part of a U.S. Department of Agriculture funded project titled “Enhancing Food Security in the Northeast through Regional Food Systems (EFSNE).” This seven-year research, education, and outreach project examined food production, distribution, and consumption in the Northeast U.S. (defined as 12 states from Maine to West Virginia and the District of Columbia) with the goal of understanding the potential for regional food systems to address food security challenges in the region. The project included collaborators from 11 different universities and other institutions. As part of the project’s distribution, consumption, and outreach objectives, five urban and four rural study locations in the Northeast were identified for community- and store-level analysis.
These case studies described and characterized the participating supermarkets which operated in low-income neighborhoods and identified and measured the regional and non-regional food supply chains that served the stores. The in-depth descriptions of supermarket supply chains have not been described elsewhere in the literature. The cases estimated price margins for each member of the supply chains as well as price margins as a percent of retail price, food miles, fuel expended, and fuel efficiency. In addition, the cases presented a unique calculation method and measurement of the proportion of the economic, value added activity conducted within the Northeast region from our market basket supply chains. Although the number of market basket items analyzed was very small, the number of different supply chains was far greater and provided a glimpse into many different supply arrangements and supplier entities.
This report summarizes the findings that cut across the cases. These are presented as key lessons that offer researchers and policymakers a better understanding of how regional food systems operate and how policies may be made to maintain a sustainable food system in the Northeast.
Methods Our cases considered 11 supermarkets in the Northeastern United States that are located in both urban and rural environments. From each supermarket, we examined the supply chains of two of the eight foods in the EFSNE project’s market basket, which served as a focal point for many of its research activities.
In order to compare regional supply chains to non-regional chains, we selected foods that were being grown or produced in the Northeast or had the potential to be produced in the Northeast. The market basket foods included fresh apples, fresh potatoes, fresh cabbage, milk, ground beef, bread, canned peaches, and frozen broccoli. Each product, except for bread, was studied at least twice, in that each product was represented in at least two different stores.

2
Sufficient information could not be obtained to analyze the bread supply chains in these case studies, but bread is included in research from the larger EFSNE project1.
We conducted interviews with store owners and managers about general store characteristics, operations, sales of market basket items, and suppliers of these same items. We then conducted interviews with store suppliers, supplementing them with secondary research when needed. Information was gathered on marketing margins, prices, volumes, flows, quality of relationships among supply chain participants, form of contracts, and mode of transportation.
We defined a regional supply chain as one where the product is produced, or grown, in the region, and we assessed how these supply chains are configured, how they operate, and how they compare to non-regional supply chains on transportation efficiency, share of retail price, and contribution to value-added economic activity.
With one exception, the retailers involved in the project were all supermarkets according to the U.S. Census definition, which characterizes supermarkets as establishments “primarily engaged in retailing a general line of food, such as canned and frozen foods; fresh fruits and vegetables; and fresh and prepared meats, fish, and poultry.”2 The formats of the supermarkets varied from limited-assortment stores, to a discount grocer selling closeout foods, to supermarkets with a standard product assortment. The exception was the inclusion of a large convenience store that offered a number of products not usually sold in this store format, including produce, fresh meats, dairy products, and frozen foods. Ten of the 11 stores were smaller on a square foot basis than the average U.S. supermarket.
Key Lessons Key economic and supply chain characteristics shared by our 11 case studies are described below.
Store Environment: Effects of ownership, size and economies of scale In general, ownership, size, and economies of scale can affect the structures of a store’s supply chains. • In these cases, all stores were independently owned. Being independently owned often
constrains the size of the supermarket business. Single proprietors generally do not have the wealth to own and manage supermarket chains large enough to self-distribute, that is, to
1 Clancy, K., Bonanno, A., Canning, P., Cleary, R., Conrad, Z., Fleisher, D., Gomez, M., Griffin, T., Lee, R., Kane, D., Palmer, A., Park, K., Peters, C., Tichenor, N. Using a Market Basket to Explore Regional Food Systems. Journal of Agriculture, Food Systems, and Community Development. Volume 7, Issue 4 / Fall 2017. 2 U.S. Census Bureau. Industry Statistics Portal. NAICS definition located at: https://www.census.gov/econ/isp/sampler.php?naicscode=445110&naicslevel=6#.

3
have their own distribution centers. In general, these types of operations purchase the majority of their supplies from large grocery wholesalers and fill in the rest of their supplies from smaller distributors, wholesalers, and manufacturers. This was the case with seven of the 11 supermarkets; however, some stores used alternatives to the large grocery wholesalers:
o Two of the stores were licensed and operated under the guidelines of a contract
with large chain store companies. These chain companies hired their own buying staff and had distribution centers. The two store licensees bought the majority of their supplies from these distribution centers.
o Two of the remaining nine stores self-distributed, which means that they purchased directly from processors or manufacturers, maintained a warehouse, and distributed supplies to their own stores.
• Direct control of their supply chains back to the producer was usually not possible for our
stores. On the other hand, we observed that many of these independent stores often had enough flexibility to purchase from a variety of specialty wholesalers in order to offer a curated assortment of products targeted to their primary customer. Every store could theoretically purchase directly from a farm if it were economically feasible, even though only one store in our study did so.
• We observed that even though the two licensed stores were able to enjoy economies of scale
by purchasing from their chain store wholesaler, they had to purchase almost exclusively from this wholesaler and had to follow strict guidelines for store layout, product assortment, store design and fixtures, and other store operations. The license agreements were similar to owning a licensed McDonald’s restaurant. That is, almost all the store products were supplied by the parent company. The assortment of products, the pricing and the promotional strategies, among others, were dictated by the parent company.
• On the other hand, we observed that the independent stores who purchased from
wholesalers often had flexibility in procurement strategies. Such procurement structure may give an independent store certain advantages. For example:
o Some stores strategically developed their product assortment to cater to their
customers and neighborhood even though this meant finding alternative and niche suppliers and working with multiple suppliers. These efforts set them apart from other stores with standard product assortments. For example, one store made the effort to locate and purchase Middle Eastern products from a distant specialty distributor. In another case, the convenience store was owned by an entrepreneur interested in developing his stores to include more food options and in bringing healthier foods to his stores. This commitment to more and healthier food choices required the store to engage a produce wholesaler vendor to supply fresh fruits and vegetables. In this store’s case study, we determined that the produce wholesaler

4
purchased approximately 64 percent of its potatoes and 70 percent of its cabbage from growers within the state.
o These stores significantly outperformed the average U.S. supermarket store in several key retail performance metrics including weekly sales, weekly sales per square foot, and weekly sales per full-time employee.
• Several of our participating independent stores engaged in alternative buying arrangements
which helped them offer competitive prices to their customers. These arrangements included:
o being a member of a retail cooperative in which independent stores form a
cooperative for the purpose of buying directly from manufacturers. o owning a warehouse and buying in bulk at lower prices and selling to the company’s
stores as well as to additional customers. o buying and selling extremely discounted products that are overstocked, close to their
expiration date or expired. • The size of the store itself can affect operations costs for delivery, replenishment, and labor.
Deliveries of smaller volumes are more costly and less efficient. Wholesalers and distribution centers often have to break apart full cases to pick individual items for small orders, and transportation is more expensive for small drop sizes. Ten of our 11 stores were physically smaller than the average U.S. supermarket. In our case studies, two stores managed this issue by placing fewer orders per week but ordering delivery of greater volume. For example, one store had a large backroom storage space to accommodate larger volume deliveries. A second store negotiated use of environmentally controlled space nearby to increase the size of delivery. According to the store managers, this allowed them to better manage orders, reduce out-of-stocks, control perishables shrink, and improve product quality.
Regional Production of Market Basket Items • The Northeast region is an important producer of some of the eight market basket items:
apples, cabbage, and fluid milk. It also produces potatoes for fresh consumption and for processing as chips and sends some beef cattle as well as dairy cattle into beef processing. Although the region grows fresh peaches and fresh broccoli, it does not manufacture commercial volumes of canned peaches or frozen broccoli. Bread, the remaining market basket item, is frequently manufactured and baked close to consumption. In our case studies, bread was regionally manufactured; however, not enough data from supply chain members were gathered to estimate our supply chain performance measures. In addition, while the bread was manufactured in the region, not enough data were able to be gathered about the sources of wheat, which is the major ingredient in most breads. Therefore, information on regional versus non-regional bread supply chains is not presented below.

5
• A significant proportion of many of the market basket items that were purchased by the
stores were produced within the Northeast. This has never been enumerated before. Almost certainly, the scale of production in the Northeast for these items enables large scale marketing and distribution systems. Table 1 lists each of the market basket items (except bread), the proportion of the stores’ purchases that were produced within the region, and the proportion of U.S. production from the Northeast. For example, 77 percent of the case study stores’ total apple purchases were from Northeast apple growers, and the Northeast produces 15.6 percent of the U.S. fresh apples.
Table 1. Percent of Stores’ Market Basket Items Produced in the Northeast
Market Basket Item
Percentage of stores’ purchases produced
regionally1
Regional production as a % of U. S.
production Apples 77 16% Cabbage, fresh 40 20% Potatoes, fresh and processed 39 5% Ground beef na na Milk, including all dairy products 100 15% Peaches, processed 0 0% Broccoli, fresh and processed 0 0% 1 Researchers’ estimates from case study interviews 2 Calculated from USDA, NASS, Quickstats. https://www.nass.usda.gov/Data_and_Statistics/index.php.
• In general, case study stores procured from intermediaries (e.g. distributors, wholesalers or
manufacturers), and not directly from growers. With one exception, these stores were too small to have their own dedicated buying office and distribution center. This means that even though many of the stores’ apples, potatoes, and cabbages were grown by farms in the region, these supply chains were not any shorter than their non-regional counterparts. In addition, we observed some cases of alliances and “subcontracting” among grower/shippers within and outside of the region to supply some of the larger wholesalers. Some regional apple grower/shippers use sales agents who coordinate supplies from several growers to be able to supply large wholesalers. Some non-regional potato shippers have formal as well as informal arrangements with regional potato grower/shippers so they can reduce transportation time and freight charges for large wholesaler accounts.
o We found only one instance of direct delivery from a grower to a store. In this one
case, the grower was 11 miles away from the store and delivered directly to a
6
number of retailers. In addition, the owner preferred to purchase produce for direct store delivery from growers nearby and has purchased from this particular grower for almost 30 years.
Effect of Geography/Distance Past research has also examined food miles traveled by some specific products into a given market area. Spielman described the miles traveled by ground beef, milk, apples, and bread from the processing sites, through distribution centers to Missoula.3 Of all the conventional products in the study, Spielman found that ground beef traveled the most food miles to Missoula (an average of 1,215 miles). Like this study, Spielman was unable to trace the bread supply chain back to wheat farmers. The product that traveled the least amount of food miles was milk (an average of 162.5 miles). Spielman noted that food miles for these food supply chains is incomplete because they could not be traced back to the growers.
Earlier studies calculated the average miles food traveled before reaching the consumer. In a simple model of flows conducted in 1969, researchers estimated food traveled an average distance of 1,346 miles.4 Data from a 1980 study examining transportation and fuel was used to estimate transportation distances for fresh produce (1,500 miles), processed fruits and vegetables (800 miles), meat products (950 miles), and milk (50-75 miles).5 And a food bank report calculated a pound of produce traveled an average of 1,685 miles to the Jessup, Maryland terminal market, which serves a number of metropolitan areas along the Atlantic seaboard.6
• In our study, regional supply chains had substantially fewer food miles and transportation
costs than non-regional supply chains. In each of the metrics used to evaluate transportation, transportation mileage, fuel consumption per hundredweight, and transportation cost as a percent of retail price, regional supply chains were shorter geographically, more efficient, and less costly than their non-regional counterparts (Figures 1, 2, and 3).
o Figure 1 presents the average number of transportation miles from grower, or first supply chain member as described in our case study, to store. It compares the mileage for regional versus non-regional supply chains by market basket item. Regional supply chains for apples, cabbage, potatoes, and ground beef all
3 Spielman, Kimberly R., 2007. “Food Supply Chains and Food-Miles: An analysis for selected conventional, non-local organic and other-alternative foods sold in Missoula, Montana.” The University of Montana, thesis for master of arts. Missoula, MT. https://scholarworks.umt.edu/etd/458/ 4 U.S. Department of Defense, 1969. U.S. Agriculture: Potential Vulnerabilities. Stanford Research Institute, Menlo Park, CA. 5 Hendrickson, John, 1996. “Energy use in the U.S. Food System: A Summary of existing research and analysis.” Sustainable Farming-REAP-Canada. Ste. Anne-de’Bellevue, Quebec. Vol 7, No 4. Fall 1997. 6 Hora, Matthew, and Jody Tick, 2001. “From Farm to Table: Making the Connection in the Mid-Atlantic Food System.” Capital Area Food Bank of Washington D.C. report.

7
transported product along fewer miles than did non-regional supply chains. The milk supply chains were all regional. Even though mileage cannot be compared to a non-regional supply chain, the transportation mileage for milk was actually the shortest supply chain demonstrated. Only non-regional supply chains existed for canned peaches and frozen broccoli in our case studies. These supplies traveled the farthest in the case studies.
o Milk stands out in this study as well as the studies described above as being a product usually produced and processed within about 200 miles of its markets. Spielman estimated the distance milk traveled to the Missoula market as being 122-203 miles and Hendrickson estimated that milk traveled an average of 50-75 miles in the U.S.
Figure 1. Average Transportation Miles for Market Basket Items, Regional versus Non-Regional Supply Chains
Source: Researchers’ estimates from case study interviews
o Total fuel use for the case study supply chains exhibited the same patterns as did transportation miles (Figure 2). Regional supply chains used less fuel per hundredweight than did non-regional supply chains. And those products, such as milk, canned peaches and frozen broccoli that did not have the other type of supply chain to which to compare, exhibited similar fuel usage respectively.
o The impact of the mode of transportation can be seen on the fuel use for transporting frozen broccoli and canned peaches. These items traveled the farthest distances (see Figure 1) but fuel use per hundredweight was much less than for non-regional
259 321
730 693
1860 0
2035
1319
1951
1096
0
3261
2435
0
500
1000
1500
2000
2500
3000
3500
apples cabbage potatoes ground beef milk cannedpeaches
frozenbroccoli
mile
s
regional non-regional

8
apples and potatoes as much of their journey was by rail or ship, which are much more fuel efficient than truck transport.
Figure 2. Total Fuel Use per Hundredweight, Regional versus Non-Regional Supply Chains
Source: Researchers’ estimates from case study interviews
• The average transportation cost of each market basket item as a percent of retail price was also clearly less for regionally-sourced supply chains than for the non-regional supply chains (Figure 3). Previous research compared the movement of apples through two different supply chains into the Syracuse market area, one from Washington State and one from a local farm. The costs of transportation as a percent of retail price for these apples were 12 and 2 percent respectively.7 The overall cost of transportation for food produced in the U.S. and purchased for consumption in the home in 2015 is estimated to be 5.1 percent.8
7 Growing Local: Case Studies on Local Supply Chains. 2014. Edited by Robert P. King, Michael S. Hand, and Miguel I. Gómez. University of Nebraska Press, Lincoln, Nebraska. 8 Canning, Patrick, 2017, Food Dollar Series. United States Department of Agriculture, Economic Research Service. Washington, DC. https://www.ers.usda.gov/data-products/food-dollar-series/.
0.11
0.23
0.310.36
0.29
0.00 0.00
0.85
0.59
0.82
0.46
0.00
0.55
0.26
0.00
0.10
0.20
0.30
0.40
0.50
0.60
0.70
0.80
0.90
apples cabbage potatoes ground beef milk cannedpeaches
frozenbroccoli
gallo
ns p
er c
wt
regional non-regional

9
Figure 3. Transportation as a Percent of Retail Price
Source: Researchers’ estimates from case study interviews
o During interviews, researchers heard comments that travel time for regional chains
was less than for non-regional chains. For example, orders placed by City Produce for potatoes and for cabbages grown in the Northeast arrived within 24 hours, whereas potato orders from Idaho arrived in three to seven days and cabbage orders from two to three days.
o Deliveries from suppliers farther away are more likely to result in delivery delays than those from suppliers nearby. McLaughlin, et al. reported that higher transportation costs from rising fuel prices as well as difficulties finding trucks and drivers for long hauls were important produce industry issues. Suppliers reported that more drop shipments and transfers were needed to get product across the country creating the likelihood of slower deliveries and interruptions in the cold chain. Shippers were responding to transportation challenges by adding in-house logistics departments and controlling transportation activities or by outsourcing all logistics to third-party providers.9
o Figure 3 underscores a familiar theme. The more perishable the product is, the greater the advantage to being close to the market, primarily because transporting
9 McLaughlin, Edward W., Park, Kristen S., Hawkes, Gerard, F., 2015, Produce Industry Procurement: Changing Preferences and Practices. E.B. 15-10, Dyson School of Applied Economics and Management, Ithaca, NY.
2.2
5.16.4
2.9
0.5 0 0
9.1 8.5
21.2
3.3
0
6.1
10
0
5
10
15
20
25
apples cabbage potatoes ground beef milk cannedpeaches
frozenbroccoli
%
regional non-regional
10
fresh produce costs more than transporting packaged goods due to costs associated with refrigeration, space usage, etc.
• Despite the frequent availability of regionally-produced products, many of these products
were often not well labeled with information about where the product was grown. The potatoes were sometimes in a bag labeled with the farm name and town, but it was not a prominent feature of the bag. It looked very similar to other 5-pound bags of potatoes. Cabbages were usually plain or wrapped in film with only a sticker indicating the price and weight. Milk was labeled with the processor’s name but little information indicating where the dairy farms were located.
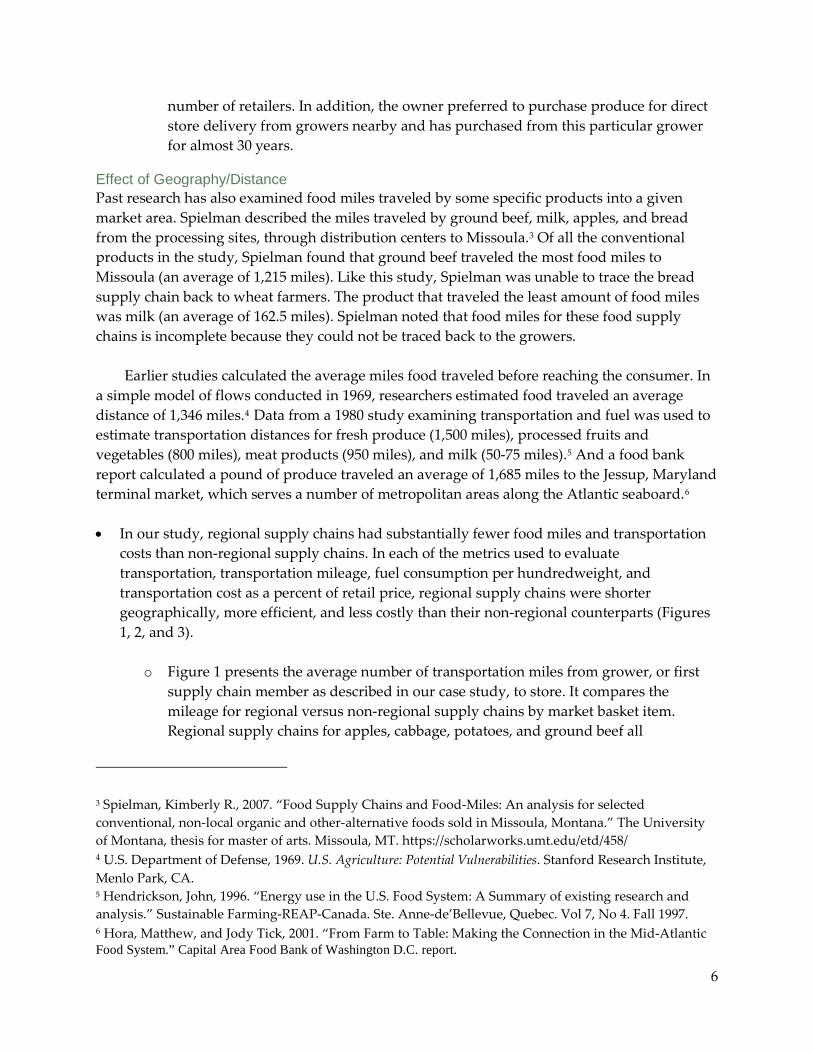
• We calculated the producers’ average share of retail price in regional supply chains versus
non-regional supply chains to see if regional producers captured a greater share than non-regional producers whose products are sold in the Northeast (Figure 4). We did not see a relationship between the farm share of retail price and regional versus non-regional supply chain.
Figure 4. Producer Price Margins as a Percent of Retail Price, Regional versus Non-
Regional Supply Chains
Source: Researchers’ estimates from case study interviews
44.8
26.7
36.3
47.051.4
31.1 32.435.0
60.5
11.4
34.1
0.0
10.0
20.0
30.0
40.0
50.0
60.0
70.0
apples cabbage potatoes ground beef milk cannedpeaches
frozen broccoli
%
regional non-regional
NA NA NA
11
Extent of Regional Value-Added Activity In agriculture, the term value-added traditionally has referred to processing a raw product into a form used by consumers. For one of its program grants, USDA defines a value-added product as:10
(1) The agricultural commodity must meet one of the following five value-added methodologies:
• Has undergone a change in physical state • Was produced in a manner that enhances the value of the agricultural commodity • Is physically segregated in a manner that results in the enhancement of the value of the
agricultural commodity • Is a source of farm- or ranch-based renewable energy, including E-85 fuel • Is aggregated and marketed as a locally-produced agricultural food product
(2) As a result of the change in physical state or the manner in which the agricultural commodity was produced, marketed, or segregated:
• The customer base for the agricultural commodity is expanded. A greater portion of the revenue derived from the marketing, processing, or physical segregation of the agricultural commodity is available to the producer of the commodity
In our case studies, we use value-added in economic terms as defined by Coltrain, Barton, and Boland (2000) to represent the change in product form, time, or place in order to make it more desirable to the market channel customer or “more preferred in the marketplace”.11
In order to describe economic value-added activity, we used the % price margin12 as a
proxy for the amount of value-added activity produced by each supply chain member. We also knew how much of the total volume each supply member provided.
We then took each supply chain member’s “% price margin” weighted by the amount of
the store’s market basket item that they provided. When we looked at all the supply chain members that were located in the region, this represented the region’s contribution to the supply chain’s economic activity. Table 3 summarizes how much of the market basket item is
10 U.S. Department of Agriculture Rural Business-Cooperative Service, 2015. Value-Added Producer Grant Program, Final Rule, 7 CFR Part 4284, Federal Register, Vol. 80, No. 89. http://www.gpo.gov/fdsys/pkg/FR-2015-05-08/pdf/2015-10441.pdf. 11 Coltrain, D., D. Barton, and M. Boland, 2000. "Value Added: Opportunities and Strategies.” Arthur Capper Cooperative Center, Department of Agricultural Economics, Kansas State University. http://www.agecon.ksu.edu/accc/kcdc/pdf%20Files/VALADD10%202col.pdf. 12 The difference between the selling price and the purchase cost as a percent of retail price.

12
produced in the region and how much the region contributes to the supply chains’ value-added activity. • The value-added activity occurring in the Northeast was sizeable even in supply chains
where the product was grown outside the region (Table 2). Even for supply chains which originate far away, such as frozen broccoli from Mexico or Guatemala, there can be a lot of value-addition occurring in the region, an average of 53 percent in the case of frozen broccoli. This arises from economic activity in the part of the distribution system which is located in the Northeast. In our case studies, all of the milk sold in the stores was produced within the region and, therefore, 100 percent of the value-added was performed regionally.
Table 2. Estimates of the Percent of Value-Added Activities Performed in the Region
Percent of stores’ purchases produced
regionally Percent value-added
in the region Apples 77 87 Cabbage, fresh 40 59 Potatoes 39 60 Ground beef na 33 Milk 100 100 Canned peaches 0 42 Frozen broccoli 0 53 Source: Researchers’ estimates from case study interviews
Discussion These case studies described 11 supermarkets in low-income areas and how they procured a few of the foods sold in their stores. Most of the study stores were too small to have dedicated or vertically-integrated supply chains, and most of them used a large grocery wholesaler for the majority of their supplies.
Robert King suggests that wholesaler-supplied stores are less competitive in terms of adopting supply chain technology and may be less likely to collaborate with members up the supply chain and with service providers.13 Anecdotal evidence might point to small supermarkets’ limited ability to collaborate with supply chain members; however, we found that our stores were able to access smaller, sometimes more unique, distributors and
13 King, Robert, 2003, “Is There a Future for Wholesaler-Supplied Supermarkets?” Choices. December 2003.

13
distribution systems, for example hard discount suppliers, ethnic food wholesalers, and regional suppliers, than those that chain stores use.
These case studies also described the actual form and scale of several regional food
supply chains serving our 11 study supermarkets. They have illuminated the extent to which regionally-produced and non-regionally-produced items are reaching independent supermarkets in low income areas.
Our market basket items reached supermarkets almost exclusively through a system of
intermediaries that included producer sales agents, brokers, repackers, processors, produce wholesalers and almost always grocery wholesalers. Whether the supply chain was regional or non-regional did not affect the number of actors in the supply chain; however, it appeared that the size and scale of the producer did. For the perishable market basket items, the larger the grower/shipper, the more likely it sold directly to the grocery wholesaler servicing the supermarket.
The intermediaries provided very valuable services to those shippers who either were
not large enough or who required additional value-added functions, such as further processing or repacking, or small-scale distribution to small stores, to access these markets. Some potato supply chains that used regional shippers as subcontractors to non-regional shippers made greater use of regional potatoes and incurred less fuel use; however, we could not determine if these supply chains were beneficial to regional shippers. In other words, we don’t know whether the subcontract price was sufficient to be profitable and sustainable.
The milk supply chains were entirely regional; no non-regional chains existed. There
are two primary reasons explaining this. First, the Northeast dairy industry is large with a scale sufficient to efficiently access the markets under this study, relative to other production regions. Second, the nature of fluid milk makes it difficult to transport efficiently over long distances, keeping production relatively close to assembly and processing plants, and these plants close to destination markets. We could presume that other regionally-grown products with these characteristics would have similar supply chain characteristics.
We observed that even though the Northeast is one of the largest cabbage growers and
cabbage can store for several months, cabbage supplies came from various parts of the country, moving from one region to another depending on the season. That is, in general, cabbage growers do not keep product on storage to supply local markets during months following harvest. Two factors explain this behavior. Transporting cabbage, assuming large volumes, is relatively less expensive than storing the product, unless the travel distance is

14
sufficiently long. Moreover, most cabbage that is stored is used for processing purposes, given that the quality of fresh cabbage decreases with storage time.
Regional supply chains did not exist for our packaged products, canned peaches and frozen broccoli, although for slightly different reasons. The canned peaches industry is concentrated in California where the cost of peaches for canning is about half that of what it would be in the Northeast. The frozen broccoli industry that supplies the U.S. is centered in various Latin American countries. Chopping broccoli is done by hand and labor intensive, and these countries have low labor costs. These factors constrain possible regional production in the Northeast.
Transportation remains a very important factor in supply chain performance. Transportation costs benefit regional production. In addition to transportation costs, recent developments may also enhance the attractiveness of regional supply chains. Some of these include ongoing driver shortages, new mandatory electronic logs, changes in regulations impacting Mexican drivers, and Walmart’s and Kroger’s new standards for on-time deliveries. Walmart’s new standards shorten the acceptable delivery delays and increase the requirement for accurate loads.14 Regional supply chains may have an advantage in being closer to their customers and better able to comply with the shorter delivery window.
We observed that transparency did not emerge as a major theme in supply chain
discussions, even though most stores did not know the origin of each of its products. With an average of 40,000 different SKUs or stock keeping items in a typical supermarket, it is not surprising that owners or managers do not know where all of their products are produced.
In general, stores also have more difficulty in knowing where products originate when
layers of intermediaries are used in their supply chains. Unless products are labeled visibly as to origin, this knowledge is lost in the supply chain unless needed in a foodborne illness outbreak trace back.
Many products in our market basket were not labeled as to where they were produced.
Even one frozen food wholesale buyer thought that all their frozen broccoli was coming from China, when, in fact, none of their frozen broccoli was from China and most was from Guatemala, Ecuador, and Mexico. Even when indicated, labeling was generally not prominent. An exception may be the prominent “Grown in Idaho” label. Store owners and managers interviewed about potatoes readily recognized their Idaho suppliers.
14 “Walmart’s new OTIF policy raises concerns.” Linden, Tim. The Produce News. August 17, 2017. http://producenews.com/the-produce-news-today-s-headlines/22081-walmart-s-new-otif-policy-raises-concerns

15
An opportunity may exist for members of the supply chains to work collaboratively to harness the power of identifying the source of its regionally-sourced perishable products (e.g., apples, cabbage, milk, potatoes). Promoting regional products with prominent labels and signage may increase the sales of regionally-produced products. Investments on the part of the growers and the wholesalers to label and promote regionally-produced items would be needed. Stores may still need to rely on their produce or grocery wholesalers to coordinate regionally-grown products. In this case, labeling products at the farm-level would be extremely important in order to maintain the identity of the product through the supply chain.
The food supply chain in the U.S. is highly efficient, feeding millions of people. Emerging issues in food transparency, food waste, environmental costs, and interests in self-reliance may pressure supply chains to change. The better the understanding of the system, the better policies we can put in place to guide the changes in a direction that is beneficial and sustainable.

EB No Title Author(s)
OTHER A.E.M. EXTENSION BULLETINS
Fee(if applicable)
Case Studies of supermarkets and food supplychains in low-income areas of the Northeast: Across case comparison of 11 case studies
Park, K.S., Gomez, M.I. and K. Clancy2018-02
Six Year Trend Analysis New York State DairyFarms: Selected Financial and ProductionFactors
Karszes, J. and K. Windecker2018-01
Case studies of supermarkets and food supplychains in low-income areas of the Northeast:Syracuse Store 2, New York
Park, K.S., Gomez, M. and K. Clancy2017-16
Case studies of supermarkets and food supplychains in low-income areas of the Northeast:Syracuse Store 1, New York
Park, K.S., Gomez, M. and K. Clancy2017-15
Case studies of supermarkets and food supplychains in low-income areas of the Northeast:Pittsburgh Store, Pennsylvania
Park, K.S., Gomez, M. and K. Clancy2017-14
Case studies of supermarkets and food supplychains in low-income areas of the Northeast:Onondaga County Store, New York
Park, K.S., Gomez, M. and K. Clancy2017-13
Case studies of supermarkets and food supplychains in low-income areas of the Northeast:New York City Store, New York
Park, K.S., Gomez, M. and K. Clancy2017-12
Case studies of supermarkets and food supplychains in low-income areas of the Northeast:Madison County Store, New York
Park, K.S., Gomez, M. and K. Clancy2017-11
Case studies of supermarkets and food supplychains in low-income areas of the Northeast:Kent Store 2, Delaware
Park, K.S., Gomez, M. and K. Clancy2017-10
Case studies of supermarkets and food supplychains in low-income areas of the Northeast:Kent Store 1, Delaware
Park, K.S., Gomez, M. and K. Clancy2017-09
Paper copies are being replaced by electronic Portable Document Files (PDFs). To request PDFs of AEM publications, write to (be sure toinclude your e-mail address): Publications, Department of Applied Economics and Management, Warren Hall, Cornell University, Ithaca,NY 14853-7801. If a fee is indicated, please include a check or money order made payable to Cornell University for the amount of yourpurchase. Visit our Web site (http://dyson.cornell.edu/outreach/#bulletins) for a more complete list of recent bulletins.