Embed Size (px)
Citation preview
Case studies in restoring connectivity of coastal aquatic habitats: floodgates, box culvert and rock-ramp fishway
Craig Boys, Tim Glasby, Frederieke Kroon, Lee Baumgartner, Kevin Wilkinson, Gary Reilly and Tony Fowler
NSW Department of Primary Industries Port Stephens Fisheries Institute
Locked Bag 1, Nelson Bay, NSW 2315 Australia
June 2011
Fisheries Final Report Series No. 130
ISSN 1837-2112
Case studies in restoring connectivity of coastal aquatic habitats: floodgates, box culvert and rock-ramp fishway. June 2011 Authors: Craig Boys, Tim Glasby, Frederieke Kroon, Lee Baumgartner, Kevin Wilkinson, Gary Reilly
and Tony Fowler Published By: NSW Department of Primary Industries Postal Address: Cronulla Fisheries Research Centre of Excellence, PO Box 21, Cronulla, NSW, 2230 Internet: www.dpi.nsw.gov.au
© NSW Department of Primary Industries This work is copyright. Except as permitted under the Copyright Act, no part of this reproduction may be reproduced by any process, electronic or otherwise, without the specific written permission of the copyright owners. Neither may information be stored electronically in any form whatsoever without such permission. DISCLAIMER The publishers do not warrant that the information in this report is free from errors or omissions. The publishers do not accept any form of liability, be it contractual, tortuous or otherwise, for the contents of this report for any consequences arising from its use or any reliance placed on it. The information, opinions and advice contained in this report may not relate to, or be relevant to, a reader’s particular circumstance. ISSN 1837-2112 Note: Previous issues of the ‘Fisheries Final Report Series’ (ISSN 1837-2112) have been published as follows: (i) No.’s 1 – 66: ‘NSW Fisheries Final Report Series’ (ISSN 1440-3544); (ii) No.’s 67 – 110: ‘NSW Department of Primary Industries – Fisheries Final Report Series’ (ISSN 1449-9967); (iii) No.’s 111 – 129: ‘Industry & Investment NSW – Fisheries Final Report Series’ (ISSN 1837-2112).
Contents iii
Case studies in coastal fish passage remediation Boys et al.
TABLE OF CONTENTS
TABLE OF CONTENTS..............................................................................................................................III LIST OF TABLES.........................................................................................................................................IV LIST OF FIGURES.......................................................................................................................................IV ACKNOWLEDGEMENTS..........................................................................................................................VI NON-TECHNICAL SUMMARY .............................................................................................................. VII 1. GENERAL INTRODUCTION............................................................................................................ 11
1.1. Restoring fish passage at barriers within NSW........................................................................... 11 1.2. Objectives and case study sites.................................................................................................... 11
2. CASE STUDY 1: FLOODGATE MANAGEMENT WITHIN THE MACLEAY AND CLARENCE RIVER ESTUARIES..................................................................................................... 13 2.1. Introduction................................................................................................................................. 13 2.2. Methods ....................................................................................................................................... 14 2.3. Results ....................................................................................................................................... 20 2.4. Discussion ................................................................................................................................... 34
3. CASE STUDY 2: DOUBLE BOX CULVERT AT QUART POT ROAD CROSSING, BUCKENBOWRA RIVER .................................................................................................................. 38 3.1. Introduction................................................................................................................................. 38 3.2. Site details ................................................................................................................................... 38 3.3. Methods ....................................................................................................................................... 41 3.4. Results ....................................................................................................................................... 44 3.5. Discussion ................................................................................................................................... 49
4. CASE STUDY 3: LOW-FLOW, PARTIAL-WIDTH FISHWAY WITHIN A FULL-WIDTH ROCK-RAMP FISHWAY AT STROUD WEIR, KARUAH RIVER.............................................. 51 4.1. Introduction................................................................................................................................. 51 4.2. Site details ................................................................................................................................... 51 4.3. Method s ..................................................................................................................................... 52 4.4. Results ....................................................................................................................................... 57 4.5. Discussion ................................................................................................................................... 61
5. REFERENCES...................................................................................................................................... 63
iv Contents
Boys et al. Case studies in coastal fish passage remediation
LIST OF TABLES
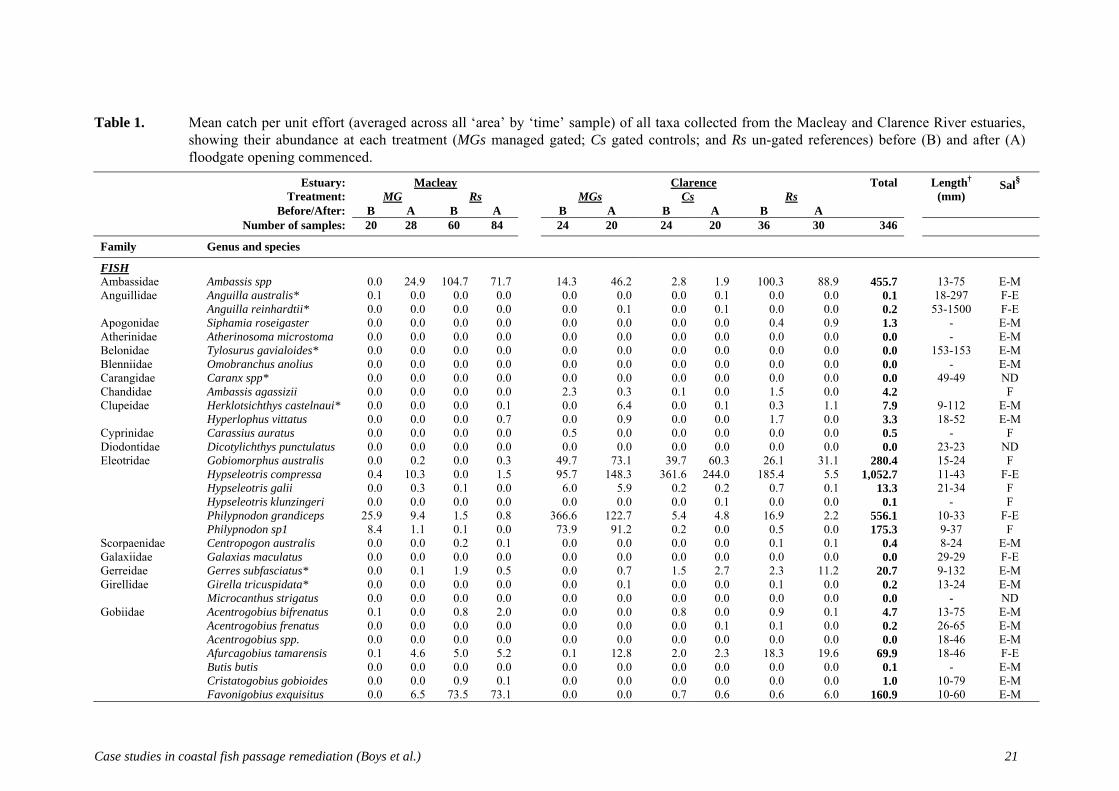
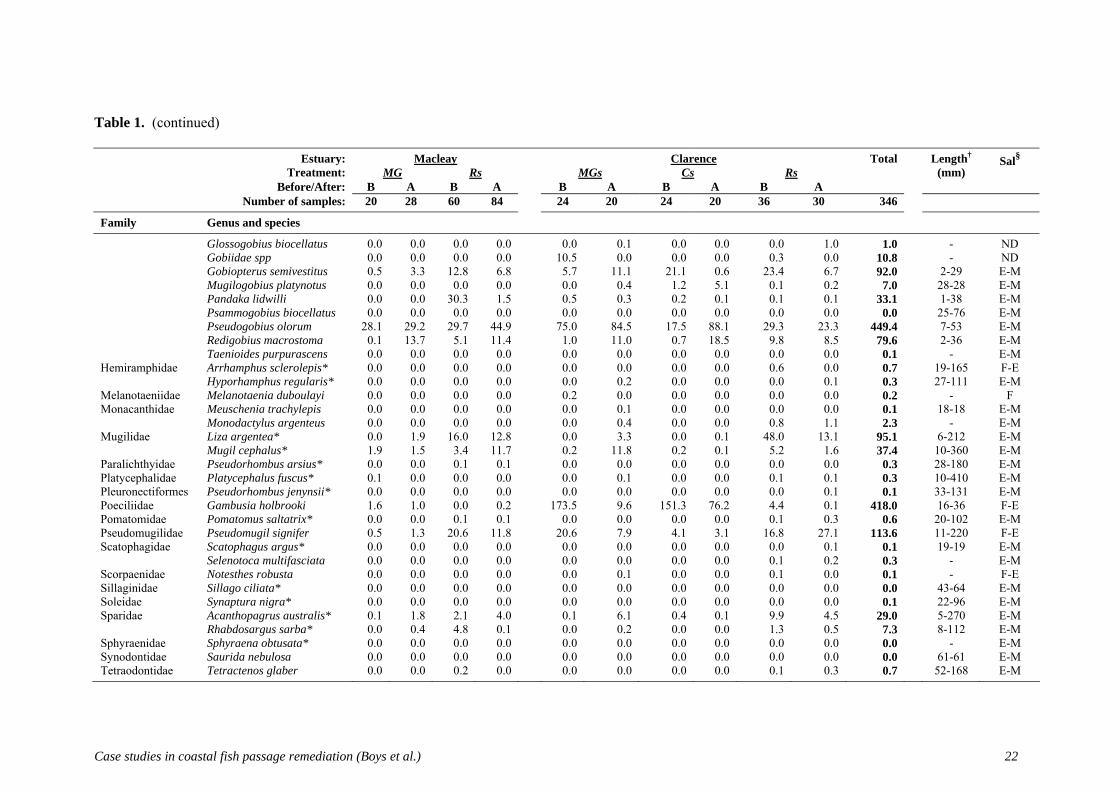
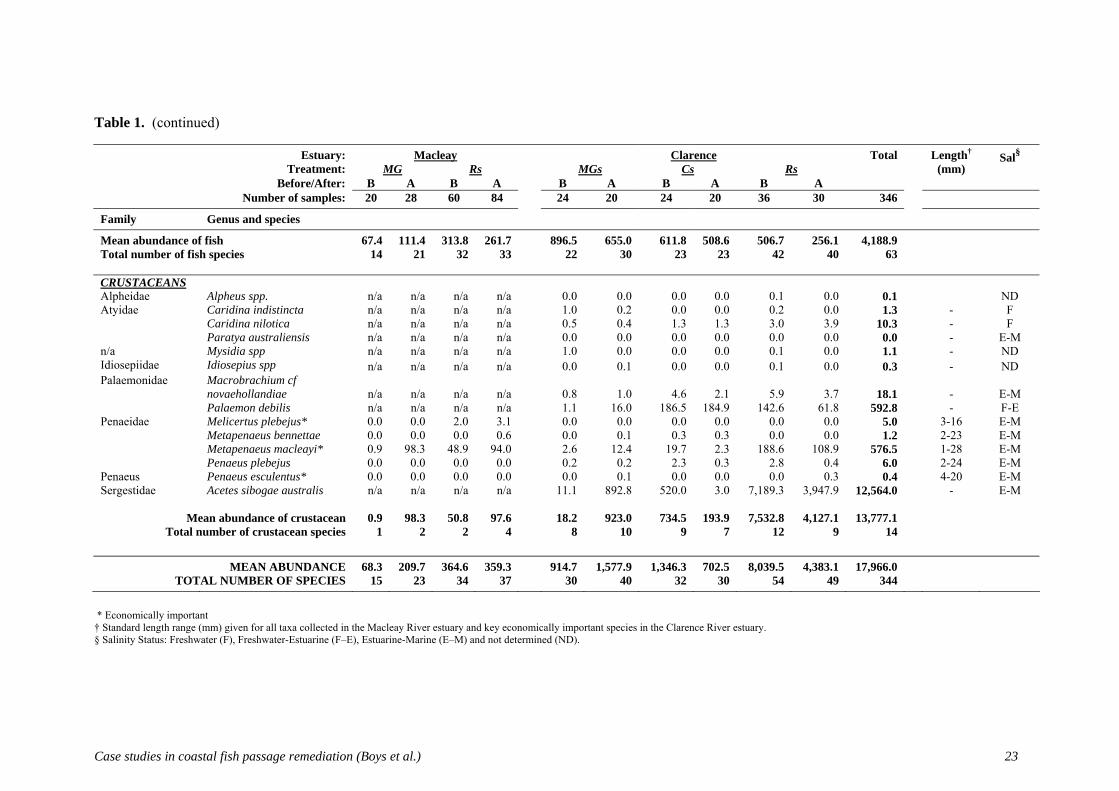
Table 1. Mean catch per unit effort of all taxa collected from the Macleay and Clarence River estuaries, showing their abundance at each treatment before and after floodgate opening commenced. ................................................................................... 21
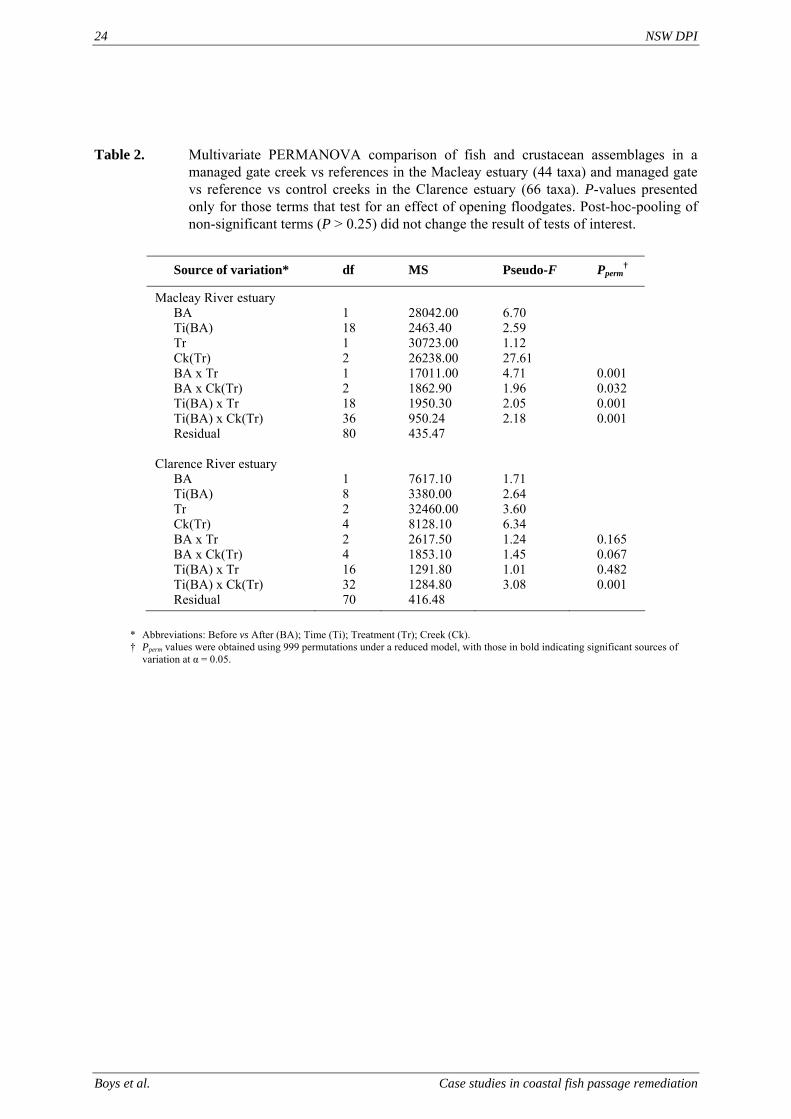
Table 2. Multivariate PERMANOVA comparison of fish and crustacean assemblages in a managed gate creek vs references in the Macleay estuary and managed gate vs reference vs control creeks in the Clarence estuary..................................................... 24
Table 3. Average Bray-Curtis dissimilarity values between MG1 and reference creeks in the Macleay showing species contributing most to dissimilarity before floodgate opening, and again after floodgate opening................................................................. 30
Table 4. Average Bray-Curtis dissimilarity values between MG2 and reference creeks in the Clarence showing species contributing most to dissimilarity before floodgate opening, and again after floodgate opening................................................................. 32
Table 5. Average Bray-Curtis dissimilarity values between MG3 and reference creeks in the Clarence showing species contributing most to dissimilarity before floodgate opening (times 1–5), and again after floodgate opening.............................................. 33
Table 6. Summary of fish caught approaching and exiting the culvert in the downstream and upstream direction in each season, as well as backpack electrofishing riffles upstream and downstream of the road crossing in the Summer of 2007-08................ 45
Table 7. Abundance of fish species caught from 23 paired samples approaching the bottom and exiting the top of the Stroud Weir Fishway. ......................................................... 58
LIST OF FIGURES
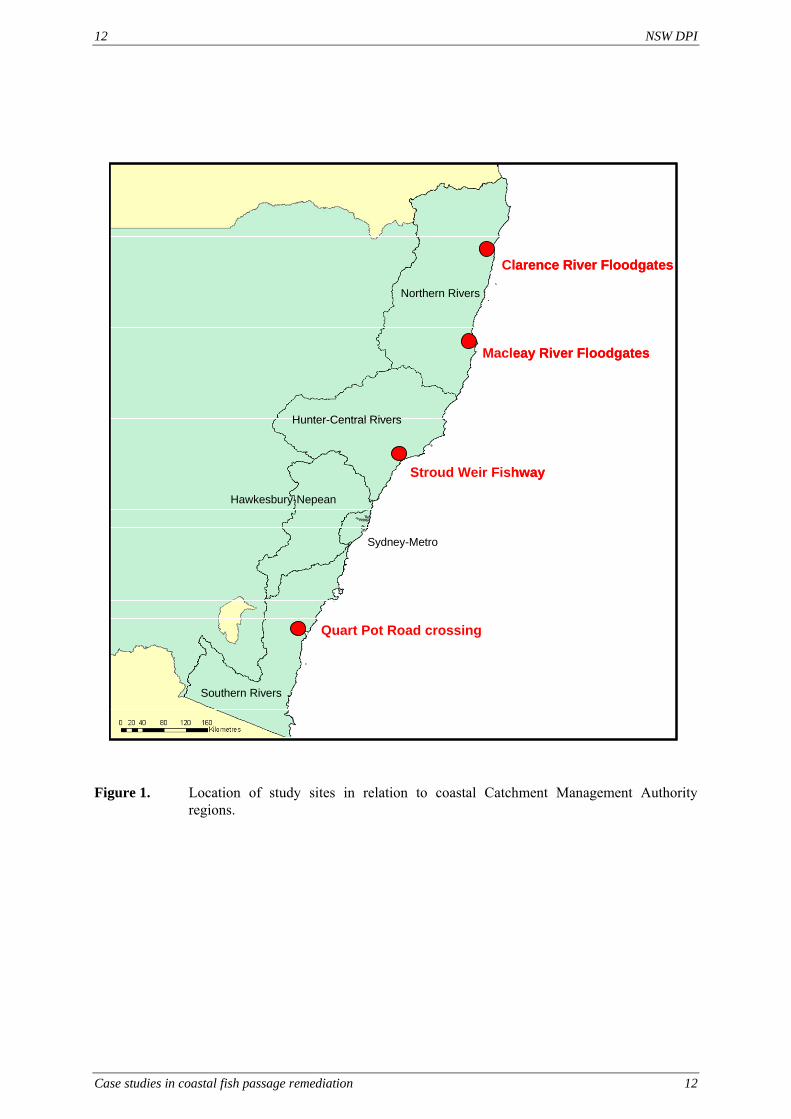
Figure 1. Location of study sites in relation to coastal Catchment Management Authority regions.......................................................................................................................... 12
Figure 2. Map of the Macleay and Clarence River estuaries in NSW showing the 11 study creeks. .......................................................................................................................... 15
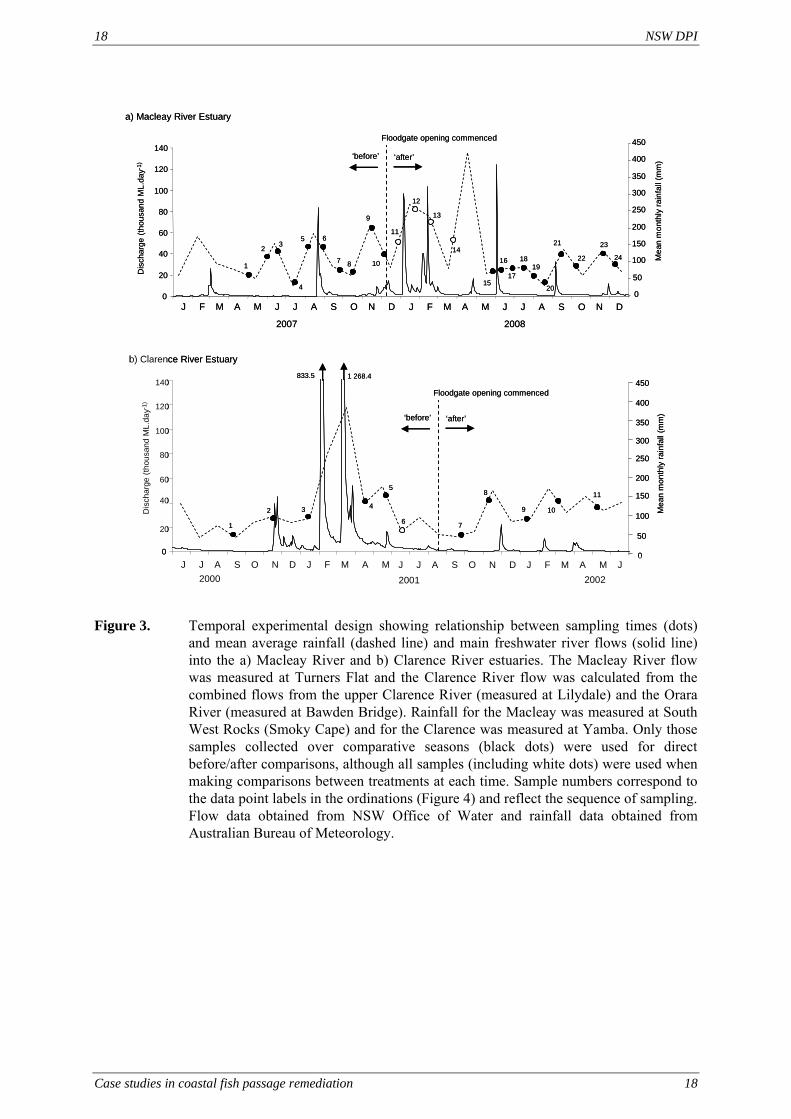
Figure 3. Temporal experimental design showing relationship between sampling times and mean average rainfall and main freshwater river flows into the Macleay River and Clarence River estuaries.. ............................................................................................ 18
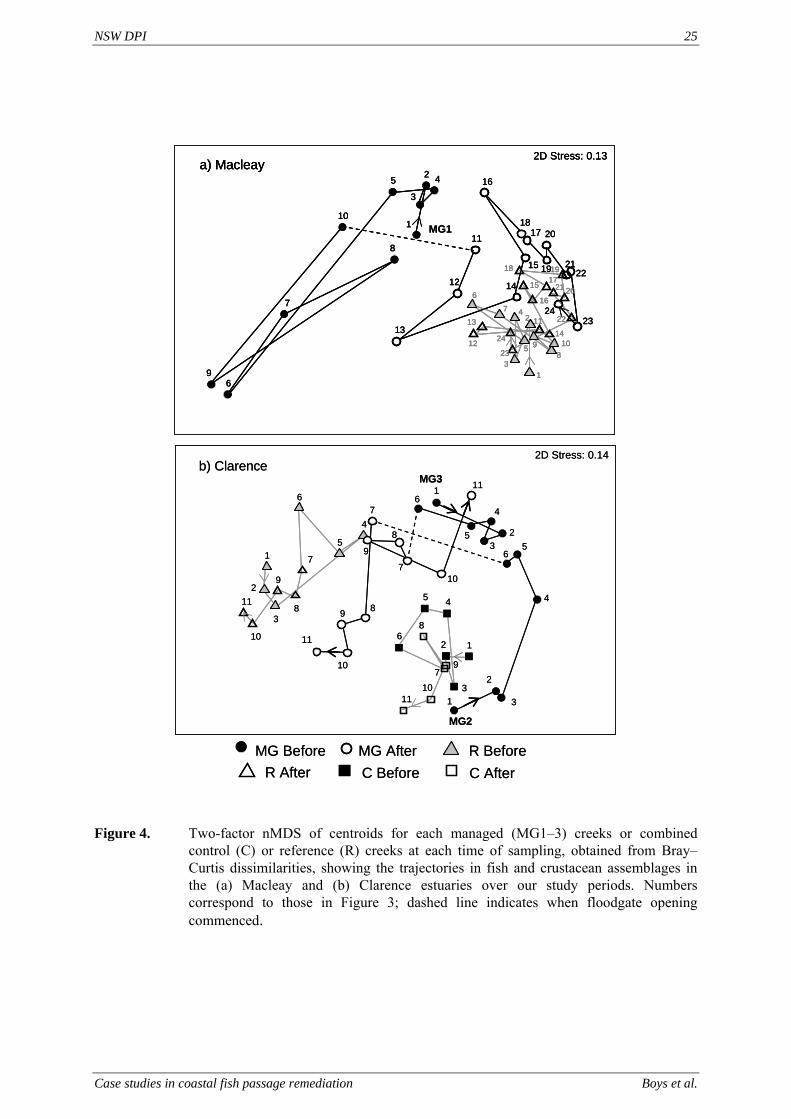
Figure 4. Two-factor nMDS of centroids for each managed creeks or combined control or reference creeks at each time of sampling, obtained from Bray-Curtis dissimilarities, showing the trajectories in fish and crustacean assemblages in the Macleay and Clarence estuaries over our study periods. ............................................. 25
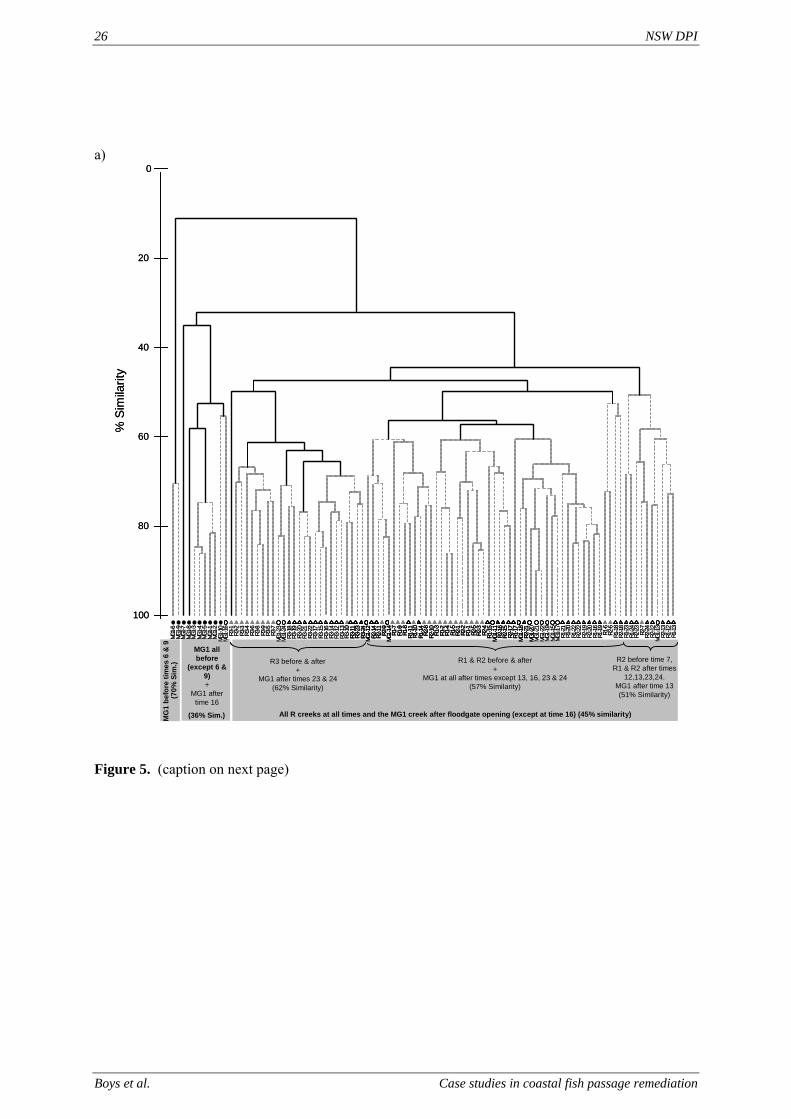
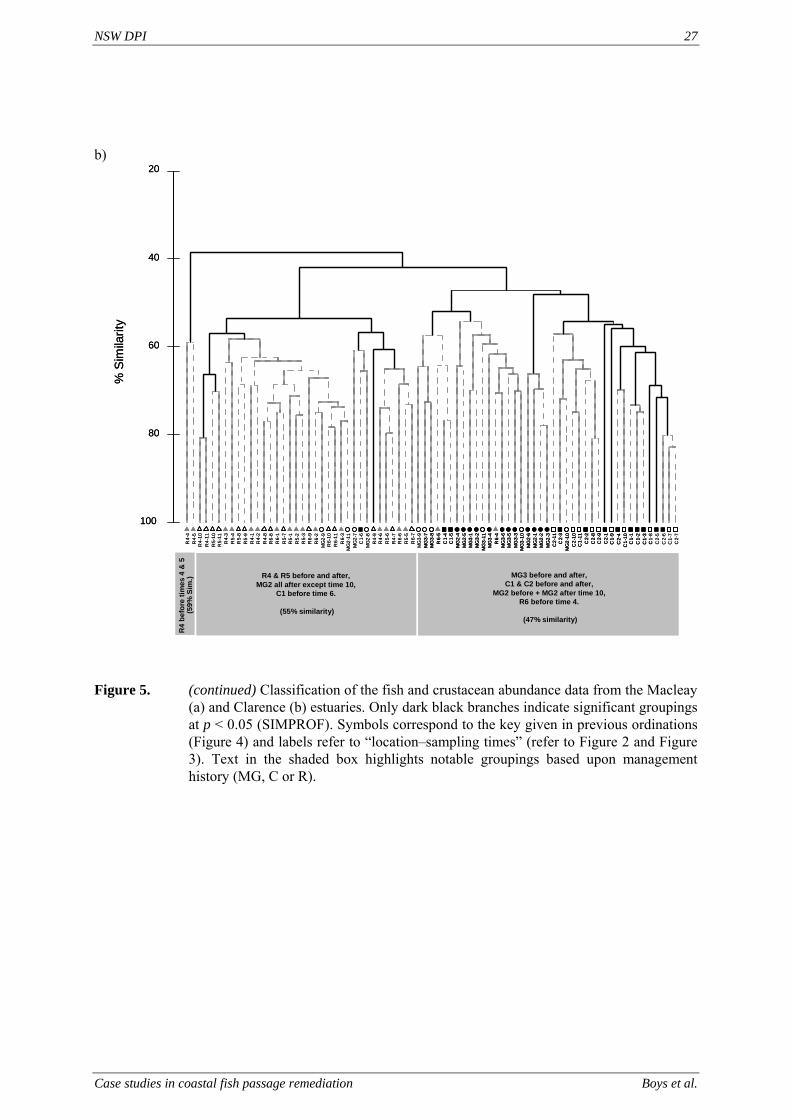
Figure 5. Classification of the fish and crustacean abundance data from the Macleay and Clarence estuaries. ....................................................................................................... 27
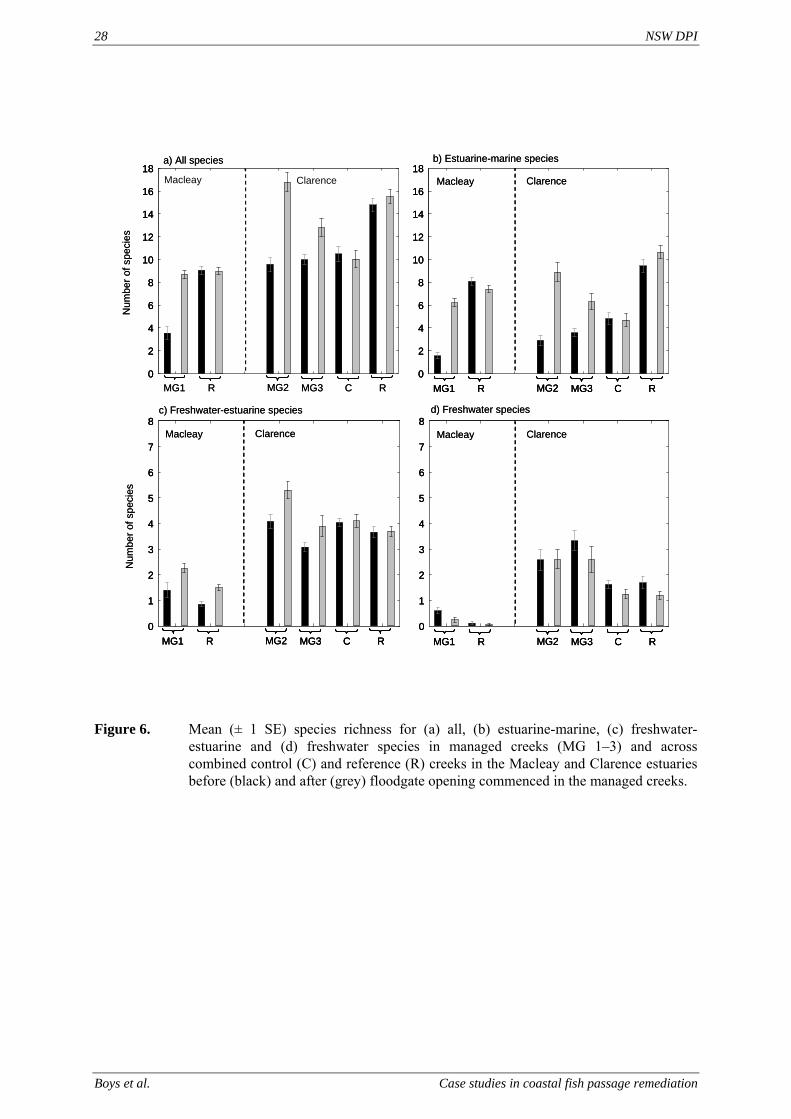
Figure 6. Mean species richness for all, estuarine-marine, freshwater-estuarine and freshwater species in managed creeks and across combined control and reference creeks in the Macleay and Clarence estuaries before and after floodgate opening commenced in the managed creeks.............................................................................. 28
Figure 7. Mean richness for all fish and crustacean species and estuarine-marine, freshwater and freshwater-estuarine species in tidal creeks of the Macleay and Clarence estuaries through time.................................................................................................. 29
Figure 8. Location of Quart Pot Road crossing........................................................................... 39 Figure 9. Quart Pot Road crossing aprior to and after construction of a double box culvert. ..... 40 Figure 10. Schematic aerial diagram of Quart Pot Road Crossing showing fyke net placement
allowing fish to be trapped approaching and exiting the culvert, in both the upstream and downstream direction. ........................................................................... 42
Contents v
Case studies in coastal fish passage remediation Boys et al.
Figure 11. Fyke net configuration for trapping fish aapproaching and exiting culvert..................43 Figure 12. Mean number of fish caught per 24 hour period for 16 pairs of approach/exit
samples at Quart Pot Road culvert in both the downstream and upstream direction....46 Figure 13. Top: Length frequency histogram of all fish caught at the approaching and exiting
Quart Pot Road culvert in the UPSTREAM direction. Bottom: Size range and median size for each species caught approaching and exiting......................................47
Figure 14. Top: Length frequency histogram of all fish caught at the approaching and exiting Quart Pot Road culvert in the DOWNSTREAM direction...........................................48
Figure 15. Location of Stroud Weir fishway. ................................................................................53 Figure 16. Stroud Weir prior to fishway construction and following fishway construction..........54 Figure 17. Low-flow fishway located within the full width rock ramp showing flows
characteristic of those sampled during this study. ........................................................55 Figure 18. Fyke net set in upstream direction at top of fishway and at the bottom of the
fishway..........................................................................................................................56 Figure 19. Mean number of fish caught per 24 hour period for 23 pairs of top/bottom samples
at Stroud Fishway. ........................................................................................................59 Figure 20. Top: Length frequency histogram of all fish caught at the bottom and top of Stroud
Fishway. Bottom: Size range and mean size for each species caught at the bottom and top ..........................................................................................................................60
vi Contents
Boys et al. Case studies in coastal fish passage remediation
ACKNOWLEDGEMENTS
We are grateful to all technicians (particularly Graham Housefield, Ben Kearney, Brook McCartin, Isabelle Thiebaud and Lachlan Bassett) in the Aquatic Ecosystems Unit who assisted with field and laboratory work. We are particularly thankful to all the landholders who allowed us access to their properties and drainage systems. The Clarence floodgate component of this work used data gathered under grant 1998/215 from the Australian Fisheries Research and Development Corporation to the former NSW Fisheries. The Macleay floodgate component, Quart Pot Road crossing and Stroud fishway component was funded by a Federal Government grant administered through the Southern Rivers CMA as part of the Bringing Back the Fish Project. Several Conservation and Aquatic Habitat Rehabilitation Managers worked tirelessly to manage the rehabilitation works under the Bring Back the Fish Project, including (but not limited to) Matthew Gordos, Scott Nicols, Cameron Lay and Marcus Riches. The collection of all animals in this project was in accordance with the appropriate animal care and ethics research authority (98/11) and a Section 37 research permit in accordance with the NSW Fisheries Management Act 1994. Michael Lowry provided invaluable comments on the draft manuscript. This report is dedicated to D.M.B, K.C.B and J.T.B. whose profound influence throughout the writing of this report cannot be underestimated.
Non Technical Summary vii
Case studies in coastal fish passage remediation Boys et al.
NON-TECHNICAL SUMMARY
Case studies in restoring connectivity of coastal aquatic habitats: floodgates, box culvert and rock-ramp fishway
PRINCIPAL INVESTIGATOR: Dr Craig Boys ADDRESS: Port Stephens Fisheries Institute Locked Bag 1 Nelson Bay, NSW, 2315, AUSTRALIA Telephone: +61 2 4982 1232 Fax: + 61 2 4982 2265 e-mail: [email protected]
OBJECTIVES:
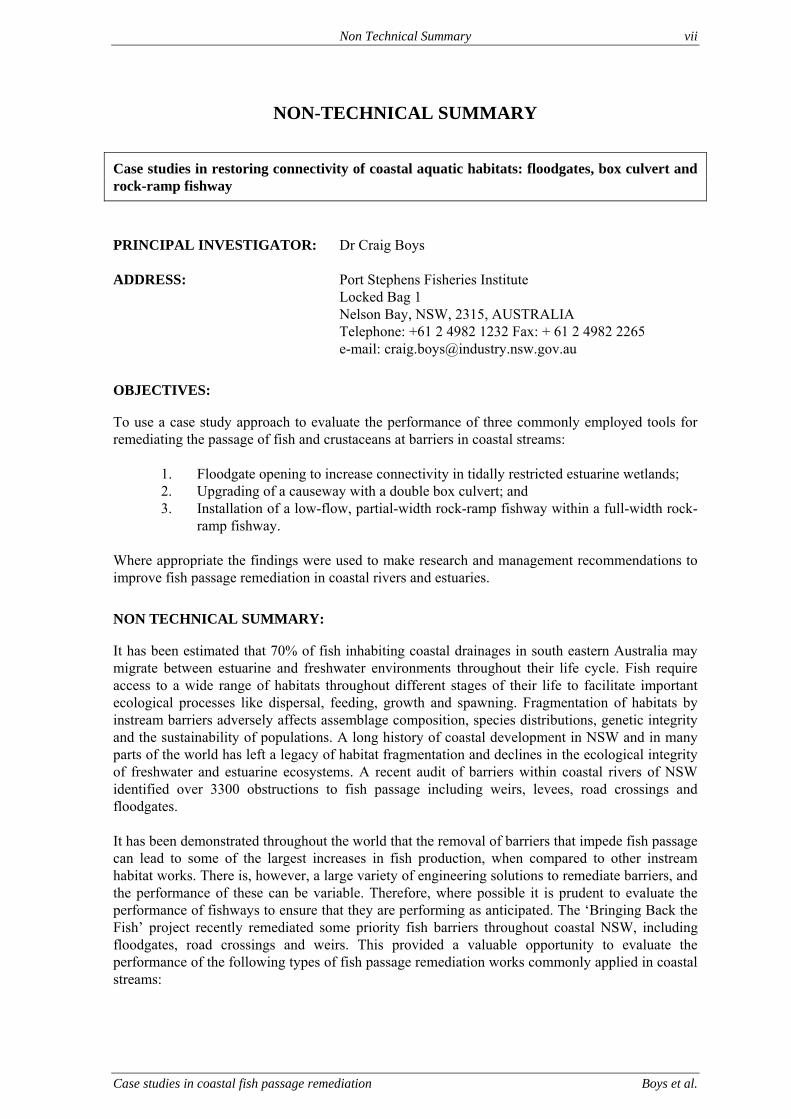
To use a case study approach to evaluate the performance of three commonly employed tools for remediating the passage of fish and crustaceans at barriers in coastal streams:
1. Floodgate opening to increase connectivity in tidally restricted estuarine wetlands; 2. Upgrading of a causeway with a double box culvert; and 3. Installation of a low-flow, partial-width rock-ramp fishway within a full-width rock-
ramp fishway. Where appropriate the findings were used to make research and management recommendations to improve fish passage remediation in coastal rivers and estuaries.
NON TECHNICAL SUMMARY:
It has been estimated that 70% of fish inhabiting coastal drainages in south eastern Australia may migrate between estuarine and freshwater environments throughout their life cycle. Fish require access to a wide range of habitats throughout different stages of their life to facilitate important ecological processes like dispersal, feeding, growth and spawning. Fragmentation of habitats by instream barriers adversely affects assemblage composition, species distributions, genetic integrity and the sustainability of populations. A long history of coastal development in NSW and in many parts of the world has left a legacy of habitat fragmentation and declines in the ecological integrity of freshwater and estuarine ecosystems. A recent audit of barriers within coastal rivers of NSW identified over 3300 obstructions to fish passage including weirs, levees, road crossings and floodgates. It has been demonstrated throughout the world that the removal of barriers that impede fish passage can lead to some of the largest increases in fish production, when compared to other instream habitat works. There is, however, a large variety of engineering solutions to remediate barriers, and the performance of these can be variable. Therefore, where possible it is prudent to evaluate the performance of fishways to ensure that they are performing as anticipated. The ‘Bringing Back the Fish’ project recently remediated some priority fish barriers throughout coastal NSW, including floodgates, road crossings and weirs. This provided a valuable opportunity to evaluate the performance of the following types of fish passage remediation works commonly applied in coastal streams:
viii Non Technical Summary
Case studies in coastal fish passage remediation viii
1. Managed floodgate opening to increase connectivity in tidally restricted estuarine wetlands;
2. Replacement of a causeway with a double box culvert; and 3. Installation of a partial-width, low-flow rock-ramp within a high-flow, full-width
rock-ramp fishway at a low-level weir.
CASE STUDY 1: Floodgate management in the Macleay and Clarence River estuaries
Tidal flushing and connectivity was increased in three floodgated tidal creeks in the Macleay (Yarrahapinni Broadwater) and Clarence (Carrols and Taloumbi #5) River estuaries on the mid-north coast of NSW. Changes in juvenile fish and decapod crustacean assemblages were evaluated using a Before-After-Control-Impact (BACI) approach which utilised multiple un-gated reference creeks in the Macleay and multiple un-gated reference and gated control creeks in the Clarence. Sampling was conducted either on a monthly or two-monthly basis and responses were observed leading up to the intervention and within the first year following it. Closed floodgates were observed to have a significant impact on the utilisation of tidal creek habitat by a large number of juvenile estuarine-marine species. Creeks with closed floodgates had 70–80% fewer estuarine-marine species than un-gated reference creeks. Following the opening of gates, this difference was reduced to only 15%, showing significant and rapid recolonisation of most species. Although there was considerably variability in species responses among locations, positive ecological changes were observed which could be attributed to floodgate opening in all creeks. In two of the three study creeks, assemblages changed following floodgate opening, so that they more closely resembled un-gated reference creeks within months of gate opening and the changes were sustained throughout the study. In the Clarence, which utilised gated controls, no such shift was observed in the controls. The response was driven by an increase in the number of estuarine-marine species (many of commercial importance) which were able to recolonise the newly available habitats. This study demonstrates that localised increases in fish and decapod crustacean abundances can be achieved in tidally restricted wetlands by managing floodgate opening to promote connectivity and tidal flushing. Not all creeks responded in the same way, with a substantial lag in response measured in one of the creeks in the Clarence. This difference may be a result of floodgate design and/or the location of the creek within the estuary. Variability in response highlights the importance of monitoring ecological responses to rehabilitation works to better understand what mechanisms are promoting or hindering ecological recovery in some instances.
CASE STUDY 2 Replacement of a causeway with a double box culvert
The passage of fish was quantified at a newly constructed double box culvert where Quart Pot Road crosses the Buckenbowra River on the south coast of NSW. The ability of fish to negotiate the culvert in both upstream and downstream directions during low-flow conditions was evaluated by directly comparing the species and size classes of fish trapped by fyke nets when approaching and exiting the culvert in both the upstream and downstream direction. Sampling was undertaken in summer and autumn between 2007 and 2009. The box culvert was able to pass a large range of potomodromous and catadromous species and size classes in both the upstream and downstream direction. In doing so, the crossing was deemed to be meeting its objectives in facilitating passage during low-flow conditions. In order to refine criteria for future road crossing design and assist with the prioritisation of barrier removal in coastal NSW, further research beyond the scope of this study is required. The main recommendations for future work are:
Non Technical Summary ix
Case studies in coastal fish passage remediation Boys et al.
1. Undertake lab-based studies to better understand the swimming performance and behaviour of a variety of coastal fish species and size classes. These should be validated with field trials at a select number of ‘demonstration sites’.
2. Undertake replicated field studies looking at a variety of designs, in a variety of geomorphological and hydrological contexts, with passage rates associated with physical variables such as depth and velocity. This will improve the generality of findings beyond what was possible with the current case study approach.
3. Develop better barrier removal prioritisation protocols which incorporate the cumulative impact of sequential barriers in relation to the resident fish assemblage and long-term hydrology. This will ensure that individual site-specific actions (such as undertaken in this study) fit into a larger context of catchment restoration and fisheries recovery.
4. Incorporate a rigorous BACI design into future culvert research studies (as applied in Chapter 1 of this report). This will significantly enhance our understanding of what are the real benefits of barrier remediation. That is, a fishway may be working, but what relative benefits have been gained over a pre-existing structures.
5. Do long-term studies into the hydraulic performance of different fishway designs in different geomorphological settings, to ensure that passage is retained through time. A visit to Quart Pot Road crossing 12 months after this study has revealed that gravel has all but blocked flow through one side of the double box culvert, almost certainly affecting fish passage. Better understanding the ongoing maintenance requirements of different fishways will ensure that appropriate engineering decisions are made at the start (e.g., more armouring of banks) and that the true ongoing costs of barrier remediation is understood. For example, in some instances culverts may appear a less costly measure than a bridge, but a bridge would allow better transmission of sediment and flows and be less likely to ‘clog’. In the long term, a culvert which constrains the channel may require costly maintenance, or worse, may become a greater barrier to fish passage and a greater flood risk than the previous structure.
CASE STUDY 3: Installation of a full-width rock ramp with low-flow channel at a low-level weir
The performance of a partial-width, rock-ramp fishway (located within a larger high-flow, full-width, rock-ramp fishway) was assessed at Stroud Weir on the Karuah River. This involved comparing species and size classes of fish that approached the bottom of the fishway with those that successfully ascended and exited. Fish trapping was achieved with a fine mesh double wing fyke net, which was alternated between the top and bottom of the fishway. Twenty three top/bottom paired samples were collected between 2007 and 2008 over a broad upstream migration period (November – April). The partial-width, low-flow, rock-ramp fishway at Stroud Weir provided passage to a diverse range of species and size classes of native fish and performed to specifications. Passage rates over the flow range sampled are assumed to be higher than what would have occurred in the absence of a fishway where an excessive headloss (up to 1.15m at times) would have prevented any passage. The passage rates observed were higher than those reported for ineffective weir and pool design fishways, but lower than those generally achieved by vertical-slot fishways on coastal rivers. This may, however, be an artefact of sampling only when flows were constrained to the low-flow partial-width channel. Passage rates may have been higher for some species (such as Australian bass) as discharge increased and the high-flow, full-width fishway became inundated or the structure drowned-out (which frequently occurred). However, many other species and size classes may lack the ability to pass this barrier under these elevated flows and the provision of passage for these species and size classes over lower flows will undoubtedly improve connectivity of the system and generally benefit the broader fish community in this section of river. This study did not seek to determine the overall contribution of fishway construction to improve river condition.

x Non Technical Summary
Case studies in coastal fish passage remediation x
Future studies need to adopt a BACI-style experimental design to determine larger-scale ecological benefits
KEYWORDS
Fish passage, habitat rehabilitation, coastal rivers, estuarine wetland, migration barriers, connectivity, New South Wales.
NSW DPI 11
Case studies in coastal fish passage remediation Boys et al.
1. GENERAL INTRODUCTION
1.1. Restoring fish passage at barriers within NSW
Many fish species inhabit a broad range of freshwater and estuarine habitats throughout their life and need to be able to migrate freely between these habitats. In coastal rivers of south eastern Australia it has been estimated that 70% of fish may move between rivers and the estuary at some stage of their life (Harris 1984b). These migrations, whether for spawning, dispersal of juveniles from nursery grounds or the movement of fish between habitats, maintain gene-flow and support ecological processes essential for maintaining the integrity and resilience of native fish assemblages (Beumer 1980, Harris 1984b, Mallen-Cooper and Harris 1990). Unfortunately, throughout NSW and in many parts of the world there has been a proliferation of instream barriers which have fragmented channel, wetland and estuarine habitats. Structures such as weirs, dams, levees, road crossings and floodgates block natural fish migrations, alienate habitats and disrupt essential feeding and breeding behaviours (Kearney et al. 1999, Thorncraft and Harris 2000). A recent audit of barriers within coastal rivers of NSW identified over 3300 obstructions to fish passage (Gordos et al. 2007) and this is acknowledged to be a conservative estimate of the true extent of the problem. Although the Fisheries Management Act ensures that no new instream structures are constructed on NSW waterways without adequate provision of fish passage, the legacy of all pre-existing and often poorly designed structures remains. Not all instream structures pose a significant risk to coastal fish assemblages and a recent instream barrier audit (Gordos et al. 2007) prioritised fish passage impediments for remediation within all coastal catchments. From this prioritisation process, Industry & Investment NSW (now NSW DPI) in conjunction with the coastal catchment CMAs embarked on the ‘Bringing Back the Fish’ project to facilitate rehabilitation projects at a select number of sites across the entire spectrum of barrier types to demonstrate best practice techniques in fish passage remediation. Under Bringing Back the Fish it was acknowledged that, where possible, remediation works should be accompanied with monitoring and reporting to ensure that the interventions were achieving their goals and to ensure that there was no detrimental impact on existing fish populations. This report outlines the findings of this monitoring.
1.2. Objectives and case study sites
Given the sheer number of instream barriers across NSW, not all remediation projects can be scientifically evaluated. In this instance, a case study approach was adopted where the performance of several fish passage remediation options were investigated. Subsequently, research and management recommendations have been made where appropriate. This study specifically looked at the performance of (Figure 1):
1. Floodgate remediation in tidal creeks of the Clarence and Macleay River estuaries, looking at both automated tidal flap-valves and regular manual openings at winched gates;
2. A double box culvert at Quart Pot Road crossing in the lower reaches of the Buckenbowra River; and
3. A low-flow fishway within a full-width rock-ramp fishway in the middle reaches of the Karuah River.
12 NSW DPI
Case studies in coastal fish passage remediation 12
Quart Pot Road crossing
Stroud Weir Fishway
Macleay River Floodgates
Clarence River Floodgates
Hunter-Central Rivers
Northern Rivers
Southern Rivers
Hawkesbury-Nepean
Sydney-Metro
Quart Pot Road crossing
Stroud Weir Fishway
Macleay River Floodgates
Clarence River Floodgates
Hunter-Central Rivers
Northern Rivers
Southern Rivers
Hawkesbury-Nepean
Sydney-Metro
Figure 1. Location of study sites in relation to coastal Catchment Management Authority regions.
NSW DPI 13
Case studies in coastal fish passage remediation Boys et al.
2. CASE STUDY 1: FLOODGATE MANAGEMENT WITHIN
THE MACLEAY AND CLARENCE RIVER ESTUARIES
2.1. Introduction
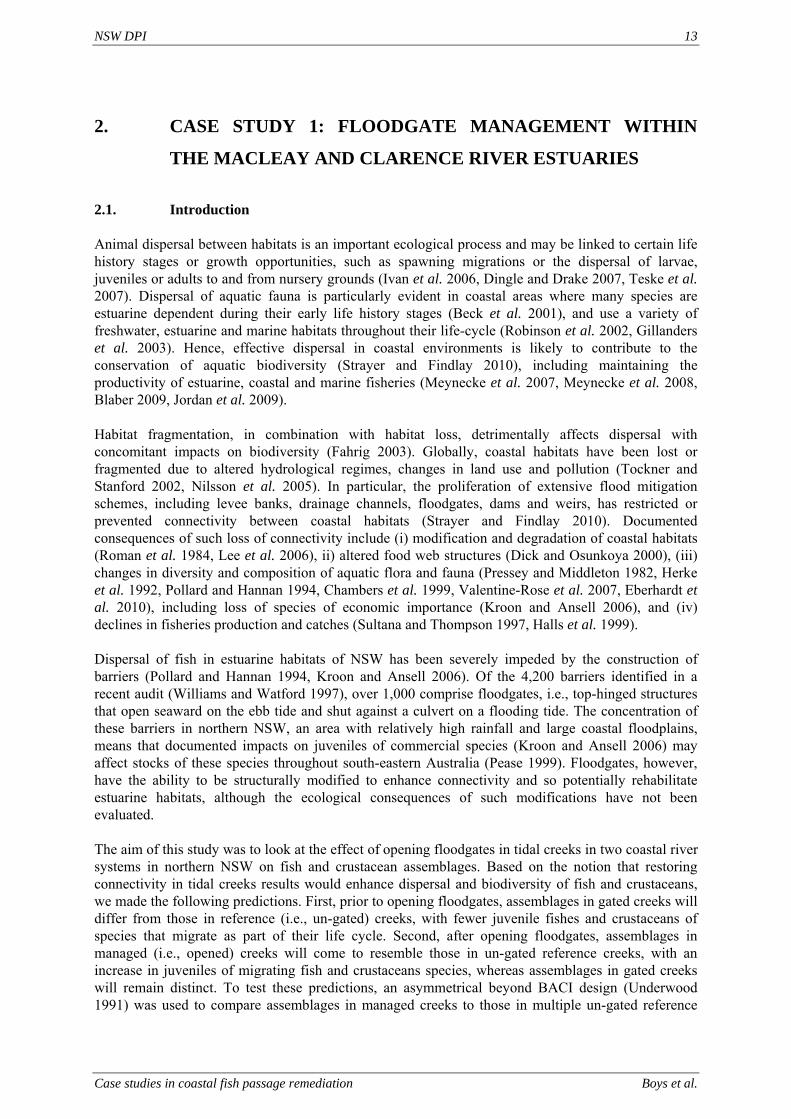
Animal dispersal between habitats is an important ecological process and may be linked to certain life history stages or growth opportunities, such as spawning migrations or the dispersal of larvae, juveniles or adults to and from nursery grounds (Ivan et al. 2006, Dingle and Drake 2007, Teske et al. 2007). Dispersal of aquatic fauna is particularly evident in coastal areas where many species are estuarine dependent during their early life history stages (Beck et al. 2001), and use a variety of freshwater, estuarine and marine habitats throughout their life-cycle (Robinson et al. 2002, Gillanders et al. 2003). Hence, effective dispersal in coastal environments is likely to contribute to the conservation of aquatic biodiversity (Strayer and Findlay 2010), including maintaining the productivity of estuarine, coastal and marine fisheries (Meynecke et al. 2007, Meynecke et al. 2008, Blaber 2009, Jordan et al. 2009). Habitat fragmentation, in combination with habitat loss, detrimentally affects dispersal with concomitant impacts on biodiversity (Fahrig 2003). Globally, coastal habitats have been lost or fragmented due to altered hydrological regimes, changes in land use and pollution (Tockner and Stanford 2002, Nilsson et al. 2005). In particular, the proliferation of extensive flood mitigation schemes, including levee banks, drainage channels, floodgates, dams and weirs, has restricted or prevented connectivity between coastal habitats (Strayer and Findlay 2010). Documented consequences of such loss of connectivity include (i) modification and degradation of coastal habitats (Roman et al. 1984, Lee et al. 2006), ii) altered food web structures (Dick and Osunkoya 2000), (iii) changes in diversity and composition of aquatic flora and fauna (Pressey and Middleton 1982, Herke et al. 1992, Pollard and Hannan 1994, Chambers et al. 1999, Valentine-Rose et al. 2007, Eberhardt et al. 2010), including loss of species of economic importance (Kroon and Ansell 2006), and (iv) declines in fisheries production and catches (Sultana and Thompson 1997, Halls et al. 1999). Dispersal of fish in estuarine habitats of NSW has been severely impeded by the construction of barriers (Pollard and Hannan 1994, Kroon and Ansell 2006). Of the 4,200 barriers identified in a recent audit (Williams and Watford 1997), over 1,000 comprise floodgates, i.e., top-hinged structures that open seaward on the ebb tide and shut against a culvert on a flooding tide. The concentration of these barriers in northern NSW, an area with relatively high rainfall and large coastal floodplains, means that documented impacts on juveniles of commercial species (Kroon and Ansell 2006) may affect stocks of these species throughout south-eastern Australia (Pease 1999). Floodgates, however, have the ability to be structurally modified to enhance connectivity and so potentially rehabilitate estuarine habitats, although the ecological consequences of such modifications have not been evaluated. The aim of this study was to look at the effect of opening floodgates in tidal creeks in two coastal river systems in northern NSW on fish and crustacean assemblages. Based on the notion that restoring connectivity in tidal creeks results would enhance dispersal and biodiversity of fish and crustaceans, we made the following predictions. First, prior to opening floodgates, assemblages in gated creeks will differ from those in reference (i.e., un-gated) creeks, with fewer juvenile fishes and crustaceans of species that migrate as part of their life cycle. Second, after opening floodgates, assemblages in managed (i.e., opened) creeks will come to resemble those in un-gated reference creeks, with an increase in juveniles of migrating fish and crustaceans species, whereas assemblages in gated creeks will remain distinct. To test these predictions, an asymmetrical beyond BACI design (Underwood 1991) was used to compare assemblages in managed creeks to those in multiple un-gated reference
14 NSW DPI
Case studies in coastal fish passage remediation 14
and gated control creeks pre- and post- restoration of tidal flow, in the Macleay and Clarence River systems over a two-year period. As such, this study applied a robust sampling protocol, including relevant treatments and sufficient replicates across space and time, to test the efficacy of the management solution of interest (Memmott et al. 2010).
2.2. Methods
2.2.1. Site descriptions and management interventions
The Macleay and Clarence River estuaries are situated on the mid-north coast of New South Wales (NSW), Australia (Figure 2). The estuaries contribute substantially to fisheries production within NSW and their adjacent wetlands have significant tidal restrictions due to floodgate installations. Floodgates are a common type of tidal restriction found in NSW estuaries and are generally used to control surface runoff and flooding in developed areas. Conceptually, floodgates are typically top-hinged structures that open seaward on the ebb tide and shut against a culvert on a flooding tide.
Macleay River
The Macleay River (30o 52’S, 153o 01’E) has a catchment area of ~11,385 km2 (Roy et al. 2001), with tidal influence terminating approximately 54 km from the entrance. Its floodplain and has been greatly altered by flood mitigation works including 138 km of drains, 180 flood control structures and 352 floodgates. The main study area, Yarrahapinni Broadwater (referred hereafter as MG1) was closed off from the main estuary through construction of levee banks, drainage channels and floodgates in 1971. The floodgates comprise five box culverts fitted with one way (downstream opening) steel flap gates (size 2 m x 1.5 m). Prior to closing, the Broadwater was a large estuarine wetland with 84 ha mangroves, 339 ha saltmarshes, and large areas of seagrasses and shallow mudflats. Since closing, the wetland has lost its saltmarsh, mangrove and seagrass habitats and is now dominated by freshwater flora and fauna. During the study, fisheries managers in conjunction with a community steering group changed the flushing regime of MG1 from permanently closed to partially opened. Two of the five floodgates became tide-actuated, using 500 mm x 500 mm flap-valves fitted in the middle of two of the gates. One flap-valve was permanently removed within the first month of installation and the second flap-valve after seven months due to a combination of vandalism and maintenance issues. When operational, both flap-valves remained open across the lower to mid-tide range and gradually shut as high tide approached. Thus, the creek management scenario comprised (i) partial opening of the gates using a combination of tide-actuated valves and permanently open valves in the first six months, and (ii) permanently opened valves in the last eight months.
Clarence River
The Clarence River (29o 25’S, 153o 23’) is NSW’s largest coastal river system, with a catchment area of ~22,400 km2 (Roy et al. 2001) and a floodplain covering an area of 2100 km2 (Bell and Edwards 1980). The floodplain has been extensively altered by agricultural activities, comprising mostly sugarcane cultivation and cattle grazing (Williams 2000). Almost all of the wetlands on the floodplain (14.7 km2) have been modified by grazing and drainage activities, including 186 floodgates (Walsh et al. 2004) and 1700 km of associated drainage channels (Williams 2000). The two study creeks were situated in the lower floodplain, with Carrolls Drain 13 km from the mouth of the Clarence River and Taloumbi #5 24 km (Kroon and Ansell 2006) (Figure 2b). Carrols Drain (referred hereafter as MG2) was created in 1966 by blocking the opening of original creek and constructing a new, gated opening (five box culverts, floodgates 1.5 m x 1.5 m). Taloumbi #5 (referred hereafter as MG3) was constructed in 1973 with three tidal floodgates (three pipe culverts, floodgates
NSW DPI 15
Case studies in coastal fish passage remediation Boys et al.
1.5 m x 1.5 m), and comprises one of the radial drains entering Lake Wooleweyah. At MG2 and MG3, only 0.5 km2 (20%) and zero km2 of the original wetland areas remain, respectively. During the study (funded as part of a previous grant from the Fisheries Research and Development Corporation to NSW Fisheries), the flushing regime of both managed creeks was changed from permanently closed to intermittently open. In contrast to the floodgate at MG1 in the Macleay, both MG2 and MG3 floodgates were opened manually and completely by property owners. At MG2, all three floodgates were generally opened just before low tide and kept open until the water level reached 0.4 m (Australian Height Datum) at the floodgates. These gates were opened 38 times totalling 80 hrs from August 2001 to April 2002, with an average opening time of 126 min ± 79 SD (range 5 – 300 mins) and average closing time of 6.4 days ± 8.4 SD (range 0 to 32 days). At MG3, generally only one of the three gates was opened, usually on an incoming tide. The gates at MG3 were opened 33 times totalling 56.5 hrs from August 2001 to May 2002, with an average opening time of 103 min ± 81 SD (range 25 – 300 mins) and average closing time of 8.6 days ± 7.7 SD (range 1 to 22 days)
A. Macleay River Estuary B. Clarence River Estuary
MG1
R3
R2 R1
South West Rocks
Yamba
Iluka
Clybucca ck
Anderson Inlet
Macleay R
Jerseyville
Spencers Ck
MG2
MG3
C2 C1
R4
R6
R5
Maclean
Clarence R
*Area A
Area B
~100 m
~ 50 m from floodgate / creek mouth
A. Macleay River Estuary B. Clarence River Estuary
MG1
R3
R2 R1
South West Rocks
Yamba
Iluka
Clybucca ck
Anderson Inlet
Macleay R
Jerseyville
Spencers Ck
MG2
MG3
C2 C1
R4
R6
R5
Maclean
Clarence R
*Area A
Area B
~100 m
~ 50 m from floodgate / creek mouth
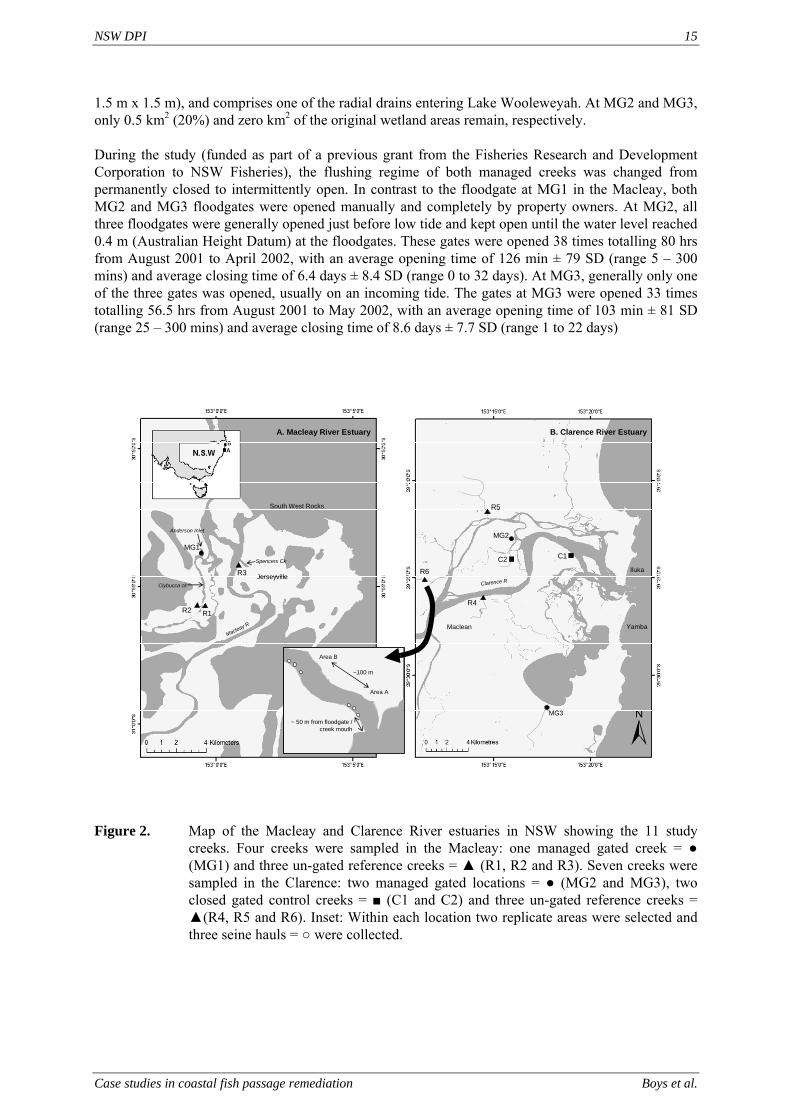
Figure 2. Map of the Macleay and Clarence River estuaries in NSW showing the 11 study creeks. Four creeks were sampled in the Macleay: one managed gated creek = ● (MG1) and three un-gated reference creeks = ▲ (R1, R2 and R3). Seven creeks were sampled in the Clarence: two managed gated locations = ● (MG2 and MG3), two closed gated control creeks = ■ (C1 and C2) and three un-gated reference creeks = ▲(R4, R5 and R6). Inset: Within each location two replicate areas were selected and three seine hauls = ○ were collected.
16 NSW DPI
Case studies in coastal fish passage remediation 16
2.2.2. Experimental design
Macleay River
The sampling design involved a comparison between one managed-gated (MG1) and three nearby tidal reference (R1–3) creeks with no floodgates (Figure 2a). Given the proximity of sampling creeks and their similar sizes and habitats, it was assumed that there would be similar species assemblages at managed and reference creeks in the absence of floodgates. No control creeks (where gates remained closed throughout the study) were found, hence the hypotheses for the Macleay River related only to changes from before to after opening in the managed-gated creek relative to the reference creeks. Samples were collected in each of 20 months from May 2007 until December 2008, on 10 occasions prior to, and 14 occasions after gate opening (Figure 3a; see below for detail). The complete suite of temporal samples was used to plot trajectories of change in each creek through time (MG or R). For the statistical comparisons, a balanced design was created by using only samples collected in corresponding months in ‘before’ versus ‘after’ periods (Figure 3).
Clarence River
A more robust design was possible for the Clarence River, which involved a comparison between two managed creeks (MG2 and MG3), three tidal reference creeks (R4–R6) without any floodgates and two control creeks with gates that remained closed (C1 and C2) (Figure 2b). It was hypothesised that managed creeks would come to resemble reference creeks following floodgate opening, whereas no such change would occur in control creeks. Samples were collected every two months over a 21 month period (September 2000 – May 2002), on six occasions prior to, and five occasions after gate openings at both MGs (Figure 3b). As in the Macleay, the complete suite of temporal samples was used to examine trajectories of change at each creek or treatment through time (MG, C or R), but only those collected in corresponding months were used for statistical comparisons of ‘before’ versus ‘after’ periods.
NSW DPI 17
Case studies in coastal fish passage remediation Boys et al.
2.2.3. Sampling methods
Fish and crustaceans were collected using a fine mesh seine net (10 m headline x 2 m drop x 6 mm stretch mesh) pursed onto the shore (see Kroon and Ansell 2006 for more detail). Three seine hauls (~10 m apart) were collected from each of two areas (50 and 150 m from the floodgate or creek mouth) within each creek (see Kroon and Ansell 2006 for details) (Figure 2). The three seine hauls within each area were summed to give one composite sample per area and both areas within each creek were considered far enough apart to be independent and so provided two replicate samples per creek at each sampling time. All sampling was conducted during daylight hours and moon phase was not taken into consideration. To enable effective seine netting of littoral habitats in each location, it was necessary to sample the tidally-active reference locations at different stages in the tidal cycle. In general R1, R2, R4 and R6 were sampled around high slack time and R3 and R5 were sampled around slack low tide. While tidal changes in fish assemblages have been recorded (e.g., Morrison et al. 2002), habitat effects on species assemblages generally tend to override any tidal effects (e.g., Ribeiro et al. 2006). Any impact of floodgate management on assemblages should therefore override any potential differences due to sampling at different times of the tide. This sampling approach has been shown to collect 86% of fish and decapod crustacean species present in these areas (Kroon et al. 2004), but is selective towards small species (usually those of little direct economical importance) and juveniles of larger (usually commercially or recreationally important angling species). Most individuals were identified to species level, but small juveniles of the families Ambassidae, Acentrogobidae and Alpheidae were unable to be classified beyond family (as in Kroon and Ansell 2006). Where possible, taxa were classified according to their salinity status, reflecting the potential to migrate between saltwater and freshwater habitats as part of their life cycle and therefore respond to improved connectivity. Estuarine-marine (E-M) are those saltwater species that spend most of their lives in either estuarine or coastal ocean waters. Freshwater-estuarine (F–E) are euryhaline species equally well adapted to life in freshwater or saltwater habitats. Freshwater (F) species are those typically confined to freshwater.
18 NSW DPI
Case studies in coastal fish passage remediation 18
Dis
char
ge (t
hous
and
ML.
day-
1)
0
20
40
60
80
100
120
140
Mea
n m
onth
ly ra
infa
ll (m
m)
0
50
100
150
200
250
300
350
400
450
J F M A M J J A S O N D J F M A M J J A S O N D
Floodgate opening commenced
1
2 3
4
5
7 8
9
6
10
11
13
14
12
15
16
17
1819
20
21
22
23
24
a) Macleay River Estuary
0
20000
40000
60000
80000
100000
120000
140000
1/06
/200
0
1/07
/200
0
1/08
/200
0
1/09
/200
0
1/10
/200
0
1/11
/200
0
1/12
/200
0
1/01
/200
1
1/02
/200
1
1/03
/200
1
1/04
/200
1
1/05
/200
1
1/06
/200
1
1/07
/200
1
1/08
/200
1
1/09
/200
1
1/10
/200
1
1/11
/200
1
1/12
/200
1
1/01
/200
2
1/02
/200
2
1/03
/200
2
1/04
/200
2
1/05
/200
2
1/06
/200
2
20
40
60
80
100
120
140
Dis
char
ge (t
hous
and
ML.
day-
1)
833.5 1 268.4
J J A S O N D J F M A M0
50
100
150
200
250
300
350
400
450
J J A S O N D J F M A M J
Mea
n m
onth
ly ra
infa
ll (m
m)
b) Clarence River Estuary
2007 2008
Floodgate opening commenced
2000 2001 2002
1
2 3 4
5
7
8
6
9 10
11
‘before’ ‘after’
‘before’ ‘after’
Dis
char
ge (t
hous
and
ML.
day-
1)
0
20
40
60
80
100
120
140
Mea
n m
onth
ly ra
infa
ll (m
m)
0
50
100
150
200
250
300
350
400
450
J F M A M J J A S O N D J F M A M J J A S O N D
Floodgate opening commenced
1
2 3
4
5
7 8
9
6
10
11
13
14
12
15
16
17
1819
20
21
22
23
24
a) Macleay River Estuary
0
20000
40000
60000
80000
100000
120000
140000
1/06
/200
0
1/07
/200
0
1/08
/200
0
1/09
/200
0
1/10
/200
0
1/11
/200
0
1/12
/200
0
1/01
/200
1
1/02
/200
1
1/03
/200
1
1/04
/200
1
1/05
/200
1
1/06
/200
1
1/07
/200
1
1/08
/200
1
1/09
/200
1
1/10
/200
1
1/11
/200
1
1/12
/200
1
1/01
/200
2
1/02
/200
2
1/03
/200
2
1/04
/200
2
1/05
/200
2
1/06
/200
2
20
40
60
80
100
120
140
Dis
char
ge (t
hous
and
ML.
day-
1)
833.5 1 268.4
J J A S O N D J F M A M0
50
100
150
200
250
300
350
400
450
J J A S O N D J F M A M J
Mea
n m
onth
ly ra
infa
ll (m
m)
b) Clarence River Estuary
2007 2008
Floodgate opening commenced
2000 2001 2002
1
2 3 4
5
7
8
6
9 10
11
‘before’ ‘after’
‘before’ ‘after’
Figure 3. Temporal experimental design showing relationship between sampling times (dots)
and mean average rainfall (dashed line) and main freshwater river flows (solid line) into the a) Macleay River and b) Clarence River estuaries. The Macleay River flow was measured at Turners Flat and the Clarence River flow was calculated from the combined flows from the upper Clarence River (measured at Lilydale) and the Orara River (measured at Bawden Bridge). Rainfall for the Macleay was measured at South West Rocks (Smoky Cape) and for the Clarence was measured at Yamba. Only those samples collected over comparative seasons (black dots) were used for direct before/after comparisons, although all samples (including white dots) were used when making comparisons between treatments at each time. Sample numbers correspond to the data point labels in the ordinations (Figure 4) and reflect the sequence of sampling. Flow data obtained from NSW Office of Water and rainfall data obtained from Australian Bureau of Meteorology.
NSW DPI 19
Case studies in coastal fish passage remediation Boys et al.
2.2.4. Statistical analyses
Two separate asymmetrical, four factor models were used for the Macleay and Clarence data. Factors in the Macleay model were: Before versus After (BA) (fixed, two levels); Time (Ti) (random, 10 levels, nested within BA); Treatment (Tr) (fixed, with two levels, Managed Gate (MG) vs References (R)); and Creek (Ck) (random, with 1 level nested in MG and 2 levels nested in R). The Clarence model included control creeks and fewer times of sampling and so consisted of: BA (fixed, two levels); Ti (random, five levels, nested within BA); Tr (fixed, three levels, MGs vs Rs vs Cs); and Ck (random, 2 levels nested within each of MGs and Rs, 3 levels nested with Cs). Non-parametric permutational analyses of variance (PERMANOVA in the PRIMER v6 software package, Anderson 2001, McArdle and Anderson 2001, Clarke and Gorley 2006, Anderson et al. 2008) were used to test for changes in assemblages in MGs over time relative to Rs or Cs. PERMANOVA is especially useful for mixed model asymmetrical analyses because pseudo F tests (analogous to traditional quasi F ratios) can be created for both main effects and interactions in even the most complex designs using linear combinations of appropriate mean squares (Terlizzi et al. 2005). Because P values are calculated using permutation tests, the P values for all pseudo F tests are perfectly correct (unlike quasi F ratios; Anderson et al. 2008). To reduce the influence of very abundant species (e.g., ambassids, eleotrids, shrimps), data were fourth root transformed (Clarke and Green 1988) before calculating Bray-Curtis similarities (Bray and Curtis 1957). Non-metric multidimensional scaling (nMDS; Kruskal and Wish 1978) ordinations were used to present multivariate patterns in the combined fish and crustacean assemblage data. The ordinations show the centroids for each managed-gated creek along with centroids for the combined control or reference creeks at each time of sampling. Agglomerative hierarchical clustering was used to help interpret ordinations and to identify significant natural grouping of samples using similarity profile permutations (SIMPROF; Clarke et al. 2008). The SIMPER procedure (Clarke 1993) was used on presence/absence transformed data to identify those species that were most important in differentiating each managed creek from the group of reference creeks before versus after floodgate opening. Species were selected as important if they exceeded an arbitrary threshold value of percent dissimilarity ≥3% (Terlizzi et al. 2005). For MG3 which showed only a short-term response to floodgate opening, the after period was analysed as two discrete periods (times 7–9 and 10–11) to better describe early versus later changes. The consistency ratio (Dissimilarity/SD), calculated for all important species, indicated whether a species consistently contributed (values >1) to the average dissimilarity between managed and reference creeks in the majority of times in the before or after period, or only at certain times (Clarke 1993).
20 NSW DPI
Case studies in coastal fish passage remediation 20
2.3. Results
2.3.1. General
In total, 1,038 seines were hauled, yielding 75 taxa (61 fish and 14 decapod crustacean taxa), and 580,086 individuals (130,669 fish and 449,417 crustaceans) (Table 1). The vast majority of individuals (86%) and species (65%) were classified as primarily estuarine or marine. Euryhaline (F–E) species and those species which are solely dependent on freshwater comprised 12% and 2% of the total number of individuals and 15% and 12% of the total number of species, respectively. One third of the species caught (6% of individuals) were of some economic importance, with adults of these species forming part of a recreational and/or commercial fishery. The most abundant economically important species were Metapenaeus macleayi (school prawn), Liza argentea and Mugil cephalus (mullets) and Acanthopagrus australis (yellowfin bream), which comprised 73%, 18% and 3% of the total economically important catch, respectively. The various shrimp species caught in the Macleay estuary were not kept for analysis. However, shrimp were included in the analysis for the Clarence estuary and were the most abundant type of decapod sampled, comprising 97% of the total decapod catch.
2.3.2. Macleay River
Coinciding with the opening of the floodgate, fish and crustacean assemblages in MG1 showed a significant shift that was not observed in the reference creeks (Table 2: BA x Ck(Tr) interaction). In addition, assemblages at MG1 came to resemble those in the reference creeks after the floodgates were opened (Figure 4a, Figure 5a), with the average dissimilarity between MG1 and Rs falling from 76.4 before opening to 37.6 in the after opening (SIMPER, Table 3). Furthermore, after floodgate opening, seasonal fluctuations in species assemblages in MG1 became much smaller and similar to those in the reference creeks (Figure 4a). The total number of species varied significantly between MG1 and the three reference creeks from before to after the opening of the floodgates (BA x Tr Pseudo-F = 12.96, P = 0.001). Specifically, in MG1 the number of species increased after the floodgates were opened to become similar to the numbers in the reference creeks, while there was no equivalent temporal change in the reference creeks (Figure 6a). This pattern was driven primarily by estuarine-marine species (Figure 6b, BA x Tr Pseudo-F = 20.55, P = 0.002 ), which doubled within one month following floodgate opening and subsequently increased over the next eight months (Figure 7). The estuarine-marine species responsible primarily for the change were Metapenaeus macleayi (School prawn) and the fish Redigobius macrostoma, Ambassis spp, Favonigobius exquisitus, Pandaka lidwilli, Gobiopterus semivestitus, Liza argentea, Acanthopagrus australis (SIMPER, Table 3). In contrast, smaller changes in freshwater-estuarine and freshwater species were observed at MG1 in response to floodgate opening (Figure 6c,d) and these were significant only at certain times in some creeks (for freshwater-estuarine species, Ti(BA) x Ck(Tr) Pseudo-F = 1.54, P = 0.047). Abundances of the freshwater-estuarine fish species Pseudomugil signifer and Philypnodon grandiceps increased, whilst numbers of the freshwater fish Philypnodon macrostoma, decreased (SIMPER, Table 3). The mean consistency ratio (Diss/SD) for those species which discriminated between MG1 and Rs prior to opening decreased from 1.4 to 0.8 after opening, indicating that species differences were consistent for the majority of times before floodgate opening, but less so following floodgate opening.
Case studies in coastal fish passage remediation (Boys et al.) 21
Table 1. Mean catch per unit effort (averaged across all ‘area’ by ‘time’ sample) of all taxa collected from the Macleay and Clarence River estuaries, showing their abundance at each treatment (MGs managed gated; Cs gated controls; and Rs un-gated references) before (B) and after (A) floodgate opening commenced.
Estuary: Macleay Clarence Treatment: MG Rs MGs Cs Rs Before/After: B A B A B A B A B A
Total
Length† (mm)
Sal§
Number of samples: 20 28 60 84 24 20 24 20 36 30 346
Family Genus and species
FISH Ambassidae Ambassis spp 0.0 24.9 104.7 71.7 14.3 46.2 2.8 1.9 100.3 88.9 455.7 13-75 E-M Anguillidae Anguilla australis* 0.1 0.0 0.0 0.0 0.0 0.0 0.0 0.1 0.0 0.0 0.1 18-297 F-E Anguilla reinhardtii* 0.0 0.0 0.0 0.0 0.0 0.1 0.0 0.1 0.0 0.0 0.2 53-1500 F-E Apogonidae Siphamia roseigaster 0.0 0.0 0.0 0.0 0.0 0.0 0.0 0.0 0.4 0.9 1.3 - E-M Atherinidae Atherinosoma microstoma 0.0 0.0 0.0 0.0 0.0 0.0 0.0 0.0 0.0 0.0 0.0 - E-M Belonidae Tylosurus gavialoides* 0.0 0.0 0.0 0.0 0.0 0.0 0.0 0.0 0.0 0.0 0.0 153-153 E-M Blenniidae Omobranchus anolius 0.0 0.0 0.0 0.0 0.0 0.0 0.0 0.0 0.0 0.0 0.0 - E-M Carangidae Caranx spp* 0.0 0.0 0.0 0.0 0.0 0.0 0.0 0.0 0.0 0.0 0.0 49-49 ND Chandidae Ambassis agassizii 0.0 0.0 0.0 0.0 2.3 0.3 0.1 0.0 1.5 0.0 4.2 F Clupeidae Herklotsichthys castelnaui* 0.0 0.0 0.0 0.1 0.0 6.4 0.0 0.1 0.3 1.1 7.9 9-112 E-M Hyperlophus vittatus 0.0 0.0 0.0 0.7 0.0 0.9 0.0 0.0 1.7 0.0 3.3 18-52 E-M Cyprinidae Carassius auratus 0.0 0.0 0.0 0.0 0.5 0.0 0.0 0.0 0.0 0.0 0.5 - F Diodontidae Dicotylichthys punctulatus 0.0 0.0 0.0 0.0 0.0 0.0 0.0 0.0 0.0 0.0 0.0 23-23 ND Eleotridae Gobiomorphus australis 0.0 0.2 0.0 0.3 49.7 73.1 39.7 60.3 26.1 31.1 280.4 15-24 F Hypseleotris compressa 0.4 10.3 0.0 1.5 95.7 148.3 361.6 244.0 185.4 5.5 1,052.7 11-43 F-E Hypseleotris galii 0.0 0.3 0.1 0.0 6.0 5.9 0.2 0.2 0.7 0.1 13.3 21-34 F Hypseleotris klunzingeri 0.0 0.0 0.0 0.0 0.0 0.0 0.0 0.1 0.0 0.0 0.1 - F Philypnodon grandiceps 25.9 9.4 1.5 0.8 366.6 122.7 5.4 4.8 16.9 2.2 556.1 10-33 F-E Philypnodon sp1 8.4 1.1 0.1 0.0 73.9 91.2 0.2 0.0 0.5 0.0 175.3 9-37 F Scorpaenidae Centropogon australis 0.0 0.0 0.2 0.1 0.0 0.0 0.0 0.0 0.1 0.1 0.4 8-24 E-M Galaxiidae Galaxias maculatus 0.0 0.0 0.0 0.0 0.0 0.0 0.0 0.0 0.0 0.0 0.0 29-29 F-E Gerreidae Gerres subfasciatus* 0.0 0.1 1.9 0.5 0.0 0.7 1.5 2.7 2.3 11.2 20.7 9-132 E-M Girellidae Girella tricuspidata* 0.0 0.0 0.0 0.0 0.0 0.1 0.0 0.0 0.1 0.0 0.2 13-24 E-M Microcanthus strigatus 0.0 0.0 0.0 0.0 0.0 0.0 0.0 0.0 0.0 0.0 0.0 - ND Gobiidae Acentrogobius bifrenatus 0.1 0.0 0.8 2.0 0.0 0.0 0.8 0.0 0.9 0.1 4.7 13-75 E-M Acentrogobius frenatus 0.0 0.0 0.0 0.0 0.0 0.0 0.0 0.1 0.1 0.0 0.2 26-65 E-M Acentrogobius spp. 0.0 0.0 0.0 0.0 0.0 0.0 0.0 0.0 0.0 0.0 0.0 18-46 E-M Afurcagobius tamarensis 0.1 4.6 5.0 5.2 0.1 12.8 2.0 2.3 18.3 19.6 69.9 18-46 F-E Butis butis 0.0 0.0 0.0 0.0 0.0 0.0 0.0 0.0 0.0 0.0 0.1 - E-M Cristatogobius gobioides 0.0 0.0 0.9 0.1 0.0 0.0 0.0 0.0 0.0 0.0 1.0 10-79 E-M Favonigobius exquisitus 0.0 6.5 73.5 73.1 0.0 0.0 0.7 0.6 0.6 6.0 160.9 10-60 E-M
Case studies in coastal fish passage remediation (Boys et al.) 22
Table 1. (continued)
Estuary: Macleay Clarence Treatment: MG Rs MGs Cs Rs Before/After: B A B A B A B A B A
Total
Length† (mm)
Sal§
Number of samples: 20 28 60 84 24 20 24 20 36 30 346
Family Genus and species
Glossogobius biocellatus 0.0 0.0 0.0 0.0 0.0 0.1 0.0 0.0 0.0 1.0 1.0 - ND Gobiidae spp 0.0 0.0 0.0 0.0 10.5 0.0 0.0 0.0 0.3 0.0 10.8 - ND Gobiopterus semivestitus 0.5 3.3 12.8 6.8 5.7 11.1 21.1 0.6 23.4 6.7 92.0 2-29 E-M Mugilogobius platynotus 0.0 0.0 0.0 0.0 0.0 0.4 1.2 5.1 0.1 0.2 7.0 28-28 E-M Pandaka lidwilli 0.0 0.0 30.3 1.5 0.5 0.3 0.2 0.1 0.1 0.1 33.1 1-38 E-M Psammogobius biocellatus 0.0 0.0 0.0 0.0 0.0 0.0 0.0 0.0 0.0 0.0 0.0 25-76 E-M Pseudogobius olorum 28.1 29.2 29.7 44.9 75.0 84.5 17.5 88.1 29.3 23.3 449.4 7-53 E-M Redigobius macrostoma 0.1 13.7 5.1 11.4 1.0 11.0 0.7 18.5 9.8 8.5 79.6 2-36 E-M Taenioides purpurascens 0.0 0.0 0.0 0.0 0.0 0.0 0.0 0.0 0.0 0.0 0.1 - E-M Hemiramphidae Arrhamphus sclerolepis* 0.0 0.0 0.0 0.0 0.0 0.0 0.0 0.0 0.6 0.0 0.7 19-165 F-E Hyporhamphus regularis* 0.0 0.0 0.0 0.0 0.0 0.2 0.0 0.0 0.0 0.1 0.3 27-111 E-M Melanotaeniidae Melanotaenia duboulayi 0.0 0.0 0.0 0.0 0.2 0.0 0.0 0.0 0.0 0.0 0.2 - F Monacanthidae Meuschenia trachylepis 0.0 0.0 0.0 0.0 0.0 0.1 0.0 0.0 0.0 0.0 0.1 18-18 E-M Monodactylus argenteus 0.0 0.0 0.0 0.0 0.0 0.4 0.0 0.0 0.8 1.1 2.3 - E-M Mugilidae Liza argentea* 0.0 1.9 16.0 12.8 0.0 3.3 0.0 0.1 48.0 13.1 95.1 6-212 E-M Mugil cephalus* 1.9 1.5 3.4 11.7 0.2 11.8 0.2 0.1 5.2 1.6 37.4 10-360 E-M Paralichthyidae Pseudorhombus arsius* 0.0 0.0 0.1 0.1 0.0 0.0 0.0 0.0 0.0 0.0 0.3 28-180 E-M Platycephalidae Platycephalus fuscus* 0.1 0.0 0.0 0.0 0.0 0.1 0.0 0.0 0.1 0.1 0.3 10-410 E-M Pleuronectiformes Pseudorhombus jenynsii* 0.0 0.0 0.0 0.0 0.0 0.0 0.0 0.0 0.0 0.1 0.1 33-131 E-M Poeciliidae Gambusia holbrooki 1.6 1.0 0.0 0.2 173.5 9.6 151.3 76.2 4.4 0.1 418.0 16-36 F-E Pomatomidae Pomatomus saltatrix* 0.0 0.0 0.1 0.1 0.0 0.0 0.0 0.0 0.1 0.3 0.6 20-102 E-M Pseudomugilidae Pseudomugil signifer 0.5 1.3 20.6 11.8 20.6 7.9 4.1 3.1 16.8 27.1 113.6 11-220 F-E Scatophagidae Scatophagus argus* 0.0 0.0 0.0 0.0 0.0 0.0 0.0 0.0 0.0 0.1 0.1 19-19 E-M Selenotoca multifasciata 0.0 0.0 0.0 0.0 0.0 0.0 0.0 0.0 0.1 0.2 0.3 - E-M Scorpaenidae Notesthes robusta 0.0 0.0 0.0 0.0 0.0 0.1 0.0 0.0 0.1 0.0 0.1 - F-E Sillaginidae Sillago ciliata* 0.0 0.0 0.0 0.0 0.0 0.0 0.0 0.0 0.0 0.0 0.0 43-64 E-M Soleidae Synaptura nigra* 0.0 0.0 0.0 0.0 0.0 0.0 0.0 0.0 0.0 0.0 0.1 22-96 E-M Sparidae Acanthopagrus australis* 0.1 1.8 2.1 4.0 0.1 6.1 0.4 0.1 9.9 4.5 29.0 5-270 E-M Rhabdosargus sarba* 0.0 0.4 4.8 0.1 0.0 0.2 0.0 0.0 1.3 0.5 7.3 8-112 E-M Sphyraenidae Sphyraena obtusata* 0.0 0.0 0.0 0.0 0.0 0.0 0.0 0.0 0.0 0.0 0.0 - E-M Synodontidae Saurida nebulosa 0.0 0.0 0.0 0.0 0.0 0.0 0.0 0.0 0.0 0.0 0.0 61-61 E-M Tetraodontidae Tetractenos glaber 0.0 0.0 0.2 0.0 0.0 0.0 0.0 0.0 0.1 0.3 0.7 52-168 E-M
Case studies in coastal fish passage remediation (Boys et al.) 23
Table 1. (continued)
Estuary: Macleay Clarence Treatment: MG Rs MGs Cs Rs Before/After: B A B A B A B A B A
Total
Length† (mm)
Sal§
Number of samples: 20 28 60 84 24 20 24 20 36 30 346
Family Genus and species
Mean abundance of fish 67.4 111.4 313.8 261.7 896.5 655.0 611.8 508.6 506.7 256.1 4,188.9 Total number of fish species 14 21 32 33 22 30 23 23 42 40 63 CRUSTACEANS Alpheidae Alpheus spp. n/a n/a n/a n/a 0.0 0.0 0.0 0.0 0.1 0.0 0.1 ND Atyidae Caridina indistincta n/a n/a n/a n/a 1.0 0.2 0.0 0.0 0.2 0.0 1.3 - F Caridina nilotica n/a n/a n/a n/a 0.5 0.4 1.3 1.3 3.0 3.9 10.3 - F Paratya australiensis n/a n/a n/a n/a 0.0 0.0 0.0 0.0 0.0 0.0 0.0 - E-M n/a Mysidia spp n/a n/a n/a n/a 1.0 0.0 0.0 0.0 0.1 0.0 1.1 - ND Idiosepiidae Idiosepius spp n/a n/a n/a n/a 0.0 0.1 0.0 0.0 0.1 0.0 0.3 - ND Palaemonidae Macrobrachium cf
novaehollandiae n/a n/a n/a n/a 0.8 1.0 4.6 2.1 5.9 3.7 18.1 - E-M Palaemon debilis n/a n/a n/a n/a 1.1 16.0 186.5 184.9 142.6 61.8 592.8 - F-E Penaeidae Melicertus plebejus* 0.0 0.0 2.0 3.1 0.0 0.0 0.0 0.0 0.0 0.0 5.0 3-16 E-M Metapenaeus bennettae 0.0 0.0 0.0 0.6 0.0 0.1 0.3 0.3 0.0 0.0 1.2 2-23 E-M Metapenaeus macleayi* 0.9 98.3 48.9 94.0 2.6 12.4 19.7 2.3 188.6 108.9 576.5 1-28 E-M Penaeus plebejus 0.0 0.0 0.0 0.0 0.2 0.2 2.3 0.3 2.8 0.4 6.0 2-24 E-M Penaeus Penaeus esculentus* 0.0 0.0 0.0 0.0 0.0 0.1 0.0 0.0 0.0 0.3 0.4 4-20 E-M Sergestidae Acetes sibogae australis n/a n/a n/a n/a 11.1 892.8 520.0 3.0 7,189.3 3,947.9 12,564.0 - E-M
Mean abundance of crustacean 0.9 98.3 50.8 97.6 18.2 923.0 734.5 193.9 7,532.8 4,127.1 13,777.1 Total number of crustacean species 1 2 2 4 8 10 9 7 12 9 14
MEAN ABUNDANCE 68.3 209.7 364.6 359.3 914.7 1,577.9 1,346.3 702.5 8,039.5 4,383.1 17,966.0 TOTAL NUMBER OF SPECIES 15 23 34 37 30 40 32 30 54 49 344
* Economically important † Standard length range (mm) given for all taxa collected in the Macleay River estuary and key economically important species in the Clarence River estuary. § Salinity Status: Freshwater (F), Freshwater-Estuarine (F–E), Estuarine-Marine (E–M) and not determined (ND).
24 NSW DPI
Boys et al. Case studies in coastal fish passage remediation
Table 2. Multivariate PERMANOVA comparison of fish and crustacean assemblages in a
managed gate creek vs references in the Macleay estuary (44 taxa) and managed gate vs reference vs control creeks in the Clarence estuary (66 taxa). P-values presented only for those terms that test for an effect of opening floodgates. Post-hoc-pooling of non-significant terms (P > 0.25) did not change the result of tests of interest.
Source of variation* df MS Pseudo-F Pperm
†
Macleay River estuary BA 1 28042.00 6.70 Ti(BA) 18 2463.40 2.59 Tr 1 30723.00 1.12 Ck(Tr) 2 26238.00 27.61 BA x Tr 1 17011.00 4.71 0.001 BA x Ck(Tr) 2 1862.90 1.96 0.032 Ti(BA) x Tr 18 1950.30 2.05 0.001 Ti(BA) x Ck(Tr) 36 950.24 2.18 0.001 Residual 80 435.47
Clarence River estuary BA 1 7617.10 1.71 Ti(BA) 8 3380.00 2.64 Tr 2 32460.00 3.60 Ck(Tr) 4 8128.10 6.34 BA x Tr 2 2617.50 1.24 0.165 BA x Ck(Tr) 4 1853.10 1.45 0.067 Ti(BA) x Tr 16 1291.80 1.01 0.482 Ti(BA) x Ck(Tr) 32 1284.80 3.08 0.001 Residual 70 416.48
* Abbreviations: Before vs After (BA); Time (Ti); Treatment (Tr); Creek (Ck). † Pperm values were obtained using 999 permutations under a reduced model, with those in bold indicating significant sources of
variation at α = 0.05.
NSW DPI 25
Case studies in coastal fish passage remediation Boys et al.
b) Clarence
MG Before MG After R BeforeR After
1
1
2
2
3
3
4
4
5
5
6
6
7
7
8
8
9
9
10
10
11
11
2D Stress: 0.14
C Before C After
a) Macleay
1
2
3
45
6
7
8
9
10
11
12
13
14
15
16
17
19
1820
2122
2324
2D Stress: 0.13
12
13
6
7 4
24
233
1
81095
14
15
16
1718 19
2021
222 11
MG2
1
2
2
3
3
4
4
55
6
67
7
8
8
9
9
10
10
11
11
1
MG3
MG1
b) Clarence
MG Before MG After R BeforeR After
1
1
2
2
3
3
4
4
5
5
6
6
7
7
8
8
9
9
10
10
11
11
2D Stress: 0.14
C Before C After
a) Macleay
1
2
3
45
6
7
8
9
10
11
12
13
14
15
16
17
19
1820
2122
2324
2D Stress: 0.13
12
13
6
7 4
24
233
1
81095
14
15
16
1718 19
2021
222 11
a) Macleay
1
2
3
45
6
7
8
9
10
11
12
13
14
15
16
17
19
1820
2122
2324
2D Stress: 0.13
12
13
6
7 4
24
233
1
81095
14
15
16
1718 19
2021
222 11
MG2
1
2
2
3
3
4
4
55
6
67
7
8
8
9
9
10
10
11
11
1
MG3
MG1
Figure 4. Two-factor nMDS of centroids for each managed (MG1–3) creeks or combined
control (C) or reference (R) creeks at each time of sampling, obtained from Bray–Curtis dissimilarities, showing the trajectories in fish and crustacean assemblages in the (a) Macleay and (b) Clarence estuaries over our study periods. Numbers correspond to those in Figure 3; dashed line indicates when floodgate opening commenced.
26 NSW DPI
Boys et al. Case studies in coastal fish passage remediation
a)
MG1- 6
MG1- 9
MG1- 7
MG1- 8
MG1- 3
MG1- 4
MG1- 5
MG1- 1
MG1- 2
MG1-
10MG
1-16
R3- 1
R3- 2
R3- 3
R3- 4
R3- 6
R3-8
R3-9
R3-5
R3-7
MG1-
23MG
1-24
R3-18
R3-19
R3-20
R3-21
R3-22
R3-17
R3-15
R3-16
R3-14
R3-12
R3-13
R3-10
R3-11
R3-23
R3-24
MG1-1
2R2
-14R2
-11 R2-9
MG1-1
4R1
-7R1
-9R1
-8R1
-11R1
-10R1
-14 R2-8
R2-10 R1-3
R1-2
R1-4
R1-5
R2-1
R2-2
R1-1
R2-5
R2-3
R2-4
R1-15
MG1-1
1R2
-16R2
-15R2
-17R1
-17MG
1-18
R2-21
MG1- 2
0MG
1-21
MG1-2
2MG
1-19
MG1-1
5MG
1-17
R1-21
R1-20
R1-22
R2-22
R2-19
R2-20
R1-16
R1-19 R1-6
R2-6
R1-18
R2-18
R1-23
R1-24
R2-23 R2-7
R2-24
R2-12
MG1-1
3R2
-13R1
-12R1
-1 3
100
80
60
40
20
0
% S
imila
rity
R3 before & after+
MG1 after times 23 & 24(62% Similarity)
R1 & R2 before & after+
MG1 at all after times except 13, 16, 23 & 24(57% Similarity)
MG1 all before
(except 6 & 9) +
MG1 after time 16
All R creeks at all times and the MG1 creek after floodgate opening (except at time 16) (45% similarity)
R2 before time 7, R1 & R2 after times
12,13,23,24.MG1 after time 13(51% Similarity)
(36% Sim.)MG
1 be
fore
tim
es 6
& 9
(70%
Sim
.)MG
1- 6MG
1- 9MG
1- 7MG
1- 8MG
1- 3MG
1- 4MG
1- 5MG
1- 1MG
1- 2MG
1-10
MG1-1
6R3
- 1R3
- 2R3
- 3R3
- 4R3
- 6R3
-8R3
-9R3
-5R3
-7MG
1-23
MG1-2
4R3
-18R3
-19R3
-20R3
-21R3
-22R3
-17R3
-15R3
-16R3
-14R3
-12R3
-13R3
-10R3
-11R3
-23R3
-24MG
1-12
R2-14
R2-11 R2-9
MG1-1
4R1
-7R1
-9R1
-8R1
-11R1
-10R1
-14 R2-8
R2-10 R1-3
R1-2
R1-4
R1-5
R2-1
R2-2
R1-1
R2-5
R2-3
R2-4
R1-15
MG1-1
1R2
-16R2
-15R2
-17R1
-17MG
1-18
R2-21
MG1- 2
0R3
-11R3
-23R3
-24MG
1-12
R2-14
R2-11 R2-9
MG1-1
4R1
-7R1
-9R1
-8R1
-11R1
-10R1
-14 R2-8
R2-10 R1-3
R1-2
R1-4
R1-5
R2-1
R2-2
R1-1
R2-5
R2-3
R2-4
R1-15
MG1-1
1R2
-16R2
-15R2
-17R1
-17MG
1-18
R2-21
MG1- 2
0MG
1-21
MG1-2
2MG
1-19
MG1-1
5MG
1-17
R1-21
R1-20
R1-22
R2-22
R2-19
R2-20
R1-16
R1-19 R1-6
R2-6
R1-18
R2-18
R1-23
R1-24
R2-23 R2-7
R2-24
R2-12
MG1-1
3R2
-13R1
-12R1
-1 3
100
80
60
40
20
0
% S
imila
rity
R3 before & after+
MG1 after times 23 & 24(62% Similarity)
R1 & R2 before & after+
MG1 at all after times except 13, 16, 23 & 24(57% Similarity)
MG1 all before
(except 6 & 9) +
MG1 after time 16
All R creeks at all times and the MG1 creek after floodgate opening (except at time 16) (45% similarity)
R2 before time 7, R1 & R2 after times
12,13,23,24.MG1 after time 13(51% Similarity)
(36% Sim.)MG
1 be
fore
tim
es 6
& 9
(70%
Sim
.)
Figure 5. (caption on next page)
NSW DPI 27
Case studies in coastal fish passage remediation Boys et al.
b)
R4-
4R
4-5
R4-
1 0R
4-1 1
R5-
1 0R
5-1 1
R4-
3R
5-4
R5-
8R
5-9
R4-
1R
4-2
R4-
8R
6-8
R6-
1R
5-7
R5-
1R
5-2
R5-
3R
6-9
R6-
2M
G2-
9R
6-1 0
R6-
1 1R
6-3
MG
2-1 1
MG
2-7
C1-
6M
G2-
8R
4-9
R4-
6R
5-6
R4-
7R
6-6
R5-
5R
6-7
MG
3-9
MG
3-7
MG
3-8
R6-
5C
1-4
C1-
5M
G2-
4M
G2-
5M
G3-
1M
G3-
2M
G3-
1 1M
G3-
4R
6-4
MG
3-6
MG
3-5
MG
3-3
MG
3-1 0
MG
2-6
MG
2-1
MG
2-2
MG
2-3
C2-
1 1C
2-3
MG
2-1
0C
2-1 0
C1-
1 1C
2-2
C2-
8C
2-9
C2-
1C
1-9
C2-
4C
1-10
C1-
1C
1-2
C1-
3C
1-8
C2-
5C
2-6
C1-
7C
2-7
100
80
60
40
20
% S
imila
rity
MG3 before and after,C1 & C2 before and after,
MG2 before + MG2 after time 10,R6 before time 4.
(47% similarity)
R4
befo
re ti
mes
4 &
5(5
9% S
im.) R4 & R5 before and after,
MG2 all after except time 10,C1 before time 6.
(55% similarity)
R4-
4R
4-5
R4-
1 0R
4-1 1
R5-
1 0R
5-1 1
R4-
3R
5-4
R5-
8R
5-9
R4-
1R
4-2
R4-
8R
6-8
R6-
1R
5-7
R5-
1R
5-2
R5-
3R
6-9
R6-
2M
G2-
9R
6-1 0
R6-
1 1R
6-3
MG
2-1 1
MG
2-7
C1-
6M
G2-
8R
4-9
R4-
6R
5-6
R4-
7R
6-6
R5-
5R
6-7
MG
3-9
MG
3-7
MG
3-8
R6-
5C
1-4
C1-
5M
G2-
4M
G2-
5M
G3-
1M
G3-
2M
G3-
1 1M
G3-
4R
6-4
MG
3-6
MG
3-5
MG
3-3
MG
3-1 0
MG
2-6
MG
2-1
MG
2-2
MG
2-3
C2-
1 1C
2-3
MG
2-1
0C
2-1 0
C1-
1 1C
2-2
C2-
8C
2-9
C2-
1C
1-9
C2-
4C
1-10
C1-
1C
1-2
C1-
3C
MG
3-7
MG
3-8
R6-
5C
1-4
C1-
5M
G2-
4M
G2-
5M
G3-
1M
G3-
2M
G3-
1 1M
G3-
4R
6-4
MG
3-6
MG
3-5
MG
3-3
MG
3-1 0
MG
2-6
MG
2-1
MG
2-2
MG
2-3
C2-
1 1C
2-3
MG
2-1
0C
2-1 0
C1-
1 1C
2-2
C2-
8C
2-9
C2-
1C
1-9
C2-
4C
1-10
C1-
1C
1-2
C1-
3C
1-8
C2-
5C
2-6
C1-
7C
2-7
100
80
60
40
20
% S
imila
rity
MG3 before and after,C1 & C2 before and after,
MG2 before + MG2 after time 10,R6 before time 4.
(47% similarity)
R4
befo
re ti
mes
4 &
5(5
9% S
im.) R4 & R5 before and after,
MG2 all after except time 10,C1 before time 6.
(55% similarity)
Figure 5. (continued) Classification of the fish and crustacean abundance data from the Macleay
(a) and Clarence (b) estuaries. Only dark black branches indicate significant groupings at p < 0.05 (SIMPROF). Symbols correspond to the key given in previous ordinations (Figure 4) and labels refer to “location–sampling times” (refer to Figure 2 and Figure 3). Text in the shaded box highlights notable groupings based upon management history (MG, C or R).
28 NSW DPI
Boys et al. Case studies in coastal fish passage remediation
0
1
2
3
4
5
6
7
8
0
1
2
3
4
5
6
7
8
0
2
4
6
8
10
12
14
16
18
c) Freshwater-estuarine species d) Freshwater species
Num
ber o
f spe
cies
Num
ber o
f spe
cies
a) All species
Macleay Clarence
MG1 R MG3 C RMG20
2
4
6
8
10
12
14
16
18b) Estuarine-marine species
Macleay Clarence
MG1 R MG3 C RMG2
Macleay Clarence
MG1 R MG3 C RMG2
Macleay Clarence
MG1 R MG3 C RMG20
1
2
3
4
5
6
7
8
0
1
2
3
4
5
6
7
8
0
1
2
3
4
5
6
7
8
0
1
2
3
4
5
6
7
8
0
2
4
6
8
10
12
14
16
18
0
2
4
6
8
10
12
14
16
18
c) Freshwater-estuarine species d) Freshwater species
Num
ber o
f spe
cies
Num
ber o
f spe
cies
a) All species
Macleay Clarence
MG1 R MG3 C RMG20
2
4
6
8
10
12
14
16
18
0
2
4
6
8
10
12
14
16
18b) Estuarine-marine species
Macleay Clarence
MG1 R MG3 C RMG2
Macleay Clarence
MG1 R MG3 C RMG2
Macleay Clarence
MG1 R MG3 C RMG2
Macleay Clarence
MG1 R MG3 C RMG2
Macleay Clarence
MG1 R MG3 C RMG2
Macleay Clarence
MG1 R MG3 C RMG2
Figure 6. Mean (± 1 SE) species richness for (a) all, (b) estuarine-marine, (c) freshwater-estuarine and (d) freshwater species in managed creeks (MG 1–3) and across combined control (C) and reference (R) creeks in the Macleay and Clarence estuaries before (black) and after (grey) floodgate opening commenced in the managed creeks.
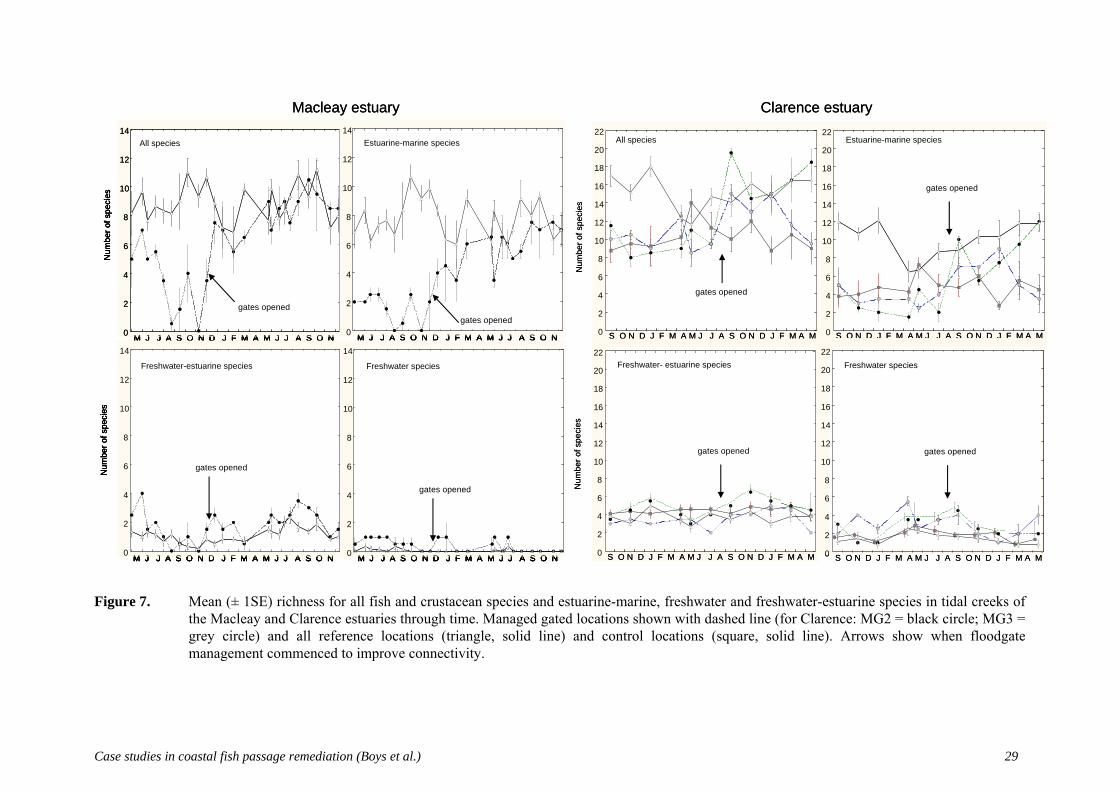
Case studies in coastal fish passage remediation (Boys et al.) 29
0
2
4
6
8
10
12
14All species
0
2
4
6
8
10
12
14Estuarine-marine species
0
2
4
6
8
10
12
14M J J A S O N D J F M A M J J A S O N M J J A S O N D J F M A M J J A S O N
M J J A S O N D J F M A M J J A S O N
Freshwater-estuarine species
0
2
4
6
8
10
12
14
M J J A S O N D J F M A M J J A S O N
Freshwater species
Num
ber o
f spe
cies
Num
ber o
f spe
cies
gates openedgates opened
gates opened
gates opened
2
4
6
8
10
12
14
16
18
20
22
0 S O N D J F M A M J J A S O N D J F M A M 0
2
4
6
8
10
12
14
16
18
20
22
S O N D J F M A M J J A S O N D J F M A M
All species Estuarine-marine species
gates opened
gates opened
0
2
4
6
8
10
12
14
16
18
20
22
S O N D J F M A M J J A S O N D J F M A M
Freshwater- estuarine species
gates opened
0
2
4
6
8
10
12
14
16
18
20
22
S O N D J F M A M J J A S O N D J F M A M
Freshwater species
gates opened
Num
ber o
f spe
cies
Num
ber o
f spe
cies
Macleay estuary Clarence estuary
0
2
4
6
8
10
12
14All species
0
2
4
6
8
10
12
14Estuarine-marine species
0
2
4
6
8
10
12
14M J J A S O N D J F M A M J J A S O N M J J A S O N D J F M A M J J A S O N
M J J A S O N D J F M A M J J A S O N
Freshwater-estuarine species
0
2
4
6
8
10
12
14
M J J A S O N D J F M A M J J A S O N
Freshwater species
Num
ber o
f spe
cies
Num
ber o
f spe
cies
gates openedgates opened
gates opened
gates opened
0
2
4
6
8
10
12
14All species
0
2
4
6
8
10
12
14Estuarine-marine species
0
2
4
6
8
10
12
14M J J A S O N D J F M A M J J A S O N M J J A S O N D J F M A M J J A S O N
M J J A S O N D J F M A M J J A S O N
Freshwater-estuarine species
0
2
4
6
8
10
12
14
M J J A S O N D J F M A M J J A S O N
Freshwater species
Num
ber o
f spe
cies
Num
ber o
f spe
cies
0
2
4
6
8
10
12
14All species
0
2
4
6
8
10
12
14Estuarine-marine species
0
2
4
6
8
10
12
14M J J A S O N D J F M A M J J A S O N M J J A S O N D J F M A M J J A S O N
M J J A S O N D J F M A M J J A S O N
Freshwater-estuarine species
0
2
4
6
8
10
12
14
M J J A S O N D J F M A M J J A S O N
Freshwater species
0
2
4
6
8
10
12
14
0
2
4
6
8
10
12
14
0
2
4
6
8
10
12
14All species
0
2
4
6
8
10
12
14
0
2
4
6
8
10
12
14Estuarine-marine species
0
2
4
6
8
10
12
14
0
2
4
6
8
10
12
14M J J A S O N D J F M A M J J A S O N M J J A S O N D J F M A M J J A S O N
M J J A S O N D J F M A M J J A S O N
Freshwater-estuarine species
0
2
4
6
8
10
12
14
0
2
4
6
8
10
12
14
M J J A S O N D J F M A M J J A S O N
Freshwater species
Num
ber o
f spe
cies
Num
ber o
f spe
cies
gates openedgates opened
gates opened
gates opened
2
4
6
8
10
12
14
16
18
20
22
0 S O N D J F M A M J J A S O N D J F M A MS O N D J F M A M J J A S O N D J F M A M 0
2
4
6
8
10
12
14
16
18
20
22
S O N D J F M A M J J A S O N D J F M A MS O N D J F M A M J J A S O N D J F M A M
All species Estuarine-marine species
gates opened
gates opened
0
2
4
6
8
10
12
14
16
18
20
22
S O N D J F M A M J J A S O N D J F M A MS O N D J F M A M J J A S O N D J F M A M
Freshwater- estuarine species
gates opened
0
2
4
6
8
10
12
14
16
18
20
22
S O N D J F M A M J J A S O N D J F M A M
Freshwater species
gates opened
Num
ber o
f spe
cies
Num
ber o
f spe
cies
Macleay estuary Clarence estuary
Figure 7. Mean (± 1SE) richness for all fish and crustacean species and estuarine-marine, freshwater and freshwater-estuarine species in tidal creeks of the Macleay and Clarence estuaries through time. Managed gated locations shown with dashed line (for Clarence: MG2 = black circle; MG3 = grey circle) and all reference locations (triangle, solid line) and control locations (square, solid line). Arrows show when floodgate management commenced to improve connectivity.
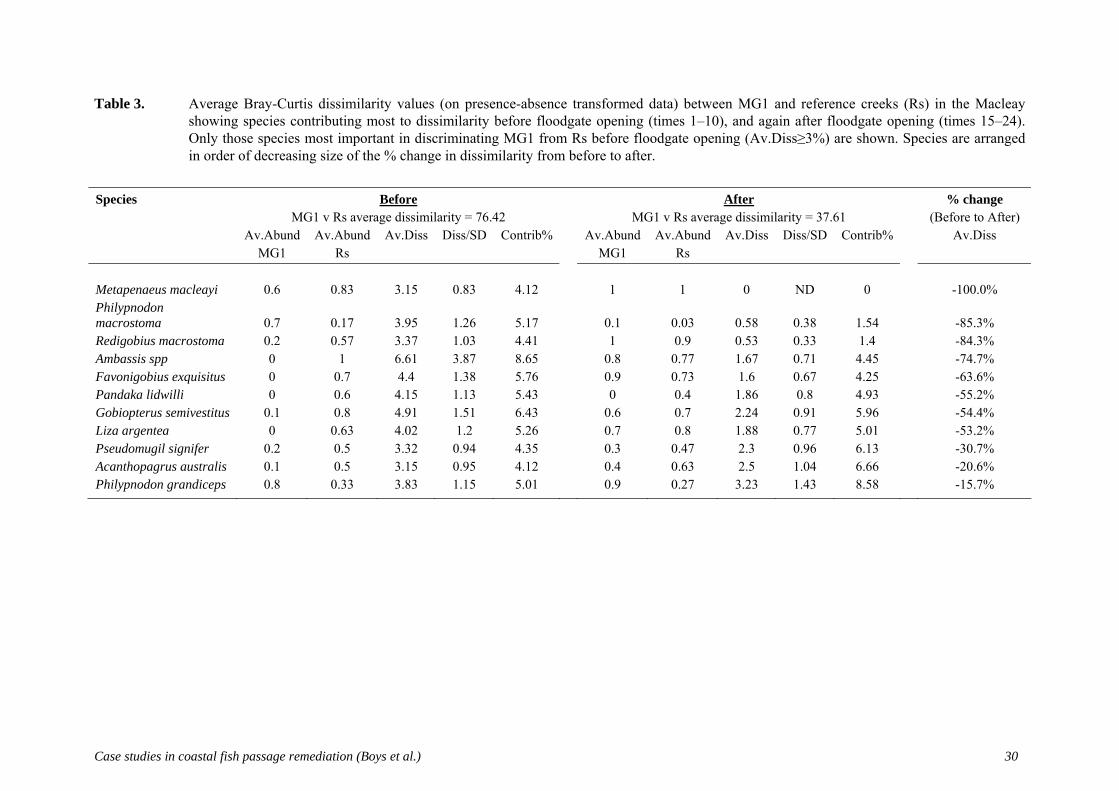
Case studies in coastal fish passage remediation (Boys et al.) 30
Table 3. Average Bray-Curtis dissimilarity values (on presence-absence transformed data) between MG1 and reference creeks (Rs) in the Macleay showing species contributing most to dissimilarity before floodgate opening (times 1–10), and again after floodgate opening (times 15–24). Only those species most important in discriminating MG1 from Rs before floodgate opening (Av.Diss≥3%) are shown. Species are arranged in order of decreasing size of the % change in dissimilarity from before to after.
Species Before After % change MG1 v Rs average dissimilarity = 76.42 MG1 v Rs average dissimilarity = 37.61 (Before to After) Av.Abund Av.Abund Av.Diss Diss/SD Contrib% Av.Abund Av.Abund Av.Diss Diss/SD Contrib% Av.Diss MG1 Rs MG1 Rs Metapenaeus macleayi 0.6 0.83 3.15 0.83 4.12 1 1 0 ND 0 -100.0% Philypnodon macrostoma 0.7 0.17 3.95 1.26 5.17 0.1 0.03 0.58 0.38 1.54 -85.3% Redigobius macrostoma 0.2 0.57 3.37 1.03 4.41 1 0.9 0.53 0.33 1.4 -84.3% Ambassis spp 0 1 6.61 3.87 8.65 0.8 0.77 1.67 0.71 4.45 -74.7% Favonigobius exquisitus 0 0.7 4.4 1.38 5.76 0.9 0.73 1.6 0.67 4.25 -63.6% Pandaka lidwilli 0 0.6 4.15 1.13 5.43 0 0.4 1.86 0.8 4.93 -55.2% Gobiopterus semivestitus 0.1 0.8 4.91 1.51 6.43 0.6 0.7 2.24 0.91 5.96 -54.4% Liza argentea 0 0.63 4.02 1.2 5.26 0.7 0.8 1.88 0.77 5.01 -53.2% Pseudomugil signifer 0.2 0.5 3.32 0.94 4.35 0.3 0.47 2.3 0.96 6.13 -30.7% Acanthopagrus australis 0.1 0.5 3.15 0.95 4.12 0.4 0.63 2.5 1.04 6.66 -20.6% Philypnodon grandiceps 0.8 0.33 3.83 1.15 5.01 0.9 0.27 3.23 1.43 8.58 -15.7%
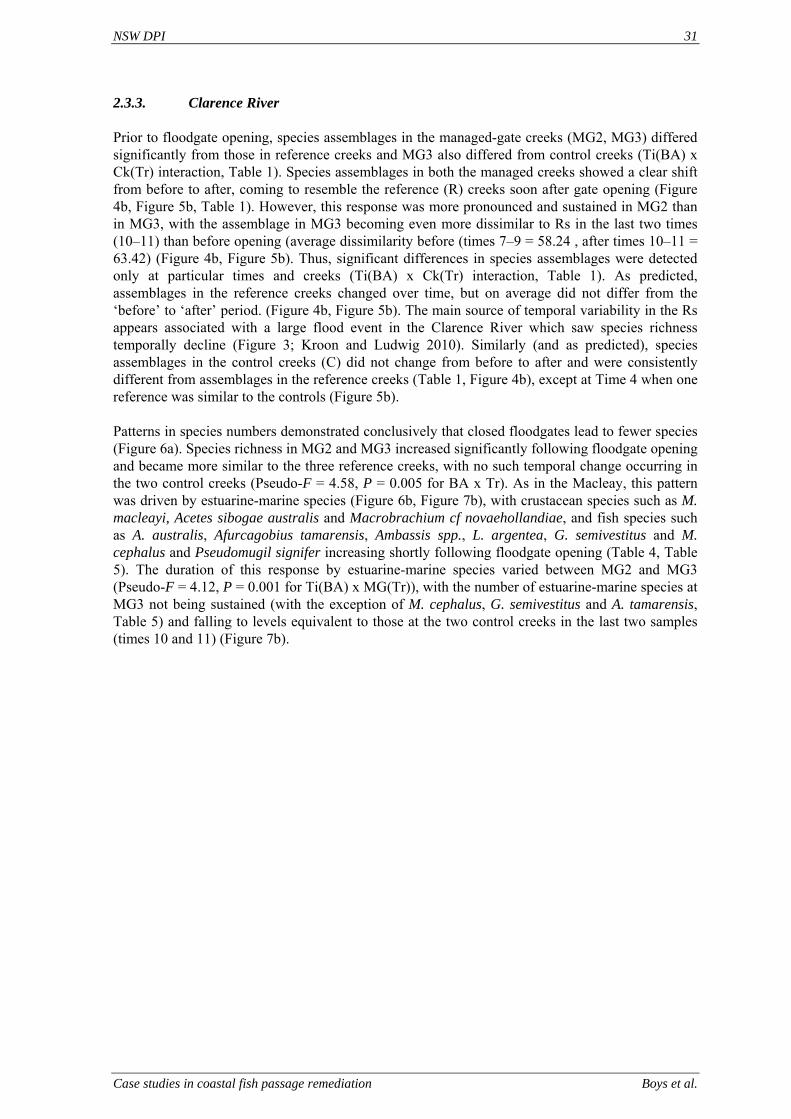
NSW DPI 31
Case studies in coastal fish passage remediation Boys et al.
2.3.3. Clarence River
Prior to floodgate opening, species assemblages in the managed-gate creeks (MG2, MG3) differed significantly from those in reference creeks and MG3 also differed from control creeks (Ti(BA) x Ck(Tr) interaction, Table 1). Species assemblages in both the managed creeks showed a clear shift from before to after, coming to resemble the reference (R) creeks soon after gate opening (Figure 4b, Figure 5b, Table 1). However, this response was more pronounced and sustained in MG2 than in MG3, with the assemblage in MG3 becoming even more dissimilar to Rs in the last two times (10–11) than before opening (average dissimilarity before (times 7–9 = 58.24 , after times 10–11 = 63.42) (Figure 4b, Figure 5b). Thus, significant differences in species assemblages were detected only at particular times and creeks (Ti(BA) x Ck(Tr) interaction, Table 1). As predicted, assemblages in the reference creeks changed over time, but on average did not differ from the ‘before’ to ‘after’ period. (Figure 4b, Figure 5b). The main source of temporal variability in the Rs appears associated with a large flood event in the Clarence River which saw species richness temporally decline (Figure 3; Kroon and Ludwig 2010). Similarly (and as predicted), species assemblages in the control creeks (C) did not change from before to after and were consistently different from assemblages in the reference creeks (Table 1, Figure 4b), except at Time 4 when one reference was similar to the controls (Figure 5b). Patterns in species numbers demonstrated conclusively that closed floodgates lead to fewer species (Figure 6a). Species richness in MG2 and MG3 increased significantly following floodgate opening and became more similar to the three reference creeks, with no such temporal change occurring in the two control creeks (Pseudo-F = 4.58, P = 0.005 for BA x Tr). As in the Macleay, this pattern was driven by estuarine-marine species (Figure 6b, Figure 7b), with crustacean species such as M. macleayi, Acetes sibogae australis and Macrobrachium cf novaehollandiae, and fish species such as A. australis, Afurcagobius tamarensis, Ambassis spp., L. argentea, G. semivestitus and M. cephalus and Pseudomugil signifer increasing shortly following floodgate opening (Table 4, Table 5). The duration of this response by estuarine-marine species varied between MG2 and MG3 (Pseudo-F = 4.12, P = 0.001 for Ti(BA) x MG(Tr)), with the number of estuarine-marine species at MG3 not being sustained (with the exception of M. cephalus, G. semivestitus and A. tamarensis, Table 5) and falling to levels equivalent to those at the two control creeks in the last two samples (times 10 and 11) (Figure 7b).
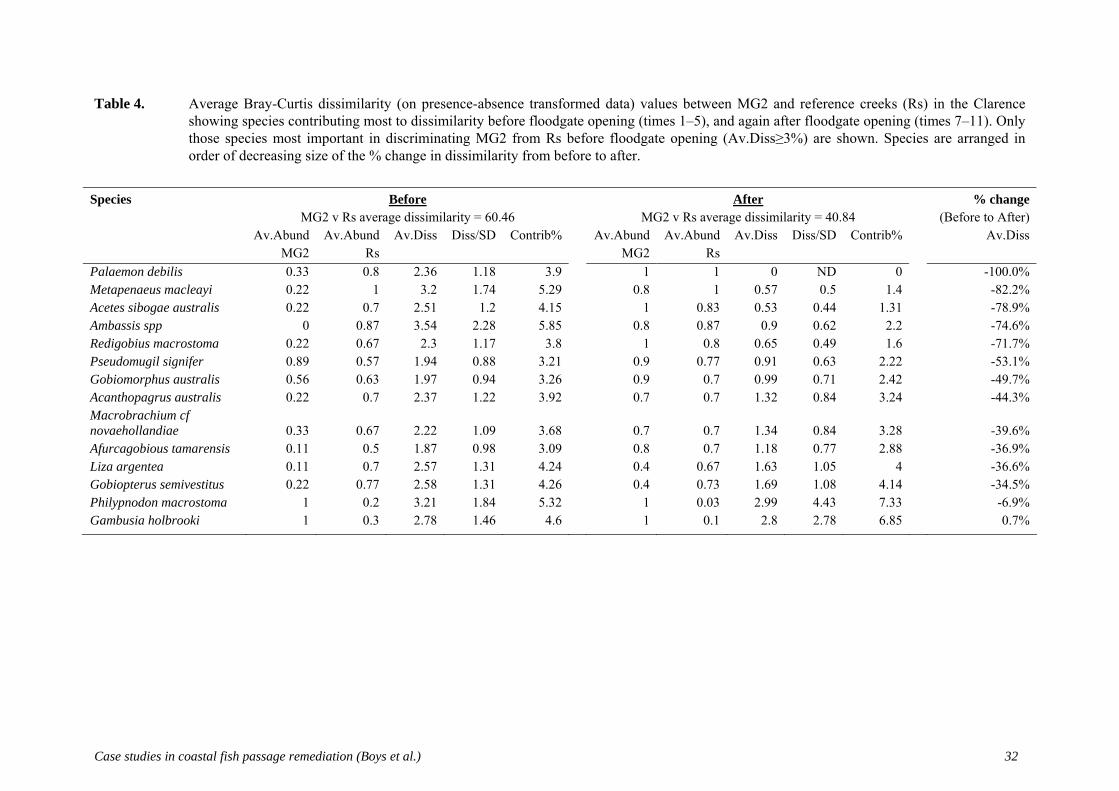
Case studies in coastal fish passage remediation (Boys et al.) 32
Table 4. Average Bray-Curtis dissimilarity (on presence-absence transformed data) values between MG2 and reference creeks (Rs) in the Clarence showing species contributing most to dissimilarity before floodgate opening (times 1–5), and again after floodgate opening (times 7–11). Only those species most important in discriminating MG2 from Rs before floodgate opening (Av.Diss≥3%) are shown. Species are arranged in order of decreasing size of the % change in dissimilarity from before to after.
Species Before After % change MG2 v Rs average dissimilarity = 60.46 MG2 v Rs average dissimilarity = 40.84 (Before to After)
Av.Abund Av.Abund Av.Diss Diss/SD Contrib% Av.Abund Av.Abund Av.Diss Diss/SD Contrib% Av.Diss MG2 Rs MG2 Rs Palaemon debilis 0.33 0.8 2.36 1.18 3.9 1 1 0 ND 0 -100.0% Metapenaeus macleayi 0.22 1 3.2 1.74 5.29 0.8 1 0.57 0.5 1.4 -82.2% Acetes sibogae australis 0.22 0.7 2.51 1.2 4.15 1 0.83 0.53 0.44 1.31 -78.9% Ambassis spp 0 0.87 3.54 2.28 5.85 0.8 0.87 0.9 0.62 2.2 -74.6% Redigobius macrostoma 0.22 0.67 2.3 1.17 3.8 1 0.8 0.65 0.49 1.6 -71.7% Pseudomugil signifer 0.89 0.57 1.94 0.88 3.21 0.9 0.77 0.91 0.63 2.22 -53.1% Gobiomorphus australis 0.56 0.63 1.97 0.94 3.26 0.9 0.7 0.99 0.71 2.42 -49.7% Acanthopagrus australis 0.22 0.7 2.37 1.22 3.92 0.7 0.7 1.32 0.84 3.24 -44.3% Macrobrachium cf novaehollandiae 0.33 0.67 2.22 1.09 3.68 0.7 0.7 1.34 0.84 3.28 -39.6% Afurcagobious tamarensis 0.11 0.5 1.87 0.98 3.09 0.8 0.7 1.18 0.77 2.88 -36.9% Liza argentea 0.11 0.7 2.57 1.31 4.24 0.4 0.67 1.63 1.05 4 -36.6% Gobiopterus semivestitus 0.22 0.77 2.58 1.31 4.26 0.4 0.73 1.69 1.08 4.14 -34.5% Philypnodon macrostoma 1 0.2 3.21 1.84 5.32 1 0.03 2.99 4.43 7.33 -6.9% Gambusia holbrooki 1 0.3 2.78 1.46 4.6 1 0.1 2.8 2.78 6.85 0.7%
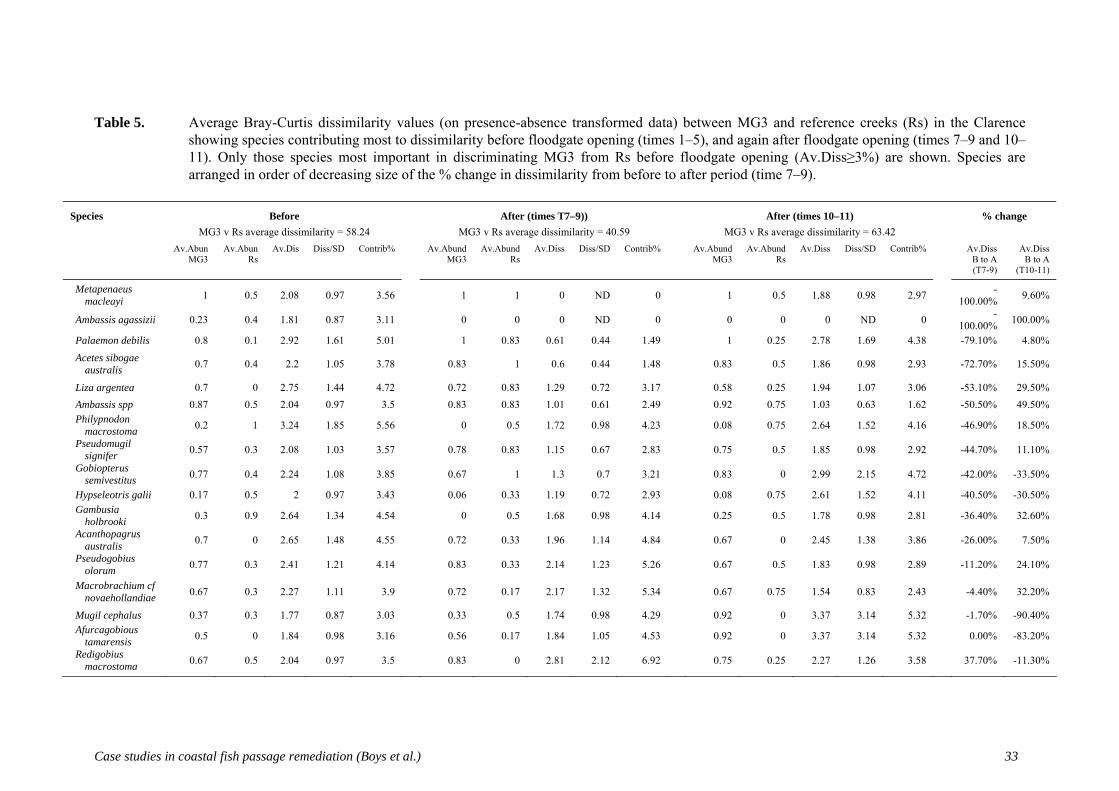
Case studies in coastal fish passage remediation (Boys et al.) 33
Table 5. Average Bray-Curtis dissimilarity values (on presence-absence transformed data) between MG3 and reference creeks (Rs) in the Clarence showing species contributing most to dissimilarity before floodgate opening (times 1–5), and again after floodgate opening (times 7–9 and 10–11). Only those species most important in discriminating MG3 from Rs before floodgate opening (Av.Diss≥3%) are shown. Species are arranged in order of decreasing size of the % change in dissimilarity from before to after period (time 7–9).
Species Before After (times T7–9)) After (times 10–11) % change MG3 v Rs average dissimilarity = 58.24 MG3 v Rs average dissimilarity = 40.59 MG3 v Rs average dissimilarity = 63.42 Av.Abun Av.Abun Av.Dis Diss/SD Contrib% Av.Abund Av.Abund Av.Diss Diss/SD Contrib% Av.Abund Av.Abund Av.Diss Diss/SD Contrib% Av.Diss Av.Diss MG3 Rs MG3 Rs MG3 Rs B to A
(T7-9) B to A
(T10-11)
Metapenaeus macleayi 1 0.5 2.08 0.97 3.56 1 1 0 ND 0 1 0.5 1.88 0.98 2.97 -
100.00% 9.60%
Ambassis agassizii 0.23 0.4 1.81 0.87 3.11 0 0 0 ND 0 0 0 0 ND 0 -100.00% 100.00%
Palaemon debilis 0.8 0.1 2.92 1.61 5.01 1 0.83 0.61 0.44 1.49 1 0.25 2.78 1.69 4.38 -79.10% 4.80% Acetes sibogae
australis 0.7 0.4 2.2 1.05 3.78 0.83 1 0.6 0.44 1.48 0.83 0.5 1.86 0.98 2.93 -72.70% 15.50%
Liza argentea 0.7 0 2.75 1.44 4.72 0.72 0.83 1.29 0.72 3.17 0.58 0.25 1.94 1.07 3.06 -53.10% 29.50% Ambassis spp 0.87 0.5 2.04 0.97 3.5 0.83 0.83 1.01 0.61 2.49 0.92 0.75 1.03 0.63 1.62 -50.50% 49.50% Philypnodon
macrostoma 0.2 1 3.24 1.85 5.56 0 0.5 1.72 0.98 4.23 0.08 0.75 2.64 1.52 4.16 -46.90% 18.50%
Pseudomugil signifer 0.57 0.3 2.08 1.03 3.57 0.78 0.83 1.15 0.67 2.83 0.75 0.5 1.85 0.98 2.92 -44.70% 11.10%
Gobiopterus semivestitus 0.77 0.4 2.24 1.08 3.85 0.67 1 1.3 0.7 3.21 0.83 0 2.99 2.15 4.72 -42.00% -33.50%
Hypseleotris galii 0.17 0.5 2 0.97 3.43 0.06 0.33 1.19 0.72 2.93 0.08 0.75 2.61 1.52 4.11 -40.50% -30.50% Gambusia
holbrooki 0.3 0.9 2.64 1.34 4.54 0 0.5 1.68 0.98 4.14 0.25 0.5 1.78 0.98 2.81 -36.40% 32.60%
Acanthopagrus australis 0.7 0 2.65 1.48 4.55 0.72 0.33 1.96 1.14 4.84 0.67 0 2.45 1.38 3.86 -26.00% 7.50%
Pseudogobius olorum 0.77 0.3 2.41 1.21 4.14 0.83 0.33 2.14 1.23 5.26 0.67 0.5 1.83 0.98 2.89 -11.20% 24.10%
Macrobrachium cf novaehollandiae 0.67 0.3 2.27 1.11 3.9 0.72 0.17 2.17 1.32 5.34 0.67 0.75 1.54 0.83 2.43 -4.40% 32.20%
Mugil cephalus 0.37 0.3 1.77 0.87 3.03 0.33 0.5 1.74 0.98 4.29 0.92 0 3.37 3.14 5.32 -1.70% -90.40% Afurcagobious
tamarensis 0.5 0 1.84 0.98 3.16 0.56 0.17 1.84 1.05 4.53 0.92 0 3.37 3.14 5.32 0.00% -83.20%
Redigobius macrostoma 0.67 0.5 2.04 0.97 3.5 0.83 0 2.81 2.12 6.92 0.75 0.25 2.27 1.26 3.58 37.70% -11.30%
34 NSW DPI
Boys et al. Case studies in coastal fish passage remediation
2.4. Discussion
2.4.1. Impacts of floodgates and localised responses to their opening
The results show that floodgates fragment habitats and change juvenile fish and invertebrate assemblages in tidal creeks, significantly lowering the number of estuarine-marine species that utilise habitats upstream of the floodgates. This is in general agreement with observations made elsewhere in the world of estuarine wetlands impacted by tidal restrictions like levees and culverts (Raposa and Roman 2003, Eberhardt et al. 2010), and also supports other studies on floodgated systems within Australia (Pollard and Hannan 1994, Kroon and Ansell 2006). Importantly, it has been demonstrated that substantial improvements in species richness and abundance can be achieved in a relatively short time by opening gates and improving the connectivity of tidal creeks. When these findings are viewed alongside other studies that have demonstrated recovery in biota such as fish, birds and vegetation elsewhere in the world (Raposa and Roman 2003, Raposa 2008, Eberhardt et al. 2010), it can be seen how such rehabilitation practices may contribute to whole-of-ecosystem recovery in fragmented coastal habitats. The main impact of closed floodgates was the exclusion of many estuarine species from tidal creeks. Creeks with closed floodgates had 70–80 % fewer estuarine-marine species than un-gated reference creeks. Following the opening of gates, this difference was reduced to only 15 %, showing significant and rapid recolonisation of estuarine-marine species, including juveniles of economically significant species such as Acanthopagrus australis, Liza argentea, Metapenaeus macleayi, and Mugil cephalus. Contrary to what has been described previously (Kroon and Ansell 2006), freshwater species did not dominate tidal creek assemblages upstream of closed floodgates, either in terms of species richness or abundance. Freshwater-estuarine and estuarine-marine species were still more numerous than wholly freshwater species in these impacted systems, showing some degree of passage past closed gates. Importantly, opening floodgates did not cause a decline in these freshwater species, with the exception of two Phylipnodon gudgeon species which can complete their entire life cycles within freshwater. Closed floodgates clearly decrease ability of many estuarine-marine species to disperse into tidal creeks. In two of the three managed gated creeks, the speed of recolonisation following floodgate opening was rapid and is probably in direct response to restoring passage (and potentially water quality), rather than longer-term effects of habitat change. Fish are extremely mobile and it has been shown that they will quickly move into defaunated habitats once they become available (Peterson and Bayley 1993, Sheldon and Meffe 1995, Hohausova et al. 2010). Rapid responses to improved connectivity, are more likely to be seen in those species which are strong dispersers and early colonisers (Hohausova et al. 2010). This was observed in this study and A. Australis responded rapidly to floodgate opening. Sparids are habitat opportunists (Griffiths 2001, Miller and Skilleter 2006) and are key colonising species due to their ability to cross relatively large expanses of sand where little protection from predation is found (Fernandez et al. 2007). Further development of the assemblage over time will then be affected by ‘post-settlement’ processes such as foraging, predation-prey interactions and competition (Poizat and Crivelli 1997, Connell 2002). Predatory fish species are also more likely to respond to larger aggregations of prey species (Stewart and Jones 2001, Connell 2002) and in our study, the early colonisation of rehabilitated tidal creeks by prey species such as A. sibogae australis (shrimp) may have led to successional changes as predators which feed on these prey capitalise on the more abundant food source. This may partly explain the increase in species such as H. castelnaui, L. argentea, M. cephalus and A. australis observed in this study.
NSW DPI 35
Case studies in coastal fish passage remediation Boys et al.
2.4.2. Relative differences between floodgate designs
Different methods of floodgate operation may influence rehabilitation success. A true test of the ecological performance of automated, tide-actuated gates has yet to be achieved. In this study, vandalism resulted in the automated flaps being removed for a significant part of the study. Nevertheless, passage at this creek was enhanced by the 500 mm x 500 mm openings in the middle portion of the floodgates. Although this appeared to provide sufficient passage for the majority of species, not all species (e.g., the eastern king prawn M. plebejus) were found to move upstream through the flaps. Perhaps the flaps situated mid-water column did not create adequate physical or hydraulic conditions suitable for the passage of species such as M. plebejus, which tend to disperse along the bottom. Notably, however, the manual opening of the entire floodgate in the Clarence did not appear to perform much better for this species. There have also been anecdotal reports of extremely high velocities being observed during incoming tides at the Yarrahapinni floodgates (MG1) (Dr William Glamore, UNSW, pers. comm.). The turbulence, pressure and shear created by this may result in injury or death of juvenile fish (Baumgartner et al. 2011). Further studies looking at the relative eco-hydraulic performance of different tide actuated flap gate designs is warranted. The rate and success of recolonisation was variable between the treated creeks, and in MG3 no significant change in the estuarine-marine assemblage relative to control creeks was detected in the initial 10 months following gate opening. This may be in part driven by the relative proximity of the rehabilitated habitats to nearby natural habitats and dispersal routes. MG3 differed from the other two managed creeks in that, rather than being located directly off the main river channel, it was at the end of a large lake, meaning nearby habitats and dispersal paths are likely to be distinctly different from the other creeks. When new habitats are created, colonisation rates tend to be fastest in cases where the new habitat is close to natural habitats with a good supply of post-settlement individuals (Bohnsack and Sutherland 1985, Matthews 1985, Alevizon and Gorham 1989, Hueckel et al. 1989, Golani and Diamant 1999) and the physical features of dispersal routes (e.g., depth) can also affect recolonisation (Hohausova et al. 2010). Within estuaries, it has been shown that fish densities are highest the closer a habitat is to the estuary mouth (Bell et al. 1988). MG3 was 23.9 km from the estuary mouth, approximately twice as far from the estuary mouth as all the other study creeks, possibly affecting recolonisation rates. Whilst these environmental factors may be in part responsible for the difference in response within the Clarence, structural or operational differences between the two floodgate installations (which were under landholder control) cannot be discounted. The floodgates at MG3 consisted of pipe culverts in comparison to MG1 and MG2 which were box culverts. Fish passage at culverts is inversely related to flow velocity (Castro-Santos 2005) and pipe culverts with higher velocities than box culverts have been shown to have lower passage rates for a large range of species and size classes (Warren and Pardew 1998). There are an increasing number of floodgate styles and modifications available to natural resource managers (NSW Fisheries 2002) and further research is required into their hydraulic performance to better inform operational criteria (e.g., flap position, opening times around diurnal, lunar and seasonal cycles and in relation to river flooding) to maximise rehabilitation outcomes.
2.4.3. Rehabilitation of floodgated wetlands and implications for fisheries production
There is evidence that tidal wetland habitats are of significant nursery value in estuaries (Morton 1990, Sheridan and Hays 2003) and we have been able to show that juveniles of many species recolonised these habitats quickly once a floodgate barrier was opened. Whether increasing the amount of juvenile habitat will improve the nursery value of an estuary and therefore contribute to increased fisheries production depends on the relative contribution that reclaimed habitats make within the interconnected mosaic of habitats within the estuarine landscape (Sheaves 2005). Not all
36 NSW DPI
Boys et al. Case studies in coastal fish passage remediation
habitats contribute equally to nursery value (Beck et al. 2001). Likewise, improvements in nursery value will not be equivalent between restored habitats. Improvements will also be based upon whether the availability of nurseries in estuaries is limiting recruitment into local and offshore fisheries. There is evidence that this may be the case in many areas where long-term commercial fish catches are highest in estuaries of greatest tidal wetland habitat availability and connectivity (Turner 1992, de Graaf and Xuan 1999, Manson et al. 2005a, Manson et al. 2005b, Meynecke et al. 2008, Meynecke 2009). Being able to go one step further and directly quantify the contribution that rehabilitating tidal wetlands may have on fisheries production warrants further study, as it will assist resource managers weigh-up competing environmental, social and economic interests in coastal floodplains. The social and commercial gains from wetland rehabilitation may be significant but will be difficult to measure. This is partly because some of the species which utilise tidal wetlands as nurseries can undertake large migrations before reaching adult habitats and being taken by commercial or recreational fisheries. For example, M. plebejus tagged in the Hunter River estuary of NSW have been shown to migrate 740 km to spawning grounds in Moreton Bay off the coast of southeastern Queensland (Ruello 1975), thus contributing to the most productive eastern king prawn fishery on the east coast of Australia. Juveniles of this species were historically recorded in large abundances in Hexham Swamp (Hunter River), but have significantly declined in this wetland habitat since the installation of floodgates on tidal creeks. This highlights the important impact that localised losses of wetland nurseries can have on commercial and recreational fisheries over large geographical scales, and inversely, the potential gains that could be made from localised rehabilitation efforts. It also illustrates the importance of undertaking further research to understand why a species such as M. plebejus appeared to respond poorly to the floodgate opening in the current study.
2.4.4. Improving the design of tidal wetland rehabilitation studies
Control and reference creeks were used in this study to quantify which component of assemblage change was due to background spatio-temporal variability, and which was likely to be due to a response to floodgate opening. That is, control creeks were used as surrogates for ‘no-intervention’ and reference creeks were used to gauge the direction and distance the assemblage makes towards an un-impacted or natural state. Reference creeks behaved as expected, but finding suitable control creeks was a little more problematic. No appropriate creeks could be found in the Macleay, and those chosen in the Clarence started off with an assemblage quite different from the managed creeks. From a statistical standpoint, this meant that the BA x Tr interaction alone was not a suitable test for a response under the hypothesis: MG = C ≠ R before floodgate opening, and MG = R ≠ C afterwards. Finding suitable controls or references is a common problem faced during rehabilitation studies which utilise a BACI approach and there are techniques which can help circumvent such problems (e.g., Brewer and Menzel 2009). The approach that proved useful in this instance, as in other studies (e.g., Terlizzi et al. 2005, Fraschetti et al. 2006, Raposa 2008) was to use a combination of explorative methods. In this case, the trajectory of change was more informative than the amount of variance partitioned in the BA x Tr interaction. That is, regardless of the starting point, managed creeks became more like reference creeks after opening, whereas control creeks remained unchanged. This demonstrates that for rehabilitation studies, it need not be necessary to find controls that are equivalent in condition to a location to be rehabilitated, as long as those controls still provide an indication of what natural level of temporal variability may be present in an impacted site in the absence of rehabilitation. Without control creeks in the Macleay estuary, it may be argued that the trajectory of recovery of managed sites could have happened without floodgate opening. However, by adopting a multiple-
NSW DPI 37
Case studies in coastal fish passage remediation Boys et al.
lines-of-evidence approach (Downes et al. 2002) and looking at this response alongside the more complex design employed in the Clarence, we were able to have more confidence that the response was a result of gate opening. That is, uncertainty in the Macleay was overcome by replicating treatments in other areas where controls were available. Replicating treatments across multiple locations and estuaries also has the added advantage of taking what are localised responses and allowing the findings to be more generally applied (Hurlbert 1984, Holl 2010). It also enables a greater diversity of potential responses to be canvassed. If this study had been restricted to either the two creeks that did respond, or the one creek which did not respond, then the conclusions would be different. As it stands, these results show floodgate opening can result in improvements in fish and crustacean assemblages, but that responses may differ among tidal wetlands, as has been previously shown by Raposa (2008). Because of this, where possible, tidal wetland rehabilitation works should be carried out in conjunction with pre- and post-monitoring programs to ensure that rehabilitation objectives are being achieved. Finally, incorporating temporal variability into the sampling design provided a more accurate measure of rehabilitation success, as has been shown in other studies (e.g., Tupper and Able 2000, Raposa and Roman 2001). The utilisation of estuarine habitats by fish is very temporally and spatially dynamic (Miller and Skilleter 2006) and our results show that intra-seasonal variation can be significant. For example, juvenile A. Australis and M. cephalus were sampled in significantly higher abundances from reference and opened managed gated creeks between July and October, following the peak offshore spawning periods for these species between May and August (Pollock et al. 1983, Miller and Skilleter 2006). If sampling was not conducted at this time of year, this response would have been missed. Studies concerning the rehabilitation of estuarine wetlands need to be replicated sufficiently through time, and be sampled during times when recruits enter the estuary so that the true contribution of rehabilitation activities are not underestimated. In this study, regular sampling also enabled the impact of large floods in the Clarence River on assemblage composition to be accounted for. Following widespread flooding in the northern rivers of NSW in early 2001 (see Figure 3) substantial fish kills occurred in the Clarence River estuary of a magnitude not documented previously in Australia (Walsh et al. 2004). This impacted species diversity in the reference creeks, adding a source of variability to assemblage composition throughout the pre-intervention period. Assemblages quickly recovered (also reported in Kroon and Ludwig (2010)), however, and this short-term disturbance was able to be placed in context with what was otherwise a relatively stable condition.
2.4.5. Conclusion
In summation, our results indicate that rehabilitation efforts which promote the frequent opening of floodgates to promote connectivity can lead to rapid recolonisation of juvenile estuarine-marine species into defaunated tidal wetland habitats. Trajectories of recovery were observed across two estuaries, although the speed of response differed across the creeks. Whilst this supports the generality of the findings, it does show that further research is required to better understand the mechanisms responsible for promoting or hindering ecological recovery in some tidally-restricted wetlands and species. Rehabilitating fragmented and degraded tidal wetlands may serve as an important management tool when applied alongside other approaches which promote the protection of those areas of existing high connectivity (e.g., Meynecke et al. 2008, Meynecke 2009). Addressing historical losses in this way may be even more pertinent in those parts of the world where climate change and reduced river flows threaten to further fragment estuarine fish nurseries and foodwebs into the future (Vinagre et al. 2010).
38 NSW DPI
Boys et al. Case studies in coastal fish passage remediation
3. CASE STUDY 2: DOUBLE BOX CULVERT AT QUART POT
ROAD CROSSING, BUCKENBOWRA RIVER
3.1. Introduction
Obstructions to fish passage are common on river channels throughout NSW and typically consist of dams or weirs for water supply or river flow gauging, or causeways and culverts for vehicle access (Pethebridge et al. 1998). Most road crossings may pose a barrier at low flows but allow the movement of fish in times of flood; when the structure is said to “drown-out”. Poorly designed or installed road crossings can severely delay or even block the upstream and downstream movement of fish, causing assemblage shifts, increased predation (Jepsen et al. 1998) and even localised extinctions in severe cases (Wager and Jackson 1993, Gibson et al. 2005). Culverts impede fish passage more than any other structure, both in NSW (Pethebridge et al. 1998) and internationally (Gibson et al. 2005). There are two main designs of culverts: box and pipe. Both designs can result in significantly modified bed structure, depth, turbulence and flow velocities but box culverts are generally preferred over pipe culverts for fish passage. Pipe culverts are commonly constructed to have higher velocities and slope (Bouska and Paukert 2010). The higher , with velocities inversely related to fish passage (Warren and Pardew 1998). Because they can also be recessed into the bed, box culverts can more closely replicate natural bed conditions. Although engineering guidelines for culvert design exist, the conveyance of flows and cost rather than fish passage is a central design feature. This is in part because there is a general lack of information on the swimming abilities of most species and size classes of fish negotiating barriers (Baker and Boubée 2006). Furthermore, when structures are remediated for fish passage purposes, they are seldom assessed in field to determine if they are meeting the desired ecological objectives. In this case study, we examined fish passage at a newly constructed double box culvert on the south coast of NSW. In comparison to the vast majority of culvert passage studies which focus on anadromous salmonids (e.g., Belford and Gould 1989, Bates and Powers 1998, Kahler and Quinn 1998, Richmond et al. 2007), we examined both upstream and downstream passage of the entire fish assemblage and all size ranges. Whilst this study provided a case study of one particular structure, in the absence of specific passage criteria of coastal NSW fish species, it was the objective to indentify further research needs for culvert passage within NSW.
3.2. Site details
Quart Pot Rod crossing (35o43’41.88”S 150o04’13.75”E) is located on the Buckenbowra River, a tributary of the Clyde River on the south coast of NSW (Figure 8). Pool-riffle sequences characterise the habitat within the vicinity of the crossing, both upstream and downstream. The crossing is approximately 1–2 km upstream of the tidal limit and there are no significant barriers to fish passage between the road crossing and the downstream estuary (approximately 20km). Fish passage is impeded upstream of the crossing by a non-functional submerged orifice fishway located on a low-level weir 0.8 km upstream of the road crossing. The road crossing formerly consisted of a causeway (Figure 9a). Although the causeway did periodically drown-out for short periods, shallow (<0.1 m) sheeting flow over the causeway and an excessive head differential on the downstream side (approximately 0.5 m) obstructed fish passage in low to moderate flow conditions which predominate at this location. The road crossing was replaced with a double box culvert, thus allowing passage over most low-flow conditions (Figure 9b). Each box of the culvert is 3.6m in length, 2.4m wide and 1.2m high (set approximately 0.6m into the river bed. A low gradient of approximately 1:350 maintained with rocks placed within the culvert cells. Mean velocity and depth varied throughout the study but were not recorded.
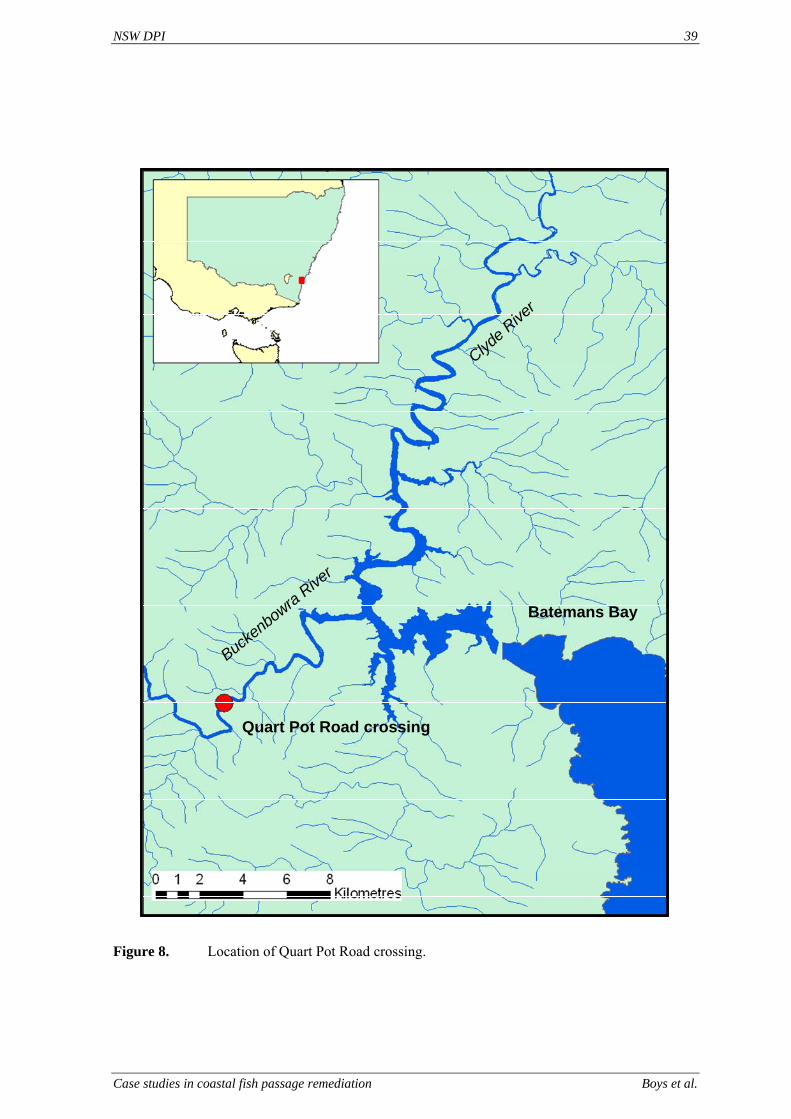
NSW DPI 39
Case studies in coastal fish passage remediation Boys et al.
Quart Pot Road crossing
Batemans Bay
Clyde Rive
r
Buckenbowra
River
Quart Pot Road crossing
Batemans Bay
Clyde Rive
r
Buckenbowra
River
Figure 8. Location of Quart Pot Road crossing.
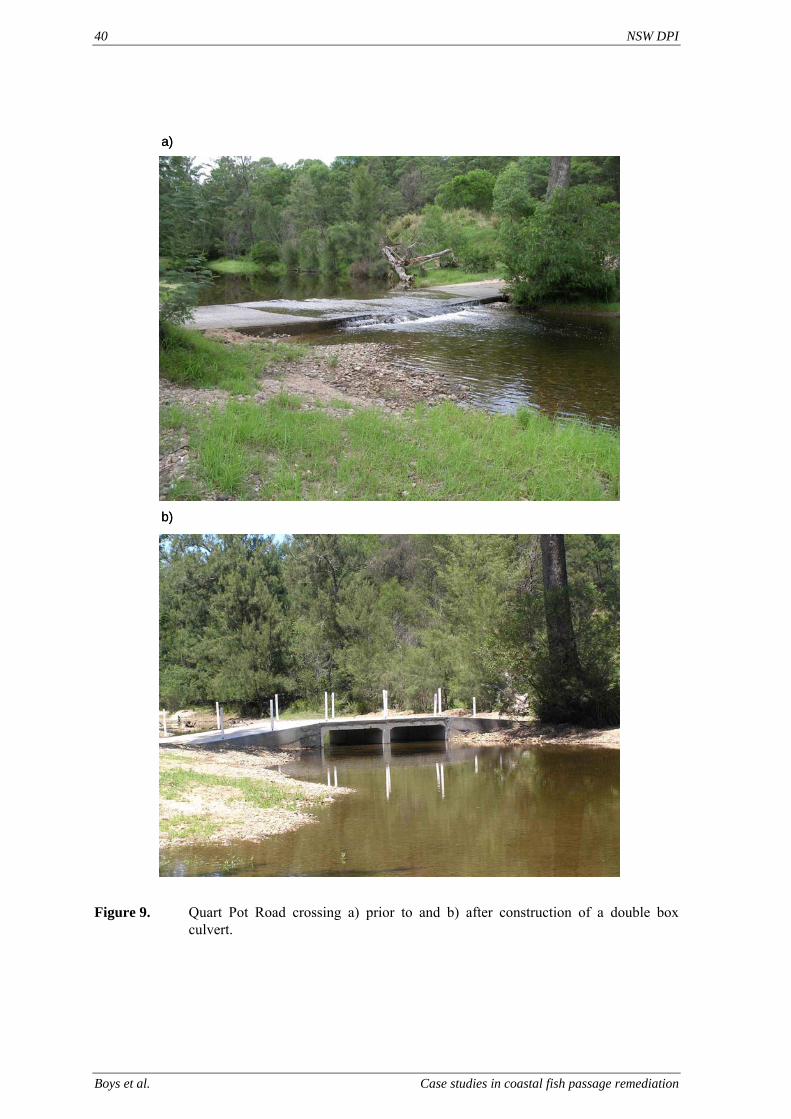
40 NSW DPI
Boys et al. Case studies in coastal fish passage remediation
b)
a)
b)
a)
Figure 9. Quart Pot Road crossing a) prior to and b) after construction of a double box
culvert.
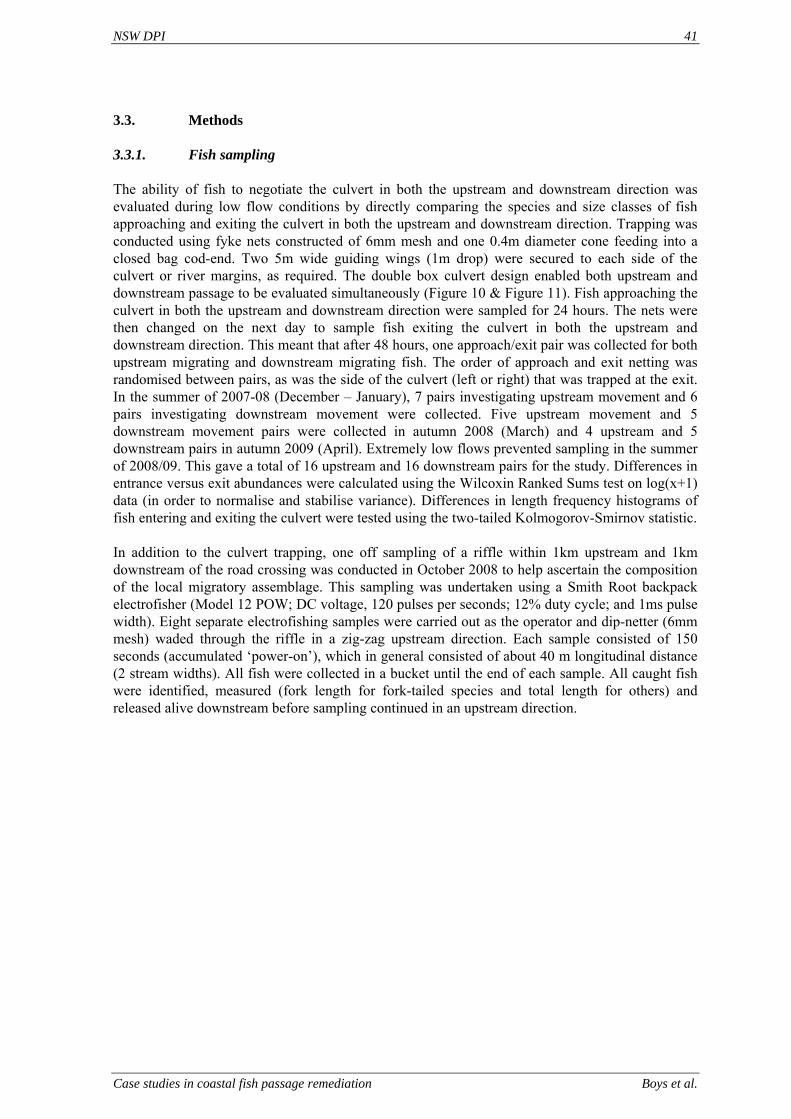
NSW DPI 41
Case studies in coastal fish passage remediation Boys et al.
3.3. Methods
3.3.1. Fish sampling
The ability of fish to negotiate the culvert in both the upstream and downstream direction was evaluated during low flow conditions by directly comparing the species and size classes of fish approaching and exiting the culvert in both the upstream and downstream direction. Trapping was conducted using fyke nets constructed of 6mm mesh and one 0.4m diameter cone feeding into a closed bag cod-end. Two 5m wide guiding wings (1m drop) were secured to each side of the culvert or river margins, as required. The double box culvert design enabled both upstream and downstream passage to be evaluated simultaneously (Figure 10 & Figure 11). Fish approaching the culvert in both the upstream and downstream direction were sampled for 24 hours. The nets were then changed on the next day to sample fish exiting the culvert in both the upstream and downstream direction. This meant that after 48 hours, one approach/exit pair was collected for both upstream migrating and downstream migrating fish. The order of approach and exit netting was randomised between pairs, as was the side of the culvert (left or right) that was trapped at the exit. In the summer of 2007-08 (December – January), 7 pairs investigating upstream movement and 6 pairs investigating downstream movement were collected. Five upstream movement and 5 downstream movement pairs were collected in autumn 2008 (March) and 4 upstream and 5 downstream pairs in autumn 2009 (April). Extremely low flows prevented sampling in the summer of 2008/09. This gave a total of 16 upstream and 16 downstream pairs for the study. Differences in entrance versus exit abundances were calculated using the Wilcoxin Ranked Sums test on log(x+1) data (in order to normalise and stabilise variance). Differences in length frequency histograms of fish entering and exiting the culvert were tested using the two-tailed Kolmogorov-Smirnov statistic. In addition to the culvert trapping, one off sampling of a riffle within 1km upstream and 1km downstream of the road crossing was conducted in October 2008 to help ascertain the composition of the local migratory assemblage. This sampling was undertaken using a Smith Root backpack electrofisher (Model 12 POW; DC voltage, 120 pulses per seconds; 12% duty cycle; and 1ms pulse width). Eight separate electrofishing samples were carried out as the operator and dip-netter (6mm mesh) waded through the riffle in a zig-zag upstream direction. Each sample consisted of 150 seconds (accumulated ‘power-on’), which in general consisted of about 40 m longitudinal distance (2 stream widths). All fish were collected in a bucket until the end of each sample. All caught fish were identified, measured (fork length for fork-tailed species and total length for others) and released alive downstream before sampling continued in an upstream direction.
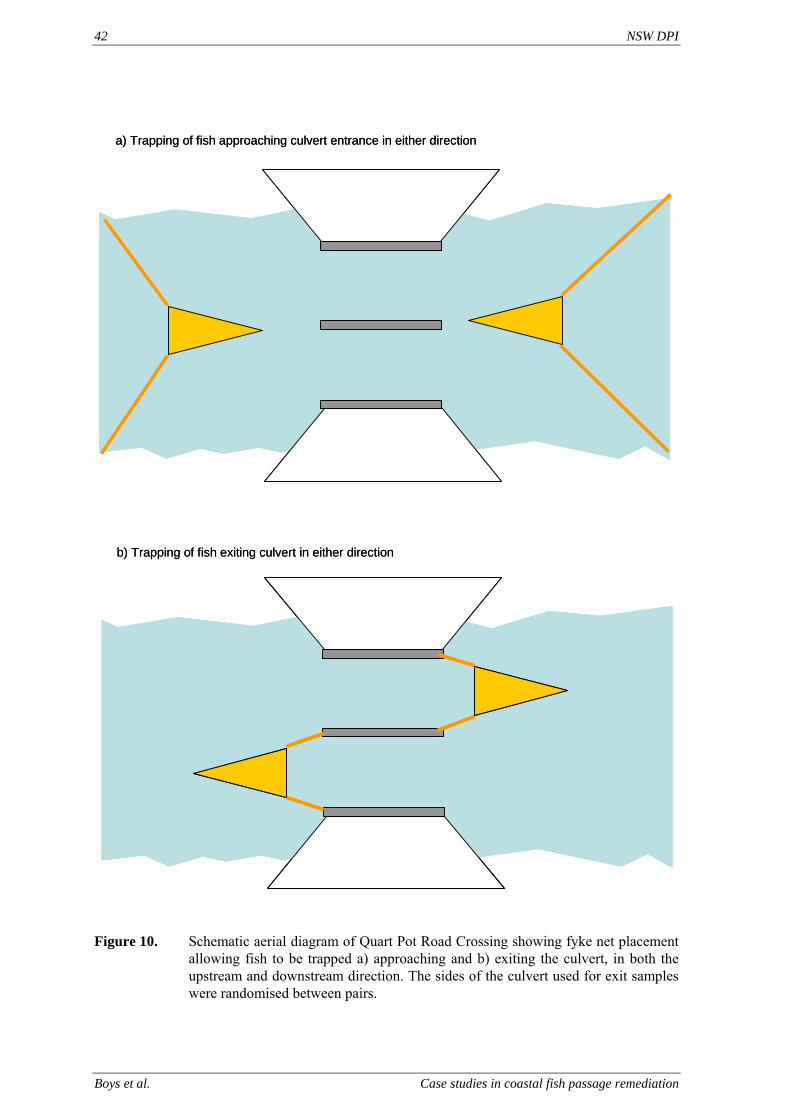
42 NSW DPI
Boys et al. Case studies in coastal fish passage remediation
b) Trapping of fish exiting culvert in either direction
a) Trapping of fish approaching culvert entrance in either direction
b) Trapping of fish exiting culvert in either direction
a) Trapping of fish approaching culvert entrance in either direction
Figure 10. Schematic aerial diagram of Quart Pot Road Crossing showing fyke net placement
allowing fish to be trapped a) approaching and b) exiting the culvert, in both the upstream and downstream direction. The sides of the culvert used for exit samples were randomised between pairs.
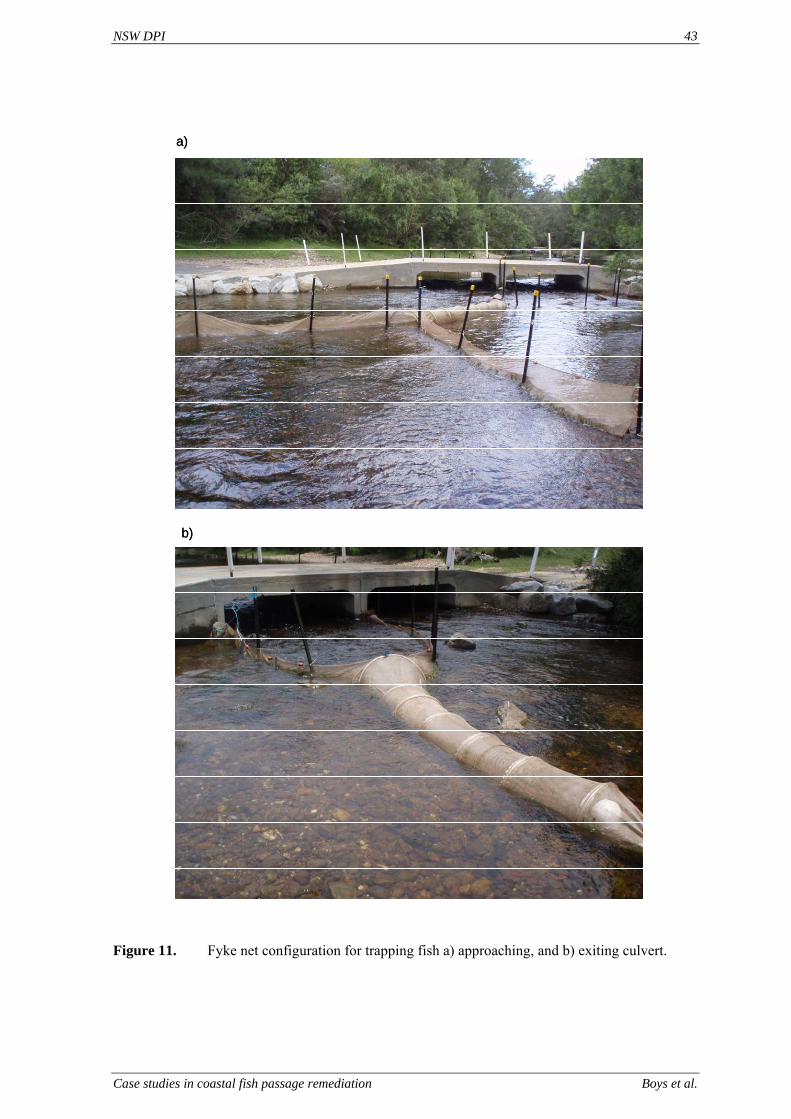
NSW DPI 43
Case studies in coastal fish passage remediation Boys et al.
a)
b)
a)
b)
Figure 11. Fyke net configuration for trapping fish a) approaching, and b) exiting culvert.
44 NSW DPI
Boys et al. Case studies in coastal fish passage remediation
3.4. Results
A total 891 individuals, representing 15 species of fish were sampled either approaching or exiting the box culvert (Table 6). This accounted for the total diversity of species that were sampled from the nearby upstream and downstream riffles assemblages, plus six additional species: Firetail gudgeon, Carp gudgeon, Flathead gudgeon, Bullrout, Striped Mullet and Shortfinned eel. The majority of species (67%) and individuals (86%) sampled have both estuarine and freshwater habits, with the remainder typically found only in freshwater. Australian smelt, Common jollytail, Empire gudgeon, Striped gudgeon, Dwarf flathead gudgeon, Flathead gudgeon and Longfinned eel were the most abundant species sampled, collectively comprising 91% of the total catch. Almost twice as many (1.79 times) individuals were caught moving downstream as were caught moving upstream, Most species moved both upstream and downstream, however, the least abundant species (Australian Bass, Shortfinned eel, Carp gudgeon, Cox’s gudgeon and Firetailed gudgeon) were only caught either going upstream or downstream. Although there was a general trend to catch more fish exiting the culvert than approaching it (in both directions) but these differences were not statistically significant (Figure 12, downstream: Z = -1.2162, P = 0.89, upstream: Z = -2.824, P = 1.00). When analysed species by species, there were also no significant differences in the paired samples in either the upstream or downstream direction. A large range of size class of fish was collected from the culvert exit (23 – 1000mm) (Figure 13 & Figure 14). Small-bodied fish (<100mm) comprised 89% of all individuals approaching and passing the culvert. Overall, there was no significant difference in the size class of fish approaching and exiting the culvert in the upstream direction (Figure 13, Dks = 0.152, P = 0.08). 87% of all fish successfully exiting the culvert in the upstream direction and 73% of all fish approaching the culvert in the upstream direction were small-bodied. There was a significant difference found in the size class of fish approaching and exiting the culvert in the downstream direction (Figure 14, Dks = 0.237, P < 0.01), but a wide range of size classes were detected to exit the culvert (Figure 14).
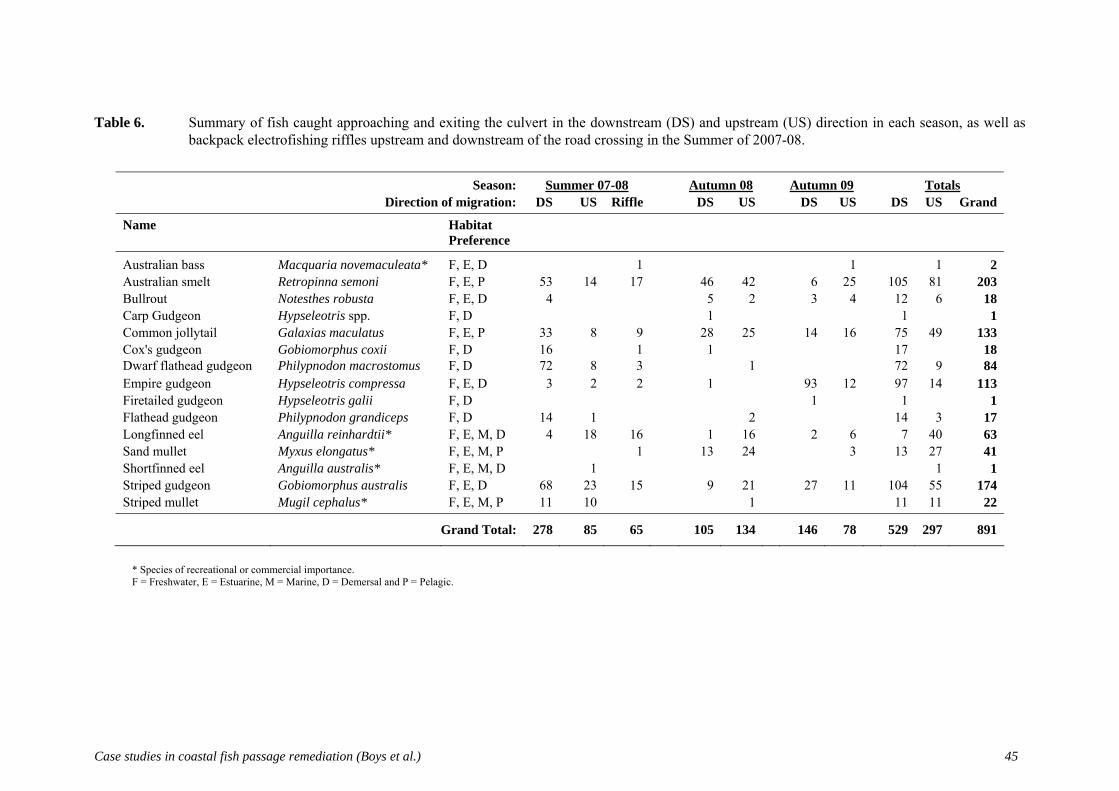
Case studies in coastal fish passage remediation (Boys et al.) 45
Table 6. Summary of fish caught approaching and exiting the culvert in the downstream (DS) and upstream (US) direction in each season, as well as backpack electrofishing riffles upstream and downstream of the road crossing in the Summer of 2007-08.
Season: Summer 07-08 Autumn 08 Autumn 09 Totals Direction of migration: DS US Riffle DS US DS US DS US Grand
Name
Habitat Preference
Australian bass Macquaria novemaculeata* F, E, D 1 1 1 2 Australian smelt Retropinna semoni F, E, P 53 14 17 46 42 6 25 105 81 203 Bullrout Notesthes robusta F, E, D 4 5 2 3 4 12 6 18 Carp Gudgeon Hypseleotris spp. F, D 1 1 1 Common jollytail Galaxias maculatus F, E, P 33 8 9 28 25 14 16 75 49 133 Cox's gudgeon Gobiomorphus coxii F, D 16 1 1 17 18 Dwarf flathead gudgeon Philypnodon macrostomus F, D 72 8 3 1 72 9 84 Empire gudgeon Hypseleotris compressa F, E, D 3 2 2 1 93 12 97 14 113 Firetailed gudgeon Hypseleotris galii F, D 1 1 1 Flathead gudgeon Philypnodon grandiceps F, D 14 1 2 14 3 17 Longfinned eel Anguilla reinhardtii* F, E, M, D 4 18 16 1 16 2 6 7 40 63 Sand mullet Myxus elongatus* F, E, M, P 1 13 24 3 13 27 41 Shortfinned eel Anguilla australis* F, E, M, D 1 1 1 Striped gudgeon Gobiomorphus australis F, E, D 68 23 15 9 21 27 11 104 55 174 Striped mullet Mugil cephalus* F, E, M, P 11 10 1 11 11 22
Grand Total: 278 85 65 105 134 146 78 529 297 891
* Species of recreational or commercial importance. F = Freshwater, E = Estuarine, M = Marine, D = Demersal and P = Pelagic.
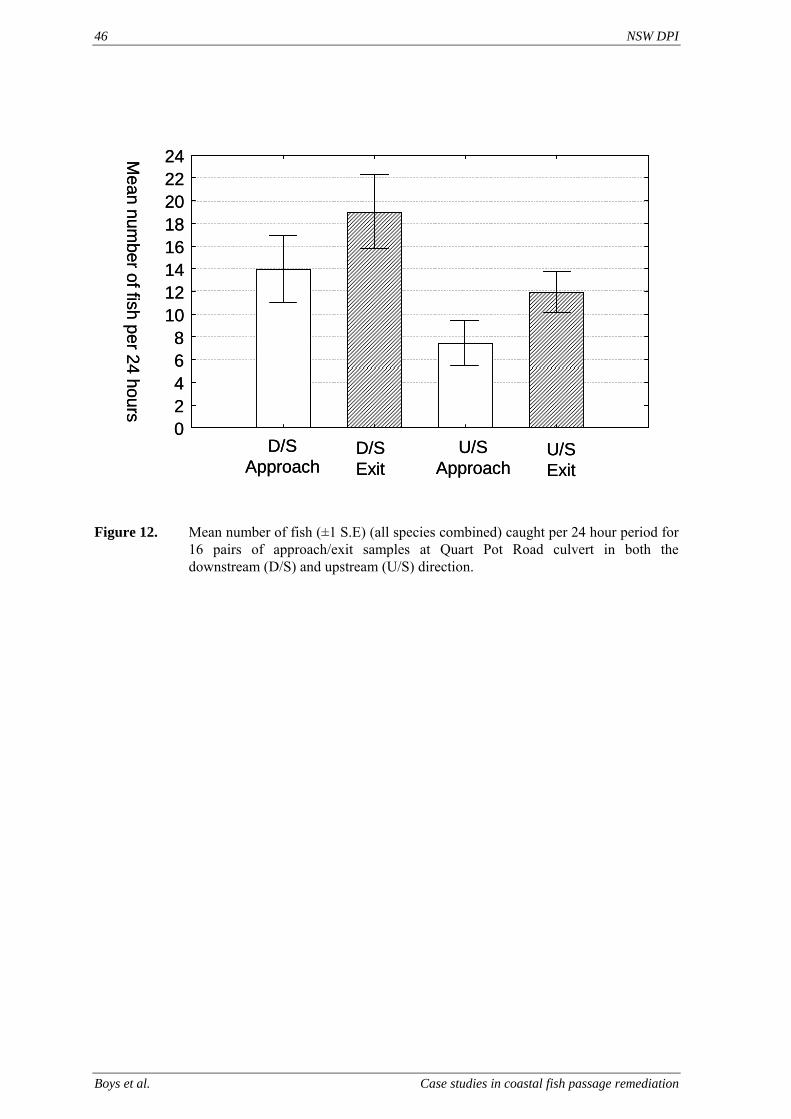
46 NSW DPI
Boys et al. Case studies in coastal fish passage remediation
D/SApproach
D/SExit
02468
1012141618202224M
ean number of fish per 24 hours
U/SApproach
U/SExit
D/SApproach
D/SExit
02468
1012141618202224M
ean number of fish per 24 hours
U/SApproach
U/SExit
Figure 12. Mean number of fish (±1 S.E) (all species combined) caught per 24 hour period for
16 pairs of approach/exit samples at Quart Pot Road culvert in both the downstream (D/S) and upstream (U/S) direction.
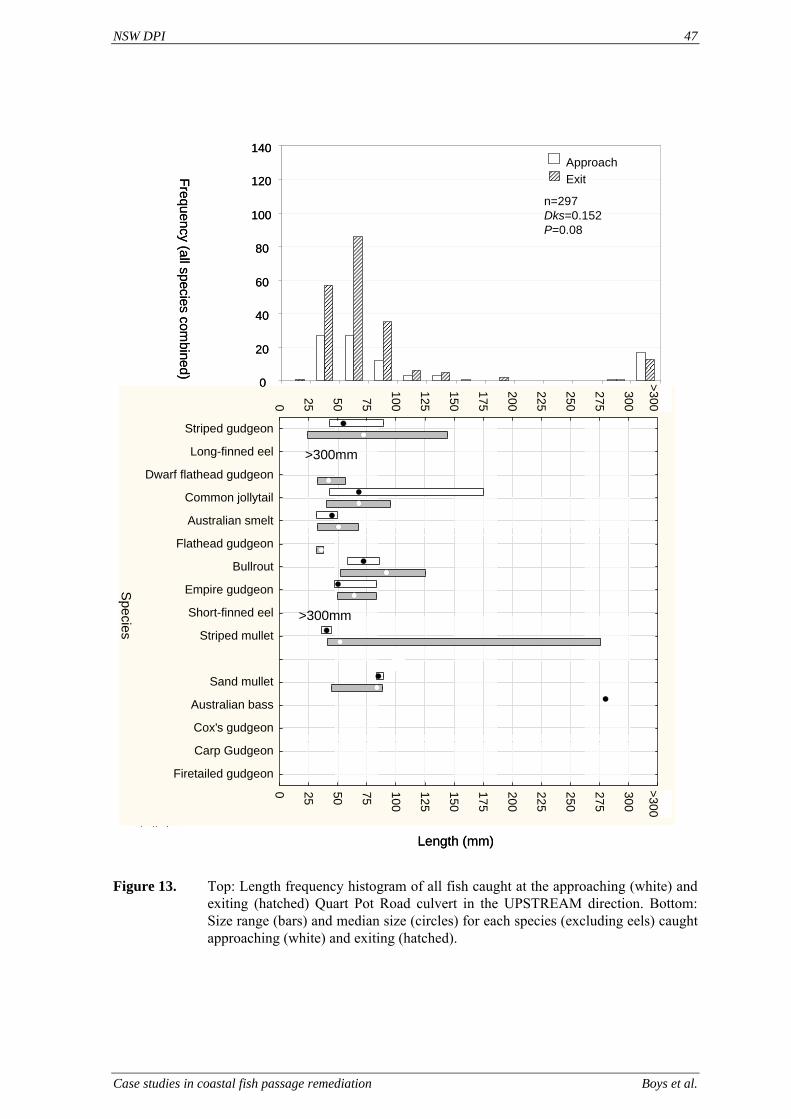
NSW DPI 47
Case studies in coastal fish passage remediation Boys et al.
Striped gudgeon
Long-finned eel
Dwarf flathead gudgeon
Common jollytail
Australian smelt
Flathead gudgeon
Bullrout
Empire gudgeon
Short-finned eel
Striped mullet
no catch
Sand mullet
Australian bass
Cox's gudgeon
Carp Gudgeon
Firetailed gudgeon
Com
mon nam
e
0 25 50 75
100
125
150
175
200
225
250
275
300
325
0 25 50 75 100
125
150
175
200
225
250
275
300
325
0
20
40
60
80
100
120
140ApproachExit
n=297Dks=0.152P=0.08
Frequency (all species combined)
Length (mm)
>300mm
>300mm
>300>300
Species
Figure 13. Top: Length frequency histogram of all fish caught at the approaching (white) and
exiting (hatched) Quart Pot Road culvert in the UPSTREAM direction. Bottom: Size range (bars) and median size (circles) for each species (excluding eels) caught approaching (white) and exiting (hatched).
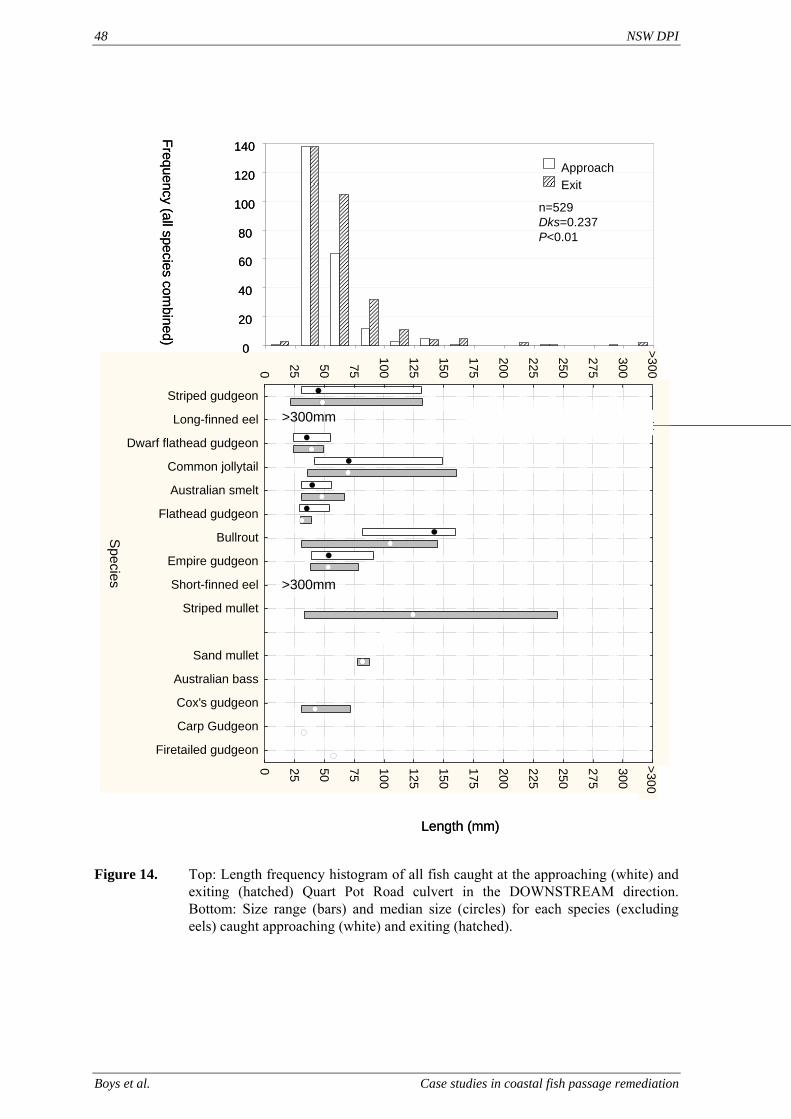
48 NSW DPI
Boys et al. Case studies in coastal fish passage remediation
Striped gudgeon
Long-finned eel
Dwarf flathead gudgeon
Common jollytail
Australian smelt
Flathead gudgeon
Bullrout
Empire gudgeon
Short-finned eel
Striped mullet
no catch
Sand mullet
Australian bass
Cox's gudgeon
Carp Gudgeon
Firetailed gudgeon
Com
mon nam
e
0 25 50 75
100
125
150
175
200
225
250
275
300
325
0 25 50 75 100
125
150
175
200
225
250
275
300
325
0
20
40
60
80
100
120
140
ApproachExit
n=529Dks=0.237P<0.01
Frequency (all species combined)
Length (mm)
Species >300mm
>300mm
>300>300
Figure 14. Top: Length frequency histogram of all fish caught at the approaching (white) and
exiting (hatched) Quart Pot Road culvert in the DOWNSTREAM direction. Bottom: Size range (bars) and median size (circles) for each species (excluding eels) caught approaching (white) and exiting (hatched).
NSW DPI 49
Case studies in coastal fish passage remediation Boys et al.
3.5. Discussion
This study has shown that a double box culvert constructed at Quart Pot Road crossing was able to pass a large range of freshwater and estuarine species and size classes in both the upstream and downstream direction. These species were typical of an assemblage from a lower catchment close to the tidal limit, being dominated by species with can tolerate fresh, brackish or estuarine conditions. Only 5 of the 15 fish species passing upstream through the culvert were catadromous (i.e., bass, mullet spp and eels). These species requiring access to the estuary at some point in their lives to spawn and upstream access to generally allow feeding and growing habitats to be recolonised. For these species, bi-directional barriers to passage located lower in the catchment (such as at Quart Pot Road) are considered a higher priority for passage, as delays in passage can affect spawning and recruitment. In this study striped and sand mullet juveniles were successfully passing through the culvert in the upstream and downstream direction. The vast majority of longfinned eels were passing the culvert in the upstream direction. A single adult Australian Bass and shortfinned eel was trapped after making a successful pass of the culvert in the upstream direction. These upstream movements of catadromous species during low-flow conditions were likely to be associated with fish moving between habitats or recolonising upstream habitats. Importantly, opportunities to perform these types of recolonising movements would have been limited to drown-out flows prior to road crossing refurbishment. The vast majority of species (10 of 15) attempting to pass the road crossing were freshwater. This suggests that even for fish without a direct need for connectivity between estuarine and fresh habitats, between-habitat movements can occur during low flows. Fish passage remediation works that focus on only commercially-important species will fail to restore passage for a large proportion of species that were collected in the vicinity of the road crossing. The true impact of restricted dispersal for freshwater species warrants further study if the true benefits of road crossing improvement programs within NSW are to be understood. The principal aim of this study was to evaluate whether a newly constructed double box culvert allowed both upstream and downstream passage of a fish assemblage past Quart Pot Road crossing under low-flow conditions. It was un-replicated spatially (i.e., only one road crossing), and therefore acts only as a site-specific case study and the generality of these results to other structures and waterways is limited. The generality of future studies can be improved by taking velocities and depth measurements in association with fish passage estimates. This will more easily enable comparisons to be drawn to other studies and structures and allow better predictions to be made on future culvert performance. It is recognised that remediating instream barriers which fragment habitats can lead to rapid and sustained improvements to ecological processes such as fish migration and water and sediment transfer (Roni et al. 2005). Improvements to the fish assemblage arising from fish passage documented through the box culvert can only be determined through ongoing monitoring programs which incorporate before and after components. Without detailed before information it is difficult to benchmark the fish community prior to barrier replacement. This inability to detect change is also intrinsically linked to local hydrology and how frequently the structure drowned-out. It is likely, however, that at Quart Pot Road improvements in habitat connectivity may be minimal. This is because a low-level weir and submerged orifice fishway still remain 0.8 km upstream of the road crossing, creating a barrier for most species. But habitat quality rather than quantity may be more important. Pess et al. (1998) showed that the quality of habitat reconnected (i.e., area of pools and density of large wood) may lead to greater increases in productivity following culvert removal than river length. Their study, however, involved salmon (Oncorhynchus spp) which have a strong dependence on upstream spawning habitat and the same may not apply for Australian native
50 NSW DPI
Boys et al. Case studies in coastal fish passage remediation
species. Regardless, it highlights the importance of considering the cumulative impact of sequential barriers when taking the most cost effective approach to prioritising road crossings for removal (Kemp and O'Hanley 2010). Optimisation procedure which link drown-out frequency and restorable habitat quality and quantity at scales relevant to migrating fish should be developed for NSW catchments and are critical to prudent and cost-effective natural resource management. In order to refine criteria for future road crossing design and assist with the prioritisation of barrier removal on coastal NSW, further research beyond the scope of this study is required. The main recommendations for future work are to:
1. Conduct lab-based studies to better understand the swimming performance and behaviour of a variety of coastal fish species and size classes. These should be validated with field trials at a select number of ‘demonstration sites’.
2. Conduct replicated field studies looking at a variety of designs, in a variety of geomorphological and hydrological contexts, with passage rates associated with physical variables such as depth and velocity. This will improve the generality of findings beyond what was possible with the current case study approach.
3. Develop better barrier removal prioritisation protocols which incorporate the cumulative impact of sequential barriers in relation to the resident fish assemblage and long-term hydrology. This will ensure that individual site-specific actions (such as undertaken in this study) fit into a larger context of catchment restoration and fisheries recovery.
4. Incorporate rigorous BACI design into future culvert research studies (as applied in Chapter 1 of this report), as this will significantly enhance our understanding of what the real benefits of barrier remediation are. That is, a fishway may be working, but what relative benefit have been gained over a pre-existing structure.
5. Conduct long-term studies into the hydraulic performance of different fishway designs in different geomorphological settings to ensure that passage is retained through time. A visit to Quart Pot Road crossing 12 months after this study revealed that gravel has all but blocked flow through one side of the double box culvert, almost certainly impacting on fish passage. Better understanding of the ongoing maintenance requirements of different fishways will ensure that appropriate engineering decisions are made at the start (e.g., more armouring of banks) and that the true ongoing costs of barrier remediation is understood. For example, in some instances culverts may be appear a less costly measure than a bridge, but a bridge would allow better transmission of sediment and flows and is less likely to ‘clog’. In the long term a culvert which constrains the channel may require costly maintenance, or worse, may become a greater barrier to fish passage and a greater flood risk than the previous structure.
3.5.1. Conclusion
This study has shown that a double box culvert constructed at Quart Pot Road crossing was able to pass a large range of potomodromous and catadromous species and size classes in both the upstream and downstream direction. In doing so, the crossing should be viewed as meeting its objectives in facilitating passage during low-flow conditions. Further research, as outlined above, is recommended to refine the biological criteria for future culvert design and to prioritise culvert remediation works throughout NSW.
NSW DPI 51
Case studies in coastal fish passage remediation Boys et al.
4. CASE STUDY 3: LOW-FLOW, PARTIAL-WIDTH
FISHWAY WITHIN A FULL-WIDTH ROCK-RAMP
FISHWAY AT STROUD WEIR, KARUAH RIVER
4.1. Introduction
For a large proportion of fish species in south eastern Australia, migration is an integral requirement for them to fulfil important parts of their life cycles, such as spawning and recolonisation (Beumer 1980, Harris 1984b, Mallen-Cooper and Harris 1990). Even low structures which drown out more frequently in lower coastal catchments like weirs and road crossings can delay and prevent migration at critical times, contributing to increased mortality and reduced species distribution; a problem compounded when sequential barriers are located on a river system (Harris 1984a). Within coastal NSW there is are a large number of barriers which block fish passage (Pethebridge et al. 1998, Gordos et al. 2007) and programs such as ‘Bringing Back the Fish’ are attempting to remediate priority structures with the use of culverts, floodgates and weirs. In the case of weirs, vertical-slot designs have been consistently shown to improve passage rates when replacing inappropriately designed fishways (Kowarsky and Ross 1981, Stuart and Berghuis 2002, Gilligan et al. 2003). The cost of these however can often be prohibitive when programs need to be implemented at a number of sites. Instead, low-cost, ‘natural-style’ fishways and bypasses such as rock-ramps may prove to be a more desirable fish passage option from a cost-perspective. To date the performance of these rock-ramp fishways within coastal and inland rivers has received relatively little attention when compared to technical designs. Results have been mixed, showing effective passage in some instances (Thorncraft and Harris 1996) and ineffective passage in others (Zampatti et al. 2002). The further investigation of the performance of rock-ramp fishways in coastal streams is warranted to ensure that this lower-cost cost design is ecologically effective as well as cost-effective. The aim of the current study was to assess the performance of a partial-width, rock-ramp fishway that was recently constructed at Stroud Weir as part of the ‘Bringing Back the Fish’ project. To do this we compared the species and size classes of fish that were approaching the bottom of the fishway with those that successfully ascended and exited.
4.2. Site details
Stroud Weir Fishway (35o43’41.88”S 150o04’13.75”E) is located on the Karuah River, approximately 36 km upstream of the Port Stephens estuary at Karuah (Figure 15). Pool-riffle sequences typify the upstream and downstream habitats. Prior to fishway construction, the weir was impassable by fish over all but high flows (Figure 16a). In late 2006 a full-width rock-ramp fishway with internal low-flow fishway was constructed (Figure 16b and Figure 17). The low-flow fishway was 23m long and constructed on a slope of 1:20, with ridge rocks spaced approximately 2m apart creating a 0.1m headloss between individual resting pools approximately 0.4m minimum depth for a least 50% of the pool. The top pool of the fishway entered the weir pool over a 200mm (3m wide) notch cut into the weir crest. Side rocks and geotextile fabric maintained a 0.3m operational depth range within the low-flow fishway. The total headloss of the structure was approximately 1 to 1.15m depending on tail water levels. All these specifications were obtained from unpublished drawings provided courtesy of the fishway designer (Martin Mallen-Cooper, Fishway Consulting Services).
52 NSW DPI
Boys et al. Case studies in coastal fish passage remediation
4.3. Methods
The low-flow channel of the fishway was trapped to observe the upstream passage of fish through the fishway over combined diurnal and nocturnal periods1. Trapping was conducted using a fyke net constructed of 6mm mesh and one 0.4m diameter cone feeding into a closed bag cod-end. Two 5m wide guiding wings (1m drop) were secured to each side of the low-flow channel and weighted to the bottom of the river to guide fish into the cod-end minimise the chance of fish escaping. During each sampling week, the fyke net was deployed for four consecutive 24 hour periods, with trapping alternated between immediately upstream of the fishway exit (Figure 18a) and immediately below the lower cell of the fishway (Figure 18b). This allowed two entrance/exit pairs to be obtained per week of sampling. All together 46 (23 top/bottom pairs) 24 hour samples were collected over two years (2007-2008) between the months of November and April to coincide with the general period of upstream migration of juvenile Australian bass, mullet and smaller species such as gudgeon. All fish trapped were identified, measured (fork length) and inspected for signs of disease before being released upstream of the fishway.
1 Fish passage at the fishway could be effectively evaluated only whilst flows were constrained within the central low-flow channel (i.e., during flows between 5 and 77 Ml.day-1). Due to gear constraints and OH&S procedures, it was not possible to trap the fishway once flows spread along the entire width of the fishway.
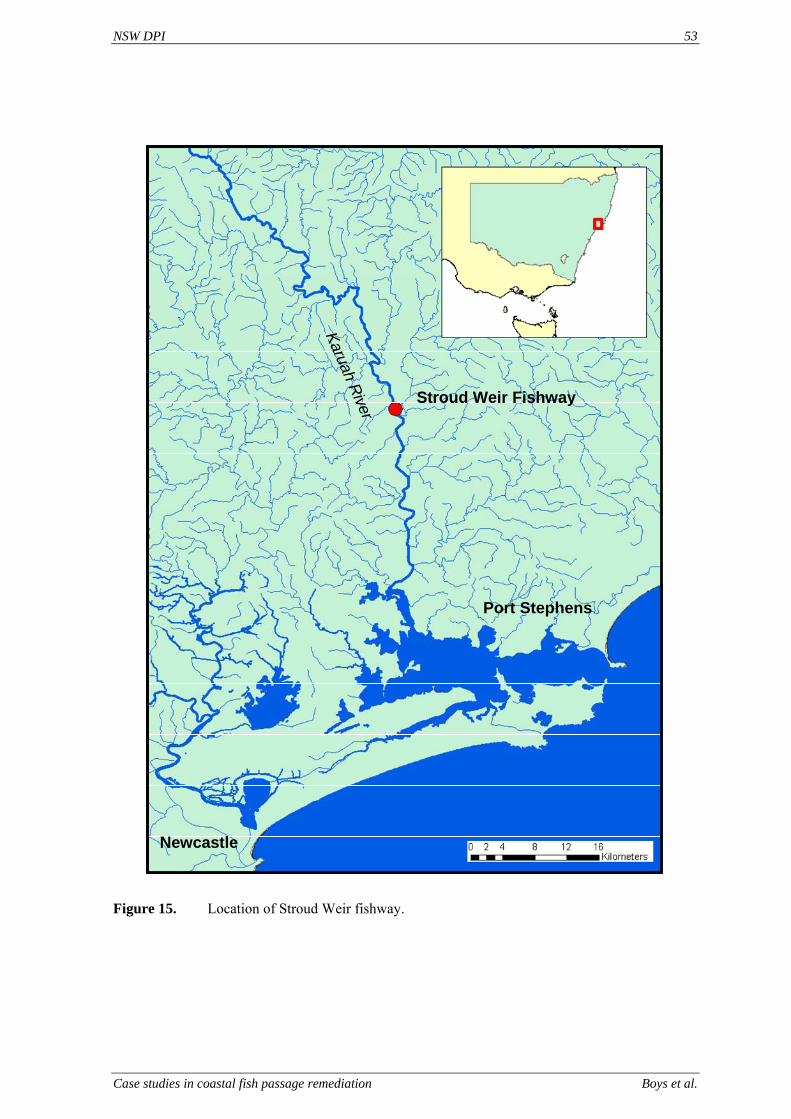
NSW DPI 53
Case studies in coastal fish passage remediation Boys et al.
Stroud Weir Fishway
Port Stephens
Karuah River
Newcastle
Stroud Weir Fishway
Port Stephens
Karuah River
Newcastle
Figure 15. Location of Stroud Weir fishway.
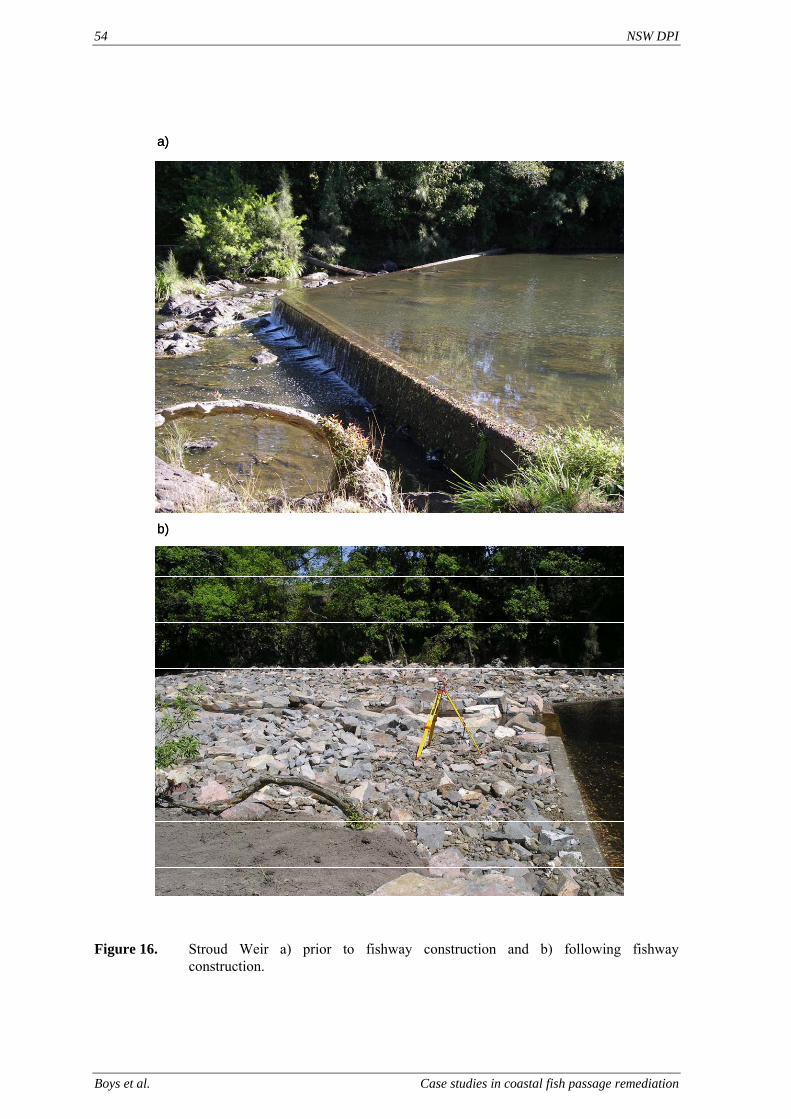
54 NSW DPI
Boys et al. Case studies in coastal fish passage remediation
b)
a)
b)
a)
Figure 16. Stroud Weir a) prior to fishway construction and b) following fishway
construction.
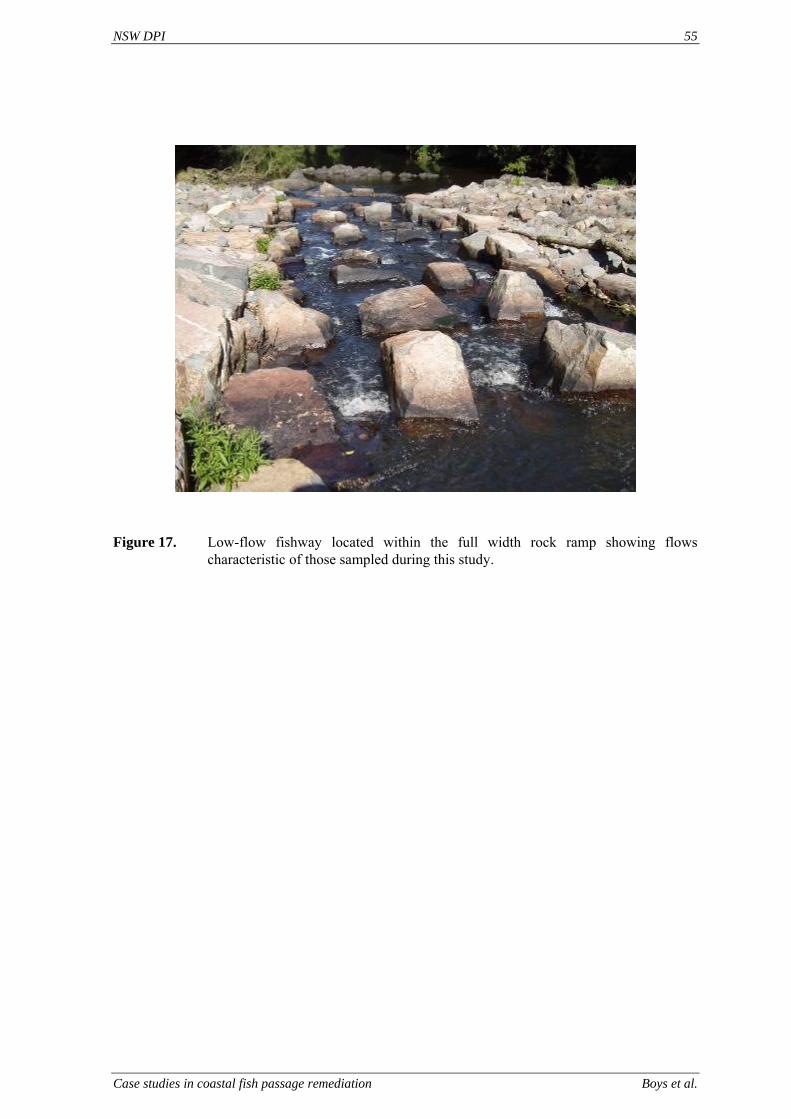
NSW DPI 55
Case studies in coastal fish passage remediation Boys et al.
Figure 17. Low-flow fishway located within the full width rock ramp showing flows characteristic of those sampled during this study.
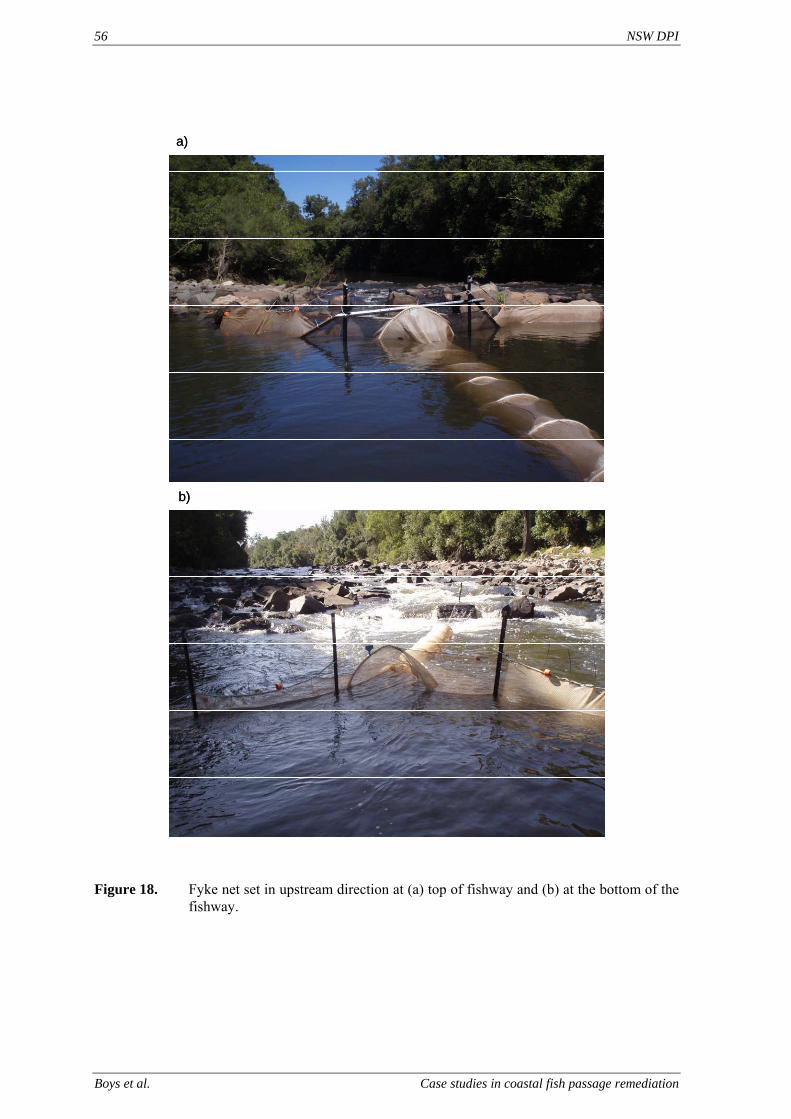
56 NSW DPI
Boys et al. Case studies in coastal fish passage remediation
a)
b)
a)
b)
Figure 18. Fyke net set in upstream direction at (a) top of fishway and (b) at the bottom of the
fishway.
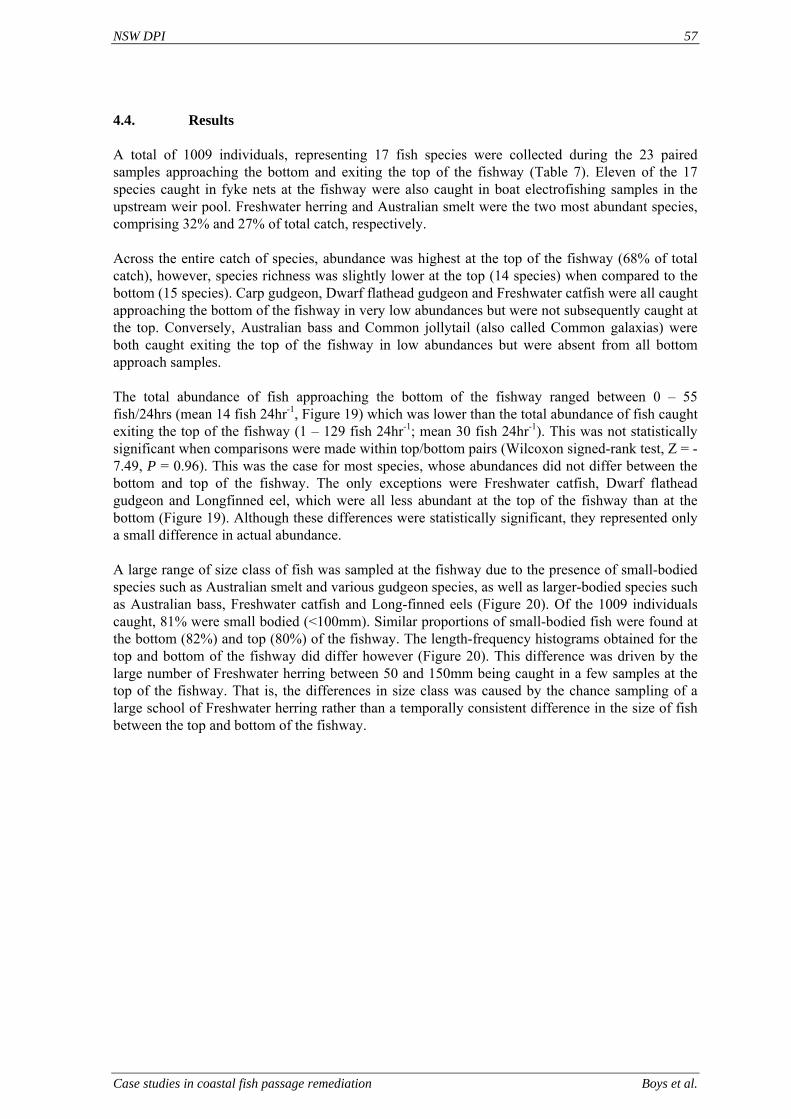
NSW DPI 57
Case studies in coastal fish passage remediation Boys et al.
4.4. Results
A total of 1009 individuals, representing 17 fish species were collected during the 23 paired samples approaching the bottom and exiting the top of the fishway (Table 7). Eleven of the 17 species caught in fyke nets at the fishway were also caught in boat electrofishing samples in the upstream weir pool. Freshwater herring and Australian smelt were the two most abundant species, comprising 32% and 27% of total catch, respectively. Across the entire catch of species, abundance was highest at the top of the fishway (68% of total catch), however, species richness was slightly lower at the top (14 species) when compared to the bottom (15 species). Carp gudgeon, Dwarf flathead gudgeon and Freshwater catfish were all caught approaching the bottom of the fishway in very low abundances but were not subsequently caught at the top. Conversely, Australian bass and Common jollytail (also called Common galaxias) were both caught exiting the top of the fishway in low abundances but were absent from all bottom approach samples. The total abundance of fish approaching the bottom of the fishway ranged between 0 – 55 fish/24hrs (mean 14 fish 24hr-1, Figure 19) which was lower than the total abundance of fish caught exiting the top of the fishway (1 – 129 fish 24hr-1; mean 30 fish 24hr-1). This was not statistically significant when comparisons were made within top/bottom pairs (Wilcoxon signed-rank test, Z = -7.49, P = 0.96). This was the case for most species, whose abundances did not differ between the bottom and top of the fishway. The only exceptions were Freshwater catfish, Dwarf flathead gudgeon and Longfinned eel, which were all less abundant at the top of the fishway than at the bottom (Figure 19). Although these differences were statistically significant, they represented only a small difference in actual abundance. A large range of size class of fish was sampled at the fishway due to the presence of small-bodied species such as Australian smelt and various gudgeon species, as well as larger-bodied species such as Australian bass, Freshwater catfish and Long-finned eels (Figure 20). Of the 1009 individuals caught, 81% were small bodied (<100mm). Similar proportions of small-bodied fish were found at the bottom (82%) and top (80%) of the fishway. The length-frequency histograms obtained for the top and bottom of the fishway did differ however (Figure 20). This difference was driven by the large number of Freshwater herring between 50 and 150mm being caught in a few samples at the top of the fishway. That is, the differences in size class was caused by the chance sampling of a large school of Freshwater herring rather than a temporally consistent difference in the size of fish between the top and bottom of the fishway.
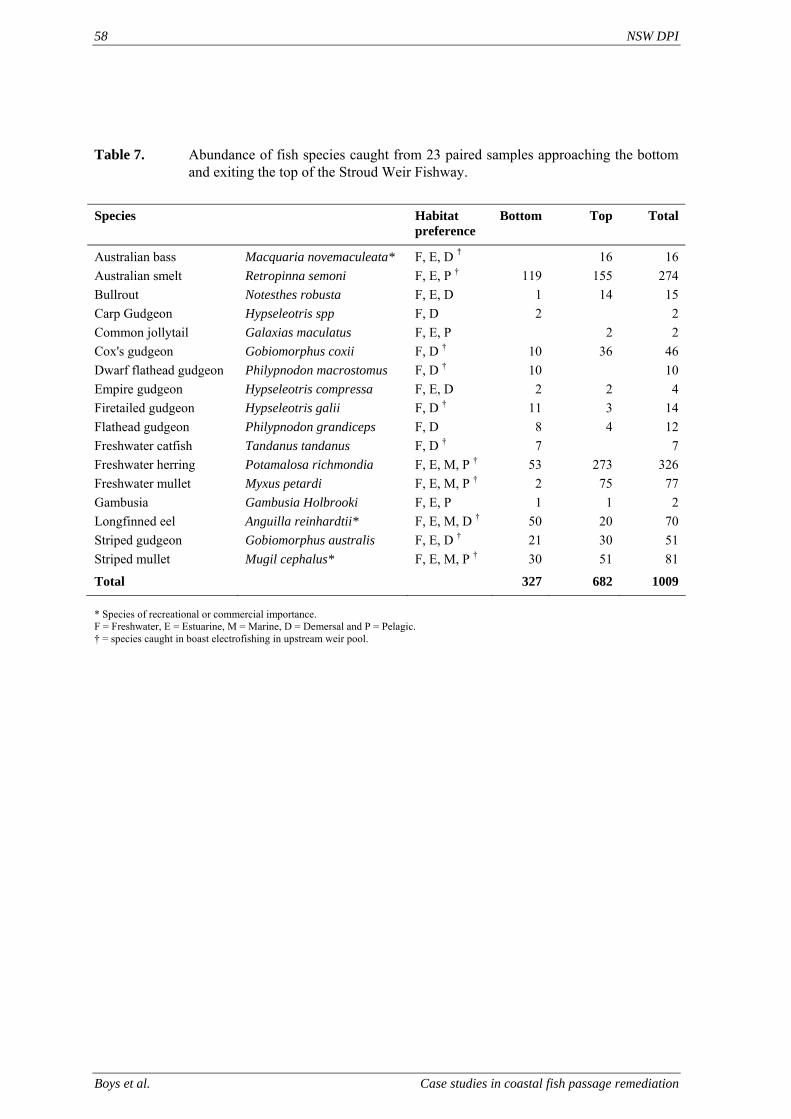
58 NSW DPI
Boys et al. Case studies in coastal fish passage remediation
Table 7. Abundance of fish species caught from 23 paired samples approaching the bottom
and exiting the top of the Stroud Weir Fishway. Species Habitat
preference Bottom Top Total
Australian bass Macquaria novemaculeata* F, E, D † 16 16 Australian smelt Retropinna semoni F, E, P † 119 155 274 Bullrout Notesthes robusta F, E, D 1 14 15 Carp Gudgeon Hypseleotris spp F, D 2 2 Common jollytail Galaxias maculatus F, E, P 2 2 Cox's gudgeon Gobiomorphus coxii F, D † 10 36 46 Dwarf flathead gudgeon Philypnodon macrostomus F, D † 10 10 Empire gudgeon Hypseleotris compressa F, E, D 2 2 4 Firetailed gudgeon Hypseleotris galii F, D † 11 3 14 Flathead gudgeon Philypnodon grandiceps F, D 8 4 12 Freshwater catfish Tandanus tandanus F, D † 7 7 Freshwater herring Potamalosa richmondia F, E, M, P † 53 273 326 Freshwater mullet Myxus petardi F, E, M, P † 2 75 77 Gambusia Gambusia Holbrooki F, E, P 1 1 2 Longfinned eel Anguilla reinhardtii* F, E, M, D † 50 20 70 Striped gudgeon Gobiomorphus australis F, E, D † 21 30 51 Striped mullet Mugil cephalus* F, E, M, P † 30 51 81
Total 327 682 1009 * Species of recreational or commercial importance. F = Freshwater, E = Estuarine, M = Marine, D = Demersal and P = Pelagic. † = species caught in boast electrofishing in upstream weir pool.
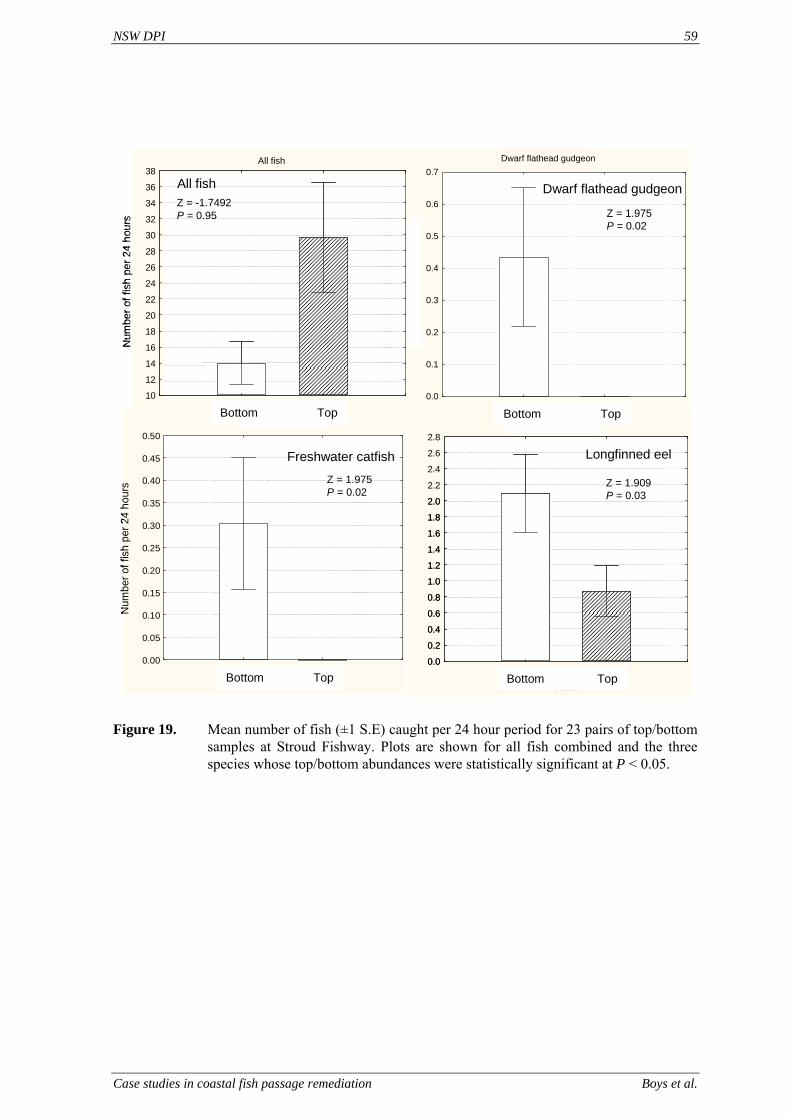
NSW DPI 59
Case studies in coastal fish passage remediation Boys et al.
All fish
Bottom Top
Location
0.00
0.05
0.10
0.15
0.20
0.25
0.30
0.35
0.40
0.45
0.50
Num
ber o
f fis
h pe
r 24
hour
s
Freshwater catfish
Dwarf flathead gudgeon
Bottom Top
Location
0.0
0.1
0.2
0.3
0.4
0.5
0.6
0.7
Num
ber o
f fis
h pe
r 24
hour
s
Dwarf flathead gudgeon
All fish
Bottom Top
Location
10
12
14
16
18
20
22
24
26
28
30
32
34
36
38
Num
ber o
f fis
h pe
r 24
hour
s
Long-finned eel
Bottom Top
Location
0.0
0.2
0.4
0.6
0.8
1.0
1.2
1.4
1.6
1.8
2.0
2.2
2.4
2.6 Longfinned eel2.8
All fish
Bottom Top Bottom Top
Bottom Top Bottom Top
Z = -1.7492P = 0.95 Z = 1.975
P = 0.02
Z = 1.975P = 0.02
Z = 1.909P = 0.03
All fish
Bottom Top
Location
0.00
0.05
0.10
0.15
0.20
0.25
0.30
0.35
0.40
0.45
0.50
Num
ber o
f fis
h pe
r 24
hour
s
Freshwater catfish
Dwarf flathead gudgeon
Bottom Top
Location
0.0
0.1
0.2
0.3
0.4
0.5
0.6
0.7
Num
ber o
f fis
h pe
r 24
hour
s
Dwarf flathead gudgeon
All fishAll fish
Bottom Top
Location
Bottom Top
Location
10
12
14
16
18
20
22
24
26
28
30
32
34
36
38
Num
ber o
f fis
h pe
r 24
hour
s
Long-finned eelLong-finned eel
Bottom Top
Location
0.0
0.2
0.4
0.6
0.8
1.0
1.2
1.4
1.6
1.8
2.0
Bottom Top
Location
0.0
0.2
0.4
0.6
0.8
1.0
1.2
1.4
1.6
1.8
2.0
2.2
2.4
2.6 Longfinned eel2.8
All fish
Bottom Top Bottom Top
Bottom Top Bottom Top
Z = -1.7492P = 0.95 Z = 1.975
P = 0.02
Z = 1.975P = 0.02
Z = 1.909P = 0.03
Figure 19. Mean number of fish (±1 S.E) caught per 24 hour period for 23 pairs of top/bottom
samples at Stroud Fishway. Plots are shown for all fish combined and the three species whose top/bottom abundances were statistically significant at P < 0.05.
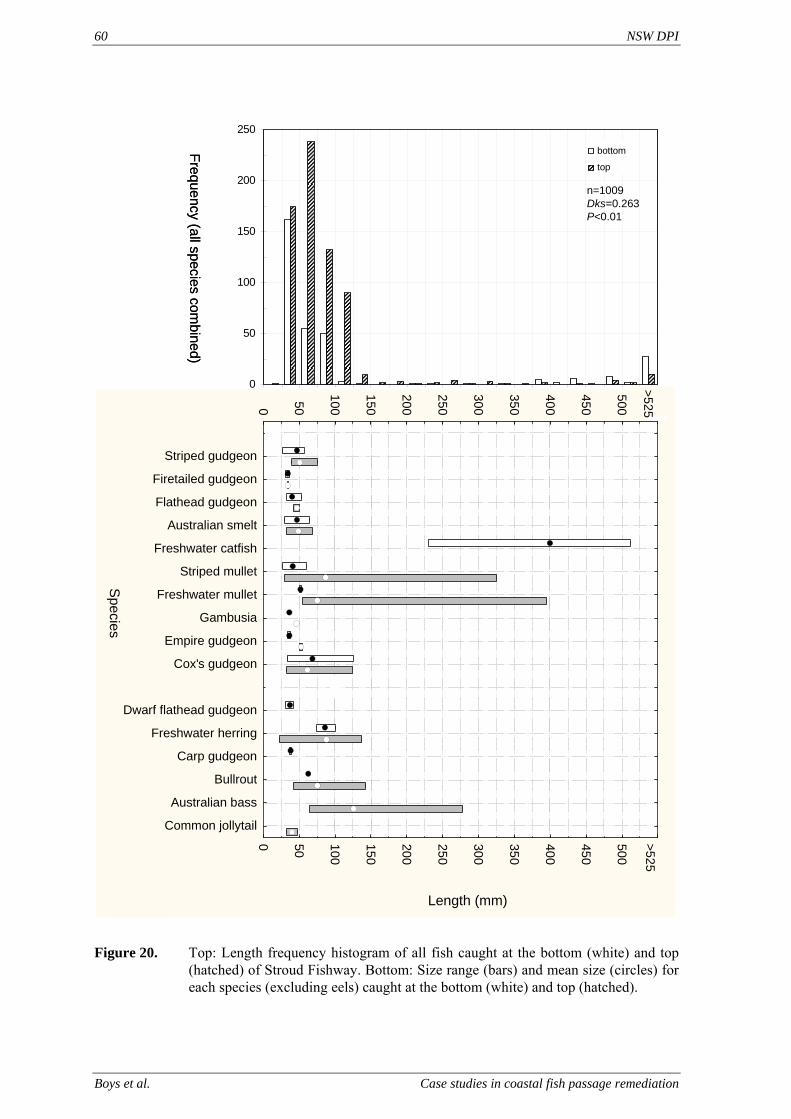
60 NSW DPI
Boys et al. Case studies in coastal fish passage remediation
0
50
100
150
200
250
bottom
top
lengthlength
Long-finned eel
Striped gudgeon
Firetailed gudgeon
Flathead gudgeon
Australian smelt
Freshwater catfish
Striped mullet
Freshwater mullet
Gambusia
Empire gudgeon
Cox's gudgeon
no catch
Dwarf flathead gudgeon
Freshwater herring
Carp gudgeon
Bullrout
Australian bass
Common jollytail
Com
mon nam
e
0 50
100
150
200
250
300
350
400
450
500
550
0 50 100
150
200
250
300
350
400
450
500
550
Length (mm)
n=1009Dks=0.263P<0.01
Species
>525>525
Frequency (all species combined)
Figure 20. Top: Length frequency histogram of all fish caught at the bottom (white) and top (hatched) of Stroud Fishway. Bottom: Size range (bars) and mean size (circles) for each species (excluding eels) caught at the bottom (white) and top (hatched).
NSW DPI 61
Case studies in coastal fish passage remediation Boys et al.
4.5. Discussion
Most species were found to successfully ascend the Stroud fishway during this study. The only species less abundant at the fishway exit than at the bottom were Dwarf flathead gudgeon, Freshwater catfish and Longfinned eel. This may be due to the very low abundance of these species encountered during the present sampling, rather than reflecting an inability to pass the structure. Eels, for instance, are capable of traversing land and passing high dams (Jellyman 1977, Gehrke et al. 2002). Dwarf flathead gudgeon have been reported successfully ascending McDonald’s Weir rock-ramp fishway (Thorncraft and Harris 1996) and Freshwater catfish are not considered to be migratory (Thorncraft and Harris 1996). Two species (Australian bass and Common jollytail) were caught in very low numbers exiting the fishway but not found at the bottom. The absence at the bottom of the fishway of these two species that are known to be migratory and use rock-ramp fishways (Thorncraft and Harris 1996, Zampatti et al. 2002) is assumed to indicate that these species were not attempting to migrate on the days of sampling, rather than being due to a lack of ability to find the fishway entrance. Australian bass are not commonly sampled at coastal rock-ramp fishways during the period of their upstream migration. Examples of this include this fishway at Stroud, McDonald’s Weir on Macquarie Rivulet (south coast NSW) and Wyong Weir on the Wyong River (central coast NSW) (Thorncraft and Harris 1996). This absence from samples may suggest that Australian bass have a behavioural aversion to rock-ramp fishways (as hypothesised earlier by Thorncraft and Harris 1996). This species has, however, been observed ascending vertical-slot fishways (Stuart and Berghuis 2002). This may warrant further investigation, although it may also be inconsequential given the frequency that structures drown out in the lower reaches of coastal rivers. This species may have a preference to migrate on elevated flows when these structures drown-out, rather than moving whilst flows are constrained to partial-width rock ramps. This assumptions is strengthened by the fact that Australian bass were found to occupy upstream habitats in this and the other rock-ramp fishway studies (Thorncraft and Harris 1996). The average rate of successful passage measured at Stroud fishway throughout this study was 1.25 fish hr-1. This rate was higher than that reported at a pool and weir design fishway (0.66 fish hr-1) on the Burnettt River in Queensland (Russell 1991). Older weir and pool design fishways based upon designs for salmonid (Clay 1995) have been consistently shown to be ineffective for the passage of many south eastern Australian fish species (Kowarsky and Ross 1981, Russell 1991) and their replacement with vertical-slot designs on coastal rivers have lead to significantly improved passage rates (Kowarsky and Ross 1981, Stuart and Berghuis 2002). The passage rate measured at the low-flow rock-ramp at Stroud was lower than passage rates reported for vertical slot fishways on the Fitzroy River (8.5 fish hr-1) (Stuart 1997), Burnett River (18.3 fish hr-1) (Stuart and Berghuis 2002) and Bulladelah fishway on the Crawford River (0.62 fish hr-1) (Gilligan et al. 2003). Although these results suggest that lower passage rates may be attainable at rock-ramps when compared to vertical-slot fishways, there may be other explanations for the lower passage rates measured in this study. For instance, we only assessed the fishway over a portion of its operating range (i.e., during operation of the low-flow fishway). The full width, high-flow fishway was frequently operating under elevated flows during the study period, but we were unable to trap the fishway under these conditions, a problem consistently encountered in rock-ramp studies (e.g., Thorncraft and Harris (1996)). Given that the number of fish attempting passage at fishways is generally related to discharge (Mallen-Cooper et al. 1995, Zampatti et al. 2002), sampling bias and a resultant underestimate of passage rates at rock-ramp fishways could account for lower migration rates. Therefore the current passage rates need to be viewed as low-flow passage rates, potentially outside of the periods when many species are stimulated to migrate under elevated flows.
62 NSW DPI
Boys et al. Case studies in coastal fish passage remediation
A large size range of fish were found to successfully ascend the fishway and if not for a large school of Freshwater herring being caught exiting the fishway on one occasion, it is unlikely that a significant difference in size structure would have been found between the top and bottom of the fishway. Smaller size classes of fish are often weaker swimmers (Mallen-Cooper 1992, 1994) and the fact that they were well represented in samples collected at the fishway exit would indicate that the velocities experienced within the Stroud fishway were not excessive for fish passage. The smallest and most abundant species consistently found successfully ascending the fishway were Australian smelt. This species has been consistently shown to be migratory and has been found successfully ascending both rock-ramp and vertical-slot fishways both on the coast and within the Murray-Darling Basin (Thorncraft and Harris 1996, Zampatti et al. 2002, Baumgartner et al. 2010). Conclusion The partial-width, low-flow, rock-ramp fishway at Stroud Weir provided passage to a diverse range of species and size classes of native fish and can be deemed to be performing to design specifications during low flow conditions. Passage rates over the flow range sampled are assumed to be higher than what would have occurred in the absence of a fishway where an excessive headloss (up to 1.15m at times) would have prevented any passage. The passage rates observed were higher than those reported for ineffective pool and weir design fishways, but lower than that generally achieved by vertical-slot fishways on coastal rivers. This may however be an artefact of sampling only when flows are constrained to the low-flow partial-width channel. Passage rates may have been higher for some species (such as Australian bass) as discharge increased and the high-flow, full-width fishway became inundated or the structure drowned-out (which frequently occurred). However, many other species and size classes may lack the ability to pass this barrier under these elevated flows and the provision of passage for these species and size classes over lower flows will assist with access to upstream habitats. This study did not seek to determine the overall contribution of fishway construction to improve river condition. Future studies need to adopt a BACI-style experimental design to determine larger-scale ecological benefits.
NSW DPI 63
Case studies in coastal fish passage remediation Boys et al.
5. REFERENCES
Alevizon, W.S. and Gorham, J.C. (1989). Effects of artificial reef deployment on nearby resident fishes. Bulletin of Marine Science 44: 646–661.
Anderson, M.J. (2001). A new method for non-parametric multivariate analysis of variance. Austral Ecology 26: 32–46.
Anderson, M.J., Gorley, R.N. and Clarke, K.R. (2008) PERMANOVA+ for PRIMER: Guide to software and statistical methods. PRIMER-E, Plymouth, UK.
Baker, C.F. and Boubée, J.A.T. (2006). Upstream passage of inanga Galaxias maculatus and redfin bullies Gobiomorphus huttoni over artificial ramps. Journal of Fish Biology 69: 668–681.
Bates, K. and Powers, P. (1998). Upstream passage of juvenile coho salmon through roughened culverts. Fish Migration and Fish Bypasses. pp. 192–202.
Baumgartner, L., Mc Pherson, B., Doyle, J., Cory, F., Bettanin, M., Cinotti, N. and Stanger, J. (2011). Quantifying and mitigating the impacts of weirs on downstream passage of native fish in the Murray-Darling Basin. Final Report to the Native Fish Strategy. Murray Darling Basin Authority, Canberra.
Baumgartner, L.J., Boys, C.A., Stuart, I.G. and Zampatti, B.P. (2010). Evaluating migratory fish behaviour and fishway performance: testing a combined assessment methodology Australian Journal of Zoology 58: 154–164.
Beck, M.W., Heck Jr, K.L., Able, K.W., Childers, D.L., Eggleston, D.B., Gillanders, B.M., Halpern, B., Hays, C.G., Hoshino, K. and Minello, T.J. (2001). The identification, conservation, and management of estuarine and marine nurseries for fish and invertebrates. BioScience 51: 633–641.
Belford, D.A. and Gould, W.R. (1989). An evaluation of trout passage through six highway culverts in Montana. North American Journal of Fisheries Management 9: 437–445.
Bell, F.C. and Edwards, A.R. (1980). An environmental inventory of estuaries and coastal lagoons in New South Wales. Total Environment Centre, Sydney.
Bell, J.D., Steffe, A.S. and Westoby, M. (1988). Location of seagrass beds in estuaries: effects on associated fish and decapods. Journal of Experimental Marine Biology and Ecology 122: 127–146.
Beumer, J. (1980). Fish ladders-steps in the right direction. Wildlife in Australia 17: 38–39.
Blaber, S.J.M. (2009). Relationships between tropical coastal habitats and (offshore) fisheries. In: I. Nagelkerken (ed.). Ecological Connectivity Among Tropical Coastal Ecosystems. Spiringer, New York, pp. 533–564.
Bohnsack, J.A. and Sutherland, D.L. (1985). Artificial reef research: a review with recommendations for future priorities. Bulletin of Marine Science 37: 11–39.
Bouska, W.W. and Paukert, C.P. (2010). Road crossing designs and their impact on fish assemblages of Great Plains streams. Transactions of the American Fisheries Society 139: 214–222.
64 NSW DPI
Boys et al. Case studies in coastal fish passage remediation
Bray, J.R. and Curtis, J.T. (1957). An ordination of the upland forest communities of Southern Wisconsin. Ecological Monographs 27: 325–349.
Brewer, J.S. and Menzel, T. (2009). A method for evaluating outcomes of restoration when no reference sites exist. Restoration Ecology 17: 4–11.
Castro-Santos, T. (2005). Optimal swim speeds for traversing velocity barriers: an analysis of volitional high-speed swimming behavior of migratory fishes. Journal of Experimental Biology 208: 421.
Chambers, R.M., Meyerson, L.A. and Saltonstall, K. (1999). Expansion of Phragmites australis into tidal wetlands of North America. Aquatic Botany 64: 261–273.
Clarke, K.R. and Green, R.H. (1988). Statistical design and analysis for a 'biological effects' study. Marine Ecology Progress Series 46: 213–226.
Clarke, K.R. (1993). Non-parametric multivariate analyses of changes in community structure. Australian Journal of Ecology 18: 117–143.
Clarke, K.R. and Gorley, R.N. (2006) PRIMER v6: User manual/tutorial. PRIMER-E, Plymouth, UK.
Clarke, K.R., Somerfield, P.J. and Gorley, R.N. (2008). Testing of null hypotheses in exploratory community analyses: similarity profiles and biota-environment linkage. Journal of Experimental Marine Biology and Ecology 366: 56–69.
Clay, C.H. (1995) Design of Fishways and Other Fish Facilities, 2nd edn. Lewis Publishers, Boca Raton, Florida.
Connell, S.D. (2002). Effects of a predator and prey on a foraging reef fish: implications for understanding density-dependent growth. Journal of Fish Biology 60: 1551–1561.
de Graaf, G.J. and Xuan, T.T. (1999). Extensive shrimp farming, mangrove clearance and marine fisheries in the southern provinces of Vietnam. Mangroves and Salt Marshes 2: 159–166.
Dick, T.M. and Osunkoya, O.O. (2000). Influence of tidal restriction floodgates on decomposition of mangrove litter. Aquatic Botany 68: 273–280.
Dingle, H. and Drake, V.A. (2007). What Is Migration? BioScience 57: 113–121.
Downes, B.J., Barmuta, L.A., Fairweather, P.G., Faith, D.P., Keough, M.J., Lake, P.S., Mapstone, B.D. and Quinn, G.P. (2002) Monitoring ecological impacts: concepts and practice in flowing waters. Cambridge University Press, Cambridge.
Eberhardt, A. L., Burdick, D. M. and Dionne, M. (2010). The effects of road culverts on nekton in New England salt marshes: Implications for tidal restoration. Restoration Ecology: DOI: 10.1111/j.1526-100X.2010.00721.x.
Fahrig, L. (2003). Effects of habitat fragmentation on biodiversity. Annual Review of Ecology, Evolution, and Systematics 34: 487–515.
Fernandez, T.V., D'Anna, G., Badalamenti, F. and Pérez-Ruzafa, A. (2007). Habitat connectivity as a factor affecting fish assemblages in temperate reefs. Aquatic Biology 1: 239–248.
Fraschetti, S., Gambi, C., Giangrande, A., Musco, L., Terlizzi, A. and Danovaro, R. (2006). Structural and functional response of meiofauna rocky assemblages to sewage pollution. Marine Pollution Bulletin 52: 540–548.
NSW DPI 65
Case studies in coastal fish passage remediation Boys et al.
Gehrke, P.C., Gilligan, D.M. and Barwick, M. (2002). Changes in fish communities of the Shoalhaven River 20 years after construction of Tallowa Dam, Australia. River Research and Applications 18: 265–286.
Gibson, R.J., Haedrich, R.L. and Wernerheirn, C.M. (2005). Loss of fish habitat as a consequence of inappropriately constructed stream crossings. Fisheries 30: 10–17.
Gillanders, B.M., Able, K.W., Brown, J.A., Eggleston, D.B. and Sheridan, P.F. (2003). Evidence of connectivity between juvenile and adult habitats for mobile marine fauna: an important component of nurseries. Marine Ecology Progress Series 247: 281–295.
Gilligan, D.M., Harris, J.H. and Mallen-Cooper, M. (2003). Monitoring changes in Crawford River fish community following replacement of an ineffective fishway with a vertical-slot fishway design: Results of an eight year monitoring program. Fisheries Final Report Series No. 45. NSW Fisheries, Cronulla, 80 pp.
Golani, D. and Diamant, A. (1999). Fish colonization of an artificial reef in the Gulf of Elat, northern Red Sea. Environmental Biology of Fishes 54: 275–282.
Gordos, M., Nichols, S., Lay, C., Townsend, A., Grove, C., Walsh, S. and Copeland, C. (2007). Audit and remediation of fish passage barriers in coastal NSW. In: Proceedings of the 5th Australian Stream Management Conference. Australian rivers: making a difference. A. L. Wilson, R. L. Dehaan, R. J. Watts, K. J. Page, K. H. Bowmer and A. Curtis (eds). Charles Sturt University, Thurgoona, New South Wales.
Griffiths, S.P. (2001). Recruitment and growth of juvenile yellowfin bream, Acanthopagrus australis Günther (Sparidae), in an Australian intermittently open estuary. Journal of Applied Ichthyology 17: 240–243.
Halls, A.S., Hoggarth, D.D. and Debnath, K. (1999). Impacts of hydraulic engineering on the dynamics and production potential of floodplain fish populations in Bangladesh. Fisheries Management and Ecology 6: 261–285.
Harris, J.H. (1984a). Impoundment of coastal drainages of south-eastern Australia, and a review of its relevance to fish migration Australian Journal of Zoology 21: 235–250.
Harris, J.H. (1984b). A survey of fishways in streams of coastal South-Eastern Australia. Australian Zoology 21: 219–234.
Herke, W.H., Knudsen, E.E., Knudsen, P.A. and Rogers, B.D. (1992). Effects of semi-impoundment of Louisiana marsh on fish and crustacean nursery use and export. North American Journal of Fisheries Management 12: 151–160.
Hohausova, E., Lavoy, R.J. and Allen, M.S. (2010). Fish dispersal in a seasonal wetland: influence of anthropgenic structures. Marine and Freshwater Research 61: 682–694.
Holl, K.D. (2010). Writing for an international audience. Restoration Ecology 18: 135–137.
Hueckel, G.J., Buckley, R.M. and Benson, B.L. (1989). Mitigating rocky habitat loss using artificial reefs. Bulletin of Marine Science 44: 913–922.
Hurlbert, S.H. (1984). Pseudoreplication and the design of ecological field experiments. Ecological Monographs 54: 187–211.
Ivan, C.O., Larry, A.G., Eva, B. and Klaus, W. (2006). Environmentally induced migration: the importance of food. Ecology Letters 9: 645–651.
66 NSW DPI
Boys et al. Case studies in coastal fish passage remediation
Jellyman, D.J. (1977). Summer upstream migration of juvenile freshwater eels in New Zealand. New Zealand Journal of Marine and Freshwater Research 11: 61–71.
Jepsen, N., Aarestrup, K., Økland, F. and Rasmussen, G. (1998). Survival of radiotagged Atlantic salmon (Salmo salar L.)–and trout (Salmo trutta L.) smolts passing a reservoir during seaward migration. Hydrobiologia 371: 347–353.
Jordan, S.J., Smith, L.M. and Nestlerode, J.A. (2009). Cumulative effects of coastal habitat alterations on fishery resources: toward prediction at regional scales. Ecology and Society 14: 16.
Kahler, T.H. and Quinn, T.P. (1998) Juvenile and resident salmonid movement and passage through culverts. Washington State Dept. of Transportation, Seattle.
Kearney, R.E., Davis, K.M. and Beggs, K.E. (1999). Issues affecting the sustainability of Australia's freshwater fisheries resources and identification of research strategies. FRDC Final report No. 97/142.
Kemp, P.S. and O'Hanley, J.R. (2010). Procedures for evaluating and prioritising the removal of fish passage barriers: a synthesis. Fisheries Management and Ecology 17: 297–322.
Kowarsky, J. and Ross, A.H. (1981). Fish movement upstream through a central Queensland (Fitzroy River) coastal fishway. Australian Journal of Marine and Freshwater Research 32: 93–109.
Kroon, F.J., Bruce, A.M., Housefield, G.P. and Creese, R.G. (2004). Coastal floodplain management in eastern Australia: barriers to fish and invertebrate recruitment in acid sulphate soil catchments. Fisheries Final Report Series No. 67. NSW Department of Primary Industries, Cronulla, 212 pp.
Kroon, F.J. and Ansell, D.H. (2006). A comparison of species assemblages between drainage systems with and without floodgates: implications for coastal floodplain management. Canadian Journal of Fisheries and Aquatic Sciences 63: 2400–2417.
Kroon, F.J. and Ludwig, J. (2010). Resilience and recovery of species composition after widespread severe flooding in a coastal river. Marine and Freshwater Research 61: 86–96.
Kruskal, J.B. and Wish, M. (1978) Multidimensional Scaling. Sage Publications, London.
Lee, S.Y., Dunn, R.J.K., Young, R.A., Connolly, R.M., Dale, P.E.R., Dehayr, R., Lemckert, C.J., McKinnon, S., Powell, B., Teasdale, P.R. and Welsh, D.T. (2006). Impact of urbanization on coastal wetland structure and function. Austral Ecology 31: 149–163.
Mallen-Cooper, M. and Harris, J. (1990). Fishways in mainland south-eastern Australia. In: Proceedings of the International Symposium on Fishways '90. Japan. 221–229.
Mallen-Cooper, M. (1992). Swimming ability of juvenile Australian bass, Macquaria novemaculeata (Steindachner), and juvenile barramundi, LAtes calcarifer (Bloch), in an experimental vertical-slot fishway. Marine and Freshwater Research 43: 823–833.
Mallen-Cooper, M. (1994). Swimming ability of adult golden perch, Macquaria ambigua (Percichthyidae), and adult silver perch, Bidyanus bidyanus (Teraponidae), in an experimental vertical-slot fishway. Marine and Freshwater Research 45: 191–198.
Mallen-Cooper, M., Stuart, I.G., Hides-Pearson, F. and Harris, J.H. (1995). Fish migration in the Murray River and assessment of the Torrumbarry fishway. Final report for Natural
NSW DPI 67
Case studies in coastal fish passage remediation Boys et al.
Resources Management Stratergy. NSW Fisheries Research Institute and the Cooperative Centre for Freshwater Ecology, Sydney, 149 pp.
Manson, F.J., Loneragan, N.R., Harch, B.D., Skilleter, G.A. and Williams, L. (2005a). A broad-scale analysis of links between coastal fisheries production and mangrove extent: a case-study for northeastern Australia. Fisheries Research 74: 69–85.
Manson, F.J., Loneragan, N.R., Skilleter, G.A., Phinn, S.R. and Gibson, R.N. (2005b). An evaluation of the evidence for linkages between mangroves and fisheries: a synthesis of the literature and identification of research directions. Oceanography and Marine Biology: An Annual Review 43: 483–513.
Matthews, K.R. (1985). Species similarity and movement of fishes on natural and artificial reefs in Monterey Bay, California. Bulletin of Marine Science 37: 252–270.
McArdle, B.H. and Anderson, M.J. (2001). Fitting multivariate models to community data: a comment on distance based redundancy analysis. Ecology 82: 290–297.
Memmott, J., Cadotte, M., Hulme, P.E., Kerby, G., Milner-Gulland, E.J. and Whittingham, M.J. (2010). Putting applied ecology into practice. Journal of Applied Ecology 47: 1–4.
Meynecke, J.-O., Lee, S.Y., Duke, N.C. and Warnken, J. (2007). The relationship between fish catch and estuarine habitats in Queensland, Australia. Bulletin of Marine Science 80: 773–793.
Meynecke, J.-O., Lee, S.Y. and Duke, N.C. (2008). Linking spatial metrics and fish catch reveals the importance of coastal wetland connectivity to inshore fisheries in Queensland, Australia. Biological Conservation 141: 981–996.
Meynecke, J.-O. (2009). Coastal habitat connectivity – implications for declared fish habitat networks in Queensland, Australia. Pacific Conservation Biology 15: 96–101.
Miller, S.J. and Skilleter, G.A. (2006). Temporal variation in habitat use by nekton in a subtropical estuarine system. Journal of Experimental Marine Biology and Ecology 337: 82–95.
Morrison, M.A., Francis, M.P., Hartill, B.W. and Parkinson, D.M. (2002). Diurnal and tidal variation in the abundance of the fish fauna of a temperate tidal mudflat. Estuarine, Coastal and Shelf Science 54: 793–807.
Morton, R.M. (1990). Community structure, density and standing crop of fishes in a subtropical Australian mangrove area. Marine Biology 105: 385–394.
Nilsson, C., Reidy, C.A., Dynesius, M. and Revenga, C. (2005). Fragmentation and flow regulation of the world’s large river systems. Science 308: 405–408.
NSW Fisheries (2002). Proceedings of the NSW Fisheries Floodgate Design & Modification Workshop. Ballina, NSW, August 14th 2002. NSW Fisheries, Wollongbar, NSW. Available at: http://www.dpi.nsw.gov.au/__data/assets/pdf_file/0010/186859/floodgate-workshop.pdf.
Pease, B.C. (1999). A spatially oriented analysis of estuaries and their associated commercial fisheries in New South Wales, Australia. Fisheries Research 42: 67–86.
Pess, G.R., McHugh, M.E., Fagen, D., Stevenson, P. and Drotts, J. (1998). Stillaguamish salmonid barrier evaluation and elimination project—Phase III. Final report to the Tulalip Tribes. Northwest Indian Fisheries Commission, Olympia, 31 pp.
68 NSW DPI
Boys et al. Case studies in coastal fish passage remediation
Peterson, J.T. and Bayley, P.B. (1993). Colonization rates of fishes in experimentally defaunated warmwater streams. Transactions of the American Fisheries Society 122: 199–207.
Pethebridge, R., Lugg, A. and Harris, J.H. (1998). Obstructions to fish passage in New South Wales South Coast streams. New South Wales Final Report Series No. 4. Cooperative Research Centre for Freshwater Ecology and NSW Fisheries.
Poizat, G. and Crivelli, A.J. (1997). Use of seasonally flooded marshes by fish in a Mediterranian wetland: timing and demographic consequences. Journal of Fish Biology 51.
Pollard, D.A. and Hannan, J.C. (1994). The ecological effects of structural flood mitigation works on fish habitats and fish communities in the lower Clarence river system of south-eastern Australia. Estuaries 17: 427–461.
Pollock, B.R., Weng, H. and Morton, R.M. (1983). The seasonal occurrence of postlarval stages of yellowfin bream, Acanthopagrus australis (Guenther), and some factors affecting their movement into an estuary. Journal of Fish Biology 22: 409–415.
Pressey, R.L. and Middleton, M.J. (1982). Impacts of flood mitigation works on coastal wetlands in New South Wales. Wetlands 2: 27–44.
Raposa, K.B. and Roman, C.T. (2001). Seasonal habitat-use patterns of nekton in a tide-restricted and unrestricted New England salt marsh. Wetlands 21: 451–461.
Raposa, K.B. and Roman, C.T. (2003). Using gradients in tidal restriction to evaluate nekton community responses to salt marsh restoration. Estuaries and Coasts 26: 198–205.
Raposa, K.B. (2008). Early ecological responses to hydrologic restoration of a tidal pond and salt marsh complex in Narragansett Bay, Rhode Island. Journal of Coastal Research 55: 180–192.
Ribeiro, J., Bentes, L., Coelho, R., Gonçalves, J.M.S., Lino, P.G., Monteiro, P. and Erzini, K. (2006). Seasonal, tidal and diurnal changes in fish assemblages in the Ria Formosa lagoon (Portugal). Estuarine, Coastal and Shelf Science 67: 461–474.
Richmond, M.C., Deng, Z., Guensch, G.R., Tritico, H. and Pearson, W.H. (2007). Mean flow and turbulence characteristics of a full-scale spiral corrugated culvert with implications for fish passage. Ecological Engineering 30: 333–340.
Robinson, C.T., Tockner, K. and Ward, G.M. (2002). The fauna of dynamic riverine landscapes. Freshwater Biology 47: 661–677.
Roman, C.T., Niering, W.A. and Warren, R.S. (1984). Salt marsh vegetation change in response to tidal restriction. Environmental Management 8: 141–149.
Roni, P., Hanson, K., Beechie, T., Pess, G., Pollock, M. and Bartley, D.M. (2005). Habitat rehabilitation for inland fisheries. Global review of effectiveness and guidance for rehabilitation of freshwater ecosystems. FAO Fisheries Technical Paper 484. Food and Agriculture Organization of the United Nations, Rome.
Roy, P.S., Williams, R.J., Jones, A.R.Y.I., Gibbs, P.J., Coastes, B., West, R.J., Scanes, P.R., Hudson, J.P. and Nichol, S. (2001). Structure and function of southeast Australian estuaries. Estuarine, Coastal and Shelf Science 53: 351–384.
Ruello, N.V. (1975). Geographical distribution, growth and breeding migration of the eastern Australian king prawn Penaeus plebejus Hess. Marine and Freshwater Research 26: 343–354.
NSW DPI 69
Case studies in coastal fish passage remediation Boys et al.
Russell, D.J. (1991). Fish movements through a fishway on the tidal barrage in sub-tropical Queensland. Proceedings of the Royal Society of Queensland 101: 109–118.
Sheaves, M. (2005). Nature and consequences of biological connectivity in mangrove systems. Marine Ecology Progress Series 302: 293–305.
Sheldon, A.L. and Meffe, G.K. (1995). Short-term recolonization by fishes of experimentally defaunated pools of a coastal plain stream. Copeia 1995: 828–837.
Sheridan, P. and Hays, C. (2003). Are mangroves nursery habitat for transient fishes and decapods? Wetlands 23: 449–458.
Stewart, B.D. and Jones, G.P. (2001). Associations between the abundance of piscivorous fishes and their prey on coral reefs: implications for prey-fish mortality. Marine Biology 138: 383–397.
Strayer, D. and Findlay, S. (2010). Ecology of freshwater shore zones. Aquatic Sciences – Research Across Boundaries 72: 127–163.
Stuart, I. and Berghuis, A. (2002). Upstream passage of fish through a vertical-slot fishway in an Australian subtropical river. Fisheries Management and Ecology 9: 111–122.
Stuart, I.G. (1997). Assessment of a modified vertical-slot fishway, Fitzroy River, Queensland. Department of Primary Industries, Queensland.
Sultana, P. and Thompson, P.M. (1997). Effects of flood control and drainage on fisheries in Bangladesh and the design of mitigating measures. Regulated Rivers: Research & Management 13: 43–55.
Terlizzi, A., Bernedetti-Cecchi, L., Bevilacqua, S., Fraschetti, S., Guidetti, P. and Anderson, M.J. (2005). Multivariate and univariate assymetrical analyses in environmental impact assessment: a case study of Mediterranean subtidal sessile assemblages. Marine Ecology Progress Series 289: 27–42.
Teske, P. R., Papadopoulos, I., Zardi, G.I., McQuaid, C.D., Edkins, M.T., Griffiths, C.L. and Barker, N.P. (2007). Implications of life history for genetic structure and migration rates of southern African coastal invertebrates: planktonic, abbreviated and direct development. Marine Biology 152: 697–711.
Thorncraft, G.A. and Harris, J.H. (1996). Assessment of rock-ramp fishways. Report for the Environmental Trusts (NSW Environmental Protection Authority), Borders Rivers Commission, Department of Land and Water Resources and the Murray Darling Basin Commission. NSW Fisheries Research Institute, Cronulla.
Thorncraft, G.T. and Harris, J.H. (2000). Fish passage and fishways in New South Wales: A status report. Cooperative Research Centre for Freshwater Ecology, Canberra, 32 pp.
Tockner, K. and Stanford, J.A. (2002). Riverine flood plains: present state and future trends. Environmental Conservation 29: 308–330.
Tupper, M. and Able, K.W. (2000). Movements and food habits of striped bass (Morone saxatilis) in Delaware Bay (USA) salt marshes: comparison of a restored and a reference marsh. Marine Biology 137: 1049–1058.
Turner, R.E. (1992). Coastal wetlands and penaeid shrimp habitat. In: R. E. Stroud (ed.). Stemming the Tide of Coastal Fish Habitat Loss. National Coalition for Marine Conservation, Inc., Savannah, USA, pp. 97–104.
70 NSW DPI
Boys et al. Case studies in coastal fish passage remediation
Underwood, A.J. (1991). Beyond BACI: Experimental designs for detecting human environmental impacts on temporal variations in natural populations. Australian Journal of Marine and Freshwater Research 42: 569–587.
Valentine-Rose, L., Cherry, J.A., Jacob Culp, J., Perez, K.E., Pollock, J.B., Arrington, D.A. and Layman, C.A. (2007). Floral and faunal differences between fragmented and unfragmented Bahamian tidal creeks. Wetlands 27: 702–718.
Vinagre, C., Salgado, J., Cabral, H. and Costa, M. (2010). Food web structure and habitat connectivity in fish estuarine nurseries—Impact of river flow. Estuaries and Coasts: DOI: 10.1007/s12237-010-9315-0.
Wager, R. and Jackson, P.D. (1993). The Action Plan for Australian Freshwater Fishes. Australian Nature Conservation Agency Engangered Species Program No. 147. 122 pp., 122 pp.
Walsh, S., Copeland, C. and Waestlake, M. (2004). Major fish kills in the northern rivers of NSW in 2001: Causes, impacts & responses. Fisheries Final Report Series No. 68. NSW Department of Primary Industries Ballina, 55 pp.
Warren, M.L. and Pardew, M.G. (1998). Road crossings as barriers to small-stream fish movement. Transactions of the American Fisheries Society 127: 637–644.
Williams, K. (2000). Assessment of floodgated watercourses and drains for management improvements – Clarence river coastal floodplain. Clarence River County Council, Grafton.
Williams, R.J. and Watford, F.A. (1997). Identification of structures restricting tidal flow in New South Wales, Australia. Wetlands Ecology and Management 5: 87–97.
Zampatti, B., Coster, W., Crook, D., Conallin, A. and Cant, B. (2002). Assessment of the rock-ramp fishway at Dights Falls, lower Yarra River, Melbourne. A report to the Catchment and Water Division, Department of Natural Resources and Environment. Freshwater Ecology Section, Arthur Rylah Institute for Environmental Research, Heidelberg, 27 pp.
71 Other titles in the series
Case studies in coastal fish passage remediation Boys et al.
Other titles in this series: ISSN 1440-3544 (NSW Fisheries Final Report Series) No. 1 Andrew, N.L., Graham, K.J., Hodgson, K.E. and Gordon, G.N.G., 1998. Changes after 20 years in relative
abundance and size composition of commercial fishes caught during fishery independent surveys on SEF trawl grounds.
No. 2 Virgona, J.L., Deguara, K.L., Sullings, D.J., Halliday, I. and Kelly, K., 1998. Assessment of the stocks of sea mullet in New South Wales and Queensland waters.
No. 3 Stewart, J., Ferrell, D.J. and Andrew, N.L., 1998. Ageing Yellowtail (Trachurus novaezelandiae) and Blue Mackerel (Scomber australasicus) in New South Wales.
No. 4 Pethebridge, R., Lugg, A. and Harris, J., 1998. Obstructions to fish passage in New South Wales South Coast streams. 70pp.
No. 5 Kennelly, S.J. and Broadhurst, M.K., 1998. Development of by-catch reducing prawn-trawls and fishing practices in NSW's prawn-trawl fisheries (and incorporating an assessment of the effect of increasing mesh size in fish trawl gear). 18pp + appendices.
No. 6 Allan, G.L. and Rowland, S.J., 1998. Fish meal replacement in aquaculture feeds for silver perch. 237pp + appendices.
No. 7 Allan, G.L., 1998. Fish meal replacement in aquaculture feeds: subprogram administration. 54pp + appendices.
No. 8 Heasman, M.P., O'Connor, W.A. and O'Connor, S.J., 1998. Enhancement and farming of scallops in NSW using hatchery produced seedstock. 146pp.
No. 9 Nell, J.A., McMahon, G.A. and Hand, R.E., 1998. Tetraploidy induction in Sydney rock oysters. 25pp. No. 10 Nell, J.A. and Maguire, G.B., 1998. Commercialisation of triploid Sydney rock and Pacific oysters. Part 1:
Sydney rock oysters. 122pp. No. 11 Watford, F.A. and Williams, R.J., 1998. Inventory of estuarine vegetation in Botany Bay, with special
reference to changes in the distribution of seagrass. 51pp. No. 12 Andrew, N.L., Worthington D.G., Brett, P.A. and Bentley N., 1998. Interactions between the abalone fishery
and sea urchins in New South Wales. No. 13 Jackson, K.L. and Ogburn, D.M., 1999. Review of depuration and its role in shellfish quality assurance. 77pp. No. 14 Fielder, D.S., Bardsley, W.J. and Allan, G.L., 1999. Enhancement of Mulloway (Argyrosomus japonicus) in
intermittently opening lagoons. 50pp + appendices. No. 15 Otway, N.M. and Macbeth, W.G., 1999. The physical effects of hauling on seagrass beds. 86pp. No. 16 Gibbs, P., McVea, T. and Louden, B., 1999. Utilisation of restored wetlands by fish and invertebrates. 142pp. No. 17 Ogburn, D. and Ruello, N., 1999. Waterproof labelling and identification systems suitable for shellfish and
other seafood and aquaculture products. Whose oyster is that? 50pp. No. 18 Gray, C.A., Pease, B.C., Stringfellow, S.L., Raines, L.P. and Walford, T.R., 2000. Sampling estuarine fish
species for stock assessment. Includes appendices by D.J. Ferrell, B.C. Pease, T.R. Walford, G.N.G. Gordon, C.A. Gray and G.W. Liggins. 194pp.
No. 19 Otway, N.M. and Parker, P.C., 2000. The biology, ecology, distribution, abundance and identification of marine protected areas for the conservation of threatened Grey Nurse Sharks in south east Australian waters. 101pp.
No. 20 Allan, G.L. and Rowland, S.J., 2000. Consumer sensory evaluation of silver perch cultured in ponds on meat meal based diets. 21pp + appendices.
No. 21 Kennelly, S.J. and Scandol, J. P., 2000. Relative abundances of spanner crabs and the development of a population model for managing the NSW spanner crab fishery. 43pp + appendices.
No. 22 Williams, R.J., Watford, F.A. and Balashov, V., 2000. Kooragang Wetland Rehabilitation Project: History of changes to estuarine wetlands of the lower Hunter River. 82pp.
No. 23 Survey Development Working Group, 2000. Development of the National Recreational and Indigenous Fishing Survey. Final Report to Fisheries Research and Development Corporation. (Volume 1 – 36pp + Volume 2 – attachments).
No.24 Rowling, K.R and Raines, L.P., 2000. Description of the biology and an assessment of the fishery of Silver Trevally Pseudocaranx dentex off New South Wales. 69pp.
No. 25 Allan, G.L., Jantrarotai, W., Rowland, S., Kosuturak, P. and Booth, M., 2000. Replacing fishmeal in aquaculture diets. 13pp.
No. 26 Gehrke, P.C., Gilligan, D.M. and Barwick, M., 2001. Fish communities and migration in the Shoalhaven River – Before construction of a fishway. 126pp.
Other titles in the series 72
Boys et al. Case studies in coastal fish passage remediation
No. 27 Rowling, K.R. and Makin, D.L., 2001. Monitoring of the fishery for Gemfish Rexea solandri, 1996 to 2000. 44pp.
No. 28 Otway, N.M., 1999. Identification of candidate sites for declaration of aquatic reserves for the conservation of rocky intertidal communities in the Hawkesbury Shelf and Batemans Shelf Bioregions. 88pp.
No. 29 Heasman, M.P., Goard, L., Diemar, J. and Callinan, R., 2000. Improved Early Survival of Molluscs: Sydney Rock Oyster (Saccostrea glomerata). 63pp.
No. 30 Allan, G.L., Dignam, A and Fielder, S., 2001. Developing Commercial Inland Saline Aquaculture in Australia: Part 1. R&D Plan.
No. 31 Allan, G.L., Banens, B. and Fielder, S., 2001. Developing Commercial Inland Saline Aquaculture in Australia: Part 2. Resource Inventory and Assessment. 33pp.
No. 32 Bruce, A., Growns, I. and Gehrke, P., 2001. Woronora River Macquarie Perch Survey. 116pp. No. 33 Morris, S.A., Pollard, D.A., Gehrke, P.C. and Pogonoski, J.J., 2001. Threatened and Potentially Threatened
Freshwater Fishes of Coastal New South Wales and the Murray-Darling Basin. 177pp. No. 34 Heasman, M.P., Sushames, T.M., Diemar, J.A., O’Connor, W.A. and Foulkes, L.A., 2001. Production of
Micro-algal Concentrates for Aquaculture Part 2: Development and Evaluation of Harvesting, Preservation, Storage and Feeding Technology. 150pp + appendices.
No. 35 Stewart, J. and Ferrell, D.J., 2001. Mesh selectivity in the NSW demersal trap fishery. 86pp. No. 36 Stewart, J., Ferrell, D.J., van der Walt, B., Johnson, D. and Lowry, M., 2001. Assessment of length and age
composition of commercial kingfish landings. 49pp. No. 37 Gray, C.A. and Kennelly, S.J., 2001. Development of discard-reducing gears and practices in the estuarine
prawn and fish haul fisheries of NSW. 151pp. No. 38 Murphy, J.J., Lowry, M.B., Henry, G.W. and Chapman, D., 2002. The Gamefish Tournament Monitoring
Program – 1993 to 2000. 93pp. No. 39 Kennelly, S.J. and McVea, T.A. (Ed), 2002. Scientific reports on the recovery of the Richmond and Macleay
Rivers following fish kills in February and March 2001. 325pp. No. 40 Pollard, D.A. and Pethebridge, R.L., 2002. Report on Port of Botany Bay Introduced Marine Pest Species
Survey. 69pp. No. 41 Pollard, D.A. and Pethebridge, R.L., 2002. Report on Port Kembla Introduced Marine Pest Species Survey.
72pp. No. 42 O’Connor, W.A, Lawler, N.F. and Heasman, M.P., 2003. Trial farming the akoya pearl oyster, Pinctada
imbricata, in Port Stephens, NSW. 170pp. No. 43 Fielder, D.S. and Allan, G.L., 2003. Improving fingerling production and evaluating inland saline water
culture of snapper, Pagrus auratus. 62pp. No. 44 Astles, K.L., Winstanley, R.K., Harris, J.H. and Gehrke, P.C., 2003. Experimental study of the effects of cold
water pollution on native fish. 55pp. No. 45 Gilligan, D.M., Harris, J.H. and Mallen-Cooper, M., 2003. Monitoring changes in the Crawford River fish
community following replacement of an effective fishway with a vertical-slot fishway design: Results of an eight year monitoring program. 80pp.
No. 46 Pollard, D.A. and Rankin, B.K., 2003. Port of Eden Introduced Marine Pest Species Survey. 67pp. No. 47 Otway, N.M., Burke, A.L., Morrison, NS. and Parker, P.C., 2003. Monitoring and identification of NSW
Critical Habitat Sites for conservation of Grey Nurse Sharks. 62pp. No. 48 Henry, G.W. and Lyle, J.M. (Ed), 2003. The National Recreational and Indigenous Fishing Survey. 188 pp. No. 49 Nell, J.A., 2003. Selective breeding for disease resistance and fast growth in Sydney rock oysters. 44pp. (Also
available – a CD-Rom published in March 2004 containing a collection of selected manuscripts published over the last decade in peer-reviewed journals).
No. 50 Gilligan, D. and Schiller, S., 2003. Downstream transport of larval and juvenile fish. 66pp. No. 51 Liggins, G.W., Scandol, J.P. and Kennelly, S.J., 2003. Recruitment of Population Dynamacist. 44pp. No. 52 Steffe, A.S. and Chapman, J.P., 2003. A survey of daytime recreational fishing during the annual period,
March 1999 to February 2000, in Lake Macquarie, New South Wales. 124pp. No. 53 Barker, D. and Otway, N., 2003. Environmental assessment of zinc coated wire mesh sea cages in Botany
Bay NSW. 36pp. No. 54 Growns, I., Astles, A. and Gehrke, P., 2003. Spatial and temporal variation in composition of riverine fish
communities. 24pp. No. 55 Gray, C. A., Johnson, D.D., Young, D.J. and Broadhurst, M. K., 2003. Bycatch assessment of the Estuarine
Commercial Gill Net Fishery in NSW. 58pp.
73 Other titles in the series
Case studies in coastal fish passage remediation Boys et al.
No. 56 Worthington, D.G. and Blount, C., 2003. Research to develop and manage the sea urchin fisheries of NSW and eastern Victoria. 182pp.
No. 57 Baumgartner, L.J., 2003. Fish passage through a Deelder lock on the Murrumbidgee River, Australia. 34pp. No. 58 Allan, G.L., Booth, M.A., David A.J. Stone, D.A.J. and Anderson, A.J., 2004. Aquaculture Diet Development
Subprogram: Ingredient Evaluation. 171pp. No. 59 Smith, D.M., Allan, G.L. and Booth, M.A., 2004. Aquaculture Diet Development Subprogram: Nutrient
Requirements of Aquaculture Species. 220pp. No. 60 Barlow, C.G., Allan, G.L., Williams, K.C., Rowland, S.J. and Smith, D.M., 2004. Aquaculture Diet
Development Subprogram: Diet Validation and Feeding Strategies. 197pp. No. 61 Heasman, M.H., 2004. Sydney Rock Oyster Hatchery Workshop 8 – 9 August 2002, Port Stephens, NSW.
115pp. No. 62 Heasman, M., Chick, R., Savva, N., Worthington, D., Brand, C., Gibson, P. and Diemar, J., 2004.
Enhancement of populations of abalone in NSW using hatchery-produced seed. 269pp. No. 63 Otway, N.M. and Burke, A.L., 2004. Mark-recapture population estimate and movements of Grey Nurse
Sharks. 53pp. No. 64 Creese, R.G., Davis, A.R. and Glasby, T.M., 2004. Eradicating and preventing the spread of the invasive alga
Caulerpa taxifolia in NSW. 110pp. No. 65 Baumgartner, L.J., 2004. The effects of Balranald Weir on spatial and temporal distributions of lower
Murrumbidgee River fish assemblages. 30pp. No. 66 Heasman, M., Diggles, B.K., Hurwood, D., Mather, P., Pirozzi, I. and Dworjanyn, S., 2004. Paving the way
for continued rapid development of the flat (angasi) oyster (Ostrea angasi) farming in New South Wales. 40pp.
ISSN 1449-9967 (NSW Department of Primary Industries – Fisheries Final Report Series) No. 67 Kroon, F.J., Bruce, A.M., Housefield, G.P. and Creese, R.G., 2004. Coastal floodplain management in eastern
Australia: barriers to fish and invertebrate recruitment in acid sulphate soil catchments. 212pp. No. 68 Walsh, S., Copeland, C. and Westlake, M., 2004. Major fish kills in the northern rivers of NSW in 2001:
Causes, Impacts & Responses. 55pp. No. 69 Pease, B.C. (Ed), 2004. Description of the biology and an assessment of the fishery for adult longfinned eels
in NSW. 168pp. No. 70 West, G., Williams, R.J. and Laird, R., 2004. Distribution of estuarine vegetation in the Parramatta River and
Sydney Harbour, 2000. 37pp. No. 71 Broadhurst, M.K., Macbeth, W.G. and Wooden, M.E.L., 2005. Reducing the discarding of small prawns in
NSW's commercial and recreational prawn fisheries. 202pp. No. 72. Graham, K.J., Lowry, M.B. and Walford, T.R., 2005. Carp in NSW: Assessment of distribution, fishery and
fishing methods. 88pp. No. 73 Stewart, J., Hughes, J.M., Gray, C.A. and Walsh, C., 2005. Life history, reproductive biology, habitat use and
fishery status of eastern sea garfish (Hyporhamphus australis) and river garfish (H. regularis ardelio) in NSW waters. 180pp.
No. 74 Growns, I. and Gehrke, P., 2005. Integrated Monitoring of Environmental Flows: Assessment of predictive modelling for river flows and fish. 33pp.
No. 75 Gilligan, D., 2005. Fish communities of the Murrumbidgee catchment: Status and trends. 138pp. No. 76 Ferrell, D.J., 2005. Biological information for appropriate management of endemic fish species at Lord Howe
Island. 18 pp. No. 77 Gilligan, D., Gehrke, P. and Schiller, C., 2005. Testing methods and ecological consequences of large-scale
removal of common carp. 46pp. No. 78 Boys, C.A., Esslemont, G. and Thoms, M.C., 2005. Fish habitat and protection in the Barwon-Darling and
Paroo Rivers. 118pp. No. 79 Steffe, A.S., Murphy, J.J., Chapman, D.J. and Gray, C.C., 2005. An assessment of changes in the daytime
recreational fishery of Lake Macquarie following the establishment of a ‘Recreational Fishing Haven’. 103pp. No. 80 Gannassin, C. and Gibbs, P., 2005. Broad-Scale Interactions Between Fishing and Mammals, Reptiles and
Birds in NSW Marine Waters. 171pp. No. 81 Steffe, A.S., Murphy, J.J., Chapman, D.J., Barrett, G.P. and Gray, C.A., 2005. An assessment of changes in
the daytime, boat-based, recreational fishery of the Tuross Lake estuary following the establishment of a 'Recreational Fishing Haven'. 70pp.
Other titles in the series 74
Boys et al. Case studies in coastal fish passage remediation
No. 82 Silberschnieder, V. and Gray, C.A., 2005. Arresting the decline of the commercial and recreational fisheries for mulloway (Argyrosomus japonicus). 71pp.
No. 83 Gilligan, D., 2005. Fish communities of the Lower Murray-Darling catchment: Status and trends. 106pp. No. 84 Baumgartner, L.J., Reynoldson, N., Cameron, L. and Stanger, J., 2006. Assessment of a Dual-frequency
Identification Sonar (DIDSON) for application in fish migration studies. 33pp. No. 85 Park, T., 2006. FishCare Volunteer Program Angling Survey: Summary of data collected and
recommendations. 41pp. No. 86 Baumgartner, T., 2006. A preliminary assessment of fish passage through a Denil fishway on the Edward
River, Australia. 23pp. No. 87 Stewart, J., 2007. Observer study in the Estuary General sea garfish haul net fishery in NSW. 23pp. No. 88 Faragher, R.A., Pogonoski, J.J., Cameron, L., Baumgartner, L. and van der Walt, B., 2007. Assessment of a
stocking program: Findings and recommendations for the Snowy Lakes Trout Strategy. 46pp. No. 89 Gilligan, D., Rolls, R., Merrick, J., Lintermans, M., Duncan, P. and Kohen, J., 2007. Scoping knowledge
requirements for Murray crayfish (Euastacus armatus). Final report to the Murray Darling Basin Commission for Project No. 05/1066 NSW 103pp.
No. 90 Kelleway, J., Williams. R.J. and Allen, C.B., 2007. An assessment of the saltmarsh of the Parramatta River and Sydney Harbour. 100pp.
No. 91 Williams, R.J. and Thiebaud, I., 2007. An analysis of changes to aquatic habitats and adjacent land-use in the downstream portion of the Hawkesbury Nepean River over the past sixty years. 97pp.
No. 92 Baumgartner, L., Reynoldson, N., Cameron, L. and Stanger, J. The effects of selected irrigation practices on fish of the Murray-Darling Basin. 90pp.
No. 93 Rowland, S.J., Landos, M., Callinan, R.B., Allan, G.L., Read, P., Mifsud, C., Nixon, M., Boyd, P. and Tally, P., 2007. Development of a health management strategy for the Silver Perch Aquaculture Industry. 219pp.
No. 94 Park, T., 2007. NSW Gamefish Tournament Monitoring – Angling Research Monitoring Program. Final report to the NSW Recreational Fishing Trust. 142pp.
No. 95 Heasman, M.P., Liu, W., Goodsell, P.J., Hurwood D.A. and Allan, G.L., 2007. Development and delivery of technology for production, enhancement and aquaculture of blacklip abalone (Haliotis rubra) in New South Wales. 226pp.
No. 96 Ganassin, C. and Gibbs, P.J., 2007. A review of seagrass planting as a means of habitat compensation following loss of seagrass meadow. 41pp.
No. 97 Stewart, J. and Hughes, J., 2008. Determining appropriate harvest size at harvest for species shared by the commercial trap and recreational fisheries in New South Wales. 282pp.
No. 98 West, G. and Williams, R.J., 2008. A preliminary assessment of the historical, current and future cover of seagrass in the estuary of the Parramatta River. 61pp.
No. 99 Williams, D.L. and Scandol, J.P., 2008. Review of NSW recreational fishing tournament-based monitoring methods and datasets. 83pp.
No. 100 Allan, G.L., Heasman, H. and Bennison, S., 2008. Development of industrial-scale inland saline aquaculture: Coordination and communication of R&D in Australia. 245pp.
No. 101 Gray, C.A and Barnes, L.M., 2008. Reproduction and growth of dusky flathead (Platycephalus fuscus) in NSW estuaries. 26pp.
No. 102 Graham, K.J., 2008. The Sydney inshore trawl-whiting fishery: codend selectivity and fishery characteristics. 153pp.
No. 103 Macbeth, W.G., Johnson, D.D. and Gray, C.A., 2008. Assessment of a 35-mm square-mesh codend and composite square-mesh panel configuration in the ocean prawn-trawl fishery of northern New South Wales. 104pp.
No. 104 O’Connor, W.A., Dove, M. and Finn, B., 2008. Sydney rock oysters: Overcoming constraints to commercial scale hatchery and nursery production. 119pp.
No. 105 Glasby, T.M. and Lobb, K., 2008. Assessing the likelihoods of marine pest introductions in Sydney estuaries: A transport vector approach. 84pp.
No. 106 Rotherham, D., Gray, C.A., Underwood, A.J., Chapman, M.G. and Johnson, D.D., 2008. Developing fishery-independent surveys for the adaptive management of NSW’s estuarine fisheries. 135pp.
No. 107 Broadhurst, M., 2008. Maximising the survival of bycatch discarded from commercial estuarine fishing gears in NSW. 192pp.
No. 108 Gilligan, D., McLean, A. and Lugg, A., 2009. Murray Wetlands and Water Recovery Initiatives: Rapid assessment of fisheries values of wetlands prioritised for water recovery. 69pp.
No. 109 Williams, R.J. and Thiebaud, I., 2009. Occurrence of freshwater macrophytes in the catchments of the Parramatta River, Lane Cove River and Middle Harbour Creek, 2007 – 2008. 75pp.
75 Other titles in the series
Case studies in coastal fish passage remediation Boys et al.
No. 110 Gilligan, D., Vey, A. and Asmus, M., 2009. Identifying drought refuges in the Wakool system and assessing status of fish populations and water quality before, during and after the provision of environmental, stock and domestic flows. 56pp.
ISSN 1837-2112 (Industry & Investment NSW – Fisheries Final Report Series) No. 111 Gray, C.A., Scandol. J.P., Steffe, A.S. and Ferrell, D.J., 2009. Australian Society for Fish Biology Annual
Conference & Workshop 2008: Assessing Recreational Fisheries; Current and Future Challenges. 54pp. No. 112 Otway, N.M. Storrie, M.T., Louden, B.M. and Gilligan, J.J., 2009. Documentation of depth-related migratory
movements, localised movements at critical habitat sites and the effects of scuba diving for the east coast grey nurse shark population. 90pp.
No. 113 Creese, R.G., Glasby, T.M., West, G. and Gallen, C., 2009. Mapping the habitats of NSW estuaries. 95pp. No. 114 Macbeth, W.G., Geraghty, P.T., Peddemors, V.M. and Gray, C.A., 2009. Observer-based study of targeted
commercial fishing for large shark species in waters off northern New South Wales. 82pp. No. 115 Scandol, J.P., Ives, M.C. and Lockett, M.M., 2009. Development of national guidelines to improve the
application of risk-based methods in the scope, implementation and interpretation of stock assessments for data-poor species. 186pp.
No. 116 Baumgartner, L., Bettanin, M., McPherson, J., Jones, M., Zampatti, B. and Kathleen Beyer., 2009. Assessment of an infrared fish counter (Vaki Riverwatcher) to quantify fish migrations in the Murray-Darling Basin. 47pp.
No. 117 Astles, K., West, G., and Creese, R.G., 2010. Estuarine habitat mapping and geomorphic characterisation of the Lower Hawkesbury river and Pittwater estuaries. 229pp.
No. 118 Gilligan, D., Jess, L., McLean, G., Asmus, M., Wooden, I., Hartwell, D., McGregor, C., Stuart, I., Vey, A., Jefferies, M., Lewis, B. and Bell, K., 2010. Identifying and implementing targeted carp control options for the Lower Lachlan Catchment. 126pp.
No. 119 Montgomery, S.S., Walsh, C.T., Kesby, C.L and Johnson, D.D., 2010. Studies on the growth and mortality of school prawns. 90pp.
No. 120 Liggins, G.W. and Upston, J., 2010. Investigating and managing the Perkinsus-related mortality of blacklip abalone in NSW. 182pp.
No. 121 Knight, J., 2010. The feasibility of excluding alien redfin perch from Macquarie perch habitat in the Hawkesbury-Nepean Catchment. 53pp.
No. 122 Ghosn, D., Steffe, A., Murphy, J., 2010. An assessment of the effort and catch of shore and boat-based recreational fishers in the Sydney Harbour estuary over the 2007/08 summer period. 60pp.
No. 123 Rourke, M. and Gilligan, D., 2010. Population genetic structure of freshwater catfish (Tandanus tandanus) in the Murray-Darling Basin and coastal catchments of New South Wales: Implications for future re-stocking programs. 74pp.
No. 124 Tynan, R., Bunter, K. and O’Connor, W., 2010. Industry Management and Commercialisation of the Sydney Rock Oyster Breeding Program. 21pp.
No. 125 Lowry, M., Folpp, H., Gregson, M. and McKenzie, R., 2010. Assessment of artificial reefs in Lake Macquarie NSW. 47pp.
No. 126 Howell, T. and Creese, R., 2010. Freshwater fish communities of the Hunter, Manning, Karuah and Macquarie-Tuggerah catchments: a 2004 status report. 93pp.
No. 127 Gilligan, D., Rodgers, M., McGarry, T., Asmus, M. and Pearce, L., 2010. The distribution and abundance of two endangered fish species in the NSW Upper Murray Catchment. 34pp.
No. 128 Gilligan, D., McGarry, T. and Carter, S., 2010. A scientific approach to developing habitat rehabilitation strategies in aquatic environments: A case study on the endangered Macquarie perch (Macquaria australasica) in the Lachlan catchment. 61pp.
No. 129 Stewart, J., Hughes, J., McAllister, J., Lyle, J. and MacDonald, M., 2011. Australian salmon (Arripis trutta): Population structure, reproduction, diet and composition of commercial and recreational catches. 257 pp.
ISSN 1837-2112 (Fisheries Final Report Series) No. 130 Boys, C., Glasby, T., Kroon, F., Baumgartner, L., Wilkinson, K., Reilly, G. and Fowler, T., 2011. Case
studies in restoring connectivity of coastal aquatic habitats: floodgates, box culvert and rock-ramp fishway. 75pp.