Embed Size (px)
Citation preview
AbstractThis paper presents case histories in the application of vadose zone profiling to support the assessment of vapor intrusion potential at field sites. The case histories focus on how detailed characterization of the vadose zone and phreatic zone can support screening of sites for vapor intrusion potential. In some cases, these data can be used to rule out vapor intrusion and in others used in supporting a quantitative assessment of vapor intrusion potential founded on the concepts of mass flux to assist with initial planning for structure sampling.
The following sections will provide an overview of the scientific basis for the field and laboratory programs and review data and observations from detailed characterization at multiple sites located in varying settings in the northeast, the mid-Atlantic, and mid-west.
In several of these cases, the vadose zone profiling data were used to guide later structure sampling or rule out vapor intrusion as a concern despite substantial source concentrations of volatile organic compounds (VOCs) in groundwater. Vapor intrusion was ruled out through multiple lines of evidence including physical characterization of lithology and physical properties of both soil and rock including, but not limited to, texture, fracturing, and moisture combined with vertical groundwater profiling, and multilevel soil gas monitoring.
IntroductionCharacterization of the vadose zone at sites under investigation for vapor intrusion can be focused on whether conditions are conducive to or limiting to subsurface vapor transport (20101). This work is founded on programs of logging and sampling with lab testing for the physical properties of soil or rock materials and the development of site-specific estimates of parameters relevant to subsurface vapor transport. Analysis of soil and rock for VOCs has also proven valuable. When combined with multilevel gas monitoring and/or analysis of whole soil or rock samples, the data allow for quantitative evaluation of vapor transport by documenting concentration gradients that drive diffusive transport.
Diffusion is the process by which a mass moves from an area of higher concentration to lower concentration as a result of the concentration gradients. A growing body of evidence from multiple sites suggests that the rate of mass transfer at sites is often controlled by molecular diffusion. Fick’s law states that the mass flux, or mass transfer rate per unit area, is proportional to the concentration gradient times an “effective diffusion” term (Deff).
The term Deff is used to distinguish diffusion through a porous media that is influenced by the presence of solid, liquid, and gas phases from free phase diffusion. An example of the relationship between water saturation (Sw) and Deff for several types of soil as estimated using the Millington equation as presented by McWhorter2 is shown on Figure 1.
Case Histories in Vadose Zone Profiling: Value of Exterior Explorations to Assess Vapor Intrusion PotentialSanborn, Head & Associates, Inc., 20 Foundry St., Concord, NH 03301 Contact: Bradley A. Green, P.G., [email protected] or Erica Bosse, P.G., [email protected]
2Case Histories in Vadose Zone Profiling: Value of Exterior Explorations to Assess Vapor Intrusion Potential
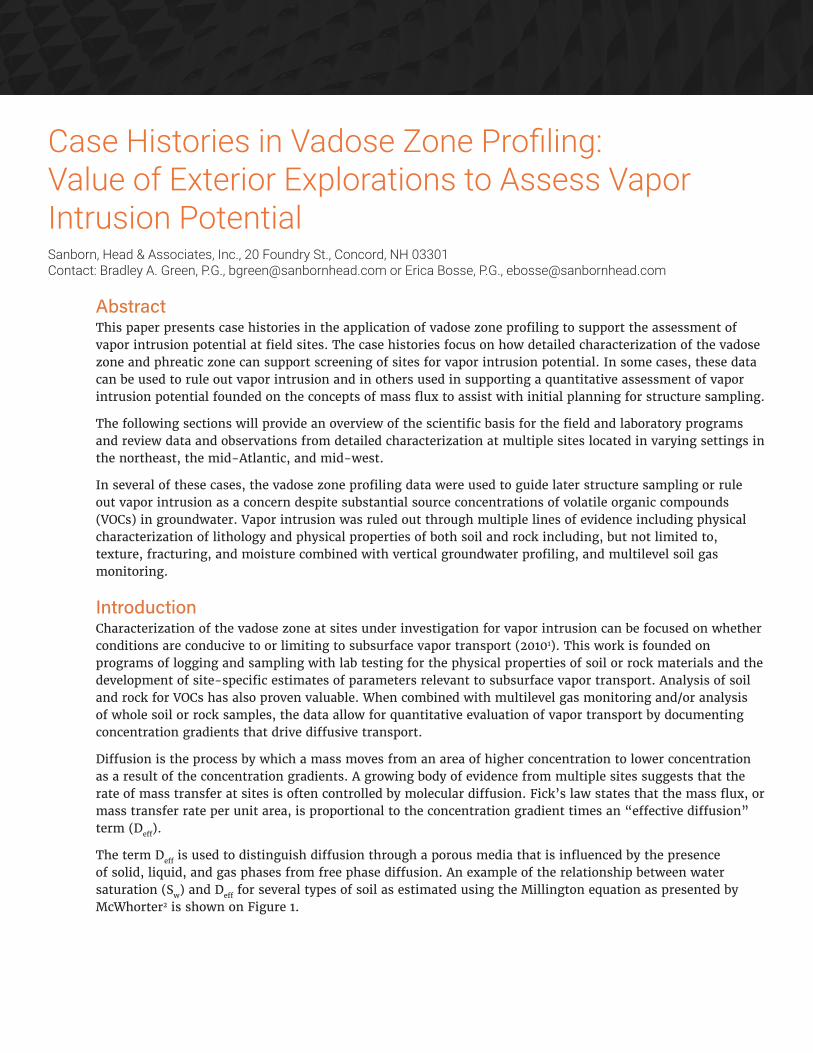
The graphic shows that for a given soil, Deff can vary by about three orders of magnitude depending on moisture content that is not constant in space and time. At pore saturations of greater than 60%, the effectiveness of diffusion declines steeply. Even very small scale heterogeneities that result in high moisture saturation may largely limit subsurface vapor migration and hence limit vapor intrusion potential.
Simplified modeling of vadose zone processes and direct measurements collected during investigation and mitigation of buildings equipped with heating ventilation and air conditioning (HVAC) air handling units have established the value of evaluating vapor intrusion data on the basis of mass flux3,4. By directly measuring air flows and hence building air exchange rates, indoor air concentrations can be used to derive estimates of VOC mass flux.
Units of flux are in micrograms per square meter of building footprint per day (µg/m2-day). Figure 2 depicts a graphic indicating that for residential structures with less than one air exchange per hour, and indoor air target values of about a microgram per cubic meter (µg/m3), a case can be made that a VOC mass flux of 10 µg/m2-day or greater is a threshold of significance where the vapor intrusion pathway may be completed.
Figure 2 - Model-predicted decline in upward VOC mass flux at foundation depth in response to instantaneous
groundwater cleanup (from Carr and Shea, 20124)
Figure 1 - Effective Diffusion as a Function of Water Saturation
3
Applied with high resolution, vadose zone profiling involves continuous sampling of vadose zone materials, preferably using methods that would retrieve minimally disturbed samples. Depending on lithology, the proper scale of sampling and laboratory analysis may be on the order of feet or less, informed by detailed field logging of texture, moisture, and fracturing. The focus is on identifying and quantifying conditions either conducive or limiting to vapor transport.
Wet soils near the water table within the capillary fringe and at capillary barriers at contacts between finer and coarser soil horizons limit vapor transport by both diffusion and advection. The position of “limiting layers” relative to foundation depth has been found to be important in assessing site conditions. This is consistent with the findings of an assessment by Johnson5 that identified soil conditions and the effective diffusion profile are among the critical parameters influencing vapor intrusion. A recent paper presenting the findings of numerical modeling of subsurface processes related to vapor intrusion by Yu.6, documented the importance of the thickness and texture of the capillary fringe and transient processes to VOC mass transfer and vapor intrusion outcomes.
Case HistoriesThe case histories described below present approaches to and results from detailed vadose zone characterization at various locations across the country under differing regulatory and geologic settings.
Northwest IllinoisThe project site is located in a rural community near and upgradient of the Mississippi River. Nearby residential, light industrial and commercial properties located west and north of the facility are underlain by a chlorinated VOCs (CVOCs) presence in groundwater between the source and the river. The investigative area is underlain primarily by granular aeolian and outwash deposits overlying a silt clay aquitard. The water table encountered at approximately 10 feet below ground. Given the potential for silt-rich aeolian deposits in the vadose zone to limit vapor transport, vadose zone and groundwater profiling were proposed as a part of due diligence work related to assessing vapor intrusion exposure prior to a property transaction.
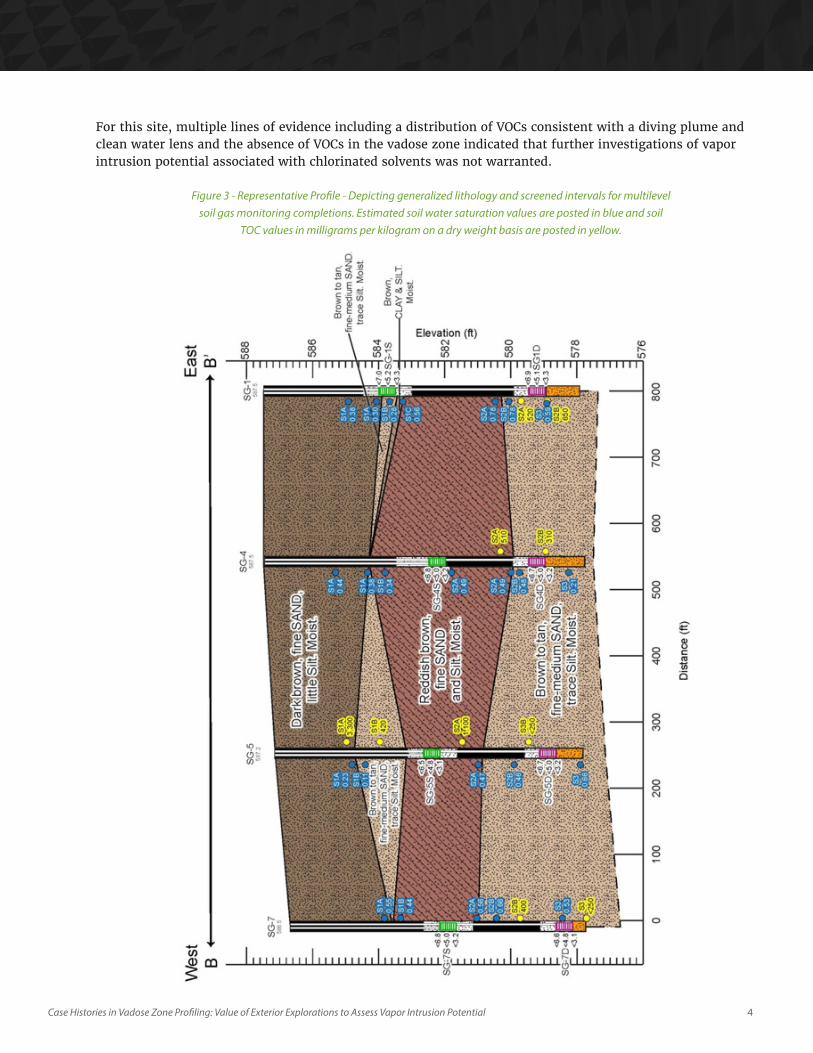
The work included continuous detailed logging of vadose zone and phreatic zone soil conditions, laboratory testing of soil physical properties, and the installation and sampling of multilevel soil vapor monitoring devices. As shown on Figure 3, paired soil gas implants were installed at depths just above the water table and at a nominal “foundation depth” of 5 feet below ground proximal to existing monitoring well locations. As indicated by prior characterization, aeolian silt-rich granular soil was encountered at all the drilling locations at depths of approximate 3 to 7 feet below ground surface, in some cases extending to the ground surface as shown on Figure 3. The water table and capillary fringe were found to be just below to within the silty aeolian soils. Given silt content, the capillary fringe may be on the order of several feet in thickness.
The vadose zone silt soils were estimated to be over 40 to 78 percent (%) saturated by water as shown by blue numbering on Figure 3, conditions that would limit transport via both diffusion and advection. The vadose zone soils within and near the monitoring zones exhibited modest to high potential for sorption of CVOCs with TOC values ranging up to several thousand milligrams per kilogram (mg/kg). Consistent with the indicated presence of a clean water lens above the CVOC plume, CVOCs were not detected in repeated samplings of multilevel soil gas installations near water table and foundation depth. With detection limits on the order of 5 µg/m3 and the potential for the soils to sorb CVOC mass, the data also support that CVOC transport across the vadose zone would not have been likely under past conditions. More simply put, if CVOCs had transported through the vadose zone under past conditions, they would likely be still detectable given sorption and desorption from vadose zone soils. Aromatic hydrocarbons consistent with petroleum were found at higher concentrations near ground surface, consistent with localized releases of petroleum unrelated to the industrial site use.
Case Histories in Vadose Zone Profiling: Value of Exterior Explorations to Assess Vapor Intrusion Potential
4Case Histories in Vadose Zone Profiling: Value of Exterior Explorations to Assess Vapor Intrusion Potential
For this site, multiple lines of evidence including a distribution of VOCs consistent with a diving plume and clean water lens and the absence of VOCs in the vadose zone indicated that further investigations of vapor intrusion potential associated with chlorinated solvents was not warranted.
Figure 3 - Representative Profile - Depicting generalized lithology and screened intervals for multilevel soil gas monitoring completions. Estimated soil water saturation values are posted in blue and soil
TOC values in milligrams per kilogram on a dry weight basis are posted in yellow.
5Case Histories in Vadose Zone Profiling: Value of Exterior Explorations to Assess Vapor Intrusion Potential
Central New JerseyThis case history involved profiling of vadose zone conditions about 600 feet downgradient of a legacy chlorinated solvent site. Groundwater extraction and treatment had largely abated the off-site groundwater plume. However, at one location, tetrachloroethene (PCE) concentrations in water samples from a fully screened well remained near the vapor intrusion Groundwater Screening Level (GWSL) of 1 microgram per liter (µg/L) established by the New Jersey Department of Environmental Protection (NJDEP). New Jersey is one of the few states that with guidance7 that encourages characterization of vadose zone conditions to support a site specific conceptual model and analytical modeling.
Absent site-specific information, the NJDEP vapor intrusion guidance (NJ VIG) GWSLs are developed based on conservative modeling assuming:
- A 5 foot thick vadose zone composed of well sorted sand, at 19% Sw; and
- A capillary fringe thickness of approximately 0.5 feet (ft) and 78% Sw.
The NJ VIG allows for development of site-specific GWSL through application of a one-layer constrained version of the Johnson & Ettinger (J&E) model8wherein the principal or dominant soil texture, depth to groundwater, and VOCs of concern can be changed, but no other parameter can be adjusted.
Historical data for the profiling location indicated that the groundwater table was found at 25 to 40 ft below the ground surface associated with a 20 to 30 ft thick “upper” aquifer. Records indicated that the vadose zone consisted of stratified inter-bedded intervals of well sorted sands and poorly sorted sand & gravel with variable amounts of fines. Water quality monitoring indicated PCE concentrations up to1.1 µg/L.
The detailed vadose zone characterization and groundwater profiling was conducted to develop a site-specific GWSL for PCE under the NJDEP protocols. The work included continuous soil detailed logging to 44 feet below ground coupled with soils laboratory testing for gradation with hydrometer, specific gravity, and moisture content of samples collected about every 2 ft. The weight and dimensions of each soil core was also recorded to estimate the dry bulk density of the soil.
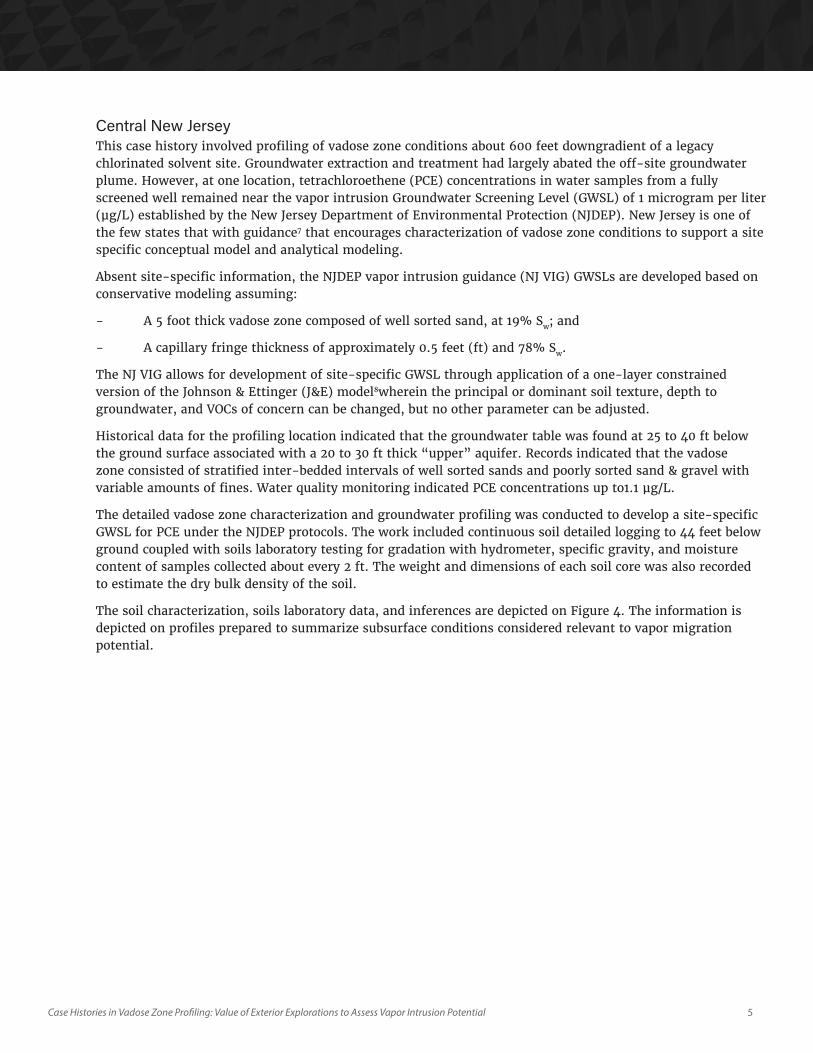
The soil characterization, soils laboratory data, and inferences are depicted on Figure 4. The information is depicted on profiles prepared to summarize subsurface conditions considered relevant to vapor migration potential.
6Case Histories in Vadose Zone Profiling: Value of Exterior Explorations to Assess Vapor Intrusion Potential
Detailed characterization of the vadose zone indicated an overall agronomic soil classification of “loamy sand” with lesser amounts of sandy loam, loam, silt loam, and sand. Approximately 97% of the vadose zone was estimated to be loamy sand or finer. The top 7 feet of the vadose zone was found to be 23 to 62% silt and clay by weight.
Figure 4 - Vadose Zone Profile - Depicting, from left to right, agronomic soil classification, percent gravel and fines (percent passing the No. 200 sieve), the effective particle size (D10), gravimetric water content, estimated water
saturation, and Deff..
7Case Histories in Vadose Zone Profiling: Value of Exterior Explorations to Assess Vapor Intrusion Potential
Saturated conditions were observed at approximately 32 ft. bgs. Across the vadose and phreatic zone, estimates of Sw range from about 34% to 95%. The lowest SW is inferred for the interval of sand at 13 to 14 ft bgs, and the highest Sw for the silty clay loam found in the upper seven feet of soil. The capillary fringe is estimated to be approximately 1 foot above the observed water table. The SW estimates for loamy sands range from 34% to 58% for intervals above the capillary fringe.
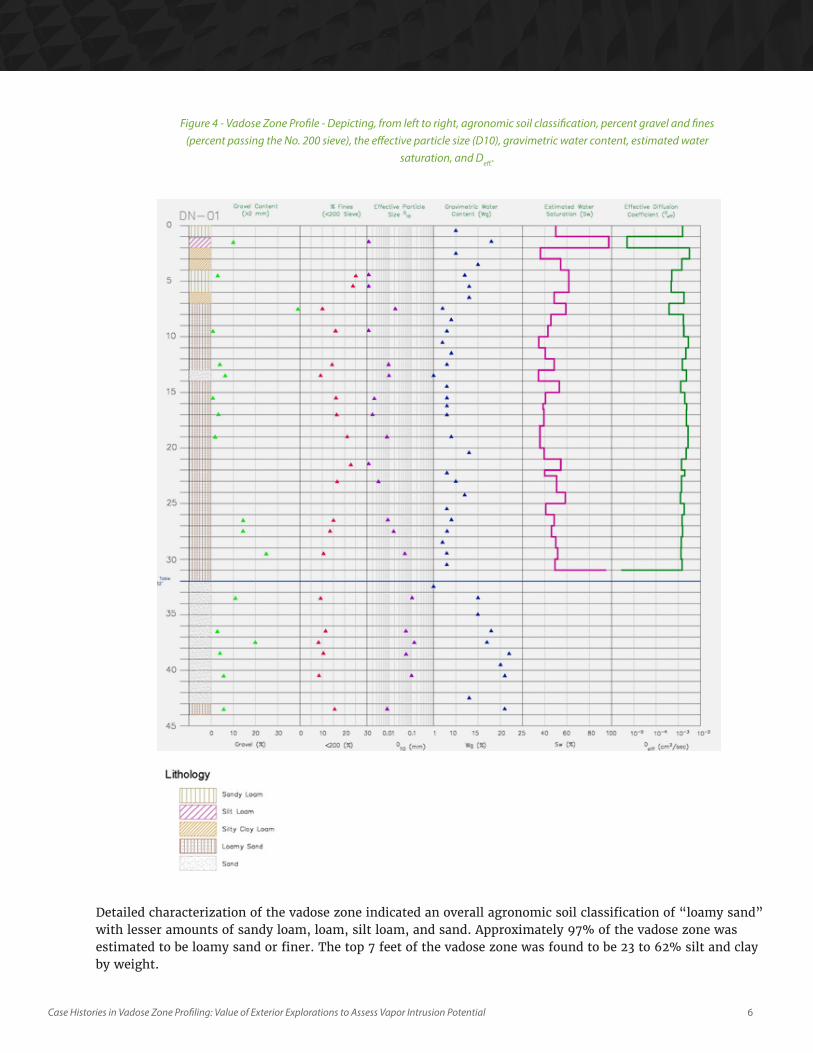
As shown in Table 1, the required model input values used to calculate the site specific GWSL are quite conservative as compared with the values observed and estimated for actual field conditions based on laboratory analysis of site soils. The default Deff is approximately 1.5 to 2 orders of magnitude above the high and low values estimated from field observations and laboratory data.
Parameter
Estimated Site Specific ParametersNJDEP J&E
DefaultValue*
Unit Max Min Mean**
Vado
se
Zone
Water Saturation SW % 94% 34% 50% 19%
Effective Diffusion Coefficient Deff
cm2/sec 5.2E-03 5.9E-06 1.9E-04 1.0E-02
Capi
llary
Fr
inge
Estimated Thickness cm 30.48 18.75
Water Saturation SW % 95% 78%
Effective Diffusion Coefficient Deff
cm2/sec 4.4E-06 1.4E-04
Overall Effective Diffusion Coefficient (Deff) for the Soil Column
cm2/sec 8.1E-05 3.8E-03
Lower effective diffusion associated with higher water saturation would limit VOC flux from the water table to ground surface. At the NJDEP indoor air target value and default assumptions regarding building dimensions and air exchange rates, the implied PCE mass flux would approach 40 µg/m2-day. The actual flux under the observed soil texture and moisture conditions would be at least three to five times lower. At lowest and average SW, site specific GWSLs of about 3 µg/L and 6 µg/L were estimated, respectively, using an unconstrained version of the J&E model9. Increasing the capillary fringe thickness from 19 cm to 33 cm (1 ft) would result in approximately one order of magnitude greater GWSL, up to approximately 20 µg/L. This analysis supports the sensitivity of vapor transport to the thickness and texture of capillary fringe.
Table 1 - Comparison of Site-Specific Estimates and NJDEP Required Default Values
*These default values for loamy sand soil may not be adjusted in the NJ-GW-SCREEN J&E modeling.
** Mean values indicate arithmetic means except for site specific Effective Diffusion Coefficients which are harmonic mean values.
8Case Histories in Vadose Zone Profiling: Value of Exterior Explorations to Assess Vapor Intrusion Potential
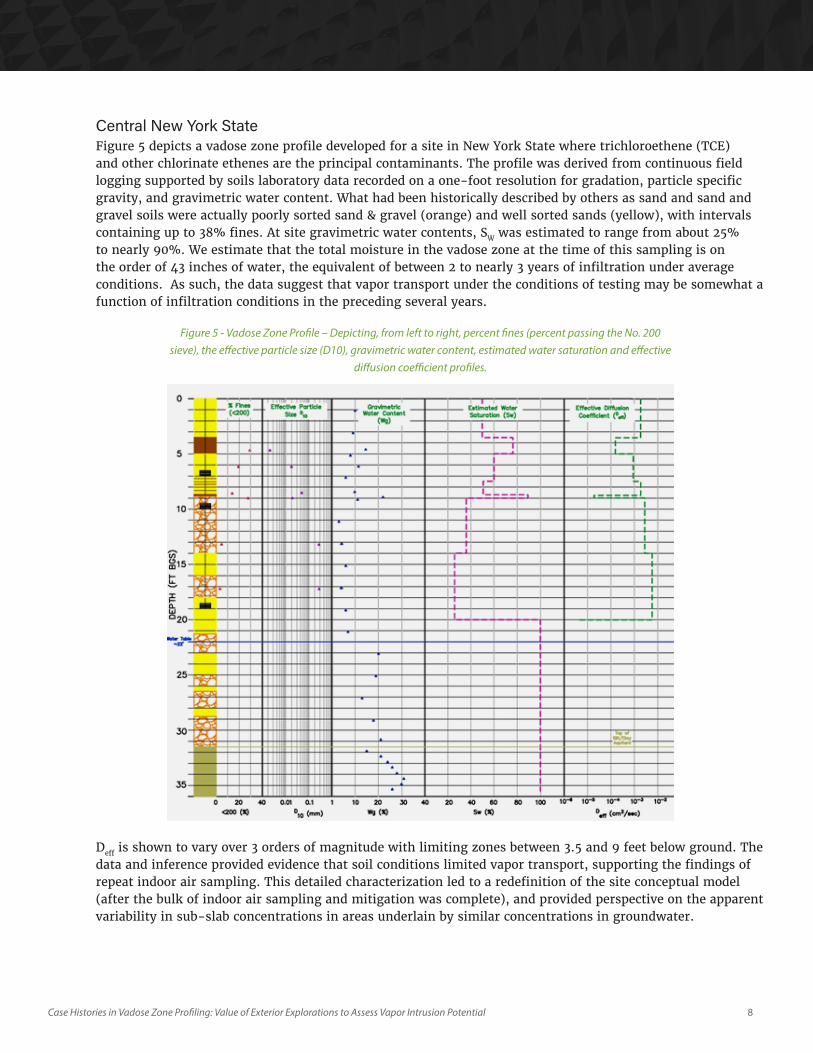
Central New York StateFigure 5 depicts a vadose zone profile developed for a site in New York State where trichloroethene (TCE) and other chlorinate ethenes are the principal contaminants. The profile was derived from continuous field logging supported by soils laboratory data recorded on a one-foot resolution for gradation, particle specific gravity, and gravimetric water content. What had been historically described by others as sand and sand and gravel soils were actually poorly sorted sand & gravel (orange) and well sorted sands (yellow), with intervals containing up to 38% fines. At site gravimetric water contents, SW was estimated to range from about 25% to nearly 90%. We estimate that the total moisture in the vadose zone at the time of this sampling is on the order of 43 inches of water, the equivalent of between 2 to nearly 3 years of infiltration under average conditions. As such, the data suggest that vapor transport under the conditions of testing may be somewhat a function of infiltration conditions in the preceding several years.
Deff is shown to vary over 3 orders of magnitude with limiting zones between 3.5 and 9 feet below ground. The data and inference provided evidence that soil conditions limited vapor transport, supporting the findings of repeat indoor air sampling. This detailed characterization led to a redefinition of the site conceptual model (after the bulk of indoor air sampling and mitigation was complete), and provided perspective on the apparent variability in sub-slab concentrations in areas underlain by similar concentrations in groundwater.
Figure 5 - Vadose Zone Profile – Depicting, from left to right, percent fines (percent passing the No. 200 sieve), the effective particle size (D10), gravimetric water content, estimated water saturation and effective
diffusion coefficient profiles.
9Case Histories in Vadose Zone Profiling: Value of Exterior Explorations to Assess Vapor Intrusion Potential
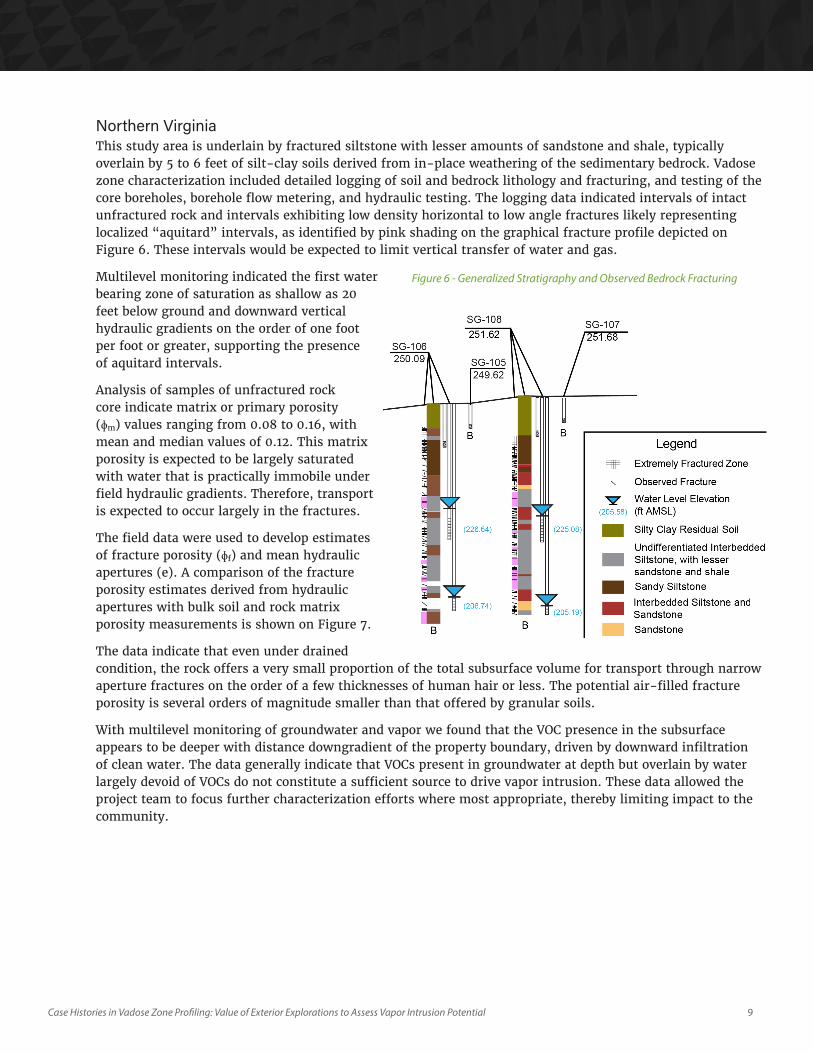
Northern VirginiaThis study area is underlain by fractured siltstone with lesser amounts of sandstone and shale, typically overlain by 5 to 6 feet of silt-clay soils derived from in-place weathering of the sedimentary bedrock. Vadose zone characterization included detailed logging of soil and bedrock lithology and fracturing, and testing of the core boreholes, borehole flow metering, and hydraulic testing. The logging data indicated intervals of intact unfractured rock and intervals exhibiting low density horizontal to low angle fractures likely representing localized “aquitard” intervals, as identified by pink shading on the graphical fracture profile depicted on Figure 6. These intervals would be expected to limit vertical transfer of water and gas.
Multilevel monitoring indicated the first water bearing zone of saturation as shallow as 20 feet below ground and downward vertical hydraulic gradients on the order of one foot per foot or greater, supporting the presence of aquitard intervals.
Analysis of samples of unfractured rock core indicate matrix or primary porosity (ɸm) values ranging from 0.08 to 0.16, with mean and median values of 0.12. This matrix porosity is expected to be largely saturated with water that is practically immobile under field hydraulic gradients. Therefore, transport is expected to occur largely in the fractures.
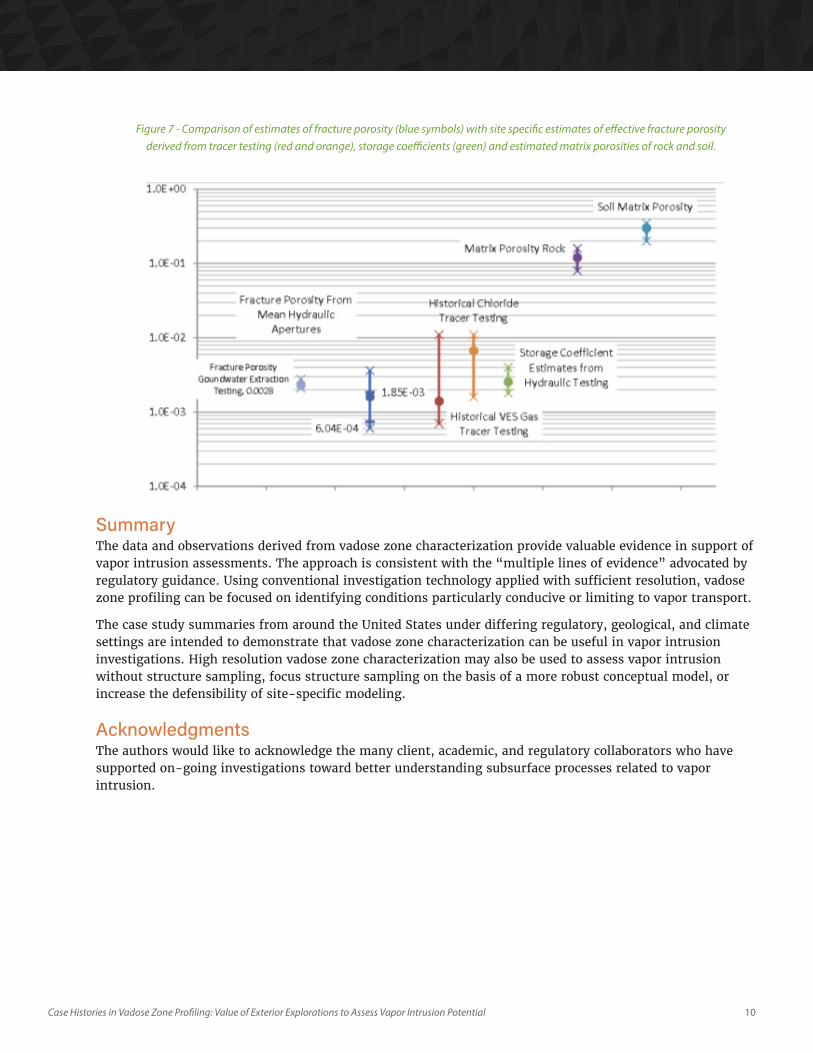
The field data were used to develop estimates of fracture porosity (ɸf) and mean hydraulic apertures (e). A comparison of the fracture porosity estimates derived from hydraulic apertures with bulk soil and rock matrix porosity measurements is shown on Figure 7.
The data indicate that even under drained condition, the rock offers a very small proportion of the total subsurface volume for transport through narrow aperture fractures on the order of a few thicknesses of human hair or less. The potential air-filled fracture porosity is several orders of magnitude smaller than that offered by granular soils.
With multilevel monitoring of groundwater and vapor we found that the VOC presence in the subsurface appears to be deeper with distance downgradient of the property boundary, driven by downward infiltration of clean water. The data generally indicate that VOCs present in groundwater at depth but overlain by water largely devoid of VOCs do not constitute a sufficient source to drive vapor intrusion. These data allowed the project team to focus further characterization efforts where most appropriate, thereby limiting impact to the community.
Figure 6: Generalized Stratigraphy and Observed Bedrock Fracturing
Figure 6 - Generalized Stratigraphy and Observed Bedrock Fracturing
10Case Histories in Vadose Zone Profiling: Value of Exterior Explorations to Assess Vapor Intrusion Potential
SummaryThe data and observations derived from vadose zone characterization provide valuable evidence in support of vapor intrusion assessments. The approach is consistent with the “multiple lines of evidence” advocated by regulatory guidance. Using conventional investigation technology applied with sufficient resolution, vadose zone profiling can be focused on identifying conditions particularly conducive or limiting to vapor transport.
The case study summaries from around the United States under differing regulatory, geological, and climate settings are intended to demonstrate that vadose zone characterization can be useful in vapor intrusion investigations. High resolution vadose zone characterization may also be used to assess vapor intrusion without structure sampling, focus structure sampling on the basis of a more robust conceptual model, or increase the defensibility of site-specific modeling.
AcknowledgmentsThe authors would like to acknowledge the many client, academic, and regulatory collaborators who have supported on-going investigations toward better understanding subsurface processes related to vapor intrusion.
Figure 7 - Comparison of estimates of fracture porosity (blue symbols) with site specific estimates of effective fracture porosity derived from tracer testing (red and orange), storage coefficients (green) and estimated matrix porosities of rock and soil.
11Case Histories in Vadose Zone Profiling: Value of Exterior Explorations to Assess Vapor Intrusion Potential
References1. Daniel B. Carr, P.E., P.G., Laurent C. Levy, Ph.D., P.E., Allan H. Horneman, D.E.S., October 2010, Vadose
Zone Profiling to Better Understand Vadose Zone Processes Related to Vapor Intrusion, Proceedings of Air and Waste Management Association, Specialty Conference on Vapor Intrusion, Chicago Illinois.
2. McWhorter, D. November 1993, Course Notes, Lecture 12, Vadose Zone Processes, Short Course Diagnosis and Remediation of DNAPL Sites, Waterloo Centre for Groundwater Research. Arlington VA.
3. David Shea, March 2012, Vapor Intrusion into Large Buildings, Presentation USEPA Workshop, Recent Advances to VI Application and Implementation, A State of the Science Update, Association of Environmental Health Sciences Conference, San Diego California.
4. Daniel B. Carr and Shea D., May 23, 2012, Field Evidence Scaling VOC Mass Flux at Vapor Intrusion Sites, Presentation, Eighth Annual International Battelle Conference, Remediation of Chlorinated and Recalcitrant Compounds, Monterey California.
5. Johnson, P. C., Identification of Critical Parameters for the Johnson and Ettinger (1991) Vapor Intrusion Model; American Petroleum Institute: Washington, DC, 2002; Soil and Groundwater Research Bulletin No. 17. http://www.api.org/ehs/groundwater/upload/Bulletin17.pdf (accessed August 2010).
6. Yu, S.; Unger, A. J. A.; Parker, B. Simulating the Fate and Transport of TCE from Groundwater to Indoor Air. J. Contam. Hydrol. 2009, 107(3-4), 140-161.
7. Vapor Intrusion Guidance; 2005, New Jersey Department of Environmental Protection: Trenton, NJ, http://www.state.nj.us/dep/srp/guidance/vaporintrusion/vig.htm (accessed August 2010).
8. New Jersey Groundwater Screening Level One Layer Version 3.1 dated, April, 2006 and obtained by Sanborn Head from http://www.state.nj.us/dep/srp/guidance/vaporintrusion/njje_gw_screen.xls on April 10, 2009.
9. U.S. EPA On-line Tools for Site Assessment Calculations, Screening Level Implementation of the Johnson and Ettinger Vapor Intrusion Model http://www.epa.gov/athens/learn2model/part-two/onsite/JnE_lite.htm