Embed Size (px)
DESCRIPTION
CARTOGRAPHIES OF SEGREGATION From Snapshots to Processes and Trajectories. Flávia F. Feitosa (UFABC) Antônio Miguel V. Monteiro (INPE). XIV Brazilian Symposium on Geoinformatics (GEOINFO 2013), November 24 th – 27 th , 2013. - PowerPoint PPT Presentation
Citation preview
CARTOGRAPHIES OF CARTOGRAPHIES OF SEGREGATIONSEGREGATION
From Snapshots to From Snapshots to Processes and TrajectoriesProcesses and Trajectories
Flávia F. Feitosa (UFABC)Antônio Miguel V. Monteiro (INPE)
XIV Brazilian Symposium on Geoinformatics (GEOINFO 2013), November 24th – 27th , 2013.
Almost 10 years ago… A Question:Almost 10 years ago… A Question:
How to measure residential segregation? How to measure residential segregation?
Photo
: T
uca
Vie
ira
Photo
: T
uca
Vie
ira
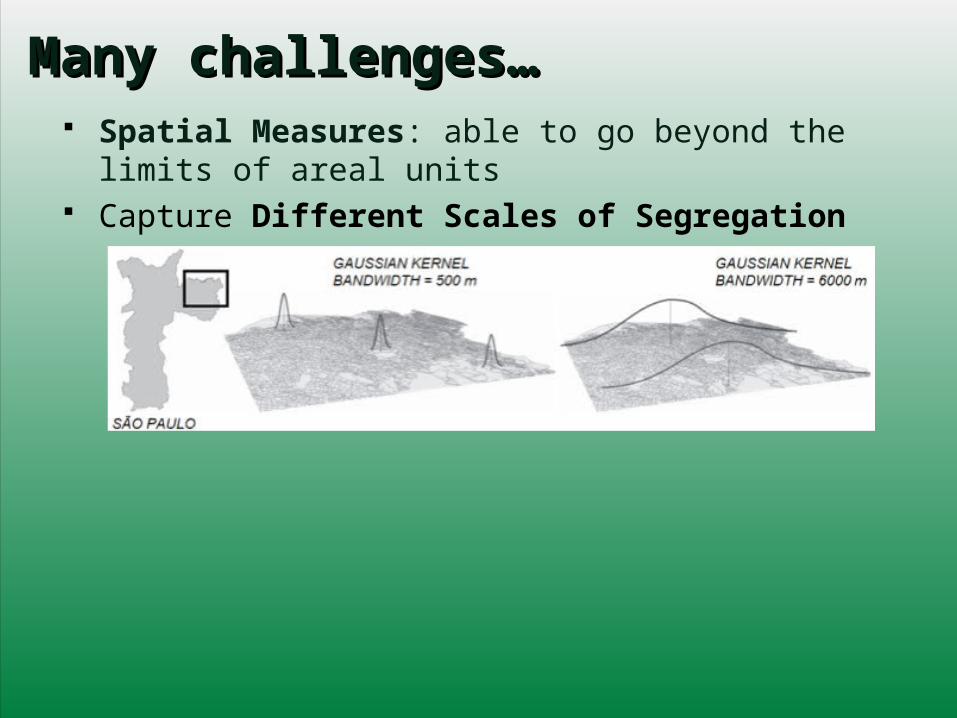
Spatial Measures: able to go beyond the limits of areal units
Capture Different Scales of Segregation
Many challenges…Many challenges…
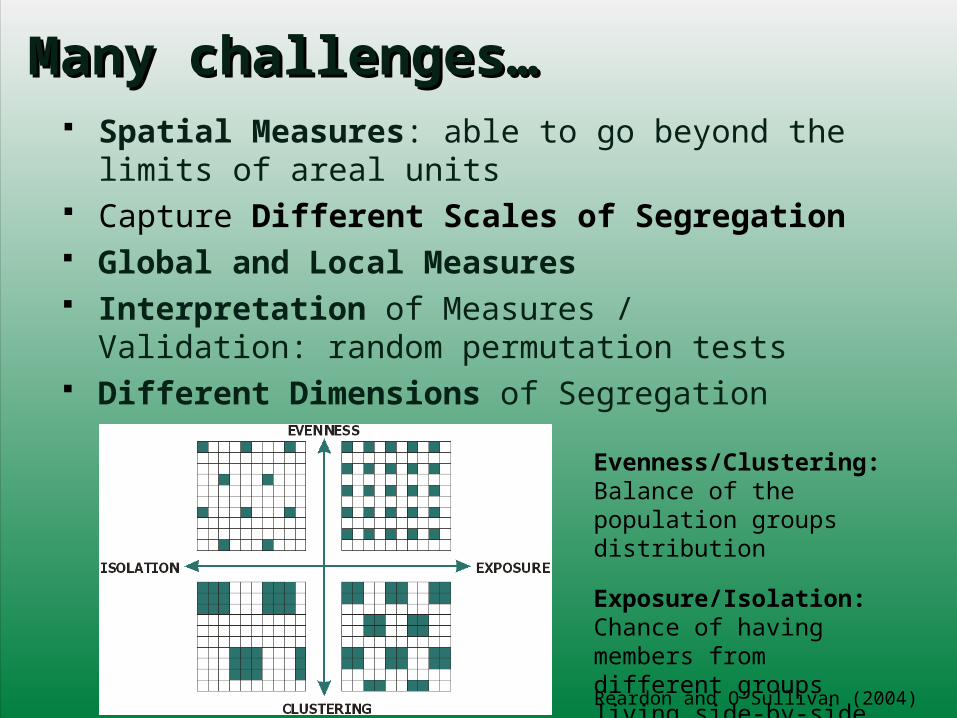
Many challenges…Many challenges… Spatial Measures: able to go beyond the limits of areal
units Capture Different Scales of Segregation Global and Local Measures Interpretation of Measures / Validation: random
permutation tests Different Dimensions of Segregation
Evenness/Clustering: Balance of the population groups distribution
Exposure/Isolation: Chance of having members from different groups living side-by-sideReardon and O’Sullivan (2004)
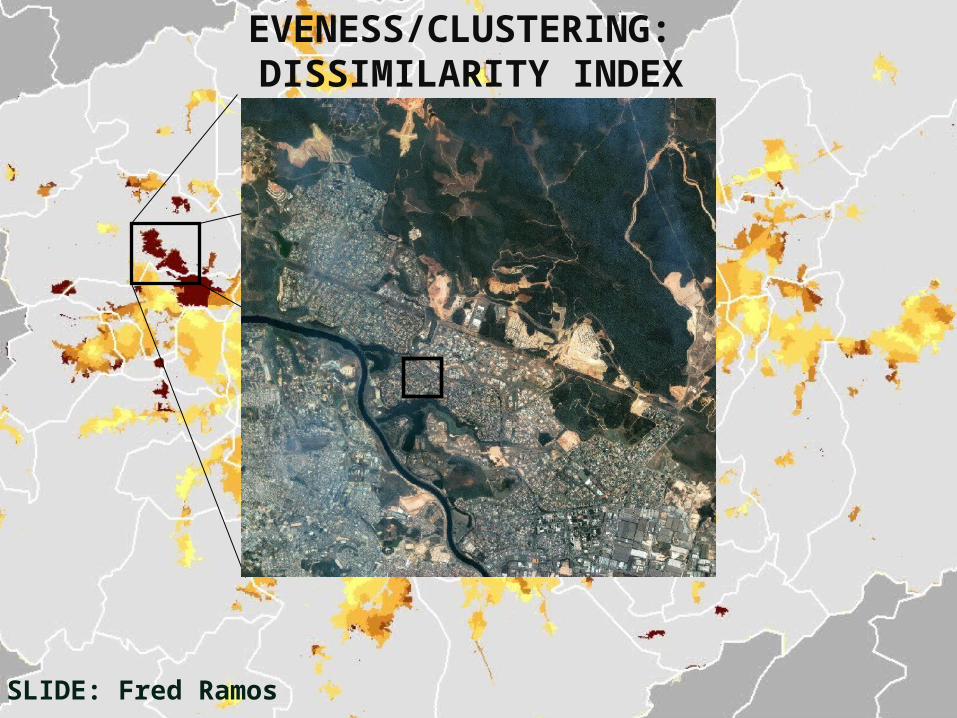
EVENESS/CLUSTERING: DISSIMILARITY INDEX
SLIDE: Fred Ramos
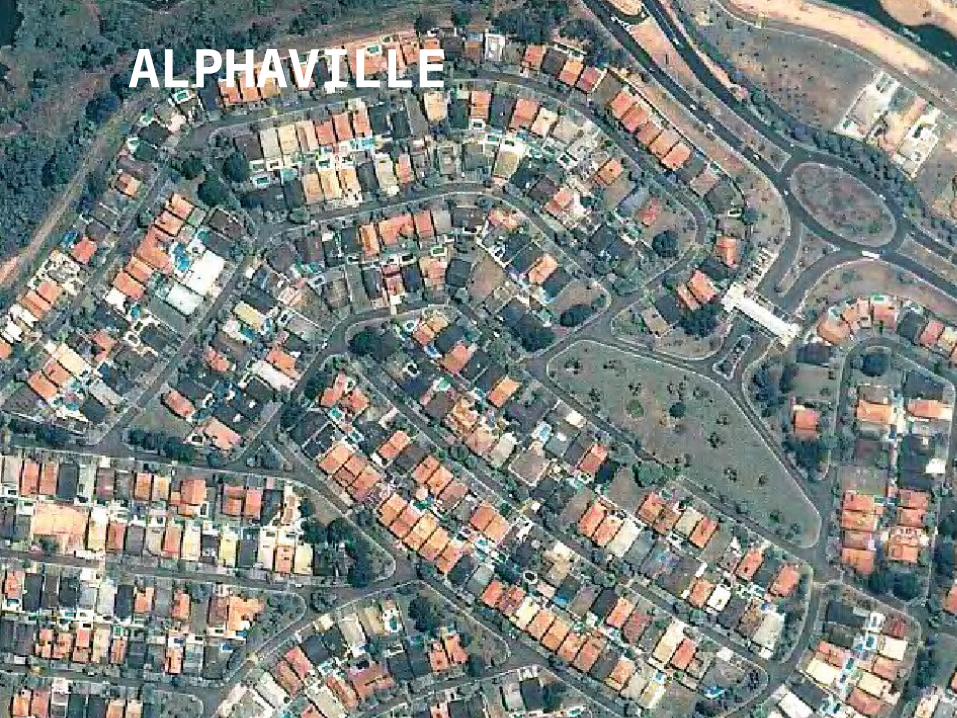
ALPHAVILLE
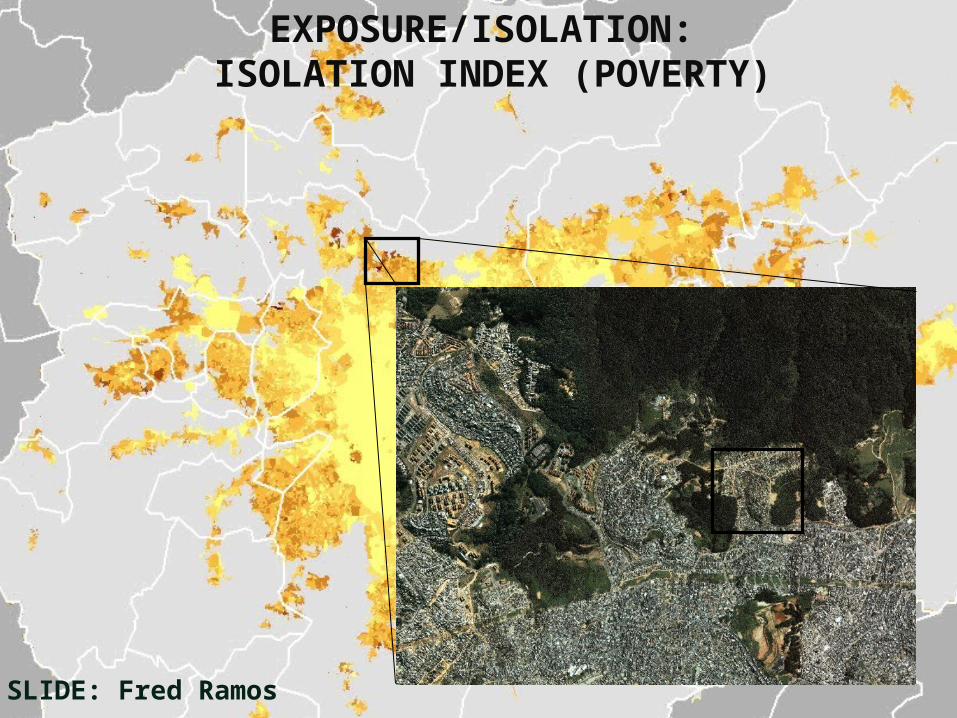
EXPOSURE/ISOLATION: ISOLATION INDEX (POVERTY)
SLIDE: Fred Ramos
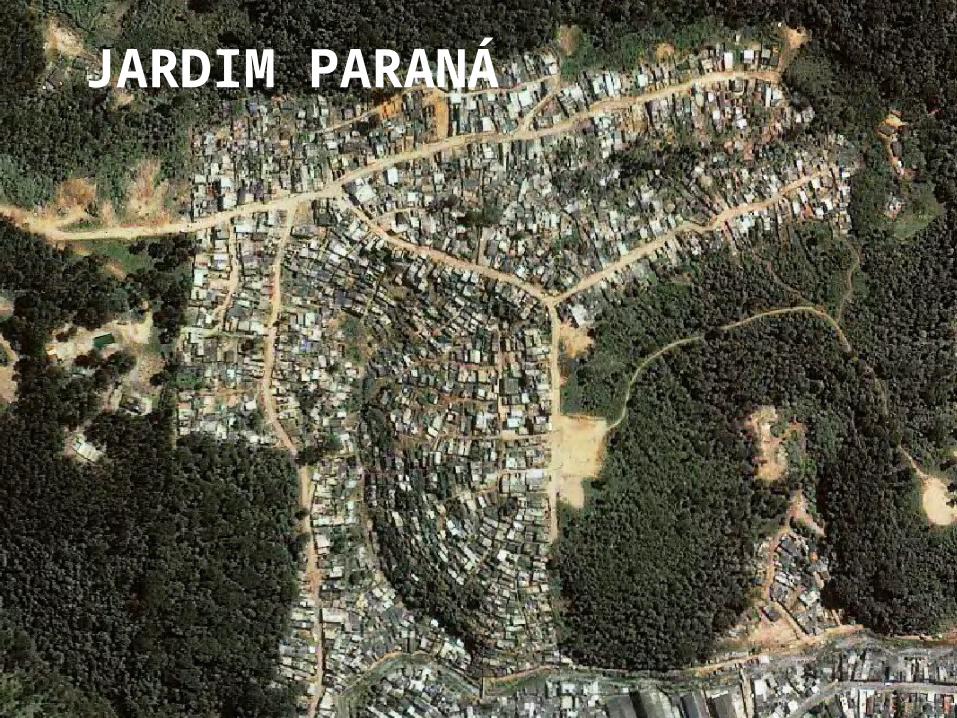
JARDIM PARANÁ
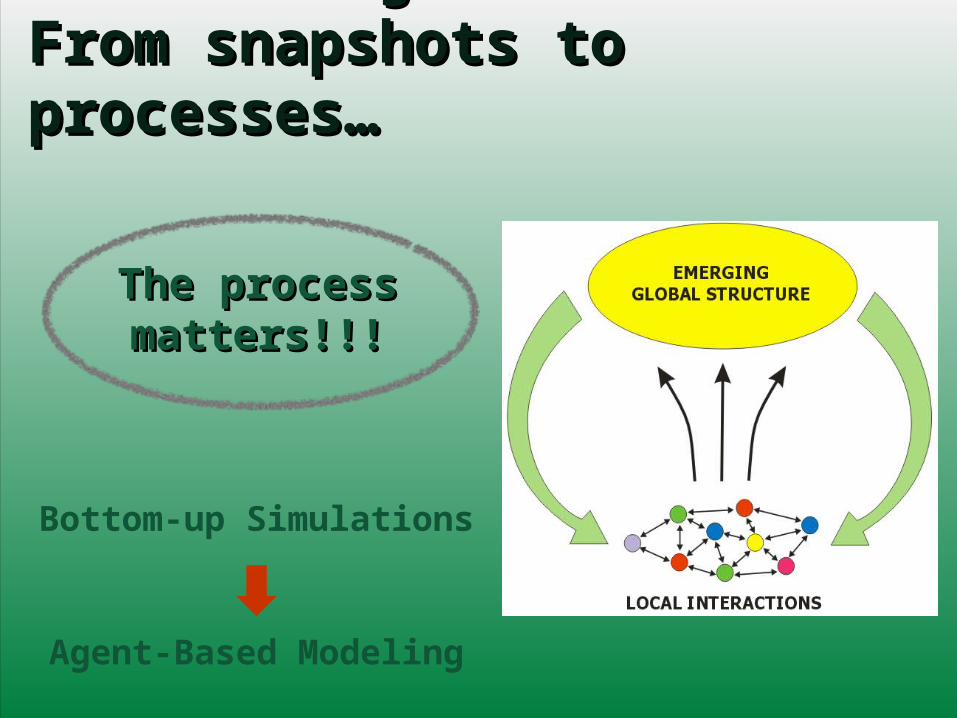
New challenges: New challenges: From snapshots to processes…From snapshots to processes…
Bottom-up Simulations
Agent-Based Modeling
The process The process matters!!!matters!!!
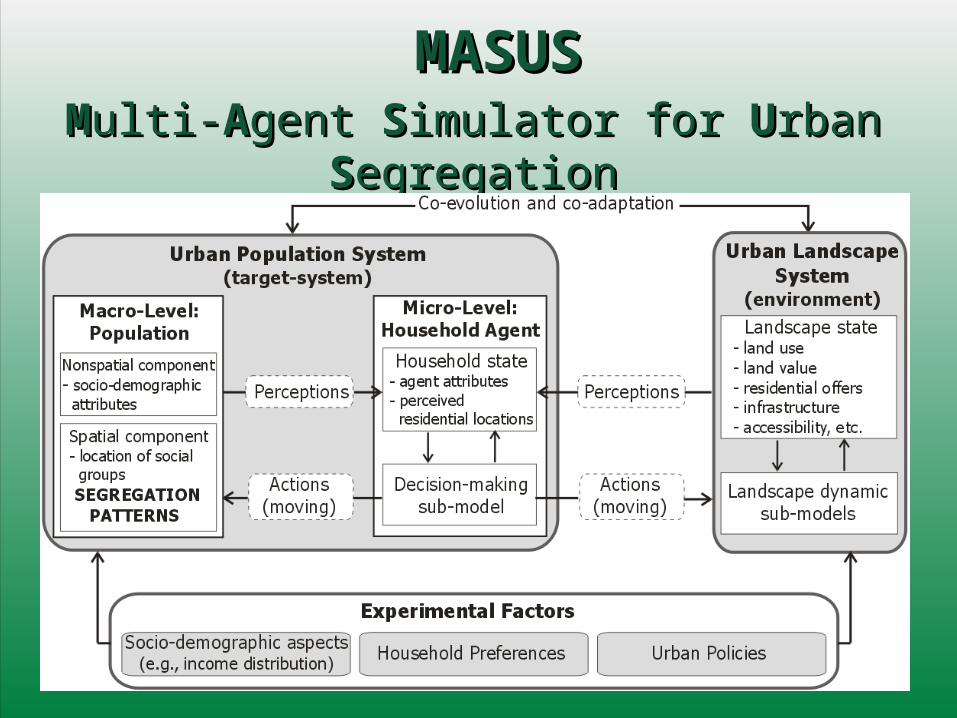
MMulti-ulti-AAgent gent SSimulator for imulator for UUrban rban SSegregationegregation
MASUSMASUS
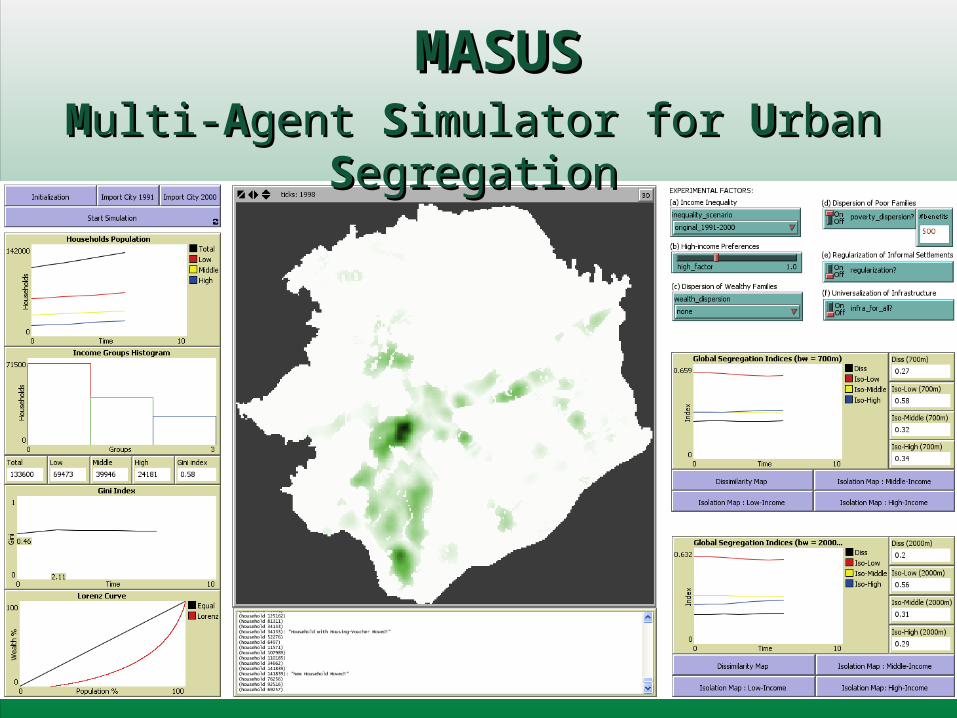
MMulti-ulti-AAgent gent SSimulator for imulator for UUrban rban SSegregationegregation
MASUSMASUS
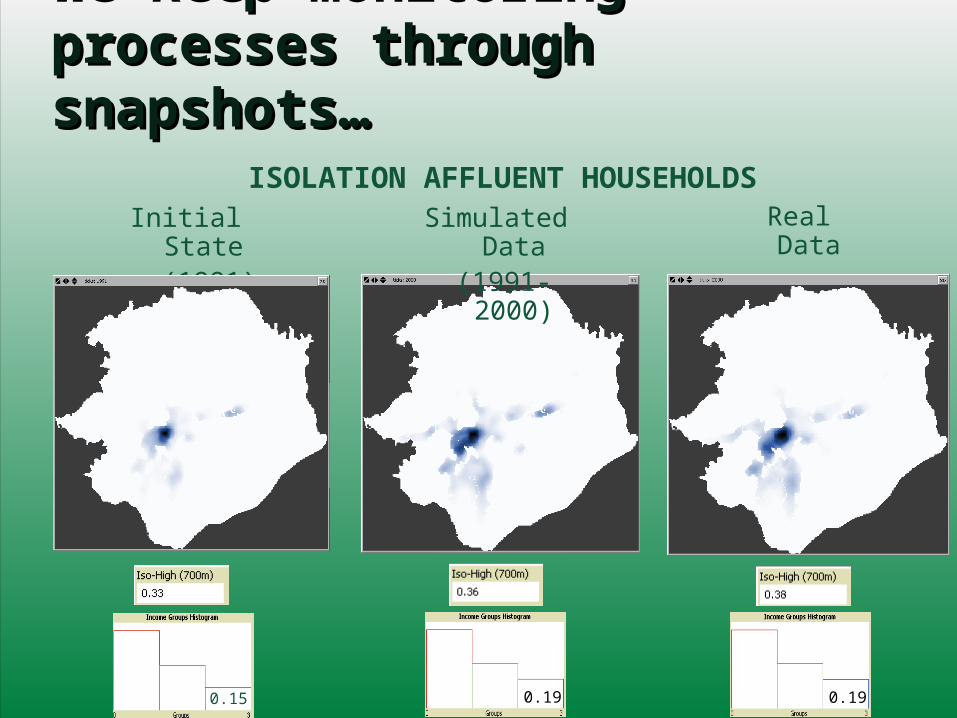
We keep monitoring processes We keep monitoring processes through snapshots… through snapshots…
ISOLATION AFFLUENT HOUSEHOLDSInitial State
(1991)Real Data
(2000)
0.15 0.19 0.19
Simulated Data (1991-2000)
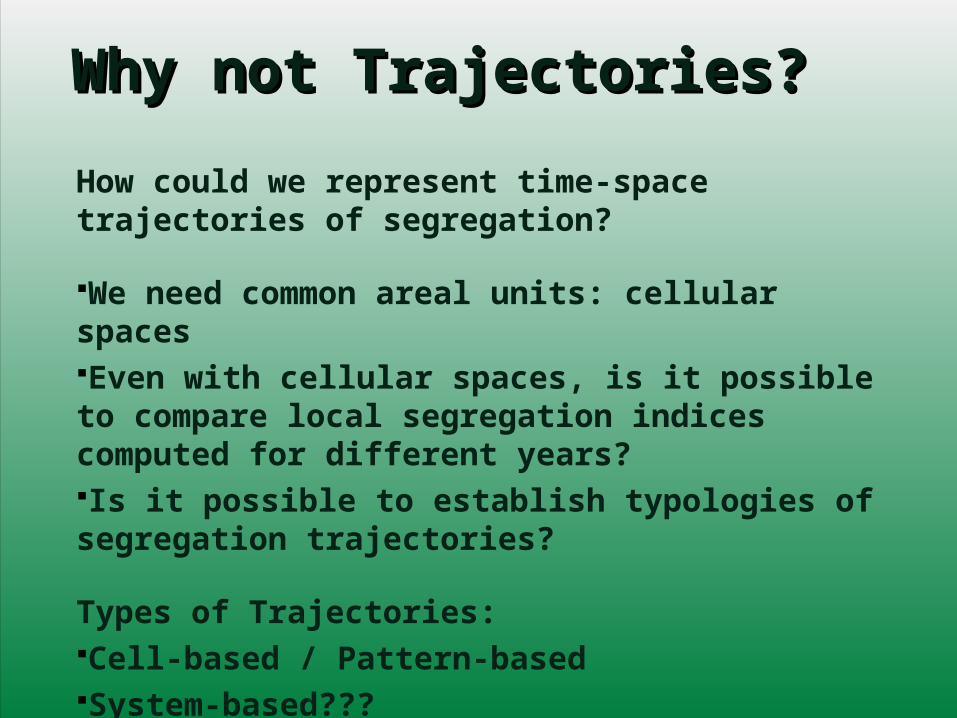
Why not Trajectories? Why not Trajectories?
How could we represent time-space trajectories of segregation?
We need common areal units: cellular spacesEven with cellular spaces, is it possible to compare local segregation indices computed for different years? Is it possible to establish typologies of segregation trajectories?
Types of Trajectories: Cell-based / Pattern-basedSystem-based???

CARTOGRAPHIES OF CARTOGRAPHIES OF SEGREGATIONSEGREGATION
From Snapshots to From Snapshots to Processes and TrajectoriesProcesses and Trajectories
Flávia F. Feitosa (UFABC)Antônio Miguel V. Monteiro (INPE)
XIV Brazilian Symposium on Geoinformatics (GEOINFO 2013), November 24th – 27th , 2013.
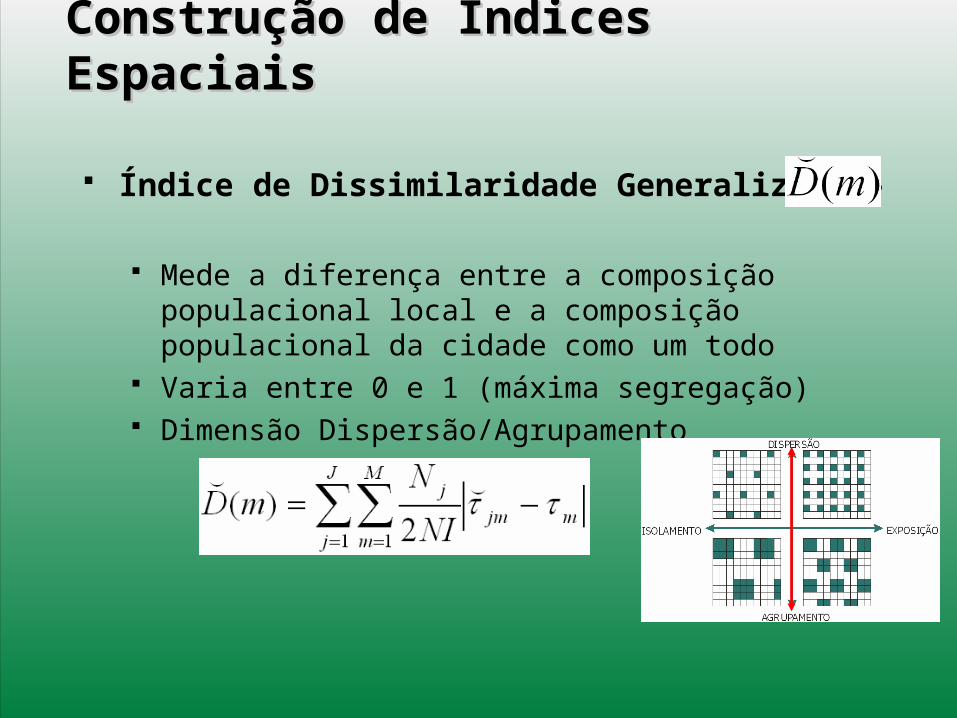
Construção de Índices EspaciaisConstrução de Índices Espaciais
Índice de Dissimilaridade Generalizado –
Mede a diferença entre a composição populacional local e a composição populacional da cidade como um todo
Varia entre 0 e 1 (máxima segregação) Dimensão Dispersão/Agrupamento
Construção de Índices EspaciaisConstrução de Índices Espaciais
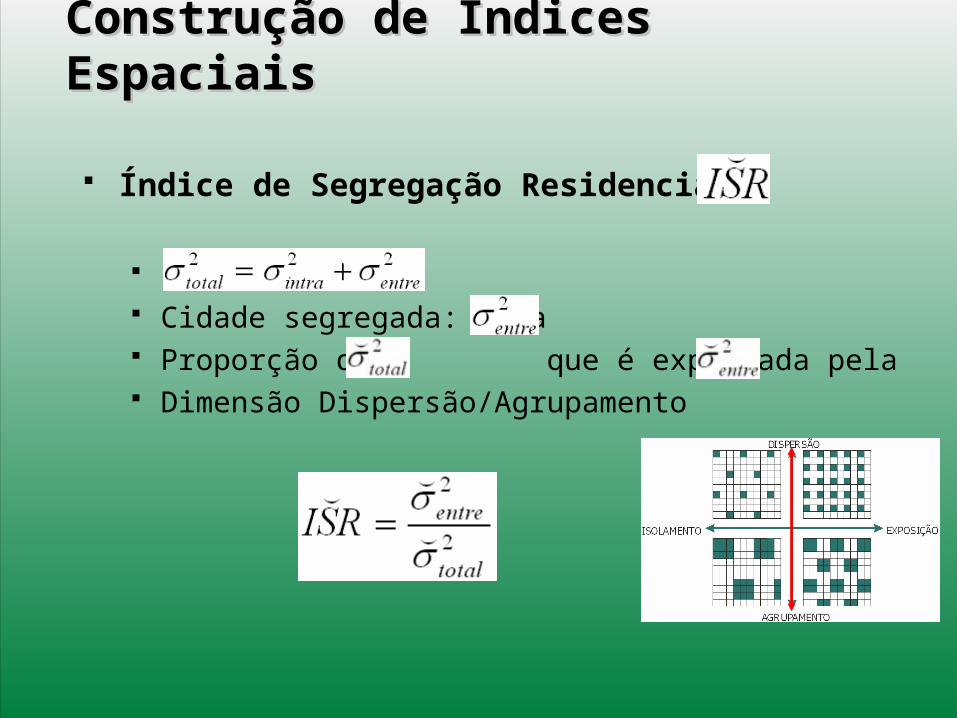
Índice de Segregação Residencial –
. Cidade segregada: alta Proporção da que é explicada pela Dimensão Dispersão/Agrupamento
Construção de Índices EspaciaisConstrução de Índices Espaciais
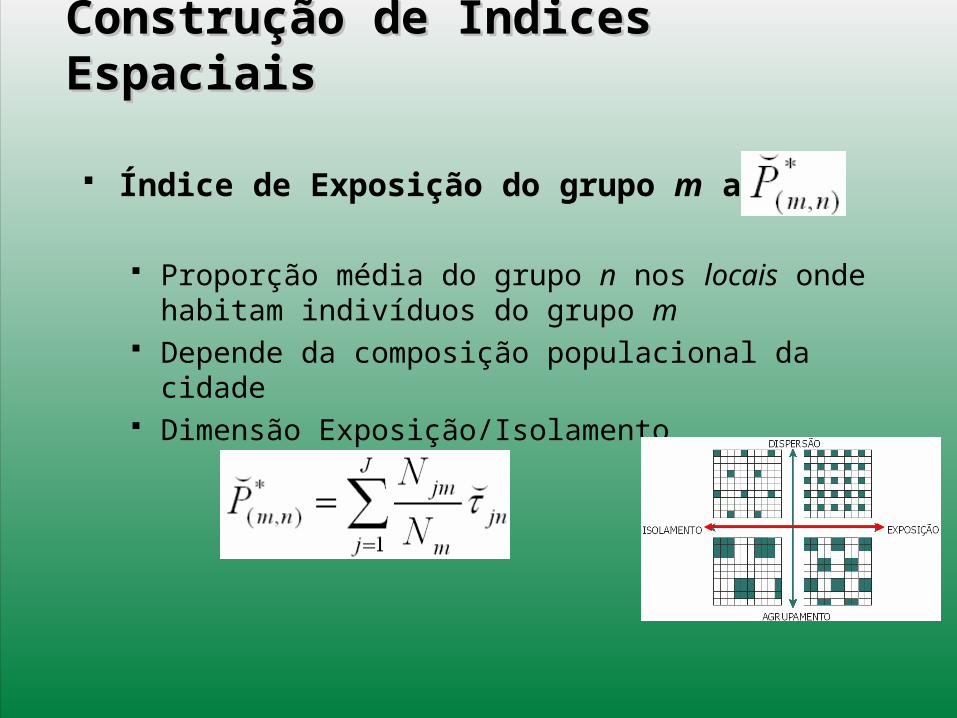
Índice de Exposição do grupo m ao n -
Proporção média do grupo n nos locais onde habitam indivíduos do grupo m
Depende da composição populacional da cidade Dimensão Exposição/Isolamento
Construção de Índices EspaciaisConstrução de Índices Espaciais
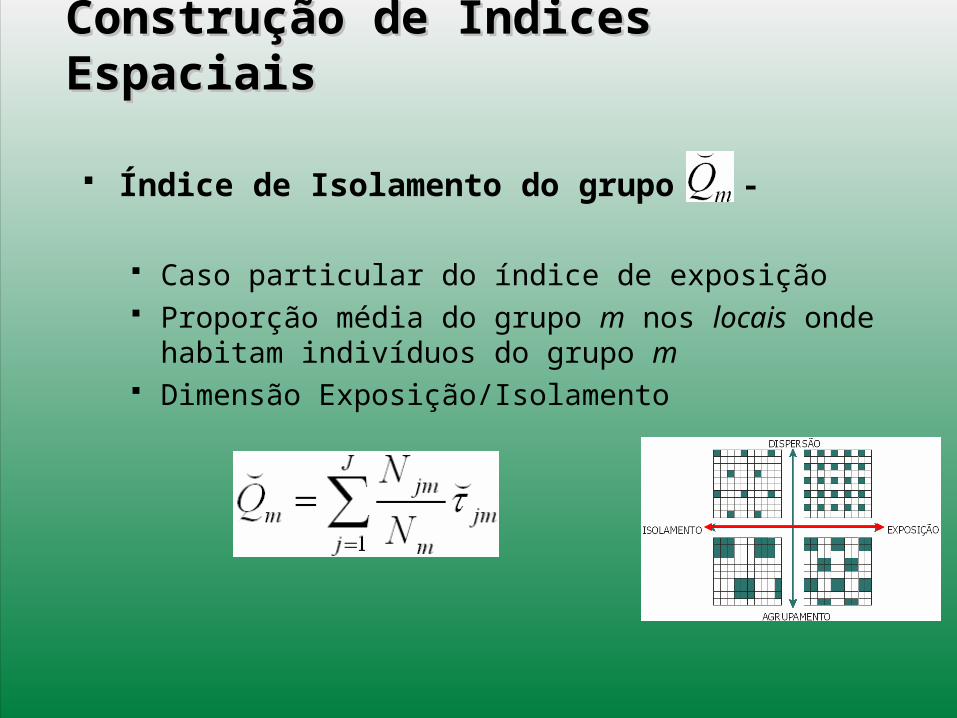
Índice de Isolamento do grupo m -
Caso particular do índice de exposição Proporção média do grupo m nos locais onde habitam
indivíduos do grupo m Dimensão Exposição/Isolamento
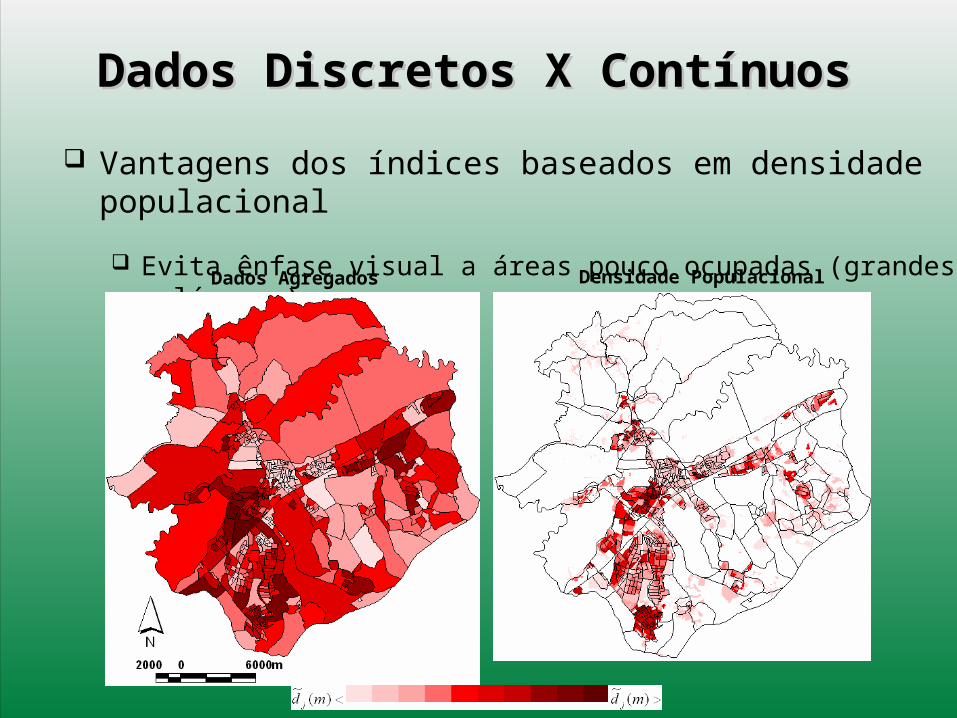
Vantagens dos índices baseados em densidade populacional
Evita ênfase visual a áreas pouco ocupadas (grandes polígonos)
Dados Agregados Densidade Populacional
Dados Discretos X ContínuosDados Discretos X Contínuos