Embed Size (px)
Citation preview

WP/16/53
CARIBBEAN ENERGY: MACRO-RELATED CHALLENGES
by Arnold McIntyre, Ahmed El-Ashram, Marcio Ronci, Julien Reynaud, Natasha Che, Ke Wang, Sebastian Acevedo, Mark Lutz,
Francis Strodel, Anayo Osueke, and Hanlei Yun
IMF Working Papers describe research in progress by the author(s) and are published to elicit comments and to encourage debate. The views expressed in IMF Working Papers are those of the author(s) and do not necessarily represent the views of the IMF, its Executive Board, or IMF management.

© 2016 International Monetary Fund WP/16/53
IMF Working Paper
Western Hemisphere Department
CARIBBEAN ENERGY: MACRO-RELATED CHALLENGES
Prepared by Arnold McIntyre, Ahmed El-Ashram, Marcio Ronci, Julien Reynaud, Natasha Che, Ke Wang, Sebastian Acevedo, Mark Lutz, Francis Strodel, Anayo
Osueke, and Hanlei Yun
Authorized for distribution by Adrienne Cheasty
March 2016
Abstract
High energy costs contribute to dampening Caribbean competitiveness and potential growth. This paper overviews power sector challenges and takes stock of national and regional strategies to address them. It presents recommendations to move the energy agenda forward based on analyses of macro-aspects of energy reform. These include: i) quantitative assessment of the impact of energy costs on growth and competitiveness; ii) evaluation of gains from implementing announced renewable energy and energy efficiency targets; and iii) analysis of the impact of energy investments on debt sustainability. The paper argues for a bigger role for the private sector in energy reform and discusses prerequisites for good public-private partnerships.
JEL Classification Numbers: Q43, Q42, C32, C33, O43, H54, H63
Keywords: Energy Reform, Oil Price Shocks, Caribbean, Economic Growth, Renewable Energy, Energy Efficiency, Public Investment, Infrastructure, Debt Sustainability, PPP
Authors’ E-Mail Addresses: [email protected]; [email protected]; [email protected]; [email protected]; [email protected]; [email protected]; [email protected]; [email protected]; [email protected]; [email protected]
IMF Working Papers describe research in progress by the author(s) and are published to elicit comments and to encourage debate. The views expressed in IMF Working Papers are those of the author(s) and do not necessarily represent the views of the IMF, its Executive Board, or IMF management.

3
Contents
Abstract ..................................................................................................................................... 2 I. Introduction ............................................................................................................................ 5 II. The Case for Energy Reform: Shortcomings of The Current Situation ............................... 7
A. The State of the Caribbean Energy Sector................................................................ 7 B. The Macro-Impact of Energy Costs........................................................................ 12
III. Impact of Energy Costs on Growth: How Important? ...................................................... 17A. Impact of Oil Price Changes In the Short and Medium Term ................................ 17 B. Energy Consumption and Efficiency in the Long Run ........................................... 18
IV. Stocktaking of Existing Energy Strategies: Adequacy and Macroeconomic Impact ........ 21A. Regulatory Reforms ................................................................................................ 22 B. Improving Energy Efficiency ................................................................................. 23 C. Diversifying the Generation Mix ............................................................................ 26 D. Potential Gains from Reform .................................................................................. 28
V. Transforming the Energy Sector: How Expensive and How Feasible? ............................. 29 A. Energy Sector Investment Needs .................................................................... 29 B. The Impact of Energy Investment on Public Debt Sustainability ................... 31
VI. Towards A Sustainable Private Investment Framework in the Energy Sector ................. 40VII. Policy Recommendations and Next Steps ....................................................................... 45References ............................................................................................................................... 47
List of Tables Table 1. Electric Utility Companies in the Caribbean ............................................................... 9 Table 2. Net Benefit to Caribbean Economies from a Decline in Oil Prices .......................... 15 Table 3. Summary of Viable Renewable Energy Sources by Country ................................... 26 Table 4. Implied Effects of Energy Efficiency Targets ........................................................... 28 Table 5. Implied Effects of Renewable Energy Targets.......................................................... 28 Table 6. Energy Sector Investment Needs in the Caribbean (2018-2023) .............................. 30 Table 7. Minimum Cost Reductions for Costed Energy Investments to be Self-Financing ... 31 Table 8. Potential Cost Savings from Energy Investments under Alternative Scenarios for the Oil Price Outlook ..................................................................................................................... 34
List of Figures Figure 1. The Caribbean: GDP, Capital, and Energy Consumption ....................................... 19 Figure 2. Summary of Existing and Proposed Energy Policies in CARICOM States ............ 22 Figure 3. Electric Power Efficiency in the Caribbean ............................................................. 23 Figure 4. National Energy Efficiency Targets and Implied Effects ........................................ 25 Figure 5. Installed Capacity of Renewable Energy ................................................................. 26 Figure 6. National Energy Efficiency Targets and Implied Effects ........................................ 27 Figure 7. Impact of Energy Investments on Debt Sustainability............................................. 38 Figure 8. Impact of Energy Investments on Debt Sustainability (Cont’d) .............................. 39

4
Figure 9. PPP Investments in the Energy Sector ..................................................................... 41 Figure 10. Organizational Responsibilities for PPPs in Jamaica ............................................ 44
List of Boxes Box 1. Recent Developments in the Global Oil and Gas Market ............................................ 16 Box 2. Benchmarking the Results of the VAR to an Oil Price Shock .................................... 20 Box 3. PPP Case Study—Renewable Energy Procurement in Jamaica .................................. 44
Annexes Annex I. Quantitative Assessment of Macro-effects of Oil prices and Energy consumption in the Caribbean ................................................................................................................................. 51 Annex II. Assessment of Potential Cost Savings from Introducing Natural Gas and Renewable Energy Technologies in the Caribbean.................................................................................... 62

5
I. INTRODUCTION
1. Reducing energy costs in the Caribbean could help improve growth in the region and strengthen competitiveness. However, regional policymakers face conflicting objectives. On the one hand, investment in an effective energy reform strategy would have long-term benefits. On the other, few countries have fiscal space to embark on ambitious investments to reform the energy sector. This paper aims to assist policymakers in confronting this difficult policy dilemma by defining the important macro-related challenges for energy sectors in the region, and assessing the impact and feasibility of announced strategies to address them.1
2. The substantial decline in oil prices since mid-2014 does not obviate the need for energy sector reform. The impact of the oil price decline is global, so it has not improved relative prices for the Caribbean compared with its trade partners. Moreover, competitiveness challenges are escalating, with the appreciation of the US dollar (expected to continue over the next few years with the normalization of US monetary policy) and the potential opening of Cuba to US tourism and trade. Hence, any gains from recent oil price declines should be seen as a temporary breathing space that gives the English speaking Caribbean some time to catch up with the cost reductions needed to compete successfully in a more open region.
3. This paper focuses on answering a few fundamental macro-questions of key relevance to regional policymakers in determining how to take energy reform forward. These are: (i) how important is energy sector reform to growth and competitiveness? (ii) Are existing energy sector strategies adequate to address current challenges? (iii) What gains could be expected from the implementation of these energy strategies? – in other words, would existing strategies really be worth implementing, or does the region need to go back to the drawing board? (iv) What are the investment costs of achieving announced energy targets? And finally, (v) could countries afford it? – meaning, would envisaged energy reform be consistent with preserving fiscal space and debt sustainability?
4. To answer these questions, the paper—after surveying the current energy environment—undertakes a sequence of exercises. The underlying goal is to provide Caribbean policymakers with more information than previously about the options and scope for undertaking effective energy sector reform.
A quantitative assessment of the impact of energy costs on growth and on an important competitiveness indicator, the real effective exchange rate (REER)—both in the short run and (from the perspective of investment in energy and improvements in energy efficiency) in the long run (Section III). These exercises are inputs to determining the potential gains from proposed energy sector strategies.
1 This paper was prepared in response to policymakers’ requests following the IMF’s September 2014 High-Level Caribbean Forum.

6
A stock-taking of existing national and regional energy strategies, together with an assessment of the impact of their announced targets. The paper reviews countries’ proposed energy strategies for scope and appropriateness and assesses their alignment with the regional CARICOM energy strategy (Section IV). It identifies policy action needed to close regulatory gaps to facilitate increased private sector participation. It also attempts to provide a basis—however preliminary—for staff to estimate the macro-impact of pursuing the reforms (towards renewable energy and energy efficiency) outlined in the strategies.
Estimation of the cost of required energy investments in the region (based on existing strategies), in collaboration with the IDB. The paper makes a first attempt to quantify the cost of the investment envelope needed to achieve adequate energy reform strategies (Section V.A). For governments making cost-benefit analyses about whether to embark on ambitious and uncertain energy sector reforms, the cost of filling the investment gap is a fundamental input. However, this vital number is not readily available, given the unavoidable uncertainties associated with its estimation. The paper provides some broad brush estimates of the cost; on the one hand, acknowledging that these are subject to a significant margin of error; but on the other, recognizing that such estimates provide important directional inputs to policymakers.
An evaluation of the potential impact of these investments on public debt sustainability. As flagged above, a main concern of Caribbean governments is whether investing in their energy strategies is feasible, in light of their limited fiscal space, particularly where the initial debt burden is high. Hence, the paper assesses the impact of undertaking the large energy investments on countries’ public debt trajectories, by augmenting the IMF’s public debt sustainability analysis framework with estimated energy investment needs, under public and private financing scenarios (Section V. B). The analysis models debt paths through 2030 (i) under specific conditions requiring projects to be bankable and self-financing in the long run and (ii) incorporating the long-run growth enhancement impact of energy sector investments, based on staff’s estimates of the elasticity of GDP to improvements in energy efficiency.
And finally, a discussion of prerequisites for managing public-private partnerships in the national interest. Given the advantages to attracting private financing to support energy strategies, the paper describes the potential application of Public-Private Partnership frameworks in energy sector investments, including prerequisites and safeguards to ensure sustainability (Section VI).
7
II. THE CASE FOR ENERGY REFORM: SHORTCOMINGS OF THE
CURRENT SITUATION
The case for Caribbean energy sector reform rests on two pillars: (A) the current poor state of the
energy sector, with infrastructure and institutional frameworks needing upgrades to eliminate high-cost
inefficiencies and enable diversification; and (B) the fact that the macro-impact of current large energy
bills remains significant, even since the recent oil price decline.
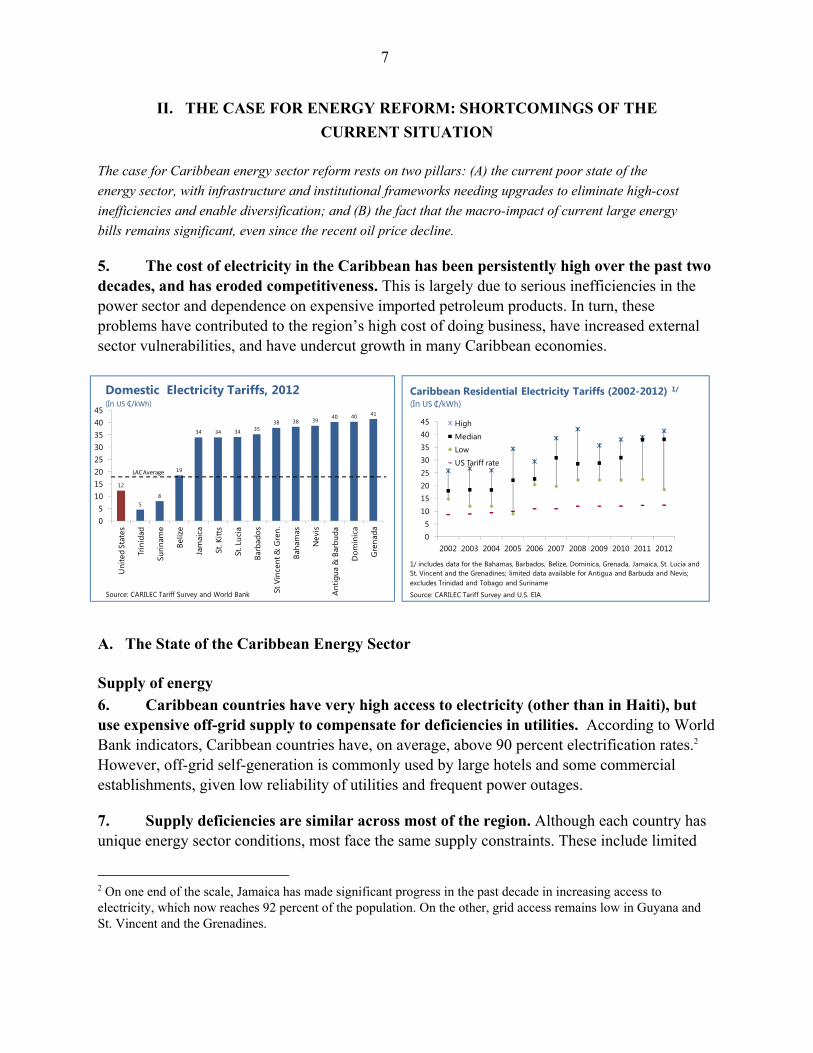
5. The cost of electricity in the Caribbean has been persistently high over the past two decades, and has eroded competitiveness. This is largely due to serious inefficiencies in the power sector and dependence on expensive imported petroleum products. In turn, these problems have contributed to the region’s high cost of doing business, have increased external sector vulnerabilities, and have undercut growth in many Caribbean economies.
A. The State of the Caribbean Energy Sector
Supply of energy 6. Caribbean countries have very high access to electricity (other than in Haiti), but use expensive off-grid supply to compensate for deficiencies in utilities. According to World Bank indicators, Caribbean countries have, on average, above 90 percent electrification rates.2 However, off-grid self-generation is commonly used by large hotels and some commercial establishments, given low reliability of utilities and frequent power outages.
7. Supply deficiencies are similar across most of the region. Although each country has unique energy sector conditions, most face the same supply constraints. These include limited
2 On one end of the scale, Jamaica has made significant progress in the past decade in increasing access to electricity, which now reaches 92 percent of the population. On the other, grid access remains low in Guyana and St. Vincent and the Grenadines.
12
58
19
34 34 34 3538 38 39
40 40 41
05
1015202530354045
Uni
ted
Stat
es
Trin
idad
Surin
ame
Beliz
e
Jam
aica
St. K
itts
St. L
ucia
Barb
ados
St V
ince
nt &
Gre
n.
Baha
mas
Nev
is
Ant
igua
& B
arbu
da
Dom
inic
a
Gre
nada
Domestic Electricity Tariffs, 2012(In US ₵/kWh)
Source: CARILEC Tariff Survey and World Bank
LAC Average
05
1015202530354045
2002 2003 2004 2005 2006 2007 2008 2009 2010 2011 2012
High
Median
Low
US Tariff rate
Caribbean Residential Electricity Tariffs (2002-2012) 1/
(In US ₵/kWh)
1/ includes data for the Bahamas, Barbados, Belize, Dominica, Grenada, Jamaica, St. Lucia and St. Vincent and the Grenadines; limited data available for Antigua and Barbuda and Nevis; excludes Trinidad and Tobago and Suriname
Source: CARILEC Tariff Survey and U.S. EIA
8
generation capacity, outdated power systems, isolated grids and lack of technical expertise that, together with episodes of high and volatile oil prices, have resulted in high average electricity costs. Electricity tariffs increased by almost 80 percent over 2002-2012, exceeding 0.30 US$/kWh for most countries in 2012.
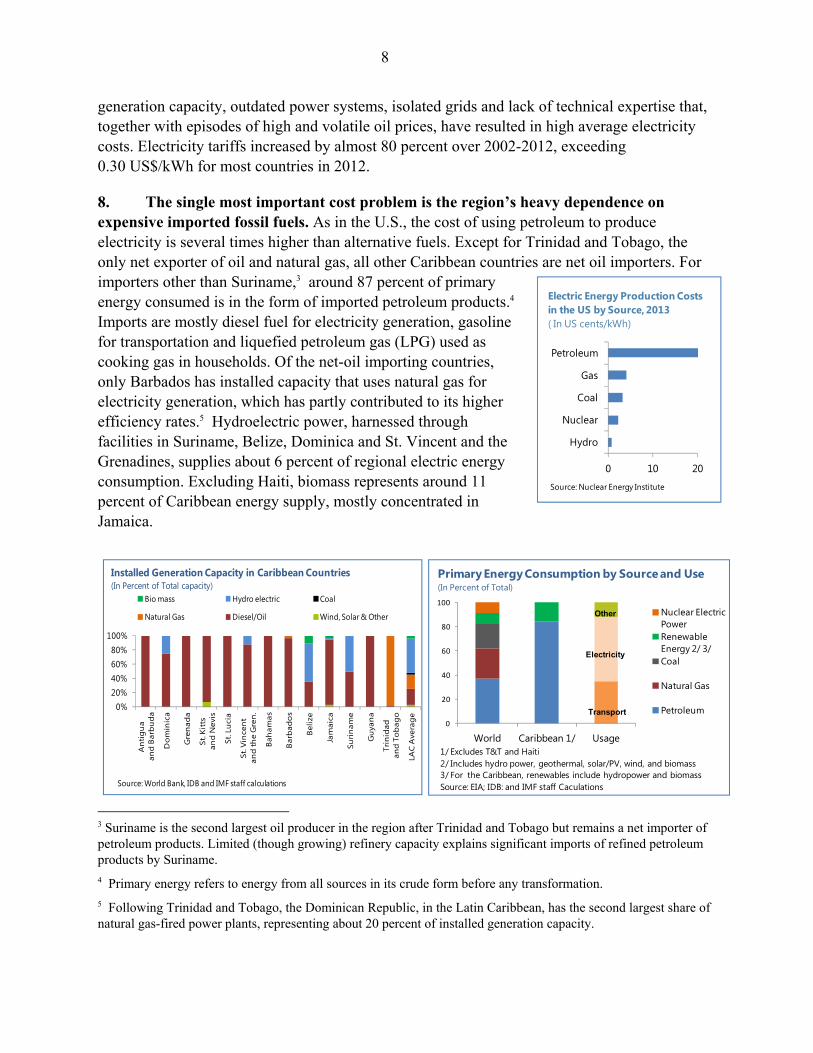
8. The single most important cost problem is the region’s heavy dependence on expensive imported fossil fuels. As in the U.S., the cost of using petroleum to produce electricity is several times higher than alternative fuels. Except for Trinidad and Tobago, the only net exporter of oil and natural gas, all other Caribbean countries are net oil importers. For importers other than Suriname,3 around 87 percent of primary energy consumed is in the form of imported petroleum products.4 Imports are mostly diesel fuel for electricity generation, gasoline for transportation and liquefied petroleum gas (LPG) used as cooking gas in households. Of the net-oil importing countries, only Barbados has installed capacity that uses natural gas for electricity generation, which has partly contributed to its higher efficiency rates.5 Hydroelectric power, harnessed through facilities in Suriname, Belize, Dominica and St. Vincent and the Grenadines, supplies about 6 percent of regional electric energy consumption. Excluding Haiti, biomass represents around 11 percent of Caribbean energy supply, mostly concentrated in Jamaica.
3 Suriname is the second largest oil producer in the region after Trinidad and Tobago but remains a net importer of petroleum products. Limited (though growing) refinery capacity explains significant imports of refined petroleum products by Suriname.
4 Primary energy refers to energy from all sources in its crude form before any transformation.
5 Following Trinidad and Tobago, the Dominican Republic, in the Latin Caribbean, has the second largest share of natural gas-fired power plants, representing about 20 percent of installed generation capacity.
0%20%40%60%80%
100%
An
tig
ua
and
Bar
bu
da
Do
min
ica
Gre
nad
a
St. K
itts
and
Nev
is
St. L
uci
a
St. V
ince
nt
and
the
Gre
n.
Bah
amas
Bar
bad
os
Bel
ize
Jam
aica
Suri
nam
e
Gu
yan
a
Trin
idad
an
d T
ob
ago
LAC
Ave
rag
e
Bio mass Hydro electric Coal
Natural Gas Diesel/Oil Wind, Solar & Other
Installed Generation Capacity in Caribbean Countries(In Percent of Total capacity)
Source: World Bank, IDB and IMF staff calculations
0
20
40
60
80
100
World Caribbean 1/ Usage
Nuclear Electric PowerRenewable Energy 2/ 3/Coal
Natural Gas
Petroleum
Primary Energy Consumption by Source and Use(In Percent of Total)
1/ Excludes T&T and Haiti2/ Includes hydro power, geothermal, solar/PV, wind, and biomass3/ For the Caribbean, renewables include hydropower and biomassSource: EIA; IDB: and IMF staff Caculations
Other
Transport
Electricity
0 10 20
Hydro
Nuclear
Coal
Gas
Petroleum
Electric Energy Production Costs in the US by Source, 2013 ( In US cents/kWh)
Source: Nuclear Energy Institute

9
9. An important burden on cost is that Caribbean power systems suffer from notable inefficiency and high system losses. For most countries, electricity generation relies heavily on medium-speed/low-speed generators running on diesel or heavy fuel oil, the efficiency of which is constrained by their age and old generation technology. The bulk of the power grids are also old and not adequately maintained, leading to significant technical and transmission losses. Commercial losses, resulting from illegal connections to the grid, are a significant problem.6
10. A second constraint is that the power market structure is undiversified and under-regulated. The Caribbean electricity market is served by a mix of state-owned and private utility companies (Table 1). For the most part, electric utilities are vertically integrated monopolies that hold exclusive licenses for generation, transmission, distribution and sale of electricity. Some of these monopolies are unable to finance necessary investments in generation capacity and the national grid, leaving consumers without access to reliable and affordable energy. The absence of adequately-staffed and independent national energy regulators in many countries leaves regulatory gaps unbridged.7
6 Commercial losses reach as high as 20 percent of net generation in Guyana and 16 percent in Jamaica, while Antigua and Barbuda and St. Kitts and Nevis suffer from significant operational inefficiency, with the highest rate of system losses in the ECCU.
7 For instance, in the ECCU, only Dominica has an independent national regulator. However, recently, the Eastern Caribbean Energy Regulatory Agency, ECERA, has been under pilot launch in Grenada and St. Lucia.
50
34
24 2420
15 1512 10 10 9 9 9 9 8 7
0
10
20
30
40
50
60
Hai
ti
Guy
ana
Jam
aica
Ant
igua
&Ba
rbud
a
St. K
itts&
Nev
is
The
Baha
mas
St. K
itts&
Nev
is
Beliz
e
Trin
idad
&To
bago
Surin
ame
St. L
ucia
Gre
nada
The
Baha
mas
Dom
inic
a
St. V
ince
nt&
Gre
n
Barb
ados
Power Utilities' Commercial and Technical Losses (in percent of net generation)
Source: CARICOM Energy Strategy.
Table 1. Electric Utility Companies in the CaribbeanCountry Power Utilities OwnershipAntigua and Barbuda Antigua Public Utilities Authority (APUA) State-OwnedBahamas Bahamas Electricity Corporation (BEC) State-Owned
Grand Bahama Power Company (GBPC) Privately-OwnedBarbados Barbados Power & Light-(P&L) Privately-OwnedBelize Belize Electricity Limited State-OwnedDominica Dominica Electricity Services Ltd. (DOMLEC) Privately-OwnedGrenada Grenada Electricity Services Ltd. (GRENLEC) Privately-OwnedGuyana Guyana Power & Light Inc.-State-(P&L) State-OwnedJamaica Jamaica Public Service Company (JPSCo) Privately-OwnedSt. Kitts and Nevis St. Kitts Electricity Department (SKELEC) State-Owned
Nevis Electricity Company Ltd. (NEVLEC) State-OwnedSt. Lucia St. Lucia Electricity Services Ltd. (LUCELEC) Private/Public entitySt. Vincent and the Grenadines St. Vincent Electricity Services Ltd. (VINLEC) State-OwnedSuriname Energy Companies of SurinameTrinidad & Tobago Trinidad & Tobago Electricity Commission State-Owned
PowerGen Private/Public enterprise

10
11. Pricing policy for electricity tariffs generally follows best practice by passing fuel costs on to consumers, with only sporadic subsidization. Most Caribbean utilities are allowed to pass fuel cost volatility to their customers through a flexible tariff structure that incorporates a fuel surcharge. This fuel cost recovery mechanism, implemented in response to oil price volatility, explains the region’s volatile electricity prices, since fuel costs are the highest share of utility companies’ service cost.8,9
Demand for energy 12. Despite the deterrent of high prices, Caribbean energy consumption has been growing, putting further pressure on total energy bills. Consumption has grown fastest in energy-rich Trinidad and Tobago, due to the abundance of natural gas, cheap electricity and a significant expansion in its hydrocarbon industries. But also consumption in the much smaller importers of the Eastern Caribbean almost tripled to reach 28.7 trillion BTU in 2012. 10
8 In 2011-2012, fuel costs accounted for around 70 percent of the average cost of electricity generation in countries where there is almost universal dependence on fuel oil for electricity generation.
9 There are, however, exceptions to the ‘no subsidization’ norm. Electricity tariffs in Trinidad and Tobago are much lower and do not incorporate a fuel surcharge as the utility company, T&TEC, uses domestically produced natural gas to generate electricity. In Suriname, electricity tariffs of about US$0.08 per kWh are heavily subsidized and do not cover the cost of generation (estimated at around US$0.16 per kWh). In Antigua and Barbuda, significant cross-subsidies exist between the public sector and the power utility, while in Guyana and St. Vincent and the Grenadines the government subsidizes electricity for some social groups and, in some cases, government departments.
10 Jamaica is the second largest electricity consumer, after Trinidad and Tobago, with aggregate consumption of 3.0 billion kWh in 2012 (32 percent of total regional electricity consumption excluding Trinidad and Tobago).
0.00
0.10
0.20
0.30
0.40
Barb
ados
(B
LPC)
St. L
ucia
(L
UCE
LEC)
Gre
nada
(GRE
NLE
C)
Dom
inic
a(D
OM
LEC)
Jam
aica
(JPS
)
St. V
ince
nt
and
the
Gre
n.(V
INLE
C)
Non-Fuel Op.Exp. Fuel Cost
Cost of Service in Some Regional Utility Companies, 2011 (In US $/kWh Sold)
Sources: IDB and 2012 Annual reports for BLPC, LUCELEC, GRENLEC, DOMLEC, JPS and VINLEC.
$26$31
$42
$57
$66$72
$100
$62
$79
$95
$0.20
$0.23 $0.23
$0.27 $0.28
$0.33
$0.40
$0.31$0.35
0.00
0.05
0.10
0.15
0.20
0.25
0.30
0.35
0.40
0.45
0
20
40
60
80
100
120
2002 2004 2006 2008 2010
Crude Oil price
Average Tarrif (RHS)
Impact of Oil Price Volatility on Tariff Prices(In US$)
Source: IDB, CARILEC and IMF staff calculations

11
13. Countries’ energy intensity depends on their economic structure.11 Guyana appears to be the most energy-intensive country among commodity exporters, while Barbados is the most energy-efficient country, consuming the least energy per unit of GDP. Antigua and Barbuda is the least efficient country in the ECCU and in tourism-dependent economies. On a per capita basis, tourism-dependent Caribbean economies appear more energy intensive than commodity-exporting countries like Belize, Guyana, Jamaica and Suriname; this is largely explained by how much larger the tourist population is in tourism-dependent economies relative to their small indigenous population.
14. The most energy intensive users include hotels in tourism-based economies, and the industrial sector in other Caribbean states. In tourism-based economies, commercial consumers, namely hotels and tourist establishments, are the most intensive energy users,
11 Tourism-dependent countries include ECCU countries, the Bahamas, and Barbados. Commodity exporters are those countries where at least 20 percent of total exports in 2008–2012 were natural resources, including agricultural commodities, and these include Belize, Guyana, Jamaica, and Suriname.
0
5
10
15
20
25
Guya
na
Surin
ame
Jam
aica
Beliz
e
Antig
ua &
Bar
buda
St. K
itts &
Nev
is
Gren
ada
Dom
inic
a
The
Baha
mas
St. L
ucia
St. V
ince
nt &
Gre
n.
Barb
ados
Energy Consumption Per Unit of GDP, 2012(Thousand BTU per 1 US$ of GDP, 2005 prices)
Source: EIA; and IMF Staff Calculations
20304050607080
1980
1982
1984
1986
1988
1990
1992
1994
1996
1998
2000
2002
2004
2006
2008
2010
2012
Tourism-based countries 1/
Commodity Exporters 2/
Energy Consumption per Capita, 2012(Million BTU per capita )
1/ includes ECCU countries , Barbados and the Bahamas2/Includes Jamaica, Belize, Guyana, and Suriname; excludes T&TSources: US EIA and IMF staff calculations.
0
100
200
300
400
500
60019
80
1982
1984
1986
1988
1990
1992
1994
1996
1998
2000
2002
2004
2006
2008
2010
2012
ECCU
Trinidad and Tobago
Other Caribbean
Growth in Primary Energy Consumption in the Caribbean(In percent of 1980 consumption)
Source: US EIA; IMF staff calculations
-1.0 2.0 3.0 4.0 5.0 6.0 7.0 8.0 9.0
0.01.02.03.04.05.06.07.08.09.0
Trin
idad
& To
bago
Jam
aica
The
Baha
mas
Surin
ame
Barb
ados
Beliz
e
Guy
ana
St. L
ucia
Antig
ua &
Bar
buda
Gre
nada
St. K
itts
& N
evis
St. V
ince
nt &
Gre
n.
Dom
inic
a
Net Consumption, 2012 (LHS)Average annual growth rate (1980-2012)
Net Consumption of Electricity Per Year(In billion kWh)
Source: EIA; and IMF Staff Calculations

12
absorbing around 41 percent of ex-transportation primary energy, with air conditioning accounting for almost half of consumption. Residential consumers are the second largest users. In commodity-exporting countries—where the productive base is larger—the industrial sector is the largest energy consumer with a share of about 57 percent.12 Of total primary energy consumed in the region, around 36 percent is for transportation.
B. The Macro-Impact of Energy Costs
15. Caribbean countries’ high dependence on imported oil contributes to their macroeconomic problems. The region’s dependence on imported fossil fuels has heavily exposed it to adverse oil market developments, with significant negative terms of trade shocks and some fiscal costs.
16. The high oil prices of the past decade have significantly contributed to macro-imbalances and undercut competitiveness.
External balances have suffered. In net oil-importing countries, the average value of net oil imports doubled between 2005-2014, reflecting worsening terms of trade. This widened the trade and current account deficit by an average of 3.7 percent of GDP annually, compared to the previous decade and put pressure on foreign exchange reserves.
The domestic economy has also suffered. The energy bill has absorbed a growing share of households’ discretionary income, reducing consumption spending in other sectors. In 2012, the national electricity bill in the Caribbean represented, on average, 9 percent of countries’ GDP, compared to 2½ percent of GDP in the US. Around 40 percent of Caribbean firms identify
12 For instance, in Jamaica, the bauxite industry is the single largest user of energy, surpassing the electricity sector, with a share of 37 percent. Jamaica’s sugar industry is also a significant energy consumer, using around 12 percent.
0%
20%
40%
60%
80%
100%
TotalCaribbean 1/
Tourism-dependent
CommodityExporters
Residential
Commercial
Industry
Public Sector
Power Consumption in the Caribbean by Sector(In Percent of Total)
1/ excludes Trinidad and Tobago and HaitiSource: IDB and IMF staff calculations
0
20
40
60
80
100
120
02468
10121416182020
00
2001
2002
2003
2004
2005
2006
2007
2008
2009
2010
2011
2012
2013
2014
2015
Non-oil deficit Oil deficit
Current account deficit Average oil price (US$; RHS)
Average Current Account Deficit in the Caribbean 1/
(In percent of GDP)
Sources: Country Authorities and IMF staff calculations.1/ Excludes Trinidad and Tobago and Haiti.
0 50 100
Dominica (2010)St. Kitts and Nevis (2010)
Dominican Republic (2010)St. Lucia (2010)
Barbados (2010)Antigua and Barbuda (2010)
Guyana, CR (2010)Belize (2010)
Jamaica (2010)St. Vincent and the Grenadines (2010)
Bahamas, The (2010)Suriname (2010)Grenada (2010)
Trinidad and Tobago (2010)
Other countries, average (2014 or latest)LA6, average (2014 or latest)
Caribbean average
Electricity as a Major Constraint to Firms
Percent of firms identifying electricity as a major constraint
Percent of firms owning or sharing a generator
Sources: World Bank Enterprise Survey (2015), Fund staff calculations.

13
electricity costs as a major constraint to doing business, which is higher than the average of LA6 and other developing countries. 13 This has increased uncertainty of investment planning, with unfavorable repercussions for capital formation, the inflow of FDI, and long-term growth.
17. The region has seen inflation and real exchange rate appreciation. Fixed exchange rate regimes in many countries, like Barbados, the Bahamas, Belize and the Eastern Caribbean states, have limited the extent to which the exchange rate can cushion the impact of oil price shocks on external balances. Large and persistent inflationary shocks from pass-through of higher fuel prices lead to real exchange rate appreciation and a difficult-to-reverse loss of competitiveness. Tourism, the mainstay of the economy in many Caribbean countries, is exceptionally exposed to spillovers from oil price shocks, through lower tourism receipts as higher oil prices dampen demand from key source markets and increase airfare costs, encouraging substitution to closer tourist destinations.
The high pass-through of oil price shocks has significantly contributed to inflation dynamics. Oil price increases directly impact headline inflation though a higher cost of electricity (a fuel surcharge) and higher transportation costs. Some of the energy price movement filters into core inflation and affects competitiveness.14
13 LA6 is Brazil, Chile, Colombia, Mexico, Peru, and Uruguay.
14 In the ECCU (with a fixed exchange rate), core inflation peaked at 4.7 percent y/y in November 2008, after oil prices surged to a record high of US$145 per barrel in July 2008. In Jamaica, headline and core inflation also reached all-time highs of 25.6 percent y/y and 15.8 percent y/y, respectively, in July 2008. In Suriname too, core inflation largely traced oil price swings, partly reflecting the automatic pass-through system of retail fuel prices in place since 2005; also the authorities raised the fuel tax by about 70 percent in January 2011, which along with a 20 percent devaluation of the official exchange rate, led to an increase of about 40 percent in fuel prices at the pump.
-1012345
-30-20-10
0102030
Jan-02 Jan-04 Jan-06 Jan-08 Jan-10 Jan-12 Jan-14
Fuel and Light Subindex
Core Inflation (RHS)
ECCU: Energy Price Volatility vs. Core Inflation 1/(Y/Y change in percent)
1/core inflation excludes food and fuel; weights are based on St. Lucia consumption basketSource: ECCB; IMF staff calculations
-10
0
10
20
-80
-40
0
40
80
120
Jan-05 Jan-07 Jan-09 Jan-11 Jan-13
Oil Price Jamaica (RHS) Suriname
Core Inflation Indices and Oil Price Volatility 1/(Y/Y change in percent)
1/ core inflation excludes food, fuel and transportation.2/ In Suriname, fuel tax increased by 70 percent in January 2011. Source: Country authorities; IMF staff calculations.

14
Inflationary shocks from oil price shocks feed in to real exchange rate appreciation. Inflationary shocks that are slow to decay can permanently alter an economy’s cost structure, particularly as the shock filters into higher wages, raising unit labor costs. Caribbean economies with fixed exchange rates are especially vulnerable as the monetary policy response is constrained. The resulting real exchange rate appreciation undermines competitiveness. The real effective exchange rate is significantly correlated with the lagged oil price (0.7 in 2006-2014), except in Grenada, Dominica and Belize.
18. Although energy prices in the region are relatively flexible, subsidies in some countries have negatively affected the fiscal accounts. Fuel and electricity prices in Trinidad and Tobago and Guyana have been heavily subsidized with an estimated annual fiscal burden of 2.7 percent and 3.0 of GDP, respectively, over 2011-2013. 15 In Suriname, below-cost electricity tariffs are facilitated through cross-subsidies and transfers between the government, the electric utility and the state-owned oil company estimated at around 2 percent of GDP in 2013 (Di Bella et al., 2015). In the rest of the region, flexible pricing mechanisms, mostly introduced over 2005-06, have reduced the fiscal impact by periodic adjustment of fuel market prices and electric tariff rates, with a residual consumption tax often absorbing the price volatility between adjustments. But given the scale of oil price movements, even price-smoothing has meant significant forgone revenue or lower profitability of electric utilities (and, for state-owned utilities, losses passed on to the fiscal accounts). Di Bella and et al. (2015) showed that in countries like Antigua and Barbuda, the Bahamas, Barbados, and Grenada, forgone tax revenue ranged from 0.4 to 0.6 percent of GDP from excise taxes on fuel and an average of another 0.5 percent of GDP from consumption taxes on electricity over 2011-13. On the expenditure side, higher prices have increased spending on the public sector’s own consumption of energy, leading in some cases, like St. Kitts and Nevis, to significant arrears to the electric utility. The
15 In St. Kitts and Nevis, the Sugar Industry Diversification Foundation (SIDF) has subsidized the fuel surcharge component of the electricity tariff for residential consumers since 2012; however, this subsidy significantly declined following the recent oil price decline.
0
40
80
120
160
70
80
90
100
110
120
130
140
Jan-
00
Jan-
01
Jan-
02
Jan-
03
Jan-
04
Jan-
05
Jan-
06
Jan-
07
Jan-
08
Jan-
09
Jan-
10
Jan-
11
Jan-
12
Jan-
13
Jan-
14
Jamaica Barbados Oil Price
Sources: IMF staff estimates.
Real Effective Exchange Rates (Index Number, Jan 2005=100)
85
95
105
115
20 40 60 80 100 120
REE
R
Oil Price at t-1
Antigua and Barbuda
St. Kitts and Nevis
St. Lucia
St. Vincent and the Gren. Trendline (Corr=0.71)
Correlation between REER and One-year Lagged Oil Price (2006-2014)

15
higher the public energy bill, the greater the need for expenditure cuts in other areas or higher taxes, to avoid energy costs worsening the fiscal balance and increasing public debt.
19. Disincentives to reform have delayed a response to the macroeconomic problems created by high energy costs. Because infrastructure energy projects are costly and often irreversible, governments have, in many cases, delayed the transition to technologies that generate affordable and efficient power, given perceived investment risks. Moreover, the availability of concessional oil financing under PetroCaribe Energy Cooperation Agreements, while offering relief against the oil price surge, has prolonged oil dependence by discouraging diversification into alternative fuels, and increased the region’s vulnerability to sudden stops of these inflows.
20. While challenges have become less pressing with the recent decline in oil prices, uncertainty remains high, and the size of gains depends partly on Petrocaribe. The currently lower oil prices will substantially improve the oil trade deficits of oil importing countries by an average of 3 percent of GDP in 2015, but the future for oil markets remains exceptionally uncertain (Box 1). Moreover, gains in 2015 will be partly offset by lower external financing from Venezuela through PetroCaribe, which is expected to decline by nearly 1 percent of GDP. While, in aggregate, countries will still gain in net terms, countries relying on PetroCaribe funds to finance some budget or quasi-fiscal activities will suffer fiscal pressures if savings from lower oil prices are passed through to the private sector while the public sector loses financing. The projected decline in financing implies the need for replacement financing or some adjustment estimated at around 0.7 percent of GDP on average in 2015 for countries where information is available.
PetroCaribe: StopsPetroCaribe:
Decrease in Oil Trade Deficit (A)
Decline in PetroCaribe
Financing (B)
Improvement in External Position
(A-B)
Improvement in External Position
Antigua and Barbuda 5.1 1.3 3.8 3.1Belize 2.4 2.4 0.0 -1.0Dominica 2.2 0.4 1.8 0.6Dominican Rep. 2.3 0.4 1.9 1.5Grenada 3.1 0.8 2.3 1.7Guyana 8.6 1.6 7.0 3.9Haiti 4.1 1.8 2.3 0.0Jamaica 4.0 1.3 2.7 1.5Nicaragua 4.0 1.8 2.2 -0.3St. Kitts and Nevis 1.9 0.7 1.2 0.5St. Lucia 1.5 0.0 1.5 1.5St. Vincent and the Gren. 1.8 0.7 1.1 0.4Suriname 5.0 0.0 5.0 5.0
Average 3.5 1.0 2.5 1.4
Source: IMF staff estimates.
Table 2: Net Benefit to Caribbean Economies from a Decline in Oil Prices(Percent of GDP)
Continues

16
Box 1. Recent Developments in the Global Oil and Gas Market
The sharp price declines in the global oil and gas market since mid-2014 have eased pressures on the external accounts of most oil-importing countries, including in the Caribbean. These developments may weaken incentives over the near-term to address energy sector challenges, but the outlook for oil prices remains highly uncertain, with some rebound expected.
World oil prices have witnessed significant volatility over the past decade. The spot price for West Texas Intermediate, one major indicator of crude oil prices, increased from an average of US$20 per barrel over 1990-2000 to a peak of US$145 in July 2008, before falling sharply to a low of US$33 in December 2008, after the global financial crisis. By early 2011, prices had recovered to over US$100, mainly on the back of political unrest in supplier countries in the Middle East and North Africa.
Following a period of relative stability, oil prices fell sharply in the second half of 2014. Oil prices remained high through June 2014 before plummeting by nearly 50 percent through January 2015. This represents the third largest oil price decline in recent decades (after the 1986 and 2008 collapses). The decline was less dramatic in real terms (based on the U.S. GDP deflator) and given the recent strengthening of the US dollar. Despite rebounding slightly in the first half of 2015, prices have subsequently declined again, averaging about $45/barrel ($55/barrel for Brent) in August 2015. Other fuel prices have also declined. Diesel fuel prices have dropped by around 30 percent as of end-June 2015, while natural gas prices declined by around 45 percent. 1/
The sharp decline in prices reflects a constellation of temporary and permanent supply and demand factors.2/ The currently slower pace of world growth and lower growth prospects for key emerging markets, like China and Brazil, and across Europe have dampened demand pressures. On the supply side, oil supply from by shale producers in North America, together with OPEC’s decision in November 2014 to maintain production levels to preserve market share, has increased downward price pressures. Long-term improvements in energy efficiency, greater reliance on alternate energy sources, including renewable energy, and geopolitical developments have also influenced oil price developments. The outlook is highly uncertain and volatility is expected to remain high. In the short-term, oil reserves made available by the increasing productivity of unconventional extraction will continue to exert downward pressure on prices. Over the medium term, as global demand for oil is set to rise, prices are expected to rebound somewhat, but remain below 2011-2014 levels. _______________________ 1/ Natural gas prices have traditionally broadly tracked oil prices—in part for contractual reasons, albeit with a lag (see Loungani and Matsumoto, 2012). While prices may differ substantially at times across markets (including at Henry Hub in the U.S., Russian gas price to Europe, Indonesian LNG, and Japan natural gas price), the average price fell by more than 40 percent between February 2014 and March 2015, remaining on average at US$2.8/MMBtu thereafter.
2/ see IMF (2015), Arezki and Blanchard (2014), Baumeister and Killian (2015), Killian (2015), and Baffes et al. (2015).
0
20
40
60
80
100
120
140
160
Jan-
1995
Jan-
1997
Jan-
1999
Jan-
2001
Jan-
2003
Jan-
2005
Jan-
2007
Jan-
2009
Jan-
2011
Jan-
2013
Jan-
2015
WTI Cushing Crude Oil Spot Price (Jan 1995- Aug 2015)(US$/bbl)
Source: U.S Energy Information Agency.
20
40
60
80
100
120
140
160
10 11 12 13 14 15
Brent Crude Oil; Jan 2015 vs. Jun 2014 Projections(U.S. dollars a barrel)
95% confidence interval86% confidence interval68% confidence interval
June 2014 Projections
January 2015 Projections
Source: World Economic Outlook.
-
1,000
2,000
3,000
4,000
5,000
6,000
7,000
8,000
1980
1982
1984
1986
1988
1990
1992
1994
1996
1998
2000
2002
2004
2006
2008
2010
2012
2014
OPEC OECD (incl. US shale) Rest of the world
World and OPEC crude oil and Gas Production(Million metric tons)
Source: BP Statistical Review of World Energy June 2015.

17
III. IMPACT OF ENERGY COSTS ON GROWTH: HOW IMPORTANT?
Before undertaking energy reforms, policymakers need to know the potential gains from doing so. This
section assesses how energy costs influence macroeconomic outcomes in Caribbean economies, by (A)
modeling the impact of oil price shocks on near-term growth and the real exchange rate; and (B)
assessing the potential for improving the efficiency of the power sector in delivering higher long-run
sustainable growth.
21. This section attempts to quantify the impact of energy costs on growth over both the short and long run. Such an exercise, while preliminary, is important to provide indicators of the gains that might accrue if countries undertake cost-cutting strategies. In other words, is energy sector reform worthwhile? The paper follows two distinct approaches—to estimate the impact of oil prices (and hence the energy bill) on growth in the short and medium term, and to estimate the impact of energy savings on the economy in the long run.
A. Impact of Oil Price Changes in the Short and Medium Term
Oil prices and GDP 22. Changes in real oil prices have an important short-term impact on growth, although other factors dominate.
Staff estimates suggest that movements in real oil prices explain, on average, 7 percent of real GDP growth variation in the Caribbean—with some variation across countries, ranging from 15 percent in Dominica to less than 1 percent in Guyana.16 This means that a reduction in countries’ dependence on oil would materially alleviate the cost of adverse price movements. That said, the exercise also showed that a greater share of real growth variation (30 percent) is explained by external demand shocks—meaning that energy sector reform alone cannot be presented as a panacea for solving Caribbean growth problems. The results are comparable to other Latin American countries such as Chile and Guatemala (Annex I, A).
16 In the short and medium-run, the impact of higher oil prices on real GDP growth and the real exchange rate of Caribbean economies is estimated with a Vector Auto-Regressive (VAR) model with block exogeneity restrictions in line with the spillover effects literature (Annex I). See Cashin and Sosa (2013) and Osterholm and Zettelmeyer (2008).
15 14 139 9 8 7 5 5 3 2 1 0 2 20
10
20
30
40
50
60
DMA GRD SUR JAM BLZ BHS LCA KNA TTO VCT ATG BRB GUY CHL GTMOil price AEs Demand AEs int. rate
Contribution of Oil Price Shocks to Variation in Real GDP Growth(Precent, average over 3 years)

18
1.8
2.83.0
3.8
0
1
2
3
4
1 year 5 years
Tourism Intensive
Commodity Producers
Impact of a 10% increase in oil prices on the rate of change of REER(Percentage points)
Sources: VAR model with exogenous shocks.
-0.2
-0.5
-0.05 -0.01
0.5
0.8
-0.6
-0.4
-0.2
0.0
0.2
0.4
0.6
0.8
1 year 5 years
Tourism IntensiveCommodity ProducersTrinidad and Tobago
Impact on real GDP growth of a 10% increase in oil prices (Percentage points)
Sources: VAR model with exogenous shocks.
A 10 percent increase in real oil prices reduces real GDP growth by about 0.5 percentage points over five years in tourism-intensive economies and 0.01 percentage point in commodity producers—other than in Trinidad and Tobago (an oil exporter), where the shock raises real GDP growth by 0.8 percentage points in five years.17
This impact on growth is less than would be inferred from using the IMF’s Flexible System of Global Models but the difference is likely to be explained by factors specific to the Caribbean (Box 2).
With the bulk of Caribbean countries highly dependent on imported oil, reducing dependency or improving energy consumption efficiency would lower fuel imports and ease pressures on the external accounts as well as dampen oil-related shocks to GDP.
Oil prices and competitiveness 23. Higher oil prices increase the rate of real effective exchange rate (REER) appreciation for both tourism-intensive economies and commodity producers. Staff estimates suggest that a 10 percent increase in oil prices could increase the REER appreciation rate (i.e., reduce competitiveness) by 2.8 percentage points over five years in tourism-intensive economies and 3.8 percentage points in commodity producers.18
B. Energy Consumption and Efficiency in the Long Run
24. Mitigating the negative impact of oil prices on growth and external competitiveness can be achieved through efforts to reduce oil dependency and lower the energy bill. While countries have no control over oil price movements, they can save over the longer run by diversifying their energy mix and improving the efficiency of energy consumption to reduce fuel imports and thereby limit the impact of price shocks. To assess the potential effectiveness of
17 These results are based on elasticities derived from impulse response functions (see Annex I, A).
18 See previous footnote.

19
such savings, the paper estimates the impact of energy consumption and efficiency on long-run output.19
25. A basic challenge for Caribbean countries is that more energy is needed for more growth. Data show that output per capita is strongly positively correlated with both the capital stock per capita and energy consumption per capita (Figure 1). In particular, the transformation of many Caribbean economies from agriculture-based to tourism-based has been accompanied by a significant capital accumulation and expansion of energy consumption as the tourism industry increased energy needs. For these economies to continue to grow and attract investment in tourism and other sectors, energy consumption will need to expand further. Results of the long run quantitative assessment show that an increase of 1 percent in energy consumption per capita could increase GDP per capita by about 0.14 percent points on average. Hence, since growth is likely to be accompanied with a growing energy share, countries will be able to contain the burden of the energy bill only by improving energy efficiency.20
26. Improvements in energy efficiency as well as investment in the energy sector both have a positive impact on long-run GDP. Staff estimates suggest that an improvement of 1 percent in energy efficiency would be accompanied by an increase in GDP per capita by 0.2 percent in the long run. An increase in 1 percent of gross capital formation per capita is associated with a 0.15 percent increase in long-run GDP per capita.21 In sum, staff results indicate that improving energy efficiency, including through diversification of the generation mix with cheaper and more efficient alternative energy sources and the adoption of energy efficient technologies, will have a significant impact on GDP in the long run (Annex I, C).
Figure 1. The Caribbean: GDP, Capital, and Energy Consumption (per capita)
Real GDP per capita is positively correlated with energy consumption per capita …….
… and the fixed stock of capital per capita
Sources: US. Energy Information Agency and IMF Staff calculations
19 For the long run, the role of energy consumption and efficiency in determining long-run output is estimated using the Augmented Mean Group estimator (AMG) developed by Eberhardt and Teal (2010), as an alternative to the model by Pesaran (2006) (Annex I, C).
20 Higher energy efficiency means reducing primary energy consumption per unit of GDP.
21 This estimate is based on capital formation for all sectors, not only in the energy sector.
y = 1.0156x - 4.9407R² = 0.5034
0
1
2
3
4
5
6
7
7 7.5 8 8.5 9 9.5 10 10.5
Rea
lGD
P p
er c
apit
a (l
ogg
ed)
Consumption of Energy per capita in logs
y = 0.9906x + 0.6987R² = 0.521
4
5
6
7
8
9
10
11
12
7 7.5 8 8.5 9 9.5 10 10.5
Rea
lGD
P p
er c
apit
a in
logs
Fixed capital stock per capita in logs

20
Box 2. Benchmarking the Results of the VAR to an Oil Price Shock To provide a benchmark for the VAR estimations we use the Western Hemisphere module of the IMF’s Flexible System of Global Models (FSGM) and simulate a 10 percent permanent increase in oil prices, as the VAR does.1 The results presented in the chart indicate that the FSGM model predicts a larger drop (-0.4 percentage point) in the GDP growth rate after an increase in oil prices, compared to the initial decline shown by the VAR (-0.1 pp). However, the result of the FSGM model falls within the confidence interval of the VAR, suggesting that both models are broadly consistent. There are three likely explanations as to why the FSGM results show a larger drop in output after an oil price shock.
The FSGM is not calibrated for tourism-based economies. Given limitations to data availability the FSGM model is calibrated to industrial countries; in particular, the response of the productive sector to an oil shock is calibrated for the manufacturing sector, which is more responsive to a change in oil prices than the tourism sector. The tourism industry’s consumption of energy is more inelastic: hotels cannot shut down air conditioning and lights in response to changes in oil prices, and have to absorb the losses (or gains) from changes in oil prices. Since the FSGM model does not incorporate these nuances of tourism-intensive countries, the decline in output is larger than in the VAR.
Loss absorption by state-owned Caribbean utilities. Another idiosyncrasy observed in some Caribbean countries studied is that utility companies, when state-owned, tend to partially absorb the oil price shock in their balance sheets, therefore reducing the need for households to adjust, which in turn results in a lower adjustment of consumption and growth to a change in oil prices. This effect can be seen in the balance sheets of state-owned utility companies in Antigua and Barbuda, Bahamas, St. Kitts and Nevis, Suriname, and Trinidad and Tobago, which have accumulated large balances of receivables from households and the public sector in periods where the oil price was high. Again, this absorption of losses (or gains) from the utility companies reduces the need for adjustment after an oil price shock, particularly through cushioning the impact on households’ consumption, and partly explains the difference between the VAR (which captures this effect) and the FSGM (which does not). However, this channel only operates in countries where the utility company is state-owned. In countries where the utility company is privately-owned, the balance sheets are in good shape—as in Barbados, Grenada, and Dominica.
A positive external demand shock may have offset the adverse impact of high oil prices over the previous decade. In the 2000s, economic performance in the Caribbean was dominated by strong external demand factors, with tourism-dependent economies experiencing strong growth in tourist arrivals and commodity exporters benefiting from rising commodity prices. The VAR controls for spillovers from advanced economies’ growth, but inflows of FDI and external receipts may have been idiosyncratically larger in the Caribbean during that period, counterbalancing the adverse impact of a four-fold increase in the average annual oil price over 2002-2008. This may have partly contributed to weaker than expected VAR estimates of the oil price impact on growth in the region.
_________________________ 1 The results of the module presented here are those for the group of countries that includes Bahamas, Barbados, Belize, Jamaica, Antigua and Barbuda, Grenada, Guyana, Haiti, St. Lucia, St. Vincent and the Grenadines, and Suriname. Annex I includes a brief description of the FSGM model, which is presented in detail in Andrle et al. (2015).
-0.8
-0.6
-0.4
-0.2
0.0
0.2
0.4
1 2 3 4 5
FSGMVAR
Note: The dotted lines are the 90 percent confidence interval for the VAR.
Real GDP Growth Response to a 10% Oil Price Increase (In percent)

21
IV. STOCKTAKING OF EXISTING ENERGY STRATEGIES: ADEQUACY AND
MACROECONOMIC IMPACT
Caribbean authorities have recognized energy sector challenges and their negative implications for their
economies since the mid-2000s. Most countries have formulated draft energy policies that spell out key
objectives and a general framework that focuses on shifting to cheaper energy sources and improving energy
efficiency. In some countries, action plans have been developed with specific targets, although progress on
implementation remains slow. In 2013, a Caribbean-wide initiative was undertaken to harmonize these
policies and an overall regional strategy was developed. This section takes stock of these strategies and,
where possible, estimates their expected savings.
27. Caribbean national energy sector strategies already exist, and specify the main recommended energy sector policies for the region. Staff surveyed countries’ existing energy strategies and found that most of them reflect international best-practice advice on policies to achieve energy sector transformation — regulatory reforms, improving energy efficiency and diversification of the generation mix. Figure 2 summarizes existing and proposed reforms in CARICOM states.
28. In 2013, a regional energy policy was approved by CARICOM and aligned with national energy policies developed by individual member states. The CARICOM energy policy (CEP) developed a framework for coordinated actions to achieve a range of the most important objectives, including: i) increased energy efficiency and conservation in all sectors, including the transportation sector; ii) establishment and enforcement of labeling and standards for the importation of electrical appliances as well as standards for vehicles importation; and iii) accelerated deployment of renewable and clean sources of energy to improve diversification and affordability.
29. The Caribbean Sustainable Energy Roadmap and Strategy (C-SERMS-Phase I) established an action plan to achieve the objectives of the CEP.22 The Roadmap sets specific regional energy targets in the following areas: (i) energy efficiency: 33 percent reduction in energy intensity by 2027; (ii) renewable power generation: 20 percent renewable power capacity by 2017 (currently at about 15 percent), 28 percent by 2022 and 47 percent by 2027; and (iii) CO2 emissions reductions of 18 percent by 2017, 32 percent by 2022, and 46 percent by 2027.23 The national targets set by countries for energy efficiency and renewable energy are aligned with these regional targets. Hence the Caribbean already has in place most of the key building
22 The Caribbean Sustainable Energy Roadmap and Strategy (C-SERMS) is a regional initiative led by CARICOM in collaboration with the Worldwatch Institute. The C-SERMS final Baseline Report and Assessment, published in October 2015, has benefited from the technical and financial support of the German Agency for International Collaboration (GIZ) and the Inter-American Development Bank (IDB). 23 Renewable energy and energy efficiency targets covered in C-SERMS may be subject to future revisions to ensure they remain fully aligned with the objectives of COP21 and the Intended Nationally Determined Contributions (INDCs) committed by countries.

22
blocks needed to achieve substantial energy reform—with some important exceptions on the regulatory side.
Figure 2. Summary of Existing and Proposed Energy Policies in CARICOM States
Source: Caribbean Sustainable Energy Roadmap and Strategy (C-SERMS).
A. Regulatory Reforms
30. Reform of the legal and regulatory framework for the Caribbean power sector is the first important prerequisite for sustainable and affordable energy solutions. In particular, reforms that address regulatory gaps relating to Independent Power Producers (IPPs) are key. Although independent generation is permitted in many Caribbean economies, no clear framework governs the licensing of utility-scale IPPs and their ability to sell to the grid. Facilitating licensing procedures and introducing feed-in tariffs and net billing schemes are likely to be critical to the development of private sector-led projects that supply electricity to the grid at competitive cost. IPPs are particularly instrumental for exploiting the renewable energy potential in the region and since these projects involve large upfront capital cost and no fuel cost, feed-in tariffs and net-billing schemes should aim to establish adequate cost recovery mechanisms to ensure viability while reducing the overall cost of energy. So far, net metering has been introduced in Barbados, Grenada, Jamaica, and St. Lucia.
31. Creation of independent national and/or regional regulators would help promote a predictable and transparent regulatory environment for energy investors. The lack of an independent regulator in many Caribbean countries is an impediment to new market entrants, given the need to assure them of a level playing field. Establishing an independent power sector regulator requires building sufficient institutional capacity to competently perform key functions
Renewable Energy Energy Efficiency
Feed-In Tariff
Net Meetering/ Billing
Renewable Portfolio/Standard Quota
IPPs Permitted
Tax CreditsTax Reduction/ Exemption
Public Loans/Grants
Green Public Procurement
Antigua and Barbuda Suggested X Suggested X X X Suggested Antigua and Barbuda Suggested SuggestedThe Bahamas
In development
In development
In development
X SuggestedThe Bahamas
Suggested Suggested Suggested X Suggested
BarbadosIn
developmentX
In developmen
tX X X X
Barbados
X X
Belize Suggested Suggested Suggested Suggested Belize SuggestedDominica X X X Dominica Suggested Suggested X Suggested SuggestedGrenada
Suggested XIn
development
XIn
developmentX
In development
Grenada
Suggested Suggested Suggested
Guyana Suggested X X Guyana Suggested X X SuggestedHaiti
Suggested Suggested Suggested X Suggested SuggestedIn
developmentHaiti
Suggested Suggested X
JamaicaX X X X X X
Jamaica In development
X X X
Montserrat Suggested Suggested Montserrat
St. LuciaSuggested X X Suggested X
St. Lucia In development
X
St. Kitts and Nevis X X X St. Kitts and Nevis
St. Vincent & the Grenadines Suggested X X Suggested Suggested
St. Vincent & the Grenadines Suggested X Suggested
SurinameIn
developmentSuggested X Suggested
Suriname
Suggested Suggested
Trinidad and TobagoIn
developmentSuggested X X Suggested
Trinidad and Tobago
Suggested X Suggested Suggested Suggested
Public Demonstration
Prohibited Use/
Import of Incandesce
nt Bulbs
Appliance Labeling
Standards
Regulatory Policies Fiscal Incentives and Public Financing
National Energy
Efficiency Standards
Tax CreditsTax
Reduction/ Exemption
23
of tariff-setting, license issuance and effective market oversight. The pilot launch of the Eastern Caribbean Energy Regulatory Authority (ECERA) project in Grenada and St. Lucia, facilitated by US$5.6 million in credit facilities from the World Bank’s IDA, has aimed to promote these objectives in the ECCU as well as provide advisory services to governments on renewable energy development, electricity sector plans and cross border interconnection.
B. Improving Energy Efficiency
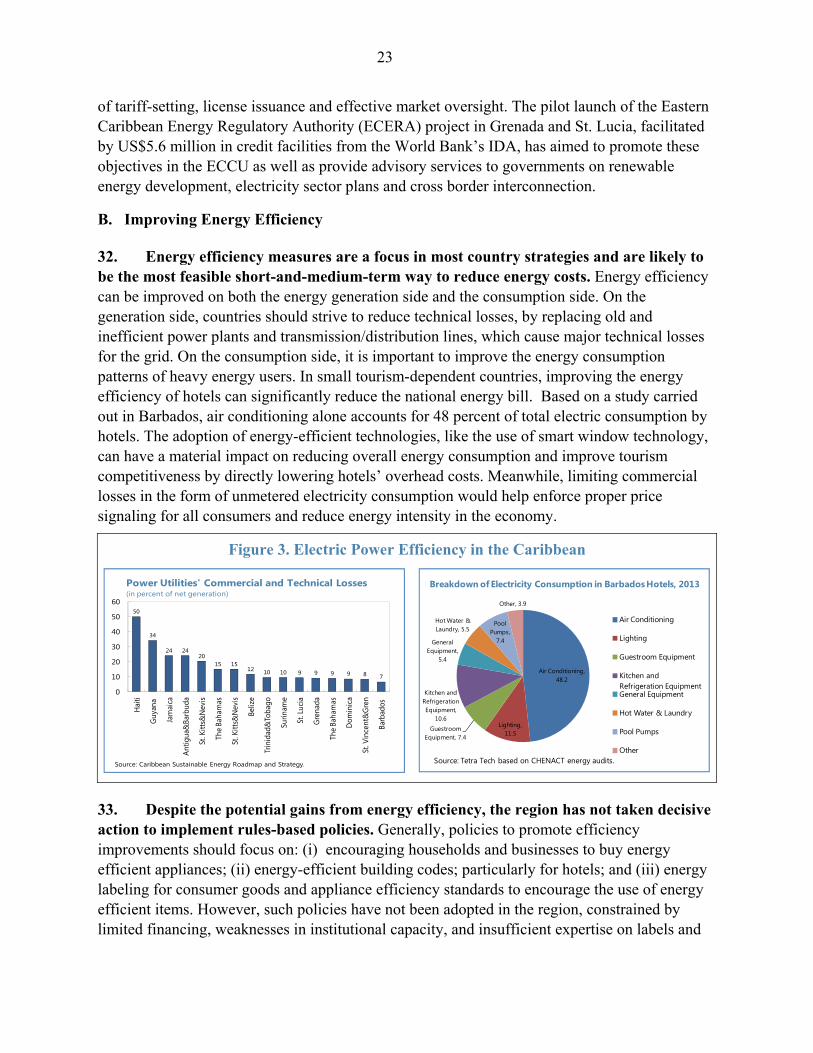
32. Energy efficiency measures are a focus in most country strategies and are likely to be the most feasible short-and-medium-term way to reduce energy costs. Energy efficiency can be improved on both the energy generation side and the consumption side. On the generation side, countries should strive to reduce technical losses, by replacing old and inefficient power plants and transmission/distribution lines, which cause major technical losses for the grid. On the consumption side, it is important to improve the energy consumption patterns of heavy energy users. In small tourism-dependent countries, improving the energy efficiency of hotels can significantly reduce the national energy bill. Based on a study carried out in Barbados, air conditioning alone accounts for 48 percent of total electric consumption by hotels. The adoption of energy-efficient technologies, like the use of smart window technology, can have a material impact on reducing overall energy consumption and improve tourism competitiveness by directly lowering hotels’ overhead costs. Meanwhile, limiting commercial losses in the form of unmetered electricity consumption would help enforce proper price signaling for all consumers and reduce energy intensity in the economy.
Figure 3. Electric Power Efficiency in the Caribbean
33. Despite the potential gains from energy efficiency, the region has not taken decisive action to implement rules-based policies. Generally, policies to promote efficiency improvements should focus on: (i) encouraging households and businesses to buy energy efficient appliances; (ii) energy-efficient building codes; particularly for hotels; and (iii) energy labeling for consumer goods and appliance efficiency standards to encourage the use of energy efficient items. However, such policies have not been adopted in the region, constrained by limited financing, weaknesses in institutional capacity, and insufficient expertise on labels and
50
34
24 2420
15 1512 10 10 9 9 9 9 8 7
0
10
20
30
40
50
60
Hai
ti
Guy
ana
Jam
aica
Antig
ua&
Barb
uda
St. K
itts&
Nev
is
The
Baha
mas
St. K
itts&
Nev
is
Beliz
e
Trin
idad
&To
bago
Surin
ame
St. L
ucia
Gre
nada
The
Baha
mas
Dom
inic
a
St. V
ince
nt&
Gre
n
Barb
ados
Power Utilities' Commercial and Technical Losses (in percent of net generation)
Source: Caribbean Sustainable Energy Roadmap and Strategy.
Air Conditioning, 48.2
Lighting, 11.5
Guestroom Equipment, 7.4
Kitchen and Refrigeration Equipment,
10.6
General Equipment,
5.4
Hot Water & Laundry, 5.5
Pool Pumps,
7.4
Other, 3.9
Air Conditioning
Lighting
Guestroom Equipment
Kitchen and Refrigeration EquipmentGeneral Equipment
Hot Water & Laundry
Pool Pumps
Other
Breakdown of Electricity Consumption in Barbados Hotels, 2013
Source: Tetra Tech based on CHENACT energy audits.

24
standards.24 Figure 2 includes a list of countries where national energy efficiency standards are under consideration.25
34. Energy efficiency has not yet been addressed in Caribbean building codes. Instead, the focus has been on safety and minimizing damage from hazards and natural disasters such as fires, hurricanes, and earthquakes. An Organization of American States’ study on energy policy in the Caribbean (2010-11) emphasized that better enforcement of building codes offers an opportunity to significantly improve energy efficiency, since (based on US data) energy use in buildings typically accounts for one-third of all types of energy and two thirds of all electricity.
35. Policy action to promote energy efficiency has focused on the provision of fiscal incentives. In Guyana, tax exemptions have been used to encourage efficient lighting. In Trinidad and Tobago, a tax allowance of 150 percent has been granted to commercial and industrial enterprises for expenditure on energy savings systems.26 There are as yet no incentives to encourage businesses, particularly hotels, to conduct energy audits, although audits provide an important baseline of data and information to help identify areas for improvements in energy efficiency.27
36. Incentives for adoption of energy-efficient technologies could boost energy conservation efforts but must be cost-effective. Although use of fiscal incentives to sponsor the adoption of energy-efficient technologies and equipment by households and commercial establishments may promote higher penetration of these technologies, these increase pressures on the budget and their net benefit needs to be carefully assessed, particularly in the case of many potential “free-riders”—consumers and businesses who would have purchased efficiency measures even without the tax incentive.
37. New technologies could help improve energy efficiency. An energy efficiency cost curve estimated by the IDB suggests a range of commercially and economically viable strategies to improve efficiency, including compact fluorescent lamps, power monitors, and efficient window and split air conditioning systems. At tariff rates of US$0.32/kWh or above, all energy-efficient technologies in the chart would be commercially viable. Eight energy-efficient
24 The Eastern Caribbean Energy Labeling Project (ECELP) is a project that was launched in 2012, in the context of the Caribbean Renewable Energy Development Program (CREDP), in collaboration with the OECS Secretariat.
25 Jamaica is the only Caribbean country to have drafted national energy efficiency standards. Also, in 2010, St. Lucia published a list of standards for electrical systems and lighting. It is unclear whether these standards are enforced
26 Available information indicates that specific targets have not yet been set.
27 An energy audit is a survey and analysis of energy flows in a building or system to reduce the amount of energy input without negatively affecting the output.
0.320.32
0.30.25
0.220.2
0.160.11
0.10.09
0.080.04
0.02
0 0.05 0.1 0.15 0.2 0.25 0.3 0.35 0.4 0.45
LED Street LightingEfficient Retail Refrigerators (Condensing Unit)
Efficient Residential RefrigeratorsLCD Computer Monitors
T5 High Output Fluorescent LampsEfficient Chillers
T8 Fluorescent Lamps w/ Occupancy SensorEfficient Split A/C SystemsVariable Frequency Drives
Efficient Window A/C SystemsPremium Efficiency Motors
Power MonitorsCompact Fluorescent Lamps (CFLs)
Energy Efficiency Cost Curve(in US$ per kWh)
Source: IDB's Prefeasibility Study for Natural Gas.

25
technologies would be economically viable at average generation costs of US$0.20/kWh.28
38. Some CARICOM states have set energy efficiency targets that, if achieved, would have a positive macroeconomic impact. Figure 4 shows the long-term targets and estimated macro-economic effects of reaching them, namely, important savings in fuel imports and the national electricity bill. 29 For instance, if Antigua and Barbuda meets its target of improving overall energy efficiency in the economy by 20 percent (including the transport sector), estimated impacts are: an equivalent 20 percent drop in oil imports; a 13 percent decline in the national energy bill; and a long-run cumulative increase of 4 percent in the level of GDP over the long-run. The right-hand panel of Figure 4 shows that most CARICOM states that have specified energy efficiency targets would reap significant benefits from reaching them. 30
28 Technologies that can save electricity for less than it costs to generate the electricity are considered ‘economically viable’. Any technology with a cost per kWh saved less than the tariff are considered ‘commercially viable’.
29 The economic impact of achieving energy efficiency targets is estimated based on: (i) the implied reduction in fuel imports for electricity generation (and transportation, where relevant); (ii) the implied reduction in the national electricity bill of end-users from introducing energy efficient technologies at an average cost of US$0.13/kWh (using the energy efficiency cost curve from the Castalia report for Barbados) ; and (iii) the implied impact on long-term GDP using the elasticity of GDP to energy efficiency from the econometric analysis (Annex I, C). 30 See table 4 for a summary of the effective efficiency targets when normalized to a uniform base of energy consumption in the entire economy and the associated macroeconomic impact.
Figure 4. National Energy Efficiency Targets and Implied Effects
Sources: Caribbean Sustainable Energy Roadmap and Strategy (C-SERMS), Castalia Reports, IDB, WEO, and IMF staff estimates.
Haiti Achieve 36% of households using improved cooking stoves by 2015
Jamaica Reduce energy intensity from 22 million to 6.3 million joules per USD of GDP by 2030
Trinidad and Tobago No target currently exists; however, a 150% tax allowance is granted to commercial and industrial enterprises that
achieve a target % of energy efficiency improvement (target currently being determined)
Montserrat NoneSt. Lucia Reduce public sector electricity consumption 20% by 2020
St. Kitts and Nevis Reduce projected electricity demand 20% by 2015 (resulting in peak demand of 45.7 MW)
St. Vincent and the Grenadines
Reduce projected increase in peak demand 5% by 2015 and 10% by 2020
Reduce power losses 7% by 2015 and 5% by 2020Reduce electricity generation 15% by 2020
Suriname None
Dominica Reduce public sector electricity consumption 20% by 2020Grenada NoneGuyana Remove duties and taxes on energy-efficient CFLs and LED
lights
The Bahamas NoneBarbados Reduce electricity consumption 22% compared to business-
as-usual by 2029
Belize Improve energy efficiency and conservation by at least 30% by 2033 (suggested)
Overview of National Energy Efficiency Targets in CARICOM Member StatesCountry Energy Efficiency
Antigua and Barbuda Improve energy efficiency 20% by 2020
0% 20% 40% 60% 80%
Dominica
St. Lucia
Barbados
St. Kitts and Nevis
St. Vincent and the Grens.
Antigua and Barbuda
Belize 2/
Jamaica
Effective Efficiency Target 1/
Implied reduction in oil imports
Implied reduction in the national electricity bill
Implied impact on long-term GDP level
1/ Announced targets shown on the left are normalized to the same base to reflect the targeted improvement in energy consumption in the entire economy, including the transport sector. 2/The impact on the national electricity bill from achieving the target reflects the smaller savings from energy efficiency technologies in Belize, where the electricity tariff rate is relatively low.
National Energy Efficiency Targets and Implied Effects(in percent, cumulative over the period of long-term target)

26
C. Diversifying the Generation Mix
39. The other main focus of most reform strategies is a diversification of energy sources, especially towards cost-effective renewables. Some Caribbean countries already have existing renewable energy capacities in their generation mix. Figure 5 shows the current installed capacity of renewable power in CARICOM states. While countries such as Belize and Suriname have considerable renewable power capacities, more than half of the countries in the region still have a very low share of renewables in their energy mix. Hydropower comprises the majority of installed renewable power capacity. But other renewable energy technologies, using biomass, wind and solar power, are also becoming more commonly deployed, with increased private sector participation.
Figure 5. Installed Capacity of Renewable Energy
40. The region possesses significant renewable energy potential that can be exploited. Some CARICOM states have conducted assessments that give an overview of available renewable energy resources. Table 3 summarizes viable renewable energy sources by country. Except for Antigua and Barbuda, ECCU countries have significant geothermal potential that can cover their likely base load, allowing for potential self-sufficiency in electric power generation. Geothermal development is advanced in Dominica, Nevis and Montserrat, with progress in St. Vincent and the Grenadines. St. Kitts has launched several solar power initiatives, including two solar farms, while, in Jamaica, three renewable energy projects have recently been developed—two wind plants and a solar farm.
-
10
20
30
40
50
60
70
80
90
0
10
20
30
40
50
60
Belize Dominica Haiti Guyana Jamaica St. Kitts and
Nevis
Grenada Barbados
Biomass and Other
Solar
Wind
Hydro
Total Renewables (MW, right)
Installed renewable capacity by source(in percent of total capacity)
Source: CARICOM Caribbean Sustainable Energy Roadmap.
0%
10%
20%
30%
40%
50%
60%
70%
Installed renewable power capacity(in percent of total power capacity)
Source: CARICOM Caribbean Sustainable Energy Roadmap.
Table 3: Summary of Viable Renewable Energy Sources by Country
Country Solar
Wind
Geotherm
al
Hydro
Biomass
Antigua and Barbuda Dominica Grenada St. Kitts and Nevis St. Lucia St. Vincent and the Grens. The Bahamas Barbados Guyana Haiti Jamaica Suriname Source: CARICOM Caribbean Sustainable Energy Roadmap

27
41. Diversifying the generation mix, by replacing fuel oil with renewable energy, would offer substantial cost reductions. Estimates of renewable energy costs by the U.S. Energy Information Agency and the International Renewable Energy Agency (IRENA) show that the bulk of renewable energy technologies appear to be economically viable, with generation costs of US$0.20/kWh or less.
42. Staff estimates indicate significant positive macroeconomic impacts from meeting the renewable energy targets in the CARICOM roadmap. Figure 6 shows renewable energy targets and the impact of their implementation on the national electricity bill and fossil fuel imports in respective Caribbean countries. 31 There are also implied gains for long-run GDP.
Figure 6. Renewable Energy Targets and their Implied Effects
Sources: Caribbean Sustainable Energy Roadmap and Strategy (C-SERMS), Castalia Report, IDB, WEO, and IMF staff estimates.
31 The economic impact is based on achieving the target using viable renewable power technologies, up from the existing penetration rate in each country. (i) The implied reduction in fuel imports for electricity generation reflects the replacement of fossil fuel-based generation capacity; (ii) the implied reduction in electricity tariffs assumes a 100 percent pass-through of cost savings from the introduction of renewable energy; generation costs for each technology are based on data from the California Public Utilities Commission Report and International Renewable Energy Agency; (iii) The implied impact on long-term GDP level is based on the elasticity of long-term GDP to energy efficiency from the econometric analysis (Annex I, C).
Country
Antigua and Barbuda
The Bahamas
Barbados
Belize
Dominica
Grenada
Guyana
St. Lucia
St. Kitts and Nevis
St. Vincent and the Grenadines
Trinidad and Tobago
100% by 202025% by 2010, 100% through the addition of
geothermal by 2020
Overview of Renewable Energy Targets in CARICOM Member StatesRenewable Energy
SupplyElectricity from Renewables
15 % by 2030 20% by 2020
30% by 2030 15% by 2020; 30% by 2030
10% by 201220% by 2026
29% by 2029
Reduce fossil fuel dependence 50% by 2020
89% by 2033
20% by 202010% by 2013 (Grenada), 20% by 2017
(Grenada), 40% by 2011 (Carriacou and Petite Martinique), 100% by 2030 (no date given)
90% through hydro development Install 15,000 solar home systems (no date given)
Jamaica 20% by 203012.5% by 201520% by 2030
35% by 20205% by 2013; 15% by 2015
30% by 2020
20% by 2015100% by 2010 (Nevis)
5% of peak demand (or 60 MW) by 2020
30% by 201560% by 2020
0.30
0.21
0.18
0.16
0.10
0.09
0.08
0.07
0.06
0.00 0.10 0.20 0.30 0.40
Solar PV (Small-scale)Solar Thermal
Wind (Offshore)Solar PV (Utility-scale)
Geothermal (10MW)Biomass
Wind (Onshore)Hydroelectric
Geothermal (100 MW)
Renewable Energy Cost Curve 1/
(in USD per kWh)
1/ Reflects estimated average levelized cost of electricity (LCOE) in 2013, including capital costs, for new generation resources over a useable life of 30 years. Sources: U.S EIA 2015 Annual Energy Outlook, International Renewable Energy Agency and and IMF staff estimates.
0% 50% 100%
Antigua and Barbuda
Jamaica
Barbados
The Bahamas
St. Lucia
St. Kitts and Nevis 1/
St. Vincent and the Grens.
Belize
Guyana
Dominica
Grenada
Renewable target of electricity
Implied reduction in oil imports
Implied reduction in the national electricity bills
Implied impact on long-term GDP level
National Renewable Energy Targets and Implied Effects(in percent, cumulative over the period of long-term target)
1/ Target is the average of a 20 percent renewable target for St. Kitts and 100 percent target for Nevis, weighted by size of electricity generation on each island.

28
D. Potential Gains from Reform
43. Taken together, the potential gains from pursuing already-specified energy strategies are substantial. Tables 4 and 5 present summary estimates of what could be achieved by meeting country targets for efficiency improvements and renewable (see footnote 28 and 30). While some national targets are quite ambitious (such as 100 percent renewable energy in Dominica and Grenada), and the estimates of gains from meeting the targets are necessarily broad-brush, they signal the possibility of important eventual savings if the energy sector can be transformed so as to achieve them.
Implied reduction in oil
imports
Implied reduction in the national
electricity bill 2/
Implied impact on long-term
GDP level
Antigua and Barbuda 20% 10% 6% 1%
Jamaica 20% 5% 4% 0%
Barbados 29% 13% 6% 1%
The Bahamas 30% 17% 11% 1%
St. Lucia 35% 22% 11% 1%
St. Kitts and Nevis 3/ 40% 24% 9% 1%
Belize 89% 25% 10% 1%
Guyana 90% 28% 21% 2%
Dominica 100% 45% 16% 2%
Grenada 100% 49% 31% 3%
Table 5. Implied Effects of Renewable Energy TargetsImplied Effects 1/
Renewable Energy
Target for Electricity
Country
Sources: CARICOM Caribbean Sustainable Energy Roadmap, Castalia Report, IDB, and IMF staff estimates.
1/ Reflects the impact of achieving the target using viable renewable power technologies, up from the existing renewable penetration rate in each country. 2/ Assumes a 100 percent pass-through of cost savings from renewable energy technologies to end-users.3/ Target is the average of a 20 percent renewable target for St. Kitts and 100 percent target for Nevis, weighted by size of electricity generation on each island.
Implied reduction in oil
imports
Implied reduction in national
electricity bill 2/
Implied impact on long-term
GDP level
Dominica 1% 1% 1% 0%
St. Lucia 1% 1% 1% 0%
Barbados 12% 11% 9% 2%
St. Kitts and Nevis 12% 11% 8% 2%St. Vincent and the Grens. 12% 10% 5% 2%
Antigua and Barbuda 20% 20% 13% 4%
Belize 3/ 30% 20% 1% 6%
Jamaica 71% 69% 31% 14%
CountryEffective Efficiency Target 1/
Implied Effects
Sources: CARICOM Caribbean Sustainable Energy Roadmap, Castalia Reports, IDB, WEO, and IMF staff estimates.
Table 4. Implied Effects of Energy Efficiency Targets
1/ Announced efficiency targets presented in the Caribbean Sustainable Energy Roadmap (see figure 4) are normalized to the same base to reflect targeted improvement in energy consumption in the entire economy, including the transport sector.
2/ Reflects savings in the energy bill of end-users from introducing energy efficient technologies at an average cost of US$0.13/kWh. (See energy efficiency cost curve, paragraph 36). 3/ The impact on the national electricity bill from achieving the target reflects the smaller savings from energy efficiency technologies in Belize, where the electricity tariff rate is relatively low.
29
V. TRANSFORMING THE ENERGY SECTOR: HOW EXPENSIVE AND HOW
FEASIBLE?
Energy sector transformation may require significant upfront investments to make necessary upgrades and introduce renewable energy and energy-efficient technologies. With the IDB’s support, staff estimated the investment envelope needed to implement the energy strategies already specified by Caribbean countries. However, public sector financing of large scale investments is often constrained by the limited fiscal space and the high debt burden faced by many Caribbean economies. This section examines the implications for public debt sustainability under different financing scenarios, including by formalizing the impact of public sector financing of energy investments in a debt-dynamics equation.
A. Energy Sector Investment Needs
44. National and regional energy strategies imply a need for investments to achieve their announced targets, but do not quantify their cost. Most of the renewable and energy efficiency initiatives identified in the C-SERMS framework involve significant upfront capital investments that are beyond the financing capabilities of most electric utilities in the region. Similarly, national energy action plans have not outlined the scale of investment required for their implementation or potential sources of financing. Significant investment is also needed to upgrade existing power infrastructure, reduce technical losses and ensure system integrity in the face of growing demand for electricity.
45. IDB-based estimates suggest that total energy sector investment requirements amount to about 7 percent of regional GDP. These cover investments to: i) expand and upgrade existing power plants to meet growing demand for electricity, improve generation efficiency and reduce system losses; ii) introduce renewable energy sources like geothermal, solar, wind and hydro power in countries where these technologies are viable; and iii) implement energy efficiency initiatives, including solar water heating systems, smart street lighting, etc.32 The IDB also estimated the size of the investment envelope for introducing natural gas in Western Caribbean countries, including the cost of converting existing power plants to natural gas and the construction of re-gasification terminals for liquefied natural gas (LNG). In the ECCU, where introducing natural gas is less feasible, the IDB’s investment estimates focused on the cost of developing geothermal power, which has significant potential and can cover a significant share of the islands’ base load. 33 In Antigua and Barbuda, where geothermal is not a viable resource, the cost of renewable energy investments was estimated based on the cost of existing plans for installing 10MW of solar PV panels and staff estimates of the cost of 11MW of wind power technology, consistent with achieving the country’s 2020
32 Investments for new plant equipment cover projected needs through 2023.
33 Geothermal power development includes cost of preliminary testing, full exploration and 10MW geothermal plant development (see Table A2.3 in Annex II).

30
Building/ Upgrading
power plants 1/
Introducing Natural Gas Facilities 2/
Renewable Energy
Investments 3/ 4/
Energy Efficiency
and Conservation Initiatives 5/
Total Investment
Total Investment (%GDP)6/
Average GDP
Growth (2006-2015)
Gross Public Debt (% of GDP)
6/
The Bahamas 150 251 70 40 511 5.8 0.4 60.8Barbados 190 129 80 40 439 9.9 0.6 103.8Belize 59 - - 59 3.3 2.6 78.1Guyana 135 110 5 20 270 8.4 4.4 70.2Jamaica 400 280 60 120 860 6.2 0.1 127.7Suriname 100 223 45 10 378 7.5 3.8 36.9ECCU 421 30 451 9.8 1.2 82.9
Antigua & Barbuda 42 5 47 3.7 1.2 101.9Dominica 52 5 57 10.6 2.4 79.4Grenada 88 5 93 9.7 0.7 90.3St. Kitts and Nevis 87 5 92 10.3 2.0 66.3St. Lucia 66 5 71 4.9 1.1 82.6St. Vincent & Gr. 87 5 92 12.0 1.0 77.0
Region Total 975 1,052 681 260 2968 6.9 1.9 80.0
Source: IDB and IMF staff estimates.
2/ Includes estimated costs of converting existing plants to natural gas and the construction of regasification facilities.3/ Includes solar, hydro, wind, and waste-to-energy projects. For the ECCU, reflects cost for geothermal power development.4/ For Antigua and Barbuda, reflects cost estimates for solar and wind power peneration of 20 percent by 2020. 5/ Includes cost for solar water heaters, grid loss reduction, street lighting retrofit and smart fund for EE projects.6/ Based on 2015 estimates
Table 6: Energy Sector Investment Needs in the Caribbean (2018-2023) (in millions of USD)
1/ Includes cost of building new capacity of natural gas-fired power plants. IDB estimates do not include expansions for generation capacity in Belize, which imports a significant share of its electric power from Mexico. For Guyana and Suriname includes costs for rural electrification.
target of 20 percent renewable power penetration.34 The exercise excludes Trinidad and Tobago, the region’s sole energy exporter.
46. As a share of GDP, energy investment needs are highest in Eastern Caribbean countries. The cost of required investments represents on average of about 9.8 percent of GDP in ECCU countries. This is largely the result of the significant cost involved in geothermal power development. However, efficiency gains from geothermal power are expected to be substantial, providing for long-term energy security and considerable cost savings compared to conventional generation using fuel oil. The introduction of natural gas facilities in Western Caribbean countries is also significant, with the bulk of the future installed capacity expected to be run by natural gas following investments in converting existing plants to natural gas-fired
34 Installation cost estimates for wind power technology are from the International Renewable Energy Agency (IRENA): “Renewable Power Generation Costs in 2014”.
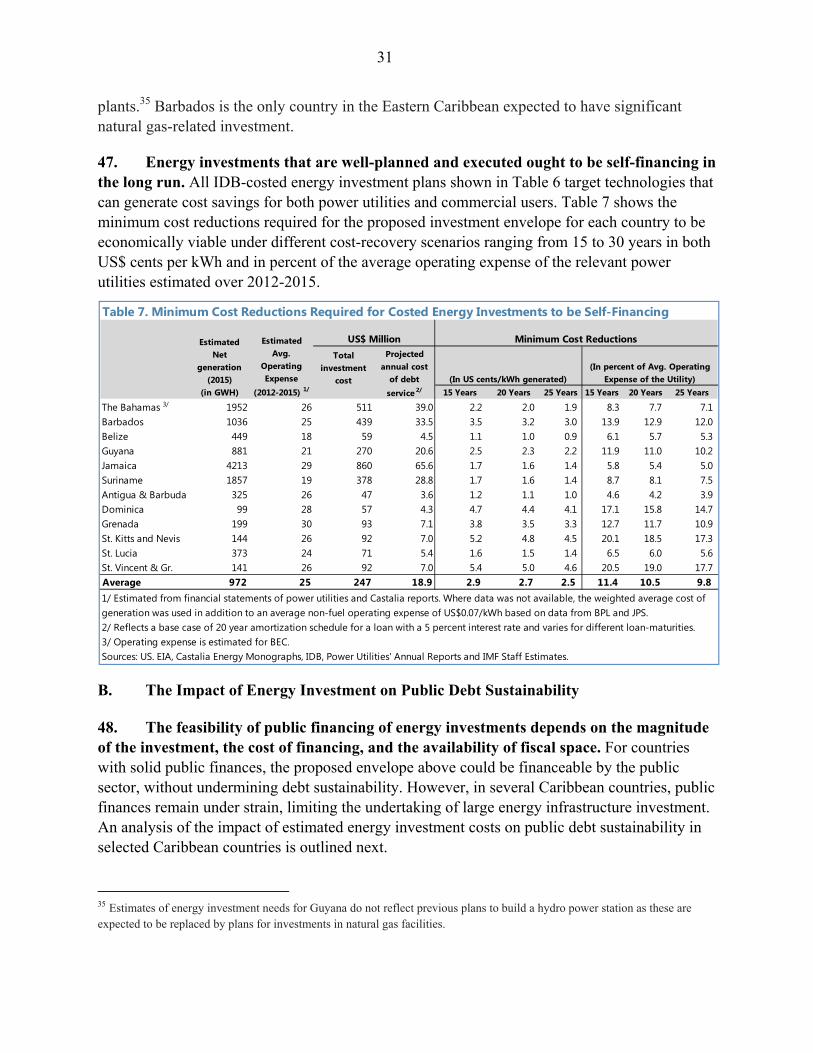
31
plants.35 Barbados is the only country in the Eastern Caribbean expected to have significant natural gas-related investment.
47. Energy investments that are well-planned and executed ought to be self-financing in the long run. All IDB-costed energy investment plans shown in Table 6 target technologies that can generate cost savings for both power utilities and commercial users. Table 7 shows the minimum cost reductions required for the proposed investment envelope for each country to be economically viable under different cost-recovery scenarios ranging from 15 to 30 years in both US$ cents per kWh and in percent of the average operating expense of the relevant power utilities estimated over 2012-2015.
B. The Impact of Energy Investment on Public Debt Sustainability
48. The feasibility of public financing of energy investments depends on the magnitude of the investment, the cost of financing, and the availability of fiscal space. For countries with solid public finances, the proposed envelope above could be financeable by the public sector, without undermining debt sustainability. However, in several Caribbean countries, public finances remain under strain, limiting the undertaking of large energy infrastructure investment. An analysis of the impact of estimated energy investment costs on public debt sustainability in selected Caribbean countries is outlined next.
35 Estimates of energy investment needs for Guyana do not reflect previous plans to build a hydro power station as these are expected to be replaced by plans for investments in natural gas facilities.
Table 7. Minimum Cost Reductions Required for Costed Energy Investments to be Self-Financing
15 Years 20 Years 25 Years 15 Years 20 Years 25 Years
The Bahamas 3/ 1952 26 511 39.0 2.2 2.0 1.9 8.3 7.7 7.1 Barbados 1036 25 439 33.5 3.5 3.2 3.0 13.9 12.9 12.0 Belize 449 18 59 4.5 1.1 1.0 0.9 6.1 5.7 5.3 Guyana 881 21 270 20.6 2.5 2.3 2.2 11.9 11.0 10.2 Jamaica 4213 29 860 65.6 1.7 1.6 1.4 5.8 5.4 5.0 Suriname 1857 19 378 28.8 1.7 1.6 1.4 8.7 8.1 7.5 Antigua & Barbuda 325 26 47 3.6 1.2 1.1 1.0 4.6 4.2 3.9 Dominica 99 28 57 4.3 4.7 4.4 4.1 17.1 15.8 14.7 Grenada 199 30 93 7.1 3.8 3.5 3.3 12.7 11.7 10.9 St. Kitts and Nevis 144 26 92 7.0 5.2 4.8 4.5 20.1 18.5 17.3 St. Lucia 373 24 71 5.4 1.6 1.5 1.4 6.5 6.0 5.6 St. Vincent & Gr. 141 26 92 7.0 5.4 5.0 4.6 20.5 19.0 17.7 Average 972 25 247 18.9 2.9 2.7 2.5 11.4 10.5 9.8
2/ Reflects a base case of 20 year amortization schedule for a loan with a 5 percent interest rate and varies for different loan-maturities.3/ Operating expense is estimated for BEC. Sources: US. EIA, Castalia Energy Monographs, IDB, Power Utilities' Annual Reports and IMF Staff Estimates.
1/ Estimated from financial statements of power utilities and Castalia reports. Where data was not available, the weighted average cost of generation was used in addition to an average non-fuel operating expense of US$0.07/kWh based on data from BPL and JPS.
(In US cents/kWh generated)(In percent of Avg. Operating
Expense of the Utility)
Minimum Cost ReductionsProjected
annual cost of debt
service 2/
Total investment
cost
Estimated Net
generation (2015)
(in GWH)
US$ MillionEstimated Avg.
Operating Expense
(2012-2015) 1/

32
Public versus private financing36
49. The impact of the investment cost on public debt sustainability can be alleviated through higher private participation. To assess the impact of countries’ required investment envelopes (as estimated above) on their public debt trajectories, this exercise compares two financing scenarios with a baseline scenario based on staff’s macro-framework assumptions.
Scenario 1: the public sector finances 100 percent of the investment in energy infrastructure. This scenario assumes that major infrastructure investments shown in Table 6 are financed by the public sector through a 20-year commercial loan, disbursed over three years (2016-2018), with a 3-year grace period and an average interest rate of 5 percent (consistent with the projected cost of potential multilateral funding to the region through 2019).37 Reflecting the requirement that the projects be eventually self-financing, the scenario includes a projected improvement in the public sector primary balance to cover the debt service over the life of the loan, recouped from the projects’ cost savings, consistent with a 20-year cost recovery schedule for all investments.38 The impact on debt sustainability is modeled through 2030. Staff estimates of the fiscal stance and growth outlook in 2020 govern baseline debt dynamics for subsequent years.39 Improvements in output growth from both the investment impact and the projected efficiency gains are incorporated into the growth outlook for this scenario (and the one below).
Scenario 2: the private sector undertakes 80 percent of the investment. This scenario assumes that a private sector partner will finance the bulk of the infrastructure projects, particularly those that lend themselves to a private-public partnership type of set-up like the development of renewable or natural gas-fired power plants. In such cases, the public sector would still need to make a financial contribution, often in the form of an equity tranche in the project’s capital structure, as well as undertake some level of infrastructure investment, including in grid interconnection. The growth impact of the energy investments and the efficiency gains is the same as in Scenario 1. The public sector share of the investment is financed under the same terms as in Scenario 1 and the public sector primary balance is
36 This assessment only considers the cost of large infrastructure investments for natural gas and renewable power and excludes the cost of energy efficiency and conservation initiatives identified in table 6.
37 The interest rate assumption is calibrated for a potential IDB Investment loan. IDB charges a floating interest rate on its loans with a 3-month LIBOR as a base rate plus a varying spread (1.15 percent as of 2015Q4). However, the base rate can be fixed after each disbursement (a 20-year loan fully disbursed as of end-November 2015 would attract a fixed interest rate of 2.55 percent). The assumed 5 percent rate implies an increase in interest rates by 2.5 percent over the horizon of the disbursements. This is consistent with the average of projections for the Federal Funds Rate over 2016-2018 (2.5 percent vs. a current 0.1 percent) by Federal Reserve Board Members released in the September 2015 FOMC meeting minutes.
38 Annex II details staff’s methodology for estimating energy investments cost savings for each country to ensure projects are self-financing over a 20 year horizon (2019-2038).
39 To model debt dynamics through 2030, staff’s projections of central government primary balance has been capped at 3.0 percent for Antigua and Barbuda and Jamaica to reflect the easing of adjustment needs beyond 2020.

33
improved to cover the associated debt service from its share of recouped cost savings. Figures 7 and 8 depict the impact on public debt trajectories (compared to baseline) of the 12 Caribbean countries under scenarios 1 and 2.
Reflecting the growth impact of investments
50. To the extent that energy investments improve growth, pressures on debt sustainability from financing them will ameliorate. The coefficients of the econometric analysis (Section III.B) show that a 10 percent improvement in energy efficiency across the entire economy could increase the level of GDP by 2 percent in the long run. Besides this, spending on energy investment has a short-run impact on growth through the direct expansion of aggregate demand. Earlier work by Fund staff on a sample of Caribbean countries estimated the cumulative public investment multiplier to be about 0.37 after four quarters.40 Collectively, the impact of energy investments on growth is expected to improve the public debt ratio over the long-run.
Efficiency gains and growth under different fuel price scenarios
51. Net of debt service, estimated average cost savings from planned energy investments could improve operational efficiency in the region by more than 25 percent through 2038. This is based on a detailed analysis of the impact of specific investments costed by the IDB on energy costs in each country under alternative scenarios for the oil and gas price outlook during 2019-2038, consistent with a 20-year cost-recovery schedule (see Annex II for more detail). Debt service costs are consistent with the financing loan assumptions in Scenario 1 (see paragraph 50). Table 8 shows potential net cost reductions (in US$ cents/kWh) in percent of estimated average operating expense for the different power utilities in the region. 41
The largest cost savings accrue to countries where the introduction of natural gas is viable. These average about 35 percent of recent utilities’ operating costs under baseline projections for the prices of natural gas and distillate fuel oil by the U.S. Energy Information Agency.42
Countries where hydroelectric power capacity is significant, such as Belize and Suriname, will enjoy overall lower energy costs.
40 See IMF Working Paper 13/117: “Fiscal multipliers in the ECCU”. 41 A direct comparison between the potential reduction in electricity bills in Tables 4 and 5 and cost savings in Table 8 would be inappropriate, given the more granular approach for each investment project in this exercise. Table 8 shows cost savings from implementing IDB’s costed investments, projected over a 20-year horizon, net of debt service, using projected oil price data. Tables 4 and 5 show cost savings based on country announced targets using backward looking tariff price data. Calculations for western Caribbean countries in Table 8 also reflect natural gas technologies, while Tables 4 and 5 are based on exploiting viable renewable energy sources only.
42 Cost savings are calculated in percent of historical average operating expense over (2012-2015). Cost reduction may be lower if shown in percent of projected operating expense that reflects a higher oil price. This is true for the “High” oil price scenario shown in Table 8.

34
At 2015 fuel oil prices (the ‘2015 average’ scenario), renewable energy introduction in the ECCU, including geothermal power, appears to provide limited to no cost savings under given financing and generation cost assumptions,43 while introducing natural gas would seem viable mainly because of the significant drop in natural gas prices in early 2015. However, under baseline energy price projections (2019-2038), efficiency gains in ECCU countries average 19 percent. Moreover, future scaling up of geothermal power development in countries with higher geothermal potential could achieve lower generation costs, implying higher efficiency gains than those shown below.
43 A US$0.10/kWh all-in cost of generation has been assumed for a 10MW geothermal power plant. See Annex II.B for further details.
2015 Avg. Baseline Low High 2015 Avg. Baseline Low High 4/
The Bahamas 5.6 13.8 8.5 26.4 26 21.6 53.0 32.5 101.1Barbados 3.8 11.2 6.4 22.6 25 15.2 44.8 25.5 90.2Belize 1.6 4.4 2.5 8.7 18 8.8 24.8 14.4 49.4Guyana 2.5 7.2 4.1 14.6 21 11.6 34.0 19.4 68.5Jamaica 3.1 7.7 4.7 14.7 29 10.6 26.6 16.2 51.2Suriname 2.4 6.7 3.9 13.3 19 12.3 34.7 20.1 69.1Average 3.1 8.5 5.0 16.7 23 13.3 36.3 21.4 71.6Antigua & Barbuda 5/ 0.2 2.3 1.1 5.0 26 0.6 8.7 4.4 19.1Dominica 0.5 7.9 3.9 17.6 28 0.0 28.6 14.2 63.6Grenada -0.7 3.7 1.4 9.3 30 -2.2 12.2 4.5 30.8St. Kitts and Nevis -0.9 5.1 1.9 12.9 26 -3.3 19.7 7.4 49.5St. Lucia 0.1 2.4 1.2 5.4 24 0.4 9.9 4.8 22.4St. Vincent & Gr. 1.7 8.8 5.0 18.1 26 6.6 33.8 19.3 69.1Average 0.2 5.0 2.4 11.4 27 0.4 18.8 9.1 42.4Region Average 1.6 6.8 3.7 14.0 25 6.8 27.6 15.2 57.0Crude Oil (US$/Bbl) 2/ 55 103 67 188Distillate Fuel (US$/gallon) 2/ 1.7 3.7 2.8 6.0Natural Gas (US$/MMBTU) 2/ 2.8 5.8 5.4 7.3
5/ Reflects the introduction of 10MW of solar panels and 11MW of wind power technology achieving a 20 percent renewable energy penetration rate.
Table 8. Potential Cost Savings from Energy Sector Investments under Alternative Scenarios for the Oil Price Outlook
4/ Ratio would be lower if shown in percent of projected operating expense that reflects the higher projected average oil price of US$188/Bbl over 2019-2038 under this scenario.
3/ Average in US$ cents/kWh over 2012-2015 estimated from financial statements of power utilities and Castalia reports. Where data was not available, an estimated weighted average cost of generation was used in addition to an average non-fuel operating expense (including administrative expenses and transmission and distribution costs) of US$0.07/kWh based on data from BPL and JPS. Data for the Bahamas is estiamted for BEC.
Sources: US. EIA Database, U.S. EIA 2015 Annual Energy Outlook Report, CARICOM C-SERMS 2015 Baseline Report and Assessment, IDB's Pre-feasibility Study of the Potential Market for Natural Gas in the Caribbean, International Renewable Energy Agency's Report on Renewable Power Generation Costs in 2014, State of California Public Utilities Commission's 2014 Report, Castalia Energy Monographs, Power Utilities' Annual Reports and IMF Staff estimates.
In US cents/kWh generated In percent of (2012-2015) Operating Expense
Net Savings from introducing Natural Gas/Renewable Technology (2019-2038) 1/ 2/
1/ Reflects estimated cost savings, net of debt service, based on replacing distillate fuel with natural gas in the Bahamas, Barbados, Belize, Guyana, Jamaica and Suriname, and introducing a 10MW geothermal power plant in Dominica, Grenada, St. Kitts and Nevis, St. Lucia, and St. Vincent and the Grenadines as base load capacity. Assumes a 20-year loan amortization schedule. For detailed methodology see Annex II.
2/ Based on U.S. EIA 2015 Annual Energy Outlook projections of Brent crude oil, distillate fuel oil and natural gas (Henry Hub) prices over 2019-2038. Reference price reflects average over the projection period. 2015 average reflects data through September 2015.
Operating Expense 3/

35
52. The efficiency gains are expected to translate into long-run growth benefits. The growth rate assumed for the long-run debt dynamics of scenarios 1 and 2 has been augmented to reflect the improved power sector efficiency from the investments and the resulting cost savings. This was modeled based on the GDP elasticity to energy efficiency derived in Section III.B. The ultimate impact on growth will likely depend on how the efficiency gains are spread across the economy. In this exercise, we assumed a pass-through of cost savings to end-users of about 50-60 percent to accommodate potential required return on capital to the investor (whether private or public),. Hence, in ECCU countries, where efficiency gains under baseline assumptions averaged 19 percent, growth was enhanced to reflect a 10 percent efficiency gain passed on to end-users. In the rest of the Caribbean, where natural gas is expected to provide higher cost savings of 35 percent on average, growth was enhanced to reflect at least 20 percent efficiency gain passed on to end-users.44 Higher pass-through of cost savings could possibly imply higher growth dividends in the long-run.
53. More formally, the trajectory of public debt would be governed by the following debt dynamics equation augmented by the impact of energy investments on debt service costs, growth and the public sector primary balance.
1 1 11 1 1 1
Where d denotes public sector debt; is the weighted average nominal interest rate on the debt stock excluding the energy loan; is the interest rate on the energy loan; is the share of the energy loan in the public debt portfolio; reflects the impact of the energy investment on GDP growth in period t; reflects the impact of higher energy efficiency on GDP growth over the long-run; is the inflation rate; is the public sector primary balance; µ is the recouped cost savings to cover for the energy loan debt service; is the share of the public sector in financing the energy investment; and denotes other debt related flows.45
Results of the Debt Sustainability Analysis
54. While results differ by country, there are important general conclusions.
The magnitude of proposed energy investments did not materially alter the trajectory of public debt in most countries. Although undertaking the investment through the public sector increased the public debt ratio for all countries over the medium term, the modeled
44 A 10 percent improvement in the efficiency of the power sector is equivalent to a 5 percent improvement in energy efficiency in the entire economy given the 50 percent share of electric power generation in the energy sector in the Caribbean. Hence, based on the long-run GDP elasticity to energy efficiency from the econometric results discussed in (section III; B), this translates to a potential increase of 1 percent in the level of GDP over the long run. A 20 percent efficiency gain implies a potential increase of 2 percent in the level of GDP over the long run. 45 Under the private sector financing scenario, λ is 0.2 reflecting the share of the public sector in the energy investment and its recouped cost savings. Under the public sector financing scenario, λ is equal to 1.

36
cost recovery for debt service and the positive impact on growth (from both the investment impact and the lower energy costs) offset this increase in the long-run.
Private sector financing of energy projects moderately improves the debt-to-GDP ratio compared to baseline. As a result of the modeled growth enhancement from improvements in energy efficiency, Scenario 2 yields a lower debt-to-GDP path compared to baseline in all countries. However, this is likely to be contingent on the private sector developer passing a measurable share of the cost savings to end users. Retaining the bulk of the cost savings as returns on investment could limit the transmission of benefits to the wider economy and reduce projected growth dividends from the lower cost of energy. In this regard, Power Purchase Agreements that provide for limited reductions in consumer tariff rates are unlikely to generate the anticipated improvements in cost competitiveness in Caribbean economies.46
The impact of the investment on the debt trajectory will be less favorable than modeled if the efficiency of public sector investment is low or the overall cost of capital for the private sector is high. The exercise is based on the assumption that the return to the investment is the same whether it is undertaken by the public or private sector. If, however, public investment efficiency were low, rates of return to the public sector would be lower than in the private sector (e.g., through cost overruns) and there would be higher accumulation of debt than in this exercise. On the other hand, the cost of financing for the private sector developer could be higher than for the public sector if the project were perceived to be of high risk, particularly if financing were sourced through a special purpose vehicle not backstopped by the balance sheet of a larger private sector firm of strong credit standing or not benefiting from any guarantees by central government or IFIs. This would raise the required rate of return for the project and lower the potential share of cost savings passed on to the end-consumer, resulting in lower growth dividends. When deciding on the optimal financing choice, policymakers would need to carefully consider these factors.
Fiscal risks would be higher if the income stream of the power utility cannot be safeguarded. Tariff rates charged by utilities should fully cover their operating expenses, including the elevated debt service from the new borrowing. Administrative practices that dictate a specific tariff rate or limit its adjustment to allow for full cost-recovery would mean that the project cannot be fully self-financing. This would pose significant risks to the financial position of the power utility and, ultimately, the budget, in the case of state-owned power companies. Also, a low collection rate on bills by the utility, as a result of high customer delinquency rates and technical or political barriers to enforcing power cuts, would mean that its cash flow cannot be guaranteed to cover its expenses, including debt service costs. In either case, the primary balance of the public sector would be lower and the trajectory of public debt would be higher than in this exercise.
46 Although under this scenario, the country may still accrue some benefits to the balance of payments through reducing the cost of imports of expensive fuel oil.

37
55. Countries fall into three categories with respect to capacity to undertake these large-scale energy investments. See Figure 7 (ECCU countries) and Figure 8 (rest of the Caribbean).
Countries with a lower initial debt load and sustainable debt dynamics can reap the benefit of reducing energy costs without weakening fiscal or debt sustainability. Under both baseline and public investment scenarios, the debt-to-GDP ratio in the Bahamas and St. Kitts and Nevis is projected to remain below 70 percent through 2030—the threshold for triggering the IMF’s Debt Sustainability Analysis Framework’s heat map for Market Access Countries. Nonetheless, these countries could still benefit from a private sector partnership to undertake these projects. Guyana and St. Vincent and the Grenadines have largely sustainable debt trajectories, but public sector financing of energy investments would keep the debt-to-GDP ratio above the 70 percent threshold till 2021 in Guyana and 2023 in St. Vincent and the Grenadines (though the latter would reach the ECCU’s 60 percent target by 2026). Finally, while Suriname’s debt trajectory is projected to rise, its low initial public debt of 37 percent in 2015 may allow it to sustain the estimated 7.5 percent of GDP of energy investments over the medium term, particularly if the investment allows the country to eliminate energy subsidies estimated at 2.7 percent of GDP in 2013.
Countries with a high public debt load and unsustainable debt dynamics are not well-positioned to undertake such investments using public sector financing. Countries like Dominica and St. Lucia have a high probability of debt distress given their high debt to GDP ratio and unsustainable debt trajectories. In Barbados, the public debt ratio is projected to remain above 100 percent till 2026 if energy sector investments are financed through public resources.47 Hence, in these countries, allowing the private sector to undertake the bulk of these investments would ease financing constraints without increasing the public debt load and would also provide critical risk sharing, particularly in cases where the renewable resource potential remains uncertain or the energy market outlook is highly uncertain. The favorable impact on the debt trajectory from the enhanced growth outlook would help improve debt sustainability.48
Countries undertaking significant adjustment to bring debt back to sustainable levels could elect to finance high-yielding investments under certain conditions. Specifically, it would be important that the economy features strong structural conditions, like high returns on public capital, high public investment efficiency and high collection rates, and that the investment does not create transition problems. In Jamaica, energy investments, estimated at 6.2 percent of GDP, do not materially alter the debt path but may impose additional strain on fiscal resources if projected cost savings fall short of the cost of financing, particularly if
47 Barbados’s public sector debt ratio is being revised to include debt of state-owned enterprises. 48 However, as discussed below, prudent management of private sector contracts and power purchase agreements are necessary to limit any potential contingent liabilities to the fiscal sector.

38
financing terms are unfavorable or crowd out other investments. In countries where commercial losses are high or the utility accumulates large unpaid receivables from end-users, transition problems may emerge if a fiscal adjustment is needed to cover for the cost of financing (Buffie et al., 2012). This could aggravate fiscal challenges if the baseline required fiscal adjustment is already high like in Antigua and Barbuda, Grenada, or Jamaica.
Figure 7. Impact of Energy Investments on Debt Sustainability 1/
1/ Reflects staff macroeconomic assumptions as of end-October 2015.
60
65
70
75
80
85
90
95
2015 2017 2019 2021 2023 2025 2027 2029
Baseline Scenario
Public Investment Scenario
Private Investment Scenario
St. Lucia: Public Debt(In percent of GDP)
0
20
40
60
80
100
120
2015 2017 2019 2021 2023 2025 2027 2029
Baseline Scenario
Public Investment Scenario
Private Investment Scenario
Antigua and Barbuda: Public Debt(In percent of GDP)
40
50
60
70
80
90
100
110
2015 2017 2019 2021 2023 2025 2027 2029
Baseline Scenario
Public Investment Scenario
Private Investment Scenario
Dominica: Public Debt(In percent of GDP)
20
30
40
50
60
70
80
90
100
2015 2017 2019 2021 2023 2025 2027 2029
Baseline Scenario
Public Investment Scenario
Private Investment Scenario
Grenada: Public Debt(In percent of GDP)
20
30
40
50
60
70
80
2015 2017 2019 2021 2023 2025 2027 2029
Baseline Scenario
Public Investment Scenario
Private Investment Scenario
St. Kitts and Nevis: Public Debt(In percent of GDP)
4045505560657075808590
2015 2017 2019 2021 2023 2025 2027 2029
Baseline Scenario
Public Investment Scenario
Private Investment Scenario
St. Vincent and the Grenadines: Public Debt(In percent of GDP)

39
Figure 8. Impact of Energy Investments on Debt Sustainability (Cont’d) 1/ 2/
1/ Reflects staff macroeconomic assumptions as of end-October 2015. 2/Does not fully reflect debt of state-owned enterprises for the Bahamas, Barbados and Jamaica.
30
35
40
45
50
55
60
65
70
2015 2017 2019 2021 2023 2025 2027 2029
Baseline Scenario
Public Investment Scenario
Private Investment Scenario
The Bahamas: Public Debt (In percent of GDP)
40
50
60
70
80
90
100
110
120
2015 2017 2019 2021 2023 2025 2027 2029
Baseline Scenario
Public Investment Scenario
Private Investment Scenario
Barbados: Public Debt (In percent of GDP)
405060708090
100110120130140
2015 2017 2019 2021 2023 2025 2027 2029
Baseline Scenario
Public Investment Scenario
Private Investment Scenario
Jamaica: Public Debt (In percent of GDP)
6065707580859095
100105110
2015 2017 2019 2021 2023 2025 2027 2029
Baseline Scenario
Public Investment Scenario
Private Investment Scenario
Belize: Public Debt(In percent of GDP)
3035404550556065707580
2015 2017 2019 2021 2023 2025 2027 2029
Baseline Scenario
Public Investment Scenario
Private Investment Scenario
Guyana: Public Debt(In percent of GDP)
20
25
30
35
40
45
50
55
60
2015 2017 2019 2021 2023 2025 2027 2029
Baseline Scenario
Public Investment Scenario
Private Investment Scenario
Suriname: Public Debt(In percent of GDP)

40
VI. TOWARDS A SUSTAINABLE PRIVATE INVESTMENT FRAMEWORK IN THE
ENERGY SECTOR
Given public financing constraints, private investment may be pivotal for successful energy sector reform. However, PPPs have been slow to take off in the Caribbean. This section describes the investment framework required to attract and adequately regulate private investors.
56. Public-private partnerships (PPPs), if managed properly, can reduce the cost of infrastructure investment to the public sector, while improving investment efficiency.49 Private sector financing through PPPs has become popular because it allows countries with public debt constraints to undertake needed infrastructure investments without directly increasing their public debt load. Moreover, compared to traditional procurement, PPPs may offer efficiency gains driven by a profit incentive, and may also better harness private sector expertise in management and innovation. In some countries, PPPs are reported to reduce cost overruns of infrastructure projects and improve the timeliness of project delivery. In others, however, projects become stalled if differences emerge between the government and its private partner over inadequately specified elements of the contract or other realization of risks—in which case costly fiscal contingencies can materialize.
57. Although PPPs have the potential to help address energy infrastructure needs in the Caribbean region, not much has been done. The current status of energy PPP development is uneven. In some countries such as Belize (Figure 9), the private sector is actively involved in electricity infrastructure investments. In others such as Guyana and Grenada, the size of energy sector PPPs is quite limited.
49 PPPs are contractual arrangements through which the private sector collaborates with the government in supplying infrastructure assets and services that are traditionally delivered by the government. Although there are many types of PPP arrangements, they all share some common features, including: private sector involvement in financing and executing the investment; private sector delivering the core service of the project; and sharing of risks and rewards between the government and the private party.
0
50,000
100,000
150,000
200,000
250,000
1990 1994 1998 2002 2006 2010
Total PPP investment in USD
PPP investment in 1990 constant USD
Public-Private Partnership Investments in all Emerging Markets(in US$ million)
Source: World Bank PPI database

41
Figure 9. PPP Investments in the Energy Sector (average percent of GDP, 1990-2013)
Source: World Bank PPI data base.
58. Despite their prospective benefits, PPPs often carry significant risks. Compared to traditional procurement, the involvement of private partners increases the complexity of PPP contracts. This calls for a strong institutional framework that facilitates project supervision and management and safeguards against risks emerging from the PPP contract. Similar to other infrastructure PPPs, key risks from a Power Purchase Agreement (PPA) that governs the terms of the PPP need to be carefully managed to safeguard against:
Lax selection standards, especially if the PPP is perceived to be low-cost to the budget and thus is subject to relaxed approval standards.
Lack of transparency and/or sufficient competition in the bidding process.
Inadequate risk sharing and risk transfer in the project design, where, for example, the public sector bears the bulk of the downside risk through explicit government guarantees, while the benefit from significant upside risks accrues to the private partner or when the private partner is required to bear a risk it cannot manage, thus reducing the project’s appeal to competent private partners or raising their cost of financing.
Inadequate returns from the project due to unforeseen risks related to the effective generation capacity of the deployed technology, especially in renewable weather-linked technologies that are vulnerable to climate change, including wind, solar and hydro power.
Risks related to the evolution of energy demand —for instance, if the utility commits to a specific amount (or a step-up schedule) of MWs purchases over a given horizon but the projected growth in domestic consumption fails to materialize.
Poor project execution or time and cost overruns that relate either to structural economic factors in the economy (e.g., strong bargaining power of labor unions) or delayed government action (e.g., implementation of public infrastructure necessary to the project).
0.000.200.400.600.801.001.201.401.601.802.00
Beliz
eBo
livia
Phili
ppin
esCh
ileN
icar
agua
Peru
Pana
ma
Braz
ilG
uate
mal
aSt
. Luc
iaH
ondu
ras
Dom
inic
an R
e pA
rgen
tina
Jam
aica
Mac
edon
iaD
omin
ica
El S
alva
dor
Colo
mbi
aU
rugu
ayA
lban
iaKo
sovo
Mon
tene
gro
Gre
nada
Vanu
atu
Tong
aG
abon
Cape
Ver
deG
uyan
a, C
RCo
sta
Rica BiH

42
Insufficient incentives to invest in asset maintenance, particularly for contracts that involve the eventual transfer of ownership to the public sector within a horizon that is much shorter than the planned useable life of the deployed power technology.
59. Unintended fiscal costs from PPP contracts should be especially guarded against. Even if a PPP contract does not involve explicit government liabilities, hidden fiscal costs, in such forms as government guarantees on minimum user demand and/or on project borrowing, may create higher-than-expected financial burdens for the public sector. Failure to honor contract obligations can also lead to higher fiscal costs when the government is required to make termination payments or take over the project. Fiscal contingencies are more likely to materialize when the institutional framework for PPPs is weak, when the projects are of poor quality and not competitively procured, and when the accounting and reporting systems for PPPs do not transparently disclose the project’s fiscal implications.
60. For successful power sector PPPs, governments need to establish appropriate institutional arrangements. To harness the potential for private sector participation in electricity infrastructure investments, it is will be crucial to put in place a clear policy direction and legal framework, PPP-related institutional capacity, and the necessary human capital for project supervision and fiscal management. Successful institutional frameworks for PPPs include the following key elements:
A predictable, low-risk policy and regulatory environment that ensures a level playing field across all energy sector investors and participants, including state-owned utilities, and provides long-term clarity on the future of power sector regulation, without providing undue concessions to the private sector players. 50
A clearly-defined energy sector strategy. A long-term vision for the direction of the power sector, including targets for energy source diversification and the scope and process for private sector participation, backed up by specific policies such the announcement of standard guidelines on Power Purchase Agreements (PPAs), will serve to assure the private sector of the government’s commitment to a transparent process and will make it easier to secure project financing.
An accommodating legal framework. In many countries, important legislative adaptations are necessary to allow private sector participation in the power sector. Where a legislative framework is absent or deficient, governments should consider drafting a dedicated energy sector law—with possible technical assistance from IFIs—which recognizes their renewable energy resource, if any, as a national resource and defines the terms and restrictions of permits, licenses and concessions to private sector developers. Private investors would be especially keen on whether the law outlines a flexible tariff-setting mechanism and the
50 The UN Energy Report (2011) showed that the main contribution of government is creating a low-risk, predictable and enabling political, legal and regulatory environment with established electricity sector development goals.

43
extent of the powers it grants to the energy sector regulating body in the relevant jurisdiction. Given the emerging status of energy sector PPPs in the Caribbean, it may be advisable to draw on the legal and regulatory structures in countries with a successful PPP track record.
Sufficient institutional capacity and human resources within the government. In small economies with limited technical expertise this is particularly constraining. PPP projects tend to be larger and more complex than traditional procurement, and thus require significant resources and expertise from the government in establishing PPP policies, identifying and evaluating projects, negotiating with private partners, and monitoring project execution.51
61. Jamaica and Trinidad & Tobago are the only two countries in the region that have established PPP policy frameworks. Both have created a set of criteria for PPP project selection and an institutional process for project identification, approval, and execution. In Trinidad and Tobago, a high-level ministerial committee has been established to provide strategic guidance to PPP programs, including guiding the development of PPP policies, reviewing and selecting projects, supervising PPP execution teams, and managing changes during the lifetime of PPP projects. Similarly in Jamaica, the strategic oversight responsibility for PPPs is carried out by a privatization committee directly under the control of Cabinet, supported by a strategy committee consisting of senior officials from relevant agencies (Figure 10). On the operational side, both countries have set up a PPP unit within the government, responsible for regulating the PPP programs and managing the PPP process. In addition, both countries’ PPP policy frameworks specify that a project team will be selected to develop the business case for individual projects and to implement the PPP transaction. Jamaica’s PPP policy also requires an enterprise team to be appointed by the Cabinet to provide high-level guidance and monitoring for individual projects. Box 3 presents a PPP case study from Jamaica and highlights some key lessons from the process, including the need to ensure transparency in processes for government approvals and efficient coordination among the government agencies involved in the transaction.
62. Finally, to finance energy PPPs successfully, the core requirements of lenders must be met. These are likely to include:52 (i) a creditworthy private partner; (ii) the backing of the project by some equity; (iii) an experienced and committed management team; (iv) the use of proven technology; (v) a creditworthy executing contractor with a strong track record; (vi) in the case of renewables, ample availability of the renewable resource; and (vii) financial projections demonstrating strong cash flows and attainment of required returns.
51 Whatever the institutional arrangement created – an agency or unit – strong capacity will be critical to success and this is an area Caribbean countries will require significant technical assistance.
52 Taken from Presentation by Lynn Tabernacki: “Meeting the Energy Challenge; Promoting Foreign Investment: What are the Barriers?” delivered at the 2015 High Level Caribbean Forum in St. Kitts and Nevis.

44
Figure 10. Organizational Responsibilities for PPPs in Jamaica
Source: Government of Jamaica PPP Policy.
Box 3. PPP Case Study—Renewable Energy Procurement in Jamaica
The Office of Utilities Regulation (OUR) of Jamaica issued a public tender in 2013 to procure 80 MW renewable energy capacity. This has been the only competitive procurement of renewable energy capacity in the Caribbean to date. The tender received considerable interest from the private sector. 28 bids were submitted, among which three winners were selected to build, own and operate renewable energy facilities and supply to the grid: Blue Mountain Renewables, for 36 MW wind capacity; WRB Enterprises, for 20 MW solar capacity; and Wigton Wind Farm, for 24 MW wind capacity. Overall, the tendering process was successful and received positive feedback from participants. They reported that the government did well in ensuring that the bidding process was fair and transparent and that the evaluation for sifting out unqualified bidders was meticulous and well-organized. However, the process also generated several lessons for the future, notably:
- The design of the Power Purchase Agreement for renewable energy PPPs needs to be well thought out, and, especially, cognizant of the private partner’s need to secure bank financing;
- After the contract is awarded, there must be a clearly laid-out process for the private partner to obtain various government permits for the project;
- Coordination among relevant government agencies should be streamlined to reduce the transaction cost in the approval process for getting the project off the ground;
- The respective responsibilities of the power generator and distributor in getting the new capacity to the grid need to be clearly allocated and communicated.
Source: Government of Jamaica.

45
VII. POLICY RECOMMENDATIONS AND NEXT STEPS
63. Estimates in this paper support the view that cutting Caribbean energy costs could materially improve the region’s macroeconomic performance. Empirical analysis suggests that oil price movements influence real growth and the real exchange rate (although other factors may have been more important in explaining the region’s recent low-growth performance). Strategies to reduce exposure to oil price movements can help improve growth and competitiveness over the short and medium term, and alleviate pressures on the region’s external accounts. In the long run, improvements in energy efficiency are shown to support higher sustainable growth. Hence, measures to conserve energy and to diversify the energy mix toward cheaper sources should be a high priority for regional reform efforts.
64. Recent oil price declines do not obviate the need for energy sector reform. Improvements in domestic competitiveness will require long-term reductions in the cost of energy vis-à-vis the rest of the world. Additional effort is thus needed to increase operational efficiencies of domestic power utilities, reduce overdependence on imported petroleum products and improve resilience to future oil price shocks. Moreover, according to the IDB, most of the power plants in the Caribbean are reaching the end of their life span. This implies a necessity—but also a timely opportunity—to invest in both diversification and improving energy efficiency.
65. Achieving targets already set in national and regional energy sector strategies would generate valuable savings but require strong commitment of national authorities and substantial investments in the power sector. Staff estimates indicate that implementing these targets for renewable energy penetration and boosting energy efficiency could generate significant cost savings, through lowering electricity tariffs and fuel import costs. However, announced targets remain ambitious and strategies have yet to specify the magnitude of investments and identify the potential sources of financing required for their implementation.
66. A gap in national strategies that needs to be addressed is a strengthening of the regulatory framework to remove obstacles to greater private sector participation. Regulatory and legislative reforms are needed to establish clear licensing and operational procedures for independent power producers, including the introduction of feed-in tariffs and net billing schemes. Establishing independent energy regulators in the region with the appropriate institutional capacity is also crucial to providing a low-risk predictable environment for private energy sector investors. In addition, setting national energy efficiency standards (e.g. energy labeling and energy efficient building codes) and providing appropriate incentives will help encourage the adoption of energy efficient technologies by businesses, particularly hotels, as well as households.
67. Countries with unsustainable debt dynamics and/or a high initial debt load are not in a position to pursue large energy investments that may significantly worsen their sustainability. Augmenting the IMF’s Debt Sustainability Analysis of Caribbean economies with IDB-based estimates of energy investment needs would not materially alter the public debt trajectory of most countries. However, countries where the baseline debt path is not sustainable

46
and/or fiscal vulnerabilities remain acute, are not well-positioned to finance significant investments through public resources. In addition, countries where structural conditions are weak, featuring low returns on public capital, low public investment efficiency and low collection rates of user fees, are likely to face higher risks to fiscal and debt sustainability from large scale public sector energy investments. The analysis also suggests that private sector financing of investments can significantly improve the public debt path over the long run through their potential growth-enhancing impact, if a measurable share of the cost savings are passed on to the rest of the economy.
68. Caribbean authorities are encouraged to pursue private financing of energy investments, particularly in projects that involve significant upfront capital injection. Public-private partnerships are one modality for private sector participation; however, strong institutional arrangements and an appropriate legislative framework are crucial to ensure successful implementation in line with best practice and to limit contingent liability risks to the fiscal sector, including these related to the specific terms of the Power Purchase Agreement.
*****
69. Over the medium term, greater coordination of IFIs’ engagement is expected to catalyze energy sector investments in the region. Following the January 2015 Caribbean Energy Security Initiative (CESI) Summit, IFIs (including the World Bank Group and the IDB), the donor community and CARICOM agreed to continue to collaborate in the development and implementation of the Caribbean Sustainable Energy Roadmap and (C-SERMS) Platform, to provide an effective coordination mechanism among key stakeholders to facilitate better planning and execution of energy transformation programs. The C-SERMS Platform will establish a framework through which governments and political leadership will be able to develop, track and meet national and regional renewable energy and energy efficiency targets, while promoting a sound regulatory framework and securing the input of the various parties critical to the process, including the development/donor community, the financial services sector, educational institutions, regional utilities and civil society. Subsequent stages will support the mobilization of financing for bankable and economically viable projects, by both public and private sector investors.
70. Going forward, the IMF will support the region’s efforts by providing greater attention to energy policy in regular Article IV surveillance work. IMF country teams will continue evaluating the impact of energy costs on growth, the cost of investments in energy infrastructure and the implications of both for public debt sustainability. Country teams will also work with authorities and collaborate with other IFIs in monitoring the implementation of country strategies. The Fund will encourage country authorities to pay greater attention to improving the overall business environment, to facilitate private sector investment in the economy, including the energy sector.

47
REFERENCES
Acevedo, Sebastian, 2014, “Debt Growth and Natural Disasters: A Caribbean Trilogy” IMF Working Paper 14/125. International Monetary Fund.
Andrle, M., P. Blagrave, P. Espaillat, K. Honjo, B. Hunt, M. Kortelainen, R. Lalonde, D. Laxton, E. Mavroeidi, D. Muir, S. Mursula, and S. Snudden. (2015). “The Flexible System of Global Models – FSGM.” IMF Working Paper 15/64. International Monetary Fund
Arezki, R., and O. Blanchard (2014), “The Oil Price Slump: Seven Key Questions,” iMFdirect, 22 December (http://blog-imfdirect.imf.org/2014/12/22/seven-questions-about-the-recent-oil-price-slump/).
Auth K., M. Konold, E. Musolino, and A. Ochs. “Caribbean Sustainable Energy Roadmap (C-SERMS)-Phase 1“. Working Draft, June 2013.
Baffes, John, M. Ayhan Kose, Franziska Ohnsorge, and Marc Stocker (2015), “The Great Plunge in Oil Prices: Causes, Consequences, and Policy Responses, World Bank Group Policy Research Note PRN/15/01, March, Washington DC.
Bailey J. and N. Janson, “Pre-Feasibility Study of the Potential Market for Natural Gas as a Fuel for Power Generation in the Caribbean, Inter-American Development Bank“, December 2013.
Baumeister, C., and L Kilian, (2014a), “A General Approach to Recovering Market Expectations from Futures Prices with an Application to Crude Oil,” CEPR Discussion Paper 10162.
Baumeister, C., and L Kilian, (2014b), “What does the market think? A general approach to inferring market expectations from future prices”, VoxEU.org, 19 November.
Baumeister, C., and L Kilian, (2015), “Understanding the Decline in the Price of Oil Since June 2014”, CEPR Discussion Paper 10404.
Beidas-Strom, S., and A. Pescatori, (2014), “What has Contributed to Oil Price Volatility?,” VoxEU.org, 20 December (http://www.voxeu.org/article/oil-price-volatility-and-speculation).
Buffie, E., A. Berg, C. Pattillo, R. Portillo and L. Zanna, 2012. ” Public Investment, Growth, and Debt Sustainability: Putting Together the Pieces”. IMF Working Paper 12/144.
California Public Utilities Commission. “Report to the Legislature in Compliance with Public Utilities Code Section 910”. February 2014.

48
Caribbean Development Bank (2014), “Public-Private Partnerships in the Caribbean: Building on Early Lessons”.
Caribbean Hotel Energy Efficiency Action Programme (CHENACT). “Energy Efficiency and Micro-Generation in Caribbean Hotels“. July 2012
CARILEC, (2012). Tariff Survey of Member Electric Utilities.
Caricom Energy Policy, March 2013.
Cashin, Paul; and Sosa Sebastian, 2013, “Macroeconomic fluctuations in the Eastern Caribbean: The role of climatic and external shocks” The Journal of International Trade & Economic Development: An International and Comparative Review, Vol. 22, pp. 729-748.
Castalia Strategic Advisors. “Energy Monograph for Antigua and Barbuda”. Draft to the World Bank, 2 January 2013.
Castalia Strategic Advisors. “Energy Monograph for Barbados”. Draft to the World Bank, 3 December 2013.
Castalia Strategic Advisors. “Energy Monograph for Belize”. Draft to the World Bank, 2 January 2013.
Castalia Strategic Advisors. “Energy Monograph for Dominica”. Draft to the World Bank, 23 October 2013.
Castalia Strategic Advisors. “Energy Monograph for Grenada”. Draft to the World Bank, 22 November 2013.
Castalia Strategic Advisors. “Energy Monograph for Jamaica”. Draft to the World Bank, 15 November 2013.
Castalia Strategic Advisors. “Energy Monograph for St. Kitts and Nevis”. Draft to the World Bank, 15 November 2013.
Castalia Strategic Advisors. “Energy Monograph for St. Lucia”. Draft to the World Bank, 3 December 2013.
Castalia Strategic Advisors. “Energy Monograph for St. Vincent and the Grenadines”. Draft to the World Bank, 10 December 2013.
Castalia Strategic Advisors. “Energy Monograph for Trinidad and Tobago. Draft to the World Bank, 7 January 2013.

49
Castalia Strategic Advisors, “Sustainable Energy Framework for Barbados Final Report“, 2010.
Chaudry, A.A. (2010) A Panel Data Analysis of Electricity Demand in Pakistan. The Lahore Journal of Economics, 15, 75 – 106.
Di Bella, G., L. Norton, J. Ntamatungiro, S. Ogawa, I. Samake and M. Santoro (2015), Energy Subsidies in Latin America and the Caribbean: Stocktaking and Policy Challenges, IMF Working Paper 15/30.
Dabla-Norris et al. (2011), “Investing in Public Investment: An Index of Public Investment Efficiency”, IMF working paper 11/37.
Eberhardt, Markus and Francis Teal (2010) 'Productivity Analysis in Global Manufacturing Production', Economics Series Working Papers 515, University of Oxford, Department of Economics.
Farquharson el al. (2011), “How to Engage with the Private Sector in Public-Private Partnerships in Emerging Markets”, World Bank Group.
Giraud and Kahraman (2014) How Dependent is Growth from Primary Energy? Output Energy Elasticity in 50 Countries (1970-2011).
Government of Jamaica (2012), “Policy and Institutional Framework for the Implementation of a Public-Private Partnership Programme for the Government of Jamaica: The PPP Policy”.
Government of Trinidad and Tobago (2012), “Government of the Republic of Trinidad and Tobago PPP Policy”.
IMF (2007), “Issues Paper on Public-Private Partnerships and Fiscal Risks”, IMF issues paper 07/138.
IMF, various issues, “Commodities Price Outlook &Risks, Research Department Commodities Team (http://www.imf.org/external/np/res/commod/index.aspx).
IMF, (2015), “World Economic Outlook: Uneven Growth—Short- and Long-Term Factors,” April, Washington DC.
Inter-American Development Bank. “Energy Matrix Country Briefing“s, 2013.
International Renewable Energy Agency. “Renewable Power Generation Costs in 2014”, January 2015.
Killian, L., (2015), “Why did the price of oil fall after June 2014?,” VoxEU.org, 25, February (http://www.voxeu.org/article/causes-2014-oil-price-decline).

50
Liu, X. (2005). Explaining the Relationship between CO2 Emission and National Income-The role of
Energy Consumption. Economics Letters, 87, 325-328.
Loungani, P. and A. Matsumoto (2012), “Oil and Natural Gas Prices: Together Again?,” manuscript.
Masih, A., Masih, R. (1996). Energy consumption and real income temporal causality, results for a multi-country study based on cointegration and error-correction techniques. Energy Economics 18, 165–183.
Österholm, P., and Zettelmeyer, J., 2007. The Effect of External Conditions on Growth in Latin America. IMF Working Paper 07/176.
Paul Cashin and Sebastian Sosa (2013) Macroeconomic fluctuations in the Eastern Caribbean: The role of climatic and external shocks, The Journal of International Trade & Economic Development: An International and Comparative Review, 22:5, 729-748.
Petersen, S.L. (2002) Micro Econometric Modeling of Household Energy Use: Testing for dependence between Demand for Electricity and Natural Gas. Energy Journal, 23, 57-83.
Pesaran, Shin & Smith (1998) Energy Demand in Asian Developing Economies, Oxford University Press, Oxford.
Stern and Kander (2012) The Role of Energy in the Industrial Revolution and Modern Economic Growth, The Energy Journal, 2012, vol. Volume 33, issue Number 3.
Tabernacki, Lynn (2015). “Meeting the Energy Challenge; Promoting Foreign Investment: What are the Barriers?” Presentation. 2015 High Level Caribbean Forum, St. Kitts and Nevis.
UN-Energy (2011), “Strengthening Public-Private Partnerships to Accelerate Global Electricity Technology Deployment: Recommendations from the Global Sustainable Electricity Partnership Survey”, United Nations.
The U.S. Energy Information Agency Database. Accessed 17 May 2015.
World Bank Group (2014), Caribbean Infrastructure PPP Roadmap.

51
ANNEX I. COMPONENTS OF THE QUANTITATIVE ASSESSMENT OF
MACROECONOMIC EFFECTS OF OIL PRICES AND ENERGY CONSUMPTION IN
THE CARIBBEAN 1
A. Short-term Analysis of the Macro-Effects of Oil Price Shocks in the Caribbean
1. The empirical model used to assess the macroeconomic effects of oil price shocks is based on Cashin and Sosa (2013). It is a country-specific vector autoregressive (VAR) model with block exogeneity restrictions; the specification of the model incorporates the small open economy assumption that foreign variables are exogenous to the domestic economy. The domestic block of the model includes growth rates of real GDP and the real effective exchange rate (REER); the external block comprises foreign economic variables – the real oil price growth rate, advanced economies’ real GDP growth rates, and the advanced economies’ real interest rate. The model also assumes complete exogeneity of natural disaster shocks. Using variance decomposition analysis, the relative contribution of oil price changes (and other external factors) to the variance of real GDP growth (and the REER) is quantified. Impulse responses, in turn, illustrate how domestic output growth and the REER react to oil price changes. The model is estimated using annual data 1976-2013.
Data sources:
Domestic block: Real GDP growth rate (GDP): IMF World Economic Outlook database, Gross
domestic product, constant prices, National Currency, year-on-year percent change. Real Effective Exchange Rate (REER): IMF Information Notice System (INS),
Consumer Price Index, Index 2010=100, year-on-year percent change.
External block: Real oil price growth rate (OIL_R): IMF Primary Commodity Prices, Crude Oil
(petroleum) spot price, deflated by U.S. commodity exporters’ producer price, year-on-year percent change.2
Advanced economies real GDP growth rate (WD): Gross domestic product, constant prices, year-on-year percent change.
Advanced economies real interest rate (WRIR): Interest rate, 6-month London interbank offered rate (LIBOR), period average.
Natural disaster: dummy variable constructed as in Acevedo (2014) including natural disaster of all types (storms, floods, earthquakes, volcanic activity, and droughts).
1 Prepared by Julien Reynaud, Marcio Ronci and Sebastian Acevedo with research assistance from Anayo Osueke.
2 The VAR was also estimated using nominal oil prices and the results are very similar.

52
2. The sample comprises the following economies: Antigua and Barbuda*, the Bahamas, Barbados, Belize, Dominica*, Grenada*, Guyana, Jamaica, St. Kitts and Nevis*, St. Lucia*, St. Vincent and the Grenadines*, Suriname, and Trinidad and Tobago. For the analysis, two groups of countries are formed: Group 1 includes tourism-dependent economies and comprises the ECCU,3 the Bahamas and Barbados; Group 2 includes commodity producers and comprises the rest of the sample. (See Section I for a description of countries’ energy matrices.)
3. The main objective is to evaluate the impact of oil price shocks on Caribbean business cycle fluctuations. The exercise relies on two standard VAR tools: forecast error variance decompositions and impulse response functions. Variance decomposition analysis is used to quantify the relative importance of each type of shock as a source of output fluctuations over the sample. Impulse responses constitute a practical way to illustrate how growth has tended to react to oil price shocks, taking into account not only direct effects, but also the indirect effect through reactions of other variables.
4. The results indicate that a positive shock to the real oil price is contractionary in most countries.4 Real oil shocks explain on average 7 percent of business cycle fluctuations in the Caribbean sample, and in a relative homogeneous fashion (i.e., average variance is 7 percent for Group 1 and Group 2). Figure A1.1 shows the dynamic response of GDP growth in each of these countries to a one-standard deviation shock to real oil price: output growth decreases, with effects lasting one to two years, and the largest response typically occurs within one year after the shock. An elasticity can be derived from the impulse response functions, indicating that a 1 percentage point increase in real oil price leads to a decrease of real GDP growth of 0.02 percentage points on average the first year in Group 1 and 0.005 percentage points on average the first year in Group 2. It is worth noting that this impact is positive in the case of Suriname and Trinidad and Tobago. After three years, the average cumulative decrease in real GDP growth in Group 1 is 0.1 percentage point and 0.01 in Group 2 (Figure A1.2), showing the high dependence of tourist-dependent economies on imports for their supply of petroleum products.
5. A positive shock to the real oil price appreciates the REER in all countries. Figure A1.3 shows the dynamic response of the real effective exchange rate change (REER) in each country to a one-standard deviation shock to real oil price: REER effects last one to three years. An elasticity can be derived from the impulse response functions, indicating that a 1 percentage point appreciates the REER by 0.02 percentage points on average the first year over the sample,
3 The countries of the Eastern Caribbean Currency Union (ECCU) are denoted by a (*). These countries are part of the ECCU’s quasi-currency board arrangement with a peg to the US dollar of EC$2.7 per US$1.
4 However, in the case of Antigua and Barbuda, St. Kitts and Nevis, Bahamas, Barbados, Belize and Jamaica the negative effect only materializes with a one year lag. In some cases (e.g. Antigua and Barbuda) the delay could be explained by large oil storage facilities that result in a delay in international oil price changes being transmitted to the domestic economy. In the case of Trinidad and Tobago and Suriname, the impact of an increase in oil prices is positive as these economies are oil producers.
53
and across the different country groups. After three years, the average appreciation of the REER in Group 1 is 0.03 percentage points and 0.04 in Group 2 (Figure A1.4), possibly explained by the fact that the ECCU and other tourism-dependent economies have rigid exchange rate regimes.
6. The analysis shows, however, that oil prices are not the main explanation for business cycle fluctuations in the Caribbean; shocks to the external block account, on average, for 30 percent of GDP variation (Figure A1.5). This ranges from a low of 11 percent for Guyana to 48 percent for Barbados. External shocks as a whole (including oil shocks) account for about 35 percent of business cycle fluctuations in tourist dependent economies, i.e., the ECCU, the Bahamas and Barbados (Group 1), while accounting only for 20 percent or less in commodity-dependent economies (Group 2).

54
Figure A1.1. Response of Real GDP Growth to a Real Oil Price Shock by Country (shock: 1 standard deviation)
-2.0
-1.0
0.0
1.0
2.0
0 1 2 3 4 5 6 7 8
Antigua (GDP response to a 1-s.d. change in oil prices)
-4.0
-2.0
0.0
2.0
4.0
0 1 2 3 4 5 6 7 8
Dominica (GDP response to a 1-s.d. change in oil prices)
-4.0
-3.0
-2.0
-1.0
0.0
1.0
0 1 2 3 4 5 6 7 8
Grenada (GDP response to a 1-s.d. change in oil prices)
-3.0
-2.0
-1.0
0.0
1.0
2.0
0 1 2 3 4 5 6 7 8
St. Kitts (GDP response to a 1-s.d. change in oil prices)
-3.0
-2.0
-1.0
0.0
1.0
0 1 2 3 4 5 6 7 8
St. Lucia (GDP response to a 1-s.d. change in oil prices)
-2.0
-1.0
0.0
1.0
2.0
0 1 2 3 4 5 6 7 8
St. Vincent (GDP response to a 1-s.d. change in oil prices)
-2.0
-1.0
0.0
1.0
2.0
0 1 2 3 4 5 6 7 8
Bahamas (GDP response to a 1-s.d. change in oil prices)
-1.5
-1.0
-0.5
0.0
0.5
1.0
0 1 2 3 4 5 6 7 8
Barbados (GDP response to a 1-s.d. change in oil prices)
-2.0
-1.0
0.0
1.0
2.0
0 1 2 3 4 5 6 7 8
Guyana (GDP response to a 1-s.d. change in oil prices)
-6.0
-4.0
-2.0
0.0
2.0
4.0
0 1 2 3 4 5 6 7 8
Belize (GDP response to a 1-s.d. change in oil prices)
-2.0
-1.0
0.0
1.0
2.0
0 1 2 3 4 5 6 7 8
Jamaica (GDP response to a 1-s.d. change in oil prices)
-2.0
-1.0
0.0
1.0
2.0
3.0
4.0
0 1 2 3 4 5 6 7 8
Suriname (GDP response to a 1-s.d. change in oil prices)
-2.0
-1.0
0.0
1.0
2.0
3.0
0 1 2 3 4 5 6 7 8
Trindad (GDP response to a 1-s.d. change in oil prices)

55
Figure A1.2. Response of Real GDP Growth to a Real Oil Price Shock by Country
Groups (shock: 10 percent)
-0.6
-0.5
-0.4
-0.3
-0.2
-0.1
0.0
0 1 2 3 4 5
Avg. Impulse Response
Cumulative avg. Impulse Response
Real GDP growth response to a 10% increase in oil prices: Tourism Intensive
-0.20
-0.15
-0.10
-0.05
0.00
0.05
0.10
0 1 2 3 4 5
Avg. Impulse Response
Cumulative avg. Impulse Response
Real GDP growth response to a 10% increase in oil prices: Commodity Producers (w/TTO)
0.0
0.1
0.2
0.3
0.4
0.5
0.6
0.7
0.8
0 1 2 3 4 5
Avg. Impulse Response
Cumulative avg. Impulse Response
Real GDP growth response to a 10% increase in oil prices: TTO

56
Figure A1.3. Response of REER Change to a Real Oil Price Shock by Country
(shock is 1 standard deviation)
-2.0
-1.0
0.0
1.0
2.0
3.0
4.0
0 1 2 3 4 5 6 7 8
Antigua (REER response to a 1-s.d. change in oil prices)
-1.0
0.0
1.0
2.0
0 1 2 3 4 5 6 7 8
Dominica (REER response to a 1-s.d. change in oil prices)
-1.0
0.0
1.0
2.0
3.0
0 1 2 3 4 5 6 7 8
Grenada (REER response to a 1-s.d. change in oil prices)
-2.0
-1.0
0.0
1.0
2.0
3.0
0 1 2 3 4 5 6 7 8
St. Kitts (REER response to a 1-s.d. change in oil prices)
-2.0
-1.0
0.0
1.0
2.0
0 1 2 3 4 5 6 7 8
St. Lucia (REER response to a 1-s.d. change in oil prices)
-2.0
-1.0
0.0
1.0
2.0
0 1 2 3 4 5 6 7 8
St. Vincent (REER response to a 1-s.d. change in oil prices)
-3.0
-2.0
-1.0
0.0
1.0
2.0
3.0
0 1 2 3 4 5 6 7 8
Bahamas (REER response to a 1-s.d. change in oil prices)
-1.0
0.0
1.0
2.0
3.0
0 1 2 3 4 5 6 7 8
Barbados (REER response to a 1-s.d. change in oil prices)
-5.0
0.0
5.0
10.0
15.0
0 1 2 3 4 5 6 7 8
Guyana (REER response to a 1-s.d. change in oil prices)
-2.0
-1.0
0.0
1.0
2.0
3.0
0 1 2 3 4 5 6 7 8
Belize (REER response to a 1-s.d. change in oil prices)
-6.0
-4.0
-2.0
0.0
2.0
4.0
0 1 2 3 4 5 6 7 8
Jamaica (REER response to a 1-s.d. change in oil prices)
-10.0
-5.0
0.0
5.0
10.0
15.0
20.0
0 1 2 3 4 5 6 7 8
Suriname (REER response to a 1-s.d. change in oil prices)
-2.0
0.0
2.0
4.0
6.0
0 1 2 3 4 5 6 7 8
Trindad (REER response to a 1-s.d. change in oil prices)

57
Figure A1.4. Response of REER Growth to a Real Oil Price Shock by Country Groups (shock: 10 percent)
-1.0
-0.5
0.0
0.5
1.0
1.5
2.0
2.5
3.0
0 1 2 3 4 5
Avg. Impulse Response
Cumulative avg. Impulse Response
REER growth response to a 10% increase in oil prices: Tourism Intensive
0.0
0.5
1.0
1.5
2.0
2.5
3.0
3.5
4.0
0 1 2 3 4 5
Avg. Impulse Response
Cumulative avg. Impulse Response
REER growth response to a 10% increase in oil prices: Commodity producers

58
Figure A1.5. Variance Decomposition of Real GDP at a Horizon of Three Years (in percent)
B. The IMF’s WHDMOD Module of FSGM5 7. WHDMOD is an annual, multi-economy, forward-looking, model of the global economy combining both micro-founded and reduced-form formulations of economic sectors. It is a module of the IMF’s Flexible System of Global Models (FSGM) and is used in the paper as a benchmark for assessing the empirical results. WHDMOD contains individual blocks for large economies and largest world economies and economies in Americas, together with 6 additional regions to cover the remaining countries in the world.6
5 Prepared by Michal Andrle. The model is presented in greater detail in Andrle and others (2015).
6 The countries are: ARG, BRA, CHL, COL, CRI, DOM, GTM, MEX, PAN, PER, TTO, URY, CAN, CHN, IND, JPN, RUS, USA. The regions are the euro area, “Other central America”, “Other Latin America”, other Advanced Economies, and the Remaining countries.
0.0
0.1
0.2
0.3
0.4
0.5
0.6
0.7
0.8
0.9
1.0
ATG DMA GRD KNA LCA VCT BHS BRB GUY BLZ JAM SUR TTO
GDP WD OIL_R REER WRIR

59
8. Consumption and investment have microeconomic foundations. Consumption features overlapping-generations households that can save and smooth consumption, and liquidity-constrained households that must consume all of their current income every period. Firms’ investment is determined by a Tobin’s Q model. Firms are net borrowers and their risk premia rise during periods of excess capacity, when the output gap is negative, and fall during booms, when the output gap is positive. This mimics, for example, the effect of falling/rising real debt burdens. Trade is pinned down by semi-structural equations. They are a function of a competitiveness indicator and domestic or foreign demand. The competitiveness indicator improves one-for-one with domestic prices––there is no local-market pricing.
9. Potential output is endogenous. It is modeled by a Cobb-Douglas production function with exogenous trend total factor productivity (TFP), but endogenous capital and labor. The level of TFP is also affected by the real price of oil.
10. Consumer price and wage inflation are modeled by Phillips’ curves. They include weights on a lag and a lead of inflation and a weight on the output gap. Consumer price inflation also has a weight on the real effective exchange rate and second-round effects from food and oil prices. Monetary policy is governed by an interest rate reaction function. For most countries, it is an inflation-forecast-based rule working to achieve a long-run inflation target.
11. There are three commodities in the model—oil, metals, and food. This allows for a distinction between headline and core consumer price inflation, and provides richer analysis of the macroeconomic differences between commodity-exporting and importing regions. The demand for commodities is driven by the world demand and is relatively price inelastic in the short run due to limited substitutability of the commodity classes considered. The supply of commodities is also price inelastic in the short run. Countries can trade in commodities, and households consume food and oil explicitly, allowing for a distinction between headline and core CPI inflation. All have global real prices determined by a global output gap (only a short-run effect), the overall level of global demand, and global production of the commodity in question.
12. Countries are largely distinguished from one another in the model by their unique parameterizations. Each economy in the model is structurally identical (except for commodities), but with different key steady-state ratios and different behavioral parameters, like existence of oil production, energy-intensity of production, etc.
C. Long-term Analysis of the Energy Consumption-GDP Nexus 13. The empirical exercise for assessing long-term effects of energy consumption and energy efficiency on growth relies on Pesaran, Shin and Smith (1998), Giraud and Kahraman (2014), and Stern and Kander (2012). The large body of analytical studies focusing on the link between energy and growth has led to the energy consumption-GDP nexus. The purpose of these studies has been to examine the dynamic relationship between economic activity and energy demand in an economy. Studies of energy demand have used cross-section

60
data (eg. Petersen, 2002), time series data (eg. Masih and Masih, 1996), and panel data (eg. Pesaran et al., 1998; Liu, 2004; Chaudry, 2010). Most of the latter apply heterogeneous panel estimation techniques to model the impact of income, price, and consumption on energy demand. These models have advantages of allowing for heterogeneous slope coefficients across group members and are also concerned with correlation across panel members.
Data sources are as follows:
- Real GDP: IMF World Economic Outlook database, Gross domestic product, constant
prices, National Currency, divided by population.
- Energy Consumption: U.S. Energy Information Administration (EIA), total primary
energy consumption (Quadrillion Btu).
- Energy Efficiency: Authors’ calculation, energy consumption per unit of GDP.
- Growth Capital Formation: Penn World Table (PWT80), capital stock at constant
2005 national prices (in mil. 2005US$).
- Population: World Bank, World Development Indicators.
14. The sample comprises the following economies: Antigua and Barbuda*, Barbados, Belize, Dominica*, Grenada*, Guyana, Jamaica, St. Kitts and Nevis*, St. Lucia*, St. Vincent and the Grenadines*, and Suriname. Economies followed by an (*) are part of the Eastern Caribbean Currency Union (ECCU), which consists of a quasi-currency board agreement with a peg to the USD for 2.7 XCD (Eastern Caribbean Dollar).
15. The main objective of this model is to evaluate the energy consumption-GDP nexus in the Caribbean. This is achieved by estimating the GDP elasticity to energy consumption (per capita), capital formation (per capita), and a parameter for energy efficiency, using a panel co-integration approach. The Augmented Mean Group (AMG) estimator is preferred as it accounts for cross-section dependence, time-varying heterogeneity across panel members due to unobserved common shocks and problems of identification (Eberhardt and Teal, 2010). The AMG estimator allows for the estimation of a 'common dynamic process', which corresponds to the estimated cross-region average of TFP evolution. Such an estimator, allowing for heterogeneous slope coefficients across group members, would be suitable for this sample of Caribbean countries where country heterogeneity is relevant. However, relationships between variables in the longer run are expected to be homogeneous across the region given the region’s specifics –small and very open economies.
16. Our results indicate that energy consumption and gross capital formation play a significant role in determining GDP over the long run, and to a lesser extent energy efficiency. In the long-term, the results show that an increase of 1 percent of energy use per capita increases GDP per capita by about 0.14 percent on average, while an increase in 1 percent of gross capital formation increases GDP per capita by 0.15 percent on average. The coefficient estimate for energy efficiency is highly significant (at the 99 percent confidence interval) and

61
the long-run elasticity is about 0.20 percent on average. The common dynamic process coefficient estimated is 0.34 and also significant. Finally, and as discussed in related analysis on small island states, short-term gross capital formation elasticities are always significant and large.
Figure A1.6. Parameter Estimates
GDP per capita
Energy Consumption Per Capita 0.14 **[0.046]
Energy Efficiency 0.20 ***[0.044]
Gross Capital Formation Per Capita 0.15 **[0.068]
Common dynamic process 0.34 ***[0.122]
Constant 4.54 ***[0.484]
Observations 389Countries 11Wald test 29.05 ***
Source: Fund staff estimates. Sample: 1980-2011 as available for sample country except
Bahamas and Trinidad and Tobago. Energy efficiency is defined as real GDP divided by total
consumption of energy. *** indicates significance at the 1 percent level, ** at 5 percent.

ANNEX II. ASSESSMENT OF POTENTIAL COST SAVINGS FROM INTRODUCING
NATURAL GAS AND RENEWABLE ENERGY TECHNOLOGIES
IN THE CARIBBEAN59
The objective of this exercise is to support the Debt-Sustainability Analysis (DSA) exercise in Section V by gauging the potential of cost savings from proposed investments in Caribbean countries to: i) ensure that projects are likely to be self-financing in the long-run; and ii) assess the likely growth impact of the investments based on the magnitude of the potential efficiency gains from the new technologies, if the bulk of cost savings are passed on to end-users.
For energy investments to be economically viable, new technologies need to generate electricity for less than it costs under the existing technology. This assessment is typically done through comparing the Levelized Cost of Electricity (LCOE) of each technology and estimating the potential cost savings over a given horizon.60 IDB estimates have provided cost estimates of potential energy investments in each country. Natural gas is considered viable in the Western Caribbean countries (the Bahamas, Belize, Guyana, Jamaica, and Suriname) and Barbados. Owing to the lack of sufficient economies of scale in Eastern Caribbean countries, natural gas is not considered an optimal option, particularly given the potential for geothermal development in most countries. This exercise is based on broad-brush assumptions and is not meant to replace detailed technical and financial evaluation of proposed projects. Projects are assumed to be financed through a 20-year loan at 5 percent interest rate with a 3-year grace period. New power plants are expected to be operational by 2019 and cost savings are calculated through 2038, consistent with a 20-year cost recovery schedule.61
A. Methodology for Assessing Cost Savings from Introducing Natural Gas:
Cost savings from introducing natural gas will ultimately depend on the price differential between distillate fuel oil and natural gas over a given horizon. The IDB provided specific cost estimates of i) building re-gasification facilities at port terminals to receive LNG; ii) converting existing installed capacity run by fuel oil to natural gas-fired stations; and iii) building additional capacity through 2023 to meet growth in electricity
59 Prepared by Ahmed El-Ashram. 60 LCOE represents the per-kWh cost of building and operating a power plant over an assumed financial life and duty cycle. Key inputs to calculating LCOE include capital costs, fuel costs, fixed and variable operations and maintenance (O&M) costs, financing costs, and an assumed utilization rate for each plant type. 61 Cost savings have also been calculated over a ten-year horizon (2019-2030) to ensure that the investment generates sufficient savings to cover for debt service in the early life of the project and does not lead to fiscal adjustment in the early years if the benefits are too back-loaded.

63
demand. Table A2.1 shows the cost of converting existing capacity to natural gas-fired plants in addition to the size and cost of new natural gas capacity.
Because the power stations are expected to come on stream starting 2018 with additional expansion in capacity coming in 2023, savings need to be based on the magnitude of net generation over a forecast horizon. The following methodology has been used to arrive at these potential cost savings from replacing expensive fuel oil with natural gas:
Using data from the U.S. EIA database for net generation of electricity per country, the growth in total annual net generation of electricity in GWh was projected through 2038 (a 20-year horizon starting 2019). This is guided by growth rates in recent years as well as projections of growth in peak load for each country from Worldwatch Institute presented in
Capacity Investment Capacity Investment Capacity Investment Capacity Investment (MW) (US$ million) (MW) (US$ million) (MW) (US$ million) (MW) (US$ million)
The Bahamas, BEC 393 39.3 40 60 80 90 513 189.3
The Bahamas, GBPC 240 24 240 24
Barbados, BL&P 1/ 226 5.9 120 190 346 195.9
Belize, BEL 62 6.2 62 6.2
Guyana, GPL 140 14 40 70 40 50 220 134
Jamaica, JPS 621 62.1 360 400 981 462.1
Suriname, EBS 299 29.9 80 90 379 119.9
TOTAL 1981 181.4 440 530 320 420 2741 1131.4
1/For Barbados, the IDB assumes that some capacity fired by fuel oil may not be converted in 2018 following BL&P's 2014 Integrated Resource Plan. However, these remaining fuel oil fired generators will be used only as reserve, and will not generate any electricity.
Source: Inter-American Development Bank
Table A2.1. Investment cost of converting existing plants to natural gas-fired plants
2018 2019-20232018Capacity Expansion Plans Total
Power Utility
Existing Capacity For Conversion in 2018
Initial Capital Cost Additional Capital Cost Total Capital Cost
(2018 facilities) (2023 facilities)
Country US$ million US$ million US$ million US$ million
The Bahamas 173.2 14.9 188.1
Barbados 79.8 8.3 35.0 123.1
Belize 24.8 27.5 52.3
Guyana 88.0 8.3 96.3
Jamaica 182.6 14.9 20.0 217.5
Suriname 113.3 54.5 25.0 192.8
TOTAL 661.7 128.4 80.0 870.1
Other
Table A2.2. Investment Costs for Regasification Facilities and Infrastructure
Source: Inter-American Development Bank

64
the Caribbean Sustainable Energy Roadmap and Strategy (C-SERMS) Baseline Report and Assessment. This was however bound by the following constraints:
a. Net generation remains within planned capacity expansions. For each year, net annual generation of electricity could not exceed what could be actually produced using the available installed capacity for that year adjusted with the capacity factor for each technology in the generation mix of each country.62
b. In Countries where the IDB did not cost expansions in installed capacity (e.g. Belize), net generation projections only reflect the maximum capacity of existing power plants through 2038. Belize currently imports 40 percent of its generation from Mexico at an estimated price of US$0.12/kWh.63 This scenario assumes that additional growth in demand beyond that assumed in this exercise is covered by further electricity imports.
2. The amount of net generation expected to come from conventional sources was estimated after accounting for existing renewable technologies currently in place. These include the large hydroelectric power capacity in Belize and Suriname and biomass facilities in Belize and Guyana. They also include the small solar power capacity in each country based on most recent available data from Worldwatch Institute presented in C-SERMS Baseline Report and Assessment.
3. Purchases of electricity by the power utility from Independent Power Producers (IPPs) were excluded to arrive at net generation by the utility alone. In Jamaica, about 40 percent of the electricity is currently purchased from IPPs.64
4. The cost of natural gas fuel per kWh was estimated by updating the results of the IDB’s Pre-feasibility Study for the Potential Market for Natural Gas in the Caribbean released in December 2013. The benchmark natural gas price in this study was the Henry Hub index and the IDB used US$4.00/MMBTU as a base case. The price was updated for various pricing scenarios, including the 2015 average price and projected average price of natural gas over 2019-2030 using the 2015 U.S. EIA Energy Market Outlook Report. The estimated average LNG transportation cost from the U.S Sabine Pass supply point used in
62 The net capacity factor of a power plant is the ratio of its actual output over a period of time, to its potential output if it were possible for it to operate at full nameplate capacity continuously over time. For renewable energy technologies this reflects the variable availability of the fuel (i.e. sunlight, wind or water). While conventional fossil-fuel based power plants have high capacity factors in excess of 80 percent, Solar PV panels capacity factor may be as low as 25 percent. Average capacity factor for each technology is sourced from U.S. EIA monthly data. 63 Based on recent information from authorities in Belize. 64 If IPPs are expected to run their facilities using natural gas, their generation and installed capacities may be included but for lack of data on this, this exercise excludes their generation from the calculation.

65
the IDB study was preserved for each country and countries’ cost of natural gas fuel per kWh was calculated by updating the price in each scenario.
5. Gross Savings per kWh were calculated by comparing the fuel cost per kWh generated using natural gas against the average fuel cost (per kWh) of distillate fuel oil in 2015 and under the different price projections of both natural gas and distillate fuel oil by the U.S. EIA through 2038.65 Gross savings in US$ million are calculated by multiplying the savings (from the fuel replacement) per kWh by the projected net electric generation from natural gas-fired facilities.
6. The annual cost of debt service (in US$ million) is then deducted based on a 20-year amortization schedule and the total investment cost for each country.
7. Net Savings, net of debt service, are then calculated and presented as a percent of estimated operating expense for each utility (per kWh) to estimate potential gains in operating efficiency (see Table 8 in the main text).
B. Methodology for Estimating Cost Savings from Introducing Geothermal Power in the ECCU:
1. IDB cost estimates shown in Table A2.3 are used for geothermal plant development in the ECCU. The cost of a 10MW geothermal plant is estimated at US$45 million for all countries but some countries are more advanced than others in the initial testing and drilling phases. Completed phases are discounted from the total cost of the project.
65 Average savings per kWh also materialize over shorter horizons over 2019- 2030 under a lower period average for the baseline oil price scenario.
Stage 1a: Pre-Investment
Stage 1b: Pre-investment 1/
Stage 2: Exploration
Total
Country (Studies)(Slim hole drillings)
(Full scale drillings)
(Production/re-injection
wells)(Plant Cost)
Dominica (done) (done) (done) 7 45 52
Grenada 1.5 6 14 21 45 87.5
St. Lucia 0.5 6 14 21 45 86.5
St. Kitts and Nevis (done) (done) (done) 21 45 66
St. Vincent & Gr. 1 6 14 21 45 87Total 3 18 42 91 225 3791/ Additional costs may be incurred to enable pre-investment activities in the development sites. 2/ Does not include cost of sub-stations and transmission linesSource: Inter-American Development Bank
Stage 3: Field Development 2/
Table A2.3. Estimated Costs to Develop a 10MW Geothermal Power Plant by Stage (in US$ millions)

66
2. The “current” weighted average cost of generation is determined based on the
existing generation mix for each country to meet the average load. This is based on the installed capacities in each country, the per kWh cost of generation for each technology and the respective capacity factors for each technology.66 For Dominica and St. Vincent and the Grenadines, the availability of hydroelectric power reduces the overall cost of generation.
3. The weighted average cost of generation of the “new generation mix” is then calculated. Geothermal power is used as base load in all scenarios. The assumed plant size is 10MW and fuel oil- fired plants are expected to pick up the remaining peak load after other renewable capacities are accounted for.
4. Generation costs for geothermal power plants are based on the 2014 California Public Utilities Commission Report using small-scale operating plants of comparable size to power plants planned for the Caribbean. A premium for small scale was still used for geothermal generation costs (10 cents/kWh vs. reported 7.3 cents/kWh). Hydroelectric generation costs are based on VINLEC data. (These are all in costs, including operating and maintenance and equipment depreciation. This excludes any profit making and cost of capital typically included by private developers in geothermal prices quoted in Power Purchase Agreements). 67,68
5. Gross savings are calculated based on multiplying the reduction in the weighted average cost of generation after introducing geothermal and the amount of kWh generated for each country. This is done under alternative scenarios for distillate fuel oil price through 2030.
6. Net savings after debt service is then calculated based on individual amortization schedules and are shown both in US$ cent/kWh and in percent of average operating expense for each utility (see Table 8 in main text).
66 Capacity factors are sourced from the U.S EIA database.
67 This is backed by estimates for costs of generation for different renewable including solar and wind power from International Renewable Energy Agency (IRENA) report on Renewable Power Generation Costs in 2014. 68 The cost of generation for conventional fuel oil-fired turbines includes an average of 4.4 cents/kWh of non-fuel costs of generation that cover operating and maintenance expenses and equipment deprecation in line with the IDB’s estimates used in the Pre-Feasibility Study for the Potential of Natural Gas in the Caribbean.

67
C. Methodology For Estimating Cost Savings from the Announced 20 Percent Renewable Energy Target In Antigua and Barbuda:
1. IDB did not cost investments for Antigua and Barbuda, which has no geothermal resource.
2. A mix of wind and solar PV panels is expected to achieve overall penetration of 20% of renewables by 2020, according to the authorities’ announced plans.
3. The authorities have announced plans to develop 10 MW of solar PV panels, of which a 2MW solar farm is currently operational near the airport. The estimated cost for this is US$20.5 million. They expect to achieve the target by introducing a wind farm. A minimum of 11 MW of wind power installed capacity is needed to reach 20 percent of the mix. Cost estimates for wind power development from the International Renewable Energy Agency suggest an upfront capital cost of about US$22 million for 11MW wind farm.69
4. Savings are calculated based on the reduction in the weighted average cost of generation under different scenarios for the average price of distillate fuel oil, which is currently used for 99 percent of electric power generation in Antigua and Barbuda.
5. Net savings after debt service are then calculated and shown both in US$ cent/kWh and in percent of average operating expense for each utility (see Table 8 in main text).
69 See IRENA’s “Renewable Power Generation Costs in 2014”; Section 4.