Embed Size (px)
Citation preview
CARIBBEAN ECONOMIC PERFORMANCE REPORT
CARIBBEAN CENTRE FOR MONEY AND FINANCE
Established under the joint auspices of the
Central Banks of the Caribbean Community and
The University of the West Indies
DECEMBER 2015
CARIBBEAN ECONOMIC PERFORMANCE REPORT
Page | ii
December 2015
CARIBBEAN CENTRE FOR MONEY AND FINANCE
The University of the West Indies
St. Augustine, Trinidad and Tobago
Phone: (868) 645-1174, Fax: (868) 645-6017
E-Mail: [email protected]
Website: www.ccmfuwi.org
CARIBBEAN ECONOMIC PERFORMANCE REPORT
Page | iii
December 2015
TABLE OF CONTENTS
1.0 EXECUTIVE SUMMARY ................................................................................................................. 1
2.0 GLOBAL ECONOMIC DEVELOPMENTS .................................................................................. 4
3.0 REGIONAL ECONOMIC PERFORMANCE.............................................................................. 12
3.1 ECONOMIC GROWTH ....................................................................................................................... 12
3.2 INFLATION ........................................................................................................................................ 14
3.3 LABOUR MARKETS ........................................................................................................................... 15
3.4 FISCAL ACCOUNTS ........................................................................................................................... 16
3.4.1 Current Fiscal Accounts ......................................................................................................... 16
3.4.2 Overall Fiscal Accounts .......................................................................................................... 17
3.5 BANKING AND FINANCE ................................................................................................................. 19
3.5.1 Interest Rates ............................................................................................................................ 19
3.5.2 Commercial Bank Performance ............................................................................................ 20
3.5.3 Financial Soundness Indicators – Banking System ............................................................ 22
3.6 PUBLIC DEBT .................................................................................................................................... 24
3.7 INTERNATIONAL TRADE .................................................................................................................. 25
3.7.1 External Current Account ...................................................................................................... 25
3.7.2 External Capital Account ....................................................................................................... 26
3.8 INTERNATIONAL RESERVES ............................................................................................................. 28
4.0 PROSPECTS 2015/2016 ................................................................................................................... 30

CARIBBEAN ECONOMIC PERFORMANCE REPORT
Page | iv
December 2015
CARIBBEAN ECONOMIC PERFORMANCE REPORT
Page | 1
December 2015
1.0 EXECUTIVE SUMMARY
The global economy in the last year has been characterised by divergence amongst major
economies and differential performances between developed and emerging economies.
Overall global economic growth in 2014 was slower than expected at 3.4 per cent and
global growth is now projected to slow to 3.1 per cent in 2015 before improving to 3.6 per
cent in 2016. This performance was and will be underpinned by stronger growth in
advanced economies but more so in the US and the UK with the Euro Area and Japan
registering smaller improvements. In contrast, emerging and developing economies
registered slightly slower growth of 4.6 per cent in 2014 and they are expected to slow
further to four per cent in 2015 before recovering to 4.5 per cent in 2016, with Latin
America and the Caribbean recording the most significant deterioration in growth.
In the current environment, risks to global growth prospects are mostly weighted on the
downside and are more significant than they were just a few months ago. Risks include
disruptive financial asset price shifts and financial market volatility driven by an
expected interest rate hike by the US Federal Reserve at the end of 2015. Future growth
in emerging and developing economies in particular can be compromised in an
environment already characterised by declining commodity prices, reduced capital flows
and pressure on their exchange rates. In addition, these risks include the further
strengthening of the US dollar against other major currencies which implies huge
challenges for portfolio management and real exchange rate appreciation along with its
negative trade implications in some emerging and developing countries. Additionally,
increased geopolitical risks, a sharper than expected growth deceleration in China, the
possibility of stagnation in Europe and Japan and lower than expected growth in
potential output are important risks to global growth prospects.
CARIBBEAN ECONOMIC PERFORMANCE REPORT
Page | 2
December 2015
The pace of economic growth in CARICOM territories over the period Jan-June 2015 fell
off considerably when compared to the corresponding period in 2014. The average
regional growth rate of Caribbean economies moved from 2.25 per cent (Jan-June 2014)
to 0.53 per cent (Jan-June 2015). This was driven mainly by the commodity-producing
economies which experienced declines in their level of economic activity in the first half
of 2015 because of the drastic drop in commodity prices and contractions in their output
from primary sectors of their economies. The tourism-dependent economies experienced
a minimal improvement in their economic performance due to improvements in their
source markets such as the US and the UK.
In terms of some key areas of economic performance, the overall fiscal balance as a
percentage of GDP for the region improved from -7.7 per cent ( Jan-June 2014) to -4.1 per
cent (Jan-June 2015). This improvement was driven in large part by increased tax
revenues as growth improved in service-based economies. All jurisdictions, with the
exception of Guyana, had overall fiscal balances that were in deficit for the period at the
end of June 2015. On the external accounts, the external current account balance narrowed
from a deficit of US$719.7 million at the end of June 2014 to a deficit of US$445.45 million
( June 2015). The Caribbean region, although still experiencing high indebtedness in 2015,
showed moderate declines in their debt to GDP ratios. The region’s average domestic
debt to GDP ratio moved from 32.8 per cent at June 2014 to 27.8 per cent at June 2015. The
external debt level of the region was relatively static moving from US$20.9 billion in June
2014 to US$19.4 billion in June 2015.
In the current challenging international economic environment the outlook for the
CARICOM region is mixed. The major forces that will drive the performance of the region
include commodity price trends, a stronger US economy and related exchange and
interest rate dynamics. Commodity-based producers are expected to face increased
challenges as commodity prices soften while the services-based economies rebound
based on improved tourism outturns and lower fuel costs. The IMF estimates that the
CARIBBEAN ECONOMIC PERFORMANCE REPORT
Page | 3
December 2015
regions will grow by approximately 2.2 per cent in 2015 improving to 2.4 per cent in 2016.
Commodity producers are generally expected to post slower growth relative to service-
based economies over the next two years with the former group of countries forecast to
record lower growth of 1.9 per cent and 2.3 per cent in 2015 and 2016 while the latter
group is expected to record growth of 2.3 per cent and 2.5 per cent over these two years.
In this context, the main objective for the region is to increase economic growth while
steadily reducing macroeconomic and financial vulnerabilities. An important area for
action is, therefore, to strengthen the fiscal accounts which is key to rebalancing the
external accounts. The fiscal consolidation that this implies in some cases only requires
increasing the efficiency of government expenditure programmes to weed out wastages
without compromising the level of services provided to citizens and businesses. In other
cases, however, more fundamental changes to expenditure and revenue systems are
required. These are, however, necessary but not the only conditions needed for the
resumption of strong sustainable growth. It also requires an improvement in
competitiveness which implies a range of actions in connected areas including the
improvement of the business environment, increasing labour productivity and
improving the quality of public infrastructure. The region also needs to strengthen the
legal and regulatory frameworks for financial risk assessment and mitigation to deal with
any financial vulnerabilities which can threaten the resumption of sustainable growth in
the Caribbean.
CARIBBEAN ECONOMIC PERFORMANCE REPORT
Page | 4
December 2015
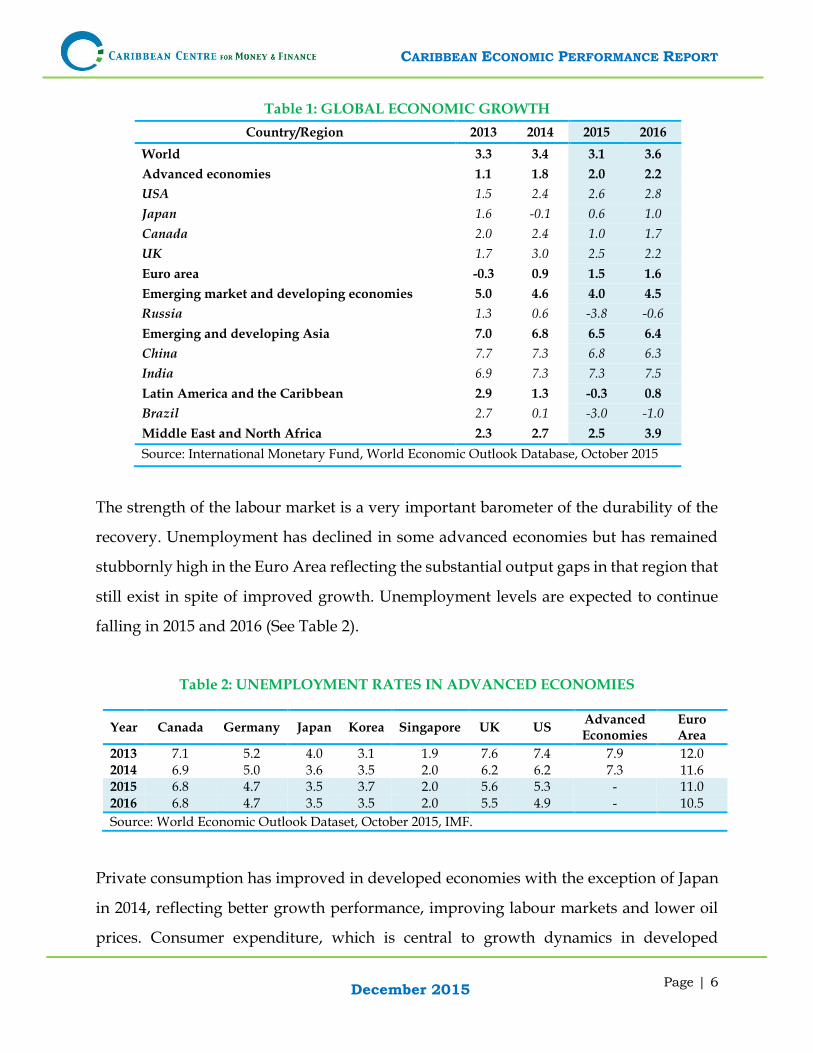
2.0 GLOBAL ECONOMIC DEVELOPMENTS
The global economy continued to grow at a modest pace with a propensity for reversals
in 2015. This was reflected in the performance of the US economy for the first half of 2015
as growth fell off in the first quarter (after strong growth in the third and fourth quarters
of 2014) before recovering in the second quarter. The global economy in the last year has
been characterised by divergence amongst major economies and differential
performances between developed and emerging economies. Overall global economic
growth in 2014 was slower than expected at 3.4 per cent and global growth is now
projected to slow to 3.1 per cent in 2015 before improving to 3.6 per cent in 2016.
This performance was and will be underpinned by stronger growth in advanced
economies but more so in the US and the UK with the Euro Area and Japan registering
smaller improvements. In contrast, emerging and developing economies registered
slightly slower growth of 4.6 per cent in 2014 and they are expected to slow further to
four per cent in 2015 before recovering to 4.5 per cent in 2016, with Latin America and the
Caribbean recording the most significant deterioration in growth (See Table 1). The
relatively muted and unbalanced nature of global growth since the international financial
and economic crisis has raised concerns of a “new normal” of lower growth which
implies that the moderate pace of global growth is a phenomenon that is likely to last
longer than expected. The fact that there is broad-based weakness in investment around
the world lends credence to this view since this not only restrains current growth but
future growth as well. In addition to low investment, other factors driving this growth
dynamic include high levels of indebtedness, financial sector weaknesses, low
productivity growth, growth realignment in China, weaker growth in commodity-based
economies and political instability.
CARIBBEAN ECONOMIC PERFORMANCE REPORT
Page | 5
December 2015
In the current environment, risks to global growth prospects are mostly weighted on the
downside and are more significant than they were just a few months ago. Risks include
disruptive financial asset price shifts and financial market volatility driven by an
expected interest rate hike by the US Federal Reserve at the end of 2015. Future growth
in emerging and developing economies in particular can be compromised in an
environment already characterised by declining commodity prices, reduced capital flows
and pressure on their exchange rates. These risks include the further strengthening of the
US dollar against other major currencies which implies huge challenges for portfolio
management and real exchange rate appreciation along with its negative trade
implications in some emerging and developing countries. Additionally, increased
geopolitical risks, a sharper than expected growth deceleration in China, the possibility
of stagnation in Europe and Japan and lower than expected growth in potential output
are important risks to global growth prospects.
The forces driving the performance of the global economy have become increasingly
complex with structural challenges and potential risks entrenching asymmetries and
creating a mixed bag of winners and losers. This often serves to frustrate international
policy coordination which is critical to successfully confronting the myriad challenges
facing the global economy.
CARIBBEAN ECONOMIC PERFORMANCE REPORT
Page | 6
December 2015
Table 1: GLOBAL ECONOMIC GROWTH
Country/Region 2013 2014 2015 2016
World 3.3 3.4 3.1 3.6
Advanced economies 1.1 1.8 2.0 2.2
USA 1.5 2.4 2.6 2.8
Japan 1.6 -0.1 0.6 1.0
Canada 2.0 2.4 1.0 1.7
UK 1.7 3.0 2.5 2.2
Euro area -0.3 0.9 1.5 1.6
Emerging market and developing economies 5.0 4.6 4.0 4.5
Russia 1.3 0.6 -3.8 -0.6
Emerging and developing Asia 7.0 6.8 6.5 6.4
China 7.7 7.3 6.8 6.3
India 6.9 7.3 7.3 7.5
Latin America and the Caribbean 2.9 1.3 -0.3 0.8
Brazil 2.7 0.1 -3.0 -1.0
Middle East and North Africa 2.3 2.7 2.5 3.9
Source: International Monetary Fund, World Economic Outlook Database, October 2015
The strength of the labour market is a very important barometer of the durability of the
recovery. Unemployment has declined in some advanced economies but has remained
stubbornly high in the Euro Area reflecting the substantial output gaps in that region that
still exist in spite of improved growth. Unemployment levels are expected to continue
falling in 2015 and 2016 (See Table 2).
Table 2: UNEMPLOYMENT RATES IN ADVANCED ECONOMIES
Year Canada Germany Japan Korea Singapore UK US Advanced Economies
Euro Area
2013 7.1 5.2 4.0 3.1 1.9 7.6 7.4 7.9 12.0 2014 6.9 5.0 3.6 3.5 2.0 6.2 6.2 7.3 11.6 2015 6.8 4.7 3.5 3.7 2.0 5.6 5.3 - 11.0 2016 6.8 4.7 3.5 3.5 2.0 5.5 4.9 - 10.5
Source: World Economic Outlook Dataset, October 2015, IMF.
Private consumption has improved in developed economies with the exception of Japan
in 2014, reflecting better growth performance, improving labour markets and lower oil
prices. Consumer expenditure, which is central to growth dynamics in developed
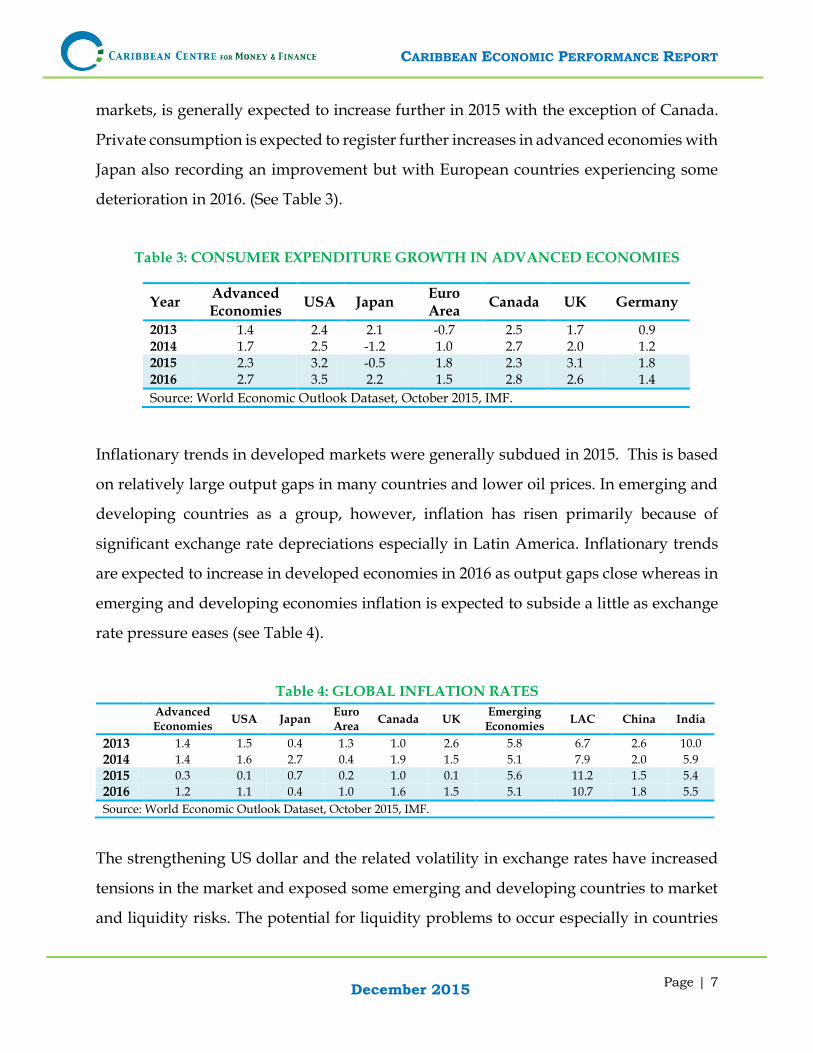
CARIBBEAN ECONOMIC PERFORMANCE REPORT
Page | 7
December 2015
markets, is generally expected to increase further in 2015 with the exception of Canada.
Private consumption is expected to register further increases in advanced economies with
Japan also recording an improvement but with European countries experiencing some
deterioration in 2016. (See Table 3).
Table 3: CONSUMER EXPENDITURE GROWTH IN ADVANCED ECONOMIES
Year Advanced Economies
USA Japan Euro Area
Canada UK Germany
2013 1.4 2.4 2.1 -0.7 2.5 1.7 0.9 2014 1.7 2.5 -1.2 1.0 2.7 2.0 1.2 2015 2.3 3.2 -0.5 1.8 2.3 3.1 1.8 2016 2.7 3.5 2.2 1.5 2.8 2.6 1.4
Source: World Economic Outlook Dataset, October 2015, IMF.
Inflationary trends in developed markets were generally subdued in 2015. This is based
on relatively large output gaps in many countries and lower oil prices. In emerging and
developing countries as a group, however, inflation has risen primarily because of
significant exchange rate depreciations especially in Latin America. Inflationary trends
are expected to increase in developed economies in 2016 as output gaps close whereas in
emerging and developing economies inflation is expected to subside a little as exchange
rate pressure eases (see Table 4).
Table 4: GLOBAL INFLATION RATES
Advanced Economies
USA Japan Euro Area
Canada UK Emerging
Economies LAC China India
2013 1.4 1.5 0.4 1.3 1.0 2.6 5.8 6.7 2.6 10.0
2014 1.4 1.6 2.7 0.4 1.9 1.5 5.1 7.9 2.0 5.9
2015 0.3 0.1 0.7 0.2 1.0 0.1 5.6 11.2 1.5 5.4
2016 1.2 1.1 0.4 1.0 1.6 1.5 5.1 10.7 1.8 5.5
Source: World Economic Outlook Dataset, October 2015, IMF.
The strengthening US dollar and the related volatility in exchange rates have increased
tensions in the market and exposed some emerging and developing countries to market
and liquidity risks. The potential for liquidity problems to occur especially in countries
CARIBBEAN ECONOMIC PERFORMANCE REPORT
Page | 8
December 2015
with high external funding requirements in this tighter funding environment is now a
major risk for some emerging market economies. This could set the stage for sudden
reversals in capital flows and the attendant crisis in capital and currency markets in some
emerging and developing economies. Indeed, this has already happened in some
emerging markets.
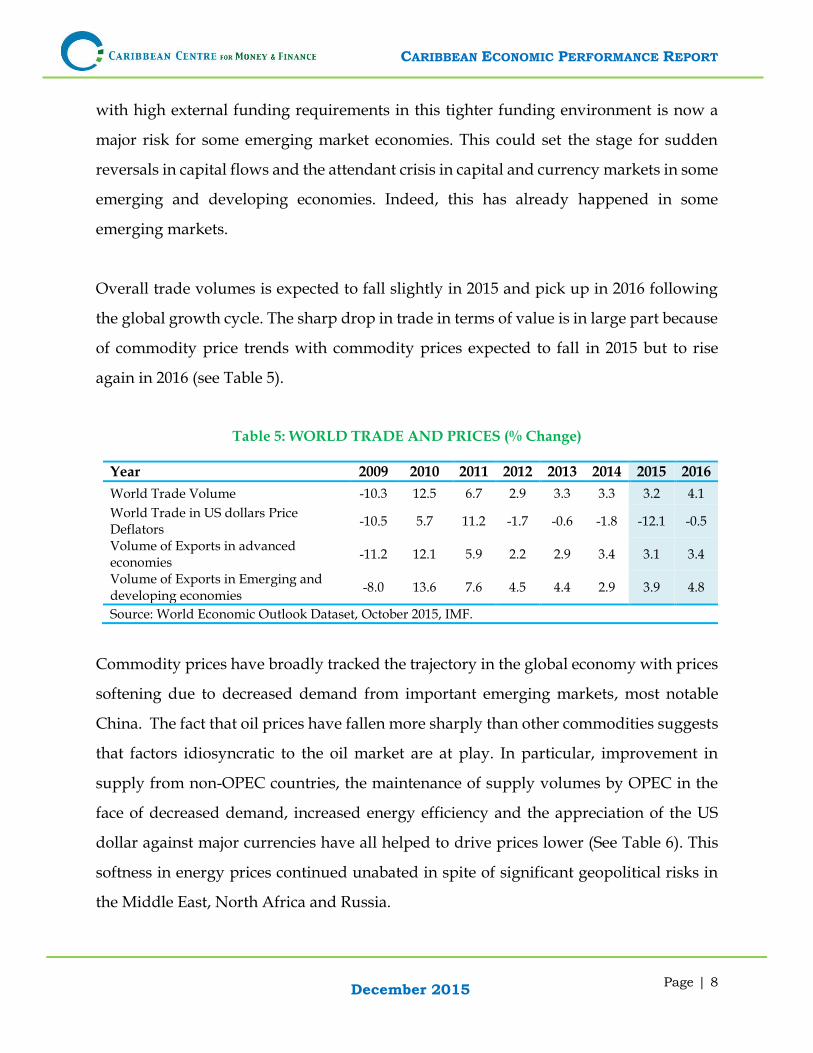
Overall trade volumes is expected to fall slightly in 2015 and pick up in 2016 following
the global growth cycle. The sharp drop in trade in terms of value is in large part because
of commodity price trends with commodity prices expected to fall in 2015 but to rise
again in 2016 (see Table 5).
Table 5: WORLD TRADE AND PRICES (% Change)
Year 2009 2010 2011 2012 2013 2014 2015 2016
World Trade Volume -10.3 12.5 6.7 2.9 3.3 3.3 3.2 4.1
World Trade in US dollars Price Deflators
-10.5 5.7 11.2 -1.7 -0.6 -1.8 -12.1 -0.5
Volume of Exports in advanced economies
-11.2 12.1 5.9 2.2 2.9 3.4 3.1 3.4
Volume of Exports in Emerging and developing economies
-8.0 13.6 7.6 4.5 4.4 2.9 3.9 4.8
Source: World Economic Outlook Dataset, October 2015, IMF.
Commodity prices have broadly tracked the trajectory in the global economy with prices
softening due to decreased demand from important emerging markets, most notable
China. The fact that oil prices have fallen more sharply than other commodities suggests
that factors idiosyncratic to the oil market are at play. In particular, improvement in
supply from non-OPEC countries, the maintenance of supply volumes by OPEC in the
face of decreased demand, increased energy efficiency and the appreciation of the US
dollar against major currencies have all helped to drive prices lower (See Table 6). This
softness in energy prices continued unabated in spite of significant geopolitical risks in
the Middle East, North Africa and Russia.
CARIBBEAN ECONOMIC PERFORMANCE REPORT
Page | 9
December 2015
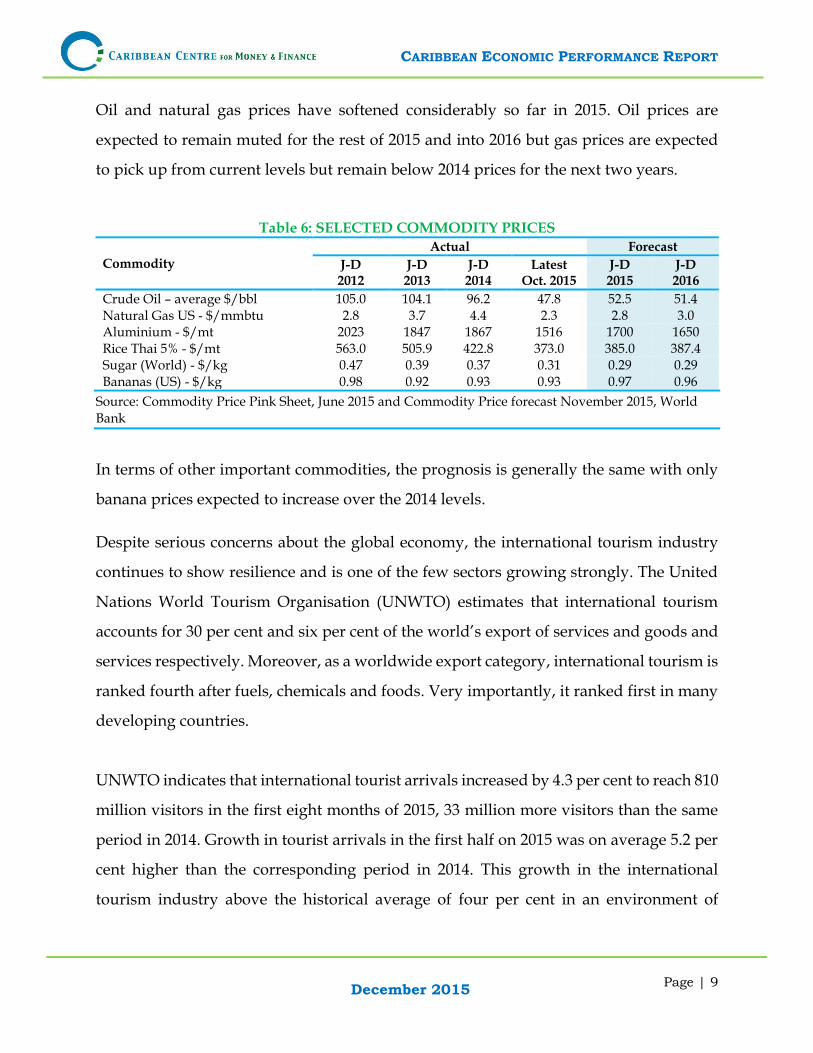
Oil and natural gas prices have softened considerably so far in 2015. Oil prices are
expected to remain muted for the rest of 2015 and into 2016 but gas prices are expected
to pick up from current levels but remain below 2014 prices for the next two years.
Table 6: SELECTED COMMODITY PRICES
Commodity
Actual Forecast
J-D 2012
J-D 2013
J-D 2014
Latest Oct. 2015
J-D 2015
J-D 2016
Crude Oil – average $/bbl 105.0 104.1 96.2 47.8 52.5 51.4 Natural Gas US - $/mmbtu 2.8 3.7 4.4 2.3 2.8 3.0 Aluminium - $/mt 2023 1847 1867 1516 1700 1650 Rice Thai 5% - $/mt 563.0 505.9 422.8 373.0 385.0 387.4 Sugar (World) - $/kg 0.47 0.39 0.37 0.31 0.29 0.29 Bananas (US) - $/kg 0.98 0.92 0.93 0.93 0.97 0.96
Source: Commodity Price Pink Sheet, June 2015 and Commodity Price forecast November 2015, World
Bank
In terms of other important commodities, the prognosis is generally the same with only
banana prices expected to increase over the 2014 levels.
Despite serious concerns about the global economy, the international tourism industry
continues to show resilience and is one of the few sectors growing strongly. The United
Nations World Tourism Organisation (UNWTO) estimates that international tourism
accounts for 30 per cent and six per cent of the world’s export of services and goods and
services respectively. Moreover, as a worldwide export category, international tourism is
ranked fourth after fuels, chemicals and foods. Very importantly, it ranked first in many
developing countries.
UNWTO indicates that international tourist arrivals increased by 4.3 per cent to reach 810
million visitors in the first eight months of 2015, 33 million more visitors than the same
period in 2014. Growth in tourist arrivals in the first half on 2015 was on average 5.2 per
cent higher than the corresponding period in 2014. This growth in the international
tourism industry above the historical average of four per cent in an environment of
CARIBBEAN ECONOMIC PERFORMANCE REPORT
Page | 10
December 2015
moderate and uneven global growth and geopolitical problems in Ukraine, the Middle
East and North Africa highlights the resilience of this sector.
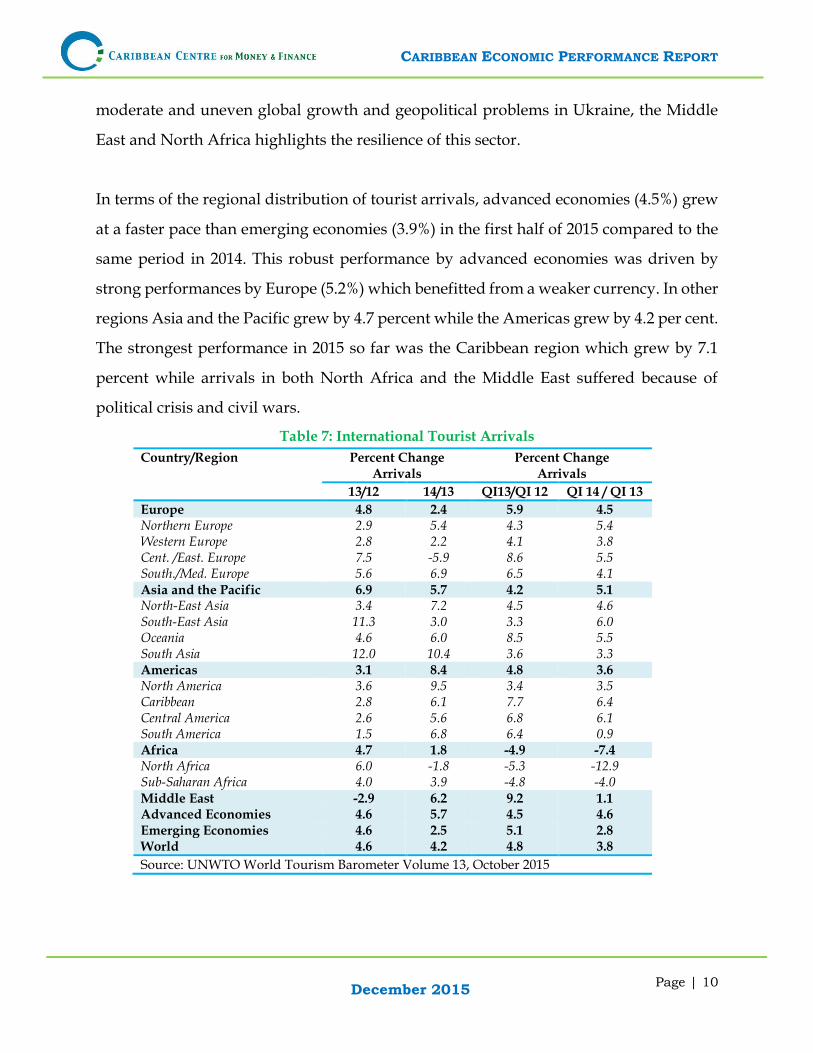
In terms of the regional distribution of tourist arrivals, advanced economies (4.5%) grew
at a faster pace than emerging economies (3.9%) in the first half of 2015 compared to the
same period in 2014. This robust performance by advanced economies was driven by
strong performances by Europe (5.2%) which benefitted from a weaker currency. In other
regions Asia and the Pacific grew by 4.7 percent while the Americas grew by 4.2 per cent.
The strongest performance in 2015 so far was the Caribbean region which grew by 7.1
percent while arrivals in both North Africa and the Middle East suffered because of
political crisis and civil wars.
Table 7: International Tourist Arrivals
Country/Region Percent Change Arrivals
Percent Change Arrivals
13/12 14/13 QI13/QI 12 QI 14 / QI 13
Europe 4.8 2.4 5.9 4.5 Northern Europe 2.9 5.4 4.3 5.4 Western Europe 2.8 2.2 4.1 3.8 Cent. /East. Europe 7.5 -5.9 8.6 5.5 South./Med. Europe 5.6 6.9 6.5 4.1 Asia and the Pacific 6.9 5.7 4.2 5.1 North-East Asia 3.4 7.2 4.5 4.6 South-East Asia 11.3 3.0 3.3 6.0 Oceania 4.6 6.0 8.5 5.5 South Asia 12.0 10.4 3.6 3.3 Americas 3.1 8.4 4.8 3.6 North America 3.6 9.5 3.4 3.5 Caribbean 2.8 6.1 7.7 6.4 Central America 2.6 5.6 6.8 6.1 South America 1.5 6.8 6.4 0.9 Africa 4.7 1.8 -4.9 -7.4 North Africa 6.0 -1.8 -5.3 -12.9 Sub-Saharan Africa 4.0 3.9 -4.8 -4.0 Middle East -2.9 6.2 9.2 1.1 Advanced Economies 4.6 5.7 4.5 4.6 Emerging Economies 4.6 2.5 5.1 2.8 World 4.6 4.2 4.8 3.8
Source: UNWTO World Tourism Barometer Volume 13, October 2015
CARIBBEAN ECONOMIC PERFORMANCE REPORT
Page | 11
December 2015
The outlook for the tourism industry in 2015 is for growth of between three and four per
cent. An important trend to note is that exchange rate developments are having
considerable impacts on the pattern of tourism demand with outbound travel from the
US increasing as the dollar strengthened. Europe has benefitted from a weaker currency
as inbound tourism increased strongly. This implies that countries that are pegged to the
US dollar have to be wary of losing market shares because of this dynamic. The increasing
competition from new destinations also implies that mature destinations have to improve
their competitiveness if they want to increase market share. Factors such as complicated
visa procedures, direct taxation of tourism activity and limited connectivity have been
identified as some of the major impediments to growth in tourism.
CARIBBEAN ECONOMIC PERFORMANCE REPORT
Page | 12
December 2015
3.0 REGIONAL ECONOMIC PERFORMANCE
3.1 ECONOMIC GROWTH
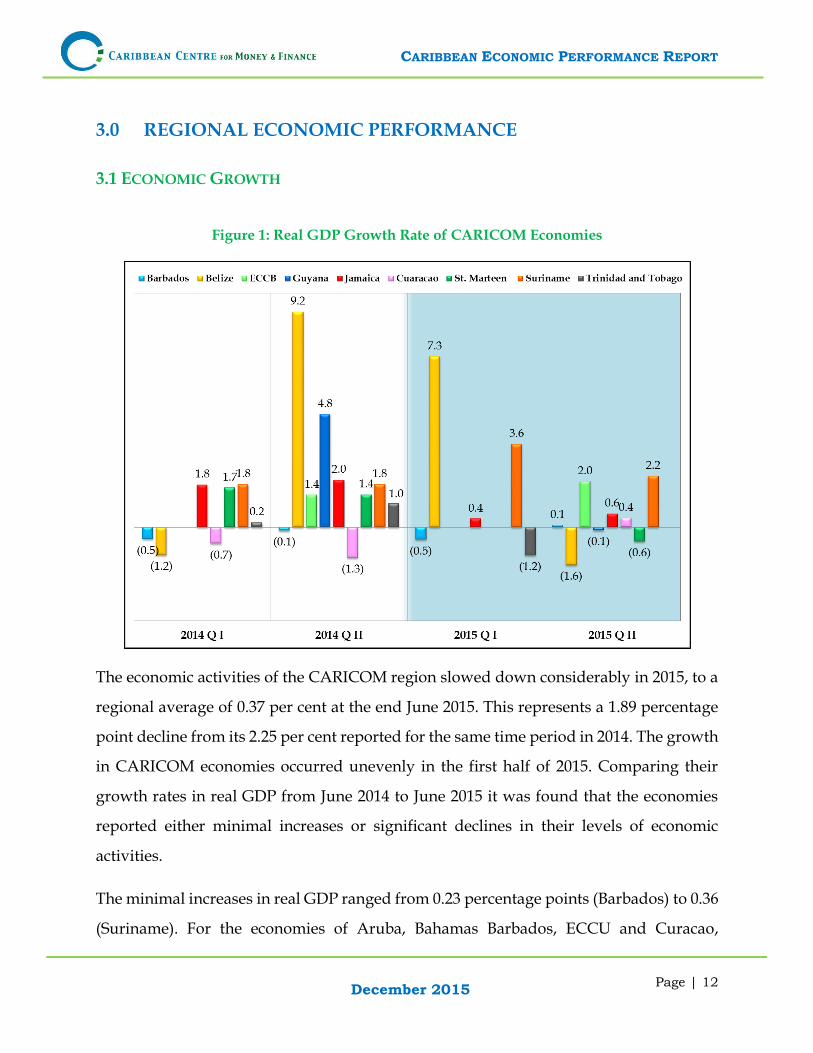
Figure 1: Real GDP Growth Rate of CARICOM Economies
The economic activities of the CARICOM region slowed down considerably in 2015, to a
regional average of 0.37 per cent at the end June 2015. This represents a 1.89 percentage
point decline from its 2.25 per cent reported for the same time period in 2014. The growth
in CARICOM economies occurred unevenly in the first half of 2015. Comparing their
growth rates in real GDP from June 2014 to June 2015 it was found that the economies
reported either minimal increases or significant declines in their levels of economic
activities.
The minimal increases in real GDP ranged from 0.23 percentage points (Barbados) to 0.36
(Suriname). For the economies of Aruba, Bahamas Barbados, ECCU and Curacao,
CARIBBEAN ECONOMIC PERFORMANCE REPORT
Page | 13
December 2015
moderate growth increases were a result of improvements in tourism that continued from
2014, as well as Foreign Direct Investment (FDI). Suriname’s growth was driven by
construction, wholesale and retail trade and fishery.
Notable declines in real GDP ranged from 1.4 percentage points (Jamaica) to 10.8
percentage points (Belize). In both Belize and Guyana the contraction in economic
activities in the first half of 2015 was a result of lower levels of production from their
primary sectors, while in Jamaica it was due to the impact of drought conditions during
the first half of 2015 on its sectors such as Agriculture, Forestry & Fishing and Electricity
& Water Supply. Trinidad and Tobago’s economy also contracted in 2015, having
reported a negative 1.2 per cent growth in real GDP for March 2015; this stemmed from
a contraction in its energy sector output.
CARIBBEAN ECONOMIC PERFORMANCE REPORT
Page | 14
December 2015
3.2 INFLATION
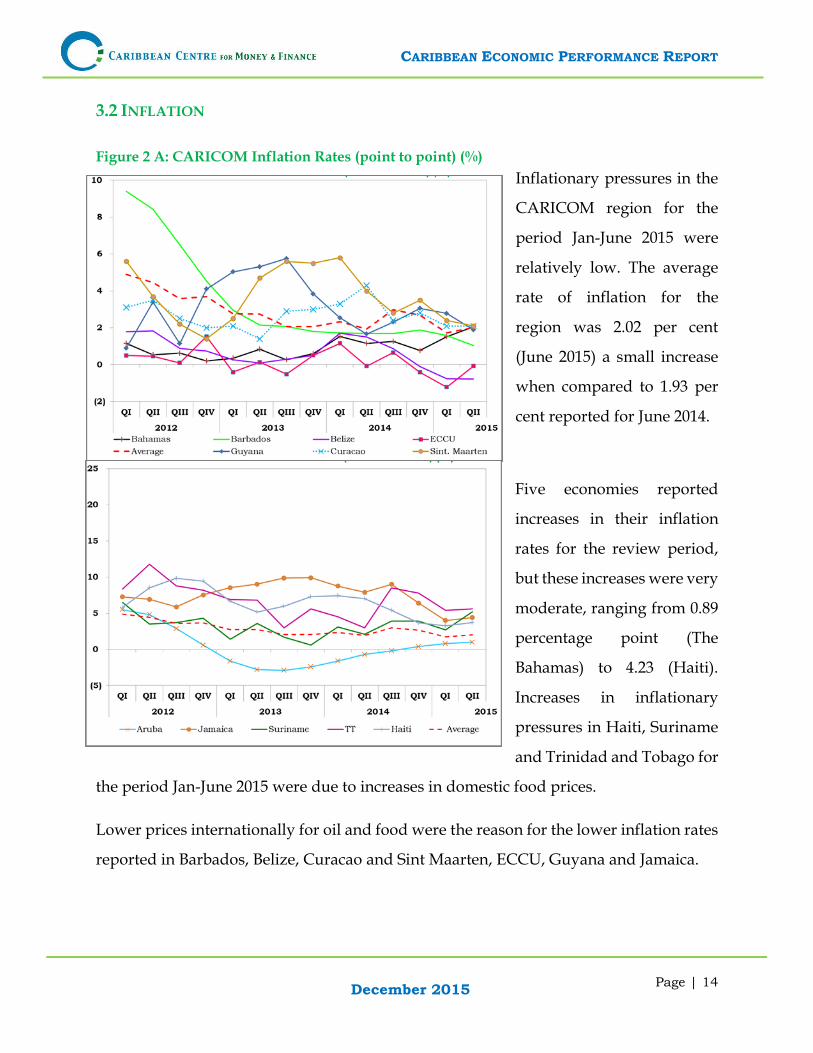
Figure 2 A: CARICOM Inflation Rates (point to point) (%)
Inflationary pressures in the
CARICOM region for the
period Jan-June 2015 were
relatively low. The average
rate of inflation for the
region was 2.02 per cent
(June 2015) a small increase
when compared to 1.93 per
cent reported for June 2014.
Five economies reported
increases in their inflation
rates for the review period,
but these increases were very
moderate, ranging from 0.89
percentage point (The
Bahamas) to 4.23 (Haiti).
Increases in inflationary
pressures in Haiti, Suriname
and Trinidad and Tobago for
the period Jan-June 2015 were due to increases in domestic food prices.
Lower prices internationally for oil and food were the reason for the lower inflation rates
reported in Barbados, Belize, Curacao and Sint Maarten, ECCU, Guyana and Jamaica.
CARIBBEAN ECONOMIC PERFORMANCE REPORT
Page | 15
December 2015
3.3 LABOUR MARKETS
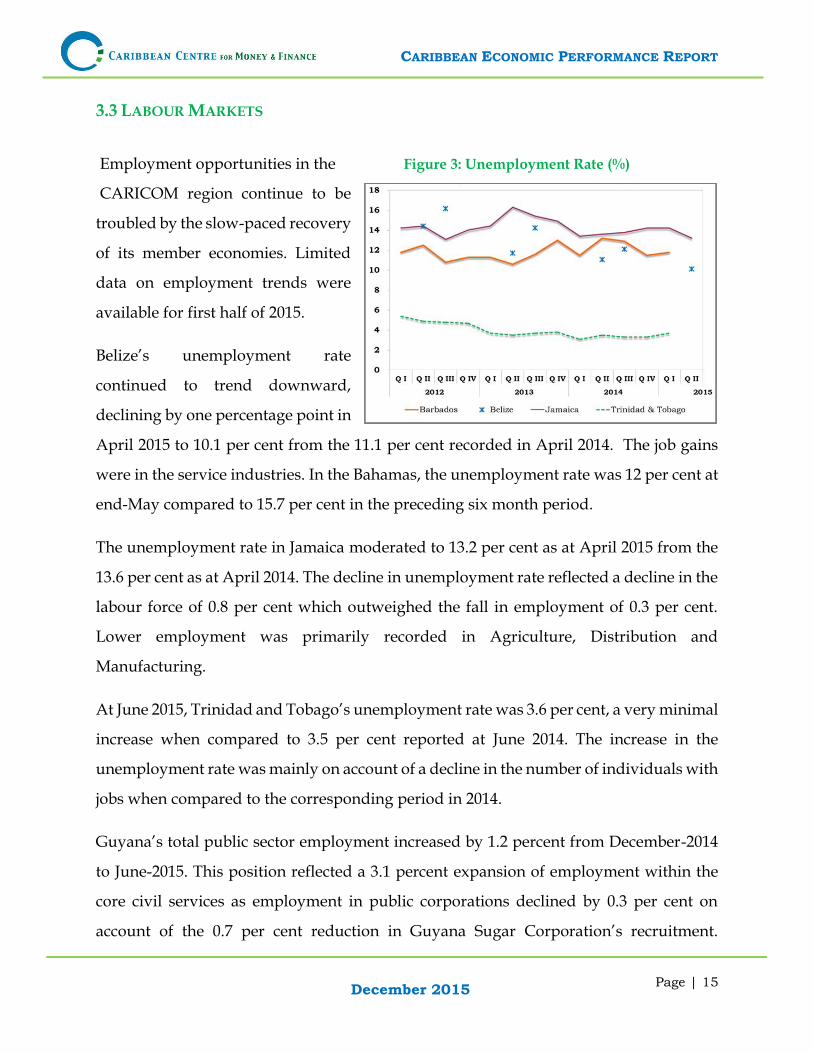
Employment opportunities in the Figure 3: Unemployment Rate (%)
CARICOM region continue to be
troubled by the slow-paced recovery
of its member economies. Limited
data on employment trends were
available for first half of 2015.
Belize’s unemployment rate
continued to trend downward,
declining by one percentage point in
April 2015 to 10.1 per cent from the 11.1 per cent recorded in April 2014. The job gains
were in the service industries. In the Bahamas, the unemployment rate was 12 per cent at
end-May compared to 15.7 per cent in the preceding six month period.
The unemployment rate in Jamaica moderated to 13.2 per cent as at April 2015 from the
13.6 per cent as at April 2014. The decline in unemployment rate reflected a decline in the
labour force of 0.8 per cent which outweighed the fall in employment of 0.3 per cent.
Lower employment was primarily recorded in Agriculture, Distribution and
Manufacturing.
At June 2015, Trinidad and Tobago’s unemployment rate was 3.6 per cent, a very minimal
increase when compared to 3.5 per cent reported at June 2014. The increase in the
unemployment rate was mainly on account of a decline in the number of individuals with
jobs when compared to the corresponding period in 2014.
Guyana’s total public sector employment increased by 1.2 percent from December-2014
to June-2015. This position reflected a 3.1 percent expansion of employment within the
core civil services as employment in public corporations declined by 0.3 per cent on
account of the 0.7 per cent reduction in Guyana Sugar Corporation’s recruitment.
CARIBBEAN ECONOMIC PERFORMANCE REPORT
Page | 16
December 2015
Preliminary estimates indicated a deceleration in private sector employment due to the
reduction in activities primarily in the construction and mining industries.
3.4 FISCAL ACCOUNTS
3.4.1 Current Fiscal Accounts
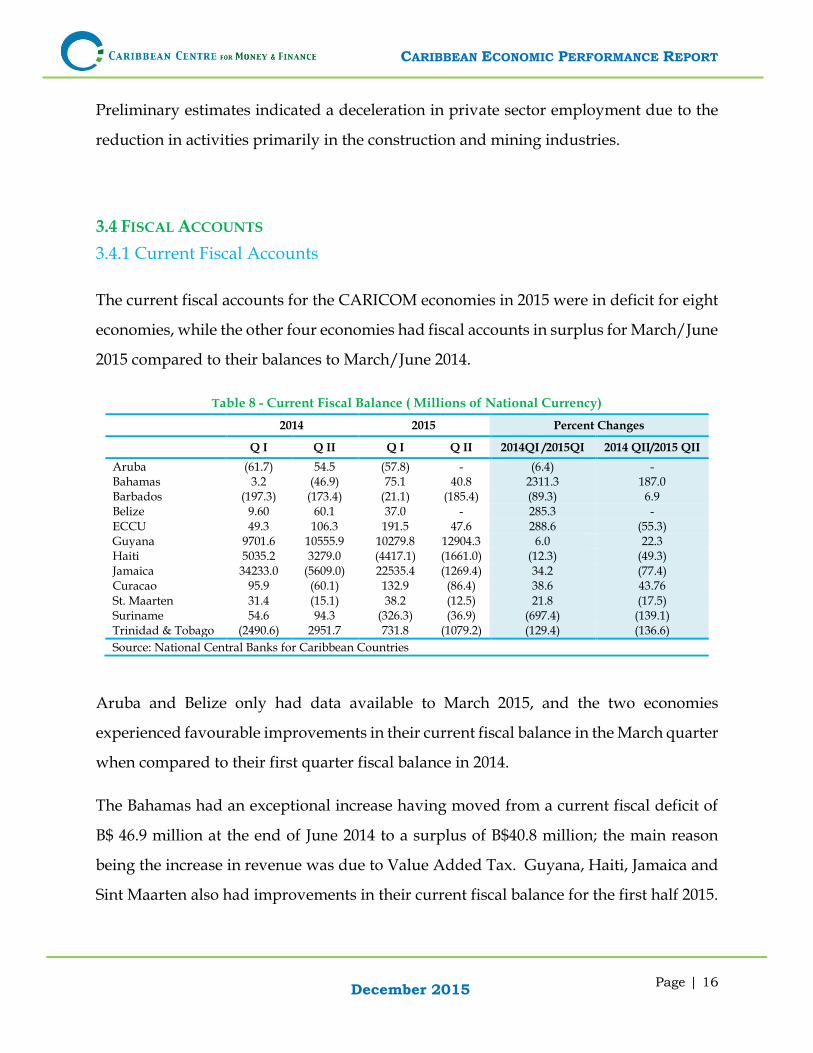
The current fiscal accounts for the CARICOM economies in 2015 were in deficit for eight
economies, while the other four economies had fiscal accounts in surplus for March/June
2015 compared to their balances to March/June 2014.
Table 8 - Current Fiscal Balance ( Millions of National Currency)
2014 2015 Percent Changes
Q I Q II Q I Q II 2014QI /2015QI 2014 QII/2015 QII
Aruba (61.7) 54.5 (57.8) - (6.4) - Bahamas 3.2 (46.9) 75.1 40.8 2311.3 187.0 Barbados (197.3) (173.4) (21.1) (185.4) (89.3) 6.9 Belize 9.60 60.1 37.0 - 285.3 - ECCU 49.3 106.3 191.5 47.6 288.6 (55.3) Guyana 9701.6 10555.9 10279.8 12904.3 6.0 22.3 Haiti 5035.2 3279.0 (4417.1) (1661.0) (12.3) (49.3) Jamaica 34233.0 (5609.0) 22535.4 (1269.4) 34.2 (77.4) Curacao 95.9 (60.1) 132.9 (86.4) 38.6 43.76 St. Maarten 31.4 (15.1) 38.2 (12.5) 21.8 (17.5) Suriname 54.6 94.3 (326.3) (36.9) (697.4) (139.1) Trinidad & Tobago (2490.6) 2951.7 731.8 (1079.2) (129.4) (136.6)
Source: National Central Banks for Caribbean Countries
Aruba and Belize only had data available to March 2015, and the two economies
experienced favourable improvements in their current fiscal balance in the March quarter
when compared to their first quarter fiscal balance in 2014.
The Bahamas had an exceptional increase having moved from a current fiscal deficit of
B$ 46.9 million at the end of June 2014 to a surplus of B$40.8 million; the main reason
being the increase in revenue was due to Value Added Tax. Guyana, Haiti, Jamaica and
Sint Maarten also had improvements in their current fiscal balance for the first half 2015.
CARIBBEAN ECONOMIC PERFORMANCE REPORT
Page | 17
December 2015
In all three case the improvements in their current fiscal accounts was on account of
increases in their current revenue and lower current expenditure for the review period.
At the end of June 2015 the current fiscal accounts for Barbados, Curacao, Suriname and
Trinidad and Tobago had declines compared to their June 2014 account balances. The
deterioration was significant for Suriname and Trinidad and Tobago moving from a
current account fiscal surplus balance in June 2014 to a deficit balance in June 2015.
Suriname’s deficit was due to a significant decline in revenue from the mining sector due
to the unfavorable low commodity prices.
3.4.2 Overall Fiscal Accounts
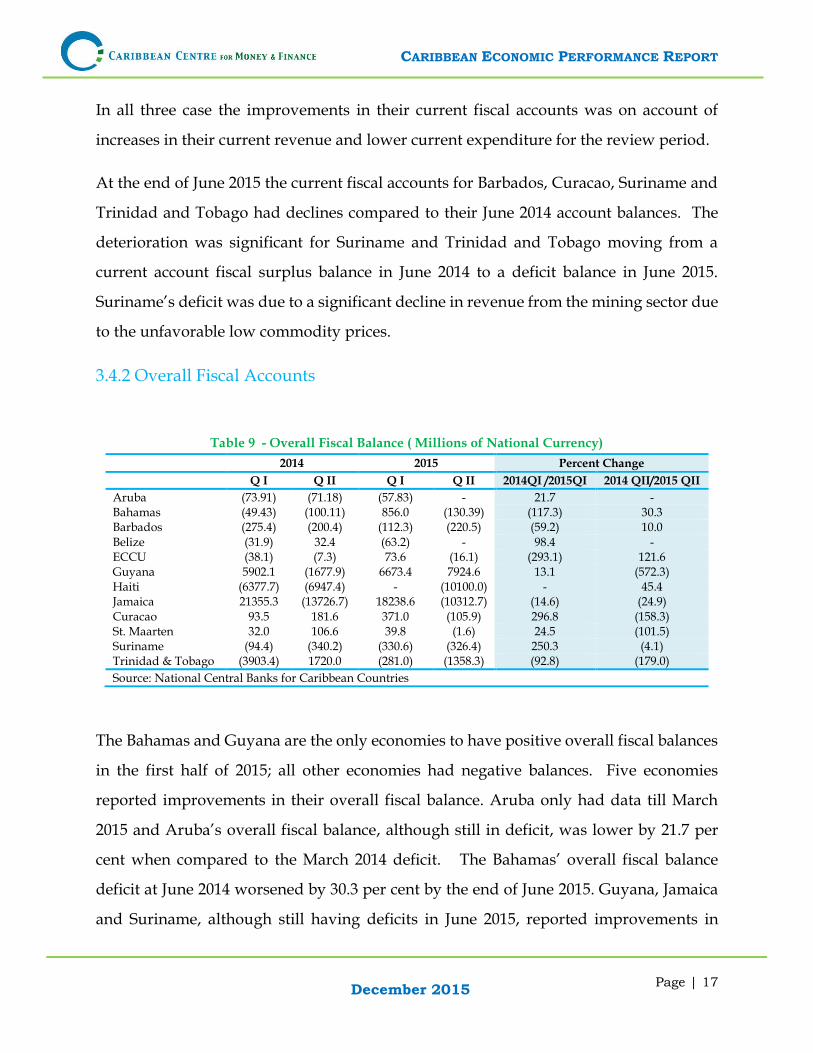
Table 9 - Overall Fiscal Balance ( Millions of National Currency)
2014 2015 Percent Change
Q I Q II Q I Q II 2014QI /2015QI 2014 QII/2015 QII
Aruba (73.91) (71.18) (57.83) - 21.7 - Bahamas (49.43) (100.11) 856.0 (130.39) (117.3) 30.3 Barbados (275.4) (200.4) (112.3) (220.5) (59.2) 10.0 Belize (31.9) 32.4 (63.2) - 98.4 - ECCU (38.1) (7.3) 73.6 (16.1) (293.1) 121.6 Guyana 5902.1 (1677.9) 6673.4 7924.6 13.1 (572.3) Haiti (6377.7) (6947.4) - (10100.0) - 45.4 Jamaica 21355.3 (13726.7) 18238.6 (10312.7) (14.6) (24.9) Curacao 93.5 181.6 371.0 (105.9) 296.8 (158.3) St. Maarten 32.0 106.6 39.8 (1.6) 24.5 (101.5) Suriname (94.4) (340.2) (330.6) (326.4) 250.3 (4.1) Trinidad & Tobago (3903.4) 1720.0 (281.0) (1358.3) (92.8) (179.0)
Source: National Central Banks for Caribbean Countries
The Bahamas and Guyana are the only economies to have positive overall fiscal balances
in the first half of 2015; all other economies had negative balances. Five economies
reported improvements in their overall fiscal balance. Aruba only had data till March
2015 and Aruba’s overall fiscal balance, although still in deficit, was lower by 21.7 per
cent when compared to the March 2014 deficit. The Bahamas’ overall fiscal balance
deficit at June 2014 worsened by 30.3 per cent by the end of June 2015. Guyana, Jamaica
and Suriname, although still having deficits in June 2015, reported improvements in
CARIBBEAN ECONOMIC PERFORMANCE REPORT
Page | 18
December 2015
overall fiscal balance when compared to balances at June 2014. Increases in revenue due
to improved collection of taxes were the main contributor to Guyana and Jamaica’s
favourable improvements in their overall fiscal deficits.
However the economies of Barbados, ECCU, Haiti and Trinidad and Tobago experienced
deteriorations in their overall fiscal balance at June 2015 when compared to June 2014;
and Belize was for the period March 2014 to March 2015. The most significant
deterioration in overall fiscal balances was in Trinidad and Tobago, the main reason
being lower revenue from the energy sector.
CARIBBEAN ECONOMIC PERFORMANCE REPORT
Page | 19
December 2015
3.5 BANKING AND FINANCE
3.5.1 Interest Rates
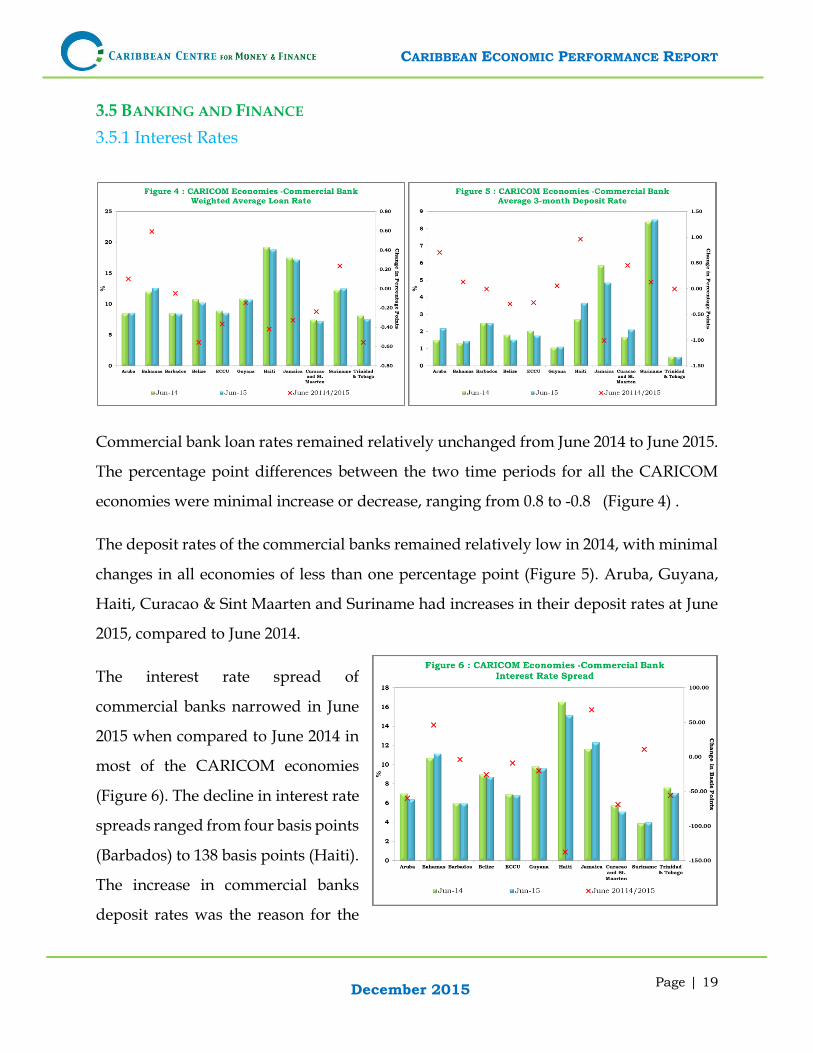
Commercial bank loan rates remained relatively unchanged from June 2014 to June 2015.
The percentage point differences between the two time periods for all the CARICOM
economies were minimal increase or decrease, ranging from 0.8 to -0.8 (Figure 4) .
The deposit rates of the commercial banks remained relatively low in 2014, with minimal
changes in all economies of less than one percentage point (Figure 5). Aruba, Guyana,
Haiti, Curacao & Sint Maarten and Suriname had increases in their deposit rates at June
2015, compared to June 2014.
The interest rate spread of
commercial banks narrowed in June
2015 when compared to June 2014 in
most of the CARICOM economies
(Figure 6). The decline in interest rate
spreads ranged from four basis points
(Barbados) to 138 basis points (Haiti).
The increase in commercial banks
deposit rates was the reason for the
CARIBBEAN ECONOMIC PERFORMANCE REPORT
Page | 20
December 2015
narrowing of interest rate spreads in these economies. However the economies of The
Bahamas, Jamaica and Suriname experienced a widening in their interest rate spread
ranging from 10.6 basis points to 68.1 basis points.
3.5.2 Commercial Bank Performance
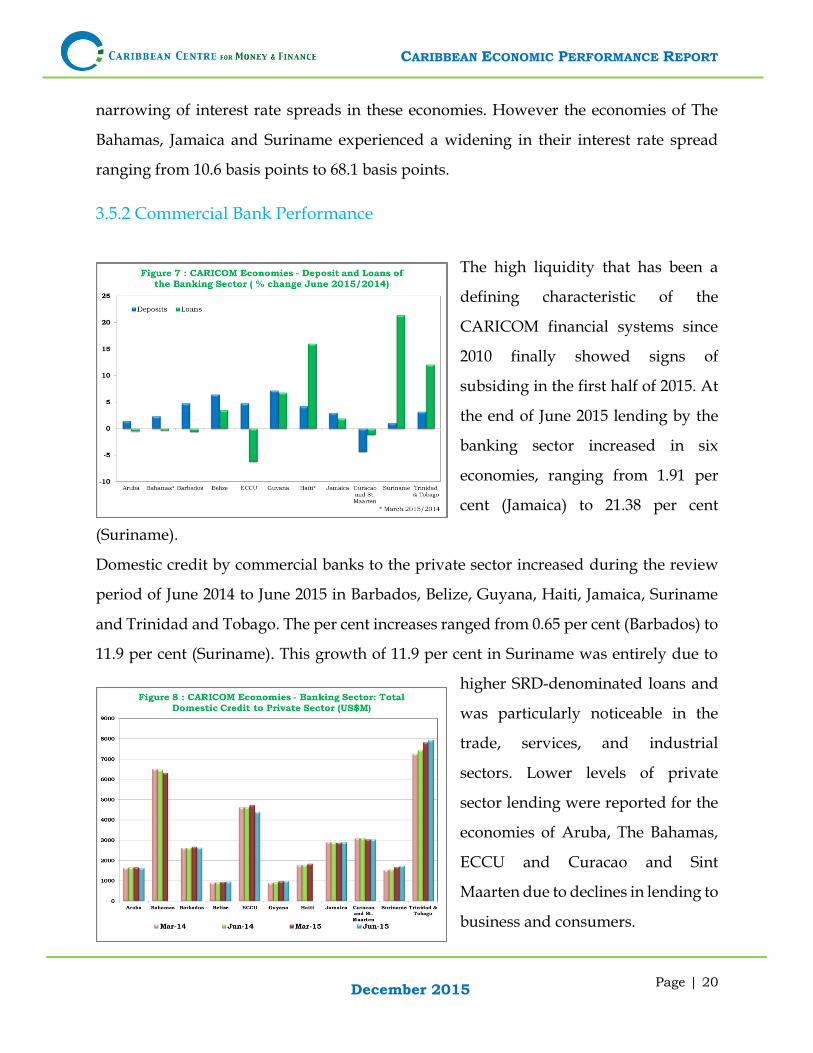
The high liquidity that has been a
defining characteristic of the
CARICOM financial systems since
2010 finally showed signs of
subsiding in the first half of 2015. At
the end of June 2015 lending by the
banking sector increased in six
economies, ranging from 1.91 per
cent (Jamaica) to 21.38 per cent
(Suriname).
Domestic credit by commercial banks to the private sector increased during the review
period of June 2014 to June 2015 in Barbados, Belize, Guyana, Haiti, Jamaica, Suriname
and Trinidad and Tobago. The per cent increases ranged from 0.65 per cent (Barbados) to
11.9 per cent (Suriname). This growth of 11.9 per cent in Suriname was entirely due to
higher SRD-denominated loans and
was particularly noticeable in the
trade, services, and industrial
sectors. Lower levels of private
sector lending were reported for the
economies of Aruba, The Bahamas,
ECCU and Curacao and Sint
Maarten due to declines in lending to
business and consumers.
CARIBBEAN ECONOMIC PERFORMANCE REPORT
Page | 21
December 2015
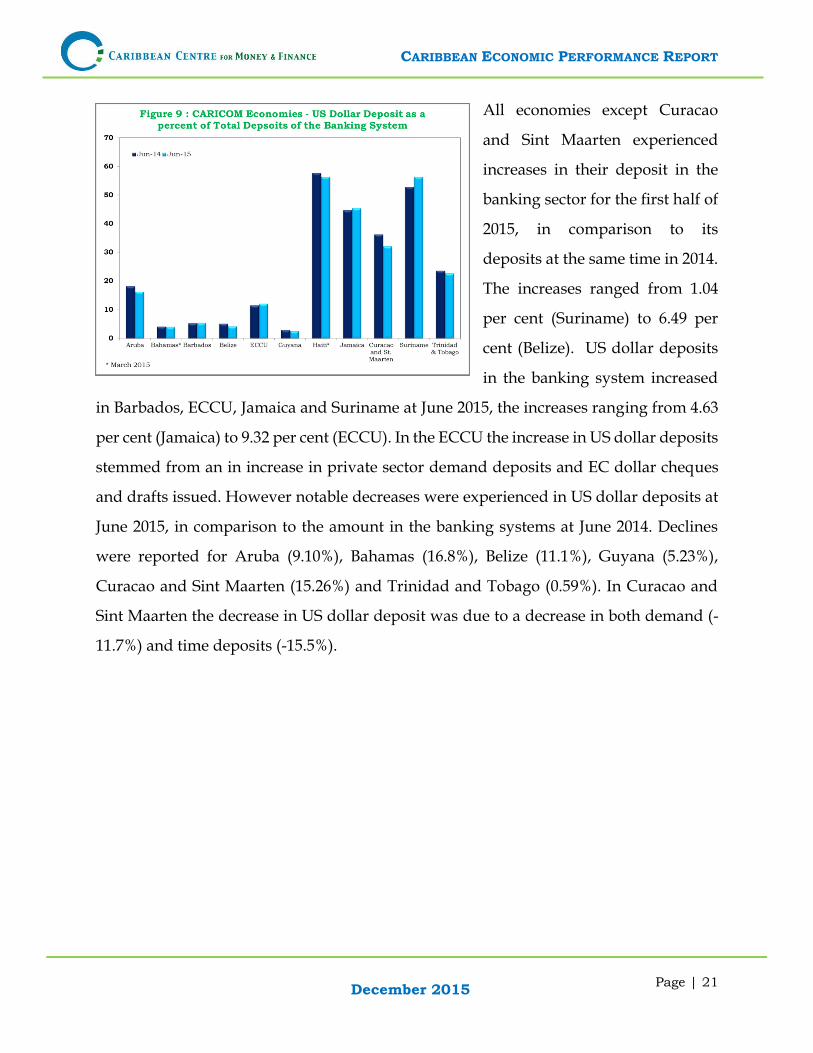
All economies except Curacao
and Sint Maarten experienced
increases in their deposit in the
banking sector for the first half of
2015, in comparison to its
deposits at the same time in 2014.
The increases ranged from 1.04
per cent (Suriname) to 6.49 per
cent (Belize). US dollar deposits
in the banking system increased
in Barbados, ECCU, Jamaica and Suriname at June 2015, the increases ranging from 4.63
per cent (Jamaica) to 9.32 per cent (ECCU). In the ECCU the increase in US dollar deposits
stemmed from an in increase in private sector demand deposits and EC dollar cheques
and drafts issued. However notable decreases were experienced in US dollar deposits at
June 2015, in comparison to the amount in the banking systems at June 2014. Declines
were reported for Aruba (9.10%), Bahamas (16.8%), Belize (11.1%), Guyana (5.23%),
Curacao and Sint Maarten (15.26%) and Trinidad and Tobago (0.59%). In Curacao and
Sint Maarten the decrease in US dollar deposit was due to a decrease in both demand (-
11.7%) and time deposits (-15.5%).
CARIBBEAN ECONOMIC PERFORMANCE REPORT
Page | 22
December 2015
3.5.3 Financial Soundness Indicators – Banking System
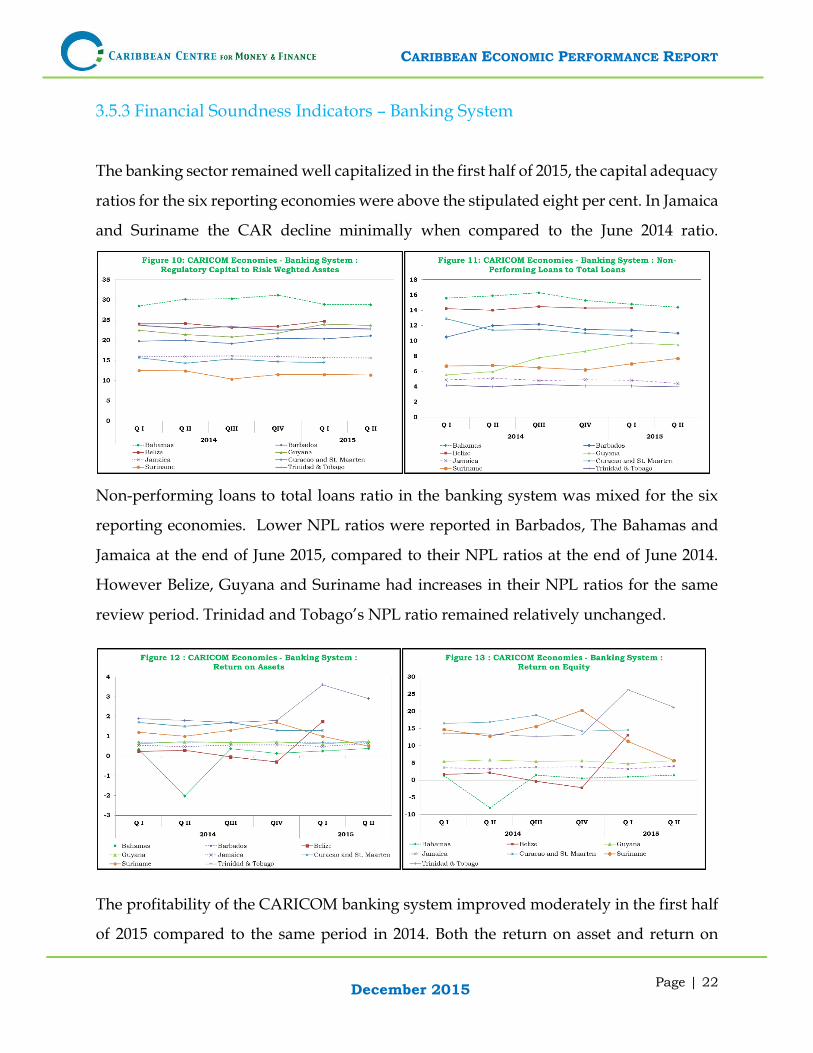
The banking sector remained well capitalized in the first half of 2015, the capital adequacy
ratios for the six reporting economies were above the stipulated eight per cent. In Jamaica
and Suriname the CAR decline minimally when compared to the June 2014 ratio.
Non-performing loans to total loans ratio in the banking system was mixed for the six
reporting economies. Lower NPL ratios were reported in Barbados, The Bahamas and
Jamaica at the end of June 2015, compared to their NPL ratios at the end of June 2014.
However Belize, Guyana and Suriname had increases in their NPL ratios for the same
review period. Trinidad and Tobago’s NPL ratio remained relatively unchanged.
The profitability of the CARICOM banking system improved moderately in the first half
of 2015 compared to the same period in 2014. Both the return on asset and return on
CARIBBEAN ECONOMIC PERFORMANCE REPORT
Page | 23
December 2015
equity ratios reported minimal, and in some cases moderate, increases over the review
period. Increases in their return on assets ratio was experienced by Belize, Guyana, The
Bahamas,Jamaica and Trinidad and Tobago, while Belize, Jamaica and Trinidad and
Tobago also reported increases in their return on equity ratios. However, Guyana
reported a decline in its return on equity. Declines in banking system profitability were
experienced by Suriname which had a significantly lower return on assets and return on
equity ratios in June 2015, compared to it June 2014 ratios.
CARIBBEAN ECONOMIC PERFORMANCE REPORT
Page | 24
December 2015
3.6 PUBLIC DEBT
The CARICOM economies’ debt issues continued into 2015. At the end of the first half of
2015 all economies had experienced increases in their overall debt.
Table 10 : CARICOM Economies Debt Outstanding
Country
Domestic Debt Outstanding
( National Currency $M)
Domestic Debt Outstanding ( % Change
2015 QII /2014 QII)
External Debt Outstanding (US$M)
External Debt Outstanding ( % Change
2015 QII /2014 QII) 2014 Q II 2015 QII 2014 QII 2015 QII
Bahamas 3670.7 4044.7 10.9 1487.8 1609.7 8.3 Barbados 5472.6 6125.5 11.9 1455.8 1397.2 (4.0) Belize 379.8 409.3 7.8 1093.9 1157.8 5.8 ECCU 6224.1 5778.0 (7.1) 2657.3 2613.0 (1.7) Guyana 87298.8 75867.8 (13.1) 1226.6 1220.0 (0.5) Haiti 1020.1 977.9 (4.1) 1562.4* 1938.9* 24.1* Jamaica 1031923.1 1058106.0 2.5 8327.3 8284.6 (0.5) Curacao 109.5 120.1 9.7 1094.2 1231.3 12.5 Sint Maarten 140.6 111.3 (20.8) 263.1 280.0 6.44 Suriname 1459.3 2168.1 48.5 769.4 884.6 14.9 Trinidad and Tobago 28267.4 30733.7 8.7 2272.0 2259.2 (0.6)
Source : National Central Banks for Caribbean Countries ; *: Represents Data at the end of March
The domestic debt outstanding in the ECCU, Guyana, Haiti and Sint Maarten
experienced a reduction in June 2015 compared to June 2014. The decline in domestic debt
was notable in Guyana and Sint Maarten. Guyana’s decline of 13.1 per cent reflected a
contraction in the stock of outstanding government treasury bills.
The other economies, with the exception of Suriname, all had increases in their domestic
debt levels that ranged from 2.5 per cent (Jamaica) to 11.9 per cent (Barbados). Suriname’s
June 2015 domestic debt compared to its June 2014 level, increased by a very significant
48.5 per cent, this was due to increased borrowing by the government from the Central
Bank and private domestic banks to finance its fiscal deficit.
The external debt increases ranged from 5.8 per cent (Belize) to 14.9 per cent (Suriname).
Suriname’s external debt increase was due to new concessional loans with multilateral
organizations. Data on the external debt outstanding was only available to March 2015
CARIBBEAN ECONOMIC PERFORMANCE REPORT
Page | 25
December 2015
for Haiti, its external debt outstanding for this period compared to its March 2014 level
increased by a considerable 24.1 per cent.
3.7 INTERNATIONAL TRADE
3.7.1 External Current Account
The trade sector of the CARICOM economies for which data was available, showed that
they continue to underperform in the first half of 2015. Barbados, Belize, Guyana,
Jamaica, Curacao and Suriname all experienced a negative balance of trade at June 2015.
Trinidad and Tobago only had trade data available to March 2015; their balance of trade
was in surplus.
Table 11 - External Current Account (US$M)
2014 Q I 2014 Q II 2015 Q I 2015 Q II Percent Change
2015 QII/2014QII
Aruba 56.31 -71.0 - - - Bahamas -324.4 -354.6 -334.6 -176.0 -50.3 Barbados -60.3 -177.8 15.8 --144.0 -19.0 Belize -4.8 -9.7 -4.8 -9.7 0.0 Guyana -116.7 -97.9 -77.5 -43.8 -55.3 Jamaica -127.1 -270.8 40.7 -85.5 -68.4 Curacao * -99.2 -21.8 -47.2 - -52.5* St. Maarten 14.4 -1.2 - - - Suriname -55.2 -89.5 -164.4 -168.5 88.3 Trinidad & Tobago* -355.0 344.9 19.7 - -105.5*
Source: National Central Banks for Caribbean Countries ; *: Represent 2015 QI/2014 QI
The performance of the economies’ external current accounts was mixed for the first half
of 2015 compared to the performance in the first half of 2014. Three of the economies –
Barbados, Guyana and Jamaica - reported improvements in their current account
balances while Suriname reported a deterioration and Belize had no change. The most
notable contractions in current account balance for the review period were in Guyana
and Jamaica. The contraction of 55.3 per cent in Guyana’s external current account was
CARIBBEAN ECONOMIC PERFORMANCE REPORT
Page | 26
December 2015
on account of a lower balance of trade deficit and lower net payments for services.
Jamaica’s contraction of 68.4 per cent in its current account reflected improvements on all
sub-accounts. However Suriname experienced an 88.3 per cent increase in its current
account balance at June 2015 in comparison to it June 2014 balance. This was because the
goods account recorded a deficit in the first half of 2015 compared to a surplus in the first
half of 2014. Exports of goods fell by 15 per cent, primarily driven by gold and oil, while
imports of goods rose by eight per cent, in particular the imports of capital goods by the
mining sector due to the construction of the new gold mine.
Curacao and Trinidad and Tobago also experienced improvements in their external
current accounts at the end of March 2015 compared to its March 2014. The narrowing of
Curacao’s current account by 52.5 per cent was because of lower imports and increases
in exports. Trinidad and Tobago’s improvement of 105.3 per cent was mainly a reflection
of the substantial narrowing of the deficit on the investment income account.
3.7.2 External Capital Account
The Bahamas, Barbados and Trinidad and Tobago were the only economies to report a
negative external current account balance during the first half of 2015. The other six
economies reported positive capital accounts.
Table 12 - External Capital Account ( Absolute - US$M)
2014 Q I 2014 Q II 2015 Q I 2015 Q II Percent change
2015 QII/2014 QII
Aruba -10.9 30.7 - - -
Bahamas 390.6 419.6 110.8 46.2 -89.0
Barbados -2.3 -1.3 -1.7 -2.1 57.5
Belize 22.7 7.7 22.7 5.2 -32.5
Guyana 63.5 17.3 7.6 12.9 -25.1
Haiti 5.8 6.5 6.0 8.0 23.1
Jamaica 403.9 375.1 311.1 137.9 -63.2
Curacao 75.8 33.2 24.3 - -67.9*
St. Maarten 2.5 -19.6 - - -
Suriname 101.0 48.6 135.1 169.1 248.2
Trinidad & Tobago 381.3 -52.9 -626.0 - -264.2*
Source: National Central Banks for Caribbean Countries ; *: Represent 2015 QI/2014 QI
CARIBBEAN ECONOMIC PERFORMANCE REPORT
Page | 27
December 2015
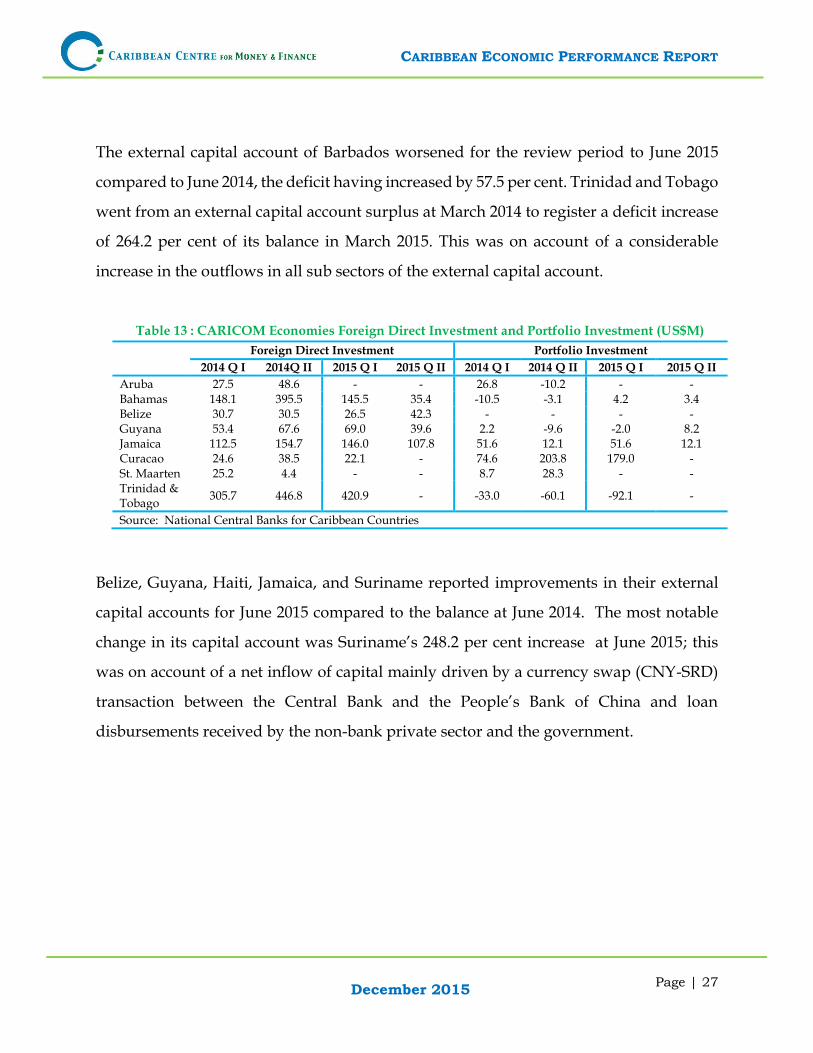
The external capital account of Barbados worsened for the review period to June 2015
compared to June 2014, the deficit having increased by 57.5 per cent. Trinidad and Tobago
went from an external capital account surplus at March 2014 to register a deficit increase
of 264.2 per cent of its balance in March 2015. This was on account of a considerable
increase in the outflows in all sub sectors of the external capital account.
Table 13 : CARICOM Economies Foreign Direct Investment and Portfolio Investment (US$M)
Foreign Direct Investment Portfolio Investment
2014 Q I 2014Q II 2015 Q I 2015 Q II 2014 Q I 2014 Q II 2015 Q I 2015 Q II
Aruba 27.5 48.6 - - 26.8 -10.2 - - Bahamas 148.1 395.5 145.5 35.4 -10.5 -3.1 4.2 3.4 Belize 30.7 30.5 26.5 42.3 - - - - Guyana 53.4 67.6 69.0 39.6 2.2 -9.6 -2.0 8.2 Jamaica 112.5 154.7 146.0 107.8 51.6 12.1 51.6 12.1 Curacao 24.6 38.5 22.1 - 74.6 203.8 179.0 - St. Maarten 25.2 4.4 - - 8.7 28.3 - - Trinidad & Tobago
305.7 446.8 420.9 - -33.0 -60.1 -92.1 -
Source: National Central Banks for Caribbean Countries
Belize, Guyana, Haiti, Jamaica, and Suriname reported improvements in their external
capital accounts for June 2015 compared to the balance at June 2014. The most notable
change in its capital account was Suriname’s 248.2 per cent increase at June 2015; this
was on account of a net inflow of capital mainly driven by a currency swap (CNY-SRD)
transaction between the Central Bank and the People’s Bank of China and loan
disbursements received by the non-bank private sector and the government.
CARIBBEAN ECONOMIC PERFORMANCE REPORT
Page | 28
December 2015
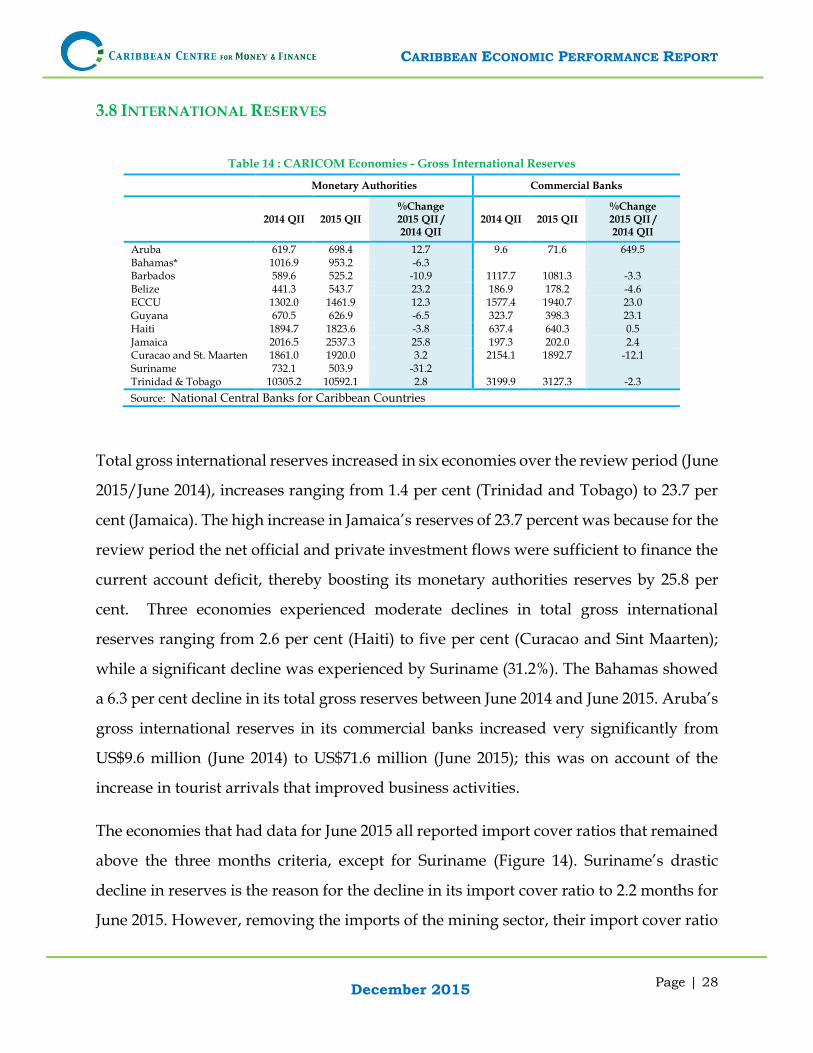
3.8 INTERNATIONAL RESERVES
Table 14 : CARICOM Economies - Gross International Reserves
Monetary Authorities Commercial Banks
2014 QII 2015 QII %Change 2015 QII / 2014 QII
2014 QII 2015 QII %Change 2015 QII / 2014 QII
Aruba 619.7 698.4 12.7 9.6 71.6 649.5 Bahamas* 1016.9 953.2 -6.3 Barbados 589.6 525.2 -10.9 1117.7 1081.3 -3.3 Belize 441.3 543.7 23.2 186.9 178.2 -4.6 ECCU 1302.0 1461.9 12.3 1577.4 1940.7 23.0 Guyana 670.5 626.9 -6.5 323.7 398.3 23.1 Haiti 1894.7 1823.6 -3.8 637.4 640.3 0.5 Jamaica 2016.5 2537.3 25.8 197.3 202.0 2.4 Curacao and St. Maarten 1861.0 1920.0 3.2 2154.1 1892.7 -12.1 Suriname 732.1 503.9 -31.2 Trinidad & Tobago 10305.2 10592.1 2.8 3199.9 3127.3 -2.3
Source: National Central Banks for Caribbean Countries
Total gross international reserves increased in six economies over the review period (June
2015/June 2014), increases ranging from 1.4 per cent (Trinidad and Tobago) to 23.7 per
cent (Jamaica). The high increase in Jamaica’s reserves of 23.7 percent was because for the
review period the net official and private investment flows were sufficient to finance the
current account deficit, thereby boosting its monetary authorities reserves by 25.8 per
cent. Three economies experienced moderate declines in total gross international
reserves ranging from 2.6 per cent (Haiti) to five per cent (Curacao and Sint Maarten);
while a significant decline was experienced by Suriname (31.2%). The Bahamas showed
a 6.3 per cent decline in its total gross reserves between June 2014 and June 2015. Aruba’s
gross international reserves in its commercial banks increased very significantly from
US$9.6 million (June 2014) to US$71.6 million (June 2015); this was on account of the
increase in tourist arrivals that improved business activities.
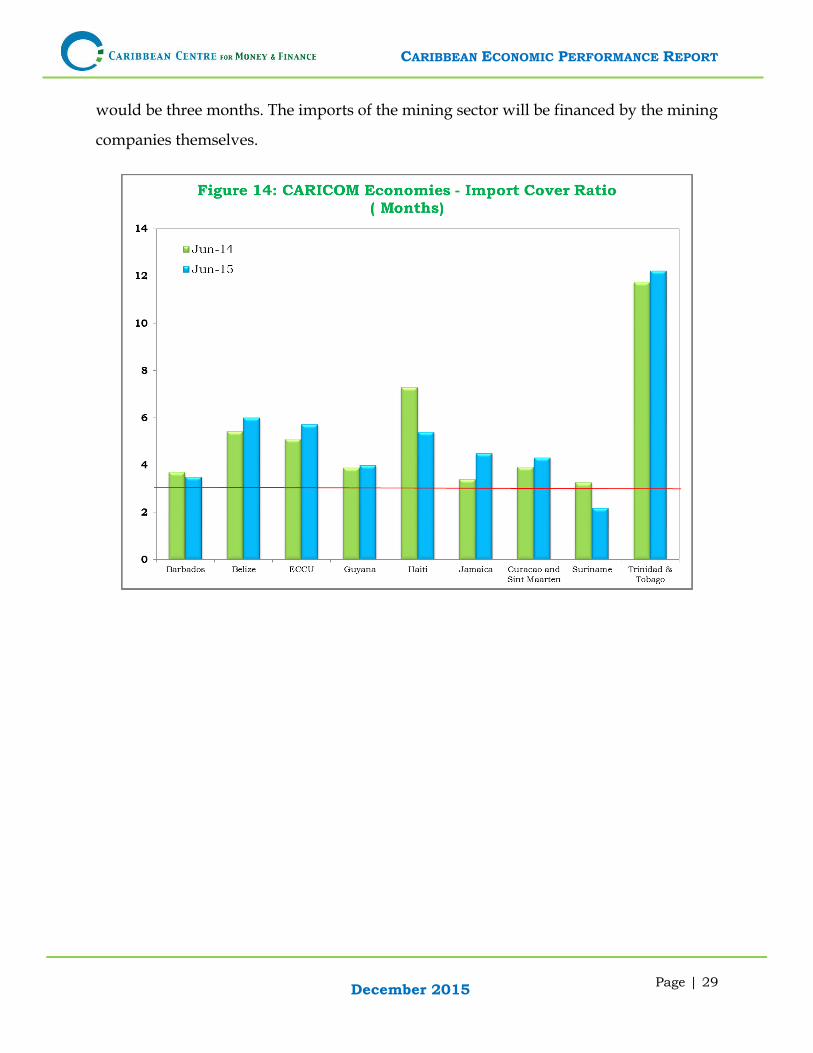
The economies that had data for June 2015 all reported import cover ratios that remained
above the three months criteria, except for Suriname (Figure 14). Suriname’s drastic
decline in reserves is the reason for the decline in its import cover ratio to 2.2 months for
June 2015. However, removing the imports of the mining sector, their import cover ratio
CARIBBEAN ECONOMIC PERFORMANCE REPORT
Page | 29
December 2015
would be three months. The imports of the mining sector will be financed by the mining
companies themselves.
CARIBBEAN ECONOMIC PERFORMANCE REPORT
Page | 30
December 2015
4.0 PROSPECTS 2015/2016
The prospects for growth in the Caribbean hinge not only on international developments
but also on the inherent structural macroeconomic vulnerabilities of these countries. The
global economy in the last year has been characterised by divergence amongst major
economies, differential performances between developed and emerging economies and
relatively muted global growth. The fact that downside risks have become more
significant over the last three months also signal that these difficult international
economic conditions are likely to persist over the next two years. Additionally, questions
about the sustainability of the PETROCARIBE arrangement, based on severe economic
problems in Venezuela driven by a sharp drop in oil prices, is a significant risk to
Caribbean economic growth prospects, since this arrangement is a significant source of
balance of payment support for many countries in the region which already have chronic
balance of payments problems.
In this challenging international economic environment the outlook for the CARICOM
region is mixed. The major forces that will drive the performance of the region include
commodity price trends, a stronger US economy and related exchange and interest rate
dynamics. Commodity-based producers are expected to face increased challenges as
commodity prices soften while the services-based economies rebound based on
improved tourism outturns and lower fuel costs. The IMF estimates that the region will
grow by approximately 2.2 per cent in 2015 improving to 2.4 per cent in 2016. Commodity
producers are generally expected to post slower growth relative to service-based
economies over the next two years with the former group of countries forecast to record
lower growth of 1.9 per cent and 2.3 per cent in 2015 and 2016 while the latter group is
expected to record growth of 2.3 per cent and 2.5 per cent over these two years. There
would be significant differences between countries however since some countries have
pre-existing external, fiscal and financial vulnerabilities which restrain growth. These
vulnerabilities have constrained business and consumer confidence and hampered
CARIBBEAN ECONOMIC PERFORMANCE REPORT
Page | 31
December 2015
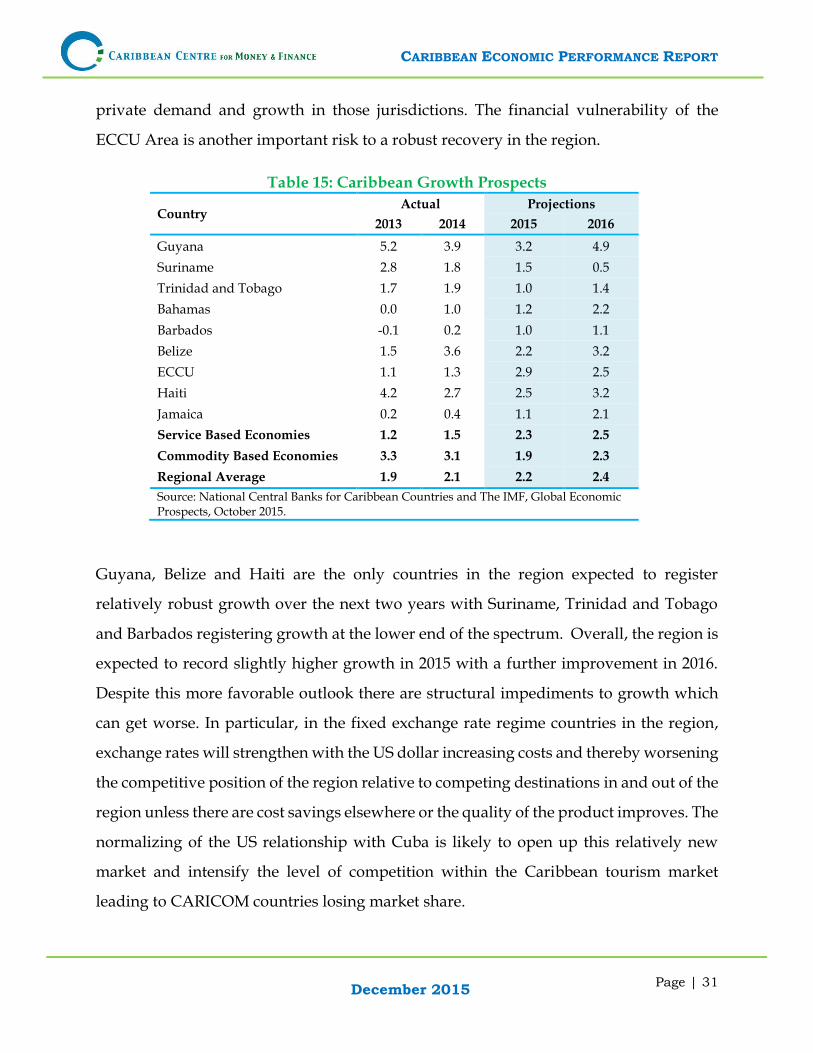
private demand and growth in those jurisdictions. The financial vulnerability of the
ECCU Area is another important risk to a robust recovery in the region.
Table 15: Caribbean Growth Prospects
Country Actual Projections
2013 2014 2015 2016
Guyana 5.2 3.9 3.2 4.9
Suriname 2.8 1.8 1.5 0.5
Trinidad and Tobago 1.7 1.9 1.0 1.4
Bahamas 0.0 1.0 1.2 2.2
Barbados -0.1 0.2 1.0 1.1
Belize 1.5 3.6 2.2 3.2
ECCU 1.1 1.3 2.9 2.5
Haiti 4.2 2.7 2.5 3.2
Jamaica 0.2 0.4 1.1 2.1
Service Based Economies 1.2 1.5 2.3 2.5
Commodity Based Economies 3.3 3.1 1.9 2.3
Regional Average 1.9 2.1 2.2 2.4
Source: National Central Banks for Caribbean Countries and The IMF, Global Economic Prospects, October 2015.
Guyana, Belize and Haiti are the only countries in the region expected to register
relatively robust growth over the next two years with Suriname, Trinidad and Tobago
and Barbados registering growth at the lower end of the spectrum. Overall, the region is
expected to record slightly higher growth in 2015 with a further improvement in 2016.
Despite this more favorable outlook there are structural impediments to growth which
can get worse. In particular, in the fixed exchange rate regime countries in the region,
exchange rates will strengthen with the US dollar increasing costs and thereby worsening
the competitive position of the region relative to competing destinations in and out of the
region unless there are cost savings elsewhere or the quality of the product improves. The
normalizing of the US relationship with Cuba is likely to open up this relatively new
market and intensify the level of competition within the Caribbean tourism market
leading to CARICOM countries losing market share.
CARIBBEAN ECONOMIC PERFORMANCE REPORT
Page | 32
December 2015
In this context, the main objective for the region is to increase economic growth while
steadily reducing macroeconomic and financial vulnerabilities. There are still significant
problems, however, in terms of fiscal and debt sustainability. An important area for
action is, therefore, to strengthen the fiscal accounts which is key to rebalancing the
external accounts. Service-based economies should use lower commodity prices to
accelerate the fiscal consolidation process with a view to improving debt sustainability.
Moreover, although commodity producers may have lower debt burdens, lower
commodity prices requires a disciplined policy framework to shore up revenues and
prevent similar sustainability issues from developing. The fiscal consolidation that this
implies in some cases only requires increasing the efficiency of government expenditure
programmes to weed out wastages without compromising the level of services provided
to citizens and businesses. Higher levels of non-performing loans in service-based
economies is also a major drag on growth which implies the need for stronger
macroprudential frameworks. These are, however, necessary but not sufficient
conditions for the resumption of strong sustainable growth. It also requires an
improvement in competitiveness which implies a range of actions in connected areas
including the improvement of the business environment, increasing labour productivity
and improving the quality of public infrastructure. The region also needs to strengthen
the legal and regulatory frameworks for financial risk assessment and mitigation to deal
with any financial vulnerabilities which can threaten the resumption of sustainable
growth in the Caribbean.
CARIBBEAN ECONOMIC PERFORMANCE REPORT
Page | 33
December 2015
CARIBBEAN ECONOMIC PERFORMANCE REPORT
Page | 34
December 2015
CARIBBEAN CENTRE FOR MONEY AND FINANCE
The University of the West Indies
St. Augustine, Trinidad and Tobago
Phone: (868) 645-1174, Fax: (868) 645-6017
E-Mail: [email protected]
Website: www.ccmfuwi.org