Embed Size (px)
Citation preview

CARE WE-RISE Final Evaluation:
Global Report
April
April
Prepared by: Suzanne Nelson, Phil Sutter, Laurie Starr, and Jeanne Downen
1 | P a g e WE-RISE Global Report – DRAFT
April 18, 2016
Table of Contents List of Tables ........................................................................................................................................................ 3 Acronyms ............................................................................................................................................................. 4 Acknowledgements ............................................................................................................................................. 5 Executive Summary ............................................................................................................................................. 6 1 INTRODUCTION AND BACKGROUND ....................................................................................................... 10
1.1 WE-RISE Goals and Objectives ......................................................................................................... 10 1.2 Outline of the Report ........................................................................................................................ 12
2 METHODOLOGY ........................................................................................................................................ 13 2.1 Limitations ......................................................................................................................................... 13
3 RESULTS AND FINDINGS ........................................................................................................................... 14 3.1 Household Characteristics ................................................................................................................ 15 3.2 Impact: Food Security ....................................................................................................................... 16
3.2.1 Dietary Diversity and Intra-Household Access ....................................................................... 16 3.3 Impact: Economic Poverty Reduction ............................................................................................. 17
3.3.1 Income Diversity ....................................................................................................................... 17 3.3.2 Loans from VSLAs ..................................................................................................................... 19
3.4 Impact: Livelihoods Resilience ......................................................................................................... 19 3.4.1 Consumption Coping Strategies .............................................................................................. 19 3.4.2 Household Savings.................................................................................................................... 21 3.4.3 Household Assets ..................................................................................................................... 22
3.5 Impact: Women’s Empowerment.................................................................................................... 23 3.6 Perceptions of Impact by Project Participants................................................................................ 29 3.7 Outcome 1: Increased Productivity, Resources, and Resilience.................................................... 29
3.7.1 Women’s Access to and Control of Loans. ............................................................................. 30 3.7.2 Agricultural Income .................................................................................................................. 32 3.7.3 Agricultural Production and Improved Practices ................................................................... 32 3.7.4 Access to Agricultural Inputs and Markets ............................................................................. 33 3.7.5 Coping with and Adapting to Shocks ...................................................................................... 35
3.8 Outcome 2: Enabling Institutional Environment ............................................................................ 37 3.8.1 Women’s Access to Agricultural Services ............................................................................... 38 3.8.2 Women’s Participation in Formal and Informal Groups ........................................................ 39 3.8.3 Women’s Self-confidence ........................................................................................................ 41
3.9 Outcome 3: Gender Equitable Environment .................................................................................. 41 3.9.1 Women’s Control of Income, Expenditures, and Assets ....................................................... 42 3.9.2 Women’s Control of Health Care and Reproductive Decisions............................................. 43 3.9.3 Gender Equity in Family Life .................................................................................................... 44 3.9.4 Women’s Mobility .................................................................................................................... 45
4 PROJECT MANAGEMENT .......................................................................................................................... 46 4.1 Staffing ............................................................................................................................................... 46
2 | P a g e WE-RISE Global Report – DRAFT
April 18, 2016
4.2 Partnerships ...................................................................................................................................... 48 4.3 M&E ................................................................................................................................................... 51 4.4 Exit Strategy ...................................................................................................................................... 52
5 CONCLUSIONS ........................................................................................................................................... 53 Annex 1 WE-RISE Global M&E Plan .................................................................................................................. 57 Annex 2 WE-RISE Global Indicator Framework ............................................................................................... 69 Annex 3 Baseline and Endline Indicator Values .............................................................................................. 71 Annex 4 Computation of Secondary Variables ................................................................................................ 76 Annex 5 Women’s Empowerment ................................................................................................................... 79

3 | P a g e WE-RISE Global Report – DRAFT
April 18, 2016
List of Tables Table 1. WE-RISE Baseline and Endline results for Impact Indicators. ............................................................ 7 Table 2: Alignment of AACES and WE-RISE Frameworks ................................................................................ 10 Table 3. Household demographics. .................................................................................................................. 15 Table 4. Food and nutrition security. ............................................................................................................... 16 Table 5. Income diversity. ................................................................................................................................. 18 Table 6. Loans from VSLAs. ............................................................................................................................... 19 Table 7. Frequency of food or income shortages. .......................................................................................... 20 Table 8. Coping strategies for dealing with food shortages. .......................................................................... 21 Table 9. Household savings (formal or informal institutions). ....................................................................... 21 Table 10. Where household savings are held.................................................................................................. 22 Table 11. Mean Asset Index. ............................................................................................................................. 23 Table 12. Women’s empowerment index (WEI). ............................................................................................ 24 Table 13. Domains of empowerment. ............................................................................................................. 25 Table 14. Gender parity. ................................................................................................................................... 27 Table 15. Participant perceptions of HH status after project participation. ................................................. 29 Table 16. Women’s access to and control of loans. ........................................................................................ 30 Table 17. Source of loans for respondents who took out a loan. .................................................................. 31 Table 18. Women earning income from agricultural production or other economic activities promoted by WE-RISE. ........................................................................................................................................................ 32 Table 19. Improved agricultural, harvest, storage, and livestock practices. ................................................. 33 Table 20. Women’s access to productive inputs and markets. ...................................................................... 34 Table 21. Household shocks. ............................................................................................................................ 36 Table 22. Household adoption of non-consumption negative coping strategies. ........................................ 37 Table 23. Household adaptation to shocks. .................................................................................................... 37 Table 24. Women’s access to agricultural financial and extension services. ................................................ 38 Table 25. Women’s participation and leadership in groups. ......................................................................... 40 Table 26. Expressing opinions in community affairs. ...................................................................................... 41 Table 27. Women’s decision-making and control over household income, expenditures, and assets. ..... 42 Table 28. Women’s decision-making and control over health care and reproductive health. ................... 43 Table 29. Perceptions of gender and gender-based violence. ....................................................................... 44 Table 30. Women’s mobility. ............................................................................................................................ 45

4 | P a g e WE-RISE Global Report – DRAFT
April 18, 2016
Acronyms AACES Australia Africa Community Engagement Scheme ACE African Commodity Exchange APAC Australian Partnership with African Communities BL Baseline CARE Cooperative for Assistance and Relief Everywhere CFIRW Chronically food insecure rural women CSI Coping strategy index DA Development Agent EEA Ethiopian Economic Association EEPRI Ethiopian Economic Policy Research Institute EL Endline ETB Ethiopian birr FANTA Food and Nutrition Technical Assistance FG Focus group FGD Focus group discussions FGM Female genital mutilation FSPM Food Security Programme Manager FTC Farming Training Centre FTF Feed the Future GBV Gender-based violence GOE Government of Ethiopia GPI Gender Parity Index GRAD Graduation with Resilience to Achieve Sustainable Development GVH Group village head HDDS Household dietary diversity score HHH Head of household IFPRI International Food Policy Research Institute IGA Income-generating activities KII Key informant interview MAICC Mponela Aids Information and Counselling Centre MK Malawi Kwacha MFI Microfinance institution OIM Opportunity International Malawi PPS Probability proportionate to size RUSACCO Rural Savings and Credit Cooperative SAA Social Action and Analysis SACCO Savings and Credit Cooperative SII Strategic Impact Inquiry SMFI Sidama Microfinance Institution TA Traditional authority Tsh Tanzania shilling VSLA Village savings and loan association WDDS Women’s Dietary Diversity Score WEI Women’s empowerment index WE-RISE Women’s Empowerment: Improving Resilience, Income and Food Security
5 | P a g e WE-RISE Global Report – DRAFT
April 18, 2016
Acknowledgements The evaluation team would like to acknowledge the valuable assistance received from colleagues at CARE Ethiopia, CARE Malawi, CARE Tanzania, and CARE Australia, who gave freely of their time to discuss in detail their perspectives on project performance, confidentially share concerns, accompany the team during training and into the field, and share opinions and ideas about WE-RISE programme progress, effectiveness, and impact. The TANGO Ethiopia team would especially like to acknowledge the fundamental support of the CARE Ethiopia team, particularly Worku Chibssa of the CARE Addis Ababa office, who extended the famous Ethiopian hospitality to the team and assisted us with our many requests, including ensuring very smooth logistics arrangements. The evaluation team is also thankful to the staff at SOS Sahel led by Naomi Berhanu who handled the necessary and extensive logistical arrangement for our team to go into the kebeles and conduct the survey in more than five hundred households, with several focus groups in nine different kebeles, and focus groups and key informant interviews in the woredas cities, as well as arranging interview times and location in Hawassa. The TANGO Tanzania team would like to acknowledge the efforts of the entire CARE Mtwara team, especially Maureen Kwilasa, the Program Director, and Christina John, Business Advisor, as well as Edson Nyingi from the CARE Dar es Salaam office, who co-facilitated the training workshop. The comprehensive planning, organization and teamwork of CARE Mtwara prior to and during the survey ensured that the survey was carried out in an efficient manner.
The TANGO Malawi team would like to acknowledge colleagues at CARE Malawi, particularly the fundamental support of Constance Msungu the CARE WE-RISE Program Manager, George Kaunda, MAICC WE-RISE Program Manager, and Salome Mhango, Pathways Program Manager, who were tireless in ensuring that all problems and potential issues were addressed and for both project evaluations. The TANGO team would like to specifically acknowledge M&E advisor, Lilian Mpona (Pathways Project) who supervised fieldwork. Her unfaltering support and tenacious efforts to ensure the assessment progressed are appreciated. Thank you to Mark Black, M&E Technical Advisor for WE-RISE, who managed logistics for the survey, and all the staff of CARE and MAICC (Isaac Kadammanja, Geoffrey Kulupajiri, Richard Matope, Simeon Phiri, and Rose Sikawa) who took time out of their busy days to help with logistics, scheduling, hospitality and to share their experiences about working on this project. The study team also thanks Lemekeza Mokiwa, Program Director for CARE Malawi`s Food and Nutrition Security and Michael Rewald, the Country Director. Finally, we wish to acknowledge the generosity and hospitality of the many communities and households that took the time to explain their lives to us and patiently sat by as we asked question after question. It is our sincere hope that the women living in rural Ethiopia, Tanzania, and Malawi will benefit from this study and experience true empowerment, resilience, and truly sustainable livelihoods.
The TANGO team – Phil Sutter, Jeanne Downen, and Laurie Starr

6 | P a g e WE-RISE Global Report – DRAFT
April 18, 2016
Executive Summary CARE has implemented their programme, Women’s Empowerment: Improving Resilience, Income and Food Security (WE-RISE), with the goal of improving household food security and resilience by empowering women, particularly through increased agricultural productivity. Funded by the Australia Africa Community Engagement Scheme (AACES) and implemented in Tanzania, Ethiopia, and Malawi, WE-RISE was designed to improve the quality of life for chronically food insecure rural women (CFIRW). The program has sought to increase agricultural productivity through income generating activities, support environments promoting women’s rights and gender-sensitive agricultural programming, and increase institutional capacity for improved gender-equitable programming at the global level.
WE-RISE in Ethiopia targeted 15,441 households in three districts – woredas – in the Sidama zone of Southern Nations, Nationalities and People’s Region (SNNPR) just south of the regional city of Hawassa; the project had actually counted approximately 10,950 participating households by December 2015. The implementing partner for CARE in Sidama was SOS Sahel Ethiopia. In Malawi, CARE has partnered with the Mponela Aids Information and Counseling Centre (MAICC) to implement WE-RISE in the districts of Dowa and rural Lilongwe, targeting 15,000 households. In Tanzania, WE-RISE targeted 9,846 households in the Mtwara and Lindi districts of southeast Tanzania.
CARE has contracted with TANGO International to design and support the implementation of a global evaluation framework for WE-RISE. TANGO led the baseline survey evaluation and the midterm reviews in all of the WE-RISE programme countries.
Methodology The baseline and endline evaluation used a mixed-methods approach, combining a statistically representative quantitative survey with in-depth qualitative research to help to understand the project’s achievement against its indicators and some of the underlying social, economic and behavioural changes and challenges that influenced the project. TANGO International led the baseline survey, midterm reviews and final evaluation of the WE-RISE programme.
The WE-RISE baseline and endline quantitative surveys were “beneficiary-based” in that the sample was randomly drawn from a sample frame composed of all households with a female member in a collective with which WE-RISE is working. Designed as a longitudinal study, data were collected from the same households for both surveys. TANGO and CARE calculated a sample size that has provided statistically representative results for household and individual level indicators at the project level. Due to attrition and the inclusion in the sample of households that registered for the project but did not participate, the endline sample was significantly reduced in each of the three countries. The Tanzania endline achieved sample size was 609 against a target of 809, with an attrition and non-response rate of 32%; the Ethiopian validation process severely restricted the sample size, which dropped from 890 households at the baseline to 578 households to be interviewed for the endline survey, a 40% reduction; the Malawi sample was reduced from 751 at baseline to 618 at endline, an attrition and non-response rate of 22%.
The endline evaluation teams in the three countries relied on triangulation of diverse quantitative and

7 | P a g e WE-RISE Global Report – DRAFT
April 18, 2016
qualitative methods. The quantitative enumeration teams, consisting of 20 to 25 enumerators and five field supervisors, administered a comprehensive questionnaire, contextualized to each of the three countries, using Nexus 7 tablets to interview female and male household heads and VSLA members. The questionnaires were programmed into the tablets in both English and Chichewa in Malawi, Swahili in Tanzania, and Amarigna in Ethiopia. TANGO provided comprehensive daily feedback to CARE and the survey supervisors on data quality. TANGO used SPSS v20.0 software to collate and analyse the data. Statistical differences are determined with t-tests or non-parametric tests. Probability levels are reported for statistically significant differences only.
The qualitative teams, consisting of team leader and four to eight researchers, employed structured in-depth interviews, focus group discussions, key informant interviews, and a program activity effectiveness ranking scorecard exercise, to gauge programme performance, programme quality, and programme impact from the perspective of WE RISE project participants, field staff and management, partners, and other stakeholders. The villages were purposively selected, maximizing diversity of relevant criteria.
Analysis of Endline Findings Overall, the goal of the WE-RISE programme is to improve food security, income, and resilience of CFIRW through their social and economic empowerment. Table 1 reports results for WE-RISE impact indicators – against which WE-RISE’s Theory of Change, goals and objectives are measured – and shows changes over the four years between the baseline (BL) and endline (EL) for the three WE-RISE country programmes.
Table 1. WE-RISE Baseline and Endline results for Impact Indicators. WE-RISE Goal: To improve food security, income and resilience for chronically food insecure rural women through their social and economic empowerment.
Impact Indicators Malawi Tanzania Ethiopia BL EL BL EL BL EL
Food & Nutrition Security IM 1.1: Mean household dietary diversity scores 4.9 5.2* 6.6 5.7* 4.1 4.6* IM 1.2: Mean women’s intra-household food access
4.7 5.0* 6.4 5.6* 3.4 4.5*
Economic Poverty Reduction IM 1.5: % households with non-agriculture income source 46.1 66.0* 35.2 39.6 22.1 33.8*
IM 1.6: % households with 3 or more income sources 65.1 86.6* 30.8 71.9* 24.5 75.7*
IM 1.11: % females accessing loans through VSLAs 83.9 87.2 92.8 85.2 9.9 71.5* Livelihoods Resilience
IM 1.3: Coping strategies index 2.8 6.4* 8.3 22.9* 26.7 8.6* IM 1.8: % households with savings 84.3 83.1 47.4 37.1* 40.6 82.9* IM 1.9: Mean asset index (including ag land) 1697 2222* 91.8 99.3 98.9 144.6*
Women's Empowerment IM 1.10: Women's 5 domains of empowerment score 0.58 0.67* 0.52 0.71* 0.55 0.59*
*Statistically different at least at the 10% level.

8 | P a g e WE-RISE Global Report – DRAFT
April 18, 2016
Impact on Food & Nutrition Security: WE-RISE households in Ethiopia and Malawi experienced an improvement in their food security over the course of the programme; they now consume more diverse foods than at baseline (IM1.1). Women also now consume more diverse foods (IM1.2) in both countries. In Tanzania, both households and women, in particular, lost ground in terms of food security; they now consume a slightly less diverse palate of foods than at baseline. On average WE-RISE households in all three countries consume foods from approximately five different types of food.
Impact on Economic Poverty Reduction: CARE WE-RISE promotes activities to increase agricultural income as well as non-agricultural income via small business activities. WE-RISE programming resulted in significant increases in availability of household income both through small business income (IM1.5) as well as through increased number of income sources (e.g., farm and off-farm income) (IM1.6). Much of this newfound income diversification is directly attributable to participation in WE-RISE activities.
As the key entry point for WE-RISE activities, VSLAs provide WE-RISE participants with an essential means for accessing credit, particularly in Ethiopia. The proportion of Ethiopian households relying on VSLAs to access credit increased dramatically between baseline and endline for women and men alike, even if the loan amounts were quite small. In Malawi and Tanzania, the vast majority of participating households were already accessing loans through VSLAs at the baseline.
Impact on Livelihoods Resilience: The Coping Strategies Index (CSI) is a powerful indicator of resilience (IM1.3), with higher index scores reflecting higher frequency of use and greater severity in type of consumption coping strategies used by a household to deal with food or income shortages. Only in Ethiopia did WE-RISE households show improvement in their ability to deal with shocks or stresses and resist engaging in harmful coping strategies. The CSI increased in both Malawi and Tanzania, where prolonged dry spells in WE-RISE operational areas caused maize and other cereal production to severely decline. Lower production, coupled with increased prices for some cereals, had a severe impact on household access to food or income in the three months prior to the endline survey.
Access to savings also reflects a level of resilience at the household level, and showed mixed results across the three programmes (IM1.8). Households reporting savings in Malawi is high (>80%) even at baseline and was not significantly different at endline. The households that were able to save actually declined slightly in Tanzania between the two surveys. However, twice as many households in Ethiopia report saving at endline than did at the baseline, a significant improvement. Participation in VSLA activities has proven to be instrumental in accounting for this very substantial change in savings behaviour. Although the amount saved in a VSLA is often small, participation in a savings group has introduced a savings culture, which is now widely adopted by project participants. VSLA loans have allowed women to invest in small livestock and other income-generating activities, as well as pay educational expenses, purchase food, make home improvements, and cope with emergencies. VSLA group participation exposed women and men to information about earning income as well as gender equality, and opened opportunities to learn new skills, such as saving and spending wisely, and social skills such as speaking up in public.

9 | P a g e WE-RISE Global Report – DRAFT
April 18, 2016
Access to and use of assets provide households with a cushion to adjust to shortfalls in incomes, or sudden increases in necessary expenditures. Thus, households with a higher asset index (IM1.9) indicates that households have been able to accumulate assets over time and are less vulnerable than households with lower asset index values. Improvements in the accumulation of assets occurred for WE-RISE participants in both Malawi and Ethiopia, though there was no change in asset ownership in Tanzania.
Impact on Women’s Empowerment: The Women’s Empowerment Index (WEI), comprising the Five Domains of Empowerment (5DE) and Gender Parity Index (GPI), was used to assess women’s empowerment in the three countries. The 5DE reflects the percentage of women who are considered empowered, based on their empowerment score. A woman who achieves an empowerment score of .80 or greater is considered to be empowered. The empowerment scores for women participants in all three WE-RISE programmes improved between baseline and endline (IM1.10).
In Ethiopia, women who participate in the WE-RISE programme have experienced a slight increase in their empowerment, but frankly continue to engender relatively low empowerment (5DE=.59), despite the introduction of a very powerful tool, the Social Analysis and Action (SAA) approach. In all countries, the percentage of women achieving empowerment also increased, though less than 20% of women participants in Malawi and Ethiopia achieved empowerment at the endline. In Tanzania, approximately 40% of women in the WE-RISE programme achieved empowerment at the endline, double that at baseline.
10 | P a g e WE-RISE Global Report – DRAFT
April 18, 2016
1 INTRODUCTION AND BACKGROUND Funded by the Australia Africa Community Engagement Scheme (AACES) and implemented by CARE Australia, the Women’s Empowerment: Improving Resilience, Income and Food Security (WE-RISE) program seeks to increase poor women farmers’ productivity and empowerment in more equitable agriculture systems at scale, and improve the quality of life for chronically food insecure rural women (CFIRW) in Tanzania, Malawi, and Ethiopia. The five-year program targets 15,000 households in two districts of Malawi, 9,846 households in two districts of Tanzania, and 15,441 households in three districts of Ethiopia. Aligned with other CARE initiatives, such as CARE USA’s Pathways programme, WE-RISE is designed to overcome the constraints to women’s productive and equitable engagement in agriculture. Using a strong gender focus, the WE-RISE programme seeks to improve household food security and resilience by empowering women to more fully engage in and benefit from agricultural activities.
1.1 WE-RISE Goals and Objectives The programme theorizes that marginalized CFIRW will be more productive and their families more food secure when:
Women have increased capacity (skills, knowledge, resources), capabilities (confidence, bargaining power, collective voice), and support
Local governance and institutions have in place and are implementing gender-sensitive policies and programming that are responsive to the rights and needs of poor women farmers
Agricultural service, value chain, and market environments of relevance to women are more competitive, gender-inclusive, and environmentally sustainable
Each of the WE-RISE Change Outcomes is designed to contribute to one or more realms of agency, structure, or relations (Table 2).
TANGO previously provided support to CARE Australia and the AACES/WE-RISE Programme in Africa through a monitoring and evaluation (M&E) workshop in India, May 2012 and the development of a global M&E plan for all three WE-RISE countries. The global M&E plan serves as the basic framework for the endline evaluation (Annex 1).
Table 2: Alignment of AACES and WE-RISE Frameworks
AACES Domains
of Change
WE-RISE
Goal: To contribute measurable outcomes for people in three priority sectors: water and sanitation, women and children’s health, and food security
Agency
Structure
Relations
Goal: To improve food security, income and resilience for chronically food insecure rural women through their social and economic empowerment
Agency Change Outcome 1: CFIRW have increased household productive assets and resource and
11 | P a g e WE-RISE Global Report – DRAFT
April 18, 2016
Objective 1: Marginalized people have sustainable access to the services they require
control over these, and are more resilient to climate shocks
Structure Change Outcome 2: Formal and informal institutions are more responsive to women’s priorities and accountable to upholding their rights
Relations Change Outcome 3: Cultural and social norms and attitudes better support the individual and collective aspirations and improved opportunities for CFIRW
Objective 2: DFAT policy and programmes are strengthened particularly in their ability to target and serve the needs of marginalized people
Structure Change Outcome 4: CARE’s learning, knowledge and documentation on women’s empowerment, transforming gender norms, and climate change resilience is strengthened such that CARE can better inform and influence DFAT and other key stakeholders
Objective 3: Increased opportunity for the Australian public to be informed about development issues in Africa
Structure Change Outcome 5: Outcomes and lessons learnt from WE-RISE are communicated effectively to the Australian public
Country Programs
CARE Tanzania implements the WE-RISE project in the districts of Lindi and Mtwara in southern Tanzania. The districts lie within the same agro-ecological zone and have similar traditional and cultural values and challenges. These areas were prioritized because they represent areas of entrenched gender discrimination, rural poverty, chronic food insecurity and unsustainable farming practices. The area is rural and has been relatively isolated due to poor infrastructure, but following the discovery of oil and gas several years ago is undergoing rapid change. The area now has an improved road to Dar es Salaam to the north and Mozambique to the south, connecting it to urban centres and other coastal areas. The project targets 9,846 households of married women and women heads of households; at endline it had reached about 5,000 women. The project management stated that the higher target may not have been realistic in terms of the project budget.
In partnership with the Mponela Aids Information and Counselling Centre (MAICC), CARE Malawi implements the WE-RISE project in the districts of Dowa (Chiwere traditional authority) and rural Lilongwe (Kalumbu traditional authority), which lie within the same agro-ecological zone and have similar traditional and cultural values and challenges. These areas were prioritized because they represent areas of entrenched gender discrimination, rural poverty, chronic food insecurity and unsustainable farming practices. Of the 15,000 chronically food insecure households targeted by the project, approximately 3,000 are female-headed households. At least 40 percent of the targeted beneficiaries participated in a six-year (2005-2011) Australian Partnership with African Communities

12 | P a g e WE-RISE Global Report – DRAFT
April 18, 2016
program that preceded WE-RISE. Expansion into new areas emerged from discussions of priority areas with the Lilongwe and Dowa District Councils.1
Since 2012, CARE’s WE-RISE programme in Ethiopia has been implemented in the Sidama zone in three woredas: Loka Abaya, Dale and Shebedino. Sidama is one of 13 zones within the Southern Nations Nationalities and Peoples’ Region of Ethiopia (SNNPR) and is divided into four major livelihood zones: Bilate Basin Agro-Pastoral, Sidama Maize Belt, Awassa Chat and Enset, and Sidama Coffee Livelihood Zones. The Sidama Maize Belt is the only zone not categorized as food secure.2 CARE and its partner, SOS Sahel, selected the three woredas for WE-RISE programme activities because the Sidama maize-growing zone was classified as food insecure, with a large number of vulnerable households identified through the government’s safety-net programme. CARE assessments also identified this area as characterized by highly patriarchal social relations between the sexes within households, communities, and social, economic and political institutions.
1.2 Outline of the Report The main purpose of the baseline and endline studies is to provide quantitative and qualitative data on food and livelihood security, agricultural productivity, and gender equality in each of the WE-RISE country programme’s targeted groups. The studies provide information necessary to characterize the status of participants at the project’s start-up and again at endline in order to assess the effect of project interventions. The purpose of both surveys is to estimate and analyse the status of key impact and outcome indicators described in the CARE WE-RISE Indicator Framework (Annex 2). The baseline survey was explicitly designed to enable an evaluation of programme performance through implementation of a directly comparable endline survey. Detailed and complete baseline and endline results are available in the country-specific reports.
This report synthesizes results from the WE-RISE endline reports for Tanzania, Malawi, and Ethiopia. First, it describes the methodology used in the studies, including data collection and data analysis, followed by a presentation of results and qualitative findings for food security (Section 3.2), income (Section 3.3), resilience (Section 3.4), and women’s empowerment (Section 3.5) impact indicators for CARE’s targeted program participants and their households. Section 3.6 presents brief findings on perceptions of programme participants on project impact. Sections 3.7 through 3.9 present results and qualitative findings for CARE WE-RISE outcome indicators. Section 4 touches on Project Management, reviewing the successes and challenges related to staffing, resources, and monitoring and evaluation. Section 5 presents the conclusions of the evaluation team about the extent to which the WE-RISE goal and domains of change have been realized.
1 Design document. Women’s Empowerment: Improving Resilience, Income and Food Security (WE-RISE) Final revised narrative 19, May, 2011. 2 Information from Final Report, Review of Gender, Social Norms and values; and livelihood Perspective of Chronically Food Insecure Households (HHs) in Sidama Zone, SNNPR; Submitted to CARE by UMA Consult PLC; February 2011.

13 | P a g e WE-RISE Global Report – DRAFT
April 18, 2016
2 METHODOLOGY This section gives a brief overview of the methodology. Full details on the evaluation methodology are reported in the full endline report for each WE-RISE country programme.
The WE-RISE baseline and endline surveys use a non-experimental design for pre-post comparison of results (i.e., the same households are compared at baseline and endline). Both the baseline and endline surveys are “beneficiary-based” in that the sample is drawn randomly from a sample frame composed of all households with a female member in a collective (e.g., VSLA) with which WE-RISE is working. The sample size is determined to provide statistically representative results for household and individual level indicators at the project level. Designed as a longitudinal study, data are to be collected from the same households for both the endline and the baseline surveys. Due to a reduction in project implementation areas and overall attrition in each country, the endline samples for each are significantly reduced from their respective baseline sample sizes. Thus, point values for the baseline are recalculated for each country programme to better reflect the status of their respective participant populations. Details are provided in the full endline report for each country.
The endline evaluation teams relied on triangulation of diverse quantitative and qualitative methods. The quantitative enumeration team, consisting of 20-25 enumerators and 4-5 supervisors, depending on the country, used a comprehensive questionnaire to interview female and male household heads and VSLA members in 580 households in Ethiopia, 609 households in Tanzania, and 662 households in Malawi. The qualitative team, consisting of a team leader and 4-6 researchers, employed structured in-depth interviews, focus group discussions, key informant interviews, and a program activity effectiveness ranking scorecard exercise, to gauge programme performance, programme quality, and programme impact from the perspective of WE RISE project participants, field staff and management, partners, and other stakeholders.
2.1 Limitations The most substantial limitation to the Ethiopia study, significantly affecting the analysis and the ability to confidently assert the validity, reliability, and representativeness of the sampled data, is the reduced endline sample size, which impacts the level of precision that key indicators can be measured. A significant proportion of baseline respondents were never beneficiaries of the programme, despite that prerequisite of inclusion in the baseline sample as stated in the baseline research protocol. It was therefore necessary for TANGO to recalculate the baseline indicators for only households that actually participated in the WE-RISE programme. A second limitation potentially affecting data quality concerned the enumeration group hired to conduct the quantitative household interviews, which paid their enumerators by number of questionnaires completed rather than at a daily rate, which is common practice. Such a poor practice encourages enumerators to explore ways to cut corners during the household interviews in order to rush through the interview, complete the questionnaire and move onto another household.
In Malawi, WE-RISE personnel were concerned that the final evaluation team would not be able to locate all sampled members within the budgeted time frame. Therefore, they sent frontrunners (typically community-based extension agents or CARE field officers) ahead of the team to alert sampled

14 | P a g e WE-RISE Global Report – DRAFT
April 18, 2016
respondents that the team was coming and to “schedule” appointments. It is possible that this tactic, even with good intentions, introduced a positive bias to the results. The extent to which CARE’s contact with participants directly before the survey may have affected the results is unknown.
The endline survey was programmed into the tablets in Chichewa. The baseline survey was programmed in English and translated by enumerators into Chichewa as they administered the questionnaire. While this greatly improves the accuracy and reliability of the endline data, as all enumerators asked questions exactly the same way, it may also mean that baseline and endline questions were asked slightly differently. If so, survey participants may have elicited different types of responses due to differences in translation. This limitation may or may not have affected the results.
Neither baseline nor endline data provide insight on the depth of food insecurity that populations face during lean season. The surveys were conducted at the end of the harvest season for the majority of the main seasonal crops in Malawi, a time when food shortages are not as prevalent as other times of the year. The baseline survey was conducted in late July - early August 2012. Although the endline data were collected one month later than baseline (late August), the 2015 harvests were delayed due to the climate-related late start of planting.3 Thus, the timing of the endline was similar to that of the baseline relative to harvest – and household food availability – suggesting the data are sufficiently comparable.
In Tanzania, factors affecting the survey included i) the accuracy of sampling frames, which contained errors that resulted in overestimation of the number of female collective members and difficulties in locating the selected respondent; ii) the length of survey, which required several hours to carry out, potentially increasing errors; iii) strong organization and logistics by CARE Mtwara; and iv) timing of the survey, which was conducted at approximately the same time and season as the baseline, though the baseline was done during Ramadan, which influences the interpretation of baseline results.
3 RESULTS AND FINDINGS WE RISE has relied on building and strengthening collectives, beginning with Village Savings and Loan Associations (VSLAs) to contribute to increasing women’s knowledge and capacity as a pathway to increasing women’s agricultural productivity and empowerment. In each of the three WE-RISE countries, FGD participating women and men expressed appreciation for the introduction and development of VSLAs as important community institutions impacting their lives and livelihoods by introducing a culture of savings. VSLA members expressed increased independence. Some reported taking loans to invest in IGAs or toward agriculture inputs or to cope with emergencies and shocks. One of the most frequently cited advantages to VSLA membership was the declining reliance on informal moneylenders, who frequently charge exorbitantly usurious interest rates. VSLA activities have slowly changed some social and economic relations between women and men, enhancing participating women’s social capital within communities and households.
Annex 3 presents all baseline and endline results for all impact and outcome indicators.
3 FEWS NET. Malawi Food Security Outlook. April to September 2015. http://www.fews.net/sites/default/files/documents/reports/Malawi_FSO_2015_04.pdf.

15 | P a g e WE-RISE Global Report – DRAFT
April 18, 2016
3.1 Household Characteristics This section summarizes the household characteristics of the sampled VSLA members.
Table 3. Household demographics.
Indicator Malawi Tanzania Ethiopia BL EL BL EL BL EL
Household size 4.6 5.2 4.4 4.8 4.8 4.9 Number of children (under 18) 2.3 2.8 2.1 2.5 2.7 2.9
Number of females in household 2.3 2.7 2.4 2.7 1.5 2.4 Number of females involved in ag in HH 1.4 1.3 1.3 1.2 1.0 1.3
Female-headed households (%) 21.5 30.1 26.3 30.4 42.1 39.4 Age of head of household 42.4 44.0 50.0 51.5 41.8 41.5
Education of head of household (%) No education 22.4 20.2 35.5 23.8 60.1 44.1
Started Primary, but did not complete - - - - ^ 48.1 Primary* 30.1 31.3 60.1 69.6 35.9 4.9
Senior Primary (5-8) 37.0 36.8 - - - - Secondary* 4.3 6.7 3.0 4.6 2.2 1.6
Senior Secondary (3-4) 5.7 4.2 - - - - More than Secondary - - - - 0.2 0.9
Tertiary (Technical or University) 0.5 0.7 0.2 0.5 - - Adult education - - 1.3 1.5 - -
Marital status of head of household (%) Single 1.2 0.7 3.1 3.8 0.9 7.3
Married (Less than or equal to two years) 16.0 5.5 5.4 1.5 0.7 6.4 Married (More than two years) 68.9 78.2 70.4 69.1 72.8 64.4
Divorced 7.0 6.9 13.5 15.6 5.8 4.5 Widow/Widower 6.9 8.6 7.6 10.0 19.8 15.6
Households with a disabled member (%) 12.4 17.0 12.5 11.5 ^ 7.1 ^Not collected at baseline. *Junior Primary (1-4) and Junior Secondary (1-2) in Malawi.
As expected in a longitudinal study, household demographics are similar between baseline and endline surveys in all three countries, with a few possible exceptions (Table 3). In all countries, household size is between four and five, and appears to have increased slightly between baseline and endline, particularly in Malawi and Tanzania, due perhaps to an increase in children less than 18 years old. Female-headed households also appears to have increased, again in Malawi and Tanzania, possibly resulting from the death of a husband given that the number of widows also increased between baseline and endline in both countries. The situation appears somewhat different in Ethiopia, where both household size and the number of children per household remained fairly constant. Interestingly, more than six percent of the sample in Ethiopia appears to have married between baseline and endline; young marriages were virtually non-existent in the baseline sample. However, the number of household heads who were widowed or divorced appears to have declined between baseline and endline, suggesting perhaps that they remarried (i.e., were reported as married less than or equal to two years).
In Malawi and Tanzania, levels of education of the household head have risen slightly at the primary and secondary levels. In Tanzania this may be due to younger people with more access to primary education

16 | P a g e WE-RISE Global Report – DRAFT
April 18, 2016
becoming heads of households. The percentage of household heads with no education declined in all three countries.
In Ethiopia, the average number of females involved in agricultural production activities has increased by thirty percent, from 1 to 1.3 per household. This may be an indication of increased participation in agricultural activities promoted by the project.
Some of the apparent differences between baseline and endline may also be due to differences in data quality. Enumerators may have been more accurate at endline than their baseline counterparts at capturing second wives from polygamous marriages (e.g., in Tanzania and Malawi) as a female-headed household. Additionally, men’s attitudes about women’s participation in collectives (e.g., VSLAs) may have changed between baseline and endline. At baseline, qualitative findings suggested that it could have been easier for female-headed household members to participate in VSLAs. Women reported that males were at times distrustful of women’s participation, feeling it was just a way for women to waste time. Although some evidence exists suggesting this may have been less prevalent at endline (e.g., Malawi), women residing in male-headed households often still face barriers to participation that are not experienced by women residing in female-headed households.
3.2 Impact: Food Security The primary indicators used in this study to measure levels of food security are: 1) the mean household dietary diversity score (HDDS), which is used as a proxy for food access, and 2) the mean women’s intra-household food access score. Table 4 illustrates that there have been improvements in these two indicators between baseline and endline in all three countries.
3.2.1 Dietary Diversity and Intra-Household Access The main food preparer (typically the sampled CARE member) is asked to report on 12 different food groups consumed by any household member over a 24-hour period (the day and night prior to the interview). The responses produce a HDDS between 0 and 12, with the higher score demonstrating access to diverse food groups. After determining whether any household member consumes each of the 12 food groups, the main food preparer is asked if all, some, or no female household members over the age of 15 ate the food item. The responses for “all women” or “some women” produce an intra-household access (IHA) score between 0 and 12, with the higher score indicating greater access to diverse food groups.
In both Malawi and Ethiopia, both female- and male-headed households are eating more diverse foods at endline than they were at baseline (approximately five food groups) (Table 4). In both cases, this falls short of the end-of-project targets (daily access to six food groups), which may have been overly ambitious. Additionally, members of female-headed households still appear to consume fewer food groups daily than members of male-headed households. The lower dietary diversity scores in Tanzania may reflect the poor rainy season experienced in the south during the main growing season in 2015.
Table 4. Food and nutrition security.
Indicator Malawi Tanzania Ethiopia BL EL BL EL BL EL

17 | P a g e WE-RISE Global Report – DRAFT
April 18, 2016
IM 1.1: Mean household dietary diversity scores All households 4.9 5.2* 6.6 5.7* 4.1 4.6*
Female HHHs 4.3 4.8* 6.6 5.7* 3.9 4.3* Male HHHs 5.0 5.4* 6.7 5.7* 4.2 4.7*
IM 1.2: Mean women’s intra-household food access All households 4.7 5.0* 6.4 5.6* 3.4 4.5*
Female HHHs 4.2 4.6 6.4 5.6* 3.3 4.2* Male HHHs 4.8 5.1* 6.4 5.5* 3.5 4.7*
*Statistically different at least at the 10% level. Food access for women, as measured by the women’s intra-household food access score, has increased between baseline and endline in Malawi and particularly in Ethiopia, though again falls short of the end of project targets for both countries. In Malawi, this change is primarily due to improved food distribution to females over the age of 15 years in male-headed households as disaggregated data detect no change in how food is distributed in female-headed households. Within a household, females over the age of 15 years consume slightly fewer food groups than other household members (5.0 versus 5.2).
In Ethiopia, women’s intra-household access to food improved by 32% between baseline and endline, a significant achievement. Women in Ethiopia now consume basically the same diet as other members of the household (4.5 compared to 4.6). This was substantiated within female FGDs, who reported they now increasingly eat their meals together with their husbands, consuming the same food items on a daily basis as well as for special meals such as at weddings, religious events, or funerals.
3.3 Impact: Economic Poverty Reduction To understand progress toward the long-term goal of “Improved Food Security, Income, and Resilience for Chronically Food Insecure Rural Women (CFIRW) through their social and economic empowerment”, WE-RISE tracked information to inform four key areas: the mean asset index (farm and non-farm), percentage of households with non-agricultural income, percentage of households with three or more different income sources, and per capita monthly household income and expenditures.
In Ethiopia, income data as well as data on expenditures, a proxy for income, was not reliable due in part to low levels of response as well as very high statistical deviation. TANGO’s analysis has therefore relied on other proxies for income, such as the asset index. Together, the other three indicators outlined above serve as proxies for income outcomes.
3.3.1 Income Diversity CARE WE-RISE promotes activities to increase agricultural income as well as non-agricultural income via small business activities. Based on results presented in Table 5, it is clear that WE-RISE programming resulted in significant increases in availability of household income for both female- and male-headed households, both through small business income as well as through increased number of income sources (e.g., farm and off-farm income). With one exception, the largest increases in households reporting income from small business activities promoted by the project – as well as from three or more sources – occurred for female-headed households. Taken together, these results suggest a certain level of success for the project, which has promoted women’s economic involvement in a variety of activities.

18 | P a g e WE-RISE Global Report – DRAFT
April 18, 2016
Table 5. Income diversity.
Indicator Malawi Tanzania Ethiopia
BL EL BL EL BL EL IM 1.5: % households with non-agricultural income promoted by WE RISEǂ
All households 46.0 66.0* 35.17 39.57 22.1 33.8* Female HHHs 40.9 63.4* 37.50 47.03* 21.0 38.3* Male HHHs 47.4 67.1* 34.32 36.32 23.0 30.8*
IM 1.6: % households with three or more income sources All households 65.2 86.6* 30.83 71.92* 24.5 75.7*
Female HHHs 61.0 87.1* 24.38 69.73* 22.0 72.4* Male HHHs 66.4 86.3* 33.18 72.88* 26.3 77.8*
*Statistically different at least at the 10% level. ǂ According to the WE-RISE M&E plan, non-agricultural income sources are limited to small business activities.
In Tanzania, an increase in households sourcing income from small businesses occurred for female-headed households only. The lack of other statistically significant results may reflect lag time between initiation of relevant activities and the time required to manifest changes. Entrepreneurship training through WE-RISE was added in Tanzania in 2014 and expanded as a central piece in 2015, thus, some of the benefits may not have been apparent yet at endline. Also, WE-RISE project management in Tanzania indicated that a fuller understanding of what women do for income in the off-season would have made training easier, and potentially more effective.
Only in Ethiopia did slightly more male- than female-headed households report income from three or more sources between the baseline and the endline. For both types of households, these results surpass the end-of-project targets (68% and 70% for female-and male-headed households). Much of this newfound income diversification – female-headed households have experienced more than a three-fold increase – is directly attributable to their participation in WE RISE activities, such as sheep or goat rearing and fattening, chick rearing, honey production or other activities. Although more female- and male-headed households source income from small business activities now than at the baseline, male-headed households remain dependent on income from agriculture production. This is not surprising as men continue to control the important Sidama cash crops of coffee and chat, as well as the sale of large livestock – cows and oxen.
Although neither income or expenditure data are presented in this summary, it is important to note that income diversity – particularly in terms of the number of income sources in which households engage – does not necessarily result in increased household income. For example, although small numbers of women in Malawi report engaging in small businesses (e.g., fritter, tomato, fish, or plastic item sales, brewing local beer, etc.), and a few participants in FGDs cited these businesses as a reason for increased household income, this is apparently not the norm. WE-RISE business training activities in Malawi were consistently ranked low by FGDs and KIIs. Communities indicated they did not have enough information to run a business that is distinct from those offered by almost everyone in the community (e.g., sales of bananas, fritters, or chitenge cloth). Many who have tried to run a small business complain of poor sales due to market saturation.

19 | P a g e WE-RISE Global Report – DRAFT
April 18, 2016
3.3.2 Loans from VSLAs VSLAs in Ethiopia – and the development of RUSACCOs that is made possible because of the VSLAs – have provided WE-RISE participants with an essential newfound means to access credit. Unlike Tanzania and Malawi, the proportion of Ethiopian households relying on VSLAs to access credit, even if relatively small loan amounts, increased dramatically between baseline and endline for women and men alike. This vastly exceeds the end-of-project target of 20%. In Malawi and Tanzania, the vast majority of participating households had already accessed loans through the VSLAs at the baseline.
Table 6. Loans from VSLAs.
Indicator Malawi Tanzania Ethiopia
BL EL BL EL BL EL IM 1.11: % females accessing loans through VSLAs
Female respondents 83.9 87.2 92.8 85.2 9.9 71.5 Male respondents 45.9 48.2 80.0 72.3 7.5 68.3 *Statistically different at least at the 10% level.
3.4 Impact: Livelihoods Resilience To understand progress toward the long-term goal of “Improved Food Security, Income, and Resilience for Chronically Food Insecure Rural Women (CFIRW) through their social and economic empowerment”, WE-RISE tracked information to inform three key areas: coping strategies related to food scarcity, household asset holdings (reflected in an asset index) and whether households are saving. Measuring the resources that individuals and households can draw upon to reduce vulnerability, provides insight on household capacity to absorb a range of different risks and adapt to various external drivers of change (e.g., ecological, economic, social, etc.).
3.4.1 Consumption Coping Strategies The Coping Strategies Index (CSI) is a tool used to measure behaviour change in households when they cannot access adequate or preferred foods. It can be used as a food security and early warning indicator, and can also be used as an indicator of longer- term changes in food security status.4 The CSI attempts to answer the following question: “What do you do when you don’t have enough food, and don’t have enough money to buy food?” Annex 4 provides more details on how the CSI is calculated.
Table 7 shows stark differences in food or income shortages between baseline and endline in each of the countries. Significantly more households in Malawi and Tanzania report food or income shortages during the three months prior to the endline survey than for the baseline survey, though the increase is more dramatic in Tanzania than in Malawi. In both Malawi and Tanzania, prolonged dry spells in the WE-RISE operational areas caused maize and other cereal production to severely decline to below-average levels.5 Lower production, coupled with increased prices for some cereals, had a severe impact on household access to food or income in the three months prior to the survey.
4 Developed by CARE and field tested by WFP and CARE, the CSI has been used for early warning and food security monitoring in African and Asian countries, in addition to several Middle Eastern countries. 5 FAO GIEWS Country Briefs, Tanzania, 8 May 2015.
20 | P a g e WE-RISE Global Report – DRAFT
April 18, 2016
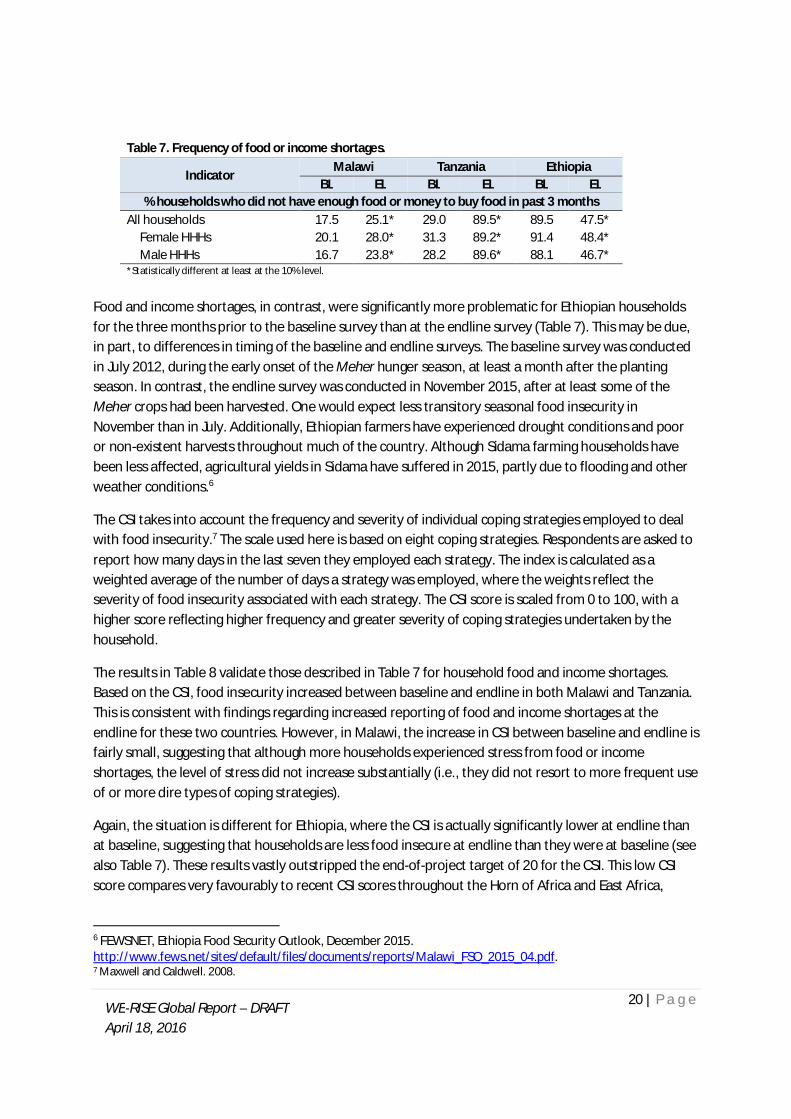
Table 7. Frequency of food or income shortages.
Indicator Malawi Tanzania Ethiopia
BL EL BL EL BL EL % households who did not have enough food or money to buy food in past 3 months
All households 17.5 25.1* 29.0 89.5* 89.5 47.5* Female HHHs 20.1 28.0* 31.3 89.2* 91.4 48.4* Male HHHs 16.7 23.8* 28.2 89.6* 88.1 46.7*
*Statistically different at least at the 10% level. Food and income shortages, in contrast, were significantly more problematic for Ethiopian households for the three months prior to the baseline survey than at the endline survey (Table 7). This may be due, in part, to differences in timing of the baseline and endline surveys. The baseline survey was conducted in July 2012, during the early onset of the Meher hunger season, at least a month after the planting season. In contrast, the endline survey was conducted in November 2015, after at least some of the Meher crops had been harvested. One would expect less transitory seasonal food insecurity in November than in July. Additionally, Ethiopian farmers have experienced drought conditions and poor or non-existent harvests throughout much of the country. Although Sidama farming households have been less affected, agricultural yields in Sidama have suffered in 2015, partly due to flooding and other weather conditions.6
The CSI takes into account the frequency and severity of individual coping strategies employed to deal with food insecurity.7 The scale used here is based on eight coping strategies. Respondents are asked to report how many days in the last seven they employed each strategy. The index is calculated as a weighted average of the number of days a strategy was employed, where the weights reflect the severity of food insecurity associated with each strategy. The CSI score is scaled from 0 to 100, with a higher score reflecting higher frequency and greater severity of coping strategies undertaken by the household.
The results in Table 8 validate those described in Table 7 for household food and income shortages. Based on the CSI, food insecurity increased between baseline and endline in both Malawi and Tanzania. This is consistent with findings regarding increased reporting of food and income shortages at the endline for these two countries. However, in Malawi, the increase in CSI between baseline and endline is fairly small, suggesting that although more households experienced stress from food or income shortages, the level of stress did not increase substantially (i.e., they did not resort to more frequent use of or more dire types of coping strategies).
Again, the situation is different for Ethiopia, where the CSI is actually significantly lower at endline than at baseline, suggesting that households are less food insecure at endline than they were at baseline (see also Table 7). These results vastly outstripped the end-of-project target of 20 for the CSI. This low CSI score compares very favourably to recent CSI scores throughout the Horn of Africa and East Africa,
6 FEWSNET, Ethiopia Food Security Outlook, December 2015. http://www.fews.net/sites/default/files/documents/reports/Malawi_FSO_2015_04.pdf. 7 Maxwell and Caldwell. 2008.

21 | P a g e WE-RISE Global Report – DRAFT
April 18, 2016
including recent surveys in Ethiopia. The CSI is a powerful indicator of resilience, in this case signalling that WE-RISE households in Ethiopia have successfully weathered shocks (discussed later in this report) to bounce back and resist engaging in harmful consumption strategies.
Table 8. Coping strategies for dealing with food shortages.
Indicator Malawi Tanzania Ethiopia
BL EL BL EL BL EL IM 1.3: Coping strategies index (mean score)
All households 2.8 6.4* 8.3 22.9* 26.7 8.6* Female HHHs 3.5 7.5* 10.2 24.5* 28.1 9.3* Male HHHs 2.7 6.0* 7.7 22.2* 25.7 8.3*
*Statistically different at least at the 10% level.
3.4.2 Household Savings Household saving patterns vary by country programme (Table 9). In Malawi, no significant changes occurred in households that report saving – either in formal or informal institutions – between baseline and endline. Although the end-of-project target of 90% was not met, the percentage of households engaged in saving was already quite high at baseline. In Tanzania, the percentage of households saving actually decreased between the baseline and endline surveys, although was not significantly different for female-headed households. In large part, this may be due to households reporting they use savings as a coping strategy for dealing with shocks and/or stresses (data presented in the Tanzania endline report). Given the increase in the number and types of shocks experienced by households, and the lack of rainfall that affected crop production in 2015, the decline in savings is not necessarily surprising.
In contrast, households with savings increased dramatically in Ethiopia; twice as many households were saving at the endline than were at the baseline. Again, this dramatically exceeds the end-of-project target for savings (64% of households). Participation in VSLA activities proved to be instrumental in accounting for this very substantial change in savings behaviour. FGD participants repeatedly stressed the importance of WE-RISE and its introduction of a savings culture, acknowledging they had not previously saved anything before WE-RISE. A similar shift in thinking was reported by FGDs and KIIs in Malawi.
At baseline, FGDs and KIIs in Malawi generally perceived that men mistrust women’s gatherings with a focus on money, especially in the first stage of VSLA initiatives, and that men tend to associate women handling cash with extramarital relationships. Four years later, this perception had radically changed, and a culture of savings seemed to be strongly developed in all WE-RISE villages visited by the qualitative team. FGD findings also suggest that the source of women’s savings contributions is often their own income, rather than their husband’s income, which was the primary way women obtained VSLA contributions at baseline.
Table 9. Household savings (formal or informal institutions).
Indicator Malawi Tanzania Ethiopia
BL EL BL EL BL EL IM 1.8: % households with savings

22 | P a g e WE-RISE Global Report – DRAFT
April 18, 2016
All households 84.3 83.1 47.4 37.1* 40.6 82.6* Female HHHs 77.4 78.8 45.6 38.9 31.9 77.0* Male HHHs 86.2 85.0 48.0 36.3* 46.9 86.2*
*Statistically different at least at the 10% level. The relatively high rates of saving at the endline suggest that the WE-RISE programme and its use of VSLAs as the entry point for all project activities can dramatically improve behaviour and attitudes, which can in turn lead to improved outcomes. Results from Tanzania also provide insights into common challenges to households being able to save, which could be used to inform future programme design and implementation.
Table 10 reports results on where households actually hold their savings, and are in large part supportive of findings on household savings described above. In Malawi, VSLAs are the most common place for households to keep their savings, and this did not change between the baseline and endline. In Tanzania, a slight shift occurred between baseline and endline, wherein households shifted from keeping their savings in VSLAs to keeping them at home. This may be due to easier accessibility of savings kept at home compared to in a VSLA, especially when savings are needed primarily for basic household needs. In Ethiopia, the majority of households use VSLAs as their main savings mechanism, followed by RUSACCOs. The importance of VSLAs and saving is perhaps most notable in Ethiopia, where it is clear that participation in a group savings institution – and exposure to a “culture of savings” – has allowed women to save. In turn, access to savings makes them better able to deal with shocks and stresses while relying less on negative coping strategies (e.g., reducing food consumption).
Table 10. Where household savings are held.
Indicator Malawi Tanzania Ethiopia
BL EL BL EL BL EL % households with savings in various locations
VSLA 82.9 82.3 45.5 35.1* 32.6 78.2* Home 17.8 23.9 20.0 49.3* 4.9 0.9* Bank/MFI 3.5 4.7 3.1 3.4 8.0 1.3* SACCO/RUSACCO - - 0.2 0.3 1.6 15.1* Other (NGO, family, friends, coop, insurance) 1.5 2.8 1.8 2.3 7.6 5.4
*Statistically different at least at the 10% level.
3.4.3 Household Assets The mean asset index is a proxy for household wealth and measures the number and weighted value of animal and other productive and household assets. This index is computed by multiplying the number of each type of household asset by the index value for that particular asset type. Index values of household assets used for construction of the asset index are presented in Annex 4. A higher asset index value indicates that households have been able to accumulate assets over time. Households are able to accumulate assets if income is greater than the necessary expenditures to meet household subsistence requirements. Assets also provide households with a cushion to adjust to shortfalls in incomes, or sudden increases in necessary expenditures. Thus, households with a higher asset index are less

23 | P a g e WE-RISE Global Report – DRAFT
April 18, 2016
vulnerable than households with lower asset index values. The asset index is critical to understanding the resilience capacity of WE-RISE participants at endline.
The mean asset index – both with and without agricultural land – improved significantly between baseline and endline in all three country programmes, with the exception of the mean index without agricultural land in Tanzania (Table 11). Household asset values (including land) increased between baseline and endline by 42% in Ethiopia, 31% in Malawi, and 26% in Tanzania. In Ethiopia, male-headed households not only had the greatest gains between baseline and endline, they also widened the gap with female-headed households in terms of asset holdings. According to female FGDs in Ethiopia, women are frequently compelled to sell assets, for example, in the absence of a husband, in order to assist with farming or income generating activities. Thus, they often have more limited capacity to develop their assets than men.
In Malawi, male-headed households experienced greater gains than female-headed households between the two surveys when including agricultural land but female-headed households gained more when not including land. However, female-headed households now own fewer total assets than they did at baseline, regardless of whether agricultural land is included. In Tanzania, female-headed households achieved a larger gain in assets than male-headed households since baseline. Although they still own fewer assets than male-headed households overall, they have closed the gap slightly since baseline, owning only 31% total fewer assets than male-headed households compared to owning 36% fewer at baseline. WE-RISE surpassed end-of-project targets for all categories in Malawi.
Table 11. Mean Asset Index.
Indicator Malawi Tanzania Ethiopia
BL EL BL EL BL EL IM 1.9: Mean asset index (with agricultural land)
All households 1695.0 2222.0* 312.1 393.9* 101.6 144.5* Female HHHs 1514.0 1944.0* 220.5 300.3* 95.9 126.1* Male HHHs 1745.0 2340.0* 344.7 434.8* 105.7 151.5*
IM 1.9: Mean asset index (without agricultural land) All households 741.0 846.0* 91.8 99.3 48.1 62.7*
Female HHHs 670.0 794.0* 59.5 68.5 43.7 52.4* Male HHHs 760.0 868.0* 103.2 112.7 51.3 69.3*
*Statistically different at least at the 10% level.
3.5 Impact: Women’s Empowerment TANGO constructed a Women’s Empowerment Index (WEI) for CARE modelled after the Women’s Empowerment in Agriculture Index (WEAI). 8 Similar to the WEAI, two sub-indices comprise CARE’s WEI—the Five Domains of Empowerment (5DE) and Gender Parity.
8 International Food Policy Research Institute. 2012. Women’s Empowerment in Agriculture Index. IFPRI, Oxford Poverty and Human Development Initiative (OPHI) and Feed the Future. Washington, D.C.
24 | P a g e WE-RISE Global Report – DRAFT
April 18, 2016
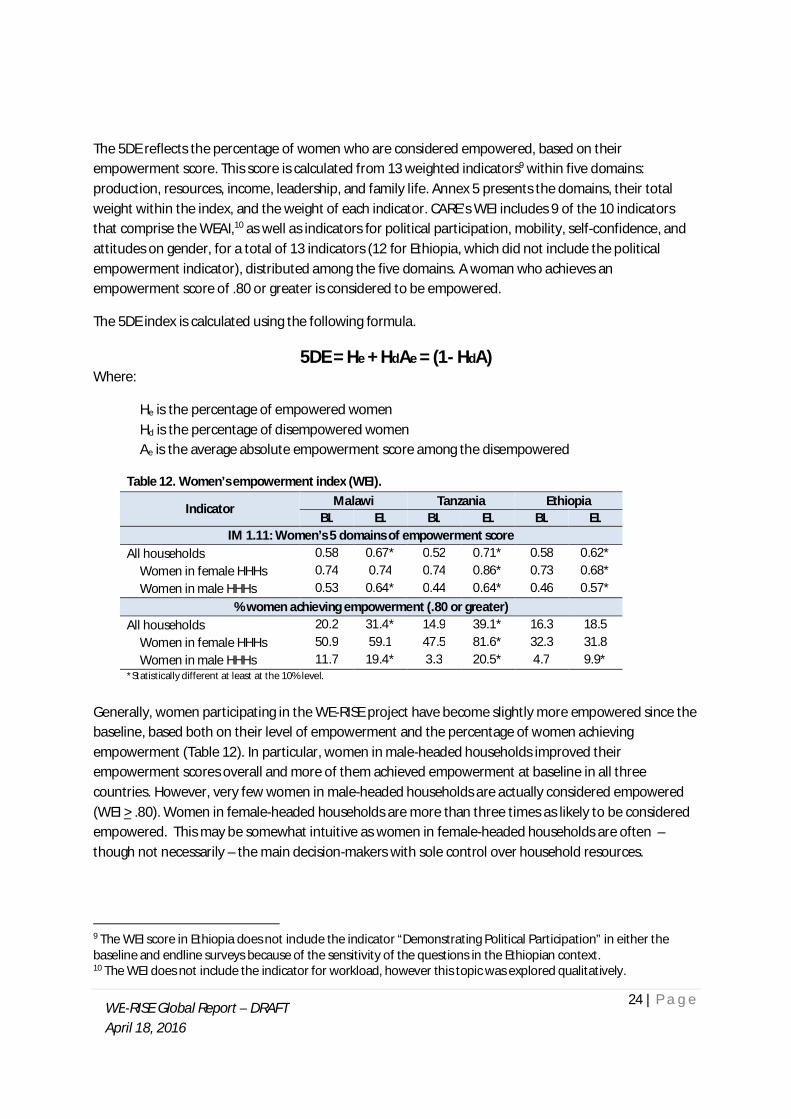
The 5DE reflects the percentage of women who are considered empowered, based on their empowerment score. This score is calculated from 13 weighted indicators9 within five domains: production, resources, income, leadership, and family life. Annex 5 presents the domains, their total weight within the index, and the weight of each indicator. CARE’s WEI includes 9 of the 10 indicators that comprise the WEAI,10 as well as indicators for political participation, mobility, self-confidence, and attitudes on gender, for a total of 13 indicators (12 for Ethiopia, which did not include the political empowerment indicator), distributed among the five domains. A woman who achieves an empowerment score of .80 or greater is considered to be empowered.
The 5DE index is calculated using the following formula.
5DE = He + HdAe = (1- HdA) Where:
He is the percentage of empowered women Hd is the percentage of disempowered women Ae is the average absolute empowerment score among the disempowered
Table 12. Women’s empowerment index (WEI).
Indicator Malawi Tanzania Ethiopia BL EL BL EL BL EL
IM 1.11: Women’s 5 domains of empowerment score All households 0.58 0.67* 0.52 0.71* 0.58 0.62*
Women in female HHHs 0.74 0.74 0.74 0.86* 0.73 0.68* Women in male HHHs 0.53 0.64* 0.44 0.64* 0.46 0.57*
% women achieving empowerment (.80 or greater) All households 20.2 31.4* 14.9 39.1* 16.3 18.5
Women in female HHHs 50.9 59.1 47.5 81.6* 32.3 31.8 Women in male HHHs 11.7 19.4* 3.3 20.5* 4.7 9.9*
*Statistically different at least at the 10% level. Generally, women participating in the WE-RISE project have become slightly more empowered since the baseline, based both on their level of empowerment and the percentage of women achieving empowerment (Table 12). In particular, women in male-headed households improved their empowerment scores overall and more of them achieved empowerment at baseline in all three countries. However, very few women in male-headed households are actually considered empowered (WEI > .80). Women in female-headed households are more than three times as likely to be considered empowered. This may be somewhat intuitive as women in female-headed households are often – though not necessarily – the main decision-makers with sole control over household resources.
9 The WEI score in Ethiopia does not include the indicator “Demonstrating Political Participation” in either the baseline and endline surveys because of the sensitivity of the questions in the Ethiopian context. 10 The WEI does not include the indicator for workload, however this topic was explored qualitatively.
25 | P a g e WE-RISE Global Report – DRAFT
April 18, 2016
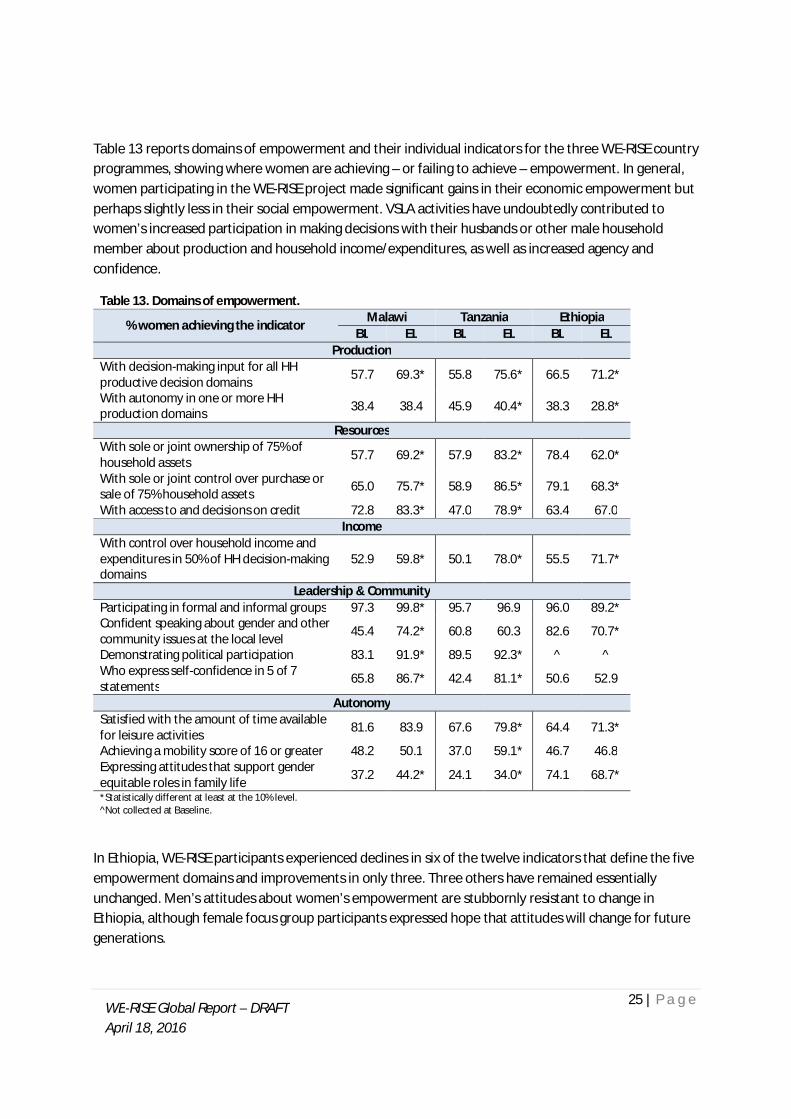
Table 13 reports domains of empowerment and their individual indicators for the three WE-RISE country programmes, showing where women are achieving – or failing to achieve – empowerment. In general, women participating in the WE-RISE project made significant gains in their economic empowerment but perhaps slightly less in their social empowerment. VSLA activities have undoubtedly contributed to women’s increased participation in making decisions with their husbands or other male household member about production and household income/expenditures, as well as increased agency and confidence.
Table 13. Domains of empowerment.
% women achieving the indicator Malawi Tanzania Ethiopia
BL EL BL EL BL EL Production
With decision-making input for all HH productive decision domains 57.7 69.3* 55.8 75.6* 66.5 71.2*
With autonomy in one or more HH production domains 38.4 38.4 45.9 40.4* 38.3 28.8*
Resources With sole or joint ownership of 75% of household assets 57.7 69.2* 57.9 83.2* 78.4 62.0*
With sole or joint control over purchase or sale of 75% household assets 65.0 75.7* 58.9 86.5* 79.1 68.3*
With access to and decisions on credit 72.8 83.3* 47.0 78.9* 63.4 67.0 Income
With control over household income and expenditures in 50% of HH decision-making domains
52.9 59.8* 50.1 78.0* 55.5 71.7*
Leadership & Community Participating in formal and informal groups 97.3 99.8* 95.7 96.9 96.0 89.2* Confident speaking about gender and other community issues at the local level 45.4 74.2* 60.8 60.3 82.6 70.7*
Demonstrating political participation 83.1 91.9* 89.5 92.3* ^ ^ Who express self-confidence in 5 of 7 statements
65.8 86.7* 42.4 81.1* 50.6 52.9
Autonomy Satisfied with the amount of time available for leisure activities 81.6 83.9 67.6 79.8* 64.4 71.3*
Achieving a mobility score of 16 or greater 48.2 50.1 37.0 59.1* 46.7 46.8 Expressing attitudes that support gender equitable roles in family life 37.2 44.2* 24.1 34.0* 74.1 68.7*
*Statistically different at least at the 10% level. ^Not collected at Baseline.
In Ethiopia, WE-RISE participants experienced declines in six of the twelve indicators that define the five empowerment domains and improvements in only three. Three others have remained essentially unchanged. Men’s attitudes about women’s empowerment are stubbornly resistant to change in Ethiopia, although female focus group participants expressed hope that attitudes will change for future generations.
26 | P a g e WE-RISE Global Report – DRAFT
April 18, 2016
Areas in which women continue to be challenged include: mobility, self-confidence, and autonomy in production. Although more women now express attitudes supporting gender-equitable roles across all three country programmes, the overall percentage of women achieving this indicator remains low, especially in Tanzania and Malawi.
The WEI also examines men’s and women’s parity in each empowerment domain. Gender parity measurements are based only on households in which a man and a woman answered questionnaire modules respective to their sex. Thus, no female-only households are included, and no households where a man was unavailable to respond to the male portion of the questionnaire are included. Empowerment scores are constructed as defined above for all men and all women.
Table 14 presents results for gender parity from households where both males and females were present. Statistical significance is reported only for comparisons of gender between baseline and endline (i.e., between females at baseline and endline, and between males at baseline and endline). Differences between females and males at baseline, and between females and males at endline, are reported in the endline report for each country.
In all three countries, women made gains towards parity with men in many of the individual indicators of empowerment. This is due not only to more women achieving individual indicators, but also from decreases in the percentage of men achieving an indicator, even though overall men also made gains in achievement of certain indicators since the baseline. Thus, in many cases, the gap between men and women narrowed, bringing them closer to parity. In particular, men’s autonomy in production domains decreased in all three countries, as women’s decision-making input for productive domains increased. Likewise, although both men and women gained in terms of control over household income and expenditures (except men in Malawi), the percentage change was considerably larger for women than for men, again, narrowing the gap. Of note in Ethiopia is the large decrease (over 50%) in men achieving the indicator for gender-equitable attitudes at the endline, which narrows the gender parity gap with women in terms of parity but is in the wrong overall direction. More women and men should be achieving this indicator, not fewer.
Results for gender parity in Ethiopia mirror those for women’s empowerment reported in Table 13. Declines in women’s empowerment for certain indicators tended to result in greater gender disparity, though not in all cases. The gender gap widened for ownership and control of household assets, but narrowed regarding credit because fewer men achieved this indicator at the endline than at the baseline. Disparity also increased in terms of mobility, where fewer women achieved the indicator at the endline than did at the baseline. Thus, while the trend is towards improvement, certain challenges for women remain, primarily in autonomy and decision-making input regarding production, mobility, and gender-equitable attitudes.
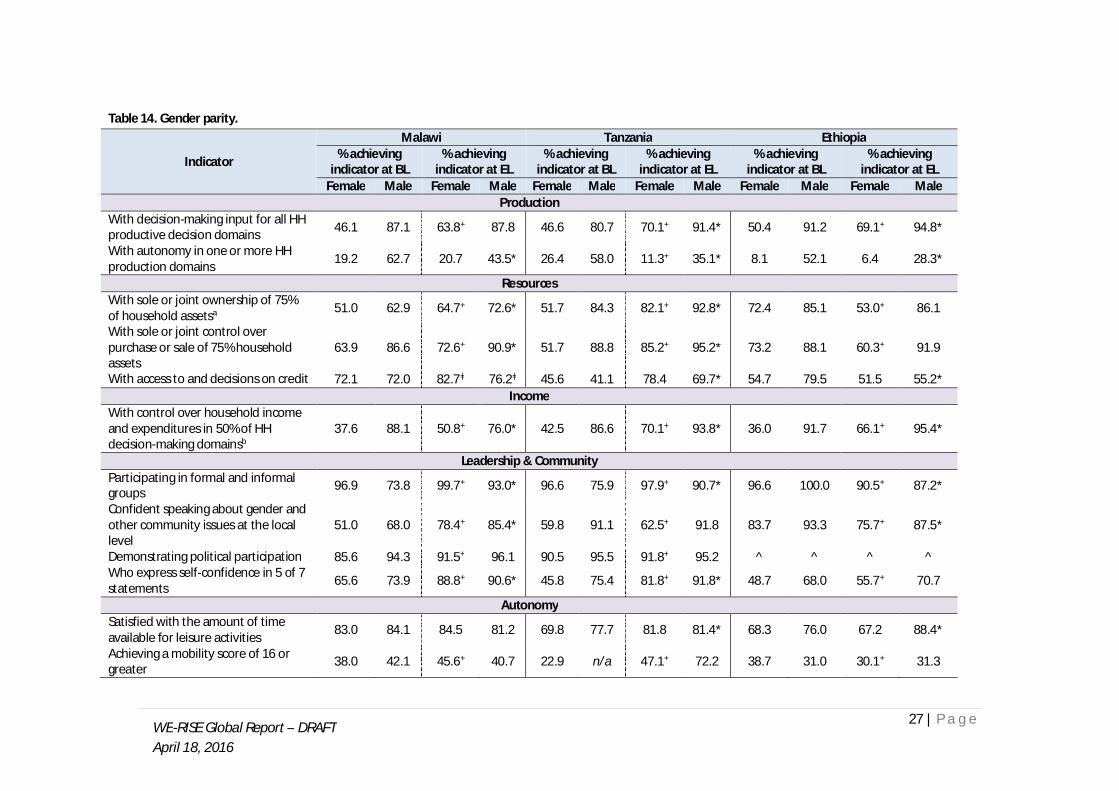
27 | P a g e WE-RISE Global Report – DRAFT
April 18, 2016
Table 14. Gender parity.
Indicator
Malawi Tanzania Ethiopia % achieving
indicator at BL % achieving
indicator at EL % achieving
indicator at BL % achieving
indicator at EL % achieving
indicator at BL % achieving
indicator at EL Female Male Female Male Female Male Female Male Female Male Female Male
Production With decision-making input for all HH productive decision domains 46.1 87.1 63.8+ 87.8 46.6 80.7 70.1+ 91.4* 50.4 91.2 69.1+ 94.8*
With autonomy in one or more HH production domains 19.2 62.7 20.7 43.5* 26.4 58.0 11.3+ 35.1* 8.1 52.1 6.4 28.3*
Resources With sole or joint ownership of 75% of household assetsa 51.0 62.9 64.7+ 72.6* 51.7 84.3 82.1+ 92.8* 72.4 85.1 53.0+ 86.1
With sole or joint control over purchase or sale of 75% household assets
63.9 86.6 72.6+ 90.9* 51.7 88.8 85.2+ 95.2* 73.2 88.1 60.3+ 91.9
With access to and decisions on credit 72.1 72.0 82.7ǂ 76.2ǂ 45.6 41.1 78.4 69.7* 54.7 79.5 51.5 55.2* Income
With control over household income and expenditures in 50% of HH decision-making domainsb
37.6 88.1 50.8+ 76.0* 42.5 86.6 70.1+ 93.8* 36.0 91.7 66.1+ 95.4*
Leadership & Community Participating in formal and informal groups 96.9 73.8 99.7+ 93.0* 96.6 75.9 97.9+ 90.7* 96.6 100.0 90.5+ 87.2*
Confident speaking about gender and other community issues at the local level
51.0 68.0 78.4+ 85.4* 59.8 91.1 62.5+ 91.8 83.7 93.3 75.7+ 87.5*
Demonstrating political participation 85.6 94.3 91.5+ 96.1 90.5 95.5 91.8+ 95.2 ^ ^ ^ ^ Who express self-confidence in 5 of 7 statements 65.6 73.9 88.8+ 90.6* 45.8 75.4 81.8+ 91.8* 48.7 68.0 55.7+ 70.7
Autonomy Satisfied with the amount of time available for leisure activities 83.0 84.1 84.5 81.2 69.8 77.7 81.8 81.4* 68.3 76.0 67.2 88.4*
Achieving a mobility score of 16 or greater 38.0 42.1 45.6+ 40.7 22.9 n/a 47.1+ 72.2 38.7 31.0 30.1+ 31.3

28 | P a g e WE-RISE Global Report – DRAFT
April 18, 2016
Expressing attitudes that support gender equitable roles in family life
35.1 - 48.3+ 52.9 21.2 16.8 30.2 34.0* 22.7 550.3.33
27.0 23.8* a excluding poultry, non-mechanized farm equipment, and small consumer durables as modelled in the WEAI. This indicator is based on the female respondent’s perception of who makes decisions on household assets. Male respondents were not directly asked questions about asset ownership and control. b excluding minor household expenditures as modelled in the WEAI. + Statistically different pairwise comparison of females between baseline and endline at least at the 10% level. *Statistically different pairwise comparison of males between baseline and endline at least at the 10% level. ^ Not collected at Baseline. ǂ Pairwise test not completed due to a difference in credit access between males and females in households with a male and female respondent.

29 | P a g e WE-RISE Global Report – DRAFT
April 18, 2016
3.6 Perceptions of Impact by Project Participants To understand saturation of project activities and participant’s perceived impact on the household, the endline survey asks male and female respondents whether they feel their households are better or worse off than before their participation in the WE-RISE project began (i.e., compared to 2012). This question was added to the endline questionnaire and results are therefore are not comparable to the baseline. Data collection had already begun in Tanzania before amending the endline questionnaire, thus no data are available.
In both Malawi and Ethiopia, the majority of respondents – both male and female – perceived their households are better off now than four years ago, before initiation of the WE-RISE project (Table 15). In both countries, improved access to savings and credit through WE-RISE activities was cited as the key reason their households are better off now. Additional benefits accruing from the project included increased agricultural production and income from both agricultural and non-agricultural sources, and improved food security. Female respondents also perceived improvements in household decision-making processes and other household activities suggesting increased gender equity within the household.
Table 15. Participant perceptions of HH status after project participation.
Indicator Malawi Tanzania Ethiopia
Females Males Females Males Females Males % respondents
Better off than 4 years ago 89.0 88.2 - - 69.1 70.7 Same as 4 years ago 7.6 10.3 - - 20.5 21.3 Worse off than 4 years ago 1.0 0.9 - - 10.3 8.9 Better in some ways and worse in others 2.4 0.6 - - - -
3.7 Outcome 1: Increased Productivity, Resources, and Resilience Under Change Outcome 1 of CARE’s WE-RISE project, activities and interventions are designed so that “CFIRW have increased household productive assets and resources and control over them, and are more resilient to climate shocks.”
The objective of Outcome 1 is to increase household access to, control over, and ownership of productive assets and resources, thereby facilitating increased resilience to climate shocks of targeted women and households. WE-RISE theorizes that increased income from agriculture will result from smallholder farmers having increased access to inputs and adopting improved agricultural and post-harvest practices – skills promoted through the project. WE RISE hypothesized that women’s participation in project activities that are designed to increase ownership of and control over household productive resources and assets would result in an improvement or increase in Outcome 1 indicators (see Annex 2 for full list of indicators).
Project activities were designed to improve women’s access to gender-sensitive agricultural agents (e.g., government extension agents, Development Agents, community-based agents); increase their access to inputs; increase their access to information about marketing and improve their ability to

30 | P a g e WE-RISE Global Report – DRAFT
April 18, 2016
identify and meet ocal market opportunities; and finally, improve community capacity for disaster risk reduction and climate change adaptation.
This section compares baseline and endline values for some of these indicators to determine change in the status of poor women farmer’s agricultural productivity.11 Results are based on data collected only from women who engaged in any agricultural activity12 in order to better understand their involvement in and perspectives on changing agricultural production activity outcomes.
3.7.1 Women’s Access to and Control of Loans. Results presented in Table 16 represent women who reported taking out a loan – or wanted to take out a loan – over the 12 months prior to each survey. CARE has promoted women’s participation as members of collectives – the Village Savings and Loan Associations, or VSLAs – as the means by which women and households participate in and successfully benefit from income generating and agricultural activities. Women’s access to loans for use in income-generating activities (IGA) is understood by both men and women alike as creating new dynamics relating to gender roles including more sharing in decision-making and greater opportunities for women and their families. Control over loans is defined as determining on one’s own to take out the loan and how the borrowed capital was used.
Table 16. Women’s access to and control of loans.
Indicator Malawi Tanzania Ethiopia
BL EL BL EL BL EL OC 1.4: % women with access to and control over loans for IGA
All households 29.0 34.2* 26.8 26.8 9.1 18.2* Female HHHs 46.7 56.3* 50.0 54.7 14.8 28.6* Male HHHs 24.1 24.9 19.9 14.0* 3.2 9.8*
*Statistically different at least at the 10% level. Women’s access to and control of loans improved between baseline and endline for women in Malawi and Ethiopia, and particularly for women in female-headed households. Women living in male-headed households in Ethiopia also improved their access to loans. Overall, women in Ethiopia made greater gains in accessing and controlling loans; twice to three times as many women gained access to and control over a loan at the endline than at the baseline, even though this was just short of the end-of-project target (20%). WE-RISE Malawi surpassed its end-of-project target (50.8%) for female-headed households, though not for all households or male-headed households.
In Tanzania, little change was reported in women’s access to and control of loans, although women in male-headed households actually lost ground. According to data on how women are using their loans (see country endline report), women now tend to use credit to meet immediate household food needs. At the baseline, the most commonly cited use of loans was as business capital, including IGAs. This prioritization of loan capital is in line with data from Tanzania that suggests an increase in the number of
11 Full results are presented in the country-specific endline reports. 12 Includes primary production, processing, or marketing of food, fibre, or fuel crops, large and small livestock, bees, fish, horticultural crops such as vegetables, fruit, nuts, berries, herbs or natural products (non-timber forest products and wild fisheries). Women whose only involvement in agriculture was wage labour were not included.

31 | P a g e WE-RISE Global Report – DRAFT
April 18, 2016
shocks that households are experiencing, and worsening food security (e.g., increase in the CSI). Not only are more households using their savings to meet household needs, they are also less likely to take out new loans.
In part, these results reflect slowly changing attitudes about loan dispersal and use since the baseline, when men tended to perceive household financial decisions as the male domain, even despite women’s ostensible participation as the household representative in the VSLA. Baseline FGD participants in Ethiopia, for example, appeared to express suspicion that the loan process should occur at the behest of men and that only “desperate” men would allow their wives to make key decisions about credit and other financial matters. This attitude appears to be a thing of the past in Ethiopia, largely because of the importance of VSLAs to households and communities in promoting savings, improved household financial management, and credit, even if only in relatively small amounts.
Credit is still often used to purchase food in all countries, which can result in a cycle of debt if not carefully managed. However, women also indicated they borrow in order to invest in small business enterprises, purchase agricultural inputs or production assets, and to pay school fees and health expenses.
Although no statistical tests were performed on sources of loans, results reported in Table 17 suggest that VSLAs are the predominant source of loans for both men and women. The rise in importance of the VSLA to the lives and livelihoods of WE-RISE participating households has coincided with a decline in reliance on other informal forms of credit. Very few male or female respondents indicated they borrow from formal institutions in any of the WE-RISE countries. Formal institutions often have less desirable loan terms and onerous collateral requirements.
Again, WE-RISE Ethiopia appears to have made the largest gains between baseline and endline compared to Malawi and Tanzania. In Tanzania, it appears that both male and female respondents shifted from borrowing from VSLAs to borrowing from friends, where the opposite appears to have happened in Ethiopia.
Table 17. Source of loans for respondents who took out a loan.
Indicator Malawi Tanzania Ethiopia
Females Males Females Males Females Males BL EL BL EL BL EL BL EL BL EL BL EL
Friends 9.8 9.5 30.0 36.4 1.0 11.2 13.3 23.4 79.6 43.3 70.1 47.2 VSLA 83.9 87.2 45.9 48.2 92.8 85.2 80.0 72.3 9.9 71.5 7.5 68.3
Informal lender 4.1 2.1 11.5 8.2 0.0 0.3 0.0 0.0 19.3 10.1 32.2 9.9 Shop/merchants 0.0 0.2 1.6 0.5 0.0 0.8 0.0 1.4 0.6 6.5 0.0 6.2
Community group 0.2 0.2 2.5 2.3 1.0 0.8 3.3 0.7 1.1 3.6 2.3 1.2 NGO 0.4 0.4 0.8 0.0 0.5 0.8 0.0 0.0 0.0 0.4 0.6 0.0
Formal lender 1.4 0.2 4.1 2.7 3.1 1.0 3.3 2.1 0.6 2.2 2.3 3.7 Gov’t extension 0.4 0.2 2.5 1.4 0.5 0.0 0.0 0.0 0.0 0.4 0.6 1.2
Other 0.0 0.0 0.8 0.5 0.0 0.0 0.0 0.0 0.0 0.7 0.0 1.2

32 | P a g e WE-RISE Global Report – DRAFT
April 18, 2016
Generally, VSLAs remain highly relevant to women’s priorities and fill a wide gap in their ability to access financial services important to their production activities and household needs. When women are able to save and access credit, their households benefit through enhanced agriculture and livestock productivity in and around their homesteads, over which they continue to have more control.
3.7.2 Agricultural Income The WE-RISE country programmes all promote increased production and income from agricultural activities, as well as from non-agricultural activities (i.e., small business enterprises). Table 18 reports results on women’s income from IGA activities promoted through WE-RISE. Women’s access to income from WE-RISE activities increased in all three country programmes. In particular, the number of WE-RISE women participants earning income from agricultural production or other economic activities promoted by the project doubled between 2012 and the end of 2015 in Ethiopia. This increase was reported for women in both female- and male-headed households, but particularly in male-headed households.
Table 18. Women earning income from agricultural production or other economic activities promoted by WE-RISE.
Indicator Malawi Tanzania Ethiopia
BL EL BL EL BL EL % women with income from WE-RISE activities.
All households 71.7 90.1* 54.5 89.8* 35.0 69.5* Female HHHs 72.3 90.9* 51.9 91.9* 41.7 67.7* Male HHHs 71.6 89.8* 55.5 88.9* 30.3 70.7*
*Statistically different at least at the 10% level. In Malawi, women linked increased participation in soya and groundnut cultivation as key to their increased earning potential. Both crops are promoted by WE-RISE. In Tanzania, cassava and oilseed (e.g., sesame) production is promoted by the WE-RISE project as inputs for processing into cassava flour and cooking oil, more high value products than the crops themselves. The number of female farmers growing sesame more than double between the baseline and endline, even though processing equipment had only arrived in WE-RISE communities around the time of the endline in 2015.
3.7.3 Agricultural Production and Improved Practices WE-RISE relies on different local partners as the main channel through which the project encourages women to adopt improved agricultural practices: community-based agents (CBA) or Farmer-to-Farmer trainers (FFT) in Malawi, Development Agents (DA) in Ethiopia, and CBAs and paraprofessionals, along with Farmer Field and Business Schools (FFBS) in Tanzania.
Significant improvements in women’s use of various improved practices occurred in both Malawi and Tanzania, while results are less encouraging in Ethiopia (Table 19). In Malawi, the greatest increases in adoption rates occurred for improved seeds, irrigation technologies, crop diversity, and manure/ compost. For example, the number of female farmers using improved seeds doubled between baseline and endline. In Tanzania, the greatest increases in adoption rates by women occurred for: minimum tillage (which tripled), crop rotation, improved seeds, cover crops, and manure/ compost.

33 | P a g e WE-RISE Global Report – DRAFT
April 18, 2016
The decline for adoption of improved storage practices in Malawi likely reflects local contextual issues beyond the control of the project. WE-RISE programme staff in Malawi had planned to strengthen post-harvest management by training communities in improved crop/seed storage systems, including demonstration units. Although the midterm evaluation found that farmers had indeed been trained in the use of nkhokwe (outdoor grain banks), minimal uptake resulted because of a fear of theft. Project staff elected to reduce focus on this activity and prioritize other areas that seemed less resistant to change.
Table 19. Improved agricultural, harvest, storage, and livestock practices.
Indicator Malawi Tanzania Ethiopia BL EL BL EL BL EL
OC 1.5: % women adopting 3 or more improved agricultural practices 44.7 66.0* 13.7 52.3* 23.8 8.8*
OC 1.6: % women farmers adopting a minimum of 2 value chain practices 58.7 68.6* 25.2 69.1* 13.5 0.6*
OC 1.7: % women adopting improved storage practices 37.3 27.0* 21.5 35.0* 2.0 3.9
OC 1.8: % women using one or more improved livestock practice 32.8 77.7* 22.7 48.0* 24.0 24.2
*Statistically different at least at the 10% level. The results for Ethiopia show either no change or a decrease in the number of women adopting various improved practices. These results reflect the reality that crop production and productivity have not been a successful focus of WE-RISE programming in Ethiopia. Although the adoption rates are low overall, the most common improved agricultural practices being adopted by women include: improved seeds, irrigation technologies, crop diversity, manure/compost, intercropping, crop rotation, and soil erosion prevention methods. WE-RISE’s implementing partner in Ethiopia, SOS Sahel, has developed and maintained excellent relationships with the government’s Sidama extension service personnel at the zone, woreda, and kebele levels in an effort to promote and sustain WE-RISE activities. However, the project has either put less emphasis on promoting crop production and productivity, or those activities relating to crop production have been relatively less successful and/or have targeted few households. The lack of results for value chain practices is likely a result of a lack of value chain programming in the WE-RISE Ethiopia programme arsenal.
As was the case in Malawi, the vast majority of female farmers in Ethiopia continue to utilize traditional storage practices. Sidama farmers normally store their crops in a traditional kafecha kept underground.
3.7.4 Access to Agricultural Inputs and Markets By design, activities related to Outcome 1 are intended to improve access to productivity-enhancing inputs, such as seed and fertilizer, via collective purchase, improved linkages to input suppliers, and support to VSLA groups/ members to operate as input suppliers. Results presented in Table 20 suggest that WE-RISE has been fairly successful in this endeavour in Malawi and Tanzania, though again, has lost ground in Ethiopia. Barely one-third of women WE-RISE participants in Ethiopia accessed agricultural inputs in the 12 months prior to the survey, and many FGD participants expressed profound disappointment with WE-RISE’s attempt at increasing their access to improved seeds, describing the

34 | P a g e WE-RISE Global Report – DRAFT
April 18, 2016
effort as involving limited seed types, untimely distribution of seed (i.e., too late to plant), and a shortage of seed.
Although fairly large improvements occurred for both women’s access to inputs and to output markets in Malawi and Tanzania, women FGD participants in Malawi reported that the groups that had formed to help farmers sell their products were not functioning well, if at all. There was consensus among interviewed participants that small farmers are seldom able to make a profit because they are not linked to appropriate markets and do not have the skills to negotiate within the market. Men and women both reported difficulty in selling their produce to any source other than the vendors who come to their villages, and who often cheat them.13 In Malawi as elsewhere, smallholder farmers – especially female farmers – often face a paucity of markets, have limited or no linkages to larger buyers, have little understanding of the benefit of waiting until larger buyers arrive to purchase crops, and often have little financial capacity to wait for formal buyers to arrive.
In Tanzania, nearly one-half of WE-RISE participants access inputs through a cooperative or producer group (see Tanzania endline report), followed by agro-dealers and input suppliers within 5 km. WE-RISE Tanzania has emphasized forging links between local agro-dealers and producers, encouraging dealers to meet with group members to reduce transaction costs for both parties. Although many women in Tanzania rely heavily on local markets for selling their agricultural products, more women are now also selling in bulk through producer groups. Fewer women are selling to middlemen or through the warehouse receipt system.
In Tanzania, project management determined that there would not be sufficient time to build capacity of marketing committees and so engaged with a local business – Private Agriculture Support Service (PASS) – to train MRCs. Marketing committees received mixed reviews from project participants; some marketing committees are viewed as stronger and more effective at identifying buyers than others. The majority of focus group respondents felt that their market committees were weak and were determined to improve them; in the meantime they feel it is necessary to sell on their own.
Table 20. Women’s access to productive inputs and markets.
Indicator Malawi Tanzania Ethiopia BL EL BL EL BL EL
OC 1.9: % women accessing agricultural inputs (seeds, fertilizers, etc.) over the last 12 months
65.5 77.9* 33.9 80.1* 57.5 32.6*
OC 1.10: % women accessing output markets to sell agricultural production over the last 12 months
28.5 51.9* 22.0 61.3* 7.7 4.8
*Statistically different at least at the 10% level. In Ethiopia, very few women report accessing output markets to sell agricultural products within the twelve months prior to the endline. Rather, the vast majority of women farmers in Ethiopia continue to 13 The calculation of the access to output market indicator counts the response “sold individually to trader/ collector.” This is often middlemen who offer low prices. If using this question in future surveys, it would be more accurate to modify the response menu such that middlemen are not tallied in greater access to output markets.

35 | P a g e WE-RISE Global Report – DRAFT
April 18, 2016
sell their products individually in local markets. Most productive enterprises that garner income through marketing continue to be controlled by men. This is the reality of an entrenched patriarchy that will take years of effort to break down. Women’s control of work, assets and income tends to be derived from resources close to and around the homestead that do not involve selling productive outputs at a major market. These include access to poultry, milk, and butter from livestock and gardening activities. To the degree these can be sold in local markets, women are often involved – especially if living in close proximity to these markets. The more distant the markets, the greater the involvement of men, due to more limited mobility afforded to women.
It is of note that in Malawi, the number of female farmers who reported reliance on inputs they themselves produce increased from 20% to 33% between the two surveys (see Malawi endline report). Coupled with the dramatic increase (43% BL to 58% EL) in their use of compost and manure (a sustainable and improved agricultural practice, and one that is promoted by WE-RISE), it is plausible that this group of female farmers seek to optimize their use of on-farm resources and minimize use of expensive purchased inputs. Therefore, although these women are not counted in the tabulation of CARE’s OC 1.9: % women accessing agricultural inputs over the last 12 months,14 they may very well increase their own short-term farm profitability by lowering production costs; improve long-term sustainability by reducing surface and groundwater pollution; and protect household health by reducing pesticide residues in food.
3.7.5 Coping with and Adapting to Shocks Households in both Malawi and Tanzania reported experiencing more shocks at endline than the baseline, suggesting they had experienced at least one additional shock between the two surveys (Table 21). The major shocks in both countries continue to be drought, increased food prices, and disease epidemics (human, livestock, crop), and chronic illness/severe accident of household member. Hailstorms continue to plague households in Malawi and decreased remittances increased dramatically in Tanzania.
The Ethiopia data support earlier evidence suggesting that WE-RISE participants have increased their ability to deal with shocks and stresses (e.g., improved CSI scores, fewer households reporting food and income shortages, and lower incidence of resorting to negative food consumption strategies). At endline, fewer households than at baseline reported experiencing virtually every type of shock. The major shocks in Ethiopia continue to be drought, chronic illness or severe accident suffered by a household member, and indebtedness.
Household responses to shocks and stresses may involve both positive and negative strategies. Households were asked about their non-consumption strategies used to cope with food and income shortages in the three months prior to the survey, many of which are considered to be negative in that they can contribute to longer-term irreversible effects. Use of negative coping strategies (e.g., sale of productive assets, sale of land, or selling seed held for next season) often makes it more difficult for
14 The tabulation of Outcome indicator 2.5 in the Global M&E plan does not include “produce own inputs” as a qualifying response.

36 | P a g e WE-RISE Global Report – DRAFT
April 18, 2016
households to recover from a shock or stress, which in turn can make them more vulnerable to future shocks and stresses.
Table 21. Household shocks.
Indicator Malawi Tanzania Ethiopia BL EL BL EL BL EL
Mean number of shocks experienced per household over the last 5 years All households 2.7 3.5* 1.8 3.1* 2.8 1.2*
Female HHHs 3.1 3.6* 2.0 3.5* 2.8 1.1* Male HHHs 2.6 3.4* 1.7 3.0* 2.7 1.3*
% HHs experiencing a shock in the last 5 years Major drought 16.0 53.2* 37.7 59.8* 67.9 26.3*
Hail storm 30.6 47.7* - - - - Chronic illness/accident of HH member 19.2 21.5* 14.7 32.8* 31.6 23.1*
Indebtedness - - - - 31.2 16.0* Death of HH income earning members 8.1 7.4 13.0 16.3 24.7 8.4*
Major flooding/waterlogging 6.6 6.5 - - 22.3 7.4* Epidemic disease (crop, livestock, human) 49.7 56.5* 21.8 54.2* 18.5 7.8*
Dowry/wedding costs - - - - 16.7 6.7* Loss of a regular job of a HH member 3.8 3.1 0.8 1.0 10.9 6.2*
Major conflicts 6.2 12.9* 2.7 4.9* 10.5 2.5* Divorce or abandonment 10.3 11.8 15.0 15.9 9.8 2.5*
Issues with division of father’s property 1.6 2.9 1.8 3.8* 9.3 3.3* Failure or bankruptcy of business 31.5 40.5* 5.2 10.0* 9.1 3.8*
Withdrawal of NGO/gov’t assistance - - - - 8.0 9.8 Decreased or cut off regular remittances 5.1 5.3 3.3 52.4* 5.4 0.0*
Sudden or dramatic increase in food price 83.5 79.3* 59.5 48.8* - - Theft - - 5.3 14.4* - -
*Statistically different at least at the 10% level. For those households that reported experiencing at least one shock, Table 22 reports the percentage adopting at least one negative (non-consumption) coping strategy. Again, more households adopted negative coping strategies at endline than at baseline in Malawi and Tanzania, while fewer households did so in Ethiopia. This is consistent with previous findings suggesting WE-RISE participants in Ethiopia have improved their ability to deal with shocks and stress. However, as previously mentioned, the timing of the endline survey occurred in November, after at least some the Meher crops had been harvested, when there would be less need to adopt negative coping strategies. WE-RISE participants in Tanzania reported the largest differences between baseline and endline, but female-headed households had slightly smaller gains than male-headed households in both Tanzania and Malawi.
In both countries, commonly reported negative coping strategies that increased at endline included: taking out a loan with interest, reducing expenditures on health care and education, pledging to sell and selling livestock (more than usual), and sending children away to better-off relatives. These are not intrinsically negative strategies by themselves, but can be under certain circumstances. For example, taking out interest-bearing loans may not be a negative strategy when food security is adequate, but

37 | P a g e WE-RISE Global Report – DRAFT
April 18, 2016
when money is borrowed because there is not enough food or money to buy food, there is a high potential for entering a cycle of debt; that is, even if food security improves, a household may not be able to repay the accrued debt.
Table 22. Household adoption of non-consumption negative coping strategies.
Indicator Malawi Tanzania Ethiopia
BL EL BL EL BL EL OC 1.11: % households adopting negative coping strategies in the past 3 months
All households 12.7 18.8* 14.6 64.5* 80.9 35.9* Female HHHs 14.5 22.6* 15.0 60.5* 78.5 32.7* Male HHHs 12.2 17.1* 14.5 66.3* 82.8 38.0*
*Statistically different at least at the 10% level. As mentioned above, households also respond to shocks and stresses in more positive and pro-active ways, allowing them to mitigate the impact of or adapt to specific shocks and stresses. For example, use of drought tolerant varieties of crops or livestock breeds confers some degree of adaptation to low rainfall and even drought conditions, often allowing for at least some production. Increased use of adaptation strategies and reduced use of negative coping strategies presents a picture of an increasingly resilient household.
Among households that reported experiencing at least one shock, the vast majority implemented at least one adaptation strategy in order to reduce the impact of future shocks or stresses (Table 23). In particular, twice as many WE-RISE participants in Tanzania reported using at least one adaptation measure at endline than at baseline, although female-headed households show a slightly lower tendency than male-headed households. This may be due, at least in part, to labour and time constraints in female-headed households.
Although there are no statistical differences between baseline and endline in Ethiopia, the majority of households report employing at least one adaptation strategy to deal with future shocks/stresses.
Table 23. Household adaptation to shocks.
Indicator Malawi Tanzania Ethiopia BL EL BL EL BL EL
OC 1.12 % households using at least one adaptation strategy to reduce the impact of future shocks All households 84.5 88.8* 43.6 87.6* 72.1 73.3
Female HHHs 81.9 83.2 41.4 84.4* 66.8 70.4 Male HHHs 85.2 91.2* 44.4 89.0* 75.9 75.2
*Statistically different at least at the 10% level.
3.8 Outcome 2: Enabling Institutional Environment Under Outcome 2, WE-RISE activities and interventions are designed such that “Formal and informal institutions are more responsive to women’s priorities and accountable to upholding their rights.”

38 | P a g e WE-RISE Global Report – DRAFT
April 18, 2016
A key focus of WE-RISE Change Outcome 2 is to improve the linkages between service providers (private sector, institutions, and government) and women farmers. Additionally, WE-RISE aims to develop the capacity of local institutions to promote democratic representative processes, increase awareness of women’s rights and inclusion of women in leadership positions. WE-RISE hypothesizes that women’s participation in project activities designed to enhance institutional responsiveness to women’s priorities will result in an improvement or increase in Outcome 2 indicators.
In order to determine if change has taken place since baseline, the surveys explore women’s access to and satisfaction with agricultural extension services, women’s access to financial services, women’s participation and leadership in groups (formal and informal); and women’s self-confidence in public speaking.
3.8.1 Women’s Access to Agricultural Services The development of VSLAs has proved to offer an essential gateway for women to access services, particularly financial services, but also other social services and activities that promote women’s empowerment.
The number of female respondents stating that they, themselves, had met with an agricultural extension worker or a livestock / fisheries worker in the 12 months prior to the survey increased dramatically between baseline and endline in both Malawi and Tanzania (Table 24). Most women report satisfaction with those services, even though fewer women were satisfied at the endline than at the baseline in Tanzania. Overall, very few women that participate in the WE-RISE project in Ethiopia are accessing agricultural services.
More women accessed agricultural financial services at the endline than baseline in all three countries. Nearly all WE-RISE women participants have now accessed some form of financial services, such as microfinance loans, VSLAs, and their own savings.
WE-RISE Ethiopia has been more successful in their promotion of increased access to and use of – at least some – financial services than in achieving improved access to agricultural services or an increase in agricultural production and/or productivity. Although the total percentage of women who reported meeting with an agricultural or livestock extension agent in the 12 months previous to either the baseline or endline survey was low, the vast majority of them expressed satisfaction with those services.
Table 24. Women’s access to agricultural financial and extension services.
Indicator Malawi Tanzania Ethiopia BL EL BL EL BL EL
OC 2.1: % women with access to agricultural extension services in last 12 months 26.8 77.5* 32.8 78.5* 23.6 11.8
OC 2.2: % women accessing agricultural financial services (loans, savings, crop insurance) in last 12 months
88.1 94.4* 88.8 99.2* 60.9 95.5*
OC 2.3: % women reporting satisfaction with agricultural extension services 91.0 93.6 74.5 62.4* 77.1 71.2
*Statistically different at least at the 10% level.

39 | P a g e WE-RISE Global Report – DRAFT
April 18, 2016
Although satisfied overall, there remains a perception among female WE-RISE participants in Ethiopia that government agricultural extension workers, who are usually men (although the proportion of female-to-male DAs appears to be inching very slowly upward), primarily serve the needs of men. In general, they believe that extension workers do not value women as agricultural producers. Women understand extension outreach as generally relating to the continuing greater public prominence and mobility of their husbands and men as the most influential farmers in the kebele.
At the kebele level, agricultural extension through WE-RISE occurs through Farming Training Centres (FTCs), which men understand as an influential and important formal institution. Active involvement in FTC activities allows men to access important social capital as well as future economic capital. Women view their participation with FTCs as indirect, largely through their husbands or males in their families. Women farmer FGD participants continue to identify the need for improved access to agricultural information and assistance in their farming activities, such as gardening close to their homes as well as other cash and food crop cultivation activities that require women’s involvement, particularly during the planting and harvesting cultivation phases.
The situation is somewhat different in Malawi, where FGD with female VSLA members indicated agricultural information was more readily available to women now compared to three years ago, due primarily to community extension officers, government extensions officers, and the private sector. Increasing access to extension services was ranked as the third most effective WE-RISE activity in Malawi, and was specifically linked to achieving higher crop production. FGDs with non-VSLA members suggest that benefits related to extension access as a result of the WE-RISE project are not limited to VSLA members only. Rather, the increased presence of community extension workers provides non-members with more access to information about agriculture than they had three years ago.
3.8.2 Women’s Participation in Formal and Informal Groups In order to understand the extent of women’s participation and leadership in formal and informal groups, the surveys first established the existence of ten different types of groups in the community. If groups existed, women were asked about their active participation, reasons for not participating, degree of decision-making input they have, and whether they held a leadership position. Results on women’s active participation in formal or informal groups and as leaders are presented here. Full results are available in the respective country endline reports.
Women’s active participation in at least one formal or informal group is high in all three countries, and showed statistically significant improvement in both Malawi and Ethiopia between baseline and endline (Table 25). Women’s participation fell somewhat between baseline and endline in Ethiopia. However, women’s participation in groups in Ethiopia needs to be understood in a more nuanced. Specifically, it is not common for women to speak out when in mixed gender groups. Thus, high rates of participation do not necessarily mean high rates of active participation. Although men are trying to be more inclusive of women, they frequently draw on old habits of cutting women off during discussions or display patrimonial attitudes about women’s contributions to the discussion. Thus, one possible explanation for the decrease in participation at endline may be due to more diligence on the part of enumerators at the endline in asking about active participation and not just participation in the form of membership.
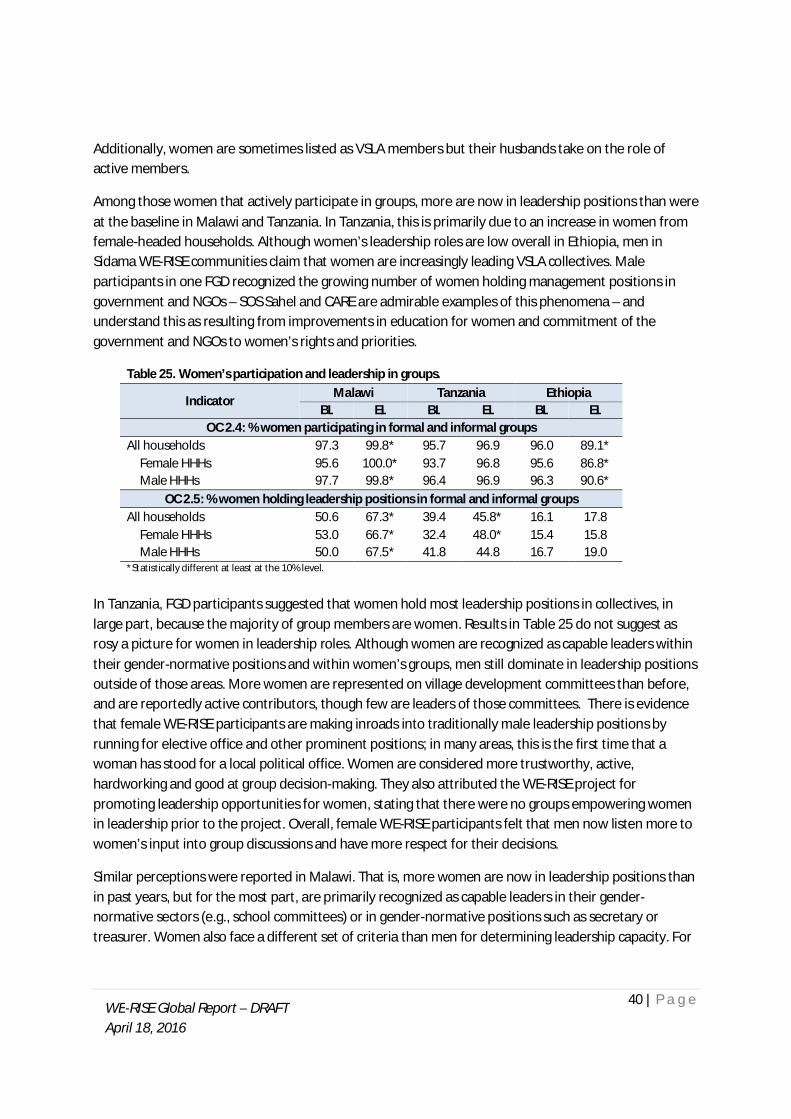
40 | P a g e WE-RISE Global Report – DRAFT
April 18, 2016
Additionally, women are sometimes listed as VSLA members but their husbands take on the role of active members.
Among those women that actively participate in groups, more are now in leadership positions than were at the baseline in Malawi and Tanzania. In Tanzania, this is primarily due to an increase in women from female-headed households. Although women’s leadership roles are low overall in Ethiopia, men in Sidama WE-RISE communities claim that women are increasingly leading VSLA collectives. Male participants in one FGD recognized the growing number of women holding management positions in government and NGOs – SOS Sahel and CARE are admirable examples of this phenomena – and understand this as resulting from improvements in education for women and commitment of the government and NGOs to women’s rights and priorities.
Table 25. Women’s participation and leadership in groups.
Indicator Malawi Tanzania Ethiopia
BL EL BL EL BL EL OC 2.4: % women participating in formal and informal groups
All households 97.3 99.8* 95.7 96.9 96.0 89.1* Female HHHs 95.6 100.0* 93.7 96.8 95.6 86.8* Male HHHs 97.7 99.8* 96.4 96.9 96.3 90.6*
OC 2.5: % women holding leadership positions in formal and informal groups All households 50.6 67.3* 39.4 45.8* 16.1 17.8
Female HHHs 53.0 66.7* 32.4 48.0* 15.4 15.8 Male HHHs 50.0 67.5* 41.8 44.8 16.7 19.0
*Statistically different at least at the 10% level. In Tanzania, FGD participants suggested that women hold most leadership positions in collectives, in large part, because the majority of group members are women. Results in Table 25 do not suggest as rosy a picture for women in leadership roles. Although women are recognized as capable leaders within their gender-normative positions and within women’s groups, men still dominate in leadership positions outside of those areas. More women are represented on village development committees than before, and are reportedly active contributors, though few are leaders of those committees. There is evidence that female WE-RISE participants are making inroads into traditionally male leadership positions by running for elective office and other prominent positions; in many areas, this is the first time that a woman has stood for a local political office. Women are considered more trustworthy, active, hardworking and good at group decision-making. They also attributed the WE-RISE project for promoting leadership opportunities for women, stating that there were no groups empowering women in leadership prior to the project. Overall, female WE-RISE participants felt that men now listen more to women’s input into group discussions and have more respect for their decisions.
Similar perceptions were reported in Malawi. That is, more women are now in leadership positions than in past years, but for the most part, are primarily recognized as capable leaders in their gender-normative sectors (e.g., school committees) or in gender-normative positions such as secretary or treasurer. Women also face a different set of criteria than men for determining leadership capacity. For

41 | P a g e WE-RISE Global Report – DRAFT
April 18, 2016
example, a woman must not be “argumentative”, and if considered for treasurer in a VSLA, she must have enough resources to pay back a loan if she misuses the money.
3.8.3 Women’s Self-confidence Women’s ability, confidence, and comfort in speaking up in public and participating in community affairs about issues of importance to them, including women’s rights, are also important indications of achievement for Change Outcome 2. To better understand women’s potential for leadership and influence in their communities, men and women were asked about their comfort level in speaking up on three topics and whether they have expressed their opinion in a public meeting (other than VSLA or producer group meetings) any time in the 12 months prior to the survey. Those who respond positively to three of the four questions are considered to have achieved the CARE WE-RISE outcome indicator: % respondents confident in speaking about gender and other community issues at the local level.
For the most part, WE-RISE project participants of both sexes have fairly high voice and agency regarding community affairs, with at least two-thirds of female participants and more than 85% of male participants across all three countries (Table 26). In particular, project participants in Malawi made great strides toward confidence in speaking publicly regarding community affairs.
Table 26. Expressing opinions in community affairs.
Indicator Malawi Tanzania Ethiopia
BL EL BL EL BL EL OC 2.6: % respondents confident speaking in public about gender and other community issues at the local level
Female respondents 45.4 74.1* 60.8 60.3 82.6 70.8* Male respondents 67.9 85.5* 91.3 91.8 93.4 87.6*
*Statistically different at least at the 10% level. That speaking publicly about issues affecting the entire community remains the purview of men is confirmed by qualitative insights. In Ethiopia, women FGD participants reported they occasionally speak up in public forums concerning important issues facing their lives and community, but prefer speaking in smaller groups composed of women when discussing community issues.
In Tanzania, many women acknowledged that they are neither comfortable nor encouraged to speak in community forums. Some women cited their lack of education for their reluctance to speak up. Cultural norms around men as the head of household who makes all important decisions also discourages some women from speaking up, particularly if they have a contradictory view, as this might be perceived by their husbands or other community members as not showing proper deference to their husbands.
3.9 Outcome 3: Gender Equitable Environment Under the WE-RISE project, Change Outcome 3 activities and interventions are designed such that “Cultural and social norms and attitudes better support the individual and collective aspirations and improved opportunities for CFIRW.” The central features of Change Outcome 3 are to use the VSLA as an entry point for women to discuss gender equality issues, and to influence cultural-social norms, such that women more actively participate in decision-making. Each WE-RISE country programme utilized local models for promoting gender roles and supporting women’s empowerment. This includes the

42 | P a g e WE-RISE Global Report – DRAFT
April 18, 2016
piloting of the Male Champion (motivators) clubs in Malawi and Tanzania, and the Social Action and Analysis (SAA) approach in Ethiopia, to model exemplary gender roles and support women’s empowerment efforts in communities.
To determine if there have been changes to cultural and social norms, the surveys measured women’s control of household and agricultural income and expenditures; 15 women’s control of household assets16; women’s decision-making related to health care and reproductive health; attitudes that support gender-equitable roles in family life, attitudes that reject gender-based household violence, and finally, women’s freedom of mobility.
3.9.1 Women’s Control of Income, Expenditures, and Assets Women participants in all three WE-RISE country programmes made significant improvements in decision-making influence regarding household income and expenditures, most of which resulted from increased decision-making control for women in male-headed households (Table 27). Most women also have more control over household assets in Malawi and Tanzania, and again, this is primarily due to greater control for women in male-headed households.
In Ethiopia, fewer women have sole or joint decision-making and control over household assets than at baseline. This may be due, in part to the heavy burdens female-headed households continue to face in juggling farming and household chores. Women without husbands are vulnerable to the approaches of men, including relatives of deceased husbands, who may already be married and have designs on a woman’s farm.
Table 27. Women’s decision-making and control over household income, expenditures, and assets.
Indicator Malawi Tanzania Ethiopia
BL EL BL EL BL EL OC 3.1: % women with sole or joint control over household income and expenditures
All households 50.6 59.5* 53.8 80.4* 54.5 70.2* Female HHHs 80.5 72.1* 88.4 98.4* 84.3 76.5 Male HHHs 42.4 54.2* 41.6 72.6* 32.4 66.2*
OC 3.2: % women with sole or joint decision-making and control over household assets All households 64.8 75.7* 54.8 83.7* 73.0 58.8*
Female HHHs 87.1 83.1 81.2 96.2* 79.5 61.2* Male HHHs 58.8 72.6* 45.6 78.3* 68.6 57.3*
*Statistically different at least at the 10% level. Across all three countries, men are primarily considered the head of the household and as such maintain control of household decisions and assets. However, most FGD participants across the programmes acknowledged some degree of improvement over the last four years. In Tanzania, women indicated they generally retain control over income that they earn, even though men retain ultimate decision-making 15 Women’s control of income and expenditures is defined as women who have input into most or all decisions relative to a household or agricultural domain AND who have input into most or all decisions regarding the use of income from the activity (if it is an income-generating activity). 16 Women’s control of household assets is defined as women who state they are a sole or joint decision maker regarding the sale or purchase of various household and agricultural assets.

43 | P a g e WE-RISE Global Report – DRAFT
April 18, 2016
control within the household, especially for the most important decisions (e.g., what crops to plant, what inputs to purchase, how to use household income). In Malawi, FGDs reveal that men still have more control of household income and how it is spent, but change is slowly happening. Some men now listen to women’s input on household decisions, including the most important ones. Focus group participants credit WE-RISE-supported community discussions on gender relations as one contributing factor to this change.
Patriarchal attitudes and religion still create barriers to greater gender equity inside and outside of the home. Cultural or religious norms regarding marriage and education for women, as well as her ability to move freely within and outside of her community, restrict women’s engagement in and influence over household and community life. Such longstanding and ingrained attitudes among men, women, and institutions will take time to change.
3.9.2 Women’s Control of Health Care and Reproductive Decisions Nearly all women are the sole or joint decision maker for reproductive health decisions, including on family planning and spacing of children, in all three countries (Table 28). Since the baseline, more women in all three countries are involved in decision-making regarding their reproductive health, with all of this increase occurring for women in male-headed households. Results are more mixed – and lower overall – for women’s control over health care decisions. In Malawi, women in female-headed households actually have less control of these decisions than they did at baseline. In both Tanzania and Ethiopia, improvements in women’s control over health care decisions can be explained primarily by gains by women in male-headed households.
Table 28. Women’s decision-making and control over health care and reproductive health.
Indicator Malawi Tanzania Ethiopia BL EL BL EL BL EL
OC 3.3: % women reporting sole or joint decision-making over reproductive health decisionsǂ All households 90.5 93.9* 91.9 97.4* 90.3 93.9*
Female HHHs 96.9 97.0 98.4 100.0 94.5 93.8 Male HHHs 89.6 93.0* 90.7 96.8* 87.2 94.1*
OC 3.4: % women making sole or joint decisions about health care All households 87.4 86.3 85.2 94.6* 82.7 90.5*
Female HHHs 98.0 90.1* 96.0 98.3 95.5 93.0 Male HHHs 84.5 84.7 81.5 93.0* 72.9 88.9*
*Statistically different at least at the 10% level. ǂ Including family planning and spacing of children.
Qualitative discussions in each country confirm that most men and women alike consider family planning to be one of the most important decisions made by a household, and in large part should be made jointly. In Ethiopia, advocacy and support for family planning (from CARE, SOS Sahel, and the Ministry of Health), the growing recognition of the decreasing size of heritable land, and the presence and support of local health posts and centres have contributed to helping bring about changes in attitudes regarding joint decision-making for family planning. Although joint decision-making is common

44 | P a g e WE-RISE Global Report – DRAFT
April 18, 2016
when it comes to family planning and health care in Tanzania, the man still makes these decisions – sometimes without input from his wife – in more traditional households (and polygamous households).
3.9.3 Gender Equity in Family Life To determine whether there has been any change in men’s and women’s attitudes toward gender-equality, male and female respondents were asked questions about their attitudes, perceptions, and practices related to gender roles, household violence,17 and women’s mobility. Respondents were asked whether they agreed or disagreed with four statements that reflect men and women’s roles in family life. Responding to three of the four questions in a manner that supports gender-equity provides a positive attitude expression for the measurements underlying gender-equal attitudes.
Small but significant progress was reported in terms of men and women’s attitudes that support gender-equitable roles in family life (Table 29). More females now support such attitudes in Malawi and Tanzania, as well as more males in Tanzania and Ethiopia. However, the percentages of males and females that support gender-equity within the household are quite low overall in both Malawi and Tanzania. For the most part, patriarchal attitudes about family life still dominate the attitudes of both men and women across the WE-RISE countries, though progress is slowly being made. In Ethiopia, small changes were noted, such as men walking side-by-side with women, and men permitting women space to speak in public fora. However, men also noted they could be shamed by the community for taking on work and roles traditionally assumed by women.
Such attitudes underscore the importance of the WE-RISE approach of working with both men and women on gender issues to create better understanding by them both that women’s empowerment does not mean that a woman should dominate within the household, thereby disempowering the male. Rather, empowering women opens a path to greater sharing of responsibility for the home and can strengthen, rather than weaken, the relationship between a husband and wife.
Table 29. Perceptions of gender and gender-based violence.
Indicator Malawi Tanzania Ethiopia
BL EL BL EL BL EL OC 3.5: % respondents expressing attitudes that support gender-equitable roles in family life
Female respondents 37.2 44.2* 24.4 34.0* 74.9 68.7* Male respondents 41.8 40.4 16.1 34.0* 57.3 60.6*
OC 3.6: % respondents expressing attitudes that reject household gender-based violence Female respondents 71.9 74.8 33.6 83.7* 34.5 54.7* Male respondents 78.6 71.7* 21.5 87.6* 36.7 51.7*
*Statistically different at least at the 10% level. It is important to note that women’s attitudes do not differ radically from men’s, reinforcing – and enabling – men’s dominance in family life. In Tanzania, female FGD participants indicated that it is not
17 Male and female respondents were asked to agree or disagree with two statements: 1) There are times women deserve to be hit, and; 2) a women should tolerate violence in order to maintain stability in the family. For this study, disagreeing with both qualifies as a rejection of household gender-based violence and serves as the underlying measurement for the outcome indicator.
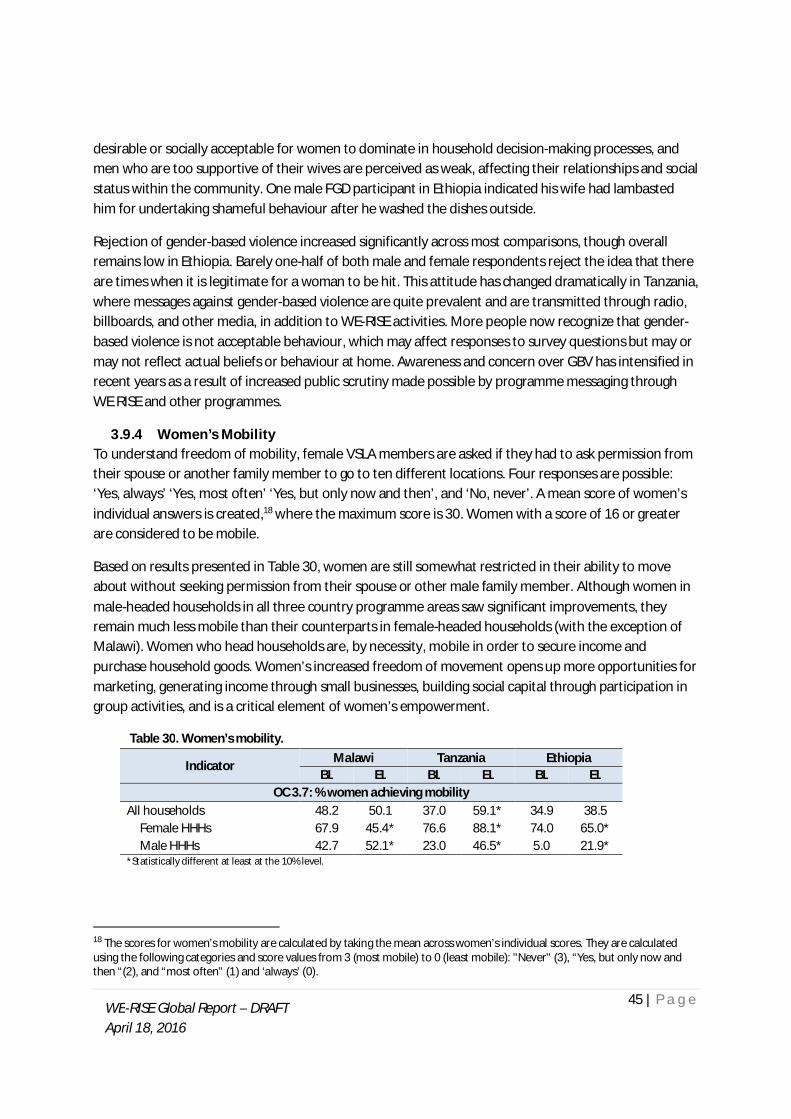
45 | P a g e WE-RISE Global Report – DRAFT
April 18, 2016
desirable or socially acceptable for women to dominate in household decision-making processes, and men who are too supportive of their wives are perceived as weak, affecting their relationships and social status within the community. One male FGD participant in Ethiopia indicated his wife had lambasted him for undertaking shameful behaviour after he washed the dishes outside.
Rejection of gender-based violence increased significantly across most comparisons, though overall remains low in Ethiopia. Barely one-half of both male and female respondents reject the idea that there are times when it is legitimate for a woman to be hit. This attitude has changed dramatically in Tanzania, where messages against gender-based violence are quite prevalent and are transmitted through radio, billboards, and other media, in addition to WE-RISE activities. More people now recognize that gender-based violence is not acceptable behaviour, which may affect responses to survey questions but may or may not reflect actual beliefs or behaviour at home. Awareness and concern over GBV has intensified in recent years as a result of increased public scrutiny made possible by programme messaging through WE RISE and other programmes.
3.9.4 Women’s Mobility To understand freedom of mobility, female VSLA members are asked if they had to ask permission from their spouse or another family member to go to ten different locations. Four responses are possible: ‘Yes, always’ ‘Yes, most often’ ‘Yes, but only now and then’, and ‘No, never’. A mean score of women’s individual answers is created,18 where the maximum score is 30. Women with a score of 16 or greater are considered to be mobile.
Based on results presented in Table 30, women are still somewhat restricted in their ability to move about without seeking permission from their spouse or other male family member. Although women in male-headed households in all three country programme areas saw significant improvements, they remain much less mobile than their counterparts in female-headed households (with the exception of Malawi). Women who head households are, by necessity, mobile in order to secure income and purchase household goods. Women’s increased freedom of movement opens up more opportunities for marketing, generating income through small businesses, building social capital through participation in group activities, and is a critical element of women’s empowerment.
Table 30. Women’s mobility.
Indicator Malawi Tanzania Ethiopia BL EL BL EL BL EL
OC 3.7: % women achieving mobility All households 48.2 50.1 37.0 59.1* 34.9 38.5
Female HHHs 67.9 45.4* 76.6 88.1* 74.0 65.0* Male HHHs 42.7 52.1* 23.0 46.5* 5.0 21.9*
*Statistically different at least at the 10% level.
18 The scores for women’s mobility are calculated by taking the mean across women’s individual scores. They are calculated using the following categories and score values from 3 (most mobile) to 0 (least mobile): "Never" (3), “Yes, but only now and then “(2), and “most often” (1) and ‘always’ (0).

46 | P a g e WE-RISE Global Report – DRAFT
April 18, 2016
Sociocultural norms continue to constrain women’s freedom of movement across the WE-RISE country programmes. Women’s mobility is a sensitive issue, as men fear losing control and being perceived as weak within their communities and social networks. Qualitative evidence confirmed that sociocultural norms continue to constrain women’s freedom of movement. There was wide consensus among all FGD participants that women are still required to seek men’s approval in order to venture outside of their communities – and sometimes their homes – during the day and to go anywhere at night. Women who venture beyond their regular routines of mobility – such as neighbour’s homes, churches and markets – may find themselves suspected of extramarital affairs. Some women also fear gender-based violence, especially after dusk.
One explanation offered for the reduction in women achieving mobility in Malawi centres on enumerator confusion regarding the question. Despite repeated explanations that the question was designed to ask, “do you need to ask permission to go to [location]”, enumerators continued to ask respondents if the woman “notified her husband” before going to a location. Notification is quite different from seeking permission.
4 PROJECT MANAGEMENT WE-RISE is a multi-country project that seeks to make technical improvements to agricultural production and marketing while promoting fundamental attitudinal and behaviour change about women’s roles and their rights in what are for the most part traditionally conservative and somewhat patriarchal societies in Malawi, Tanzania, and Ethiopia. This section presents findings regarding project staffing, partnerships, M&E, and exit strategies for each country project.
4.1 Staffing
Malawi
By design, the WE-RISE project is a complex and comprehensive effort. Objectives rely on technical skills that were new areas for many CARE staff (e.g., gender equity and value chain development). Project personnel are highly committed to the project objectives and many have been with the project since its inception. They are technically and professionally competent in most general implementation areas. M&E, value-chain development, and gender are areas where technical capacity could be strengthened.
The WE-RISE project in Malawi requires a large number of outputs in order for the project to reach its comprehensive objectives. Collectively, the outputs put forth in the project design require a much larger staff than the project has ever enjoyed. Due to a limited budget, a small field staff implemented WE-RISE; two field advisors and one field supervisor were present in each of the two traditional authorities (TA) in 2014. By the endline in 2015 – one year before the project was due to end – staff had been reduced to one field advisor in Kalumbu TA and two field advisors in Chiwere TA. Understaffing is one of
47 | P a g e WE-RISE Global Report – DRAFT
April 18, 2016
the primary reasons several initiatives have not had optimal success, and is severely undermining the project during the phase-out stage.19
To mitigate this challenge, the Project Manager and M&E advisor made admirable attempts to directly support implementation teams. WE-RISE field staff made commendable efforts to engage many volunteer trainers as the vast majority of project implementation rests on the efforts of volunteers. However, heavy reliance on volunteers does not mean the project can be successfully implemented with few staff. Although volunteers appear to be highly dedicated individuals, the quality of their efforts may waver for any number of project-related or personal reasons. Volunteers require ample training, engagement with, and follow-up from project staff. It is currently physically impossible for existing WE-RISE staff to adequately cover each and every group village head administrative district.
Tanzania
WE-RISE Tanzania has many dedicated and skilled staff, but has suffered from turnover at the project management level. Staff retention, especially in more remote areas like Mtwara and Lindi, is a challenge for many organizations in Tanzania. CARE staff and local government stakeholders identify management changes as the biggest obstacle to slowing the achievement of project goals. There have been four Program Coordinators between 2012 and 2015, with a fifth in charge at the end of 2015. The quality of these individual managers has varied greatly, and implementation was further complicated by the departure of many CARE Mtwara staff in October 2014. The frequent change of managers and of management style has been confusing for the team and has affected performance, impeding planning and slowing implementation. The manager in place at the time of the endline was very effective and was focusing on addressing project goals in a timely and efficient manner. She received positive reviews by staff, partners and government stakeholders. However, she has since departed and another new Project Coordinator is in place.
While WE-RISE has achieved significant gains in many areas despite multiple changes in management, the lack of planning and direction in its early stages indicates that the project would have achieved much greater success in transforming the economic, social and behavioural conditions of its participants if it had consistent and qualified managers throughout.
Ethiopia
After significant changes to management and staffing after the mid-term evaluation, both CARE and SOS Sahel have been well managed and staffed. The SOS Sahel office is managed and staffed by a young, energetic team – nobody remains from the early days of WE-RISE – that has completely overcome the problem of staff morale plaguing the office and affecting programming effectiveness early on. The SOS-Sahel WE-RISE office consists of a Team Leader who supervises the M&E Officer, a Gender Officer, and the Agriculture and Value Chain Expert, who replaced the Marketing and Business Officer, a position that was no longer necessary because it did not fit the WE-RISE programme model or strategy. CARE’s
19 The Malawi evaluation team notes that senior management strongly disagrees with this statement.

48 | P a g e WE-RISE Global Report – DRAFT
April 18, 2016
Food Security Program Manager (FSPM), based in Addis, manages WE-RISE, spending approximately one week a month in Hawassa and Sidama to work with SOS Sahel and the CARE Hawassa office. The SOS Sahel team also includes six field officers (FOs) based at the woreda level – two in each woreda.
CARE and SOS Sahel have enjoyed much more fruitful collaboration following the midterm. The relationship is now transparent and an example of how NGOs and other organizations can partner together to achieve something. More than one SOS staff member told the evaluation team: “Worku (CARE’s FSM, based in Addis) belongs to the SOS staff.” All SOS KI participants echoed his importance as a mentor, advisor, and WE-RISE father figure in terms of their growth within the WE-RISE team. CARE PQL – Program Quality and Learning – team members provided training on a variety of subjects to SOS Sahel staff, including the VSLA approach (the most highly ranked training sessions), the SAA approach, role modelling and best practices, and the community scorecard. There has been some collaboration with USAID’s GRAD project, though there could be more. For example, could GRAD-based households producing honey utilize the Honey Producers Cooperative? SOS staff learned some processing and value chain skills for applying to WE-RISE efforts to strengthen their Processing Cooperatives. GRAD staff learned about the WE-RISE SAA experience. SOS has occasionally collaborated with CARE Sidama: “We occasionally see the GRAD M&E officer, Mesfin.” All KIs commented that the input of the Sidama M&E office has been negligible.
WE-RISE remains understaffed at the field staff level. There are currently six Field Officers covering 26 kebeles in the project area. Field staff complained of difficulties overseeing VSLA, RUSACCO, SAA, MFI, Processing Groups, and other activities in all of the kebeles at the present time. Given problems with transportation and access to kebeles, WE-RISE should appoint one Field Officer to cover three kebeles.
4.2 Partnerships
Malawi
A highlight of the midterm review was the estimable coordination and collaboration that existed between CARE Malawi and their implementing partner Mponela Aids Information and Counselling Centre (MAICC). The teams’ synchronized work made it difficult to determine who worked for CARE and who worked for MAICC, underscoring the strong and venerable relationship. Sadly, at endline the relationship was severely stressed due to untimely resource distribution and misunderstandings regarding the reasons for delayed payments to MAICC. CARE Australia is aware of these problems and reportedly took measures to remedy them quickly, so the issue is not explored in detail at the endline. However, it is clear that the inability to purchase fuel and pay for communications has reduced the admirable field presence of the small MAICC staff, and has stifled their spirit. Both organizations appear to still be learning from each other and offering each other complementary technical backstopping and quality assurance, which is an exemplary example of good partnership practice.
Tanzania
49 | P a g e WE-RISE Global Report – DRAFT
April 18, 2016
The project has developed strong partnerships, especially with District Agricultural Departments, and with private partners such as the Aga Khan Foundation (AKF), the Paralegal Centre in Mtwara, Naliendele Agricultural Research Institute (NARI), and with MEDA on cassava seed production.
CARE Tanzania included most key actors in WE-RISE during the design stage, including the district agriculture and livestock officers, NARI, community representatives, extension officers, AKF, and Technoserve. This has helped ensure buy-in and familiarity with the project’s approach and goals by key stakeholders, and established positive working relationships that have helped the project navigate some of its implementation challenges.
Relations with a key partner, the District Commissioner and the district agricultural staff, are good and WE-RISE has established a strong working relationship with WEOs and district agricultural officials. At endline, the Program Coordinator had worked to ensure timely communication and implementation, which is appreciated by District Agriculture Department staff. CARE staff experienced some challenges with the department because WE-RISE did not channel its resources through the department, as other projects have done, but both sides report that cooperation has improved as the project has shown results. WE-RISE management felt that it could have made a more deliberate effort to involve government from the beginning; under current management CARE has made efforts to improve communications and to keep government informed of its activities.
Challenges with partners have arisen that were not anticipated during the design stage, which also slowed implementation. The main technical partner involved with the design, Technoserve, left the project early due to differences in approach on cost and budget issues. Initially, WE-RISE intended to use VSLA groups formed by AKF, which would have allowed CARE to focus on its key technical areas, though this turned out not to be possible. Issues between CARE and AKF regarding VSLAs were eventually resolved; CARE has continued to both work with AKF VSLAs and to form new VSLAs, partly due to donor requirements and partly to ensure that the project is reaching its target population of poor female farmers. While program directors think that working with existing groups is a good strategy, implementation would have been greatly facilitated if CARE had been able to work with groups that it had already established and were fully functional prior to the project.
WE-RISE partnered with NARI at the beginning of the project to ensure that participants had access to improved high-quality seed, which is in high demand and sometimes short supply. WE-RISE partnered informally with MEDA, who works directly with cassava seed producers. MEDA has trained WEOs working with CARE and provides technical advice on cassava production and marketing to WE-RISE. At the time of the endline, CARE had partnered with Mohamed Enterprises, one of the largest purchasers of local produce, including sesame. An attempt to evolve the Gender and Learning Alliance from a regional to a national level was less successful due to lack of agreement around management and funding responsibilities.
WE-RISE has had some strategic influence on other CARE Tanzania programs, according to program management. In particular, the greater understanding of gender issues in Mtwara and Lindi districts is informing project design in southern Tanzania, as well as the selection of locations and partners.

50 | P a g e WE-RISE Global Report – DRAFT
April 18, 2016
Ethiopia
The collaborative partnership between SOS Sahel and GoE offices at the woreda and zone levels constitutes one of the major strengths of the WE-RISE project in Ethiopia. SOS Sahel has managed to sustain an excellent working relationship with each of the three woreda technical teams in Loka Abaya, Dale, and Shebedino, as well as the Sidama zone office based in Hawassa. The woreda teams have worked diligently with SOS Sahel field staff to support the project by providing relevant technical expertise, capacity building through training exercises, and collaborative targeting exercises with the kebeles. Such collaboration fosters project sustainability post-WE-RISE. In fact, the collaboration is so strong that some woreda managers question the motives of technical team members in spending such inordinate amounts of their time working with SOS Sahel on WE-RISE activities. The zone and woreda teams ranked their partnership with SOS Sahel and CARE to be the most satisfying of all the NGOs operating in Sidama for these reasons:
Clearly defined project activities; Clearly delineated roles and responsibilities in collaborative efforts; Meeting field staff often to generate solutions to project problems; Maintaining close working relationships; Transparency in sharing resource and activity information, including quarterly budgets; Heightened consciousness and awareness of issues affecting women, especially GBV; Appropriate and effective training regimens; WE RISE explicitly targets women; VSLA participation is slowly changing household division of labour; and The impact of WE RISE activities on the participating households and communities.
Zone office representatives as well as woreda technical teams commended WE-RISE and SOS Sahel for devising their programme strategy to coincide with the GoE Transformation Plan and woreda development plans.
Through WE-RISE, SOS Sahel and CARE have maintained excellent working relationships with all of the offices at the zone and woreda levels. However, the woreda-level Women’s Affairs Offices remain woefully underutilized, under-budgeted, weak, and floundering. They need enhanced support to be able to fulfil their mandate, support programming efforts like WE-RISE to promote women’s empowerment within highly patriarchal social, economic and cultural contexts, and to sustain such programme approaches. The Sidama Microfinance Institution (SMFI) office remains the most difficult office in Sidama Zone with which to partner. The MFI strategy is currently far too rigid and unaccommodating to the credit needs of the types of clients – poor vulnerable households including female-headed households who even lack access to land, as well as collectives such as Production, Processing or Marketing Groups in need of capital to invest and expand their small businesses – to offer a fulfilling partnership.

51 | P a g e WE-RISE Global Report – DRAFT
April 18, 2016
4.3 M&E
Malawi
Cohort studies are a highlight of WE-RISE M&E efforts. The in-depth studies, which explore the progress of ten women over the course of three years, are the brainchild of CARE Australia. They were implemented in each WE-RISE country and consisted of survey-style questions drawn from the empowerment modules, combined with immediate qualitative probing, that allowed more insight to the survey responses. While the findings from the cohort studies are anecdotal and cannot be applied across the project, the exercise served to strengthen qualitative skills of WE-RISE staff, helped staff reflect on the factors that contribute to or prevent women’s empowerment, and contributed to global learning about empowerment metrics and evaluation design.
Aside from the cohort studies, monitoring and evaluation continues to be the weakest link in the WE-RISE project.
Performance targets: At midterm there were no targets set for impact and outcome indicators in the global M&E framework, an essential step to defining achievement at endline and ensuring accountability to the program intent and donors. The project has since set targets, but with apparently little understanding of how to set these targets. In some cases the direction of change is inaccurate—a higher target is set when the project should be aiming for a lower value at endline (CSI) or a lower value is set when the project should be aiming for a higher value (expenditures). In other cases, the targets are absurdly low. To those not close to the project, such low targets would suggest WE-RISE has little motivation to catalyse change or that WE-RISE does not believe it can catalyse much change. Based on interviews with devoted staff, neither situation is accurate; in contrast, the staff have high motivation to initiate positive change in the lives of beneficiaries, and are very optimistic about the level of success they can achieve. This situation highlights the importance of having staff on board who have the M&E capacity to rationalize and set appropriate targets.
Examples of the extremely low targets follow:
Target for women’s mean net income from agriculture is set to 1 USD higher than baseline; for women in male-headed households, the end of project target is set lower than baseline.
Target for “increased access to extension services” is set only 12% higher than baseline to 40%, yet it would be impossible to achieve Outcome 1 or the overall project goal, without a very high rate of achievement for this indicator.
Target for “increased access to inputs” is set only 12% higher than baseline—similar to above, the design theory purports that success of the higher level goals rest heavily on improved access to inputs.
Targets for women’s access to and control over loans for income-generation were set only two percentage points higher than baseline for female-headed households and sex percentage

52 | P a g e WE-RISE Global Report – DRAFT
April 18, 2016
points higher than baseline for male-headed households. This makes no sense at all–loans for IGA are a foundation of the project design.
As noted at midterm, it is difficult to see the relationship between a number of outputs and indicators, and the Change Outcomes they purportedly contribute to. For example, activities and outputs that would logically lead to the improved linkages the project strives for in Outcome 2, are actually conducted under Outcome 1. When causal logic is flawed in this way, it makes it difficult to use the project M&E framework to determine effective sequencing of project activities, to help staff see what is changing and why, or to pinpoint factors that might be impeding change. The M&E framework simply becomes a tracking system for accountability rather than a tool that can shed light on effective implementation and reflective learning.
Ethiopia
Technical team members regularly accompany WE-RISE field officers and the M&E officer to project sites – two of the eight or nine kebeles in the woreda – to conduct joint monitoring by visiting project participants, discussing issues and problems, monitoring progress, and adopting the community scorecard format prepared by the WE-RISE M&E team. CARE initially trained SOS Sahel M&E and field staff on the application of community scorecards to process and outcome monitoring. Different types of stakeholders, including service providers and project participants, provide input into the scorecard grading process. A feedback process culminates in an Action Plan. The team returns to their offices to discuss lessons learned and devise strategies relating to WE-RISE activities. The CARE and SOS Sahel monitoring approach also includes quarterly reviews that try to involve higher-level woreda officials, and finally annual reviews that may involve regional officials as well as woreda and zone offices in collaboration with CARE and SOS Sahel to review progress and devise adjustments and modifications to project approaches, if needed. The biggest issue to daunt these joint exercises remains the payment of per diem for government staff. Government offices are also plagued by high rates of turnover.
4.4 Exit Strategy
Tanzania
WE-RISE activities are in line with the District Agriculture Department’s priorities for farmers. The project has good cooperation with government but operated largely independently. The proposed integration with government, and thus the longer-term sustainability of project activities, has not realistically taken local government resources and constraints into account. For example, a key strategy in sustainability is to integrate the community paraprofessionals, who are responsible for organizing and training participants, into the District Agriculture Department. The department is supportive of the idea but lacks the financial resources to absorb the paraprofessionals, even though it recognizes the benefits of doing so.
The project design assumed that with increased income, people would be willing to buy the services of the paraprofessionals, but that had not been tested by endline. This requires that paraprofessionals have continuing access to additional training and new knowledge and skills to share with people.

53 | P a g e WE-RISE Global Report – DRAFT
April 18, 2016
Community members value paraprofessionals but it remains to be seen if community financial support is a viable option. The loss of the paraprofessionals would be a loss to female farmers as government agricultural strategies tend to be gender-blind. Local agricultural officials stated that they appreciate the emphasis on women in agriculture, but do not have the capacity for it in their own programs. Strengthening market linkages and value-added processing is another strategy that can support CARE’s exit and help ensure sustainability.
In short, the project needs a detailed exit strategy that can focus on strengthening existing linkages between participant needs, private sector interests, and government service providers.
5 CONCLUSIONS Four years into WE-RISE, CARE and its implementing partners in Malawi, Tanzania, and Ethiopia have made great achievements toward the goal: “Improved Food Security, Income, and Resilience for Chronically Food Insecure Rural Women through their social and economic empowerment.” Designed, developed, and implemented within highly patriarchal social-cultural contexts where women’s access to and control over productive assets and resources are restricted, WE-RISE has successfully – if not modestly in some instances – shown real progress toward attaining the simultaneous empowerment of women economically and socially, and within a relatively short period of time, given the fundamental social changes it seeks to encourage.
WE-RISE is a complex and ambitious undertaking that uses a value chain approach embedded in women’s empowerment to overcome economic and social barriers to food security, institutional inclusion, and gender equity in households and communities. In Malawi, WE-RISE improved access to services and has influenced women’s control of productive assets and resources. Households appear more resilient to shocks than at the baseline. Positive changes in women’s empowerment have occurred, specifically within the domains of resources, income, and leadership/community. Both female and male WE-RISE participants overwhelming believe their household is better off after participating in WE-RISE activities.
In Tanzania, WE-RISE participants have diversified their income sources and greatly improved income from all sources. Women have greater access to income and services and have expanded their control over productive assets and resources. Households are more resilient to shocks. WE-RISE is making significant contributions to women’s empowerment especially within the domains of resources, income, and autonomy, and to some degree within the production domain. Women show great progress in expressing self-confidence in the leadership and community domain.
In Ethiopia, WE-RISE households have increased their household productive assets and resources; women have more control over household assets and resources; and are substantially more resilient to climate and other shocks than they were four years earlier. WE-RISE VSLA participating members have increased their skills, knowledge, and confidence, thereby improving participating women’s agency (Change Outcome 1).

54 | P a g e WE-RISE Global Report – DRAFT
April 18, 2016
There is some evidence that WE-RISE is facilitating a process whereby formal and informal institutions are becoming more responsive to women’s priorities and accountable for upholding their rights (Change Outcome 2). Participation in – and leadership of – VSLAs is slowly altering women’s structural involvement and engagement in community affairs, thereby affecting structural relations and patterns. As a result of more women holding leadership positions within a successful VSLA or other group, men are paying more attention to women’s decisions. Moreover, even the contributions of women group members – who are not leaders – are being listened to. More women are represented on village development committees than before, and are active contributors, though few as yet are leaders of those committees. Although the trend is still for male household heads to continue controlling the most important household resources and assets, as well as having final decision-making power, the changes resulting from WE-RISE activities are slowly shifting the structures that influence women’s choices.
Change Outcome 3 addresses the cultural and social norms and attitudes that support the individual and collective aspirations and opportunities for CFIRW. The WE-RISE programme has made significant contributions in the protracted struggle to overcome and alter the patriarchal structures, agency, and social relations that restrict CFIRW. WE-RISE participants have achieved significant gains in women’s empowerment across a number of areas including gender-equitable decision-making in the household (including on production), control over income and expenditures, and access to productive resources.
WE-RISE’s inclusion of men in gender sensitisation activities is a real strength of the project; they more readily appreciate that women’s empowerment benefits them not merely financially but through a stronger partnership and greater harmony in the home. In Malawi, there is a strong link between household participation in WE-RISE gender discussions and rejection of gender-based violence by both men and women. In Ethiopia, the project has contributed to increasing awareness of and a reduction in gender-based violence and harmful practices such as FGM, rape, and early marriage, thereby improving and fostering more productive relations between women and men within the household and community. Broadly, women value relationships fostered within the VSLAs in particular, citing the groups as a valuable form of social support, solidarity, and social capital.
Although the WE-RISE programme has contributed greatly to the long march toward women’s empowerment in all three countries, significant challenges remain. What remains to be seen is if the changes in behaviour, systems and policies can take hold to the extent that they bring about the fundamental and longer-term change envisioned by the project. WE-RISE activities should continue to focus attention on women’s empowerment and gender equality to promote continued change in cultural norms and ensure that women have shared decision-making power over resources along with economic progress.
Overall, programme participants overwhelming perceive that their households have improved their wellbeing after participating in WE-RISE activities. Thus, the WE-RISE programme has had a positive impact on food security, income, and resilience of CFIRW through their social and economic empowerment.
Impact on Food & Nutrition Security: WE-RISE households in Ethiopia and Malawi experienced an improvement in their food security over the course of the programme; they now consume more diverse

55 | P a g e WE-RISE Global Report – DRAFT
April 18, 2016
foods than at baseline (IM1.1). Women also now consume more diverse foods (IM1.2) in both countries. In Tanzania, both households and women, in particular, lost ground in terms of food security; they now consume a slightly less diverse palate of foods than at baseline. This may reflect the poor rainy season experienced in the south during the main growing season in 2015. On average WE-RISE households in all three countries consume foods from approximately five different types of food.
Impact on Economic Poverty Reduction: WE-RISE activities promote increasing agricultural income as well as non-agricultural income via small business activities. WE-RISE programming resulted in significant increases in availability of household income both through small business income (IM1.5) as well as through increased number of income sources (e.g., farm and off-farm income) (IM1.6). Much of this newfound income diversification is directly attributable to participation in WE-RISE activities.
As the key entry point for WE-RISE activities, VSLAs provide WE-RISE participants with an essential means for accessing credit, particularly in Ethiopia. The proportion of Ethiopian households relying on VSLAs to access credit increased dramatically between baseline and endline for women and men alike, although the average loan was not high. In Malawi and Tanzania, the vast majority of participating households were already accessing loans through VSLAs at the baseline.
Impact on Livelihoods Resilience: The Coping Strategies Index (CSI) is a powerful indicator of resilience (IM1.3), with higher index scores reflecting higher frequency of use and greater severity in type of consumption coping strategies used by a household to deal with food or income shortages (i.e., improvement is reflected in a lower CSI score). Only in Ethiopia did WE-RISE households show improvement in their ability to deal with shocks or stresses and resist engaging in harmful coping strategies. The CSI increased in both Malawi and Tanzania, where prolonged dry spells in WE-RISE operational areas caused maize and other cereal production to severely decline. Lower production, coupled with increased prices for some cereals, had a severe impact on household access to food or income in the three months prior to the endline survey.
Access to savings also reflects a level of resilience at the household level, and showed mixed results across the three programmes (IM1.8). A strong culture of savings already existed at baseline in Malawi, and was not significantly different at endline. The households that were able to save actually declined slightly in Tanzania between the two surveys. However, twice as many households in Ethiopia report saving at endline than did at the baseline, a significant improvement. Participation in VSLA activities has proven to be instrumental in accounting for this very substantial change in savings behaviour. Although the amount saved in a VSLA is often small, participation in a savings group has introduced a savings culture, which is now widely adopted by project participants. VSLA loans have allowed women to invest in small livestock and other income-generating activities, as well as pay educational expenses, purchase food, make home improvements, and cope with emergencies. VSLA group participation exposed women and men to information about earning income as well as gender equality, and opened opportunities to learn new skills, such as saving and spending wisely, and social skills such as speaking up in public.
Access to and use of assets provide households with a cushion to adjust to shortfalls in incomes, or sudden increases in necessary expenditures. Thus, households with a higher asset index (IM1.9)

56 | P a g e WE-RISE Global Report – DRAFT
April 18, 2016
indicates that households have been able to accumulate assets over time and are less vulnerable than households with lower asset index values. Improvements in the accumulation of assets occurred for WE-RISE participants in both Malawi and Ethiopia, though there was no change in asset ownership in Tanzania.
Impact on Women’s Empowerment: A Women’s Empowerment Index (WEI), including the Five Domains of Empowerment (5DE) and Gender Parity Index (GPI), was used to assess women’s empowerment in the three countries. The 5DE reflects the percentage of women who are considered empowered, based on their empowerment score. A woman who achieves an empowerment score of .80 or greater is considered to be empowered. The empowerment scores for women participants in all three WE-RISE programmes improved between baseline and endline (IM1.10).
In Ethiopia, women who participate in the WE-RISE programme have experienced a slight increase in their empowerment, but frankly continue to engender relatively low empowerment (5DE=.59), despite the introduction of a very powerful tool, the Social Analysis and Action (SAA) approach. In all countries, the percentage of women achieving empowerment also increased, though less than 20 percent of women participants in Malawi and Ethiopia achieved empowerment at the endline. In Tanzania, approximately 40 percent of women in the WE-RISE programme achieved empowerment at the endline, double that at baseline.
Overall, WE-RISE is a valuable concept and a noteworthy project. Its achievements are validated by in-depth qualitative discussions with female and male participants who confirmed that their households are financially better off and are sharing responsibilities and decision-making after participating in WE-RISE activities. This is particularly true for women, as they have gained greater control over their own resources and production, and are contributing income to their households. This in turn has increased their husband’s respect, women’s status within the household, and supported a shift to shared decision-making and greater harmony in the home.
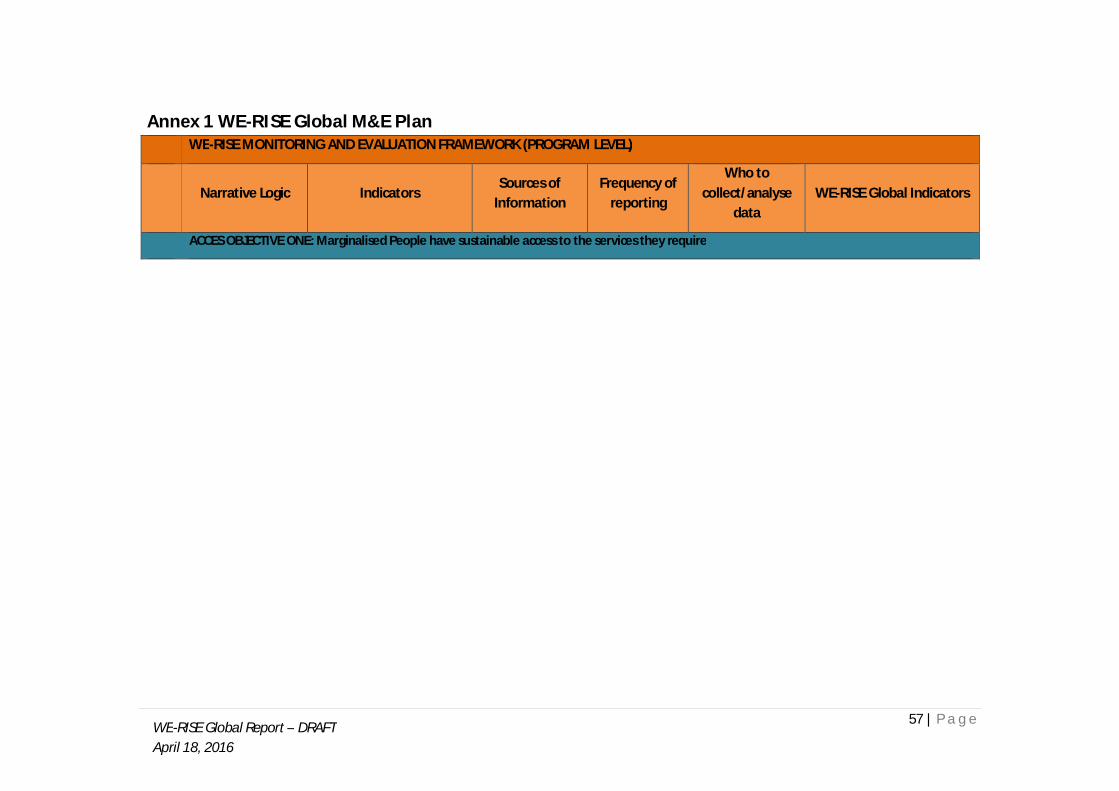
57 | P a g e WE-RISE Global Report – DRAFT
April 18, 2016
Annex 1 WE-RISE Global M&E Plan WE-RISE MONITORING AND EVALUATION FRAMEWORK (PROGRAM LEVEL)
Narrative Logic Indicators
Sources of Information
Frequency of reporting
Who to collect/analyse
data WE-RISE Global Indicators
ACCES OBJECTIVE ONE: Marginalised People have sustainable access to the services they require

58 | P a g e WE-RISE Global Report – DRAFT
April 18, 2016
IMPA
CT (
sust
aina
ble
chan
ges i
n co
nditi
ons)
WE-RISE IMPACT
Improved Food Security, Income & Resilience for Chronically Food Insecure Rural Women (CFIRW) through their social and economic empowerment
% change in months of food insecurity
% change in mean HH dietary diversity scores
% change in mean women’s dietary diversity scores
% of HH with non-agricultural income sources
% of HH with three or more different income sources
% increase in HH income
% of HH with increased incomes
% HH engaged in savings and credit groups
% of HH with savings
% average increase in savings for HH
% change in average HH asset index
Baseline data and analysis, including FGDs, KII, HH surveys
End-line data and analysis, including FGDs, KII, HH surveys
Annual cohort assessments
Routine project monitoring and progress reports, with output level data provided as markers for progress on higher level program indicators
Relevant government and market reports
Annual reflection and learning workshops
Baseline in Year 1
Quarterly and annual progress reports
Annual cohorts assessments
End-line and final evaluation – 6 months before the project end
An independent contracted consultancy (TANGO) and local firm working with the WE-RISE Program
Program Managers & Field staff;
LNGO partner staff
Local government officers
Mean household diet diversity score
Mean women’s intra-household food access
Coping strategies index Per capita monthly
household income (farm and non-farm)
% of HH with three or more different income sources
Per capita monthly household expenditures
% households with savings
Mean asset index
Women’s empowerment index

59 | P a g e WE-RISE Global Report – DRAFT
April 18, 2016
EFFE
CT (R
espo
nses
of C
FIRW
to p
roje
ct a
ctiv
ities
)
WE-RISE CHANGE OUTCOME 1
CFIRW have increased household productive assets & resources and control over these; and are more resilient to climate shocks
% change in crop yield /unit labour achieved by CFIRW for crops supported by WE-RISE
% change in crop yield/unit land achieved by CFIRW for crops supported by WE-RISE
# and type of income sources
# and type of crops grown
% of CFIRW adopting improved conservation agricultural practices in the most recent agricultural cycle
# of farmers groups (mixed and women) reporting increased capacity in technical/agricultural conservation skills
% of CFIRW adopting improved storage practices
% of CFIRW using improved livestock
Baseline data and analysis, including FGDs, KII, HH surveys
End-line data and analysis, including FGDs, KII, HH surveys
Annual cohort assessments
Routine project monitoring and progress reports, with output level data provided as markers for progress on higher level program indicators
Annual reflection and learning workshops
District Agricultural Records
VSLA records
Baseline in Year 1
Quarterly and annual progress reports
Annual cohorts assessments
End-line and final evaluation – 6 months before the project end
An independent contracted consultancy (TANGO) and local firm working with the WE-RISE Program
Program Managers & Field staff;
LNGO partner staff
Local government officers
Net income of women from agricultural production and/or related processing activities
Agricultural yield in crops supported by WE-RISE
Number of different crops grown
% women accessing output markets to sell agricultural production over the last 12 months
% women accessing agricultural inputs (seeds, fertilizers, etc.) over the last 12 months
% women with access to and control over loans for IGA
% women adopting minimum number of improved agricultural practices
% women adopting improved storage practices
% women adopting minimum number of

60 | P a g e WE-RISE Global Report – DRAFT
April 18, 2016
practices in most recent agricultural cycle
% decrease HH adopting irreversible coping strategies during food shortages & external shocks
improved livestock practices
% women adopting minimum number of value chain practices
% households adopting negative coping strategies in past 3 months
% households using adaptation strategies to reduce the impact of future shocks

61 | P a g e WE-RISE Global Report – DRAFT
April 18, 2016
WE-RISE CHANGE OUTCOME 2
Formal & informal local-level institutions are more responsive to women’s priorities & accountable to upholding their rights.
% Men and women reporting women’s meaningful participation in the public sphere (meaningful will be defined by the women themselves during the baseline FGDs – this is a perception-based indicator).
% Men and women reporting women’s ability to effectively control productive assets (perception-based indicator).
% women with access to agricultural extension services in most recent agricultural cycle
% women accessing agricultural financial services (loans, savings, crop insurance) in most recent agricultural cycle
% women satisfied with selected list of services (e.g., agricultural, health, local government)
Baseline data and analysis, including FGDs, KII, HH surveys
End-line data and analysis, including FGDs, KII, HH surveys
Annual cohort assessments
Routine project monitoring and progress reports, with output level data provided as markers for progress on higher level program indicators
Annual reflection and learning workshops
District Agricultural Records
VSLA records
Baseline in Year 1
Quarterly and annual progress reports
MTR
Annual cohorts assessments
End-line and final evaluation – 6 months before the project end
An independent contracted consultancy (TANGO) and local firm working with the WE-RISE Program
Program Managers & Field staff;
LNGO partner staff
Local government officers
% women with access to agricultural extension services in last 12 months
% women accessing agricultural financial services (loans, savings, crop insurance) in last 12 months
% women reporting satisfaction with agricultural extension services
Village/district/institutional budgets, policies, customary bylaws incorporate women’s strategic gender interests and gender equality
Women report civil society & government are responsive to their agricultural needs
% women participating in formal and informal groups
% women holding leadership positions in formal and informal groups
% respondents confident speaking about gender and

62 | P a g e WE-RISE Global Report – DRAFT
April 18, 2016
% increase in women’s representation in formal and informal institutions
% women holding leadership positions with decision-making power in membership groups and community-level institutions
% group members with demonstrated understanding of the benefits of group formation
% women and men farmers at local level comfortable and confident speaking about women’s rights
% respondents sensitized to women’s rights
% village/district budgets, policies, customary bylaws incorporating women’s strategic gender needs and gender equality
# and type of laws developed and/or reformed that promote
other community issues at the local level

63 | P a g e WE-RISE Global Report – DRAFT
April 18, 2016
women’s rights regarding land ownership, lease agreements, group membership privileges, access to common property resources, joint bank account holders, etc.

64 | P a g e WE-RISE Global Report – DRAFT
April 18, 2016
WE-RISE MONITORING AND EVALUATION FRAMEWORK (PROGRAM LEVEL)
Narrative Logic Indicators
Sources of Information
Frequency of reporting
Who to collect/analyse
data WE-RISE Global Indicators
WE-RISE CHANGE OUTCOME 3
Cultural & social norms & attitudes better support the individual and collective aspirations and improved opportunities for chronically food insecure rural women
% women reporting joint control over household income and expenditures
% women reporting joint decision-making and control over household assets
% women reporting equitable distribution of time between productive/domestic tasks
% women reporting sole or joint decision-making over reproductive health decisions (birth control; spacing of children)
% of women and men with changed attitudes toward gender-based violence.
% formal/informal groups and institutions developed or strengthened by the
Baseline data and analysis, including FGDs, KII, HH surveys
End-line data and analysis, including FGDs, KII, HH surveys
Annual cohort assessments
Routine project monitoring and progress reports, with output level data provided as markers for progress on higher level program indicators
Annual reflection and learning workshops
Baseline in Year 1
Quarterly and annual progress reports
MTR
Annual cohorts assessments
End-line and final evaluation – 6 months before the project end
An independent contracted consultancy (TANGO) and local firm working with the WE-RISE Program
Program Managers & Field staff;
LNGO partner staff
Local government officers
% women reporting joint control over household income and expenditures
% women reporting joint decision-making and control over household assets
% women reporting sole or joint decision-making over reproductive health decisions (birth control; spacing of children)
% women making sole or joint decisions about health care
% respondents expressing attitudes that support gender-equitable roles in family life
% respondents expressing attitudes that reject household gender-based violence
Women’s mobility

65 | P a g e WE-RISE Global Report – DRAFT
April 18, 2016
WE-RISE MONITORING AND EVALUATION FRAMEWORK (PROGRAM LEVEL)
Narrative Logic Indicators
Sources of Information
Frequency of reporting
Who to collect/analyse
data WE-RISE Global Indicators
projects that have developed a gender policy
Evidence of local institutions demonstrating accountability & responsiveness to women’s priorities including # community leaders (e.g., political, traditional, religious) at the local level sensitized and engaged in women’s rights
# women and men farmers at the local level sensitized and engaged on women’s rights (re: land use and other agricultural issues)
% change in social perspective of values/rights of women among leaders, among
District Agricultural Records
VSLA records
MTR
Annual cohort assessments
% of the project’s groups that have developed a gender policy

66 | P a g e WE-RISE Global Report – DRAFT
April 18, 2016
WE-RISE MONITORING AND EVALUATION FRAMEWORK (PROGRAM LEVEL)
Narrative Logic Indicators
Sources of Information
Frequency of reporting
Who to collect/analyse
data WE-RISE Global Indicators
men & boys; among women & girls
# and type of community-based sensitization/awareness-raising campaigns for women/men on gender
ACCES OBJECTIVE 2: AusAID policy and programs in Africa are strengthened particularly in their ability to target and serve the needs of marginalised people
WE-RISE CHANGE OUTCOME 4
CARE’s learning, knowledge & documentation on women’s empowerment, transforming gender norms, reducing food insecurity, and climate change resilience is strengthened such that CARE can better inform and influence
# and type of workshops/meetings based on lessons learned with relevant stakeholders
# and type of WE-RISE knowledge products influencing/taken up by AusAID policies and programs
# of ACCES peer agencies influenced by and/or applying WE-RISE knowledge products
AACES learning events
WE-RISE knowledge products and materials
AusAID external MTR & evaluation of WE-RISE Program and ACCES more broadly
End of project and an
AusAID’s external M&E specialists
CARE’s International Programs Department
# and type of WE-RISE knowledge products influencing/taken up by CARE country offices
# of partner organizations influenced by and/or applying WE-RISE knowledge products (disaggregated by institution type)
CARE and partners report improved knowledge and skills to implement and advocate for gender

67 | P a g e WE-RISE Global Report – DRAFT
April 18, 2016
WE-RISE MONITORING AND EVALUATION FRAMEWORK (PROGRAM LEVEL)
Narrative Logic Indicators
Sources of Information
Frequency of reporting
Who to collect/analyse
data WE-RISE Global Indicators
its own programs, AusAID & other key stakeholders
(disaggregated by institution type)
# relevant CARE programs/initiatives applying tools/practices/evidence generated by WE-RISE
# of CARE staff reporting improved knowledge and skills to implement and advocate for gender equality and women’s empowerment
Documented feedback from AusAID to CARE on quality of information on women’s empowerment, food security and climate change
equality and women’s empowerment
ACCES OBJECTIVE 3: Increased opportunity for the Australian Public to be informed about development issues in Africa
WE-RISE CHANGE OUTCOME 5
Learning from field experiences published in relevant sector journals and/or presented in
Evaluation tools yet to be developed for this but will be appropriate to
Throughout the lifecycle of the program in particular
AusAID’s external M&E specialists
Learning from field experiences published in relevant sector journals and/or presented in

68 | P a g e WE-RISE Global Report – DRAFT
April 18, 2016
WE-RISE MONITORING AND EVALUATION FRAMEWORK (PROGRAM LEVEL)
Narrative Logic Indicators
Sources of Information
Frequency of reporting
Who to collect/analyse
data WE-RISE Global Indicators
Positive outcomes from WE-RISE are communicated effectively to the Australian public
selected forums (local, regional, international)
#/type of communications re: positive outcomes from WE-RISE produced for targeted members of Australian public (strategy developed/implemented)
the mode of communication
during the last year
CARE’s International Programs Department
selected forums (local, regional, international)
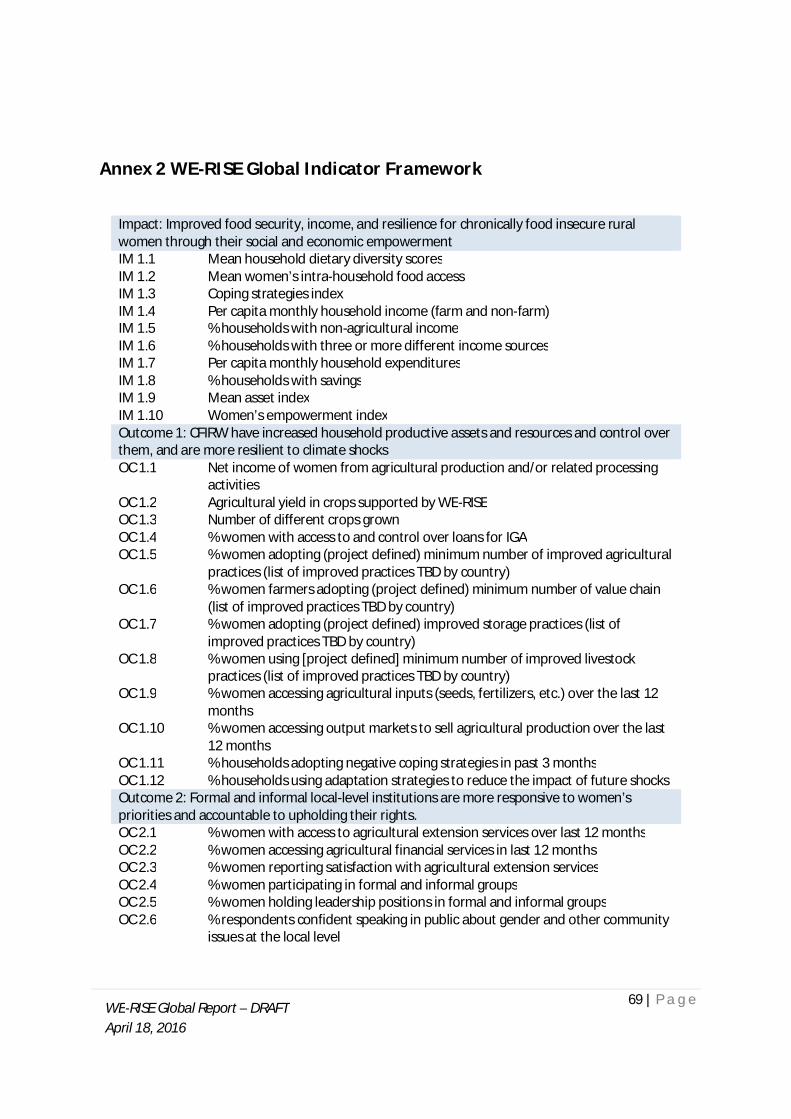
69 | P a g e WE-RISE Global Report – DRAFT
April 18, 2016
Annex 2 WE-RISE Global Indicator Framework
Impact: Improved food security, income, and resilience for chronically food insecure rural women through their social and economic empowerment
IM 1.1 Mean household dietary diversity scores IM 1.2 Mean women’s intra-household food access IM 1.3 Coping strategies index IM 1.4 Per capita monthly household income (farm and non-farm) IM 1.5 % households with non-agricultural income IM 1.6 % households with three or more different income sources IM 1.7 Per capita monthly household expenditures IM 1.8 % households with savings IM 1.9 Mean asset index IM 1.10 Women’s empowerment index
Outcome 1: CFIRW have increased household productive assets and resources and control over them, and are more resilient to climate shocks
OC 1.1 Net income of women from agricultural production and/or related processing
activities OC 1.2 Agricultural yield in crops supported by WE-RISE OC 1.3 Number of different crops grown OC 1.4 % women with access to and control over loans for IGA
OC 1.5 % women adopting (project defined) minimum number of improved agricultural
practices (list of improved practices TBD by country)
OC 1.6 % women farmers adopting (project defined) minimum number of value chain
(list of improved practices TBD by country)
OC 1.7 % women adopting (project defined) improved storage practices (list of
improved practices TBD by country)
OC 1.8 % women using [project defined] minimum number of improved livestock
practices (list of improved practices TBD by country)
OC 1.9 % women accessing agricultural inputs (seeds, fertilizers, etc.) over the last 12
months
OC 1.10 % women accessing output markets to sell agricultural production over the last
12 months OC 1.11 % households adopting negative coping strategies in past 3 months OC 1.12 % households using adaptation strategies to reduce the impact of future shocks
Outcome 2: Formal and informal local-level institutions are more responsive to women’s priorities and accountable to upholding their rights.
OC 2.1 % women with access to agricultural extension services over last 12 months OC 2.2 % women accessing agricultural financial services in last 12 months OC 2.3 % women reporting satisfaction with agricultural extension services OC 2.4 % women participating in formal and informal groups OC 2.5 % women holding leadership positions in formal and informal groups
OC 2.6 % respondents confident speaking in public about gender and other community
issues at the local level

70 | P a g e WE-RISE Global Report – DRAFT
April 18, 2016
Outcome 3: Cultural and social norms and attitudes better support the individual and collective aspirations and improved opportunities for chronically food insecure rural women.
OC 3.1 % women with sole or joint control over household income and expenditures OC 3.2 % women with sole or joint decision-making and control over household assets
OC 3.3 % women reporting sole or joint decision-making over reproductive health
decisions (birth control; spacing of children) OC 3.4 % women making sole or joint decisions about health care
OC 3.5 % respondents expressing attitudes that support gender-equitable roles in
family life
OC 3.6 % respondents expressing attitudes that reject gender-based household
violence OC 3.7 Women’s mobility
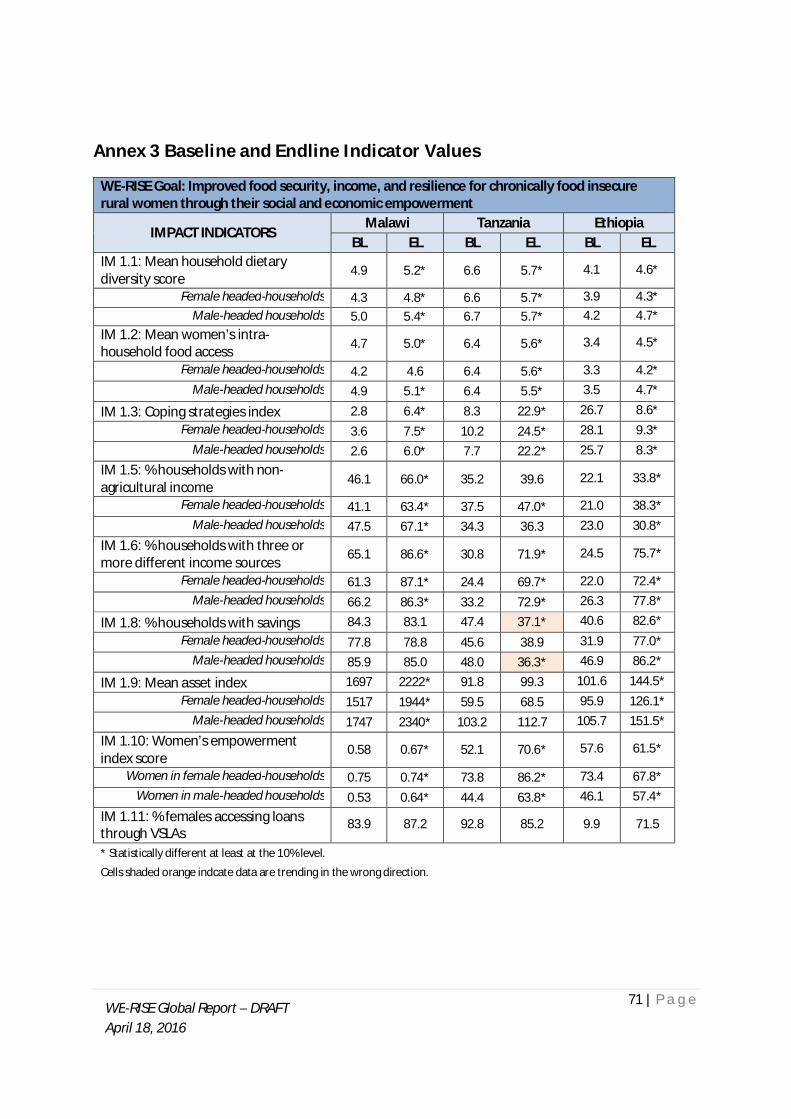
71 | P a g e WE-RISE Global Report – DRAFT
April 18, 2016
Annex 3 Baseline and Endline Indicator Values
WE-RISE Goal: Improved food security, income, and resilience for chronically food insecure rural women through their social and economic empowerment
IMPACT INDICATORS Malawi Tanzania Ethiopia
BL EL BL EL BL EL IM 1.1: Mean household dietary diversity score 4.9 5.2* 6.6 5.7* 4.1 4.6*
Female headed-households 4.3 4.8* 6.6 5.7* 3.9 4.3* Male-headed households 5.0 5.4* 6.7 5.7* 4.2 4.7*
IM 1.2: Mean women’s intra-household food access 4.7 5.0* 6.4 5.6* 3.4 4.5*
Female headed-households 4.2 4.6 6.4 5.6* 3.3 4.2* Male-headed households 4.9 5.1* 6.4 5.5* 3.5 4.7*
IM 1.3: Coping strategies index 2.8 6.4* 8.3 22.9* 26.7 8.6* Female headed-households 3.6 7.5* 10.2 24.5* 28.1 9.3*
Male-headed households 2.6 6.0* 7.7 22.2* 25.7 8.3* IM 1.5: % households with non-agricultural income 46.1 66.0* 35.2 39.6 22.1 33.8*
Female headed-households 41.1 63.4* 37.5 47.0* 21.0 38.3* Male-headed households 47.5 67.1* 34.3 36.3 23.0 30.8*
IM 1.6: % households with three or more different income sources 65.1 86.6* 30.8 71.9* 24.5 75.7*
Female headed-households 61.3 87.1* 24.4 69.7* 22.0 72.4* Male-headed households 66.2 86.3* 33.2 72.9* 26.3 77.8*
IM 1.8: % households with savings 84.3 83.1 47.4 37.1* 40.6 82.6* Female headed-households 77.8 78.8 45.6 38.9 31.9 77.0*
Male-headed households 85.9 85.0 48.0 36.3* 46.9 86.2*
IM 1.9: Mean asset index 1697 2222* 91.8 99.3 101.6 144.5* Female headed-households 1517 1944* 59.5 68.5 95.9 126.1*
Male-headed households 1747 2340* 103.2 112.7 105.7 151.5* IM 1.10: Women’s empowerment index score
0.58 0.67* 52.1 70.6* 57.6 61.5*
Women in female headed-households 0.75 0.74* 73.8 86.2* 73.4 67.8* Women in male-headed households 0.53 0.64* 44.4 63.8* 46.1 57.4*
IM 1.11: % females accessing loans through VSLAs
83.9 87.2 92.8 85.2 9.9 71.5
* Statistically different at least at the 10% level.
Cells shaded orange indcate data are trending in the wrong direction.
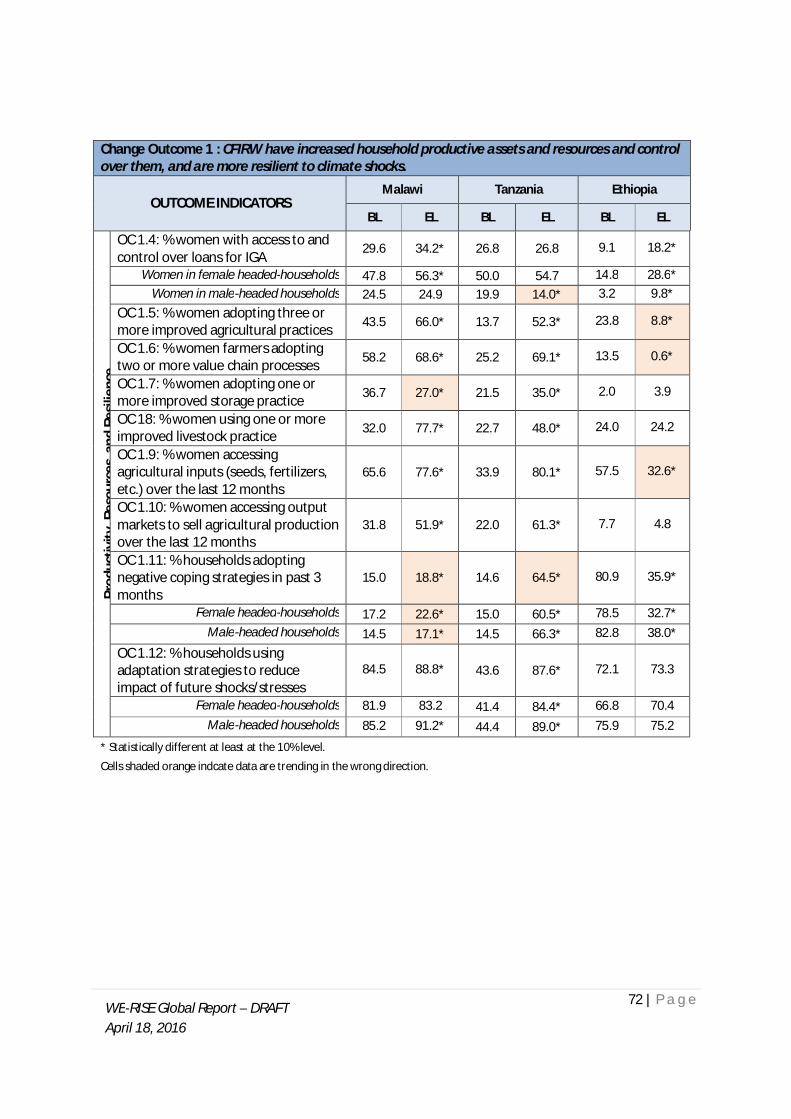
72 | P a g e WE-RISE Global Report – DRAFT
April 18, 2016
Change Outcome 1 : CFIRW have increased household productive assets and resources and control over them, and are more resilient to climate shocks.
OUTCOME INDICATORS Malawi Tanzania Ethiopia
BL EL BL EL BL EL
Prod
uctiv
ity, R
esou
rces
, and
Res
ilien
ce
OC 1.4: % women with access to and control over loans for IGA
29.6 34.2* 26.8 26.8 9.1 18.2*
Women in female headed-households 47.8 56.3* 50.0 54.7 14.8 28.6* Women in male-headed households 24.5 24.9 19.9 14.0* 3.2 9.8*
OC 1.5: % women adopting three or more improved agricultural practices 43.5 66.0* 13.7 52.3* 23.8 8.8*
OC 1.6: % women farmers adopting two or more value chain processes 58.2 68.6* 25.2 69.1* 13.5 0.6*
OC 1.7: % women adopting one or more improved storage practice 36.7 27.0* 21.5 35.0* 2.0 3.9
OC 18: % women using one or more improved livestock practice 32.0 77.7* 22.7 48.0* 24.0 24.2
OC 1.9: % women accessing agricultural inputs (seeds, fertilizers, etc.) over the last 12 months
65.6 77.6* 33.9 80.1* 57.5 32.6*
OC 1.10: % women accessing output markets to sell agricultural production over the last 12 months
31.8 51.9* 22.0 61.3* 7.7 4.8
OC 1.11: % households adopting negative coping strategies in past 3 months
15.0 18.8* 14.6 64.5* 80.9 35.9*
Female headed-households 17.2 22.6* 15.0 60.5* 78.5 32.7* Male-headed households 14.5 17.1* 14.5 66.3* 82.8 38.0*
OC 1.12: % households using adaptation strategies to reduce impact of future shocks/stresses
84.5 88.8* 43.6 87.6* 72.1 73.3
Female headed-households 81.9 83.2 41.4 84.4* 66.8 70.4 Male-headed households 85.2 91.2* 44.4 89.0* 75.9 75.2
* Statistically different at least at the 10% level.
Cells shaded orange indcate data are trending in the wrong direction.

73 | P a g e WE-RISE Global Report – DRAFT
April 18, 2016
Change Outcome 2: Formal and informal local-level institutions are more responsive to women’s priorities and accountable to upholding their rights.
PERFORMANCE INDICATORS Malawi Tanzania Ethiopia
BL EL BL EL BL EL
Enab
ling
Inst
itutio
nal E
nviro
nmen
t
OC 2.1: % women with access to agricultural extension services over last 12 months
27.4 77.5* 32.8 78.5* 23.6 11.8
OC 2.2: % women accessing agricultural financial services in last 12 months
87.3 94.4* 88.8 99.2* 60.9 95.5*
OC 2.3: % women reporting satisfaction with agricultural extension services
91.2 93.6* 74.5 62.4* 77.1 71.2
OC 2.4: % women participating in formal and informal groups 97.3 99.8* 95.7 96.9 96.0 89.1*
Women in female headed-households 95.7 100.0* 93.7 96.8 95.6 86.8* Women in male-headed households 97.8 99.8* 96.4 96.9 96.3 90.6*
OC 2.5: % women holding leadership positions in formal and informal groups
34.7 67.3* 39.4 45.8* 16.1 17.8
Women in female headed-households 32.9 66.7* 32.4 48.0* 15.4 15.8 Women in male-headed households 35.2 67.5* 41.8 44.8 16.7 19.0
OC 2.6: % Female respondents confident speaking in public about gender and other community issues at the local level
45.3 74.1* 60.8 60.3 82.6 70.8*
OC 2.6: % Male respondents confident speaking in public about gender and other community issues at the local level
68.3 85.5* 91.3 91.8 93.4 87.6*
* Statistically different at least at the 10% level. Cells shaded orange indcate data are trending in the wrong direction.
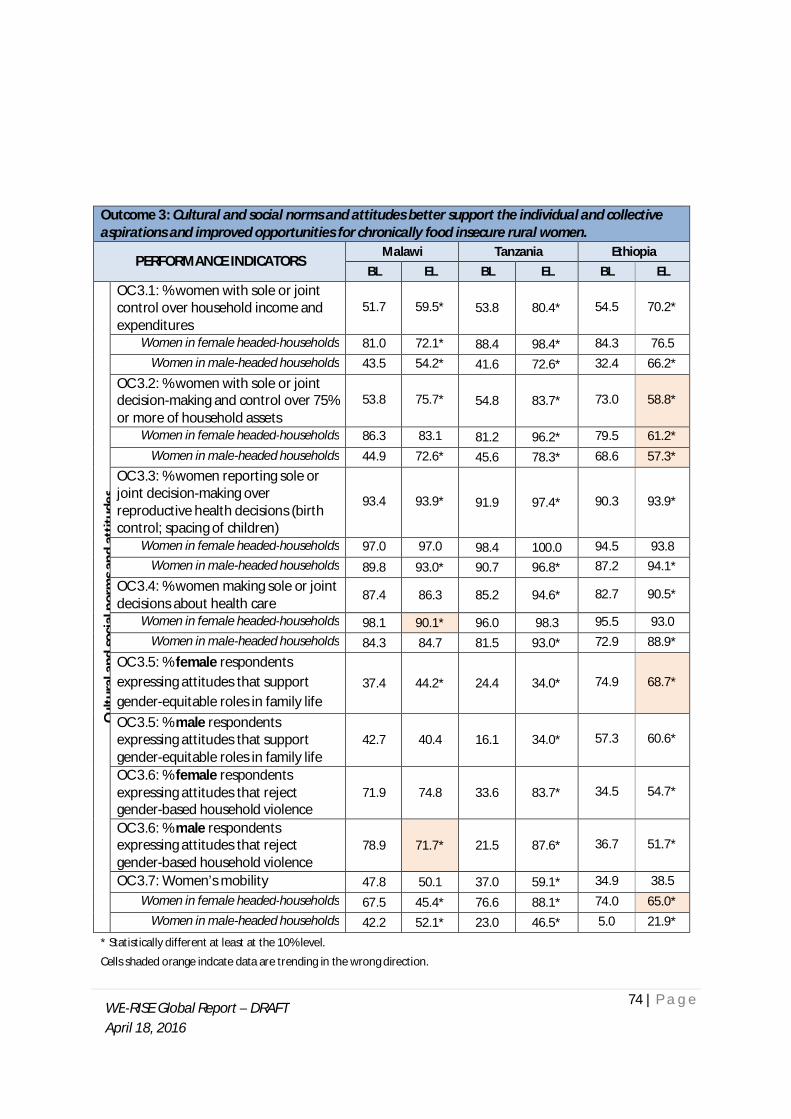
74 | P a g e WE-RISE Global Report – DRAFT
April 18, 2016
Outcome 3: Cultural and social norms and attitudes better support the individual and collective aspirations and improved opportunities for chronically food insecure rural women.
PERFORMANCE INDICATORS Malawi Tanzania Ethiopia
BL EL BL EL BL EL
Cultu
ral a
nd so
cial
nor
ms a
nd a
ttitu
des
OC 3.1: % women with sole or joint control over household income and expenditures
51.7 59.5* 53.8 80.4* 54.5 70.2*
Women in female headed-households 81.0 72.1* 88.4 98.4* 84.3 76.5 Women in male-headed households 43.5 54.2* 41.6 72.6* 32.4 66.2*
OC 3.2: % women with sole or joint decision-making and control over 75% or more of household assets
53.8 75.7* 54.8 83.7* 73.0 58.8*
Women in female headed-households 86.3 83.1 81.2 96.2* 79.5 61.2* Women in male-headed households 44.9 72.6* 45.6 78.3* 68.6 57.3*
OC 3.3: % women reporting sole or joint decision-making over reproductive health decisions (birth control; spacing of children)
93.4 93.9* 91.9 97.4* 90.3 93.9*
Women in female headed-households 97.0 97.0 98.4 100.0 94.5 93.8 Women in male-headed households 89.8 93.0* 90.7 96.8* 87.2 94.1*
OC 3.4: % women making sole or joint decisions about health care 87.4 86.3 85.2 94.6* 82.7 90.5*
Women in female headed-households 98.1 90.1* 96.0 98.3 95.5 93.0 Women in male-headed households 84.3 84.7 81.5 93.0* 72.9 88.9*
OC 3.5: % female respondents expressing attitudes that support gender-equitable roles in family life
37.4 44.2* 24.4 34.0* 74.9 68.7*
OC 3.5: % male respondents expressing attitudes that support gender-equitable roles in family life
42.7 40.4 16.1 34.0* 57.3 60.6*
OC 3.6: % female respondents expressing attitudes that reject gender-based household violence
71.9 74.8 33.6 83.7* 34.5 54.7*
OC 3.6: % male respondents expressing attitudes that reject gender-based household violence
78.9 71.7* 21.5 87.6* 36.7 51.7*
OC 3.7: Women’s mobility 47.8 50.1 37.0 59.1* 34.9 38.5 Women in female headed-households 67.5 45.4* 76.6 88.1* 74.0 65.0*
Women in male-headed households 42.2 52.1* 23.0 46.5* 5.0 21.9*
* Statistically different at least at the 10% level.
Cells shaded orange indcate data are trending in the wrong direction.

75 | P a g e WE-RISE Global Report – DRAFT
April 18, 2016

76 | P a g e WE-RISE Global Report – DRAFT
April 18, 2016
Annex 4 Computation of Secondary Variables
Household Dietary Diversity Score (HDDS) This indicator is computed by summing the number of different food categories reportedly eaten by the household the day prior to the interview. This indicator was measured as recommended by FANTA, using the following 12 food groups: cereals, tubers, legumes, dairy, meat, fish, oils, sugar, fruits, eggs, vegetables, and others. The HDDS provides a measure of household food access. A higher HDDS represents a more diverse diet, which is empirically highly correlated with a household’s income level and access to food.20
Asset Index The weighted asset index is computed by multiplying the number of each type of household asset by the index value for that particular asset type. Index values of household assets used in the construction of the asset index are presented in the table below. A higher value of the asset index indicates that households have been able to accumulate assets over time. Households are able to accumulate assets if income is greater than the necessary expenditures to meet household subsistence requirements. Assets also provide households with a cushion to adjust to shortfalls in incomes, or sudden increases in necessary expenditures. Thus, households with a higher asset index are less vulnerable than households with lower asset index values.
Asset weights
Asset type Malawi Tanzania Ethiopia Small consumer durables 2 1 1 Farm equipment non-mechanized
10 1 1
Cell phone 5 5 5 Transportation Means21 25 10 10
Non-farm business equipment 15 10 10 Large-consumer durables 25 10 10 House 500 10 10 Poultry 1 3 3 Small livestock 5 10 10 Large livestock 15 25 25 Fishing equipment / fish ponds22
5 5 5
20 Swindale, Anne, and Paula Bilinsky. Household Dietary Diversity Score (HDDS) for Measurement of Household Food Access:
Indicator Guide (v.2). Washington, D.C.: Food and Nutrition Technical Assistance Project, Academy for Educational Development, 2006.
21 The low weight is based on DHS 2010 data and qualitative observations that show the vast majority of rural transportation assets are bicycles 22 Low weight is based on fishing equipment: qualitative observations found limited ownership of fish ponds. Few exist, and those that do are community property.
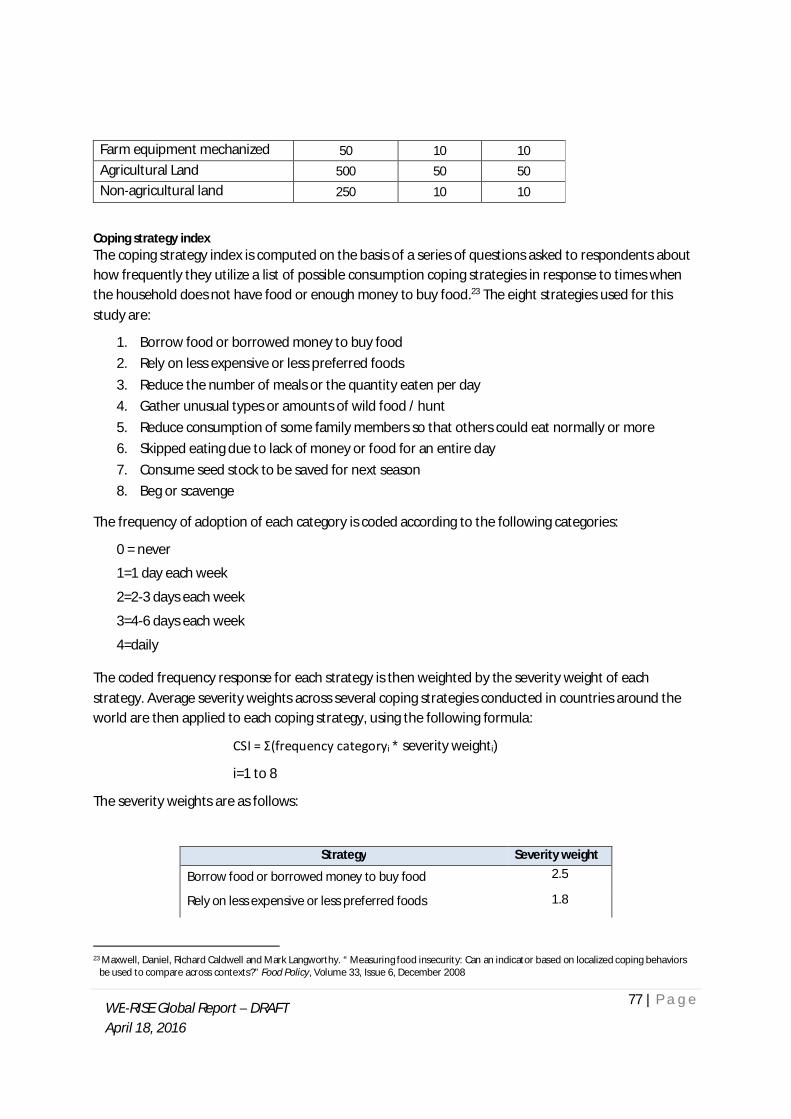
77 | P a g e WE-RISE Global Report – DRAFT
April 18, 2016
Farm equipment mechanized 50 10 10 Agricultural Land 500 50 50 Non-agricultural land 250 10 10
Coping strategy index The coping strategy index is computed on the basis of a series of questions asked to respondents about how frequently they utilize a list of possible consumption coping strategies in response to times when the household does not have food or enough money to buy food.23 The eight strategies used for this study are:
1. Borrow food or borrowed money to buy food 2. Rely on less expensive or less preferred foods 3. Reduce the number of meals or the quantity eaten per day 4. Gather unusual types or amounts of wild food / hunt 5. Reduce consumption of some family members so that others could eat normally or more 6. Skipped eating due to lack of money or food for an entire day 7. Consume seed stock to be saved for next season 8. Beg or scavenge
The frequency of adoption of each category is coded according to the following categories:
0 = never
1=1 day each week
2=2-3 days each week
3=4-6 days each week
4=daily
The coded frequency response for each strategy is then weighted by the severity weight of each strategy. Average severity weights across several coping strategies conducted in countries around the world are then applied to each coping strategy, using the following formula:
CSI = Σ(frequency categoryi * severity weighti)
i=1 to 8
The severity weights are as follows:
Strategy Severity weight
Borrow food or borrowed money to buy food 2.5
Rely on less expensive or less preferred foods 1.8
23 Maxwell, Daniel, Richard Caldwell and Mark Langworthy. “ Measuring food insecurity: Can an indicator based on localized coping behaviors
be used to compare across contexts?” Food Policy, Volume 33, Issue 6, December 2008

78 | P a g e WE-RISE Global Report – DRAFT
April 18, 2016
Reduce the number of meals or the quantity eaten per day 2.7
Skipped eating due to lack of money or food for an entire day
4.6
Consumed taboo food, wild food, famine foods which are normally not eaten
2.9
Reduce consumption of some family members so that others could eat normally or more
2.6
Consume seed stock to be saved for next season 3.6
Beg or scavenge 3.4

79 | P a g e WE-RISE Global Report – DRAFT
April 18, 2016
Annex 5 Women’s Empowerment The Women’s Empowerment Index (WEI) indicator used as part of CARE’s evaluation plan was adapted from, and closely follows, the Women’s Empowerment in Agriculture Index (WEAI) developed for Feed the Future. The WEAI is comprised as an average of two sub-indices: the 5 domains of empowerment index (5DE) and the Gender Parity Index (GPI).
The 5DE index is a direct measure of women’s empowerment and itself is split into two main components:
Incidence of Women’s Empowerment: calculated as the percentage of women that are empowered
Adequacy of the Disempowered: empowerment score of those women that are disempowered
Empowerment, as defined in the WEAI, is achievement in 80% or better of a weighted-index of the 10 indicators underlying the WEAI. The table below shows the weighting used for both the WEAI index and the adapted WEI index used by CARE for this evaluation. The differences in weighting between the two are driven in large part by additional indicators that were included as part of CARE’s evaluation plan. Those new indicators include:
Women’s self confidence Women’s mobility Women’s attitudes towards gender equitable roles in family life Women’s political participation.
The addition of the new indicators adds several important dimensions directly related to women’s empowerment that were previously unaccounted for in the WEAI. Women’s engagement in the political process and a measure of self-confidence were added to the leadership domain. With the expansion of that domain from two to four indicators, the indicators were re-weighted to 5% from 10%, leaving the domain weighted at 20%.
The WEAI “Time” domain was relabeled “Autonomy” to more accurately reflect the indicators contributing to this domain in the WEI. The workload indicator, weighted at 10% in the WEAI, was replaced by two indicators measuring women’s mobility and their attitudes concerning gender equity in the home. Questions related to women’s workload were explored through qualitative interviews rather than the quantitative survey. Again, the addition of an extra indicator to the time domain required re-weighting of the indicators in order to leave all domains equally weighted at 20%.
WEAI vs. WEI: Indicator weights
Domain Indicator WEAI weight WEI (CARE) weight
PRODUCTION With decision-making input for HH productive decision domains 1/10 10%

80 | P a g e WE-RISE Global Report – DRAFT
April 18, 2016
(20%) With autonomy in HH production domains 1/10 10%
RESOURCES
(20%)
With sole or joint ownership of household assetsa 1/15 6.67%
With sole or joint control over purchase or sale of household assetsa 1/15 6.67%
With access to and decisions on credit 1/15 6.67%
INCOME
(20%)
With control over household income and expenditures in HH decision-making domainsb
1/5 20%
LEADERSHIP & COMMUNITY
(20%)
Participating in formal and informal groups 1/10 5%
Confident speaking about gender and other community issues at the local level
1/10 5%
Demonstrating political participation N/A 5% Who express self-confidence N/A 5%
TIME/
AUTONOMY
(20%)
Satisfied with the amount of time available for leisure activities 1/10 6.67%
Workload 1/10 0%
Achieving a mobility score of 16 or greater N/A 6.67%
Expressing attitudes that support gender equitable roles in family life N/A 6.67%
Total 100% 100%
Analysis was initially conducted using the WEAI thresholds for indicator achievement, or those specified by CARE in the case of new indicators. These thresholds often resulted in baseline levels of achievement of 90% or greater, leaving little room for project improvement over time. To allow for country-specific improvement, baseline values were adjusted to country-specific thresholds. In cases where baseline indicator values were greater than 50% using the WEAI thresholds, the threshold for the indicator was adjusted until the value fell between 45-60%. The table below gives both the initial WEAI thresholds and the ending country-specific thresholds.
As an example of threshold adjustment, WEAI guidance for decision-making in household productive decision domains defined achievement as those women that had input in 2 or more (of 5 total) domains. When calculated, the percentage of women achieving this indicator was greater than 95%. Thus, the indicator was recalculated increasing the threshold for achievement until the value fell between 45 and
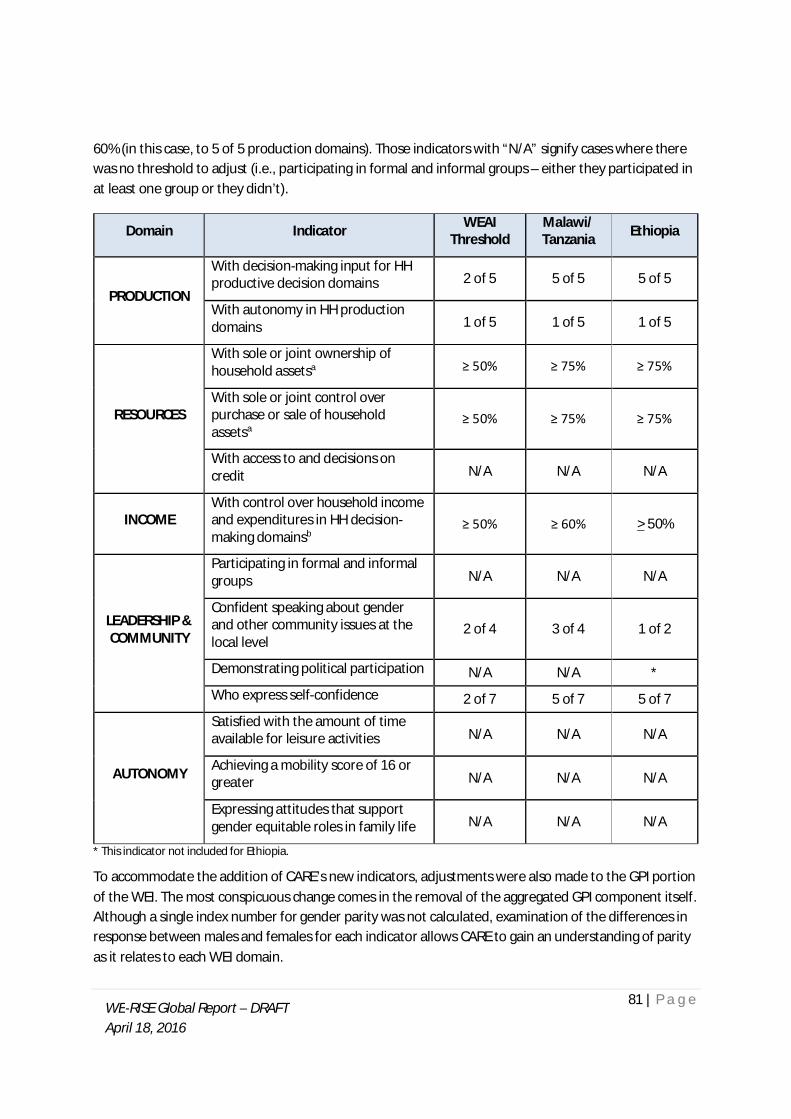
81 | P a g e WE-RISE Global Report – DRAFT
April 18, 2016
60% (in this case, to 5 of 5 production domains). Those indicators with “N/A” signify cases where there was no threshold to adjust (i.e., participating in formal and informal groups – either they participated in at least one group or they didn’t).
Domain Indicator WEAI Threshold
Malawi/ Tanzania Ethiopia
PRODUCTION
With decision-making input for HH productive decision domains 2 of 5 5 of 5 5 of 5
With autonomy in HH production domains 1 of 5 1 of 5 1 of 5
RESOURCES
With sole or joint ownership of household assetsa ≥ 50% ≥ 75% ≥ 75%
With sole or joint control over purchase or sale of household assetsa
≥ 50% ≥ 75% ≥ 75%
With access to and decisions on credit N/A N/A N/A
INCOME With control over household income and expenditures in HH decision-making domainsb
≥ 50% ≥ 60% > 50%
LEADERSHIP & COMMUNITY
Participating in formal and informal groups N/A N/A N/A
Confident speaking about gender and other community issues at the local level
2 of 4 3 of 4 1 of 2
Demonstrating political participation N/A N/A * Who express self-confidence 2 of 7 5 of 7 5 of 7
AUTONOMY
Satisfied with the amount of time available for leisure activities N/A N/A N/A
Achieving a mobility score of 16 or greater N/A N/A N/A
Expressing attitudes that support gender equitable roles in family life N/A N/A N/A
* This indicator not included for Ethiopia.
To accommodate the addition of CARE’s new indicators, adjustments were also made to the GPI portion of the WEI. The most conspicuous change comes in the removal of the aggregated GPI component itself. Although a single index number for gender parity was not calculated, examination of the differences in response between males and females for each indicator allows CARE to gain an understanding of parity as it relates to each WEI domain.

82 | P a g e WE-RISE Global Report – DRAFT
April 18, 2016
Removal of the aggregated GPI component was necessary because of differences between men and women for three indicators, inclusion of which as part of the GPI would have violated the spirit of what the GPI represents. The three indicators are: women’s mobility, women’s ownership of assets, and women’s input in the purchase in sale of assets.
The GPI includes two components:
Percentage of women achieving gender parity: measured by the percentage of empowered women + percentage of women that have empowerment scores ≥ to the empowerment score of the male respondent in their household
(Avg.) Difference in empowerment between men and women: calculated for those women that don’t achieve gender parity.
The WEAI is structured to ask both men and women about their own mobility. The question was adapted as a result of input from the Ethiopia baseline survey (the first baseline study to be conducted) wherein men felt it absurd to be asked about their own mobility. The WEI, therefore, asked for men’s perceptions about their spouse’s mobility. Thus, there was no measurement of men’s empowerment as regards their own mobility, making it impossible to measure differences between male and female empowerment in mobility (i.e., parity), as men and women were asked different questions.
Both questions related to asset ownership were only asked of the female household member (in part to help shorten the lengthy survey), again making it impossible to calculate a relative difference in empowerment between males and females for ownership and control of assets.
One option would have been to exclude all three of these indicators from calculation of the gender parity index. However, that would have meant a lack of valuable information and muddied interpretation of the results. Thus, rather than calculating a single, somewhat meaningless number as indicative of differences in men’s and women’s overall empowerment, men’s and women’s empowerment in each domain is used to understand parity. Mobility was excluded due to the interpretation issues cited above. The two asset indicators were included because, as constructed, the questions asked of household females still captured the relative difference in asset ownership and decision-making between household males and females (even if only from the perspective of the household female). Finally, the percentage of women achieving women’s parity and the average difference in empowerment between men and women respondents was excluded due to the issues cited above.