Embed Size (px)
Citation preview
Care Pathways
and Outcomes
Research Team:
Dominic McSherry, Emma Larkin, Montse
Fargas, Greg Kelly, Clive Robinson, and Kerry-
Lee Weatherall
Institute of Child Care Research,
School of Sociology, Social Policy, and Social Work,
Queen’s University Belfast
Funded by the R&D Office
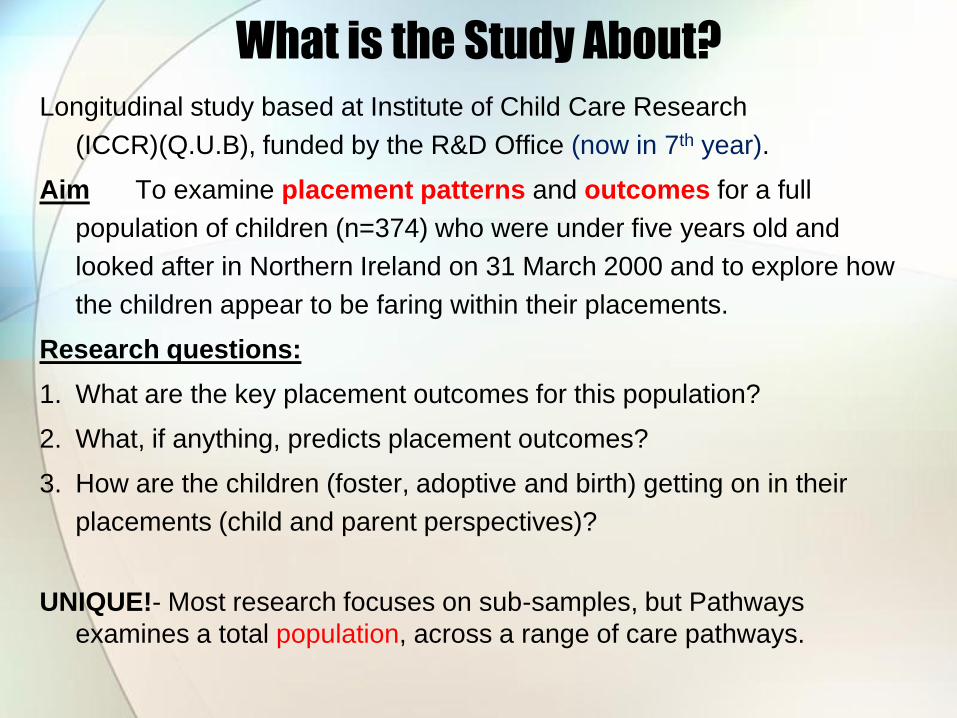
What is the Study About?
Longitudinal study based at Institute of Child Care Research
(ICCR)(Q.U.B), funded by the R&D Office (now in 7th year).
Aim To examine placement patterns and outcomes for a full
population of children (n=374) who were under five years old and
looked after in Northern Ireland on 31 March 2000 and to explore how
the children appear to be faring within their placements.
Research questions:
1. What are the key placement outcomes for this population?
2. What, if anything, predicts placement outcomes?
3. How are the children (foster, adoptive and birth) getting on in their
placements (child and parent perspectives)?
UNIQUE!- Most research focuses on sub-samples, but Pathways
examines a total population, across a range of care pathways.
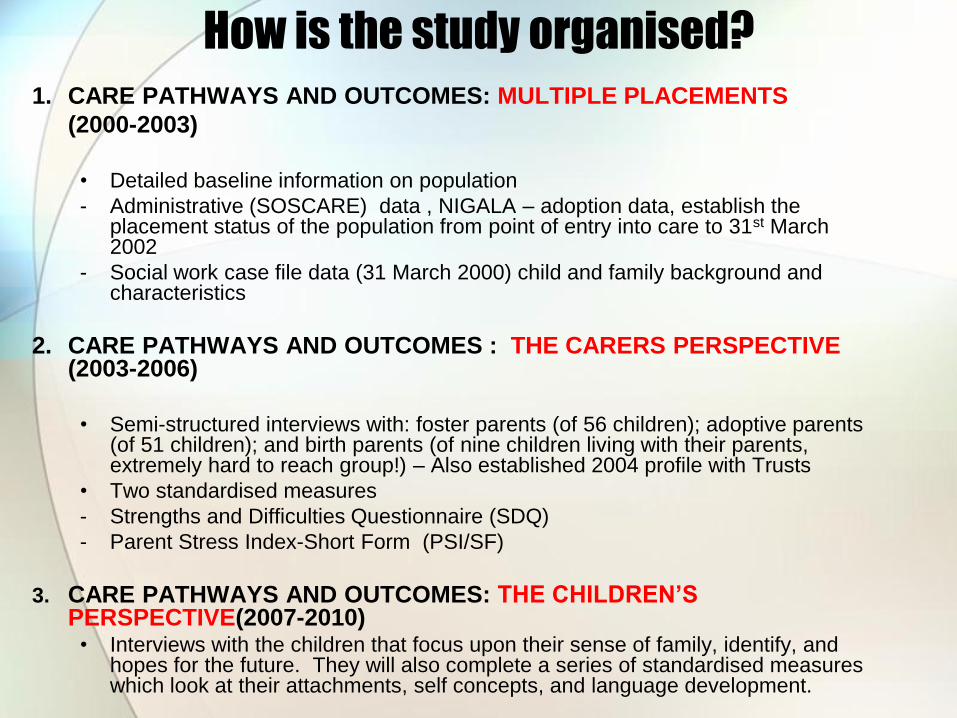
How is the study organised?
1. CARE PATHWAYS AND OUTCOMES: MULTIPLE PLACEMENTS
(2000-2003)
• Detailed baseline information on population
- Administrative (SOSCARE) data , NIGALA – adoption data, establish the placement status of the population from point of entry into care to 31st March 2002
- Social work case file data (31 March 2000) child and family background and characteristics
2. CARE PATHWAYS AND OUTCOMES : THE CARERS PERSPECTIVE (2003-2006)
• Semi-structured interviews with: foster parents (of 56 children); adoptive parents (of 51 children); and birth parents (of nine children living with their parents, extremely hard to reach group!) – Also established 2004 profile with Trusts
• Two standardised measures
- Strengths and Difficulties Questionnaire (SDQ)
- Parent Stress Index-Short Form (PSI/SF)
3. CARE PATHWAYS AND OUTCOMES: THE CHILDREN’S PERSPECTIVE(2007-2010)
• Interviews with the children that focus upon their sense of family, identify, and hopes for the future. They will also complete a series of standardised measures which look at their attachments, self concepts, and language development.

Population Characteristics
Male (50%), Female (50%)
Catholic (45%), Protestant denominations (49%)
Family history of alcohol abuse (76%)
............................domestic violence (76%)
............................mental illness (63%)
In care due to neglect (52%)
........................abuse (40%)
Behavioural problems (16%)
Developmental delay (12%)
Reflective of other Northern Irish research (Kelly & McSherry, 2003;
Donaldson, 2004; Devaney, 2007).

Placement patterns 2000-2007 (%)
0
10
20
30
40
50
60
70
2000 2002 2004 2007
Adopted
Birth parents
Non-relative foster care
Relative foster care
Residence Order
Prospective Adoption
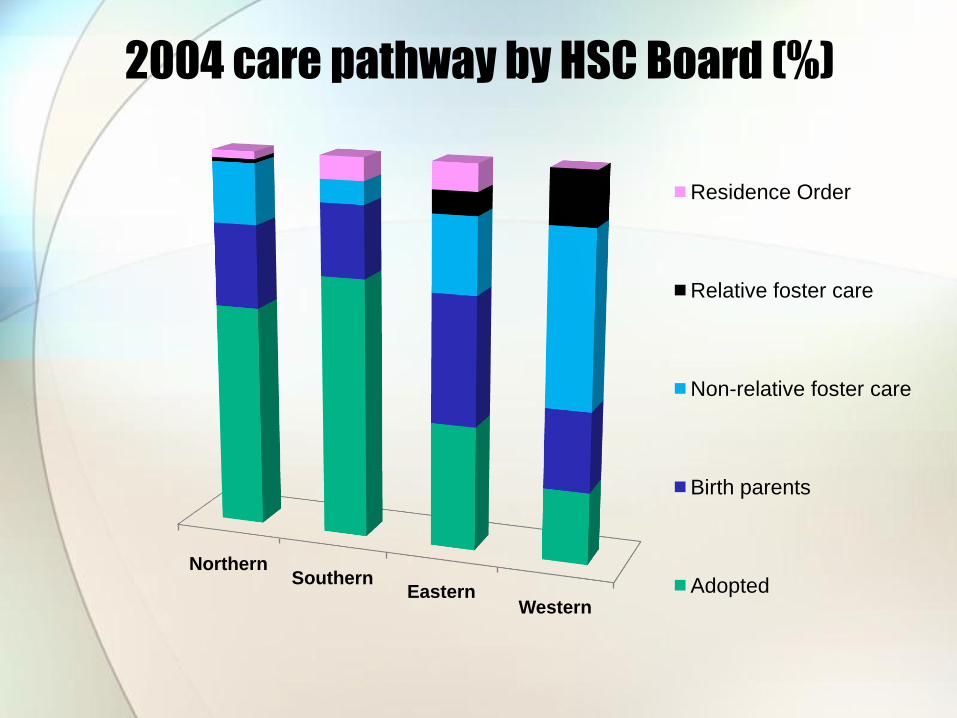
2004 care pathway by HSC Board (%)
NorthernSouthern
EasternWestern
Residence Order
Relative foster care
Non-relative foster care
Birth parents
Adopted
Placement Trends
Move towards adoption
Major decline in % children remaining in foster care (71% to 28%)
And a major rise in % children adopted or in pre-adoptive placement
(45% of population)
These figures indicate a significant shift in use of adoption as a long-
term placement option for children in care in Northern Ireland
For example, 5 yrs prior to the beginning of this study Kelly and Coulter
(1995) found very low numbers of children being adopted from care
Regional variation in placement patterns
Northern (59%) and Southern (69%) Boards large % of children adopted
compared to Eastern (33%) and Western (19%)
Southern Board highest % of children who had been adopted and the
lowest % of children in foster care (6%) in 2004
In direct contrast the Western Board has by far the highest % of children
in foster care (60%) and the lowest % of children adopted in 2004
What Predicts Care Pathway?
Used Event-History Analysis to examine the relationship between
background factors and placement type
Factors that increased likelihood of adoption:
Child being less than one year old when first entered care
Child living in the Northern or Southern Board area
Mother living alone
Child not presenting behavioural problems
Factors that increased likelihood of a return to birth parents:
No family history alcohol abuse
Case being open less than a year
Child living in the Eastern Board area
Child being in care on a voluntary basis
Child presenting developmental delay
Implications
Key Question: If the needs of the child are central to deciding on a long-
term placement, how do we explain findings of major variation in
professional decision-making across Northern Ireland?
Does this suggest a ‘postcode lottery’ operating in Northern Ireland
regarding care pathways for younger children in care?
- DoH (1998) highlighted a similar challenge: Balancing the need to
develop local solutions that match situational needs while avoiding the
pitfalls of the post-code lottery, whereby variation can result in less
positive care experiences and opportunities for Looked After children
Our findings show 20% of children under the age of one when they first
entered care still in foster care after seven years, while almost half were
adopted, and 1/5 returned to their birth parents. The KEY question is:
Does this matter? Is there any evidence to suggest that some children’s
care experiences may be more or less positive than others?

How were they getting on?
Semi-structured interviews with: foster parents (of 56 children);
adoptive parents (of 51 children); and birth parents (of nine children
living with their parents)
Purpose:
- to find out how these children appeared to be getting on, & how the
parents were faring with them; and
- to explore parents’ views on issues such as: process involvement;
the child settling into the placement; bonding & attachment; contact;
school & friendships; & support issues.
2 measures
Parent Stress Index – Short form (PSI/SF)
Strengths and Difficulties Questionnaire (SDQ)
Parenting stress
Parent Stress Index-Short Form (PSI/SF) (Abidin, 1995)
measure of stress in the parent-child system
The PSI/SF produces a Total Stress Score from three scales: Parental Distress - distress parent is experiencing in role as a parent
Parent-Child Dysfunctional Interaction - parents perception that child does not meet expectations and that interactions are not rewarding
Difficult Child - parents experience of basic characteristics of the children that make them either difficult or easy to manage.
Defensive Responding - indication of extent to which parents minimise problems
Parenting stress
HOW DO THE GROUPS COMPARE?
Adopted parents experienced the lowest and birth parents experienced the
highest parenting stress scores.
The adopted and foster groups scored within the normal range on Total Stress
and each of the subscales. However, a % of each group experienced
significant problems in relation to parenting stress.
The birth parent group were experiencing difficulties in each of the domains
and clinically significant levels of stress
Abnormally high scores on Parental Distress and Difficult Child (85th
percentile)
Abnormally high scores on Defensive Responding, Parent-child
Dysfunctional Interaction and Total Stress (95th percentile)
The normal range of scores is within 15th to 80th percentiles
These findings highlight that some adoptive and foster parents, and most birth
parents, will require support in relation to these aspects of parenting, as
increased support has been found to reduce parenting stress
Children’s strengths & difficulties
Strengths and Difficulties Questionnaire (SDQ) (Goodman, 1997) is a brief child behavioural questionnaire
completed by parents
Assesses 5 domains including:
emotional symptoms (complains of headaches, stomach aches, often worried, unhappy, downhearted, nervous/clingy in new situations, many fears/easily scared)
conduct problems (temper tantrums, disobedient, fights with/bullies other children, lies/cheats, steals)
hyperactivity-inattention (restless, overactive, constantly fidgeting/squirming, easily distracted, poor concentration and task completion)
peer relationship problems (solitary, picked on/bullied by other children, gets on better with adults than other children)
pro-social behaviour (considerate, shares readily, helpful, kind)
Total difficulties score
Scores can be classified as normal, borderline or abnormal compared to an age appropriate community sample (typically 10% borderline, 10% abnormal)
Children’s strengths & difficulties
HOW DO THE GROUPS COMPARE?
The adopted group had the lowest and the birth parent group
had the highest total difficulties score.
All of the groups scored highly on the pro-social and the
hyperactivity scales indicating that while the children are
perceived to be functioning well socially they are experiencing
difficulties with concentration and attention span.
Birth parent mean scores were abnormally high on
Conduct problems
Hyperactivity/inattention
Total difficulties
Children’s strengths & difficulties
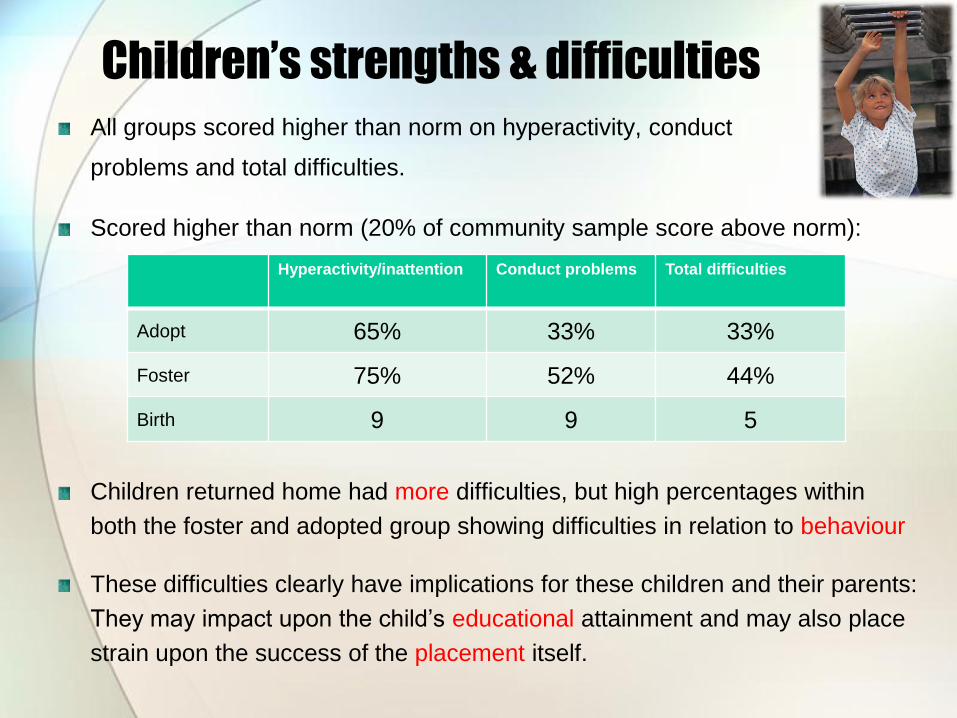
All groups scored higher than norm on hyperactivity, conduct
problems and total difficulties.
Scored higher than norm (20% of community sample score above norm):
Children returned home had more difficulties, but high percentages within
both the foster and adopted group showing difficulties in relation to behaviour
These difficulties clearly have implications for these children and their parents:
They may impact upon the child’s educational attainment and may also place
strain upon the success of the placement itself.
Hyperactivity/inattention Conduct problems Total difficulties
Adopt 65% 33% 33%
Foster 75% 52% 44%
Birth 9 9 5
PSI and SDQ Trends
Birth parents of children who have been returned home and their children were experiencing considerable difficulties
The Parenting Stress scores of birth parents were abnormally high indicating clinically significant levels of stress
Children returned to birth parents were experiencing considerably higher levels of difficulty than adopted and foster children
Adoptive parents appear to be experiencing less parenting stress and their children appear to be experiencing less overall difficulties than the foster and birth parent groups
While both the adopted and foster groups appear to be falling within norms, a percentage of each of these groups were experiencing significant parental stress and child difficulties, particularly hyperactivity

Parent Perspectives (interviews)
Contact
Support
ContactBENEFITS
Useful source of information on child and his/her background (adoptive)
Facilitate ongoing info exchange (adoptive)
Some adoptive families spoke of the benefit from practical and emotional support
of the child’s birth family ‘To gain a granny’ (adoptive)
Help children make sense of key people (adoptive)
Reduce feelings of abandonment (adoptive)
Child may benefit from witnessing a rapport, sense of unity, agreement and
friendship among key adults (adoptive)
Happy memories with birth parents, invited to celebrate
significant occasions (foster)
Contact
DIFFICULTIES/CHALLENGES
Disruption of children’s routines: sick or aggressive after (foster)
Child too young to make sense of contact (adoptive)
Child upset if parents don’t turn up (adoptive)
Rough play/jealousy with siblings (adoptive)
Visits a burden, disturbed lifestyle & complicated life (foster, adoptive)
Difficult to retain anonymity (adoptive)
Issues of parental role identity (adoptive)
Difficult & stressful, restricted communication (birth)
Important to have a sense of ownership over contact arrangements
(adoptive)
Support
Support from SS was described as insufficient (or non-existent) by birth parents;
initially not needed for adoptive parents; & mostly basic by foster parents
Foster parents
Some didn’t rely on SS support, but reassured support there if needed
Some identified gaps in services
Financial support as little more than adequate and far from generous
Adoptive parents
More intense & frequent at the start, & petered out after
Still available ‘at the end of the phone’
Many not needed, nor wanted support
A few, with more difficult children, were not happy with the level of support
Support
Birth parents
For some, no practical support to prevent children taken into care
and to get them back
After returned home, SS only concerned about checking up on them
Some afraid to ask for support because they were afraid of losing
children again
Many wanted respite care
Most foster and adoptive parents had support of family &
friends, BUT most birth parents did not have this support

Interview Trends
Birth parents – Need for a coherent support structure
for families when children return home from
care, particularly for lone young mothers
Need for targeted long-term foster care, and post-
adoption support services