Embed Size (px)
Citation preview
CARDIOVASCULAR JOURNAL OF AFRICA • Advance Online Publication, September 2019AFRICA 1
Cardiovascular Topics
An easy method for monitoring patients with pulmonary hypertension: P-wave dispersionArif Oguzhan Cimen, Samim Emet
AbstractBackground: Pulmonary arterial hypertension (PAH) is a haemodynamic and pathophysiological condition with restricted flow through the pulmonary arterial circulation. In pulmonary hypertension, right ventricular hypertrophy and diastolic dysfunction can lead to an increase in atrial strain, fibrosis and dilation, which cause inhomogeneous atrial conduction. Interlead variation in P-wave duration is called P-wave dispersion (PwD), which is an electrocardiographic parameter that can be used to predict atrial arrhythmias. Our aim was to investigate the relationship between PwD, func-tional capacity, and invasive and non-invasive haemodynamic parameters of patients diagnosed with PAH.Methods: Between 2015 and 2017 we enrolled 33 patients admitted to our in-patient clinic and diagnosed with PAH, and 32 healthy individuals for the control group. Details of these patients at the time of diagnosis were analysed, including gender, age, physical examination, electrocardio-gram (ECG), echocardiography, six-minute walk test distance (6MWD), haemodynamic parameters and blood tests for biochemical markers that are correlated with clinical severity. Statistical analyses were performed using SPSS version 20.0 (SPSS Inc, Chicago, Illinois, USA). Statistical significance was taken as p < 0.05.Results: In the forward stepwise multiple linear regression analysis, PwD and mean pulmonary artery pressure deter-mined by right heart catheterisation were independently related to the functional capacity tested by the 6MWD (p < 0.02 and p < 0.01, respectively).Conclusion: PwD can easily be calculated from a surface ECG to indirectly estimate the functional status and prognosis of the patient with PAH.
Keywords: P-wave dispersion, functional status, haemodynamic parameters, pulmonary artery hypertension
Submitted 19/8/19, accepted 3/9/19
Cardiovasc J Afr 2019; 30: online publication www.cvja.co.za
DOI: 10.5830/CVJA-2019-053
Pulmonary arterial hypertension (PAH) is a haemodynamic and pathophysiological condition with restricted flow through the pulmonary arterial circulation, resulting in increased pulmonary vascular resistance (PVR) and ultimately, right-sided heart failure (HF).1 Pre-capillary PAH is defined as an increase in mean pulmonary arterial pressure (mPAP) ≥ 25 mmHg and PVR > 3.0 Wood units (WU) without significant elevation of the pulmonary capillary wedge pressure (PCWP) (PCWP ≤ 15 mmHg) at rest as assessed by right heart catheterisation (RHC).2 Right ventricular (RV) function is a major determinant of functional capacity and prognosis in PAH.3
In PAH, RV hypertrophy and diastolic dysfunction can lead to an increase in atrial strain, fibrosis and dilation. This is called right heart reverse remodelling (RHRR). RHRR and RV failure are major determinants of symptoms and reduced survival time in PAH.4 These changes result in inhomogeneous atrial conduction.
Heterogeneity in atrial conduction can be seen as a variation in P-wave duration between differently orientated surface electrocardiogram (ECG) leads. Interlead variation in P-wave duration is called P-wave dispersion (PwD)5 and is an easily calculated ECG parameter that can be used to predict increased atrial strain caused by RHRR linked to atrial arrhythmias. This can indicate a poor prognosis in PAH patients.5
Our aim was to investigate the relationship between PwD, functional capacity, and invasive and non-invasive haemodynamic parameters of patients diagnosed with PAH.
MethodsWe enrolled 33 patients (26 females and seven males, mean age of 48.6 ± 2.6 years), who were admitted to our in-patient clinic between 2015 and 2017 and diagnosed with PAH according to the European Society of Cardiology/European Respiratory Society (ESC/ERS) guidelines for the diagnosis of PAH,2 and 32 healthy individuals for the control group. Written informed consent was obtained. The study complied with the Declaration of Helsinki and the local ethics committee approved trial protocol (number: 78, date: 12.01.2015 and 03). The inclusion criteria were:• patients diagnosed with group 1 PAH according to the ESC/
ERS guidelines, including idiopathic PAH• patients diagnosed with group 3 PAH according to the ESC/
ERS guidelines, including lung diseases and/or hypoxia • patients diagnosed with group 4 PAH according to the ESC/
ERS guidelines, including chronic thromboembolic pulmo-nary hypertension and other pulmonary artery obstructions
Department of Cardiology, Medical Faculty, Bahcesehir University, Istanbul, TurkeyArif Oguzhan Cimen, MD
Department of Cardiology, Medical Faculty, Istanbul University, Istanbul, TurkeySamim Emet, MD, [email protected]
CARDIOVASCULAR JOURNAL OF AFRICA • Advance Online Publication, September 20192 AFRICA
• patients diagnosed with group 5 PAH according to the ESC/ERS guidelines, including unclear and/or multifactorial mechanisms.
The exclusion criteria were:• patients with PAH due to left-sided heart diseases (PAH
group 2 patients) • patients with coincident cardiac diseases (hypertension, coro-
nary artery disease, diabetes, renal failure), left bundle branch block, significant arrhythmias, including atrial fibrillation, Wolff–Parkinson–White syndrome, supraventricular tachy-cardia, atrioventricular block and pacemaker rhythm
• patients with serum electrolyte imbalances and receiving anti-arrhythmic drugs were excluded due to their possible effects on ECG measurements.
Details of these patients at the time of diagnosis were analysed, including gender, age, physical examination, echocardiography, six-minute walk test distance (6MWD), haemodynamic parameters and blood tests for biochemical markers that are correlated with clinical severity.
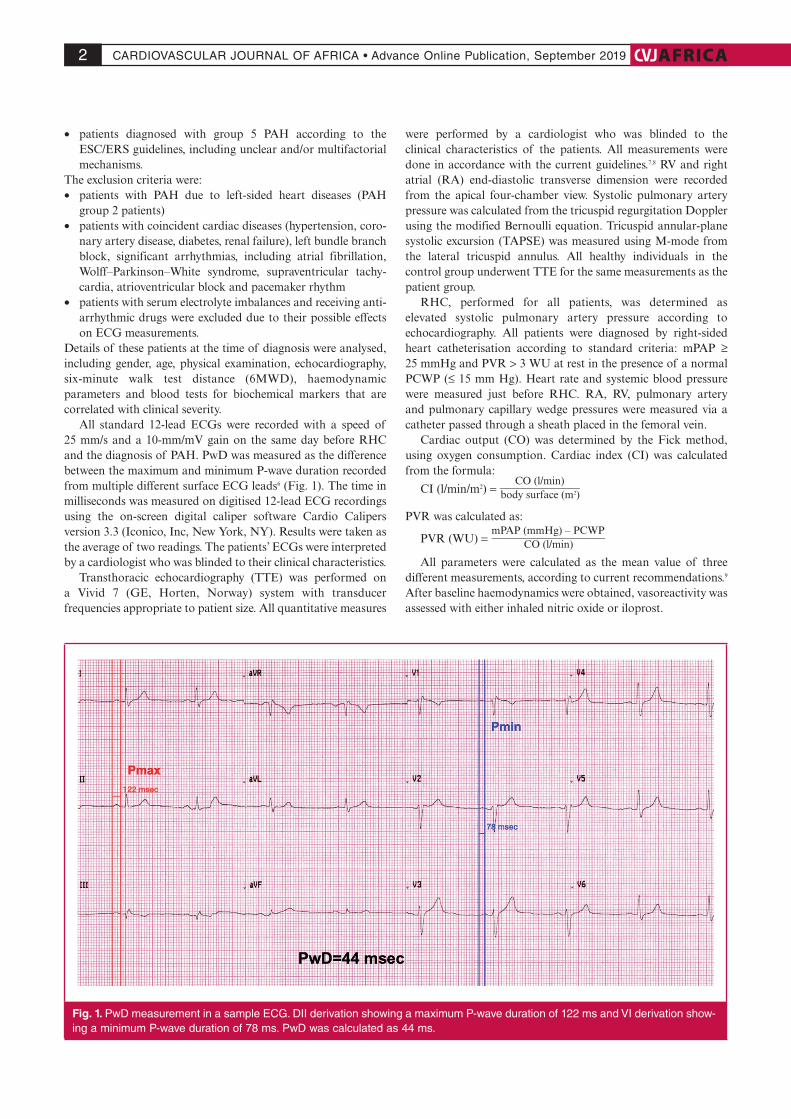
All standard 12-lead ECGs were recorded with a speed of 25 mm/s and a 10-mm/mV gain on the same day before RHC and the diagnosis of PAH. PwD was measured as the difference between the maximum and minimum P-wave duration recorded from multiple different surface ECG leads6 (Fig. 1). The time in milliseconds was measured on digitised 12-lead ECG recordings using the on-screen digital caliper software Cardio Calipers version 3.3 (Iconico, Inc, New York, NY). Results were taken as the average of two readings. The patients’ ECGs were interpreted by a cardiologist who was blinded to their clinical characteristics.
Transthoracic echocardiography (TTE) was performed on a Vivid 7 (GE, Horten, Norway) system with transducer frequencies appropriate to patient size. All quantitative measures
were performed by a cardiologist who was blinded to the clinical characteristics of the patients. All measurements were done in accordance with the current guidelines.7,8 RV and right atrial (RA) end-diastolic transverse dimension were recorded from the apical four-chamber view. Systolic pulmonary artery pressure was calculated from the tricuspid regurgitation Doppler using the modified Bernoulli equation. Tricuspid annular-plane systolic excursion (TAPSE) was measured using M-mode from the lateral tricuspid annulus. All healthy individuals in the control group underwent TTE for the same measurements as the patient group.
RHC, performed for all patients, was determined as elevated systolic pulmonary artery pressure according to echocardiography. All patients were diagnosed by right-sided heart catheterisation according to standard criteria: mPAP ≥ 25 mmHg and PVR > 3 WU at rest in the presence of a normal PCWP (≤ 15 mm Hg). Heart rate and systemic blood pressure were measured just before RHC. RA, RV, pulmonary artery and pulmonary capillary wedge pressures were measured via a catheter passed through a sheath placed in the femoral vein.
Cardiac output (CO) was determined by the Fick method, using oxygen consumption. Cardiac index (CI) was calculated from the formula:
CI (l/min/m2) = CO (l/min)
__________________ body surface (m2)
PVR was calculated as:
PVR (WU) = mPAP (mmHg) – PCWP
____________________ CO (l/min)
All parameters were calculated as the mean value of three different measurements, according to current recommendations.9 After baseline haemodynamics were obtained, vasoreactivity was assessed with either inhaled nitric oxide or iloprost.
Fig. 1. PwD measurement in a sample ECG. DII derivation showing a maximum P-wave duration of 122 ms and VI derivation show-ing a minimum P-wave duration of 78 ms. PwD was calculated as 44 ms.
CARDIOVASCULAR JOURNAL OF AFRICA • Advance Online Publication, September 2019AFRICA 3
Statistical analysis The research data used to support the findings of this study were supplied by the corresponding author under license and so cannot be made freely available. Requests for access to these data should be made to the corresponding author.
Continuous variables with parametric distribution are expressed as mean ± standard deviation. Categorical data are expressed as frequencies and their differences were analysed using the chi-squared test. Variables were investigated using visual (histograms, probability plots) and analytical methods (Kolmogorov–Smirnov/Shapiro–Wilk’s test) to determine whether or not they were normally distributed. Parameters that were normally distributed, and correlation coefficients and their significance were calculated using the Pearson’s test.
A multiple linear regression model was used to identify independent predictors of the 6MWD for the functional capacity of PAH patients. A 5% type I error level was used to infer statistical significance. Statistical analyses were performed using SPSS version 20.0 (SPSS Inc, Chicago, Illinois, USA). Statistical significance was taken as p < 0.05.
ResultsA total of 33 patients were enrolled into the study. The baseline clinical, haemodynamic, echocardiographic and ECG parameters of patients are shown in Table 1. The mean age was 47.9 ± 15.08 years, and the female gender was dominant with a rate of 78%.
Systolic PAP on echocardiography was 82 ± 24.57 mmHg, while mPAP determined by RHC, was 52.29 ± 24.33 mmHg. Maximum P-wave duration, calculated by surface ECG, was 112.129 ± 36.03 ms, while minimum P-wave duration was 52.729 ± 16.44 ms. Mean P-wave dispersion was 59.399 ± 28.93 ms. TTE measurements of the control group are also given in Table 1.
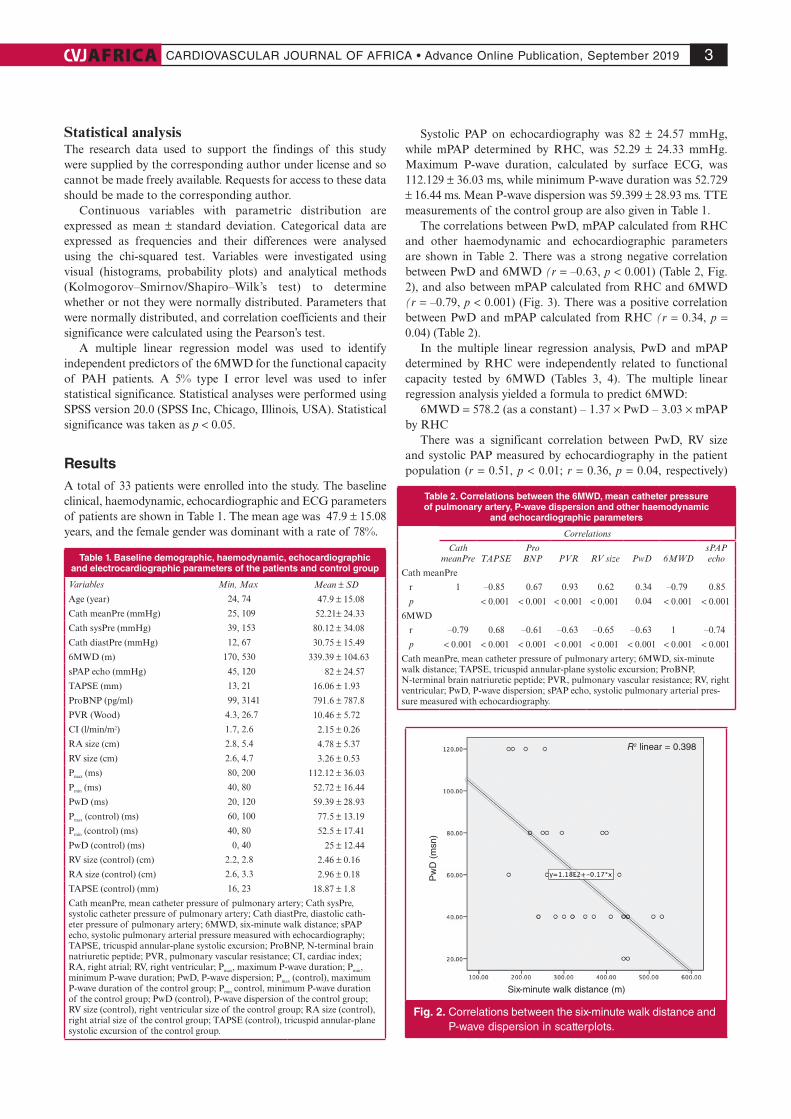
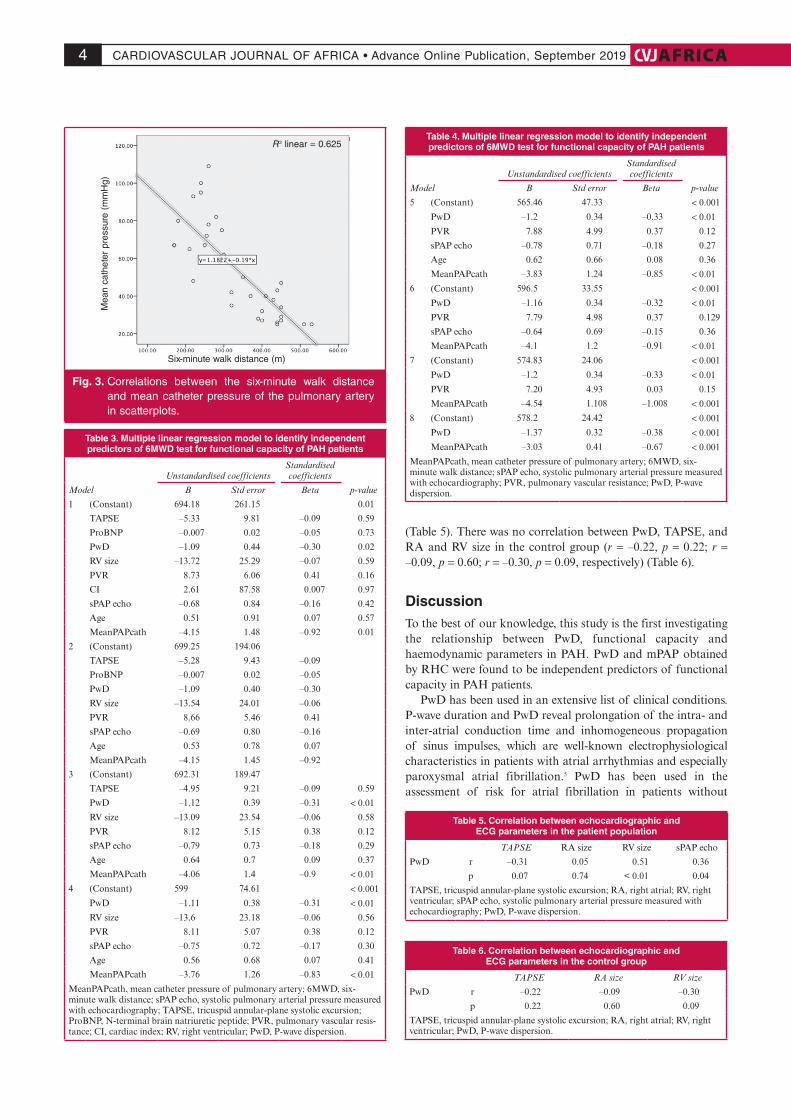
The correlations between PwD, mPAP calculated from RHC and other haemodynamic and echocardiographic parameters are shown in Table 2. There was a strong negative correlation between PwD and 6MWD (r = –0.63, p < 0.001) (Table 2, Fig. 2), and also between mPAP calculated from RHC and 6MWD (r = –0.79, p < 0.001) (Fig. 3). There was a positive correlation between PwD and mPAP calculated from RHC (r = 0.34, p = 0.04) (Table 2).
In the multiple linear regression analysis, PwD and mPAP determined by RHC were independently related to functional capacity tested by 6MWD (Tables 3, 4). The multiple linear regression analysis yielded a formula to predict 6MWD:
6MWD = 578.2 (as a constant) – 1.37 × PwD – 3.03 × mPAP by RHC
There was a significant correlation between PwD, RV size and systolic PAP measured by echocardiography in the patient population (r = 0.51, p < 0.01; r = 0.36, p = 0.04, respectively)
Table 1. Baseline demographic, haemodynamic, echocardiographic and electrocardiographic parameters of the patients and control group
Variables Min, Max Mean ± SD
Age (year) 24, 74 47.9 ± 15.08
Cath meanPre (mmHg) 25, 109 52.21± 24.33
Cath sysPre (mmHg) 39, 153 80.12 ± 34.08
Cath diastPre (mmHg) 12, 67 30.75 ± 15.49
6MWD (m) 170, 530 339.39 ± 104.63
sPAP echo (mmHg) 45, 120 82 ± 24.57
TAPSE (mm) 13, 21 16.06 ± 1.93
ProBNP (pg/ml) 99, 3141 791.6 ± 787.8
PVR (Wood) 4.3, 26.7 10.46 ± 5.72
CI (l/min/m2) 1.7, 2.6 2.15 ± 0.26
RA size (cm) 2.8, 5.4 4.78 ± 5.37
RV size (cm) 2.6, 4.7 3.26 ± 0.53
Pmax (ms) 80, 200 112.12 ± 36.03
Pmin (ms) 40, 80 52.72 ± 16.44
PwD (ms) 20, 120 59.39 ± 28.93
Pmax (control) (ms) 60, 100 77.5 ± 13.19
Pmin (control) (ms) 40, 80 52.5 ± 17.41
PwD (control) (ms) 0, 40 25 ± 12.44
RV size (control) (cm) 2.2, 2.8 2.46 ± 0.16
RA size (control) (cm) 2.6, 3.3 2.96 ± 0.18
TAPSE (control) (mm) 16, 23 18.87 ± 1.8
Cath meanPre, mean catheter pressure of pulmonary artery; Cath sysPre, systolic catheter pressure of pulmonary artery; Cath diastPre, diastolic cath-eter pressure of pulmonary artery; 6MWD, six-minute walk distance; sPAP echo, systolic pulmonary arterial pressure measured with echocardiography; TAPSE, tricuspid annular-plane systolic excursion; ProBNP, N-terminal brain natriuretic peptide; PVR, pulmonary vascular resistance; CI, cardiac index; RA, right atrial; RV, right ventricular; Pmax, maximum P-wave duration; Pmin, minimum P-wave duration; PwD, P-wave dispersion; Pmax (control), maximum P-wave duration of the control group; Pmin control, minimum P-wave duration of the control group; PwD (control), P-wave dispersion of the control group; RV size (control), right ventricular size of the control group; RA size (control), right atrial size of the control group; TAPSE (control), tricuspid annular-plane systolic excursion of the control group.
Table 2. Correlations between the 6MWD, mean catheter pressure of pulmonary artery, P-wave dispersion and other haemodynamic
and echocardiographic parameters
Correlations
Cath meanPre TAPSE
Pro BNP PVR RV size PwD 6MWD
sPAP echo
Cath meanPre
r 1 –0.85 0.67 0.93 0.62 0.34 –0.79 0.85
p < 0.001 < 0.001 < 0.001 < 0.001 0.04 < 0.001 < 0.001
6MWD
r –0.79 0.68 –0.61 –0.63 –0.65 –0.63 1 –0.74
p < 0.001 < 0.001 < 0.001 < 0.001 < 0.001 < 0.001 < 0.001 < 0.001
Cath meanPre, mean catheter pressure of pulmonary artery; 6MWD, six-minute walk distance; TAPSE, tricuspid annular-plane systolic excursion; ProBNP, N-terminal brain natriuretic peptide; PVR, pulmonary vascular resistance; RV, right ventricular; PwD, P-wave dispersion; sPAP echo, systolic pulmonary arterial pres-sure measured with echocardiography.
Six-minute walk distance (m)
Pw
D (
msn
)
R2 linear = 0.398
Fig. 2. Correlations between the six-minute walk distance and P-wave dispersion in scatterplots.
CARDIOVASCULAR JOURNAL OF AFRICA • Advance Online Publication, September 20194 AFRICA
(Table 5). There was no correlation between PwD, TAPSE, and RA and RV size in the control group (r = –0.22, p = 0.22; r = –0.09, p = 0.60; r = –0.30, p = 0.09, respectively) (Table 6).
DiscussionTo the best of our knowledge, this study is the first investigating the relationship between PwD, functional capacity and haemodynamic parameters in PAH. PwD and mPAP obtained by RHC were found to be independent predictors of functional capacity in PAH patients.
PwD has been used in an extensive list of clinical conditions. P-wave duration and PwD reveal prolongation of the intra- and inter-atrial conduction time and inhomogeneous propagation of sinus impulses, which are well-known electrophysiological characteristics in patients with atrial arrhythmias and especially paroxysmal atrial fibrillation.5 PwD has been used in the assessment of risk for atrial fibrillation in patients without
Table 3. Multiple linear regression model to identify independent predictors of 6MWD test for functional capacity of PAH patients
Model
Unstandardised coefficientsStandardised coefficients
p-valueB Std error Beta
1 (Constant) 694.18 261.15 0.01
TAPSE –5.33 9.81 –0.09 0.59
ProBNP –0.007 0.02 –0.05 0.73
PwD –1.09 0.44 –0.30 0.02
RV size –13.72 25.29 –0.07 0.59
PVR 8.73 6.06 0.41 0.16
CI 2.61 87.58 0.007 0.97
sPAP echo –0.68 0.84 –0.16 0.42
Age 0.51 0.91 0.07 0.57
MeanPAPcath –4.15 1.48 –0.92 0.01
2 (Constant) 699.25 194.06
TAPSE –5.28 9.43 –0.09
ProBNP –0.007 0.02 –0.05
PwD –1.09 0.40 –0.30
RV size –13.54 24.01 –0.06
PVR 8.66 5.46 0.41
sPAP echo –0.69 0.80 –0.16
Age 0.53 0.78 0.07
MeanPAPcath –4.15 1.45 –0.92
3 (Constant) 692.31 189.47
TAPSE –4.95 9.21 –0.09 0.59
PwD –1.12 0.39 –0.31 < 0.01
RV size –13.09 23.54 –0.06 0.58
PVR 8.12 5.15 0.38 0.12
sPAP echo –0.79 0.73 –0.18 0.29
Age 0.64 0.7 0.09 0.37
MeanPAPcath –4.06 1.4 –0.9 < 0.01
4 (Constant) 599 74.61 < 0.001
PwD –1.11 0.38 –0.31 < 0.01
RV size –13.6 23.18 –0.06 0.56
PVR 8.11 5.07 0.38 0.12
sPAP echo –0.75 0.72 –0.17 0.30
Age 0.56 0.68 0.07 0.41
MeanPAPcath –3.76 1.26 –0.83 < 0.01
MeanPAPcath, mean catheter pressure of pulmonary artery; 6MWD, six-minute walk distance; sPAP echo, systolic pulmonary arterial pressure measured with echocardiography; TAPSE, tricuspid annular-plane systolic excursion; ProBNP, N-terminal brain natriuretic peptide; PVR, pulmonary vascular resis-tance; CI, cardiac index; RV, right ventricular; PwD, P-wave dispersion.
Table 4. Multiple linear regression model to identify independent predictors of 6MWD test for functional capacity of PAH patients
Model
Unstandardised coefficientsStandardised coefficients
p-valueB Std error Beta
5 (Constant) 565.46 47.33 < 0.001
PwD –1.2 0.34 –0.33 < 0.01
PVR 7.88 4.99 0.37 0.12
sPAP echo –0.78 0.71 –0.18 0.27
Age 0.62 0.66 0.08 0.36
MeanPAPcath –3.83 1.24 –0.85 < 0.01
6 (Constant) 596.5 33.55 < 0.001
PwD –1.16 0.34 –0.32 < 0.01
PVR 7.79 4.98 0.37 0.129
sPAP echo –0.64 0.69 –0.15 0.36
MeanPAPcath –4.1 1.2 –0.91 < 0.01
7 (Constant) 574.83 24.06 < 0.001
PwD –1.2 0.34 –0.33 < 0.01
PVR 7.20 4.93 0.03 0.15
MeanPAPcath –4.54 1.108 –1.008 < 0.001
8 (Constant) 578.2 24.42 < 0.001
PwD –1.37 0.32 –0.38 < 0.001
MeanPAPcath –3.03 0.41 –0.67 < 0.001
MeanPAPcath, mean catheter pressure of pulmonary artery; 6MWD, six-minute walk distance; sPAP echo, systolic pulmonary arterial pressure measured with echocardiography; PVR, pulmonary vascular resistance; PwD, P-wave dispersion.
Table 5. Correlation between echocardiographic and ECG parameters in the patient population
TAPSE RA size RV size sPAP echo
PwD r –0.31 0.05 0.51 0.36
p 0.07 0.74 < 0.01 0.04
TAPSE, tricuspid annular-plane systolic excursion; RA, right atrial; RV, right ventricular; sPAP echo, systolic pulmonary arterial pressure measured with echocardiography; PwD, P-wave dispersion.
Mea
n ca
thet
er p
ress
ure
(mm
Hg)
Six-minute walk distance (m)
R2 linear = 0.625
Fig. 3. Correlations between the six-minute walk distance and mean catheter pressure of the pulmonary artery in scatterplots.
Table 6. Correlation between echocardiographic and ECG parameters in the control group
TAPSE RA size RV size
PwD r –0.22 –0.09 –0.30
p 0.22 0.60 0.09
TAPSE, tricuspid annular-plane systolic excursion; RA, right atrial; RV, right ventricular; PwD, P-wave dispersion.
CARDIOVASCULAR JOURNAL OF AFRICA • Advance Online Publication, September 2019AFRICA 5
obvious heart disease, coronary artery disease, hypertension, valvular heart diseases, heart failure, congenital heart diseases, rheumatological diseases and various clinical situations.5 PwD has been demonstrated to be a sensitive and specific ECG predictor of atrial fibrillation in various clinical settings.5 In our study, we found a strong correlation between PwD, mPAP and functional status in PAH patients.
Factors reflecting RV function as assessed by RHC, including mPAP, cardiac output and cardiac index, have been shown to be significant predictors of survival time in PAH. In addition, a range of other factors that reflect RV structure and function, including echocardiographic parameters, exercise capacity and serum biomarkers, have been shown to be of prognostic value.10-12 PwD is an easily calculated ECG parameter that has been found to have a strong correlation with the haemodynamic parameters shown to be of prognostic value. Our study also showed that PwD is an independent predictor of functional status in PAH patients.
The 6MWD is currently the only exercise end-point accepted by the Food and Drug Administration and European Agency for the Evaluation of Medicinal Products for studies evaluating treatment effects in PAH.13 It is a good indicator of prognosis11 and has been shown to decrease in proportion to the severity of World Health Organisation functional class, and to correlate with cardiac output, total pulmonary resistance14 and changes in PVR.15 A 6MWD ≥ 500 m should be the goal of therapy, while a 6MWD ≤ 300 m should prompt intensification of treatment.13 Since we have a formula, we can easily calculate the 6MWD to estimate the adequacy of treatment and prognosis of the patient.
In the setting of PAH and RV failure, when RV end-diastolic volumes and pressures increase, increased RV wall stress leads to reduced RV stroke volume. Elevated RV end-diastolic volumes also cause tricuspid annular dilatation, which worsens tricuspid valve insufficiency and increases atrial wall tension. Mercurio et al. demonstrated that during the course of PAH, atrial fibrillation is a predictor of a poor prognosis.16 PwD is a good predictor of atrial fibrillation.5
Although there has been significant development in our understanding of PAH and its management over the years, there is a need for further studies. In particular, despite its importance, the right ventricle has been less well studied, as have the processes underlying pulmonary vascular remodelling and strategies to modify it. There is still much to learn about the assessment of right heart function, and we have not identified ideal alternate markers for PAH. Catheterisation remains the gold standard, but is invasive and complex. Evidence is accumulating for additional measurements for predicting prognosis of PAH patients. PwD is a more robust method of predicting prognosis in patients and may be a directive to treatment.
Our study has some limitations. One is the small number of patients because of the exclusion criteria of our study. However, it was important for the correct patient selection to exclude compounding factors and strengthen the study. In addition, our study did not include follow up of patients to reveal their prognosis. Finally, the correlations between echocardiography and ECG (P-wave dispersion) were in some cases very low. P-wave dispersion reflects the ‘invasive state’ of patients.
ConclusionTo the best of our knowledge, our study is the first investigating
the relationship between PwD, functional capacity and haemodynamic parameters in PAH. PwD and mPAP obtained by RHC were found to be independent predictors of functional capacity in PAH patients. PwD is easily calculated from surface ECG to indirectly estimate the invasive status and prognosis of patients.
Special thanks go to Samet Emet for the English editing of our manuscript.
References1. Farber HW, Loscalzo J. Pulmonary arterial hypertension .N Engl J Med
2004; 351(16): 1655–1665.
2. Galiè N, Humbert M, Vachiery JL, Gibbs S, Lang I, Torbicki A, et al.
2015 ESC/ERS guidelines for the diagnosis and treatment of pulmonary
hypertension: the Joint Task Force for the Diagnosis and Treatment
of Pulmonary Hypertension of the European Society of Cardiology
(ESC) and the European Respiratory Society (ERS): endorsed by:
Association for European Paediatric and Congenital Cardiology
(AEPC), International Society for Heart and Lung Transplantation
(ISHLT). Eur Heart J 2016; 37(1): 67–119.
3. Voelkel NF, Quaife RA, Leinwand LA, Barst RJ, McGoon
MD, Meldrum DR, et al.; National Heart, Lung, and Blood Institute
Working Group on Cellular and Molecular Mechanisms of Right Heart
Failure. Right ventricular function and failure: report of a National
Heart, Lung, and Blood Institute working group on cellular and
molecular mechanisms of right heart failure. Circulation 2006; 114(17):
1883–1891.
4. Badagliacca R, Poscia R, Pezzuto B, Papa S, Reali M, Pesce F, et al.
Prognostic relevance of right heart reverse remodelling in idiopathic
pulmonary arterial hypertension. J Heart Lung Transplant 2017; 10(2):
1053–2498.
5. Okutucu S, Aytemir K, Oto A. P-wave dispersion: What we know till
now? J R Soc Med Cardiovasc Dis 2016; 5: 2048004016639443.
6. Pérez-Riera AR, de Abreu LC, Barbosa-Barros R, Grindler J, Fernandes-
Cardoso A, Baranchuk A. P-wave dispersion: an update. Indian Pacing
Electrophysiol J 2016; 16(4): 126–133.
7. Rudski LG, Lai WW, Afilalo J, Hua L, Handschumacher MD,
Chandrasekaran K, et al. Guidelines for the echocardiographic assess-
ment of the right heart in adults: a report from the American
Society of Echocardiography endorsed by the European Association
of Echocardiography, a registered branch of the European Society of
Cardiology, and the Canadian Society of Echocardiography. J Am Soc
Echocardiogr 2010; 23: 685–713.
8. Lang RM, Badano LP, Mor-Avi V, Afilalo J, Armstrong A, et
al. Recommendations for cardiac chamber quantification by echo-
cardiography in adults: an update from the American Society of
Echocardiography and the European Association of Cardiovascular
Imaging. Eur Heart J Cardiovasc Imaging 2015; 16: 233–271.
9. Davidson CJ, Bonow RO. Cardiac catheterization. In: Bonow RO,
Mann DL, Zipes DP, Libby P, eds. Braunwald’s Heart Disease: A
Textbook of Cardiovascular Medicine. 10th edn. Philadelphia: Saunders,
2015, chapter 19.
10. Benza RL, Miller DP, Gomberg-Maitland M, Frantz RP, Foreman AJ,
Coffey CS, et al. Predicting survival in pulmonary arterial hypertension:
insights from the Registry to Evaluate Early and Long-Term Pulmonary
Arterial Hypertension Disease Management (REVEAL). Circulation
2010; 122: 164–172.
11. Humbert M, Sitbon O, Chaouat A, Bertocchi M, Habib G, Gressin
V, et al. Survival in patients with idiopathic, familial, and anorexigen-
CARDIOVASCULAR JOURNAL OF AFRICA • Advance Online Publication, September 20196 AFRICA
associated pulmonary arterial hypertension in the modern management
era. Circulation 2010; 122: 156–163.
12. D’Alonzo GE, Barst RJ, Ayres SM, Bergofsky EH, Brundage BH, Detre
KM, et al. Survival in patients with primary pulmonary hypertension.
Results from a national prospective registry. Ann Intern Med 1991; 115:
343–349.
13. Galiè N, Hoeper MM, Humbert M, Torbicki A, Vachiery JL, Barbera
JA, et al; ESC Committee for Practice Guidelines (CPG). Guidelines for
the diagnosis and treatment of pulmonary hypertension: the Task Force
for the Diagnosis and Treatment of Pulmonary Hypertension of the
European Society of Cardiology (ESC) and the European Respiratory
Society (ERS), endorsed by the International Society of Heart and Lung
Transplantation (ISHLT). Eur Heart J 2009; 30: 2493–2537.
14. Miyamoto S, Nagaya N, Satoh T, Kyotani S, Sakamaki F, Fujita M, et
al. Clinical correlates and prognostic significance of six-minute walk
test in patients with primary pulmonary hypertension. Comparison with
cardiopulmonary exercise testing. Am J Respir Crit Care Med 2000; 161:
487–492.
15. FDA Advisory Committee Briefing Document Cardiovascular and Renal
Drugs Advisory Committee. Use of DPVRI for dosing recommenda-
tions of adult-approved drugs in pediatric PAH patients. www.fda.gov/
downloads/AdvisoryCommittees/CommitteesMeetingMaterials/Drugs/
CardiovascularandRenalDrugsAdvisoryCommittee/UCM220250.pdf
Date last updated: July 29, 2010. Date last accessed: July 21, 2011.
16. Mercurio V, Peloquin G, Bourji KI, Diab N, Sato T, Enobun B, et al.
Pulmonary arterial hypertension and atrial arrhythmias: incidence, risk
factors, and clinical impact. Pulm Circ 2018; 8(2): 2045894018769874.