Embed Size (px)
Citation preview

S1
Statins for primary prevention
Colin Baigent
Professor of Epidemiology
CTSU, University of Oxford
Cardiology Update, Davos, 2013

First CTT cycle: Relation between the proportional
reduction in MAJOR VASCULAR EVENTS and mean
absolute LDL-C reduction at 1 year in 14 statin trials
Lancet 2005; 366: 1267–78

Less statin
Proportional effects on MAJOR VASCULAR EVENTSper mmol/L reduction in LDL cholesterol
0.4 0.6 0.8 1 1.2 1.4
No. of events (% pa)Statin/
More statinControl/ Relative risk (CI)
Statin/morestatin better
Control/lessstatin better
Nonfatal MI
CHD death
Any major coronary event
CABG
PTCA
Unspecified
Any coronary revascularisation
Ischaemic stroke
Haemorrhagic stroke
Unknown stroke
Any stroke
Any major vascular event
3485 (1.0)
1887 (0.5)
5105 (1.4)
1453 (0.4)
1767 (0.5)
2133 (0.6)
5353 (1.5)
1427 (0.4)
257 (0.1)
618 (0.2)
2302 (0.6)
10973 (3.2)
4593 (1.3)
2281 (0.6)
6512 (1.9)
1857 (0.5)
2283 (0.7)
2667 (0.8)
6807 (2.0)
1751 (0.5)
220 (0.1)
709 (0.2)
2680 (0.8)
13350 (4.0)
0.73 (0.69 - 0.78)
0.80 (0.74 - 0.87)
0.76 (0.73 - 0.78)
0.75 (0.69 - 0.82)
0.72 (0.65 - 0.80)
0.76 (0.70 - 0.82)
0.75 (0.72 - 0.78)
0.79 (0.72 - 0.87)
1.12 (0.88 - 1.43)
0.88 (0.76 - 1.01)
0.84 (0.79 - 0.89)
0.78 (0.76 - 0.80)
99% or 95% CI

SIMVASTATIN
(originally)
PLACEBO
(originally)
HPS: In-trial and post-trial effects on MVE riskof 5-year allocation to simvastatin vs placebo
Years of follow-up
Perc
en
tage
su
ffe
rin
g e
ve
nt
Lancet 2011

Cochrane Library press release (2011)
Cholesterol-lowering statins are first line treatments for heart patients and the benefits are well established
.…. less evidence that statins are beneficial in those who have no history of CVD, given that the absolute numbers of people who benefit will inevitably be lower, and statinsare recognised as having harmful effects in some people.
….Therefore, in people at low risk of heart disease, statinsmight do more harm than good.”
“Statins: Benefits Questionable In Low-Risk Patients

CTT meta-analysis: Effects on MAJOR VASCULAR EVENTS per mmol/L LDL-C reduction subdivided by RISK
Events (% per annum)
RR (CI) Trend testStatin/more Control/less
5-year MVE risk
at baseline
99% or 95% limits
Control/less
better
<5% 167 (0.4) 254 (0.6) 0.62 (0.47 - 0.81)
5%,<10% 604 (1.1) 847 (1.6) 0.69 (0.60 - 0.79)
10%,<20% 3614 (3.0) 4195 (3.5) 0.79 (0.74 - 0.85)
20%,<30% 4108 (4.7) 4919 (5.8) 0.81 (0.77 - 0.86)
30% 2787 (7.6) 3458 (9.8) 0.79 (0.74 - 0.84)
Overall 11280 (3.3) 13673 (4.0)0.79 (0.77 - 0.81)
p<0.0001
0.5 0.75 1 1.25 1.5
Statin/more
better
c1
2=4.29
(p=0.04)
Lancet 2012

Proportional effects on components ofMAJOR VASCULAR EVENT per mmol/L LDL-C reduction
Events (% per annum)RR (CI) Trend testStatin/more Control/less
5-year MVE risk
at baseline
Major coronary event
Any stroke
Coronary revascularisation
0.5 0.75 1 1.25 1.599% or 95% limits
Control/less
better
Statin/more
better
<5% 50 (0.1) 88 (0.2) 0.57 (0.36 - 0.89)5%,<10% 276 (0.5) 435 (0.8) 0.61 (0.50 - 0.74)10%,<20% 1644 (1.3) 1973 (1.6) 0.77 (0.69 - 0.85)20%,<30% 1789 (1.9) 2282 (2.5) 0.77 (0.71 - 0.83)30% 1471 (3.7) 1887 (4.9) 0.78 (0.72 - 0.84)
<5% 71 (0.2) 90 (0.2) 0.74 (0.46 - 1.19)5%,<10% 190 (0.3) 240 (0.4) 0.77 (0.60 - 0.98)10%,<20% 797 (0.6) 907 (0.7) 0.86 (0.75 - 0.98)20%,<30% 781 (0.8) 900 (1.0) 0.86 (0.75 - 0.97)30% 571 (1.5) 661 (1.7) 0.86 (0.75 - 0.99)
<5% 73 (0.2) 135 (0.3) 0.52 (0.35 - 0.75)5%,<10% 224 (0.4) 342 (0.6) 0.63 (0.51 - 0.79)10%,<20% 1706 (1.4) 2061 (1.7) 0.75 (0.67 - 0.83)20%,<30% 2206 (2.5) 2717 (3.1) 0.79 (0.73 - 0.86)30% 1260 (3.3) 1655 (4.4) 0.76 (0.69 - 0.83)
Overall 5230 (1.5) 6665 (1.9) 0.76 (0.73 - 0.79) p<0.0001
Overall 2410 (0.7) 2798 (0.8) 0.85 (0.80 - 0.89) p<0.0001
Overall 5469 (1.5) 6910 (2.0)0.76 (0.73 - 0.79)
p<0.0001
c12=5.66
(p=0.02)
c12=1.03
(p=0.3)
c12=4.93
(p=0.03)
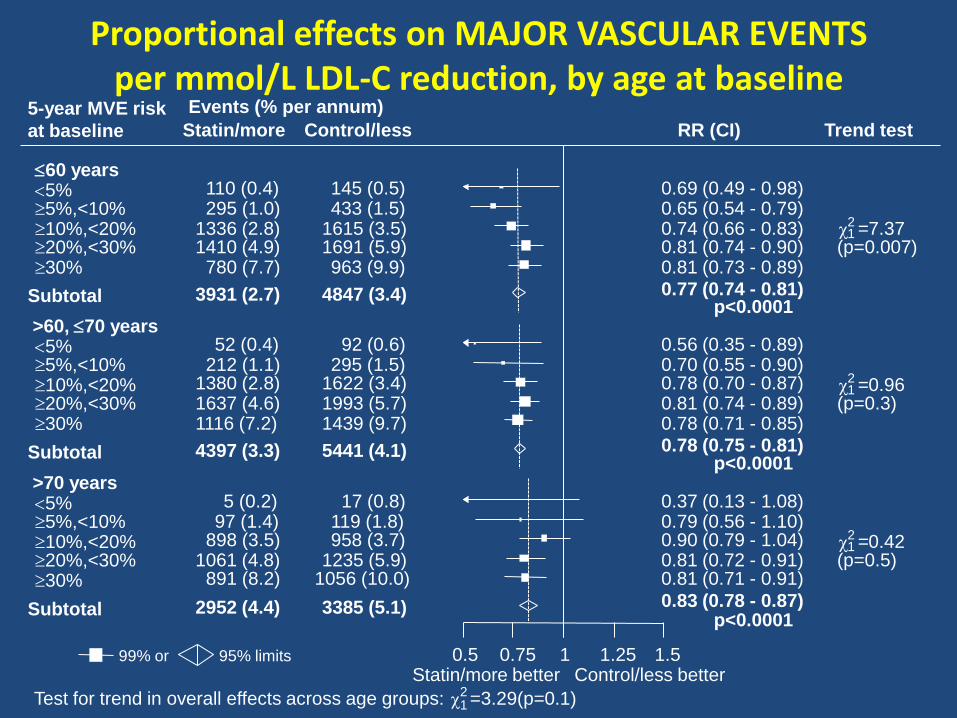
Proportional effects on MAJOR VASCULAR EVENTSper mmol/L LDL-C reduction, by age at baseline
Events (% per annum)
RR (CI) Trend testStatin/more Control/less5-year MVE risk
at baseline
60 years
>60, 70 years
>70 years
0.5 0.75 1 1.25 1.599% or 95% limits
Control/less betterStatin/more better
<5% 110 (0.4) 145 (0.5) 0.69 (0.49 - 0.98)5%,<10% 295 (1.0) 433 (1.5) 0.65 (0.54 - 0.79)10%,<20% 1336 (2.8) 1615 (3.5) 0.74 (0.66 - 0.83)20%,<30% 1410 (4.9) 1691 (5.9) 0.81 (0.74 - 0.90)30% 780 (7.7) 963 (9.9) 0.81 (0.73 - 0.89)
<5% 52 (0.4) 92 (0.6) 0.56 (0.35 - 0.89)5%,<10% 212 (1.1) 295 (1.5) 0.70 (0.55 - 0.90)10%,<20% 1380 (2.8) 1622 (3.4) 0.78 (0.70 - 0.87)20%,<30% 1637 (4.6) 1993 (5.7) 0.81 (0.74 - 0.89)30% 1116 (7.2) 1439 (9.7) 0.78 (0.71 - 0.85)
<5% 5 (0.2) 17 (0.8) 0.37 (0.13 - 1.08)5%,<10% 97 (1.4) 119 (1.8) 0.79 (0.56 - 1.10)10%,<20% 898 (3.5) 958 (3.7) 0.90 (0.79 - 1.04)20%,<30% 1061 (4.8) 1235 (5.9) 0.81 (0.72 - 0.91)30% 891 (8.2) 1056 (10.0) 0.81 (0.71 - 0.91)
Subtotal 3931 (2.7) 4847 (3.4) 0.77 (0.74 - 0.81) p<0.0001
Subtotal 4397 (3.3) 5441 (4.1) 0.78 (0.75 - 0.81) p<0.0001
Subtotal 2952 (4.4) 3385 (5.1) 0.83 (0.78 - 0.87) p<0.0001
c12 =7.37
(p=0.007)
c12 =0.96
(p=0.3)
c12 =0.42
(p=0.5)
Test for trend in overall effects across age groups: c12 =3.29(p=0.1)

Proportional effects on MAJOR VASCULAR EVENTS per mmol/L LDL-C reduction, by gender
Events (% per annum)
RR (CI) Trend testStatin/more Control/less
5-year MVE risk
at baseline
Female
Male
0.5 0.75 1 1.25 1.599% or 95% limits
Control/less
better
Statin/more
better
<5% 78 (0.3) 119 (0.5) 0.57 (0.38 - 0.86)
5%,<10% 196 (1.3) 232 (1.5) 0.84 (0.64 - 1.10)
10%,<20% 956 (3.0) 1071 (3.4) 0.88 (0.77 - 1.00)
20%,<30% 680 (4.9) 750 (5.7) 0.88 (0.76 - 1.02)
30% 429 (8.3) 522 (10.4) 0.79 (0.67 - 0.94)
<5% 89 (0.5) 135 (0.7) 0.66 (0.46 - 0.95)
5%,<10% 408 (1.0) 615 (1.6) 0.64 (0.55 - 0.75)
10%,<20% 2658 (2.9) 3124 (3.6) 0.76 (0.70 - 0.83)
20%,<30% 3428 (4.7) 4169 (5.8) 0.80 (0.75 - 0.85)
30% 2358 (7.5) 2936 (9.7) 0.79 (0.74 - 0.84)
Subtotal 2339 (2.6) 2694 (3.0) 0.84 (0.79 - 0.89) p<0.0001
Subtotal 8941 (3.5) 10979 (4.4)0.78 (0.76 - 0.80)
p<0.0001
c12=0.23
(p=0.6)
c12=6.73
(p=0.009)
Difference in overall effect between men and women: c1
2=5.23(p=0.02)

Proportional effects on VASCULAR DEATH per mmol/L LDL-C reduction, by history of vascular disease
Deaths (% per annum)RR/mM (CI) Trend testStatin/more Control/less
5-year MVE riskat baseline
Participants without prior vascular disease
Participants with prior vascular disease
All participants
0.5 0.75 1 1.25 1.5Control/less
betterStatin/more
better
31 (0.1) 40 (0.1) 0.80 (0.43 - 1.47)117 (0.2) 153 (0.3) 0.75 (0.55 - 1.04)
307 (0.9) 342 (1.0) 0.84 (0.67 - 1.05)
164 (2.3) 168 (2.3) 0.97 (0.72 - 1.32)93 (5.2) 98 (5.8) 0.88 (0.59 - 1.33)
48 (2.2) 52 (2.4) 0.93 (0.53 - 1.62)
193 (2.5) 177 (2.3) 1.07 (0.81 - 1.41)1166 (1.2) 1249 (1.3) 0.89 (0.79 - 1.00)
1432 (1.6) 1665 (1.9) 0.87 (0.80 - 0.95)1247 (3.1) 1435 (3.6) 0.87 (0.79 - 0.95)
79 (0.2) 92 (0.2) 0.87 (0.58 - 1.31)
310 (0.6) 330 (0.6) 0.92 (0.74 - 1.13)1473 (1.1) 1591 (1.2) 0.88 (0.79 - 0.97)
1596 (1.7) 1833 (1.9) 0.88 (0.81 - 0.96)1340 (3.2) 1533 (3.7) 0.87 (0.80 - 0.95)
Subtotal 712 (0.5) 801 (0.6) 0.85 (0.77 - 0.95) p= 0.004
Subtotal 4086 (1.8) 4578 (2.0)0.88 (0.84 - 0.92)
p<0.0001
Overall 4798 (1.3) 5379 (1.5)0.88 (0.84 - 0.91)
p<0.0001
c12=1.46
(p=0.2)
c12=1.49
(p=0.2)
c12=0.18
(p=0.7)
Heterogeneity between patients with and without prior
vascular disease: c12
=0.28 (p=0.6)
99% or 95% limits
<5%5%,<10%10%,<20%20%,<30%30%
<5%5%,<10%10%,<20%20%,<30%30%
<5%5%,<10%10%,<20%20%,<30%30%

Proportional effects on NON-VASCULAR DEATH per mmol/L LDL-C reduction, by history of vascular disease
Deaths (% per annum)RR/mM (CI) Trend testStatin/more Control/less
5-year MVE riskat baseline
Participants without prior vascular disease
Participants with prior vascular disease
All participants
0.5 0.75 1 1.25 1.5Control/less
betterStatin/more
better
Subtotal
Subtotal
Overall
Heterogeneity between patients with and without prior
vascular disease: c12
=0.17 (p=0.8)
99% or 95% limits
98 (0.2)
205 (0.4)352 (1.0)
169 (2.4)79 (4.4)
18 (0.8)
65 (0.8)702 (0.7)
794 (0.9)602 (1.5)
116 (0.3)
270 (0.5)
1054 (0.8)963 (1.0)
681 (1.6)
903 (0.7)
2181 (0.9)
3084 (0.8)
87 (0.2)
238 (0.5)377 (1.1)
148 (2.1)71 (4.2)
14 (0.6)
71 (0.9)727 (0.8)
793 (0.9)634 (1.6)
101 (0.2)
309 (0.6)
1104 (0.9)941 (1.0)
705 (1.7)
921 (0.7)
2239 (1.0)
3160 (0.9)
1.13 (0.76 - 1.69)
0.87 (0.67 - 1.11)0.94 (0.76 - 1.15)
1.13 (0.81 - 1.57)1.07 (0.68 - 1.69)
1.38 (0.53 - 3.63)
0.92 (0.61 - 1.41)0.95 (0.81 - 1.11)
0.98 (0.86 - 1.12)0.95 (0.82 - 1.09)
1.16 (0.80 - 1.68)
0.88 (0.71 - 1.09)
0.94 (0.83 - 1.07)1.00 (0.89 - 1.13)
0.96 (0.83 - 1.10)
0.97 (0.88 - 1.07) p= 0.60
0.96 (0.90 - 1.02) p= 0.18
0.96 (0.92 - 1.01) p= 0.16
c12=0.47
(p=0.5)
c12=0.04
(p=0.8)
c12=0.02
(p=0.9)
<5%5%,<10%10%,<20%20%,<30%30%
<5%5%,<10%10%,<20%20%,<30%30%
<5%5%,<10%10%,<20%20%,<30%30%
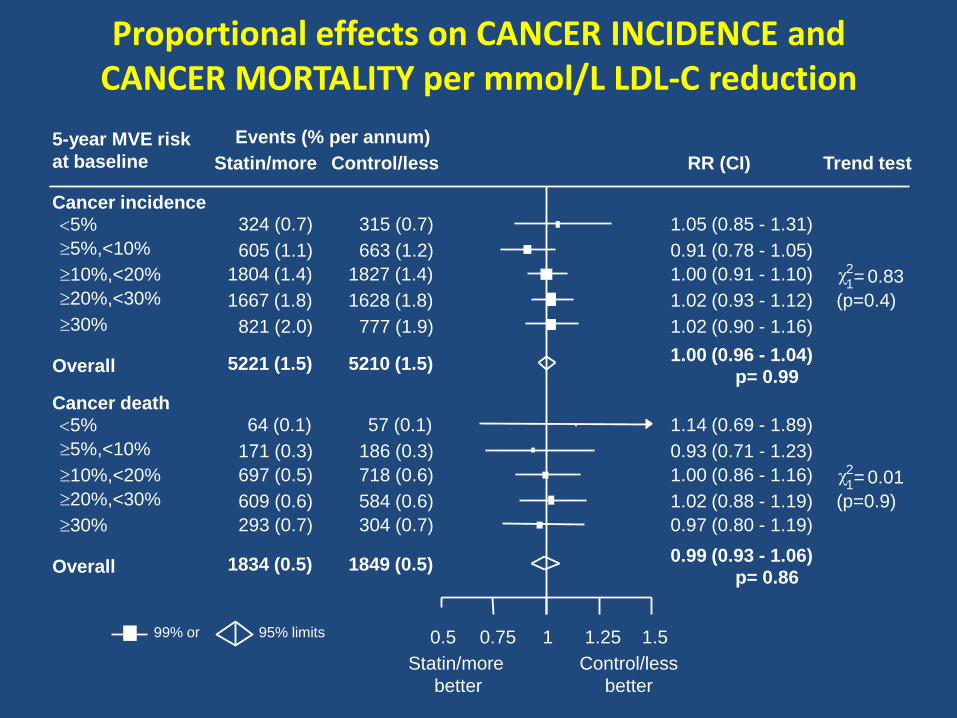
Proportional effects on CANCER INCIDENCE and CANCER MORTALITY per mmol/L LDL-C reduction
Events (% per annum)
RR (CI) Trend testStatin/more Control/less
5-year MVE risk
at baseline
Cancer incidence
Cancer death
0.5 0.75 1 1.25 1.599% or 95% limits
Control/less
better
Statin/more
better
<5% 324 (0.7) 315 (0.7) 1.05 (0.85 - 1.31)
5%,<10% 605 (1.1) 663 (1.2) 0.91 (0.78 - 1.05)
10%,<20% 1804 (1.4) 1827 (1.4) 1.00 (0.91 - 1.10)
20%,<30% 1667 (1.8) 1628 (1.8) 1.02 (0.93 - 1.12)
30% 821 (2.0) 777 (1.9) 1.02 (0.90 - 1.16)
<5% 64 (0.1) 57 (0.1) 1.14 (0.69 - 1.89)
5%,<10% 171 (0.3) 186 (0.3) 0.93 (0.71 - 1.23)
10%,<20% 697 (0.5) 718 (0.6) 1.00 (0.86 - 1.16)
20%,<30% 609 (0.6) 584 (0.6) 1.02 (0.88 - 1.19)
30% 293 (0.7) 304 (0.7) 0.97 (0.80 - 1.19)
Overall 5221 (1.5) 5210 (1.5) 1.00 (0.96 - 1.04) p= 0.99
Overall 1834 (0.5) 1849 (0.5) 0.99 (0.93 - 1.06) p= 0.86
c12= 0.83
(p=0.4)
c12= 0.01
(p=0.9)
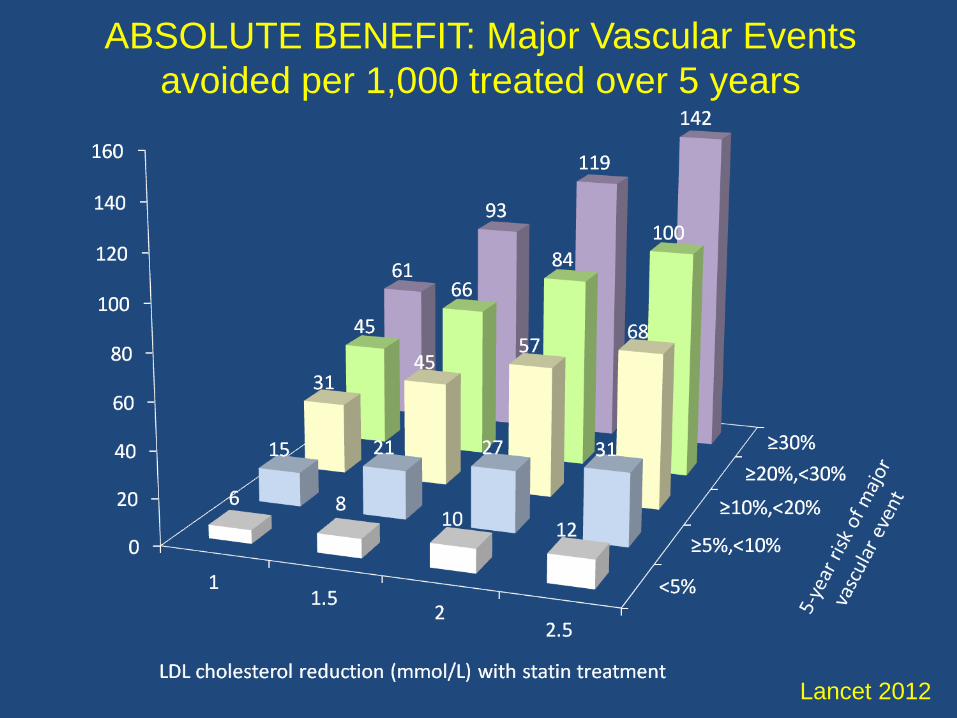
ABSOLUTE BENEFIT: Major Vascular Events
avoided per 1,000 treated over 5 years
Lancet 2012

Statin-related myopathy/rhabdomyolysis
Muscle disorder Definition Frequency(per annum)
Myopathy Creatine kinase (CK) >10x ULN with muscle symptoms
<1/10,000
Rhabdomyolysis Myopathy with CK >40x ULN and evidence of renal dysfunction
~1/100,000
Risk influenced by dose (e.g. 10-fold increase with 40 vs 80 mg
simvastatin), certain drugs and other factors (e.g. ethnicity)
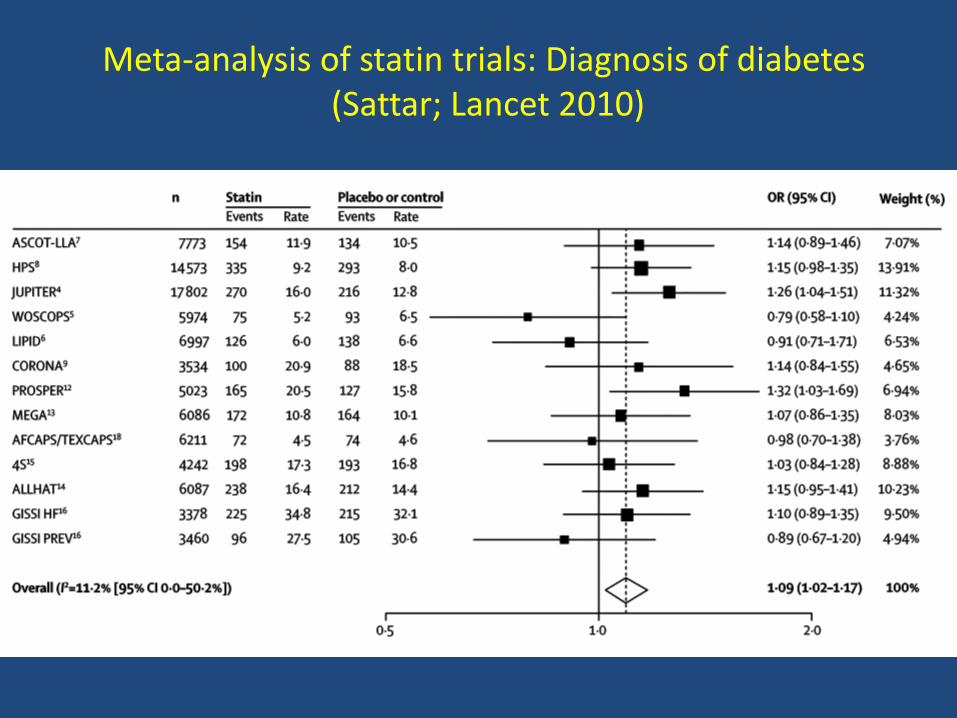
Meta-analysis of statin trials: Diagnosis of diabetes(Sattar; Lancet 2010)

Balance of benefits and risks of statin therapy in
LOWEST RISK individuals (<5% over 5 years)
5 year effects per mmol/L LDL-c reduction
per 1000 individuals treated with a statin:
• 6 fewer major vascular events*
VERSUS
• 0.5 more myopathy cases (0.1 rhabdomyolysis)
• 5 new diagnoses of diabetes mellitus
* includes 0.5 extra haemorrhagic strokes
March 2010

Effects of statins on risk of polyneuropathy
Gaist et al (Neurology 2002): Observational study
– 9 of 166 patients with idiopathic neuropathy had taken average of 15mg simvastatin daily (or equivalent of another statin) for 2.8 years
– Risk ratio of 3.7 (95%CI 1.8-7.6) for statin use
HPS (Lancet 2004): Randomised controlled trial
– 20,000 patients randomly allocated to receive
40mg simvastatin daily vs placebo for 5 years
– 11 (0.1%) statin vs 8 (0.1%) placebo cases
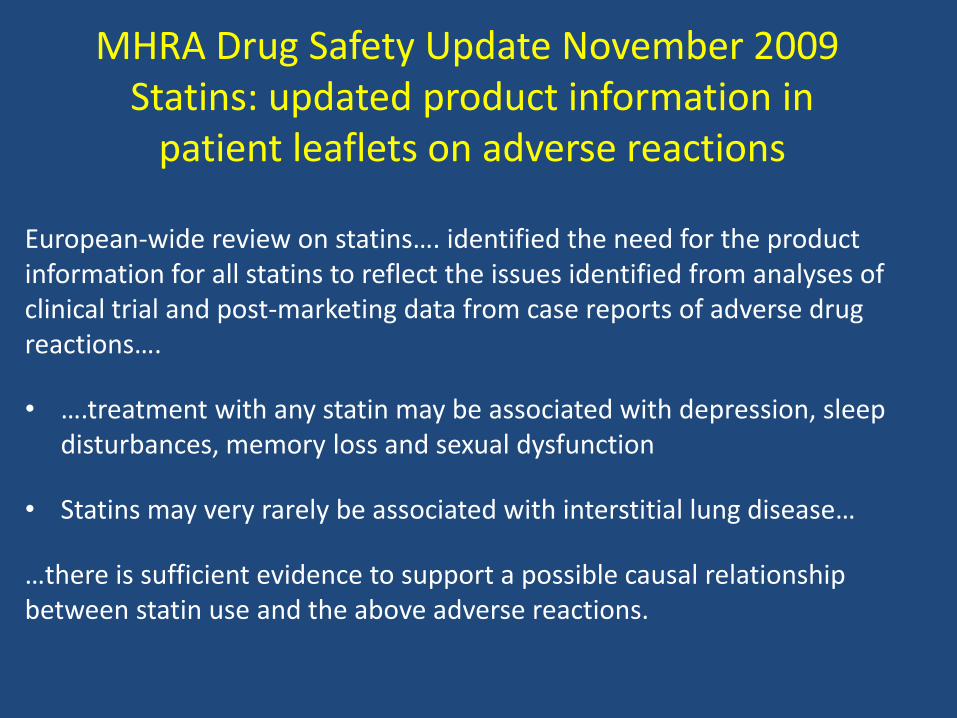
MHRA Drug Safety Update November 2009Statins: updated product information in
patient leaflets on adverse reactions
European-wide review on statins…. identified the need for the product information for all statins to reflect the issues identified from analyses of clinical trial and post-marketing data from case reports of adverse drug reactions….
• ….treatment with any statin may be associated with depression, sleep disturbances, memory loss and sexual dysfunction
• Statins may very rarely be associated with interstitial lung disease…
…there is sufficient evidence to support a possible causal relationship between statin use and the above adverse reactions.

Statins and interstitial lung disease: systematic review of literature and FDA
reports(Fernandez; Chest 2008)
“The evidence linking statins to lung injury is not definite. These cases of ILD reported as being due to statins could simply reflect background prevalence of ILD and that statins are not the cause…. Nevertheless such an association is possible.”
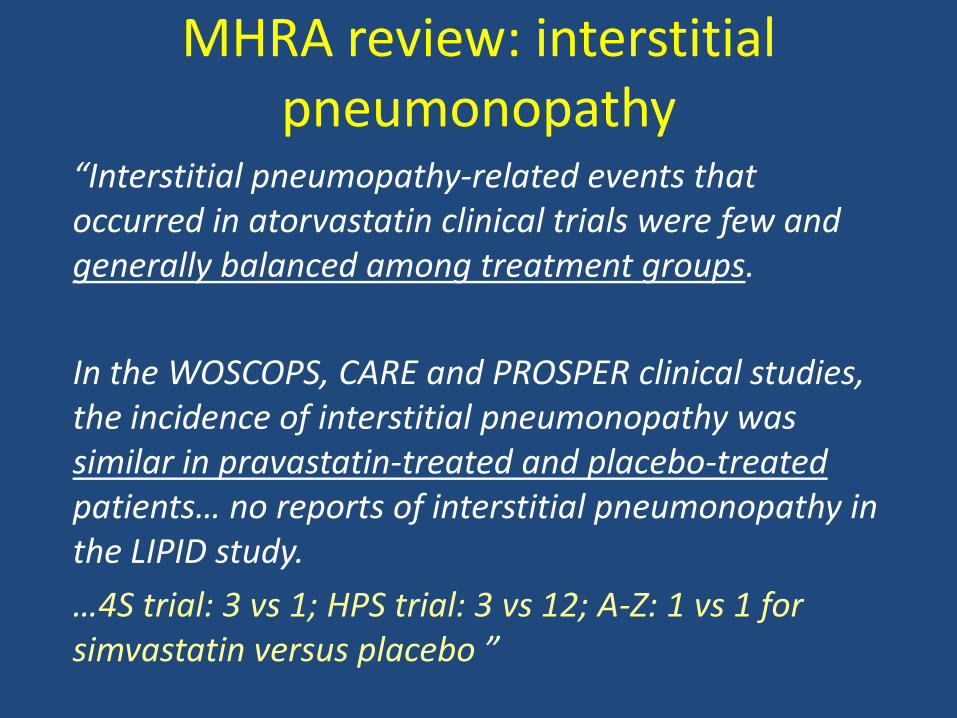
MHRA review: interstitial pneumonopathy
“Interstitial pneumopathy-related events that occurred in atorvastatin clinical trials were few and generally balanced among treatment groups.
In the WOSCOPS, CARE and PROSPER clinical studies, the incidence of interstitial pneumonopathy was similar in pravastatin-treated and placebo-treatedpatients… no reports of interstitial pneumonopathy in the LIPID study.
…4S trial: 3 vs 1; HPS trial: 3 vs 12; A-Z: 1 vs 1 for simvastatin versus placebo ”
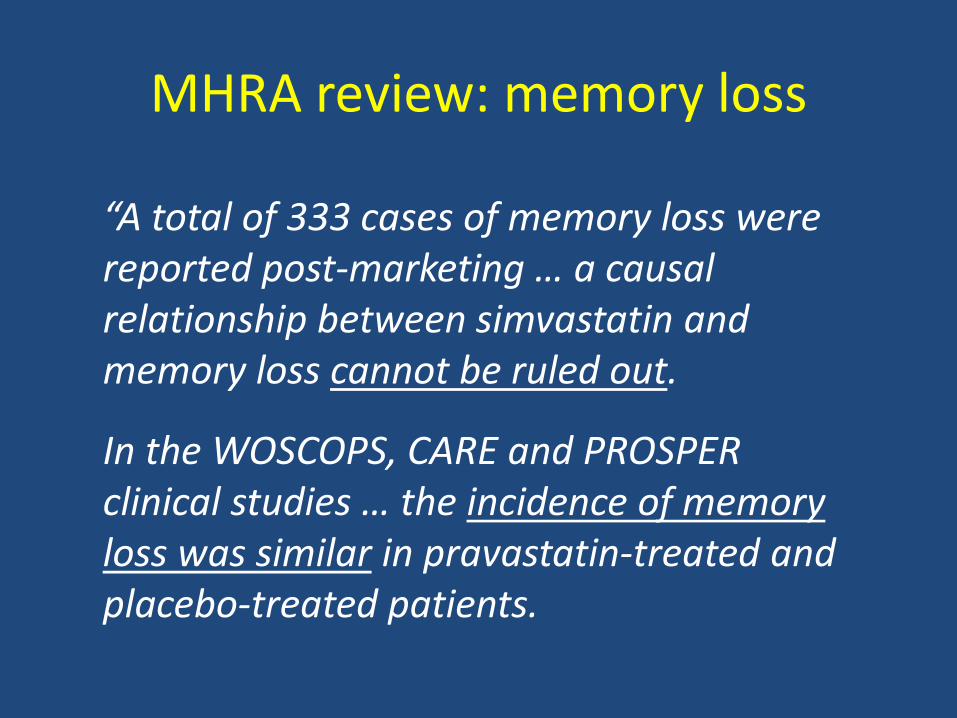
MHRA review: memory loss
“A total of 333 cases of memory loss were reported post-marketing … a causal relationship between simvastatin and memory loss cannot be ruled out.
In the WOSCOPS, CARE and PROSPER clinical studies … the incidence of memory loss was similar in pravastatin-treated and placebo-treated patients.
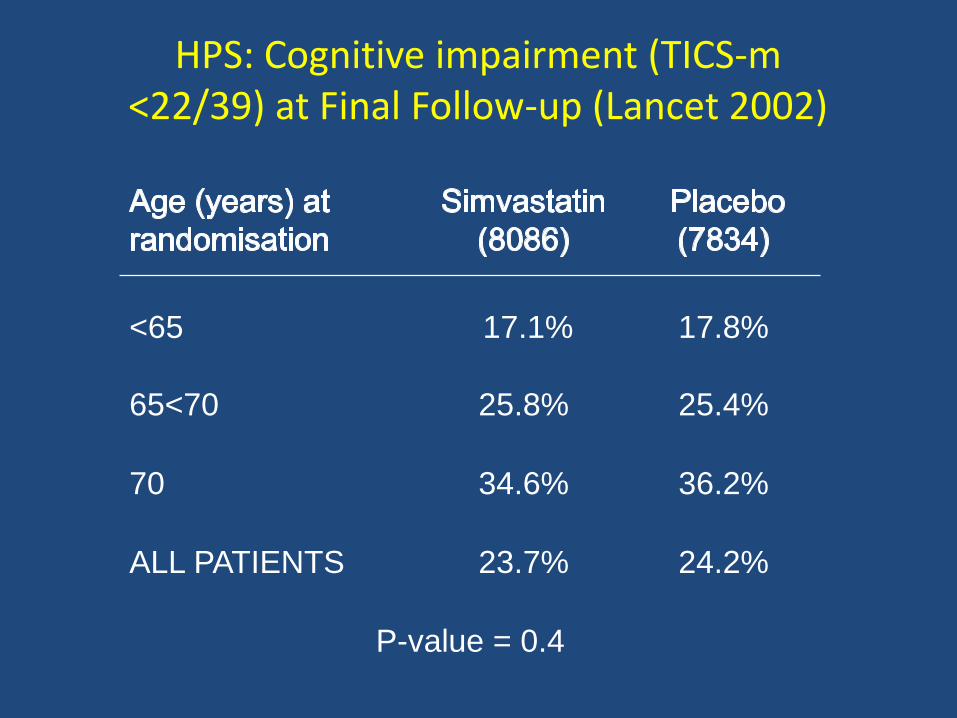
HPS: Cognitive impairment (TICS-m <22/39) at Final Follow-up (Lancet 2002)
<65 17.1% 17.8%
65<70 25.8% 25.4%
70 34.6% 36.2%
ALL PATIENTS 23.7% 24.2%
P-value = 0.4

MHRA review: depression
“Depression-related event incidence was similar in the atorvastatin and placebo groupsin all individual studies that included placebo…
In the WOSCOPS, CARE, LIPID and PROSPER clinical studies…the incidence of depression was similar in pravastatin-treated and placebo-treated patients.
… similar incidence of depression has been reported between simvastatin and placebo.”
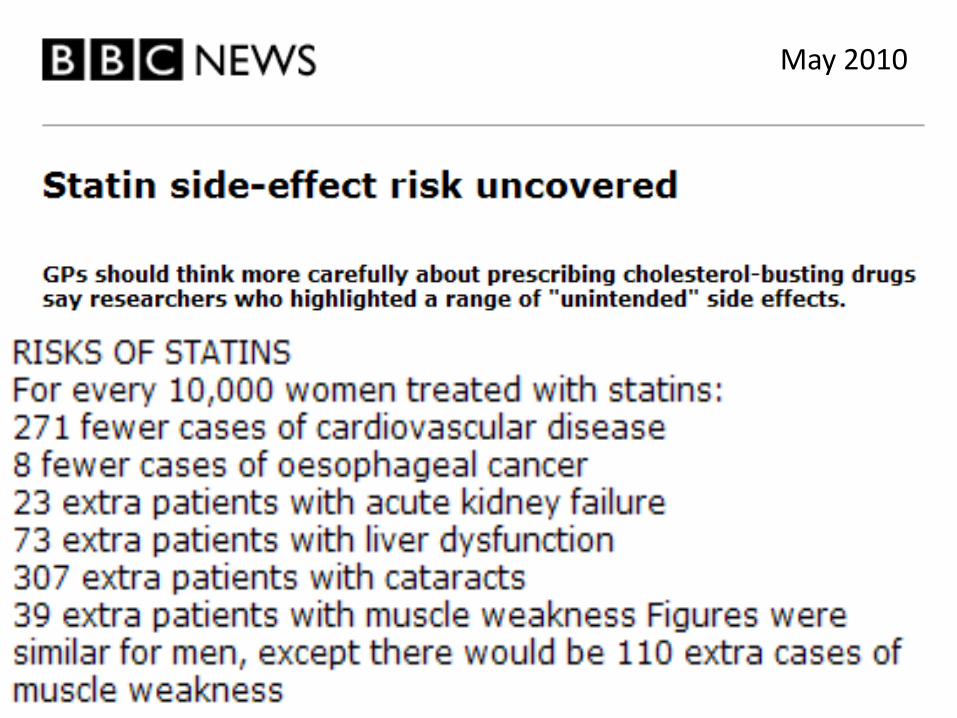
May 2010

Population-based cohort study: HR and NNT/NNH with statin over 5 years in men aged 35-74 with CV risk ≥20%
over 10 years (Hippisley-Cox; BMJ 2010)
Outcome HR (95% CI) NNT/NNH (95% CI)
CV events 0.76 (0.67 to 0.86) -33 (-57 to -24)
Cataract 1.32 (1.26 to 1.37) 52 (44 to 63)
Myopathy 6.15 (5.19 to 7.30) 91 (74 to 112)
Liver dysfunction 1.53 (1.42 to 1.66) 142 (115 to 180)
Acute renal failure 1.61 (1.39 to 1.87) 346 (245 to 539)
Based on average of only 2.5 years of statin exposure and partial adjustment for potential confounders

HPS randomised placebo-controlled trial of 40 mg simvastatin daily for 5
years: Effect on CATARACT
Simvastatin
(10,269)
Placebo
(10,267)
Cataract report
or extraction
393
(3.8%)
404
(3.9%)
Risk ratio (95% CI): 0.96 (0.84-1.11)

Low cholesterol and cancer
• Association between low blood cholesterol and increased cancer often seen in observational studies
• Previous tabular meta-analyses of randomised statin trials have generally been reassuring, but– Claims that statins might cause some types of
cancer (eg, breast, gastrointestinal)– Concerns about reducing cholesterol to very low
levels or reducing cholesterol in particular groups (eg, the elderly)
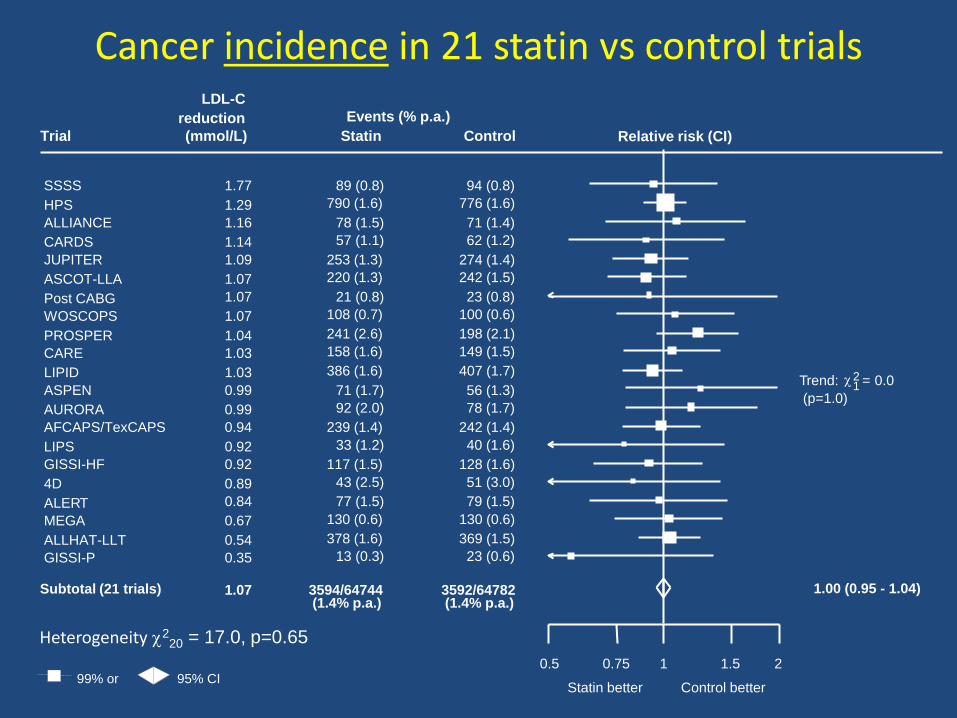
Cancer incidence in 21 statin vs control trials
0.5 0.75 1 1.5 2
Trial
Events (% p.a.)
LDL-C
reduction
(mmol/L) Statin Control
Control betterStatin better
Subtotal (21 trials) 3594/64744(1.4% p.a.)
3592/64782(1.4% p.a.)
1.07 1.00 (0.95 - 1.04)
Trend: c12 = 0.0
(p=1.0)
SSSS 89 (0.8) 94 (0.8)1.77
HPS 790 (1.6) 776 (1.6)1.29
ALLIANCE 78 (1.5) 71 (1.4)1.16
CARDS 57 (1.1) 62 (1.2)1.14
JUPITER 253 (1.3) 274 (1.4)1.09
ASCOT-LLA 220 (1.3) 242 (1.5)1.07
Post CABG 21 (0.8) 23 (0.8)1.07
WOSCOPS 108 (0.7) 100 (0.6)1.07
PROSPER 241 (2.6) 198 (2.1)1.04
CARE 158 (1.6) 149 (1.5)1.03
LIPID 386 (1.6) 407 (1.7)1.03
ASPEN 71 (1.7) 56 (1.3)0.99
AURORA 92 (2.0) 78 (1.7)0.99
AFCAPS/TexCAPS 239 (1.4) 242 (1.4)0.94
LIPS 33 (1.2) 40 (1.6)0.92
GISSI-HF 117 (1.5) 128 (1.6)0.92
4D 43 (2.5) 51 (3.0)0.89
ALERT 77 (1.5) 79 (1.5)0.84
MEGA 130 (0.6) 130 (0.6)0.67
ALLHAT-LLT 378 (1.6) 369 (1.5)0.54
GISSI-P 13 (0.3) 23 (0.6)0.35
99% or 95% CI
Relative risk (CI)
Heterogeneity c220 = 17.0, p=0.65

Requirements for evidence to support claims related to safety and efficacy of treatments
• Treatment not known to be effective
Lower threshold for safety concerns(compared with evidence for efficacy)
• Treatment known to be effective (e.g. statins)
Higher threshold for safety concerns(of similar strength to evidence thatis typically required for efficacy)
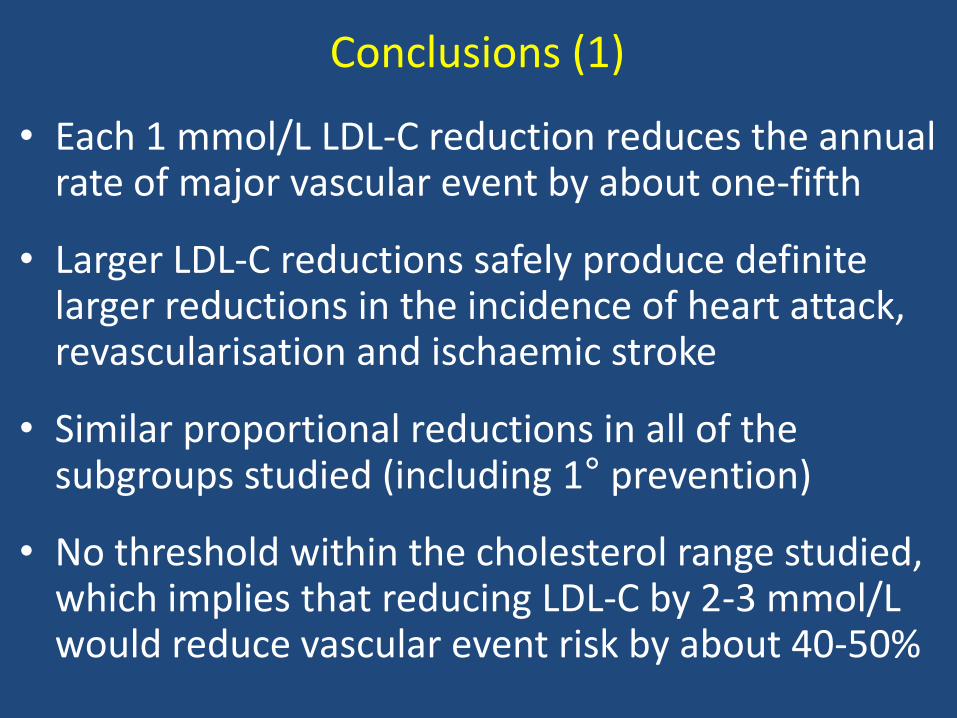
Conclusions (1)
• Each 1 mmol/L LDL-C reduction reduces the annual rate of major vascular event by about one-fifth
• Larger LDL-C reductions safely produce definite larger reductions in the incidence of heart attack, revascularisation and ischaemic stroke
• Similar proportional reductions in all of the subgroups studied (including 1° prevention)
• No threshold within the cholesterol range studied, which implies that reducing LDL-C by 2-3 mmol/L would reduce vascular event risk by about 40-50%

Conclusions (2)• Main determinants of the absolute benefit with statin
therapy are the presenting vascular risk level and the achieved absolute LDL-C reduction
• Aim to target patients at highest risk (based on prior disease and standard risk factors) , even in the absence of raised LDL cholesterol, and to lower their LDL-C substantially with the highest safe statin dose