Embed Size (px)
Citation preview
Raimund Erbel
Department of Cardiology
West-German Heart Center
University Duisburg-Essen
www.wdhz.de
Cardiology Update 2011
Davos
14. – 18. February 2011
Improvement of Risk Prediction for Coronary Events
using Signs of Subclinical Atherosclerosis and Biomarkers

Leszek K Borysiewicz Kerstin Dudas et. al. Circulation 123:46-52, /2011
Proportion of CHD deaths
(%) within 28 days occurring
in hospital by sex, age, and
calendar year, 1991 to 2006.
Improvement of Risk Prediction for Coronary Events
using Signs of Subclinical Atherosclerosis and Biomarkers
Proportion of in-Hospital CHD Death
Women
Men

Mortality due to CHD in the
hospital (within 28 days) and out
of the hospital per 100 000
population 35 10 84 years of
age, 1991 to 2006.
Kerstin Dudas et. al. Circulation 123:46-52, /2011
Improvement of Risk Prediction for Coronary Events
using Signs of Subclinical Atherosclerosis and Biomarkers
Most Deaths of AMI occur out of the hospital
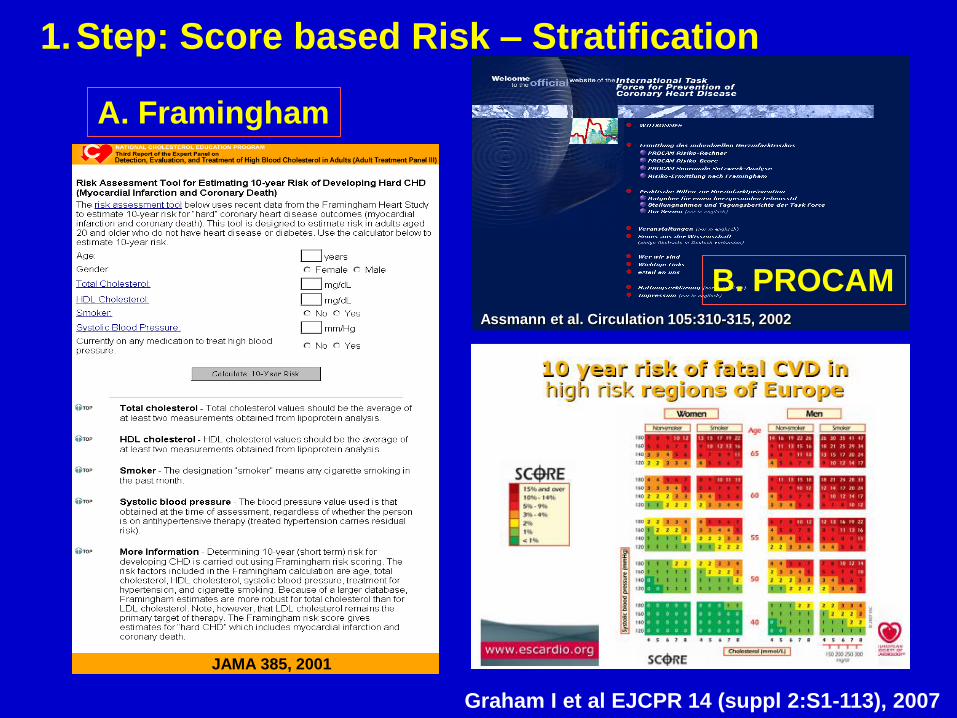
Assmann et al. Circulation 105:310-315, 2002
JAMA 385, 2001
B. PROCAM
A. Framingham
1.Step: Score based Risk – Stratification
Graham I et al EJCPR 14 (suppl 2:S1-113), 2007
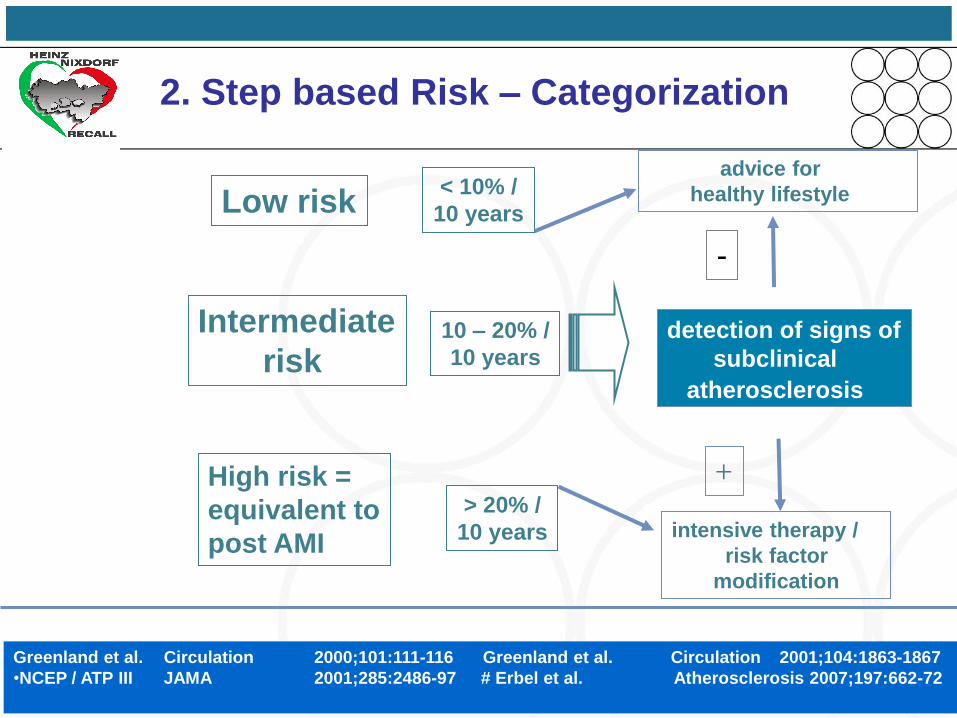
detection of signs of
subclinical
atherosclerosis
> 20% /
10 years intensive therapy /
risk factor
modification
High risk =
equivalent to
post AMI
Low risk< 10% /
10 years
Intermediate
risk10 – 20% /
10 years
Greenland et al. Circulation 2000;101:111-116 Greenland et al. Circulation 2001;104:1863-1867
•NCEP / ATP III JAMA 2001;285:2486-97 # Erbel et al. Atherosclerosis 2007;197:662-72
+
-
2. Step based Risk – Categorization
advice for
healthy lifestyle

0
4
8
12
16
20
Low Intermediate High
p=0.003
Framingham Risk Score
Ob
serv
ed
5-y
r E
ven
t R
ate
[%
]
Events / # at Risk:
Relative Risk:
37 / 1303
2.46 (1.49-4.07)
29 / 498
5.04 (2.98-8.53)25 / 2165
1.0
p=0.0003
5.8 %
2.8 %1.2 %
2. Step: Risk Prediction for Coronary Events
using Framingham Risk Score in HNR study
Erbel R et. al. JACC 56:1397-406, 2010

Imaging techniques
Non imaging techniques
Stress ECG (M 45 - 60 J)
Biomarker
Prevalence of risk categories in Germany
> 20% /
10 years
intensive therapy /
risk factor
modification
High Risk
for healthy lifestyle
Low Risk< 10% /
10 years
Intermediate
Risk10 – 20% /
10 years
31% / 9%
30% / 71%
39% / 20%
Men / Women
Greenland et al. Circulation 2000;101:111-116 Greenland et al. Circulation 2001;104:1863-1867
•NCEP / ATP III JAMA 2001;285:2486-97 # Erbel et al. Atherosclerosis 2007;197:662-72
+
Data from the Heinz Nixdorf Recall Study#
(incl. ATP III risk equivalents*)
-
3. Step: subclinical signs of atherosclerosis
used for further risk stratification
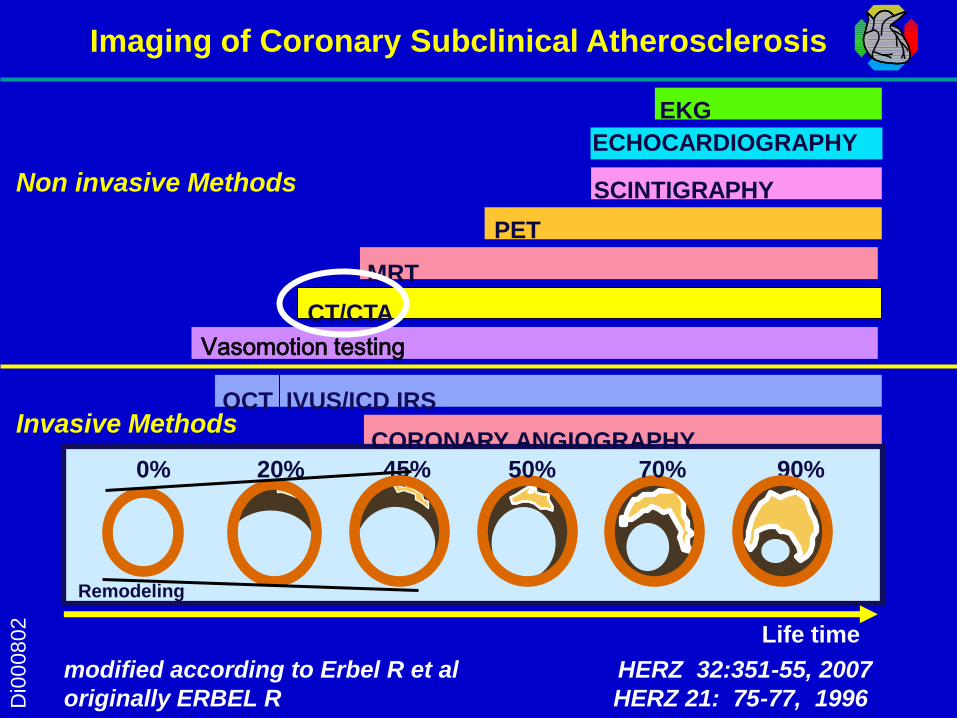
modified according to Erbel R et al HERZ 32:351-55, 2007
originally ERBEL R HERZ 21: 75-77, 1996
0% 20% 45% 50% 70% 90%
Invasive Methods
EKG
ECHOCARDIOGRAPHY
PET
CT/CTA
Non invasive Methods
OCT IVUS/ICD IRS
CORONARY ANGIOGRAPHY
SCINTIGRAPHY
Remodeling
Imaging of Coronary Subclinical AtherosclerosisD
i00
08
02
Vasomotion testing
MRT
Life time

Score
115
Score
2609
Score
49Ao
RVOT
LM
LAD
CAC
No CAC
56 year M
50 year M
51 year M
64 year F
Detection - Distribution – Quantification
Non-Invasive Imaging of Subclinical Coronary Atherosclerosisusing Computed Tomography

Non-Invasive Imaging of Subclinical Coronary Atherosclerosis using Computed Tomography
- < 20 s scan time
- 1-1.3 mSv X-ray exposure
- 100 ms acquisition time
- standardized protocols:
Agatston-Score
- 15-20 min total time
- 0.94 Kappa value for inter-
institutional variation
Imaging of coronary
artery calcification as
a specific sign of
atherosclerosis
Agatston et al. JACC 15:827-32, 1990
Hunold P et al Radiology 226:14552,2003
Schmermund et al . Z Kardiol 92:I/385,2003

0
4
8
12
16
20
0 <0-99 100-399 ≥ 400CAC Scoring
Ob
serv
ed
5-y
r E
ven
t R
ate
[%
]
Events / # at Risk:Crude Relative Risk:FRS-adjusted* RR:
24 / 1624
1.73 (0.85-3.52)
1.46 (0.71-3.00)
23 / 659
4.08 (2.00-8.33)
3.06 (1.48-6.32)
11 / 1287 1.01.0
33 / 396
9.75 (4.97-19.11)
6.25 (3.01-13.00)
p=0.13
p=0.002
p=0.0007
0.9 %1.5 %
3.5 %
8.3 %
3. Step: Improving Risk Prediction for Coronary Events
using Signs of Coronary Subclinical Atherosclerosis by CT
Erbel R et. al. JACC 56:1397-406, 2010
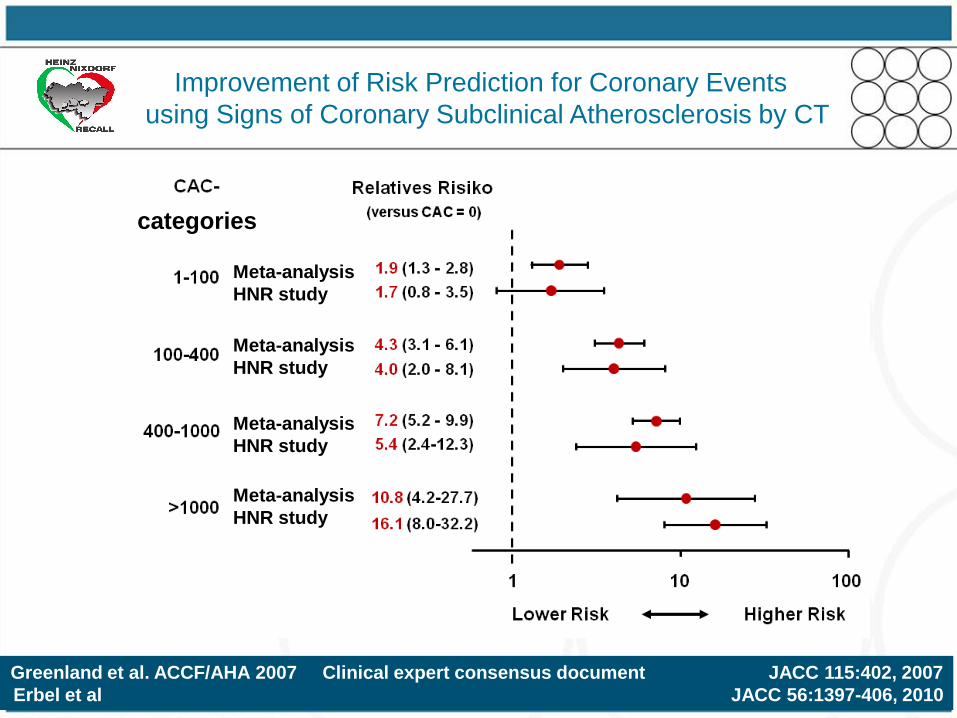
Greenland et al. ACCF/AHA 2007 Clinical expert consensus document JACC 115:402, 2007
Erbel et al JACC 56:1397-406, 2010
categories
Meta-analysis
HNR study
Meta-analysis
HNR study
Meta-analysis
HNR study
Meta-analysis
HNR study
Improvement of Risk Prediction for Coronary Events
using Signs of Coronary Subclinical Atherosclerosis by CT

Elias-Smale SE et al JACC 56:1407-14, 2010
Rotterdam Study
Improvement of Risk Prediction for Coronary Events
using Signs of Coronary Subclinical Atherosclerosis by CT
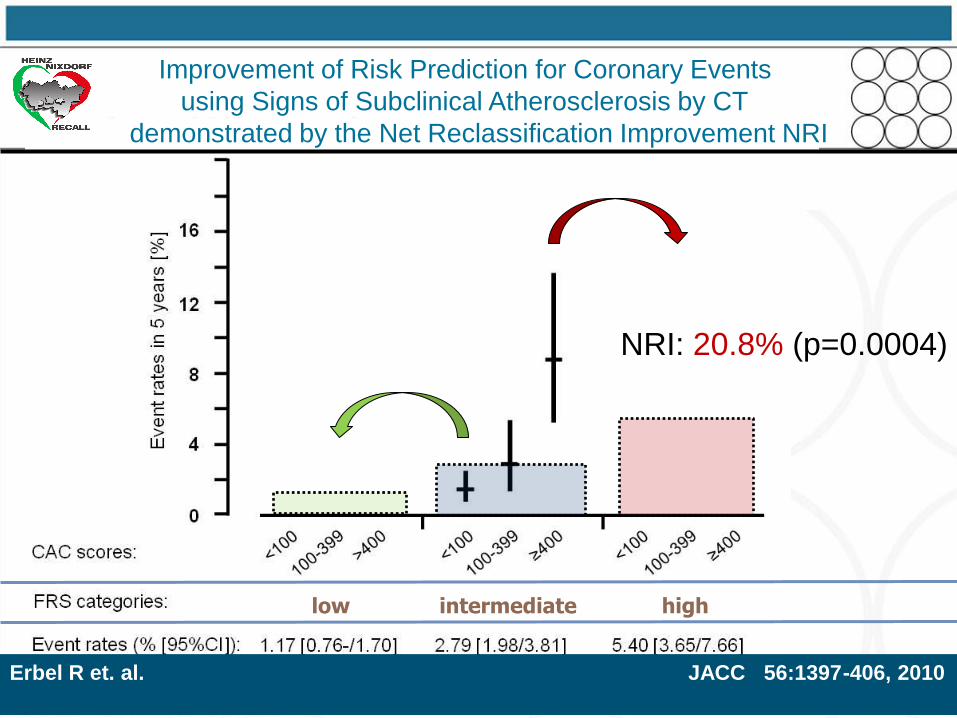
low intermediate high
NRI: 20.8% (p=0.0004)
Improvement of Risk Prediction for Coronary Events
using Signs of Subclinical Atherosclerosis by CT
demonstrated by the Net Reclassification Improvement NRI
Erbel R et. al. JACC 56:1397-406, 2010
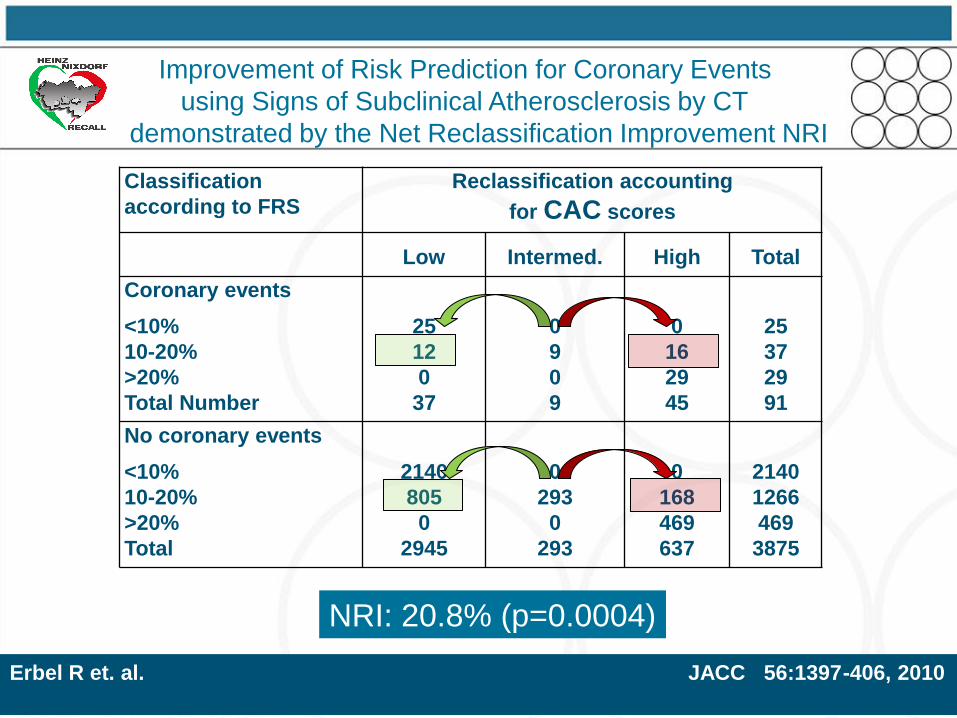
Classification
according to FRS
Reclassification accounting
for CAC scores
Low Intermed. High Total
Coronary events
<10%
10-20%
>20%
Total Number
25
12
0
37
0
9
0
9
0
16
29
45
25
37
29
91
No coronary events
<10%
10-20%
>20%
Total
2140
805
0
2945
0
293
0
293
0
168
469
637
2140
1266
469
3875
NRI: 20.8% (p=0.0004)
Improvement of Risk Prediction for Coronary Events
using Signs of Subclinical Atherosclerosis by CT
demonstrated by the Net Reclassification Improvement NRI
Erbel R et. al. JACC 56:1397-406, 2010

Improvement of Risk Prediction for Coronary Events
using Signs of Subclinical Atherosclerosis by CT
demonstrated by the Net Reclassification Improvement NRI
Erbel R et. al. JACC 56:1397-406, 2010
Classification
according to
FRS 10-year event
rate
Reclassification accounting for
CAC scores
low intermed. high Total
with events
- low
- intermediate
- high
Total
7
27
0
34
0
12
0
12
0
18
29
47
7
57
29
93
without events
- low
- intermediate
- high
Total
933
1870
0
2803
0
479
0
479
0
246
508
754
933
2595
508
4036
NRI = 30.6% (p<0.0001)
Comparison to the FRS 6-20% instead of 10-20%

Detection of signs of
risk for CV events
Biomarker
Prevalence of risk categories in Germany
> 20% /
10 years
intensive therapy /
risk factor
modification
High Risk
advice for
for healthy lifestyle
Low Risk< 10% /
10 years
Intermediate
Risk10 – 20% /
10 years
31% / 9%
30% / 71%
39% / 20%
Men / Women
Greenland et al. Circulation 2000;101:111-116 Greenland et al. Circulation 2001;104:1863-1867
•NCEP / ATP III JAMA 2001;285:2486-97 # Erbel et al. Atherosclerosis 2007;197:662-72
+
Data from the Heinz Nixdorf Recall Study#
(incl. ATP III risk equivalents*)
-
3. Step: Improving Risk Prediction for Coronary Events
using Signs of Inflammation – a Biomarker

Ridker PM et al Circulation 103: 1813, 2001
*O‘Malley PG et al Am J Cardiol 85: 945, 2001
Lipoprotein (a)
Homocystein
Cholesterol (TC)
LDL-Cholesterol (LDLC)
TC/HDLC-Ratio
HS-CRP
Relative Risk of Future Cardiovascular Events
0 0.5 1 2 3 4 5 6 7 8
Calcium Score
Univariate Analysis for
cardiac deah, AMI,
revascularisation
9 10 11
n = 28.263n = 4.348*
*
Improvement of Risk Prediction for Coronary Events
using Biomarkers

0
4
8
12
16
20
<1.0 mg/L 1-3 mg/L >3 mg/LhsCRP Categories
Ob
serv
ed
5-y
r E
ven
t R
ate
[%
]Events / # at Risk:Crude Relative Risk:FRS-adjusted* RR:
31 / 1682
1.11 (0.65-1.90)
0.93 (0.54-1.60)
37 / 897
2.49 (1.49-4.16)
1.87 (1.09-3.21)
23 / 1387 1.01.0
p=0.0006
p=0.70
1.7 % 1.8 %
4.1 %
Möhlenkamp S et al JACC 2011 in press
3. Step: Improving Risk Prediction for Coronary Events
using the Biomarker – hs-CRP

Möhlenkamp S et al JACC 2011 in press
Improvement of Risk Prediction for Coronary Events
using the Biomarker – hs-CRP vs CAC
mg/L
hs-CRP

0 0.25 0.5 0.75 1
0
0.25
0.5
0.75
1
1-Specificity
Sen
sit
ivit
y AuROC-Curve:
FRS+hsCRP+log2(CAC+1): 0.760 (0.710-0.810)
FRS only: 0.691 (0.638-0.744)
FRS+log2(CAC+1): 0.752 (0.700-0.804)
FRS+hsCRP: 0.704 (0.652-0.757)p=0.34 p=0.0074
p=0.014 p=0.19
Möhlenkamp S et al JACC 2011 in press
Improvement of Risk Prediction for Coronary Events
using the Biomarker – hs-CRP vs CAC

Classification
according to FRS
Reclassification accounting
for hsCRP scores
Low Intermed. High Total
Coronary events
<10%
10-20%
>20%
Total Number
25
9
0
34
0
14
0
14
0
14
29
43
25
37
29
91
No coronary events
<10%
10-20%
>20%
Total
2140
388
0
2528
0
579
0
579
0
299
469
768
2140
1266
469
3875
NRI: 7.8% (p=0.14)
Möhlenkamp S et al JACC 2011 in press
Improvement of Risk Prediction for Coronary Events
using the Biomarker – hs-CRP
Net Reclassification Improvement

Risk Marker / Factor: NRI p-value Reference
Multiple Biomarker Score 26.7% p=0.005 (Zethelius, NEJM 2008)*(Troponin I, NT-proBNP, Cystatin C, CRP)
Multiple Biomarker Score 14.6% p=NS (Melander, JAMA 2009)*(MR-proADM, NT-proBNP)
HDL-Cholesterol (Framingham) 12.1% p<0.001 (Pencina, Stat Med 2008)
HDL-Cholesterol (SCORE-Data) 2.2% p=0.006 (Cooney, EJCPR 2009)
hsCRP (women) 5.7% p<0.0001 (Cook, Ann Int Med 2006)
hsCRP (men and women) 11.8% p<0.009 (Wilson Cirulation 2008)
hsCRP (men) 14.1% p<0.001 (Ridker, Circulation 2008)*
HbA1c (men) 3.4% p=0.06 (Simmons, Arch Int Med 2008)
HbA1c (women) - 2.2% p=0.27 (Simmons, Arch Int Med 2008)
CAC
HNR(ATP III, FRS 10-20%, 6-10%) 18.8, 21.7%, 30.6% p=0.0002 (Erbel, JACC 2010)*
Rotterdam FRS 10 – 20 % 14% p<0.01 also hard events,older
MESA FRS 6 – 20% 30% p<0.001 also soft endpoints
modified from Cooney et al. JACC 54 :1209-1227, 2009
Erbel R et al JACC 56 :1397- 406, 2010
Improvement of Risk Prediction for Coronary Events
using Signs of Subclinical Atherosclerosis and Biomarkers

Risk Marker / Factor: NRI p-value Reference
Multiple Biomarker Score 26.7% p=0.005 (Zethelius, NEJM 2008)*(Troponin I, NT-proBNP, Cystatin C, CRP)
Multiple Biomarker Score 14.6% p=NS (Melander, JAMA 2009)*(MR-proADM, NT-proBNP)
HDL-Cholesterol (Framingham) 12.1% p<0.001 (Pencina, Stat Med 2008)
HDL-Cholesterol (SCORE-Data) 2.2% p=0.006 (Cooney, EJCPR 2009)
Heart Rate 1.1% p=NS (Cooney, ESC 2009, Abstract)
hsCRP (women) 5.7% p<0.0001 (Cook, Ann Int Med 2006)
hsCRP (men and women) 11.8% p<0.009 (Wilson Cirulation 2008)
hsCRP (men) 14.1% p<0.001 (Ridker, Circulation 2008)*
hsCRP (total 7.8% p <0.14 (Möhlenkamp JACC 2011)
HbA1c (men) 3.4% p=0.06 (Simmons, Arch Int Med 2008)
HbA1c (women) - 2.2% p=0.27 (Simmons, Arch Int Med 2008)
CAC (ATP III, FRS 10-20%, 6-10%) 18.8, 21.7%, 30.6% p=0.0002 (Erbel JACC 2010)*
Improvement of Risk Prediction for Coronary Events
using Signs of Subclinical Atherosclerosis and Biomarkers
modified from Cooney et al. JACC 54 :1209-1227, 2009
Erbel R et al JACC 56 :1397- 406, 2010

I dedicate my lecture to Philip Poole-Wilson
and Helmut Drexler

Conclusion
Improvement of Risk Prediction for Coronary Events
using Signs of Subclinical Atherosclerosis and Biomarkers
In comparison to other signs of subclincial atherosclerosis
CAC seems to be the method of choice for improvement
of risk prediction.
And cardiology has to turn its attention to prevention,
because here the biggest target for risk improvement has to
be recognized as the majority of patient (60 to 80 %), who die from AMI,
die outside the hospital and do not reach the hospital.


Background for Improving
Risk Prediction
Acute onset of coronary syndromes still combined with
- up to 50 % rate of sudden deaths
Fox CS et al Circulation 110: 522-7, 2004
AHA: Heart Disease and Stroke Update 2009 at a glance
- 60 % of deaths outside the hospital with no improvement over
the last 10 years (MONICA/KORA)
Löwel H et al Dtsch Ärztebl 103:A616-22, 2006
- prevention at top of list of measures to reduce case fatality from CAD
Chambless et al (MONICA study) Circulation 96: 3849-59,1997
Aim of the Study
Funded by the Heinz Nixdorf Foundation (chairman: G Schmidţ)
International Advisory Board: Th Meinertz, (chair)
supported by German Foundation of Research
…coronary calcium as a sign of
subclinical coronary atherosclerosis
improves risk prediction for
cardiovascular events
in comparison to risk factors
Heinz Nixdorf Recall Study (HNR)
Risk Factors, Evaluation of Coronary Calcium and Lifestyle
Initiated in 1999 and started in 2000
Erbel et al In: Late breaking clinical trial, ACC 2009
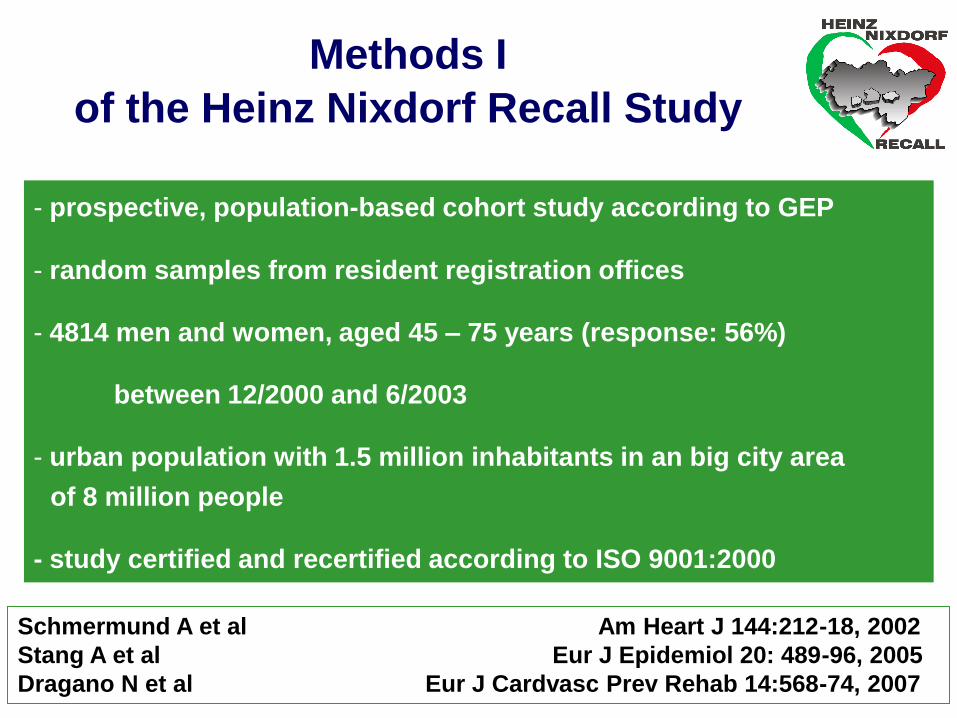
Schmermund A et al Am Heart J 144:212-18, 2002
Stang A et al Eur J Epidemiol 20: 489-96, 2005
Dragano N et al Eur J Cardvasc Prev Rehab 14:568-74, 2007
Methods I
of the Heinz Nixdorf Recall Study
- prospective, population-based cohort study according to GEP
- random samples from resident registration offices
- 4814 men and women, aged 45 – 75 years (response: 56%)
between 12/2000 and 6/2003
- urban population with 1.5 million inhabitants in an big city area
of 8 million people
- study certified and recertified according to ISO 9001:2000

„... we are still living in a world where almost 1/3 of
the patients who die ... die suddenly before we were
even aware that these people were ill or that their
lives were in jeopardy. So it seems to me that the
most important problem we face is to find a way
of recognizing these people before they drop
dead and tell us that they were sick“
In: Coronary Heart Disease, 3rd Int. Symposium
Frankfurt, Kaltenbach M, Lichtlen P, Balcon R,
Bussmann WD (eds) Thieme, Stuttgart 1978; 83
Mason Sones in Frankfurt 1978

Detrano et al NEJM 2008
Erbel et al JACC 56:1397-406, 2010
MESA-Study:- population-based
- 6814 vs 4814 subjects
- age: 45-84 vs 45-75 years
- 6 vs 3 cities
- 4 vs 1 ethnic groups
- no CVD at entry
- follow-up: 3.5 vs 5 years
Comparison of MESA and HNR
not randomly vs randomly selected
CAC burden known
versus unknown results!!
1-s
en
sit
ivit
y
FRS alone
AuROC=0.79
(p=0.01 vs. CAC+FRS)
CAC+FRS
AuROC=0.83
CAC alone
AuROC=0.78
(p=0.06 vs. CAC+FRS)
HNR
0.681
HNR
0.741*
HNR
0.749**
ΔAuROC 0.51 vs 0.68
* p=0.46, ** p=0.003
Improvement of Risk Prediction for Coronary Events
using Signs of Subclinical Atherosclerosis by CT
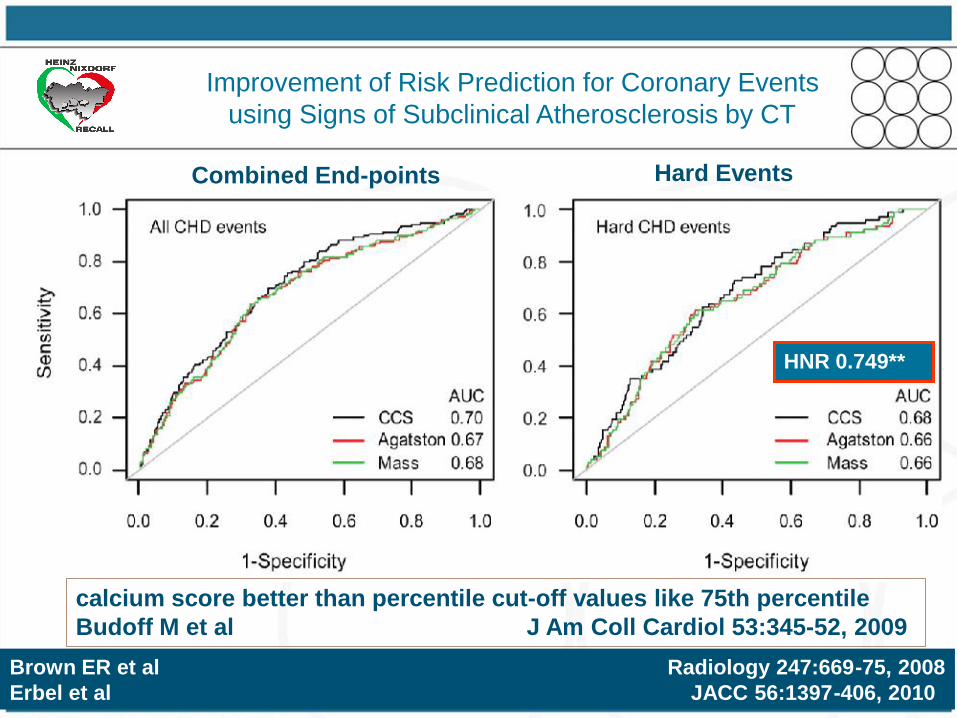
Brown ER et al Radiology 247:669-75, 2008
Erbel et al JACC 56:1397-406, 2010
calcium score better than percentile cut-off values like 75th percentile
Budoff M et al J Am Coll Cardiol 53:345-52, 2009
HNR 0.749**
Hard EventsCombined End-points
Improvement of Risk Prediction for Coronary Events
using Signs of Subclinical Atherosclerosis by CT

Philip Alexander Poole-Wilson
death with 66 years March 4, 2009
Two weeks after last Update in Cardiology
In Davos
Helmut Drexler
died 6 months later
with 58 years
Improvement of Risk Prediction for Coronary Events
using Signs of Subclinical Atherosclerosis and Biomarkers

Stang A et al Am J Epidemiol 164:85-94, 2006
Erbel R et al Atherosclerosis 197:662-72, 2008
Schmermund A et Atherosclerosis 185:177-82, 2006
Greenland P et al Circulation 115:402-26, 2007
- Framingham Risk Score
- electron beam CT (GE-Imatron, San Francisco),
- for coronary artery calcification scoring (Agatston score)
- carotid ultrasound
for measuring intimal media thickness and plaques
- blood pressure at ankle and arm
for ankle-arm index (ABI) measurement
Methods II: for detection of
Subclinical atherosclerosis

RR für CAC und hsCRP
Erbel et al., (eingereicht)

Endotheliale Dysfunktion
Herrmann J, Lerman A Herz 2007 in press

39
Atherosklerose Pathogenese
Herrmann J, Lerman A Herz 2007 in press
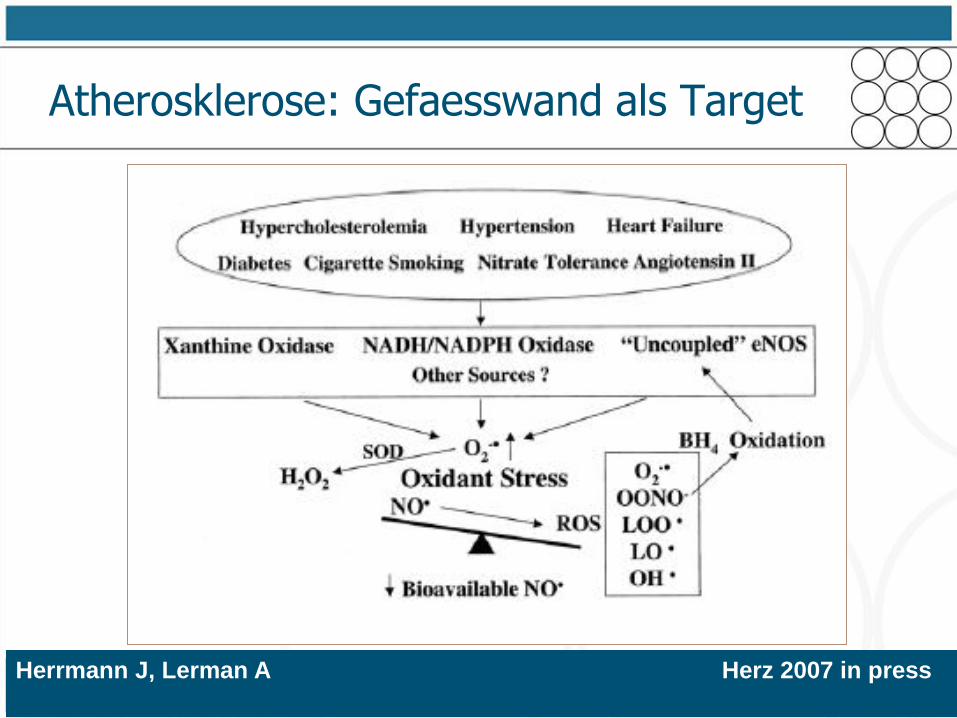
Atherosklerose: Gefaesswand als Target
Herrmann J, Lerman A Herz 2007 in press

Atherosklerose Pathogenese
Herrmann J, Lerman A Herz 2007 in press
HeartScore Classification
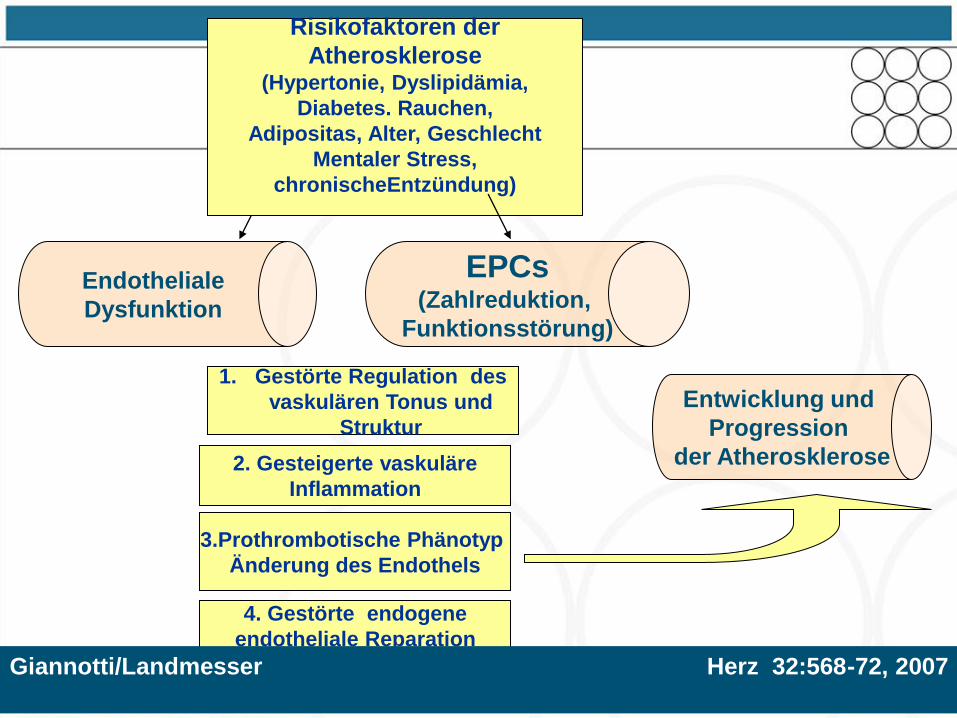
Endotheliale
Dysfunktion
3.Prothrombotische Phänotyp
Änderung des Endothels
1. Gestörte Regulation des
vaskulären Tonus und
Struktur
2. Gesteigerte vaskuläre
Inflammation
Risikofaktoren der
Atherosklerose(Hypertonie, Dyslipidämia,
Diabetes. Rauchen,
Adipositas, Alter, Geschlecht
Mentaler Stress,
chronischeEntzündung)
EPCs(Zahlreduktion,
Funktionsstörung)
Entwicklung und
Progression
der Atherosklerose
4. Gestörte endogene
endotheliale Reparation
Giannotti/Landmesser Herz 32:568-72, 2007
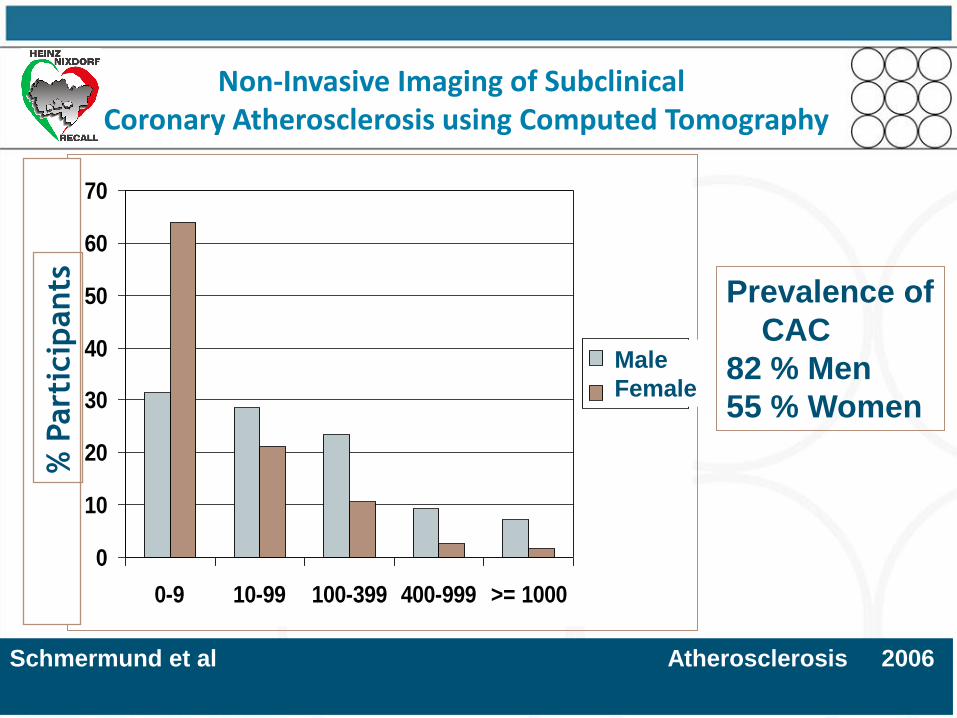
Schmermund et al Atherosclerosis 2006
0
10
20
30
40
50
60
70
0-9 10-99 100-399 400-999 >= 1000
Männer
Frauen
% P
art
icip
ants Prevalence of
CAC
82 % Men
55 % Women
Male
Female
Non-Invasive Imaging of Subclinical Coronary Atherosclerosis using Computed Tomography

McClelland et al. Circulation 2006
Schmermund et al Atherosclerosis 2006
80757065605550 80757065605550
0
500
1000
1500
2000
2500
3000
MESA
Age/years
0
100
200
300
400
Ag
ats
ton
CA
C S
co
re
50th CAC-Percentile 90th CAC-Percentile
Ag
ats
ton
CA
C S
co
re
HNR
MESA multiethnic study of atherosclerosis
MESA
HNR
Age/years
Non-Invasive Imaging of Subclinical Coronary Atherosclerosis using Computed Tomography

46
Age/years
Jöckel et al Atherosclerosis 2008
no smoking
30 cigaretts/die, stop 20 years ago
30 cigaretts/die
Current
Smoking
Former
smoking
no-
smoking
CA
C A
gats
ton
Sco
re U
nit
smoking and coronary artery calcification
Non-Invasive Imaging of Subclinical Coronary Atherosclerosis using Computed Tomography

adjusted for age, sex, education, smoking, hypertension, D.m., cholesterol, living area
-100
-50
0
50
100
150
200
250
300
Distanz >200;
PM<=22 (1041)
Distanz >200;
PM>25 (84)
Rest (3339) Distanz <=100;
PM<=22 (303)
Distanz <=100;
PM>25 (38)
Verä
nd
eru
ng
des K
alk
sco
re [
%]
Ch
an
ge o
f C
AC
/ %
B Hoffmann et al Circulation116:489-496, 2007
adjusted analysis
Non-Invasive Imaging of Subclinical Coronary Atherosclerosis using Computed Tomography
pollution and coronary artery calcification

Co
ron
ary
art
ery
calc
ific
ati
on
Ag
ats
ton
Sco
re U
nit
WomenMen
N Dragano et al Eur J Cardiovasc Prev Rehabil 14:568-74 2007
Co
ron
ary
art
ery
calc
ific
ati
on
Ag
ats
ton
Sco
re U
nit
Income quartiles Income quartiles
socio-economics and coronary artery calcification
Non-Invasive Imaging of Subclinical Coronary Atherosclerosis using Computed Tomography

Folie 49 Titel
Classification
according to
FRS 10-year event
rate
Reclassification accounting for
CAC scores
low intermed. high Total
with events
- low
- intermediate
- high
Total
7
27
0
34
0
12
0
12
0
18
29
47
7
57
29
93
without events
- low
- intermediate
- high
Total
933
1870
0
2803
0
479
0
479
0
246
508
754
933
2595
508
4036
NRI = 30.6% (p<0.0001)
Comparison to the FRS 6-20% instead of 10-20%
Note: more correct down- than up classification in those with events
Net Reclassification Improvement by CAC in
Comparison to the Framingham Risk Score