Embed Size (px)
Citation preview
CARDIAC SERVICES BCANNUAL REPORT2010
1
Car
diac
Ser
vice
s B
C -
Ann
ual R
epor
t 20
10
Contents03050606060708
101112131418
202123252729
323235
40414243
4646
52545657
6262
64
Abbreviations ForewordAcknowledgementsExecutive SummaryAnnual Report Content and HighlightsAbout Cardiac Services BCContact
Chapter 1 Community ProfileDemographics: Age and SexDemographics: EthnicitySelected Cardiovascular Disease-Related Risk FactorsRisk Factor PrevalenceRisk Factors and AMI Hospitalizations
Chapter 2 Coronary Artery Disease-Related HospitalizationsCoronary Artery Disease-Related Hospitalizations: AMICoronary Artery Disease-Related Hospitalizations: AMI Re-admissionsCoronary Artery Disease-Related Hospitalizations: AMI In-Hospital MortalityCardiac Procedures and AMI RatiosCardiac Procedures and AMI Rates
Chapter 3 Cardiac Procedure UtilizationCardiac Procedure Utilization: RatesCardiac Procedure Utilization: Where Patients Receive Care
Chapter 4Wait TimesWait Times: Isolated CABGWait Times: Patients Waiting and Completed SurgeriesWait Times: Wait Times and EP Procedures
Chapter 5 Outcomes Outcomes: 30-Day Mortality
Chapter 6 Planning PrioritiesRevascularization ServicesCongestive Heart Failure (CHF)Electrophysiology Services
Chapter 7 Financial ResourcesFinancial Resources: Cardiac Procedures Volumes and Budget by Major Program
Appendix
2
C
ardiac Services B
C - A
nnual Report 2010
Chapter 1 Community Profile
10 Figure 1.1 BC Health Authorities
11 Figure 1.2 Age Distribution (%) by Sex and Resident Health Authority, 2008
12 Figure 1.3 Ethnic Distribution (%) by Resident Health Authority, 2006
13 Figure 1.4 Prevalence of Selected Cardiovascular Disease-Related Risk Factor Rates (%) by Resident Health Authority, 2007
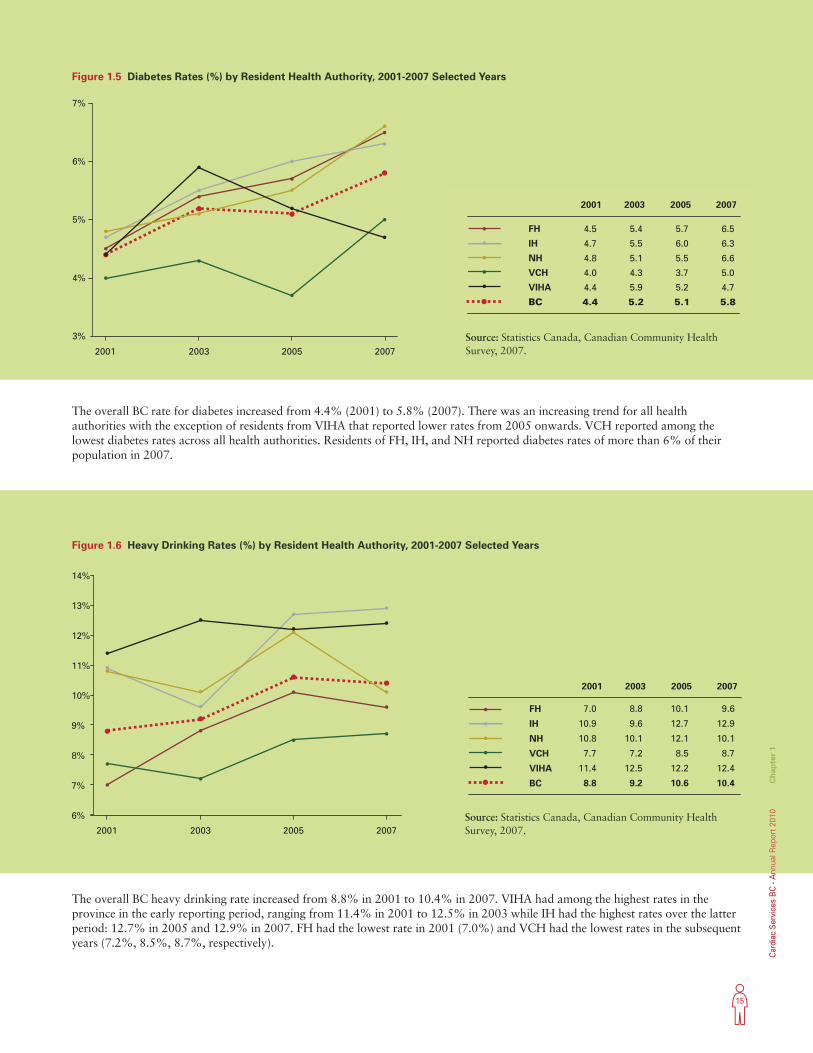
15 Figure 1.5 Diabetes Rates (%) by Resident Health Authority, 2001-2007 Selected Years
15 Figure 1.6 Heavy Drinking Rates (%) by Resident Health Authority, 2001-2007 Selected Years
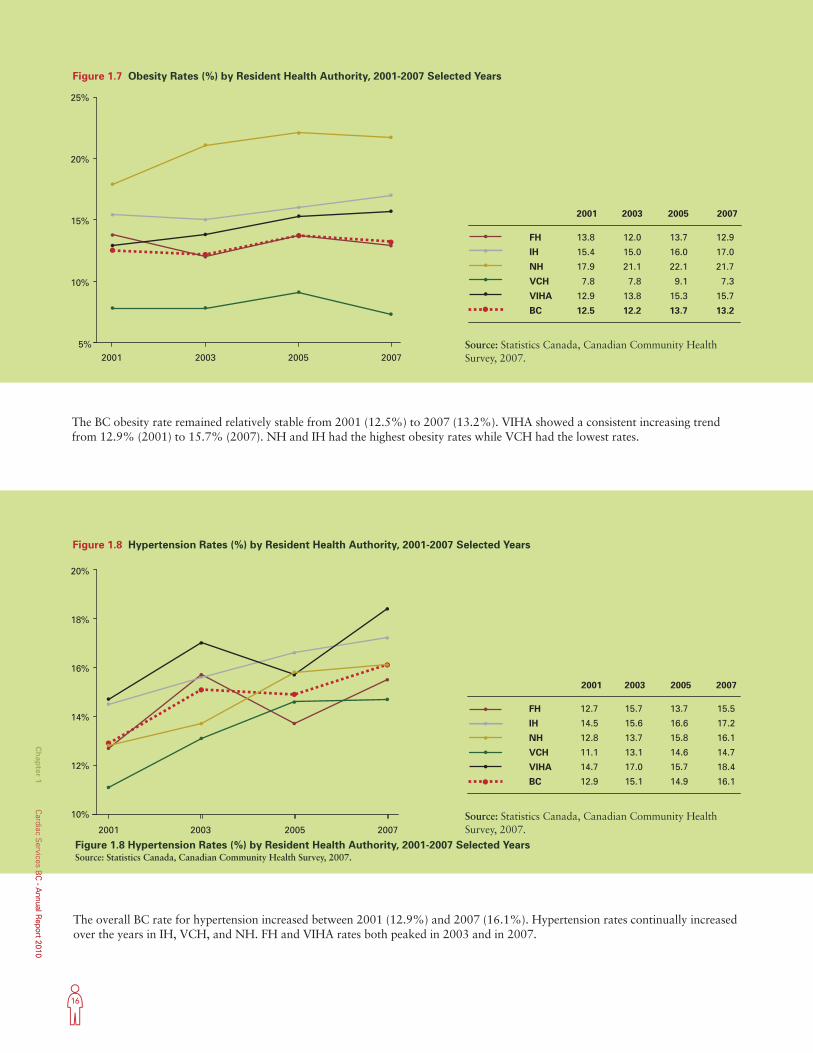
16 Figure 1.7 Obesity Rates (%) by Resident Health Authority, 2001-2007 Selected Years
16 Figure 1.8 Hypertension Rates (%) by Resident Health Authority, 2001-2007 Selected Years
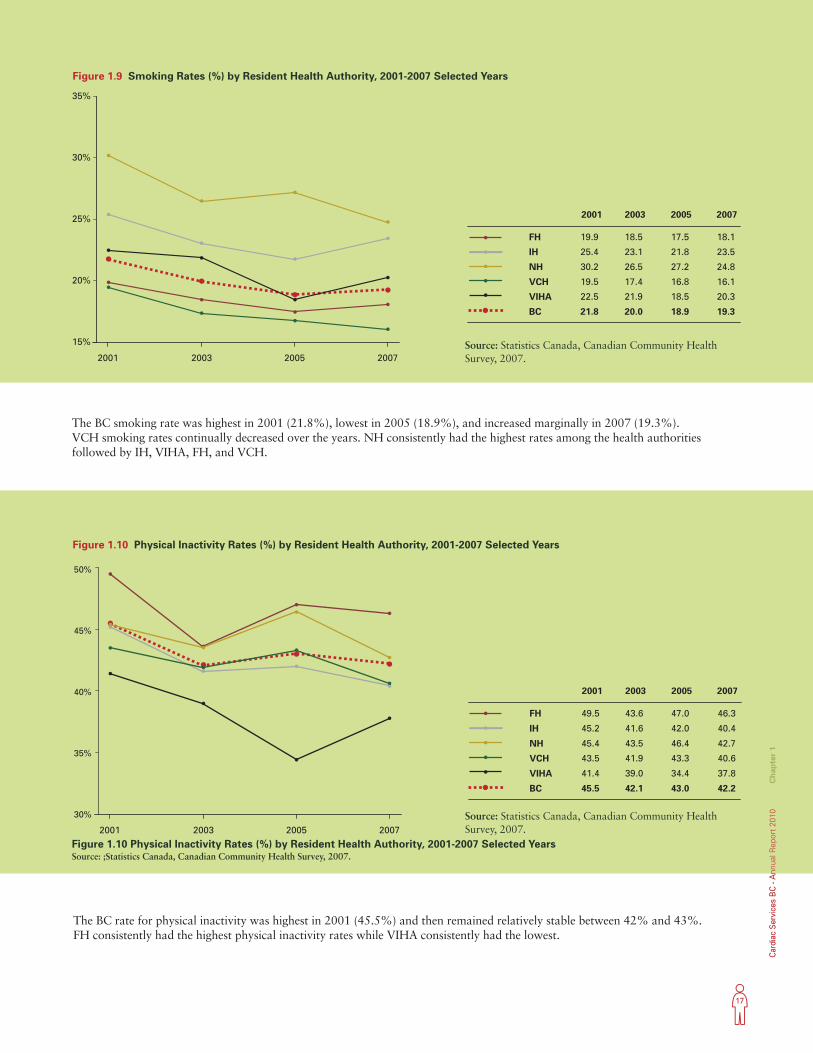
17 Figure 1.9 Smoking Rates (%) by Resident Health Authority, 2001-2007 Selected Years
17 Figure 1.10 Physical Inactivity Rates (%) by Resident Health Authority, 2001-2007 Selected Years
18 Figure 1.11 AMI Hospitalization and Risk Factor Distribution (%) by Resident Health Authority
Chapter 2 Coronary Artery Disease-Related Hospitalizations
20 Figure 2.1 AMI Hospitalization Rates (age- and sex-standardized, per 100,000 population)
by Patient Residence, 2002/03-2008/09
21 Figure 2.2 Observed and Projected AMI Hospitalization Rates for Men by Age Group
22 Figure 2.3 Observed and Projected AMI Hospitalization Rates for Females by Age Group
22 Figure 2.4 Observed and Projected Decline in AMI Hospitalization Overall Rates
27 Figure 2.5 Diagnostic Catheterization to AMI Ratio by Patient Residence, 2008/09
28 Figure 2.6 Revascularization to AMI Ratio by Patient Residence, 2008/09
29 Figure 2.7 AMI Hospitalization and Cardiac-Related Procedure Rates (age- and sex-standardized
per 100,000 population) by Patient Residence, 2008/09
Chapter 3 Cardiac Procedure Utilization
32 Figure 3.1 Diagnostic Catheterization Rates (age- and sex-standardized, per 100,000 population) by Patient Residence, 2002/03-2009/10
33 Figure 3.2 PCI Rates (age- and sex-standardized, per 100,000 population) by Patient Residence, 2002/03-2009/10
34 Figure 3.3 Isolated Coronary Artery Bypass Graft Rates (age- and sex-standardized, per 100,000 population) by Patient Residence, 2002/03-2009/10
34 Figure 3.4 Total Open Heart Surgery Rates (age- and sex-standardized, per 100,000 population)
by Patient Residence, 2002/03-2009/10
36 Figure 3.5 Percentage of Residents in a Health Authority Undergoing Diagnostic Catheterization by Hospital, 2009/10
37 Figure 3.6 Percentage of Residents in a Health Authority Undergoing PCI by Hospital, 2009/10
38 Figure 3.7 Percentage of Residents in a Health Authority Undergoing Open Heart Surgery by Hospital, 2009/10
Chapter 4 Wait Times
41 Figure 4.1 Percentage of Isolated CABG Completed within FMM Benchmarks by Priority, 2009-2010
42 Figure 4.2 Number of Waiting for and Completed Heart Surgeries by Hospital, 2009-2010
43 Figure 4.3 Median Wait Time and Number of Completed Electrophysiology Procedures by Hospital, 2009-2010
Chapter 5 Outcomes
47 Figure 5.1 30-Day All-Cause Mortality Rate (%) Post Isolated CABG in BC, 2005-2009
48 Figure 5.2 30-Day All-Cause Mortality Rate (%) Post CABG Plus Valve Surgery in BC, 2005-2009
48 Figure 5.3 30-Day All-Cause Mortality Rate (%) Post Isolated Valve Surgery in BC, 2005-2009
49 Figure 5.4 30-Day Mortality Rate (%) Post PCI in BC, 2004-2008
Chapter 6 Planning Priorities
54 Figure 6.1 Actual and Projected Demand for PCI (Volume of Cases 2001-2015)
55 Figure 6.2 Actual and Projected Demand for Heart Surgery (Volume of Cases 2001-2015)
55 Figure 6.3 Provincial Summary of PCI and Heart Surgery Volumes and Capacity
List of figures
3
Car
diac
Ser
vice
s B
C -
Ann
ual R
epor
t 20
10
AbbreviationsACS
AMI
CABG
CAD
CSBC
CSSC
EP
FH
HF
HSDA
ICD
IH
KGH
NH
OHS
PAPCH
PCI
PHSA
RCH
RJH
SPH
VCH
VGH
VIHA
Acute Coronary Syndrome
Acute Myocardial Infarction
Coronary Artery Bypass Graft
Coronary Artery Disease
Cardiac Services BC
Cardiac Services Steering Committee
Electrophysiology
Fraser Health
Heart Failure
Health Services Delivery Area
Implantable Cardioverter Defibrillator
Interior Health
Kelowna General Hospital
Northern Health
Open Heart Surgery
Provincial Advisory Panel on Cardiac Health
Percutaneous Coronary Intervention
Provincial Health Services Authority
Royal Columbian Hospital
Royal Jubilee Hospital
St Paul’s Hospital
Vancouver Coastal Health
Vancouver General Hospital
Vancouver Island Health Authority
Chapter 2 Coronary Artery Disease-Related Hospitalizations
23 Table 2.1 AMI Re-admission Rates (%) by Patient Residence, 2003/04 to 2008/09
25 Table 2.2 30-Day AMI In-Hospital Mortality Rates (%) by Patient Residence, 2003/04 to 2008/09
Chapter 6 Planning Priorities
58 Table 6.1 Device Implants – Pacemaker Projections (2008/09 – 2015/16)
58 Table 6.2 Device Implants – ICD Projections (2008/09 – 2015/16)
58 Table 6.3 EP Planning Parameters (2008/09 – 2011/12)
Chapter 7 Financial Resources
63 Table 7.1 Cardiac Procedure Volumes by Major Program, 2009/10 - 2010/11
63 Table 7.2 Cardiac Services BC Budget by Major Program, 2009/10 - 2010/11
List of tables

4
C
ardiac Services B
C - A
nnual Report 2010
5
Car
diac
Ser
vice
s B
C -
Ann
ual R
epor
t 20
10
Foreword
Heart disease remains Canada’s number one cause of death and despite huge gains in the prevention, diagnosis, and treatment of cardiovascular diseases, roughly one-third of the deaths in the nation this year will have heart disease as their root cause. According to the most recent statistics, the annual-ized rate of deaths per 100,000 British Columbians is 224, although that number has been declining over the last decade.1 That decline, however, will come under increasing pressure as the population of BC ages, demanding thoughtful planning, research, and vision to ensure BC citizens have access to the best, evidence-based, medical care in a timely manner. Cardiac Services BC (CSBC), an agency of the Provincial Health Services Authority (PHSA), is responsible for the province-wide planning, coordination, monitoring, evaluation, and funding of adult specialized cardiac care services across the spectrum of cardiovascular disease. The CSBC 2010 Annual Report explores the demographics of British Columbians, wait times they face before undergoing major cardiovascular procedures, recent initiatives for reducing delays, rates of different measures of cardiovascular health, and finally a summary of milestones reached and plans for the future, including a detailed roadmap how funds will be allocated.
1 http://www.statcan.gc.ca
6
C
ardiac Services B
C - A
nnual Report 2010
David Babiuk Provincial Executive Director
Acknowledgements
CSBC is very pleased to present the 2010 Annual Report on cardiac care in British Columbia. The major-ity of the data reports and tables were available as isolated reports and this marks the first time they have been presented in this consolidated Annual Report. The purpose of this report is to provide detailed and timely information on cardiac care in British Columbia. It is a resource for healthcare professionals and admin-istrators to inform decisions about planning, organizing, and evaluating cardiac care.
The preparation of this first Annual Report was led by Sharon Relova, Epidemiologist at CSBC. Sharon re-ceived continued guidance and direction from Dr Karin Humphries, Provincial Director, Data Services, Evalua-tion, and Research; Dr Min Gao, Director, Biostatistics and Data Management; and Dr Christopher Thompson, Medical Advisor. The “Stats Team”, in particular Aihua Pu, contributed to the data analysis and preparation of the data tables and graphs with all CSBC staff involved in the final editing and report preparation. Please refer to the Appendix for a listing of CSBC staff contributing to this report.
A special thank you to the support received from the PHSA Communication staff for their timely advice, sup-port, and layout of the report.
CSBC would like to also acknowledge the healthcare professionals, administrative staff and data entry per-sonnel located at the provider centres for the quality of their work and their continued efforts to improve upon the timeliness, completeness, and accuracy of the data entered into the CSBC Registry. The collective effort of all contributors has made it possible for CSBC to pres-ent this first Annual Report.
Executive SummaryThis report is structured around the epidemiological principles of person, place, and time. Descriptions of the demographic and risk factor profile of British Columbians are essential to understanding the com-munity of interest. Results are presented by hospital or health authority to understand better cardiac pro-cedural patterns across the province. Time trends are also provided to illustrate changes over time. Finally, planning priorities and financial resources provide con-textual information.
Annual Report Content and HighlightsCommunity Profile: This chapter describes population demographics and distribution of cardiovascular risk factors. Caucasians comprised the largest ethnic group among all health authorities. Among residents living in VCH, 26% were Chinese. According to the Canadian Community Health Survey conducted in 2007, 42% of British Columbians reported being physically inactive, while 19% reported being a smoker. Hypertension rates increased significantly from 13% in 2001 to 16% in 2007. British Columbians must adopt healthier life-styles to decrease the risk of cardiovascular disease.
Coronary Artery Disease-Related Hospitalizations: This chapter reports on AMI hospitalizations, re-admis-sion, and mortality rates. AMI can be used as a marker of coronary artery disease in the population. From 2002/03 to 2008/09, AMI rates declined from 236 to 204 per 100,000 population. The decrease in hospital-ization rates may indicate that there is increased early detection of heart disease or that people are better managing their health. Variation exists in revasculariza-tion to AMI ratios, ranging from 0.53 (East Kootenay) to 1.87 (Fraser North). Access to care or hospital prac-tices may explain some of this variability.
7
Car
diac
Ser
vice
s B
C -
Ann
ual R
epor
t 20
10
Cardiac Procedure Utilization: This chapter describes utilization trends for cardiac-related procedures (diag-nostic catheterization, PCI, isolated CABG and OHS), and where patients receive care. Overall, all cardiac procedure rates in BC have declined from 2002/03 to 2009/10. Residents tended to receive care within their health authority. For those British Columbians living in health authorities without invasive cardiac procedure programs, the majority went to either SPH or VGH.
Wait Times: This chapter reports on wait times for selected cardiac procedures. From January 2009 to September 2010, over 94% of patients had an isolated CABG within the recommended First Minister’s Meet-ing benchmark. The numbers of British Columbians waiting for OHS and completing OHS have been fairly constant between January 2009 and September 2010, suggesting that an equilibrium has been achieved. The median wait time and number of completed electro-physiology procedures continue to be monitored.
Outcomes: This chapter describes the 30-day mortal-ity rate for selected cardiac procedures. From 2005 to 2009, the 30-day risk-adjusted mortality rate post isolated CABG decreased from 2.13% to 1.79%, while the CABG plus valve surgery mortality rate increased from 4.09% to 5.62%. The 30-day risk-adjusted mortal-ity rate post PCI remained relatively stable between 2004 and 2008 at around 1.85%. Overall, the mortality rates in BC compare favourably with the literature,1 but there is room for improvement.
Planning Priorities: This chapter reports on CSBC priorities for planning cardiac services in the province within the context of PHSA’s strategic plan. Service Level Agreements outline CSBC’s priorities and define roles, responsibilities, service deliverables and ac-countabilities between CSBC and the health authori-ties. In addition, CSBC has completed provincial plans for coronary revascularization services, electrophysiol-ogy services, and heart failure services. The plans have focused on defining service need and capacity, now and into the future, and provide direction to CSBC’s overall priority setting.
Financial Resources: This chapter reports on CSBC priorities for the funding of cardiac services in the province. Currently, CSBC manages an annual
operating budget of approximately $165 million to support cardiovascular disease-related treatment services and secondary prevention. Funding is allocated to health authorities based upon a rate-based funding model. Cost savings from provincial tenders in 2009/10 allowed CSBC to allocate resources to fund additional procedures to manage wait lists and wait times while maintaining a neutral budget in 2010/11.
About Cardiac Services BCCSBC was established by the PHSA following the transfer of the adult tertiary cardiac provincial mandate and funding from the Ministry of Health Services in 2002. The province-wide mandate includes responsibil-ity for the planning, coordination, monitoring, evalu-ation, and funding of cardiovascular disease-related treatment services and more recently has been expanded to include secondary prevention. CSBC pro-vides a service coordination role for British Columbians by determining and assessing service needs across all regions of the province and the most appropriate and cost effective means of meeting the needs. CSBC also provides direction and provincial leadership in:
a. setting provincial standards for access to cardiac services and ensuring appropriate and timely triage of patients;
b. standardizing practice protocols utilizing current evidence and best practices to improve the quality of patient care;
c. establishing a provincial vision, goals, and objec-tives for the cardiac services program;
d. determining priority and allocating sufficient “life support” resources within cardiac services to best meet patient needs;
e. recommending future initiatives for cardiac ser-vices within the province;
f. developing provincial cardiac service and capital requirement plans. Where substantive increases in volumes or new technologies require significant new investment in capital equipment or infrastructure, CSBC collaborates with the regional Health Authori-ties to secure the required resources;
g. partnering with BC Transplant in the treatment of acute heart failure.
1 Shahian et al. Ann Thorac Surg 2009,88:S2–22; O’Brien et al. Ann Thorac Surg 2009,88:S23–42; Shahian et al. Ann Thorac Surg 2009,88:S43–62; Singh et al. J Am Coll Cardiol 2008; 51:2313-20.
Continued
8
C
ardiac Services B
C - A
nnual Report 2010
CSBC maintains a cardiac patient Registry containing 20 years of high quality cardiac-related procedural data. It is a complex database with data entry and report generation interfaces located at the provider sites and clinical offices. The Registry collects clinical informa-tion on all open heart surgery, angiography, angioplasty, implantable cardioverter defibrillator, and pacemaker procedures performed in the province. The registry data is used in monitoring and analyzing access time to service, projecting and planning future service require-ments, analyzing and reporting on patient outcomes, and supporting evaluation and research.
There are five regional Health Authority cardiac cen-tres providing cardiac services within the context of a provincial program. The five sites are St Paul’s Hospital (SPH), Vancouver General Hospital (VGH), Royal Jubi-lee Hospital (RJH), Royal Columbian Hospital (RCH), and Kelowna General Hospital (KGH). The provider responsibilities are generally accepted to include:
a. having an overall regional cardiac services plan in place including primary care/prevention, diagnosis, treatment, rehabilitation, and secondary prevention services that within available resources maximizes access for all residents of the region;
b. providing programs and services to support the plan;
c. providing the range of services as agreed to and as outlined in the annual funding letter from the funder;
d. providing all capital resources, within available funding, including the necessary equipment required to deliver the services. Where substantive increases in volumes or new technologies require significant new investment in capital equipment or infrastruc-ture, the parties will collaborate to secure required resources;
e. adhering to standards of patient care adopted provincially or nationally by programs of similar scope and size;
f. timely entry of all data to the CSBC Registry;
g. having quality assurance processes established and operational.
The Provincial Advisory Panel on Cardiac Health (PAPCH) is a standing expert advisory committee comprised of physician leaders in cardiovascular medicine in BC. It is responsible to and funded by CSBC and reports to CSBC through the Provincial Executive Director. Its mandate is to provide medically and scientifically expert advice and recommendations to CSBC on the full continuum of cardiac health. The PAPCH has been in place for nearly 20 years.
In 2008/09 fiscal year, the Cardiac Services Steer-ing Committee (CSSC) was established with senior administrative and clinical representation from the provider centres, the Ministry of Health Services and PAPCH. The CSSC is responsible for providing direc-tion on, among other things, the cost accounting, funding methodology, and funding policy for cardiac services; service capacity; new technology/drugs; qual-ity assurance; quality improvement; provincial capital equipment planning and funding under a joint provincial strategy; and generally to provide more transparency between the funder and the provider and ensuring equity across all Health Authorities.
An annual Service Level Agreement between CSBC and the each provider details the respective roles and responsibilities, provider deliverables including pro-cedure volumes and price. The agreement is perfor-mance based with monthly monitoring and year end reconciliation of funding to procedures performed.
ContactTo comment on this report, suggest topics for future reports, or to obtain an electronic copy of this report please contact Carmen Ng at [email protected].
Cardiac Services BC is located at 700 - 1380 Burrard Street, Vancouver, BC, V6Z 2H3.

9
Car
diac
Ser
vice
s B
C -
Ann
ual R
epor
t 20
10
Ch
apte
r 1
Chapter 1 Community Profile
10
Ch
apter 1
Cardiac S
ervices BC
- Annual R
eport 2010
Cardiovascular disease is the leading cause of death in Canada, with coronary artery disease--a narrowing of the arteries that supply blood to the heart muscle--the most common cause of heart attacks and sudden cardiac death, as well as debilitating chest pain (angina), in hundreds of thousands of Canadians. The choices we make as individuals (to exercise daily and maintain a healthy body weight), as parents (to limit screen time and to encourage physical activity in our children), and as a society (to de-mand communities that include parks and walking routes, and public health policies that limit salt in processed foods) profoundly affect the amount of cardiovascular disease in our province.
Many so-called “modifiable” factors can influence an indi-vidual’s risk of developing cardiovascular disease including tobacco and alcohol use; body weight; and physical activ-ity, blood pressure and cholesterol levels. There are also nonmodifiable factors including genetic make-up (includ-ing family history), age, sex, and ethnicity that put some population groups at higher risk of developing cardiovas-cular disease than others.
Identifying populations with higher risk of developing cardiovascular disease can help streamline efforts to improve modifiable risk factors and minimize the impact of non-modifiable factors, through, for example, improving
diets, decreasing salt consumption, encouraging smoking cessation, and increasing physical activity.
Since cultural factors influence diet, physical activity, and tobacco and alcohol use, different ethnic groups have dif-ferent cardiovascular risk profiles. A recent study from the Institute for Clinical Evaluative Sciences in Toronto, found “striking differences” in the cardiovascular risk profiles of South Asian, Chinese, white, and black ethnic groups1 . Studies have also shown socioeconomic status and level of education to exert a powerful influence on cardiovas-cular disease prevalence. Of note, however, the INTER-HEART study2, the largest, global study of cardiovascular risk to date, found that while people from different ethnic backgrounds have different risks of developing coronary heart disease, more than 90% of the risk of heart attacks across all ethnic groups can be attributed to modifiable risk factors, meaning that appropriate dietary, behavioural, or pharmaceutical approaches can radically reduce cardio-vascular risk.
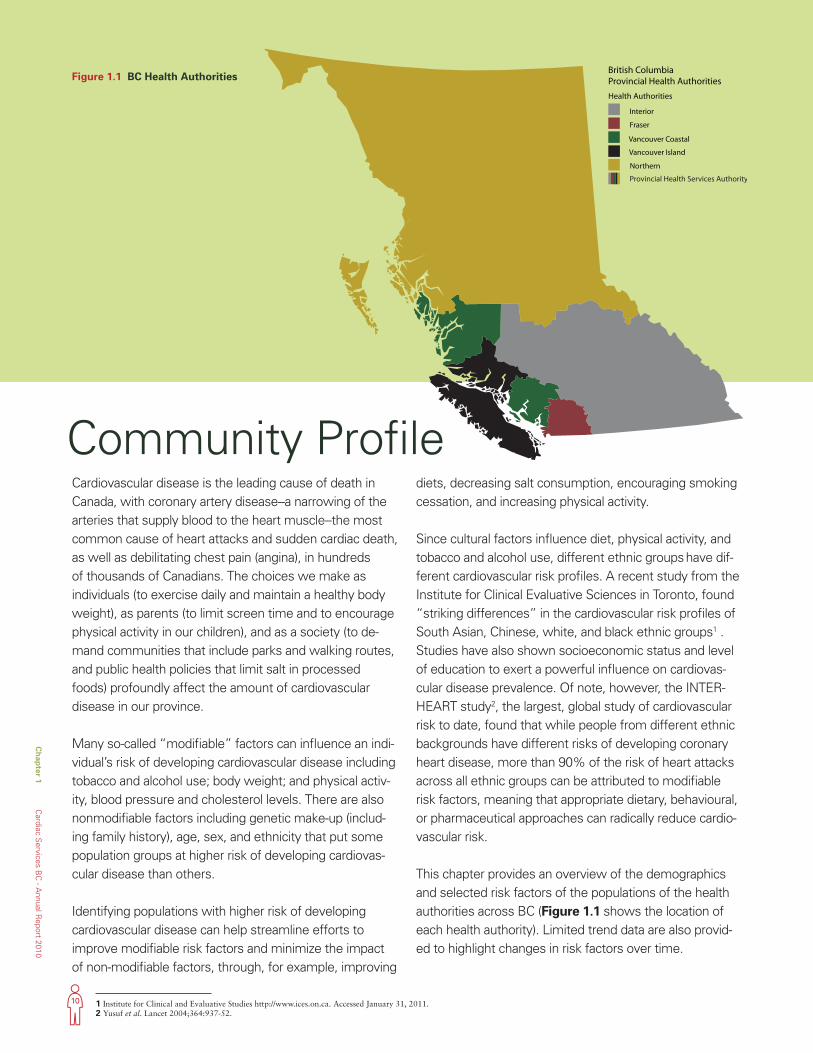
This chapter provides an overview of the demographics and selected risk factors of the populations of the health authorities across BC (Figure 1.1 shows the location of each health authority). Limited trend data are also provid-ed to highlight changes in risk factors over time.
Community Profile
1 Institute for Clinical and Evaluative Studies http://www.ices.on.ca. Accessed January 31, 2011. 2 Yusuf et al. Lancet 2004;364:937-52.
Figure 1.1 BC Health Authorities
11
Car
diac
Ser
vice
s B
C -
Ann
ual R
epor
t 20
10
Ch
apte
r 1
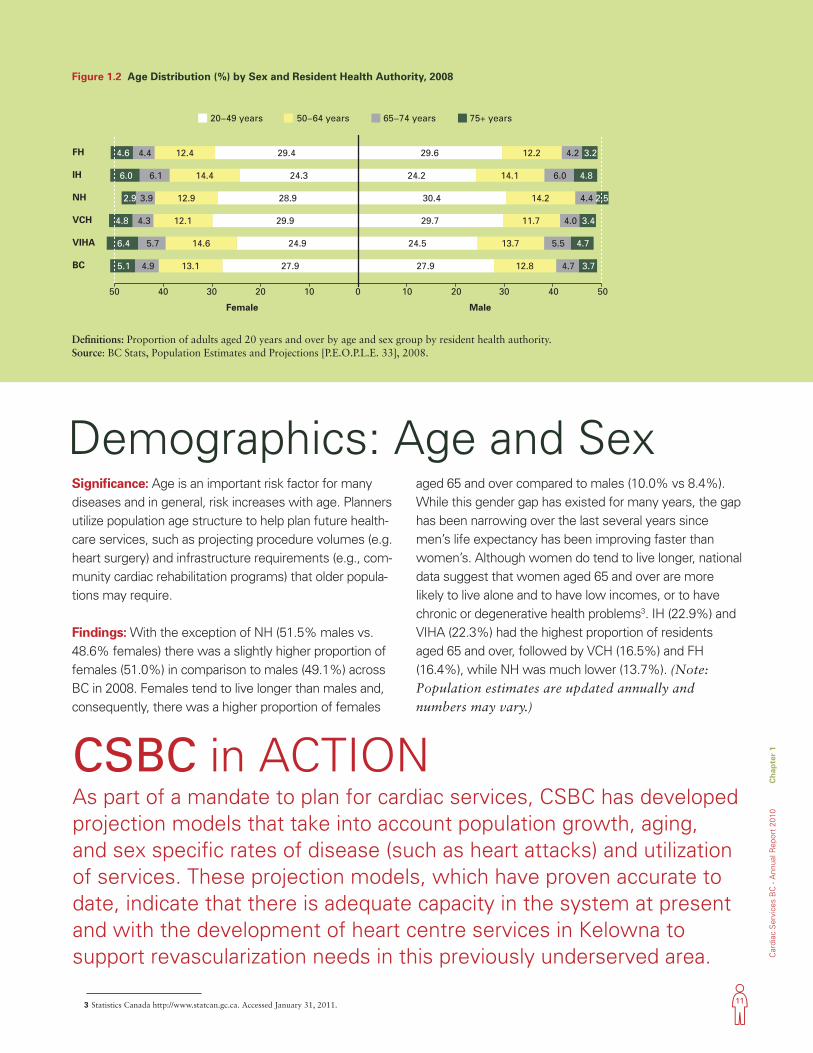
Significance: Age is an important risk factor for many diseases and in general, risk increases with age. Planners utilize population age structure to help plan future health-care services, such as projecting procedure volumes (e.g. heart surgery) and infrastructure requirements (e.g., com-munity cardiac rehabilitation programs) that older popula-tions may require.
Findings: With the exception of NH (51.5% males vs. 48.6% females) there was a slightly higher proportion of females (51.0%) in comparison to males (49.1%) across BC in 2008. Females tend to live longer than males and, consequently, there was a higher proportion of females
aged 65 and over compared to males (10.0% vs 8.4%). While this gender gap has existed for many years, the gap has been narrowing over the last several years since men’s life expectancy has been improving faster than women’s. Although women do tend to live longer, national data suggest that women aged 65 and over are more likely to live alone and to have low incomes, or to have chronic or degenerative health problems3. IH (22.9%) and VIHA (22.3%) had the highest proportion of residents aged 65 and over, followed by VCH (16.5%) and FH (16.4%), while NH was much lower (13.7%). (Note: Population estimates are updated annually and numbers may vary.)
Demographics: Age and Sex
CSBC in ACTIONAs part of a mandate to plan for cardiac services, CSBC has developed projection models that take into account population growth, aging, and sex specific rates of disease (such as heart attacks) and utilization of services. These projection models, which have proven accurate to date, indicate that there is adequate capacity in the system at present and with the development of heart centre services in Kelowna to support revascularization needs in this previously underserved area.
3 Statistics Canada http://www.statcan.gc.ca. Accessed January 31, 2011.
Definitions: Proportion of adults aged 20 years and over by age and sex group by resident health authority. Source: BC Stats, Population Estimates and Projections [P.E.O.P.L.E. 33], 2008.
Figure 1.2 Age Distribution (%) by Sex and Resident Health Authority, 2008
50 5040 4030 3020 2010 100
27.913.1 4.9 5.1 27.9 12.8 4.7 3.7BC
24.914.6 5.7 6.4 24.5 13.7 5.5 4.7VIHA
29.912.1 4.3 4.8 29.7 11.7 4.0 3.4VCH
28.912.9 3.9 2.9 30.4 14.2 4.4 2.5NH
24.314.4 6.1 6.0 24.2 14.1 6.0 4.8IH
29.412.4 4.4 4.6 29.6 12.2 4.2 3.2FH
Female Male
20−49 years 50−64 years 65−74 years 75+ years
12
Ch
apter 1
Cardiac S
ervices BC
- Annual R
eport 2010
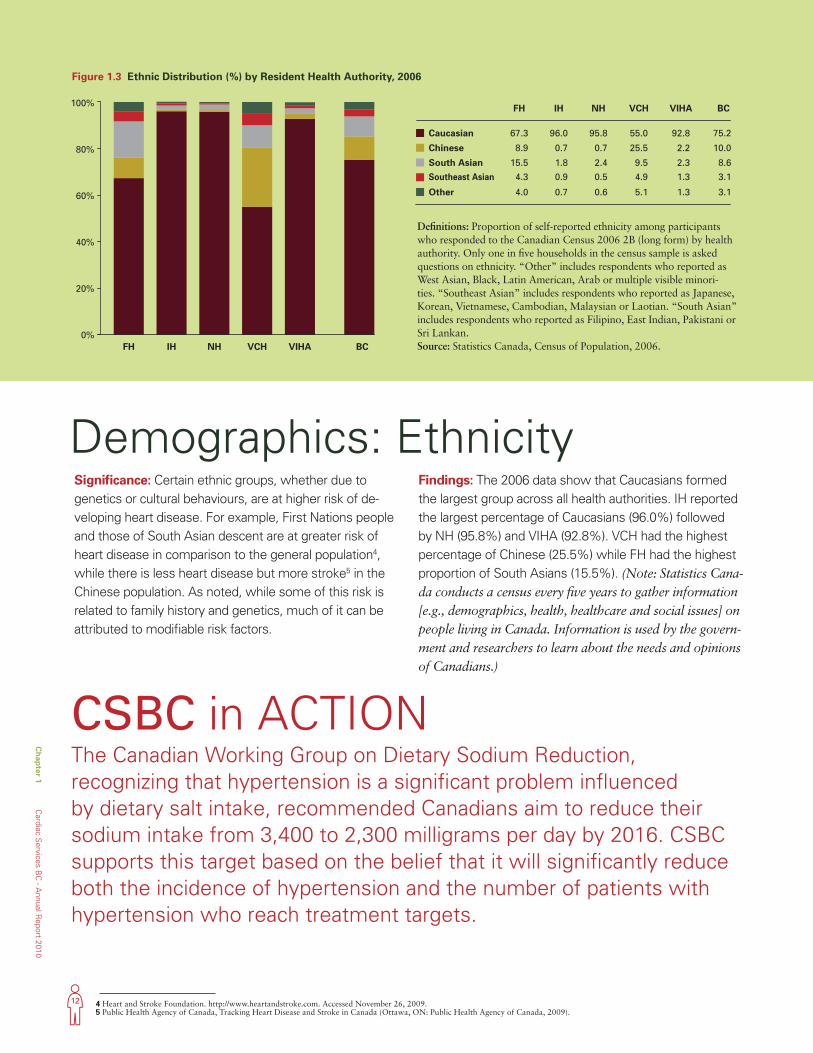
Significance: Certain ethnic groups, whether due to genetics or cultural behaviours, are at higher risk of de-veloping heart disease. For example, First Nations people and those of South Asian descent are at greater risk of heart disease in comparison to the general population4, while there is less heart disease but more stroke5 in the Chinese population. As noted, while some of this risk is related to family history and genetics, much of it can be attributed to modifiable risk factors.
Findings: The 2006 data show that Caucasians formed the largest group across all health authorities. IH reported the largest percentage of Caucasians (96.0%) followed by NH (95.8%) and VIHA (92.8%). VCH had the highest percentage of Chinese (25.5%) while FH had the highest proportion of South Asians (15.5%). (Note: Statistics Cana-da conducts a census every five years to gather information [e.g., demographics, health, healthcare and social issues] on people living in Canada. Information is used by the govern-ment and researchers to learn about the needs and opinions of Canadians.)
Demographics: Ethnicity
4 Heart and Stroke Foundation. http://www.heartandstroke.com. Accessed November 26, 2009. 5 Public Health Agency of Canada, Tracking Heart Disease and Stroke in Canada (Ottawa, ON: Public Health Agency of Canada, 2009).
Figure 1.3 Ethnic Distribution (%) by Resident Health Authority, 2006
Definitions: Proportion of self-reported ethnicity among participants who responded to the Canadian Census 2006 2B (long form) by health authority. Only one in five households in the census sample is asked questions on ethnicity. “Other” includes respondents who reported as West Asian, Black, Latin American, Arab or multiple visible minori-ties. “Southeast Asian” includes respondents who reported as Japanese, Korean, Vietnamese, Cambodian, Malaysian or Laotian. “South Asian” includes respondents who reported as Filipino, East Indian, Pakistani or Sri Lankan. Source: Statistics Canada, Census of Population, 2006.
0%
20%
40%
60%
80%
100%
FH
67.3
8.9
15.5
4.3
4.0
IH
96.0
0.7
1.8
0.9
0.7
NH
95.8
0.7
2.4
0.5
0.6
VCH
55.0
25.5
9.5
4.9
5.1
VIHA
92.8
2.2
2.3
1.3
1.3
BC
BC
75.2
10.0
8.6
3.1
3.1
Southeast Asian
Caucasian
Chinese
South Asian
Other
FH IH NH VCH VIHA
0%
20%
40%
60%
80%
100%
FH
67.3
8.9
15.5
4.3
4.0
IH
96.0
0.7
1.8
0.9
0.7
NH
95.8
0.7
2.4
0.5
0.6
VCH
55.0
25.5
9.5
4.9
5.1
VIHA
92.8
2.2
2.3
1.3
1.3
BC
BC
75.2
10.0
8.6
3.1
3.1
Southeast Asian
Caucasian
Chinese
South Asian
Other
FH IH NH VCH VIHA
CSBC in ACTIONThe Canadian Working Group on Dietary Sodium Reduction, recognizing that hypertension is a significant problem influenced by dietary salt intake, recommended Canadians aim to reduce their sodium intake from 3,400 to 2,300 milligrams per day by 2016. CSBC supports this target based on the belief that it will significantly reduce both the incidence of hypertension and the number of patients with hypertension who reach treatment targets.
13
Car
diac
Ser
vice
s B
C -
Ann
ual R
epor
t 20
10
Ch
apte
r 1
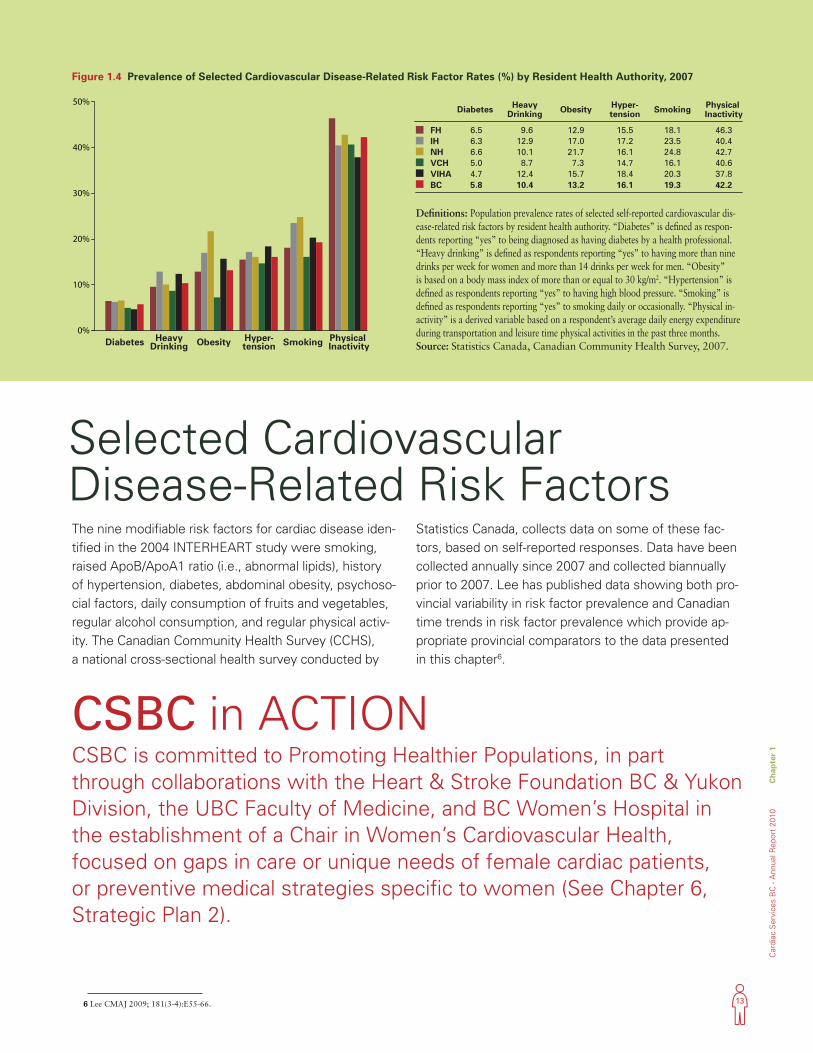
The nine modifiable risk factors for cardiac disease iden-tified in the 2004 INTERHEART study were smoking, raised ApoB/ApoA1 ratio (i.e., abnormal lipids), history of hypertension, diabetes, abdominal obesity, psychoso-cial factors, daily consumption of fruits and vegetables, regular alcohol consumption, and regular physical activ-ity. The Canadian Community Health Survey (CCHS), a national cross-sectional health survey conducted by
Statistics Canada, collects data on some of these fac-tors, based on self-reported responses. Data have been collected annually since 2007 and collected biannually prior to 2007. Lee has published data showing both pro-vincial variability in risk factor prevalence and Canadian time trends in risk factor prevalence which provide ap-propriate provincial comparators to the data presented in this chapter6.
Selected Cardiovascular Disease-Related Risk Factors
CSBC in ACTIONCSBC is committed to Promoting Healthier Populations, in part through collaborations with the Heart & Stroke Foundation BC & Yukon Division, the UBC Faculty of Medicine, and BC Women’s Hospital in the establishment of a Chair in Women’s Cardiovascular Health, focused on gaps in care or unique needs of female cardiac patients, or preventive medical strategies specific to women (See Chapter 6, Strategic Plan 2).
6 Lee CMAJ 2009; 181(3-4):E55-66.
Figure 1.4 Prevalence of Selected Cardiovascular Disease-Related Risk Factor Rates (%) by Resident Health Authority, 2007
Definitions: Population prevalence rates of selected self-reported cardiovascular dis-ease-related risk factors by resident health authority. “Diabetes” is defined as respon-dents reporting “yes” to being diagnosed as having diabetes by a health professional. “Heavy drinking” is defined as respondents reporting “yes” to having more than nine drinks per week for women and more than 14 drinks per week for men. “Obesity” is based on a body mass index of more than or equal to 30 kg/m2. “Hypertension” is defined as respondents reporting “yes” to having high blood pressure. “Smoking” is defined as respondents reporting “yes” to smoking daily or occasionally. “Physical in-activity” is a derived variable based on a respondent’s average daily energy expenditure during transportation and leisure time physical activities in the past three months. Source: Statistics Canada, Canadian Community Health Survey, 2007.
Diabetes HeavyDrinking Obesity Hyper-
tension Smoking Physical Inactivity
Diabetes HeavyDrinking Obesity Hyper-
tension Smoking Physical Inactivity
FH 6.5 9.6 12.9 15.5 18.1 46.3IH 6.3 12.9 17.0 17.2 23.5 40.4NH 6.6 10.1 21.7 16.1 24.8 42.7VCH 5.0 8.7 7.3 14.7 16.1 40.6VIHA 4.7 12.4 15.7 18.4 20.3 37.8
5.8 10.4 13.2 16.1 19.3 42.2BC 0%
10%
20%
30%
40%
50%Diabetes Heavy
Drinking Obesity Hyper-tension Smoking Physical
Inactivity
Diabetes HeavyDrinking Obesity Hyper-
tension Smoking Physical Inactivity
FH 6.5 9.6 12.9 15.5 18.1 46.3IH 6.3 12.9 17.0 17.2 23.5 40.4NH 6.6 10.1 21.7 16.1 24.8 42.7VCH 5.0 8.7 7.3 14.7 16.1 40.6VIHA 4.7 12.4 15.7 18.4 20.3 37.8
5.8 10.4 13.2 16.1 19.3 42.2BC 0%
10%
20%
30%
40%
50%
14
Ch
apter 1
Cardiac S
ervices BC
- Annual R
eport 2010
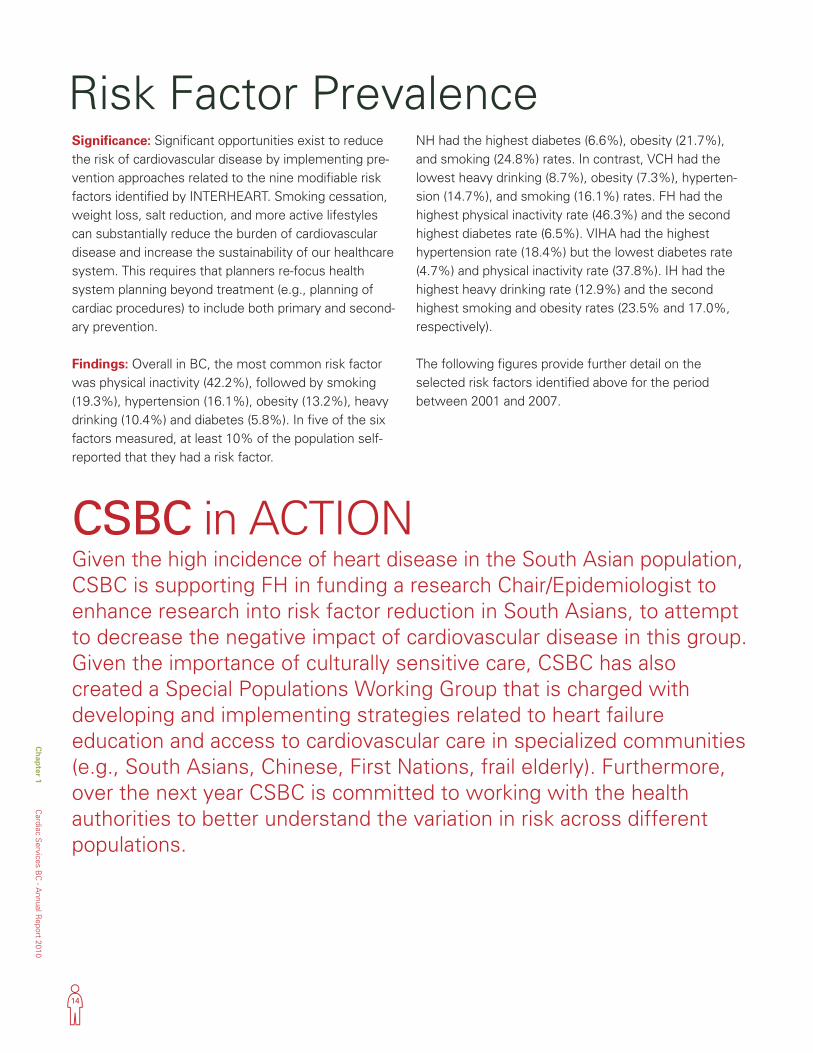
Risk Factor PrevalenceSignificance: Significant opportunities exist to reduce the risk of cardiovascular disease by implementing pre-vention approaches related to the nine modifiable risk factors identified by INTERHEART. Smoking cessation, weight loss, salt reduction, and more active lifestyles can substantially reduce the burden of cardiovascular disease and increase the sustainability of our healthcare system. This requires that planners re-focus health system planning beyond treatment (e.g., planning of cardiac procedures) to include both primary and second-ary prevention.
Findings: Overall in BC, the most common risk factor was physical inactivity (42.2%), followed by smoking (19.3%), hypertension (16.1%), obesity (13.2%), heavy drinking (10.4%) and diabetes (5.8%). In five of the six factors measured, at least 10% of the population self-reported that they had a risk factor.
NH had the highest diabetes (6.6%), obesity (21.7%), and smoking (24.8%) rates. In contrast, VCH had the lowest heavy drinking (8.7%), obesity (7.3%), hyperten-sion (14.7%), and smoking (16.1%) rates. FH had the highest physical inactivity rate (46.3%) and the second highest diabetes rate (6.5%). VIHA had the highest hypertension rate (18.4%) but the lowest diabetes rate (4.7%) and physical inactivity rate (37.8%). IH had the highest heavy drinking rate (12.9%) and the second highest smoking and obesity rates (23.5% and 17.0%, respectively).
The following figures provide further detail on the selected risk factors identified above for the period between 2001 and 2007.
CSBC in ACTIONGiven the high incidence of heart disease in the South Asian population, CSBC is supporting FH in funding a research Chair/Epidemiologist to enhance research into risk factor reduction in South Asians, to attempt to decrease the negative impact of cardiovascular disease in this group. Given the importance of culturally sensitive care, CSBC has also created a Special Populations Working Group that is charged with developing and implementing strategies related to heart failure education and access to cardiovascular care in specialized communities (e.g., South Asians, Chinese, First Nations, frail elderly). Furthermore, over the next year CSBC is committed to working with the health authorities to better understand the variation in risk across different populations.
15
Car
diac
Ser
vice
s B
C -
Ann
ual R
epor
t 20
10
Ch
apte
r 1
Figure 1.6 Heavy Drinking Rates (%) by Resident Health Authority, 2001-2007 Selected Years
The overall BC rate for diabetes increased from 4.4% (2001) to 5.8% (2007). There was an increasing trend for all health authorities with the exception of residents from VIHA that reported lower rates from 2005 onwards. VCH reported among the lowest diabetes rates across all health authorities. Residents of FH, IH, and NH reported diabetes rates of more than 6% of their population in 2007.
The overall BC heavy drinking rate increased from 8.8% in 2001 to 10.4% in 2007. VIHA had among the highest rates in the province in the early reporting period, ranging from 11.4% in 2001 to 12.5% in 2003 while IH had the highest rates over the latter period: 12.7% in 2005 and 12.9% in 2007. FH had the lowest rate in 2001 (7.0%) and VCH had the lowest rates in the subsequent years (7.2%, 8.5%, 8.7%, respectively).
Source: Statistics Canada, Canadian Community Health Survey, 2007.
Figure 1.6 Heavy Drinking Rates (%) by Resident Health Authority, 2001-2007 Selected Years
Figure 1.5 Diabetes Rates (%) by Resident Health Authority, 2001-2007 Selected Years
2001 2003 2005 2007
4.5
4.7
4.8
4.0
4.4
4.4
5.4
5.5
5.1
4.3
5.9
5.2
5.7
6.0
5.5
3.7
5.2
5.1
6.5
6.3
6.6
5.0
4.7
5.8
FH
IH
NH
VCH
VIHA
BC3%
4%
5%
6%
7%
2001 2003 2005 2007
2001 2003 2005 2007
4.5
4.7
4.8
4.0
4.4
4.4
5.4
5.5
5.1
4.3
5.9
5.2
5.7
6.0
5.5
3.7
5.2
5.1
6.5
6.3
6.6
5.0
4.7
5.8
FH
IH
NH
VCH
VIHA
BC3%
4%
5%
6%
7%
2001 2003 2005 2007
Source: Statistics Canada, Canadian Community Health Survey, 2007.
2001 2003 2005 2007
7.0 8.8 10.1 9.6FH
10.9 9.6 12.7 12.9IH
10.8 10.1 12.1 10.1NH
7.7 7.2 8.5 8.7VCH
11.4 12.5 12.2 12.4VIHA
8.8 9.2 10.6 10.4BC6%
7%
8%
9%
10%
11%
12%
13%
14%
2001 2003 2005 2007
2001 2003 2005 2007
7.0 8.8 10.1 9.6FH
10.9 9.6 12.7 12.9IH
10.8 10.1 12.1 10.1NH
7.7 7.2 8.5 8.7VCH
11.4 12.5 12.2 12.4VIHA
8.8 9.2 10.6 10.4BC6%
7%
8%
9%
10%
11%
12%
13%
14%
2001 2003 2005 2007
Car
diac
Ser
vice
s B
C -
Ann
ual R
epor
t 20
10
Ch
apte
r 1
16
Ch
apter 1
Cardiac S
ervices BC
- Annual R
eport 2010
The BC obesity rate remained relatively stable from 2001 (12.5%) to 2007 (13.2%). VIHA showed a consistent increasing trend from 12.9% (2001) to 15.7% (2007). NH and IH had the highest obesity rates while VCH had the lowest rates.
The overall BC rate for hypertension increased between 2001 (12.9%) and 2007 (16.1%). Hypertension rates continually increased over the years in IH, VCH, and NH. FH and VIHA rates both peaked in 2003 and in 2007.
Figure 1.8 Hypertension Rates (%) by Resident Health Authority, 2001-2007 Selected YearsSource: Statistics Canada, Canadian Community Health Survey, 2007.
Source: Statistics Canada, Canadian Community Health Survey, 2007.
Source: Statistics Canada, Canadian Community Health Survey, 2007.
Figure 1.7 Obesity Rates (%) by Resident Health Authority, 2001-2007 Selected Years
Figure 1.8 Hypertension Rates (%) by Resident Health Authority, 2001-2007 Selected Years
2001 2003 2005 2007
13.8 12.0 13.7 12.9FH
15.4 15.0 16.0 17.0IH
17.9 21.1 22.1 21.7NH
7.8 7.8 9.1 7.3VCH
12.9 13.8 15.3 15.7VIHA
12.5 12.2 13.7 13.2BC5%
10%
15%
20%
25%
2001 2003 2005 2007
2001 2003 2005 2007
10%
12%
14%
16%
18%
20%
FH 12.7 15.7 13.7 15.5
IH 14.5 15.6 16.6 17.2
NH 12.8 13.7 15.8 16.1
VCH 11.1 13.1 14.6 14.7
VIHA 14.7 17.0 15.7 18.4
BC 12.9 15.1 14.9 16.1
2001 2003 2005 2007
2001 2003 2005 2007
13.8 12.0 13.7 12.9FH
15.4 15.0 16.0 17.0IH
17.9 21.1 22.1 21.7NH
7.8 7.8 9.1 7.3VCH
12.9 13.8 15.3 15.7VIHA
12.5 12.2 13.7 13.2BC5%
10%
15%
20%
25%
2001 2003 2005 2007
2001 2003 2005 2007
10%
12%
14%
16%
18%
20%
FH 12.7 15.7 13.7 15.5
IH 14.5 15.6 16.6 17.2
NH 12.8 13.7 15.8 16.1
VCH 11.1 13.1 14.6 14.7
VIHA 14.7 17.0 15.7 18.4
BC 12.9 15.1 14.9 16.1
2001 2003 2005 2007
Ch
apter 1
Cardiac S
ervices BC
- Annual R
eport 2010
17
Car
diac
Ser
vice
s B
C -
Ann
ual R
epor
t 20
10
Ch
apte
r 1
Figure 1.10 Physical Inactivity Rates (%) by Resident Health Authority, 2001-2007 Selected YearsSource: ;Statistics Canada, Canadian Community Health Survey, 2007.
The BC smoking rate was highest in 2001 (21.8%), lowest in 2005 (18.9%), and increased marginally in 2007 (19.3%). VCH smoking rates continually decreased over the years. NH consistently had the highest rates among the health authorities followed by IH, VIHA, FH, and VCH.
The BC rate for physical inactivity was highest in 2001 (45.5%) and then remained relatively stable between 42% and 43%. FH consistently had the highest physical inactivity rates while VIHA consistently had the lowest.
Source: Statistics Canada, Canadian Community Health Survey, 2007.
Source: Statistics Canada, Canadian Community Health Survey, 2007.
Figure 1.9 Smoking Rates (%) by Resident Health Authority, 2001-2007 Selected Years
Figure 1.10 Physical Inactivity Rates (%) by Resident Health Authority, 2001-2007 Selected Years
2001 2003 2005 2007
FH
IH
NH
VCH
VIHA
BC15%
20%
25%
30%
35%
19.9 18.5 17.5 18.1
25.4 23.1 21.8 23.5
30.2 26.5 27.2 24.8
19.5 17.4 16.8 16.1
22.5 21.9 18.5 20.3
21.8 20.0 18.9 19.3
2001 2003 2005 2007
2001 2003 2005 2007
FH
IH
NH
VCH
VIHA
BC30%
35%
40%
45%
50%
49.5 43.6 47.0 46.3
45.2 41.6 42.0 40.4
45.4 43.5 46.4 42.7
43.5 41.9 43.3 40.6
41.4 39.0 34.4 37.8
45.5 42.1 43.0 42.2
2001 2003 2005 2007
2001 2003 2005 2007
FH
IH
NH
VCH
VIHA
BC15%
20%
25%
30%
35%
19.9 18.5 17.5 18.1
25.4 23.1 21.8 23.5
30.2 26.5 27.2 24.8
19.5 17.4 16.8 16.1
22.5 21.9 18.5 20.3
21.8 20.0 18.9 19.3
2001 2003 2005 2007
2001 2003 2005 2007
FH
IH
NH
VCH
VIHA
BC30%
35%
40%
45%
50%
49.5 43.6 47.0 46.3
45.2 41.6 42.0 40.4
45.4 43.5 46.4 42.7
43.5 41.9 43.3 40.6
41.4 39.0 34.4 37.8
45.5 42.1 43.0 42.2
2001 2003 2005 2007
Car
diac
Ser
vice
s B
C -
Ann
ual R
epor
t 20
10
Ch
apte
r 1
18
Ch
apter 1
Cardiac S
ervices BC
- Annual R
eport 2010
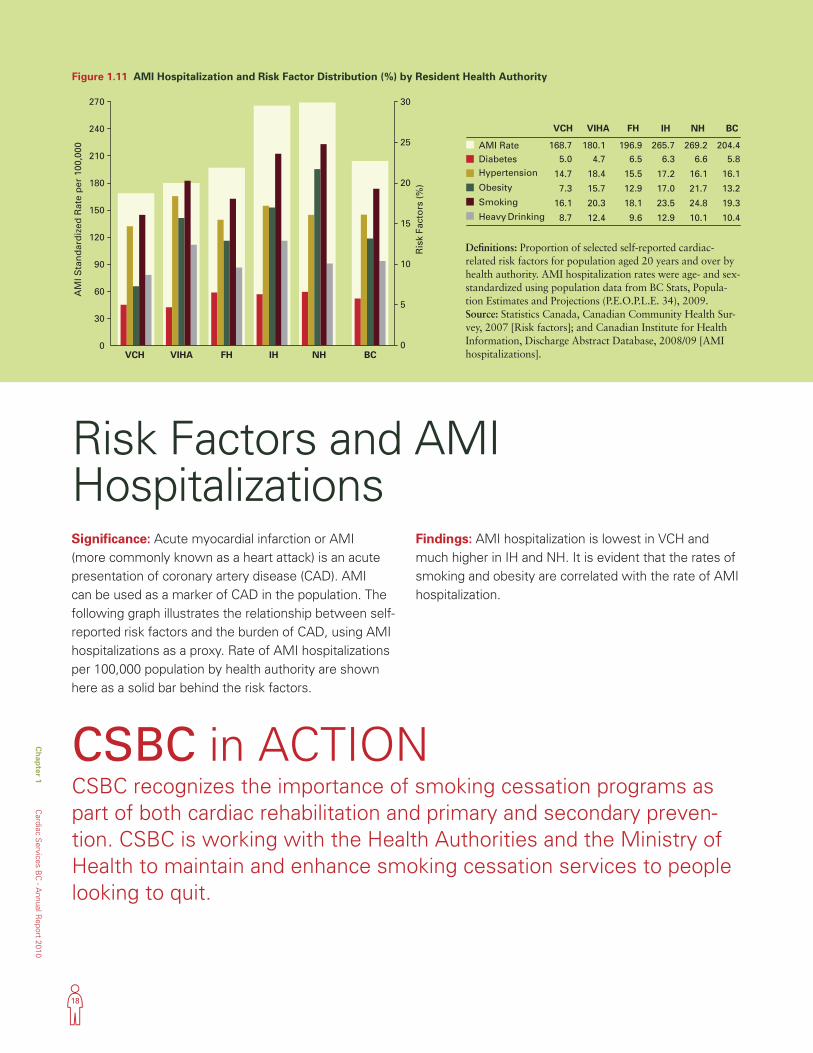
Significance: Acute myocardial infarction or AMI (more commonly known as a heart attack) is an acute presentation of coronary artery disease (CAD). AMI can be used as a marker of CAD in the population. The following graph illustrates the relationship between self-reported risk factors and the burden of CAD, using AMI hospitalizations as a proxy. Rate of AMI hospitalizations per 100,000 population by health authority are shown here as a solid bar behind the risk factors.
Findings: AMI hospitalization is lowest in VCH and much higher in IH and NH. It is evident that the rates of smoking and obesity are correlated with the rate of AMI hospitalization.
Risk Factors and AMI Hospitalizations
CSBC in ACTIONCSBC recognizes the importance of smoking cessation programs as part of both cardiac rehabilitation and primary and secondary preven-tion. CSBC is working with the Health Authorities and the Ministry of Health to maintain and enhance smoking cessation services to people looking to quit.
Figure 1.11 AMI Hospitalization and Risk Factor Distribution (%) by Resident Health Authority
AMI RateDiabetesHypertension
Obesity
Smoking
Heavy Drinking0
30
60
90
120
150
180
210
240
270
AM
I Sta
nd
ard
ized
Rat
e p
er 1
00,0
00
0
5
10
15
20
25
30
Ris
k Fa
cto
rs (
%)
168.75.0
14.7
7.3
16.1
8.7
VCH
180.14.7
18.4
15.7
20.3
12.4
VIHA
196.96.5
15.5
12.9
18.1
9.6
FH
265.76.3
17.2
17.0
23.5
12.9
IH
269.26.6
16.1
21.7
24.8
10.1
NH
204.45.8
16.1
13.2
19.3
10.4
BC
VCH VIHA FH IH NH BC
Definitions: Proportion of selected self-reported cardiac-related risk factors for population aged 20 years and over by health authority. AMI hospitalization rates were age- and sex-standardized using population data from BC Stats, Popula-tion Estimates and Projections (P.E.O.P.L.E. 34), 2009. Source: Statistics Canada, Canadian Community Health Sur-vey, 2007 [Risk factors]; and Canadian Institute for Health Information, Discharge Abstract Database, 2008/09 [AMI hospitalizations].
AMI RateDiabetesHypertension
Obesity
Smoking
Heavy Drinking0
30
60
90
120
150
180
210
240
270
AM
I Sta
nd
ard
ized
Rat
e p
er 1
00,0
00
0
5
10
15
20
25
30
Ris
k Fa
cto
rs (
%)
168.75.0
14.7
7.3
16.1
8.7
VCH
180.14.7
18.4
15.7
20.3
12.4
VIHA
196.96.5
15.5
12.9
18.1
9.6
FH
265.76.3
17.2
17.0
23.5
12.9
IH
269.26.6
16.1
21.7
24.8
10.1
NH
204.45.8
16.1
13.2
19.3
10.4
BC
VCH VIHA FH IH NH BC
19
Car
diac
Ser
vice
s B
C -
Ann
ual R
epor
t 20
10
Ch
apte
r 1
Chapter 2 Coronary ArteryDisease-RelatedHospitalizations
20
Ch
apter 2
Cardiac S
ervices BC
- Annual R
eport 2010
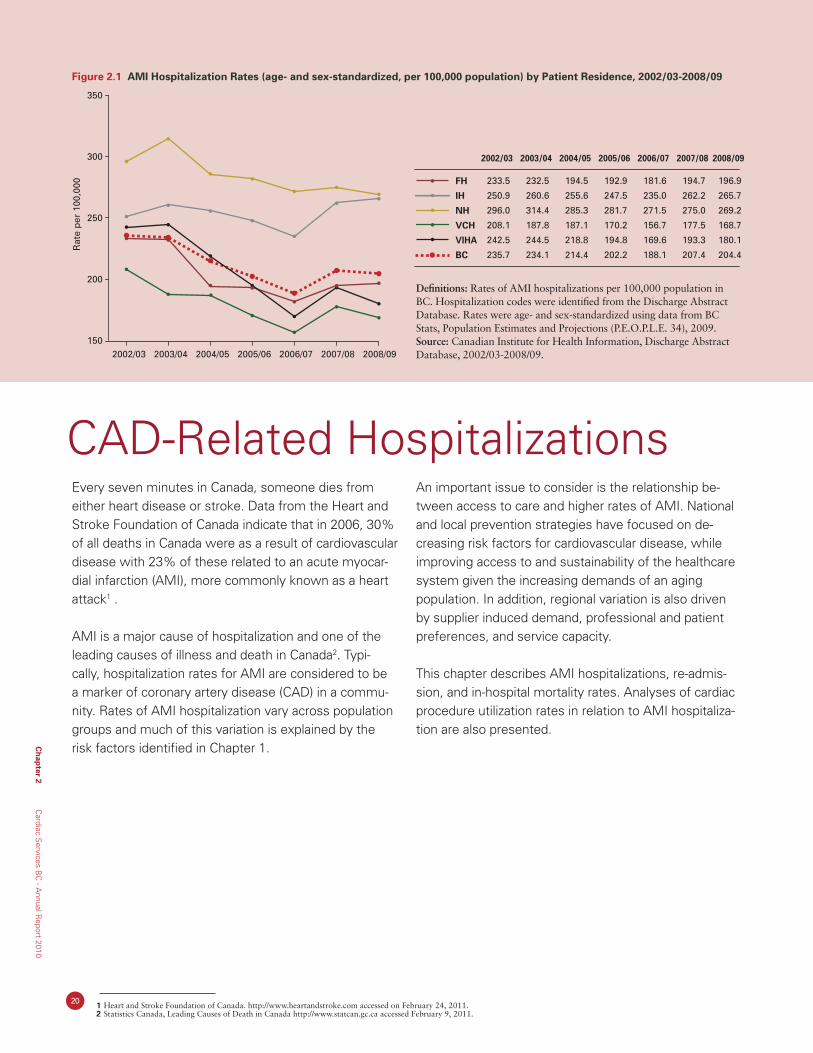
Every seven minutes in Canada, someone dies from either heart disease or stroke. Data from the Heart and Stroke Foundation of Canada indicate that in 2006, 30% of all deaths in Canada were as a result of cardiovascular disease with 23% of these related to an acute myocar-dial infarction (AMI), more commonly known as a heart attack1 .
AMI is a major cause of hospitalization and one of the leading causes of illness and death in Canada2. Typi-cally, hospitalization rates for AMI are considered to be a marker of coronary artery disease (CAD) in a commu-nity. Rates of AMI hospitalization vary across population groups and much of this variation is explained by the risk factors identified in Chapter 1.
An important issue to consider is the relationship be-tween access to care and higher rates of AMI. National and local prevention strategies have focused on de-creasing risk factors for cardiovascular disease, while improving access to and sustainability of the healthcare system given the increasing demands of an aging population. In addition, regional variation is also driven by supplier induced demand, professional and patient preferences, and service capacity.
This chapter describes AMI hospitalizations, re-admis-sion, and in-hospital mortality rates. Analyses of cardiac procedure utilization rates in relation to AMI hospitaliza-tion are also presented.
CAD-Related Hospitalizations
Figure 2.1 AMI Hospitalization Rates (age- and sex-standardized, per 100,000 population) by Patient Residence, 2002/03-2008/09R
ate
per
100
,000
2002/03
233.5
250.9
296.0
208.1
242.5
235.7
2003/04
232.5
260.6
314.4
187.8
244.5
234.1
2004/05
194.5
255.6
285.3
187.1
218.8
214.4
2005/06
192.9
247.5
281.7
170.2
194.8
202.2
2006/07
181.6
235.0
271.5
156.7
169.6
188.1
2007/08
194.7
262.2
275.0
177.5
193.3
207.4
2008/09
196.9
265.7
269.2
168.7
180.1
204.4
FH
IH
NH
VCH
VIHA
BC
150
200
250
300
350
2002/03 2003/04 2004/05 2005/06 2006/07 2007/08 2008/09
Rat
e p
er 1
00,0
00
2002/03
233.5
250.9
296.0
208.1
242.5
235.7
2003/04
232.5
260.6
314.4
187.8
244.5
234.1
2004/05
194.5
255.6
285.3
187.1
218.8
214.4
2005/06
192.9
247.5
281.7
170.2
194.8
202.2
2006/07
181.6
235.0
271.5
156.7
169.6
188.1
2007/08
194.7
262.2
275.0
177.5
193.3
207.4
2008/09
196.9
265.7
269.2
168.7
180.1
204.4
FH
IH
NH
VCH
VIHA
BC
150
200
250
300
350
2002/03 2003/04 2004/05 2005/06 2006/07 2007/08 2008/09
Definitions: Rates of AMI hospitalizations per 100,000 population in BC. Hospitalization codes were identified from the Discharge Abstract Database. Rates were age- and sex-standardized using data from BC Stats, Population Estimates and Projections (P.E.O.P.L.E. 34), 2009. Source: Canadian Institute for Health Information, Discharge Abstract Database, 2002/03-2008/09.
1 Heart and Stroke Foundation of Canada. http://www.heartandstroke.com accessed on February 24, 2011. 2 Statistics Canada, Leading Causes of Death in Canada http://www.statcan.gc.ca accessed February 9, 2011.
21
Car
diac
Ser
vice
s B
C -
Ann
ual R
epor
t 20
10
Ch
apte
r 2
CAD-Related Hospitalizations: AMISignificance: The following AMI hospitalization rates describe the change in hospitalizations over time and provide insight into the prevalence of CAD in the population. Differences in rates between health authorities may be attributed to several fac-tors, while decreasing hospitalization rates overall may be a reflection of a healthier population or may be a result of better managing the disease outside of the hospital, for example, through heart disease prevention programs. Tracking and understanding trends in hospitalizations is important for planning resources, be it capacity-planning for treatment-related procedures or for primary and secondary prevention programs.
Findings: Figure 2.1 AMI hospitalizations in BC have declined from 235.7 to 204.4 per 100,000 (2002/03 and 2008/09, respectively). AMI rates declined significantly in NH, VCH, and VIHA (p-value<0.05). NH and IH had the highest rates of AMI (above 235 per 100,000) while VCH had the lowest rates (below 210 per 100,000) in 2008/09. (Note: These numbers do not include people who were not admitted to a hospital, for example people who died before being admitted to hospital.)
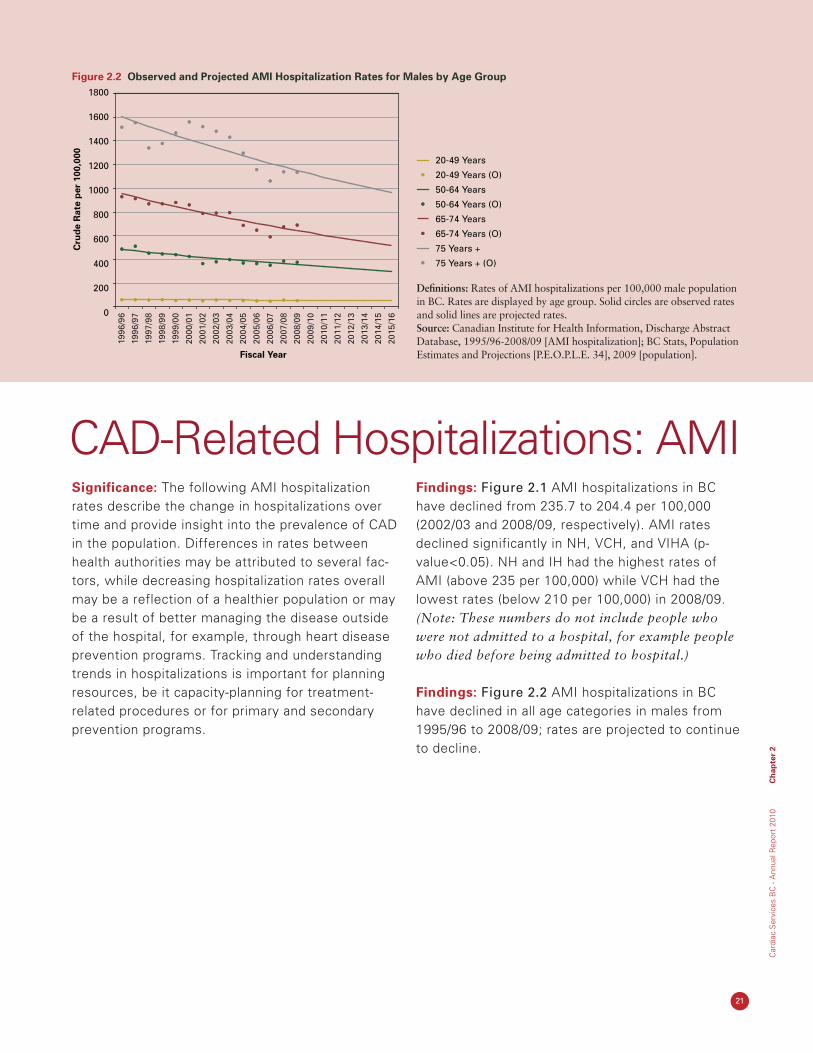
Findings: Figure 2.2 AMI hospitalizations in BC have declined in all age categories in males from 1995/96 to 2008/09; rates are projected to continue to decline.
Figure 2.2 Observed and Projected AMI Hospitalization Rates for Males by Age Group
20-49 Years
20-49 Years (O)
50-64 Years
50-64 Years (O)
65-74 Years
65-74 Years (O)
75 Years +
75 Years + (O)
0
200
400
600
800
1000
1200
1400
1600
1800
Fiscal Year
Cru
de
Rat
e p
er 1
00,0
00
1996
/96
1996
/97
1997
/98
1998
/99
1999
/00
2000
/01
2001
/02
2002
/03
2003
/04
2004
/05
2005
/06
2006
/07
2007
/08
2008
/09
2009
/10
2010
/11
2011
/12
2012
/13
2013
/14
2014
/15
2015
/16
Definitions: Rates of AMI hospitalizations per 100,000 male population in BC. Rates are displayed by age group. Solid circles are observed rates and solid lines are projected rates. Source: Canadian Institute for Health Information, Discharge Abstract Database, 1995/96-2008/09 [AMI hospitalization]; BC Stats, Population Estimates and Projections [P.E.O.P.L.E. 34], 2009 [population].
22
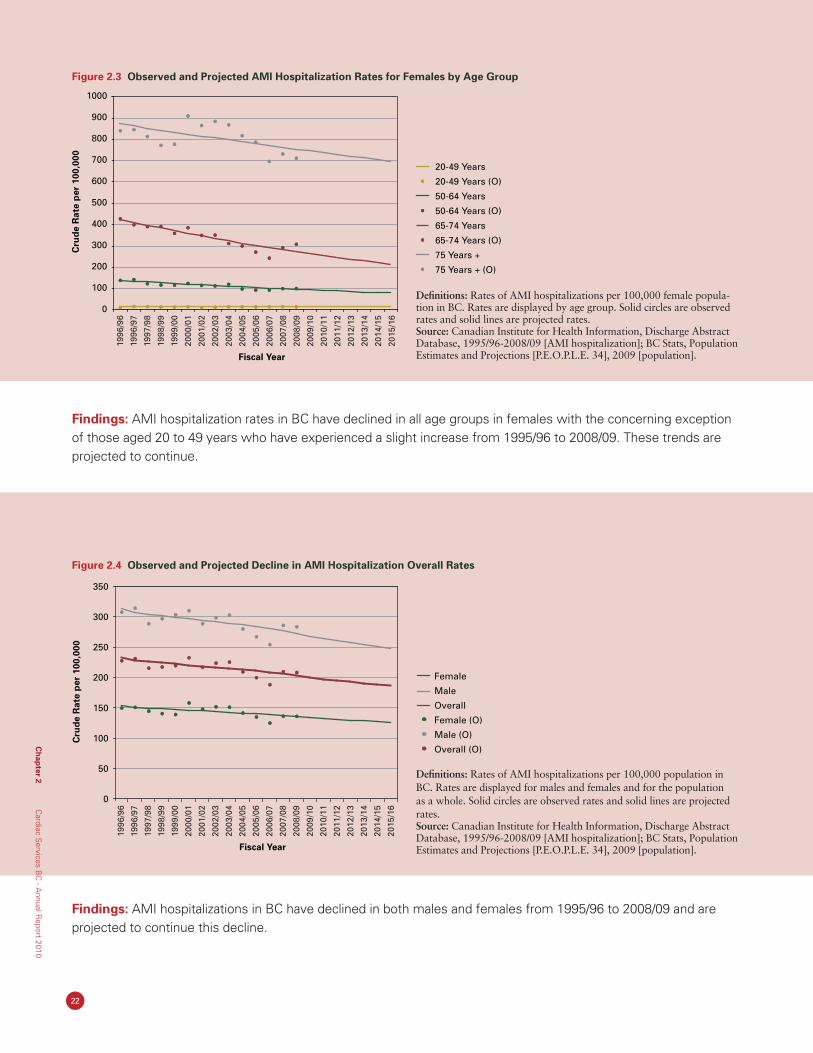
Findings: AMI hospitalization rates in BC have declined in all age groups in females with the concerning exception of those aged 20 to 49 years who have experienced a slight increase from 1995/96 to 2008/09. These trends are projected to continue.
Findings: AMI hospitalizations in BC have declined in both males and females from 1995/96 to 2008/09 and are projected to continue this decline.
Figure 2.3 Observed and Projected AMI Hospitalization Rates for Females by Age Group
Definitions: Rates of AMI hospitalizations per 100,000 female popula-tion in BC. Rates are displayed by age group. Solid circles are observed rates and solid lines are projected rates. Source: Canadian Institute for Health Information, Discharge Abstract Database, 1995/96-2008/09 [AMI hospitalization]; BC Stats, Population Estimates and Projections [P.E.O.P.L.E. 34], 2009 [population].
Figure 2.4 Observed and Projected Decline in AMI Hospitalization Overall Rates
Definitions: Rates of AMI hospitalizations per 100,000 population in BC. Rates are displayed for males and females and for the population as a whole. Solid circles are observed rates and solid lines are projected rates.Source: Canadian Institute for Health Information, Discharge Abstract Database, 1995/96-2008/09 [AMI hospitalization]; BC Stats, Population Estimates and Projections [P.E.O.P.L.E. 34], 2009 [population].
Fiscal Year
Cru
de
Rat
e p
er 1
00,0
00
1996
/96
1996
/97
1997
/98
1998
/99
1999
/00
2000
/01
2001
/02
2002
/03
2003
/04
2004
/05
2005
/06
2006
/07
2007
/08
2008
/09
2009
/10
2010
/11
2011
/12
2012
/13
2013
/14
2014
/15
2015
/16
0
100
200
300
400
500
600
700
800
900
1000 20-49 Years
20-49 Years (O)
50-64 Years
50-64 Years (O)
65-74 Years
65-74 Years (O)
75 Years +
75 Years + (O)
Ch
apter 2
Cardiac S
ervices BC
- Annual R
eport 2010
Fiscal Year
Cru
de
Rat
e p
er 1
00,0
00
1996
/96
1996
/97
1997
/98
1998
/99
1999
/00
2000
/01
2001
/02
2002
/03
2003
/04
2004
/05
2005
/06
2006
/07
2007
/08
2008
/09
2009
/10
2010
/11
2011
/12
2012
/13
2013
/14
2014
/15
2015
/16
0
50
100
150
200
250
300
350Female
Male
Overall
Female (O)
Male (O)
Overall (O)
23
Car
diac
Ser
vice
s B
C -
Ann
ual R
epor
t 20
10
Ch
apte
r 2
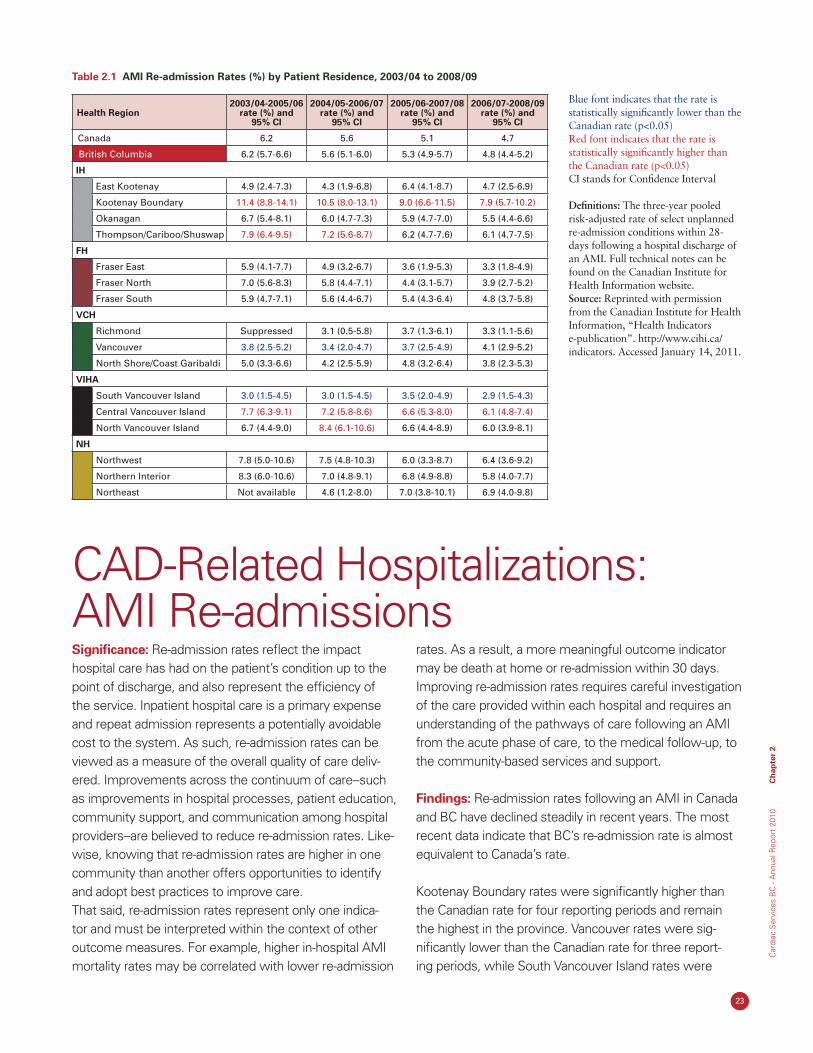
Significance: Re-admission rates reflect the impact hospital care has had on the patient’s condition up to the point of discharge, and also represent the efficiency of the service. Inpatient hospital care is a primary expense and repeat admission represents a potentially avoidable cost to the system. As such, re-admission rates can be viewed as a measure of the overall quality of care deliv-ered. Improvements across the continuum of care--such as improvements in hospital processes, patient education, community support, and communication among hospital providers--are believed to reduce re-admission rates. Like-wise, knowing that re-admission rates are higher in one community than another offers opportunities to identify and adopt best practices to improve care. That said, re-admission rates represent only one indica-tor and must be interpreted within the context of other outcome measures. For example, higher in-hospital AMI mortality rates may be correlated with lower re-admission
rates. As a result, a more meaningful outcome indicator may be death at home or re-admission within 30 days. Improving re-admission rates requires careful investigation of the care provided within each hospital and requires an understanding of the pathways of care following an AMI from the acute phase of care, to the medical follow-up, to the community-based services and support.
Findings: Re-admission rates following an AMI in Canada and BC have declined steadily in recent years. The most recent data indicate that BC’s re-admission rate is almost equivalent to Canada’s rate.
Kootenay Boundary rates were significantly higher than the Canadian rate for four reporting periods and remain the highest in the province. Vancouver rates were sig-nificantly lower than the Canadian rate for three report-ing periods, while South Vancouver Island rates were
CAD-Related Hospitalizations: AMI Re-admissions
Blue font indicates that the rate is statistically significantly lower than the Canadian rate (p<0.05)Red font indicates that the rate is statistically significantly higher than the Canadian rate (p<0.05)CI stands for Confidence Interval
Definitions: The three-year pooled risk-adjusted rate of select unplanned re-admission conditions within 28-days following a hospital discharge of an AMI. Full technical notes can be found on the Canadian Institute for Health Information website. Source: Reprinted with permission from the Canadian Institute for Health Information, “Health Indicators e-publication”. http://www.cihi.ca/indicators. Accessed January 14, 2011.
Table 2.1 AMI Re-admission Rates (%) by Patient Residence, 2003/04 to 2008/09
Health Region2003/04-2005/06
rate (%) and 95% CI
2004/05-2006/07 rate (%) and
95% CI
2005/06-2007/08 rate (%) and
95% CI
2006/07-2008/09 rate (%) and
95% CI
Canada 6.2 5.6 5.1 4.7
British Columbia 6.2 (5.7-6.6) 5.6 (5.1-6.0) 5.3 (4.9-5.7) 4.8 (4.4-5.2)
IH
East Kootenay 4.9 (2.4-7.3) 4.3 (1.9-6.8) 6.4 (4.1-8.7) 4.7 (2.5-6.9)
Kootenay Boundary 11.4 (8.8-14.1) 10.5 (8.0-13.1) 9.0 (6.6-11.5) 7.9 (5.7-10.2)
Okanagan 6.7 (5.4-8.1) 6.0 (4.7-7.3) 5.9 (4.7-7.0) 5.5 (4.4-6.6)
Thompson/Cariboo/Shuswap 7.9 (6.4-9.5) 7.2 (5.6-8.7) 6.2 (4.7-7.6) 6.1 (4.7-7.5)
FH
Fraser East 5.9 (4.1-7.7) 4.9 (3.2-6.7) 3.6 (1.9-5.3) 3.3 (1.8-4.9)
Fraser North 7.0 (5.6-8.3) 5.8 (4.4-7.1) 4.4 (3.1-5.7) 3.9 (2.7-5.2)
Fraser South 5.9 (4.7-7.1) 5.6 (4.4-6.7) 5.4 (4.3-6.4) 4.8 (3.7-5.8)
VCH
Richmond Suppressed 3.1 (0.5-5.8) 3.7 (1.3-6.1) 3.3 (1.1-5.6)
Vancouver 3.8 (2.5-5.2) 3.4 (2.0-4.7) 3.7 (2.5-4.9) 4.1 (2.9-5.2)
North Shore/Coast Garibaldi 5.0 (3.3-6.6) 4.2 (2.5-5.9) 4.8 (3.2-6.4) 3.8 (2.3-5.3)
VIHA
South Vancouver Island 3.0 (1.5-4.5) 3.0 (1.5-4.5) 3.5 (2.0-4.9) 2.9 (1.5-4.3)
Central Vancouver Island 7.7 (6.3-9.1) 7.2 (5.8-8.6) 6.6 (5.3-8.0) 6.1 (4.8-7.4)
North Vancouver Island 6.7 (4.4-9.0) 8.4 (6.1-10.6) 6.6 (4.4-8.9) 6.0 (3.9-8.1)
NH
Northwest 7.8 (5.0-10.6) 7.5 (4.8-10.3) 6.0 (3.3-8.7) 6.4 (3.6-9.2)
Northern Interior 8.3 (6.0-10.6) 7.0 (4.8-9.1) 6.8 (4.9-8.8) 5.8 (4.0-7.7)
Northeast Not available 4.6 (1.2-8.0) 7.0 (3.8-10.1) 6.9 (4.0-9.8)
24
Ch
apter 2
Cardiac S
ervices BC
- Annual R
eport 2010
significantly lower for four reporting periods. Substantial variation in re-admission rates exist on the Island with South Vancouver Island reporting rates as low as 2.9% and Central and North Vancouver Island reporting rates around 6.0%. Health Service Delivery Areas in FH and NH did not have significantly different rates however, the rates generally declined in these areas over the study period.
The data indicate that residents living in more urban com-munities have lower re-admission rates suggesting that more remote areas may have less access to specialty care. Variation in AMI re-admission rates exist across the prov-ince and also within individual health authorities. (Note: The risk-adjusted model is based on data from all provinces, excluding Quebec, and territories in Canada.)
CSBC in ACTIONCSBC is continually monitoring BC’s overall performance on AMI hospitalizations, re-admissions, and deaths, with the aim of improving performance across the system. CSBC continues to allocate funds toward a campaign initially launched by the Canadian Patient Safety Council, known as “Safer Healthcare Now” that utilizes quality improvement methods to integrate evidence and best practices into patient care delivery for patients with AMI. The projects funded focus on:
• Thedevelopmentandstandardizationofordersets(toensurethattreatmentand medication are delivered consistently regardless of the practitioner);
• Theimplementationoftrackingsystemstomonitorpatientcare;•Measurementofthecompletionrateofsiximportantquality-of-careindicators
at baseline and post-implementation; and,• Implementationofnewqualityimprovementmethods.
25
Car
diac
Ser
vice
s B
C -
Ann
ual R
epor
t 20
10
Ch
apte
r 2
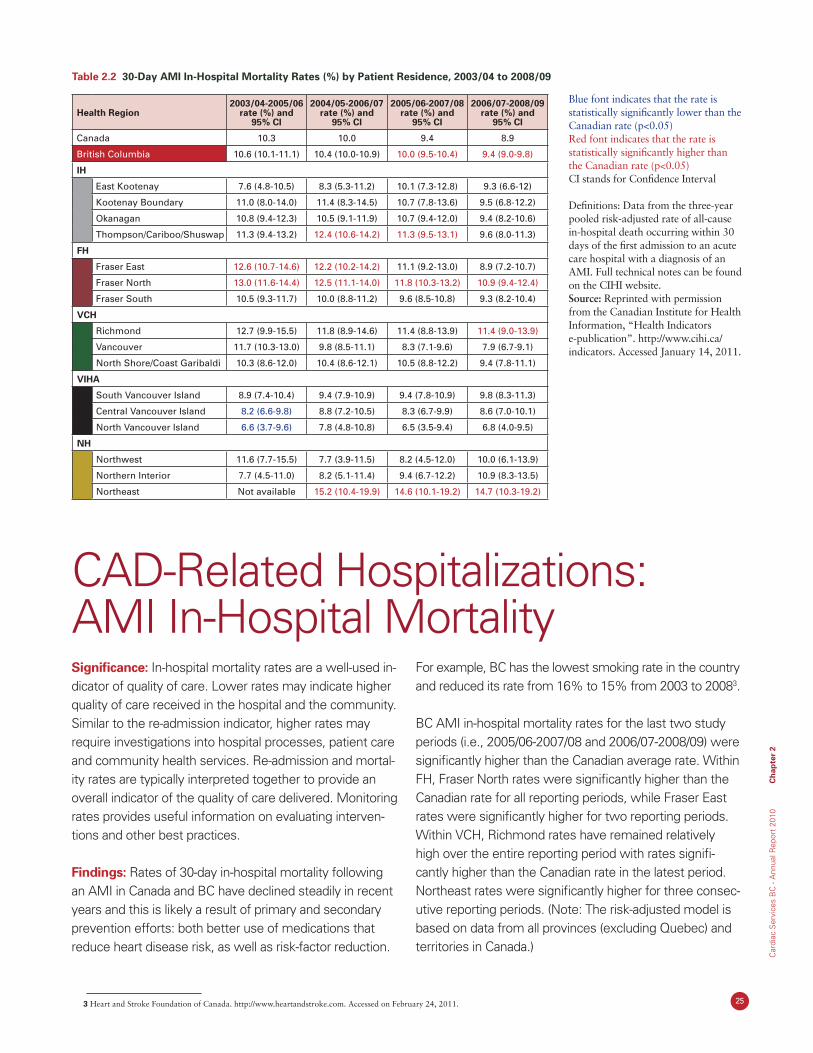
Table 2.2 30-Day AMI In-Hospital Mortality Rates (%) by Patient Residence, 2003/04 to 2008/09
Health Region2003/04-2005/06
rate (%) and 95% CI
2004/05-2006/07 rate (%) and
95% CI
2005/06-2007/08 rate (%) and
95% CI
2006/07-2008/09 rate (%) and
95% CI
Canada 10.3 10.0 9.4 8.9
British Columbia 10.6 (10.1-11.1) 10.4 (10.0-10.9) 10.0 (9.5-10.4) 9.4 (9.0-9.8)
IH
East Kootenay 7.6 (4.8-10.5) 8.3 (5.3-11.2) 10.1 (7.3-12.8) 9.3 (6.6-12)
Kootenay Boundary 11.0 (8.0-14.0) 11.4 (8.3-14.5) 10.7 (7.8-13.6) 9.5 (6.8-12.2)
Okanagan 10.8 (9.4-12.3) 10.5 (9.1-11.9) 10.7 (9.4-12.0) 9.4 (8.2-10.6)
Thompson/Cariboo/Shuswap 11.3 (9.4-13.2) 12.4 (10.6-14.2) 11.3 (9.5-13.1) 9.6 (8.0-11.3)
FH
Fraser East 12.6 (10.7-14.6) 12.2 (10.2-14.2) 11.1 (9.2-13.0) 8.9 (7.2-10.7)
Fraser North 13.0 (11.6-14.4) 12.5 (11.1-14.0) 11.8 (10.3-13.2) 10.9 (9.4-12.4)
Fraser South 10.5 (9.3-11.7) 10.0 (8.8-11.2) 9.6 (8.5-10.8) 9.3 (8.2-10.4)
VCH
Richmond 12.7 (9.9-15.5) 11.8 (8.9-14.6) 11.4 (8.8-13.9) 11.4 (9.0-13.9)
Vancouver 11.7 (10.3-13.0) 9.8 (8.5-11.1) 8.3 (7.1-9.6) 7.9 (6.7-9.1)
North Shore/Coast Garibaldi 10.3 (8.6-12.0) 10.4 (8.6-12.1) 10.5 (8.8-12.2) 9.4 (7.8-11.1)
VIHA
South Vancouver Island 8.9 (7.4-10.4) 9.4 (7.9-10.9) 9.4 (7.8-10.9) 9.8 (8.3-11.3)
Central Vancouver Island 8.2 (6.6-9.8) 8.8 (7.2-10.5) 8.3 (6.7-9.9) 8.6 (7.0-10.1)
North Vancouver Island 6.6 (3.7-9.6) 7.8 (4.8-10.8) 6.5 (3.5-9.4) 6.8 (4.0-9.5)
NH
Northwest 11.6 (7.7-15.5) 7.7 (3.9-11.5) 8.2 (4.5-12.0) 10.0 (6.1-13.9)
Northern Interior 7.7 (4.5-11.0) 8.2 (5.1-11.4) 9.4 (6.7-12.2) 10.9 (8.3-13.5)
Northeast Not available 15.2 (10.4-19.9) 14.6 (10.1-19.2) 14.7 (10.3-19.2)
Blue font indicates that the rate is statistically significantly lower than the Canadian rate (p<0.05)Red font indicates that the rate is statistically significantly higher than the Canadian rate (p<0.05)CI stands for Confidence Interval
Definitions: Data from the three-year pooled risk-adjusted rate of all-cause in-hospital death occurring within 30 days of the first admission to an acute care hospital with a diagnosis of an AMI. Full technical notes can be found on the CIHI website. Source: Reprinted with permission from the Canadian Institute for Health Information, “Health Indicators e-publication”. http://www.cihi.ca/indicators. Accessed January 14, 2011.
Significance: In-hospital mortality rates are a well-used in-dicator of quality of care. Lower rates may indicate higher quality of care received in the hospital and the community. Similar to the re-admission indicator, higher rates may require investigations into hospital processes, patient care and community health services. Re-admission and mortal-ity rates are typically interpreted together to provide an overall indicator of the quality of care delivered. Monitoring rates provides useful information on evaluating interven-tions and other best practices.
Findings: Rates of 30-day in-hospital mortality following an AMI in Canada and BC have declined steadily in recent years and this is likely a result of primary and secondary prevention efforts: both better use of medications that reduce heart disease risk, as well as risk-factor reduction.
For example, BC has the lowest smoking rate in the country and reduced its rate from 16% to 15% from 2003 to 20083.
BC AMI in-hospital mortality rates for the last two study periods (i.e., 2005/06-2007/08 and 2006/07-2008/09) were significantly higher than the Canadian average rate. Within FH, Fraser North rates were significantly higher than the Canadian rate for all reporting periods, while Fraser East rates were significantly higher for two reporting periods. Within VCH, Richmond rates have remained relatively high over the entire reporting period with rates signifi-cantly higher than the Canadian rate in the latest period. Northeast rates were significantly higher for three consec-utive reporting periods. (Note: The risk-adjusted model is based on data from all provinces (excluding Quebec) and territories in Canada.)
CAD-Related Hospitalizations: AMI In-Hospital Mortality
3 Heart and Stroke Foundation of Canada. http://www.heartandstroke.com. Accessed on February 24, 2011.
26
Ch
apter 2
Cardiac S
ervices BC
- Annual R
eport 2010
The diagnosis and treatment of CAD is an important component of CSBC’s overall mandate. Coronary revascu-larization, through Coronary Artery Bypass Grafts (CABG) and/or Percutaneous Coronary Interventions (PCI), plays a key role in the treatment of CAD. The choice of treatment
and the rate of treatment varies substantially across the system. This section provides an overview of the relation-ship between AMI hospitalizations and cardiac procedure utilization, through the reporting of rates and ratios.
CAD-Related Hospitalizations and Cardiac Procedure Utilization
CSBC in ACTIONCSBC is currently engaging in a provincial review on regional variation to better understand the impact of these factors on revascularization practice in BC.
27
Car
diac
Ser
vice
s B
C -
Ann
ual R
epor
t 20
10
Ch
apte
r 2
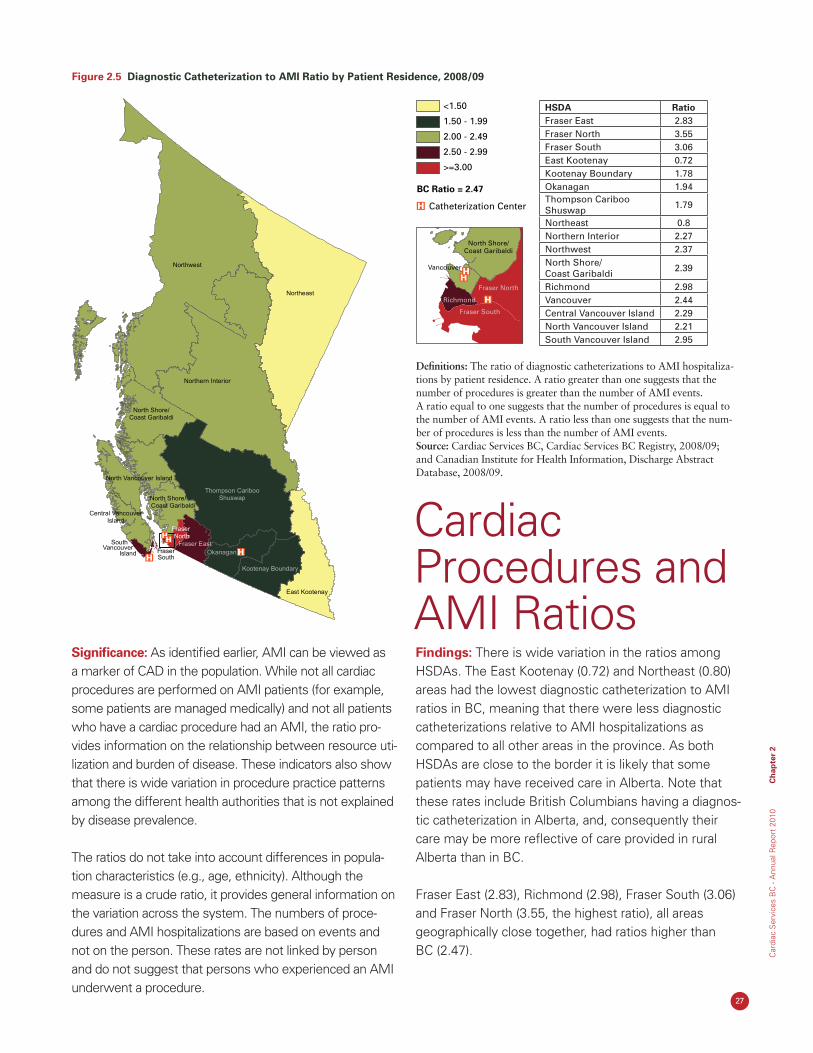
Figure 2.5 Diagnostic Catheterization to AMI Ratio by Patient Residence, 2008/09
Significance: As identified earlier, AMI can be viewed as a marker of CAD in the population. While not all cardiac procedures are performed on AMI patients (for example, some patients are managed medically) and not all patients who have a cardiac procedure had an AMI, the ratio pro-vides information on the relationship between resource uti-lization and burden of disease. These indicators also show that there is wide variation in procedure practice patterns among the different health authorities that is not explained by disease prevalence.
The ratios do not take into account differences in popula-tion characteristics (e.g., age, ethnicity). Although the measure is a crude ratio, it provides general information on the variation across the system. The numbers of proce-dures and AMI hospitalizations are based on events and not on the person. These rates are not linked by person and do not suggest that persons who experienced an AMI underwent a procedure.
Findings: There is wide variation in the ratios among HSDAs. The East Kootenay (0.72) and Northeast (0.80) areas had the lowest diagnostic catheterization to AMI ratios in BC, meaning that there were less diagnostic catheterizations relative to AMI hospitalizations as compared to all other areas in the province. As both HSDAs are close to the border it is likely that some patients may have received care in Alberta. Note that these rates include British Columbians having a diagnos-tic catheterization in Alberta, and, consequently their care may be more reflective of care provided in rural Alberta than in BC.
Fraser East (2.83), Richmond (2.98), Fraser South (3.06) and Fraser North (3.55, the highest ratio), all areas geographically close together, had ratios higher than BC (2.47).
Fraser
Northwest
Northern Interior
Northeast
North Vancouver Island
Thompson CaribooShuswap
Okanagan
Kootenay Boundary
East Kootenay
South Vancouver
Island
Central VancouverIsland
North Shore/Coast Garibaldi
Fraser East
South
North Shore/Coast Garibaldi
FraserNorth
<1.50
1.50 - 1.99
2.00 - 2.49
2.50 - 2.99
>=3.00
North Shore/Coast Garibaldi
Vancouver
Catheterization Center
BC Ratio = 2.47
Fraser North
Fraser South
Richmond
HSDA RatioFraser East 2.83Fraser North 3.55Fraser South 3.06East Kootenay 0.72Kootenay Boundary 1.78Okanagan 1.94Thompson Cariboo Shuswap 1.79
Northeast 0.8Northern Interior 2.27Northwest 2.37North Shore/ Coast Garibaldi 2.39
Richmond 2.98Vancouver 2.44Central Vancouver Island 2.29North Vancouver Island 2.21South Vancouver Island 2.95
Cardiac Procedures and AMI Ratios
Definitions: The ratio of diagnostic catheterizations to AMI hospitaliza-tions by patient residence. A ratio greater than one suggests that the number of procedures is greater than the number of AMI events. A ratio equal to one suggests that the number of procedures is equal to the number of AMI events. A ratio less than one suggests that the num-ber of procedures is less than the number of AMI events. Source: Cardiac Services BC, Cardiac Services BC Registry, 2008/09; and Canadian Institute for Health Information, Discharge Abstract Database, 2008/09.
28
Ch
apter 2
Cardiac S
ervices BC
- Annual R
eport 2010
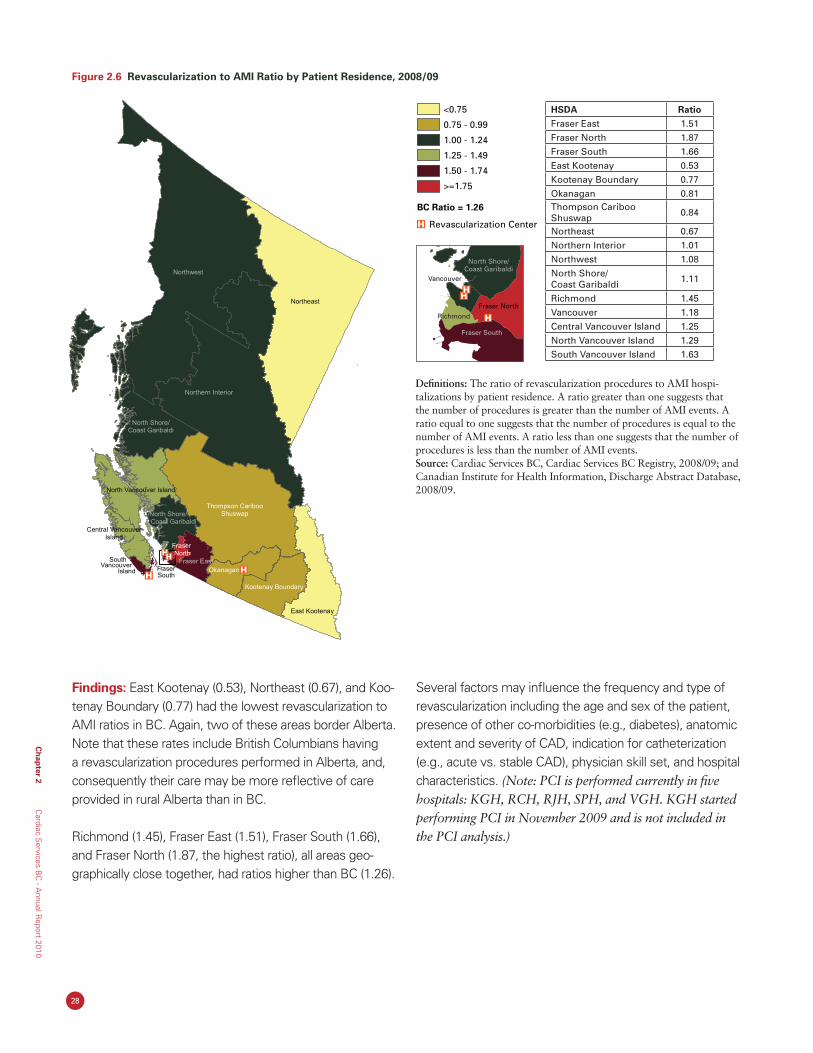
Definitions: The ratio of revascularization procedures to AMI hospi-talizations by patient residence. A ratio greater than one suggests that the number of procedures is greater than the number of AMI events. A ratio equal to one suggests that the number of procedures is equal to the number of AMI events. A ratio less than one suggests that the number of procedures is less than the number of AMI events. Source: Cardiac Services BC, Cardiac Services BC Registry, 2008/09; and Canadian Institute for Health Information, Discharge Abstract Database, 2008/09.
Findings: East Kootenay (0.53), Northeast (0.67), and Koo-tenay Boundary (0.77) had the lowest revascularization to AMI ratios in BC. Again, two of these areas border Alberta. Note that these rates include British Columbians having a revascularization procedures performed in Alberta, and, consequently their care may be more reflective of care provided in rural Alberta than in BC.
Richmond (1.45), Fraser East (1.51), Fraser South (1.66), and Fraser North (1.87, the highest ratio), all areas geo-graphically close together, had ratios higher than BC (1.26).
Several factors may influence the frequency and type of revascularization including the age and sex of the patient, presence of other co-morbidities (e.g., diabetes), anatomic extent and severity of CAD, indication for catheterization (e.g., acute vs. stable CAD), physician skill set, and hospital characteristics. (Note: PCI is performed currently in five hospitals: KGH, RCH, RJH, SPH, and VGH. KGH started performing PCI in November 2009 and is not included in the PCI analysis.)
Figure 2.6 Revascularization to AMI Ratio by Patient Residence, 2008/09
<0.75
0.75 - 0.99
1.00 - 1.24
1.25 - 1.49
1.50 - 1.74
>=1.75
North Shore/Coast Garibaldi
Vancouver
Revascularization Center
BC Ratio = 1.26
Fraser North
Fraser South
Richmond
Fraser
Northeast
rrtNo h Vancouve Island
Thompson CaribooShuswap
Okanagan
Kootenay Boundary
East Kootenay
South Vancouver
Island
Central VancouverIsland
North Shore/Coast Garibaldi
Fraser East
South
Northwest
Northern Interior
North Shore/Coast Garibaldi
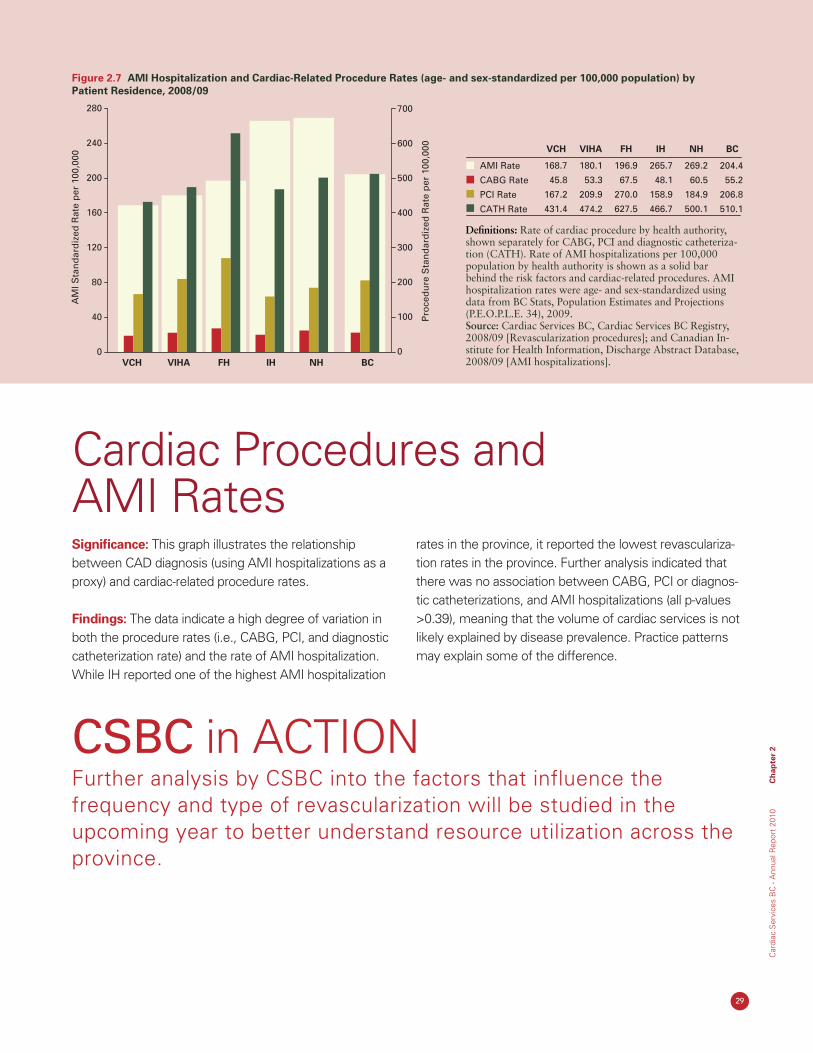
FraserNorth
<0.75
0.75 - 0.99
1.00 - 1.24
1.25 - 1.49
1.50 - 1.74
>=1.75
North Shore/Coast Garibaldi
Vancouver
Revascularization Center
BC Ratio = 1.26
Fraser North
Fraser South
Richmond
Fraser
Northeast
rrtNo h Vancouve Island
Thompson CaribooShuswap
Okanagan
Kootenay Boundary
East Kootenay
South Vancouver
Island
Central VancouverIsland
North Shore/Coast Garibaldi
Fraser East
South
Northwest
Northern Interior
North Shore/Coast Garibaldi
FraserNorth
HSDA RatioFraser East 1.51Fraser North 1.87Fraser South 1.66East Kootenay 0.53Kootenay Boundary 0.77Okanagan 0.81Thompson Cariboo Shuswap 0.84
Northeast 0.67Northern Interior 1.01Northwest 1.08North Shore/ Coast Garibaldi 1.11
Richmond 1.45Vancouver 1.18Central Vancouver Island 1.25North Vancouver Island 1.29South Vancouver Island 1.63
29
Car
diac
Ser
vice
s B
C -
Ann
ual R
epor
t 20
10
Ch
apte
r 2
Significance: This graph illustrates the relationship between CAD diagnosis (using AMI hospitalizations as a proxy) and cardiac-related procedure rates.
Findings: The data indicate a high degree of variation in both the procedure rates (i.e., CABG, PCI, and diagnostic catheterization rate) and the rate of AMI hospitalization. While IH reported one of the highest AMI hospitalization
rates in the province, it reported the lowest revasculariza-tion rates in the province. Further analysis indicated that there was no association between CABG, PCI or diagnos-tic catheterizations, and AMI hospitalizations (all p-values >0.39), meaning that the volume of cardiac services is not likely explained by disease prevalence. Practice patterns may explain some of the difference.
Cardiac Procedures and AMI Rates
Figure 2.7 AMI Hospitalization and Cardiac-Related Procedure Rates (age- and sex-standardized per 100,000 population) by Patient Residence, 2008/09
Definitions: Rate of cardiac procedure by health authority, shown separately for CABG, PCI and diagnostic catheteriza-tion (CATH). Rate of AMI hospitalizations per 100,000 population by health authority is shown as a solid bar behind the risk factors and cardiac-related procedures. AMI hospitalization rates were age- and sex-standardized using data from BC Stats, Population Estimates and Projections (P.E.O.P.L.E. 34), 2009. Source: Cardiac Services BC, Cardiac Services BC Registry, 2008/09 [Revascularization procedures]; and Canadian In-stitute for Health Information, Discharge Abstract Database, 2008/09 [AMI hospitalizations].
AMI Rate
CABG Rate
PCI Rate
168.7
45.8
167.2
431.4
180.1
53.3
209.9
474.2
196.9
67.5
270.0
627.5
265.7
48.1
158.9
466.7
269.2
60.5
184.9
500.1
204.4
55.2
206.8
510.1CATH Rate
AM
I Sta
nd
ard
ized
Rat
e p
er 1
00,0
00
VCH VIHA FH IH NH BC
VCH VIHA FH IH NH BC0
40
80
120
160
200
240
280
0
100
200
300
400
500
600
700
Pro
ced
ure
Sta
nd
ard
ized
Rat
e p
er 1
00,0
00
CSBC in ACTIONFurther analysis by CSBC into the factors that influence the frequency and type of revascularization will be studied in the upcoming year to better understand resource utilization across the province.

30
Ch
apter 3
Cardiac S
ervices BC
- Annual R
eport 2010
Car
diac
Ser
vice
s B
C -
Ann
ual R
epor
t 20
10
Ch
apte
r 3
31
Chapter 3 CardiacProcedureUtilization
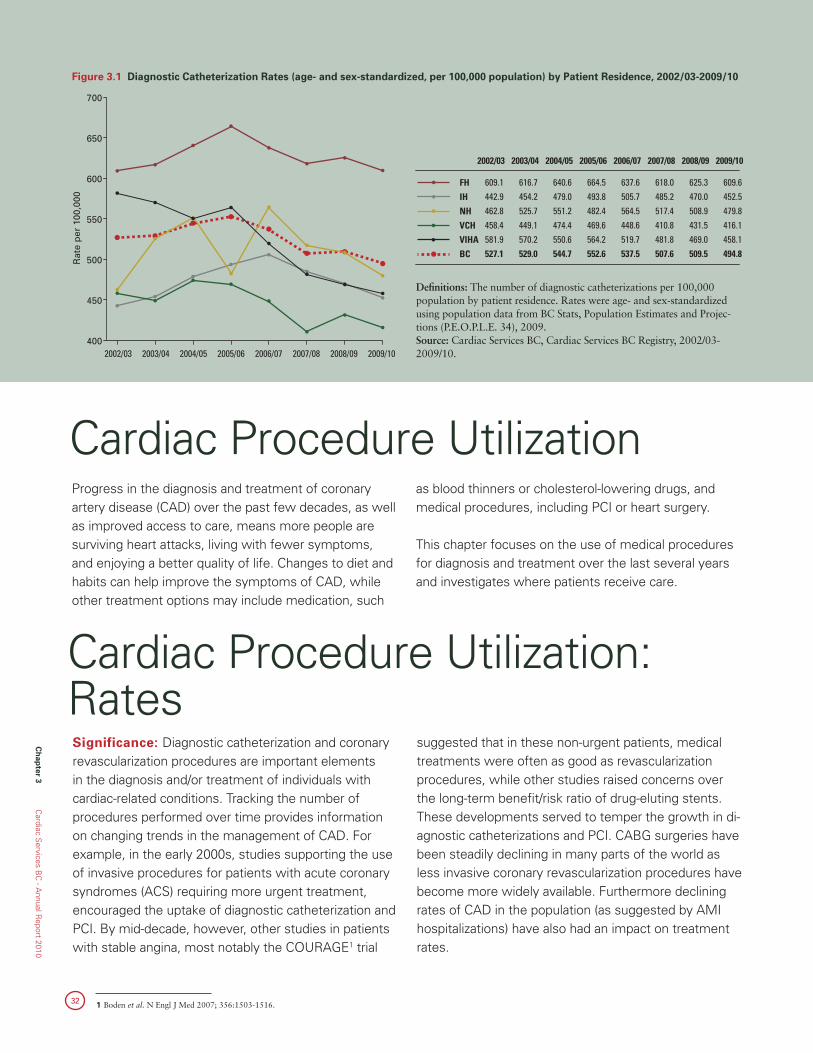
32
Ch
apter 3
Cardiac S
ervices BC
- Annual R
eport 2010
1 Boden et al. N Engl J Med 2007; 356:1503-1516.
Progress in the diagnosis and treatment of coronary artery disease (CAD) over the past few decades, as well as improved access to care, means more people are surviving heart attacks, living with fewer symptoms, and enjoying a better quality of life. Changes to diet and habits can help improve the symptoms of CAD, while other treatment options may include medication, such
as blood thinners or cholesterol-lowering drugs, and medical procedures, including PCI or heart surgery.
This chapter focuses on the use of medical procedures for diagnosis and treatment over the last several years and investigates where patients receive care.
Cardiac Procedure Utilization
Figure 3.1 Diagnostic Catheterization Rates (age- and sex-standardized, per 100,000 population) by Patient Residence, 2002/03-2009/10
Definitions: The number of diagnostic catheterizations per 100,000 population by patient residence. Rates were age- and sex-standardized using population data from BC Stats, Population Estimates and Projec-tions (P.E.O.P.L.E. 34), 2009. Source: Cardiac Services BC, Cardiac Services BC Registry, 2002/03-2009/10.
Significance: Diagnostic catheterization and coronary revascularization procedures are important elements in the diagnosis and/or treatment of individuals with cardiac-related conditions. Tracking the number of procedures performed over time provides information on changing trends in the management of CAD. For example, in the early 2000s, studies supporting the use of invasive procedures for patients with acute coronary syndromes (ACS) requiring more urgent treatment, encouraged the uptake of diagnostic catheterization and PCI. By mid-decade, however, other studies in patients with stable angina, most notably the COURAGE1 trial
suggested that in these non-urgent patients, medical treatments were often as good as revascularization procedures, while other studies raised concerns over the long-term benefit/risk ratio of drug-eluting stents. These developments served to temper the growth in di-agnostic catheterizations and PCI. CABG surgeries have been steadily declining in many parts of the world as less invasive coronary revascularization procedures have become more widely available. Furthermore declining rates of CAD in the population (as suggested by AMI hospitalizations) have also had an impact on treatment rates.
Cardiac Procedure Utilization: Rates
2002/03 2003/04 2004/05 2005/06 2006/07 2007/08 2008/09 2009/10
609.1 616.7 640.6 664.5 637.6 618.0 625.3 609.6FH442.9 454.2 479.0 493.8 505.7 485.2 470.0 452.5IH462.8 525.7 551.2 482.4 564.5 517.4 508.9 479.8NH458.4 449.1 474.4 469.6 448.6 410.8 431.5 416.1VCH581.9 570.2 550.6 564.2 519.7 481.8 469.0 458.1VIHA527.1 529.0 544.7 552.6 537.5 507.6 509.5 494.8BC
400
450
500
550
600
650
700
Rat
e p
er 1
00,0
00
2002/03 2003/04 2004/05 2005/06 2006/07 2007/08 2008/09 2009/10
2002/03 2003/04 2004/05 2005/06 2006/07 2007/08 2008/09 2009/10
609.1 616.7 640.6 664.5 637.6 618.0 625.3 609.6FH442.9 454.2 479.0 493.8 505.7 485.2 470.0 452.5IH462.8 525.7 551.2 482.4 564.5 517.4 508.9 479.8NH458.4 449.1 474.4 469.6 448.6 410.8 431.5 416.1VCH581.9 570.2 550.6 564.2 519.7 481.8 469.0 458.1VIHA527.1 529.0 544.7 552.6 537.5 507.6 509.5 494.8BC
400
450
500
550
600
650
700
Rat
e p
er 1
00,0
00
2002/03 2003/04 2004/05 2005/06 2006/07 2007/08 2008/09 2009/10
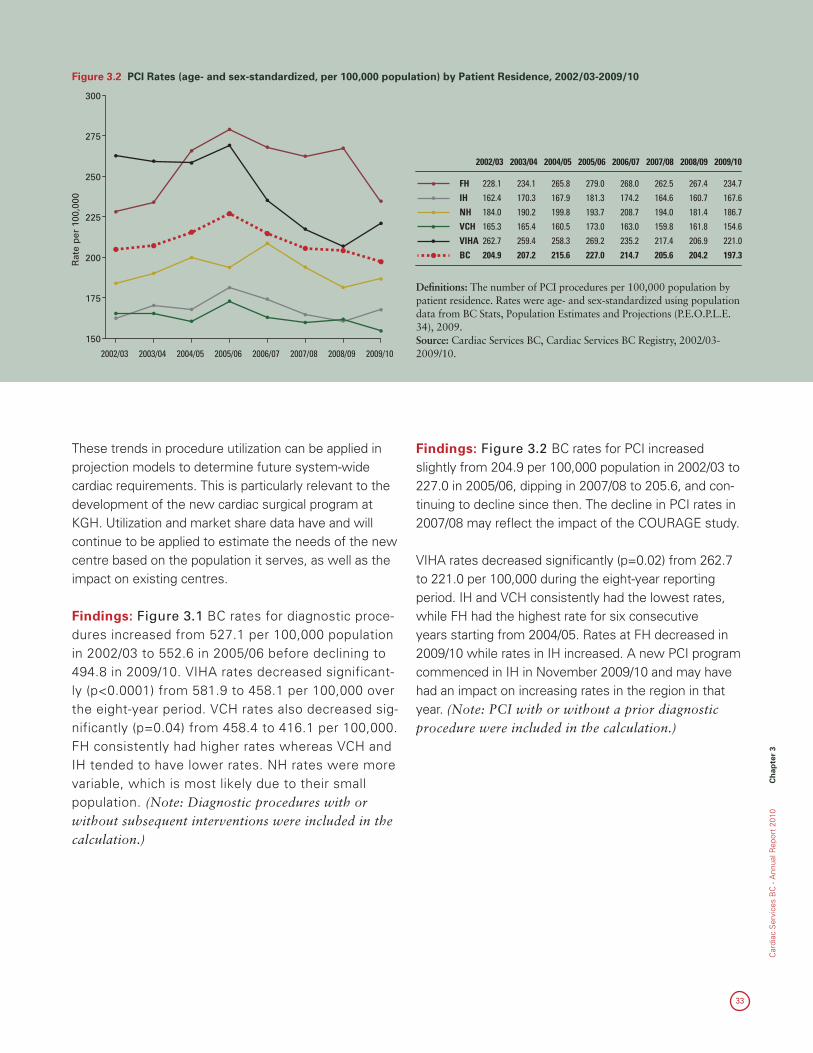
Car
diac
Ser
vice
s B
C -
Ann
ual R
epor
t 20
10
Ch
apte
r 3
33
These trends in procedure utilization can be applied in projection models to determine future system-wide cardiac requirements. This is particularly relevant to the development of the new cardiac surgical program at KGH. Utilization and market share data have and will continue to be applied to estimate the needs of the new centre based on the population it serves, as well as the impact on existing centres.
Findings: Figure 3.1 BC rates for diagnostic proce-dures increased from 527.1 per 100,000 population in 2002/03 to 552.6 in 2005/06 before declining to 494.8 in 2009/10. VIHA rates decreased significant-ly (p<0.0001) from 581.9 to 458.1 per 100,000 over the eight-year period. VCH rates also decreased sig-nificantly (p=0.04) from 458.4 to 416.1 per 100,000. FH consistently had higher rates whereas VCH and IH tended to have lower rates. NH rates were more variable, which is most likely due to their small population. (Note: Diagnostic procedures with or without subsequent interventions were included in the calculation.)
Findings: Figure 3.2 BC rates for PCI increased slightly from 204.9 per 100,000 population in 2002/03 to 227.0 in 2005/06, dipping in 2007/08 to 205.6, and con-tinuing to decline since then. The decline in PCI rates in 2007/08 may reflect the impact of the COURAGE study.
VIHA rates decreased significantly (p=0.02) from 262.7 to 221.0 per 100,000 during the eight-year reporting period. IH and VCH consistently had the lowest rates, while FH had the highest rate for six consecutive years starting from 2004/05. Rates at FH decreased in 2009/10 while rates in IH increased. A new PCI program commenced in IH in November 2009/10 and may have had an impact on increasing rates in the region in that year. (Note: PCI with or without a prior diagnostic procedure were included in the calculation.)
Figure 3.2 PCI Rates (age- and sex-standardized, per 100,000 population) by Patient Residence, 2002/03-2009/10
Definitions: The number of PCI procedures per 100,000 population by patient residence. Rates were age- and sex-standardized using population data from BC Stats, Population Estimates and Projections (P.E.O.P.L.E. 34), 2009. Source: Cardiac Services BC, Cardiac Services BC Registry, 2002/03-2009/10.
2002/03 2003/04 2004/05 2005/06 2006/07 2007/08 2008/09 2009/10
150
175
200
225
250
275
300
Rat
e p
er 1
00,0
00
2002/03 2003/04 2004/05 2005/06 2006/07 2007/08 2008/09 2009/10
FH 228.1 234.1 265.8 279.0 268.0 262.5 267.4 234.7IH 162.4 170.3 167.9 181.3 174.2 164.6 160.7 167.6NH 184.0 190.2 199.8 193.7 208.7 194.0 181.4 186.7VCH 165.3 165.4 160.5 173.0 163.0 159.8 161.8 154.6VIHA 262.7 259.4 258.3 269.2 235.2 217.4 206.9 221.0BC 204.9 207.2 215.6 227.0 214.7 205.6 204.2 197.3
2002/03 2003/04 2004/05 2005/06 2006/07 2007/08 2008/09 2009/10
150
175
200
225
250
275
300
Rat
e p
er 1
00,0
00
2002/03 2003/04 2004/05 2005/06 2006/07 2007/08 2008/09 2009/10
FH 228.1 234.1 265.8 279.0 268.0 262.5 267.4 234.7IH 162.4 170.3 167.9 181.3 174.2 164.6 160.7 167.6NH 184.0 190.2 199.8 193.7 208.7 194.0 181.4 186.7VCH 165.3 165.4 160.5 173.0 163.0 159.8 161.8 154.6VIHA 262.7 259.4 258.3 269.2 235.2 217.4 206.9 221.0BC 204.9 207.2 215.6 227.0 214.7 205.6 204.2 197.3
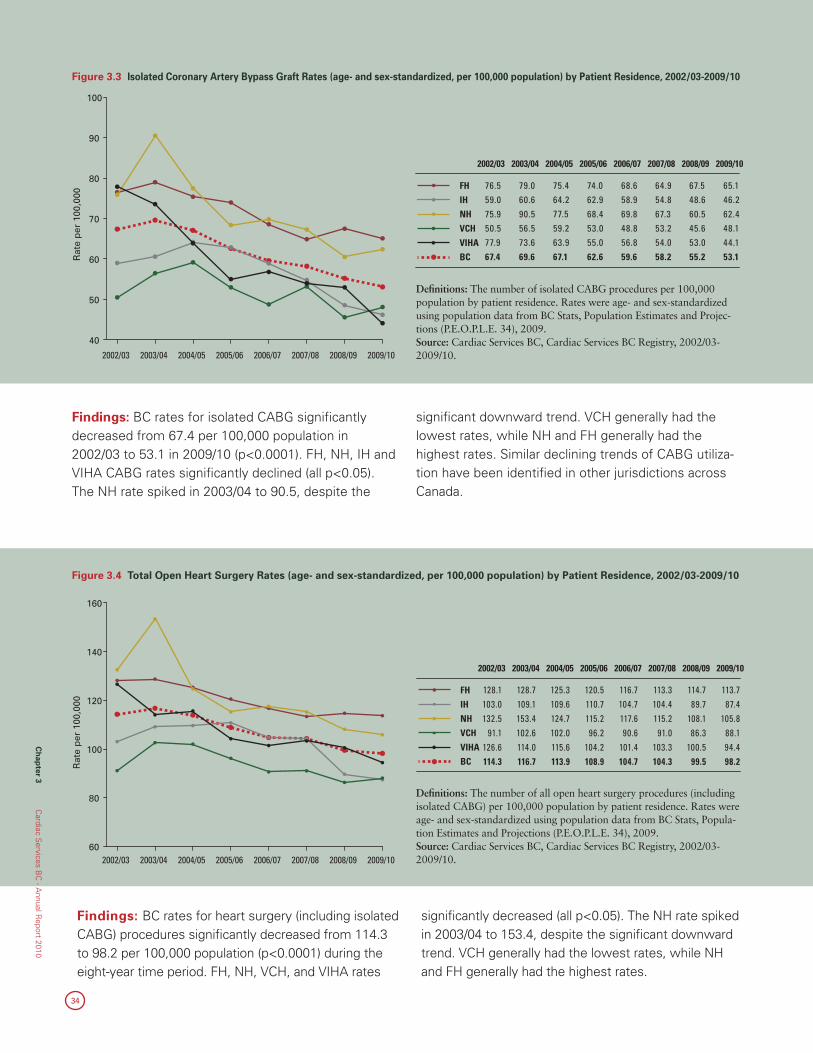
34
Figure 3.3 Isolated Coronary Artery Bypass Graft Rates (age- and sex-standardized, per 100,000 population) by Patient Residence, 2002/03-2009/10
Definitions: The number of isolated CABG procedures per 100,000 population by patient residence. Rates were age- and sex-standardized using population data from BC Stats, Population Estimates and Projec-tions (P.E.O.P.L.E. 34), 2009. Source: Cardiac Services BC, Cardiac Services BC Registry, 2002/03-2009/10.
2002/03 2003/04 2004/05 2005/06 2006/07 2007/08 2008/09 2009/10
FH
IH
NH
VCH
VIHA
BC
2002/03 2003/04 2004/05 2005/06 2006/07 2007/08 2008/09 2009/10
40
50
60
70
80
90
100
Rat
e p
er 1
00,0
00
76.559.075.950.577.967.4
79.060.690.556.573.669.6
75.464.277.559.263.967.1
74.062.968.453.055.062.6
68.658.969.848.856.859.6
64.954.867.353.254.058.2
67.548.660.545.653.055.2
65.146.262.448.144.153.1
2002/03 2003/04 2004/05 2005/06 2006/07 2007/08 2008/09 2009/10
FH
IH
NH
VCH
VIHA
BC
2002/03 2003/04 2004/05 2005/06 2006/07 2007/08 2008/09 2009/10
40
50
60
70
80
90
100
Rat
e p
er 1
00,0
00
76.559.075.950.577.967.4
79.060.690.556.573.669.6
75.464.277.559.263.967.1
74.062.968.453.055.062.6
68.658.969.848.856.859.6
64.954.867.353.254.058.2
67.548.660.545.653.055.2
65.146.262.448.144.153.1
Findings: BC rates for isolated CABG significantly decreased from 67.4 per 100,000 population in 2002/03 to 53.1 in 2009/10 (p<0.0001). FH, NH, IH and VIHA CABG rates significantly declined (all p<0.05). The NH rate spiked in 2003/04 to 90.5, despite the
significant downward trend. VCH generally had the lowest rates, while NH and FH generally had the highest rates. Similar declining trends of CABG utiliza-tion have been identified in other jurisdictions across Canada.
Findings: BC rates for heart surgery (including isolated CABG) procedures significantly decreased from 114.3 to 98.2 per 100,000 population (p<0.0001) during the eight-year time period. FH, NH, VCH, and VIHA rates
significantly decreased (all p<0.05). The NH rate spiked in 2003/04 to 153.4, despite the significant downward trend. VCH generally had the lowest rates, while NH and FH generally had the highest rates.
Figure 3.4 Total Open Heart Surgery Rates (age- and sex-standardized, per 100,000 population) by Patient Residence, 2002/03-2009/10
Definitions: The number of all open heart surgery procedures (including isolated CABG) per 100,000 population by patient residence. Rates were age- and sex-standardized using population data from BC Stats, Popula-tion Estimates and Projections (P.E.O.P.L.E. 34), 2009. Source: Cardiac Services BC, Cardiac Services BC Registry, 2002/03-2009/10.
2002/03 2003/04 2004/05 2005/06 2006/07 2007/08 2008/09 2009/10
FH
IH
NH
VCH
VIHA
BC
2002/03 2003/04 2004/05 2005/06 2006/07 2007/08 2008/09 2009/1060
80
100
120
140
160
Rat
e p
er 1
00,0
00
128.1 128.7 125.3 120.5 116.7 113.3 114.7 113.7103.0 109.1 109.6 110.7 104.7 104.4 89.7 87.4132.5 153.4 124.7 115.2 117.6 115.2 108.1 105.8 91.1 102.6 102.0 96.2 90.6 91.0 86.3 88.1
126.6 114.0 115.6 104.2 101.4 103.3 100.5 94.4114.3 116.7 113.9 108.9 104.7 104.3 99.5 98.2
Ch
apter 3
Cardiac S
ervices BC
- Annual R
eport 2010
Car
diac
Ser
vice
s B
C -
Ann
ual R
epor
t 20
10
Ch
apte
r 3
35
Understanding what populations are accessing cardiac services is an important component in planning coronary revascularization services into the future. Not all patients receive care at a hospital within their health authority. Patients may choose to receive service in a hospital out-side of their health authority, be referred out as a result of historical referral patterns, or the service may not be available in a hospital in the patient’s health authority.
Significance: Procedure volume and distribution of services among the health authorities is important for estimating the expected number of cases to be per-formed by each hospital site per year, given that sites are funded based on the volume of procedures com-pleted. Market share is also useful in planning services into the future. As new programs are developed, or services are provided in closer proximity to their resi-dence, it is useful to investigate market share and some of its drivers. Some of the factors that may drive case distributions include the distance between the patient’s residence and hospital, service demand, resources avail-able, existing referral patterns, and patient preference.
Cardiac Procedure Utilization: Where Patients Receive Care
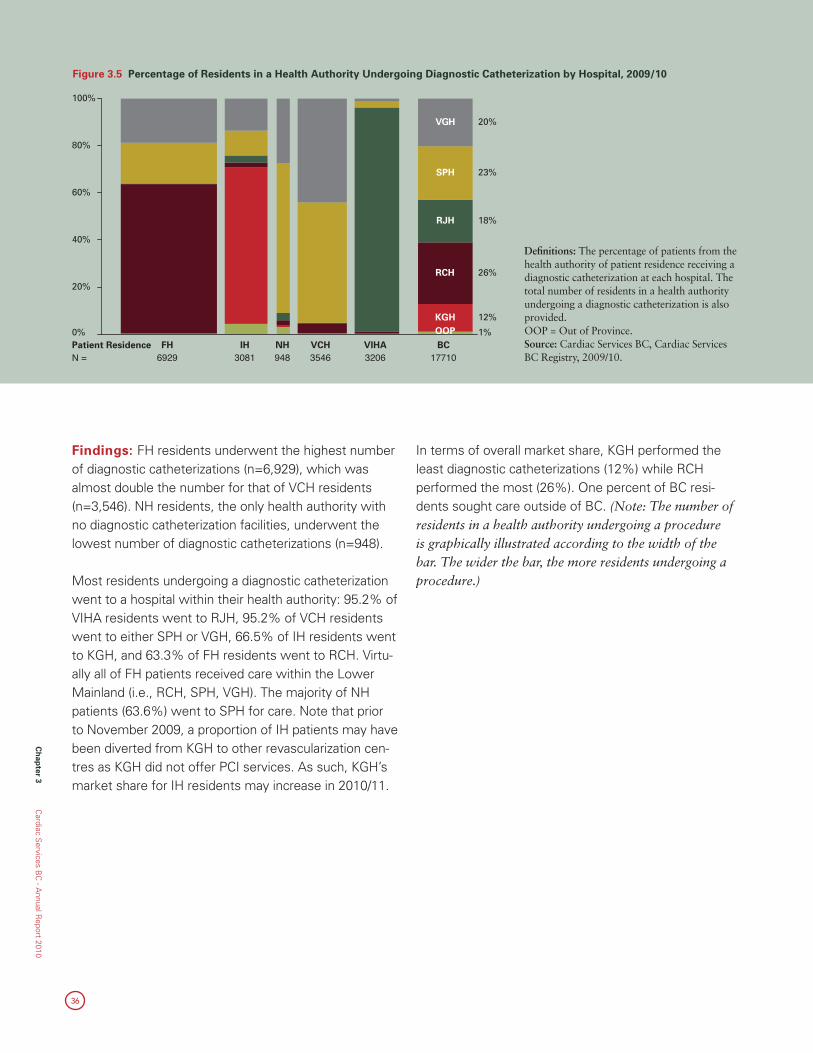
36
Ch
apter 3
Cardiac S
ervices BC
- Annual R
eport 2010
Findings: FH residents underwent the highest number of diagnostic catheterizations (n=6,929), which was almost double the number for that of VCH residents (n=3,546). NH residents, the only health authority with no diagnostic catheterization facilities, underwent the lowest number of diagnostic catheterizations (n=948).
Most residents undergoing a diagnostic catheterization went to a hospital within their health authority: 95.2% of VIHA residents went to RJH, 95.2% of VCH residents went to either SPH or VGH, 66.5% of IH residents went to KGH, and 63.3% of FH residents went to RCH. Virtu-ally all of FH patients received care within the Lower Mainland (i.e., RCH, SPH, VGH). The majority of NH patients (63.6%) went to SPH for care. Note that prior to November 2009, a proportion of IH patients may have been diverted from KGH to other revascularization cen-tres as KGH did not offer PCI services. As such, KGH’s market share for IH residents may increase in 2010/11.
In terms of overall market share, KGH performed the least diagnostic catheterizations (12%) while RCH performed the most (26%). One percent of BC resi-dents sought care outside of BC. (Note: The number of residents in a health authority undergoing a procedure is graphically illustrated according to the width of the bar. The wider the bar, the more residents undergoing a procedure.)
Figure 3.5 Percentage of Residents in a Health Authority Undergoing Diagnostic Catheterization by Hospital, 2009/10
0%
20%
40%
60%
80%
100%
1%
12%
26%
18%
23%
20%
N = 6929 3081 948 3546 3206Patient Residence FH IH NH VCH VIHA BC
OOPKGH
RCH
RJH
SPH
VGH
17710
Definitions: The percentage of patients from the health authority of patient residence receiving a diagnostic catheterization at each hospital. The total number of residents in a health authority undergoing a diagnostic catheterization is also provided. OOP = Out of Province. Source: Cardiac Services BC, Cardiac Services BC Registry, 2009/10.
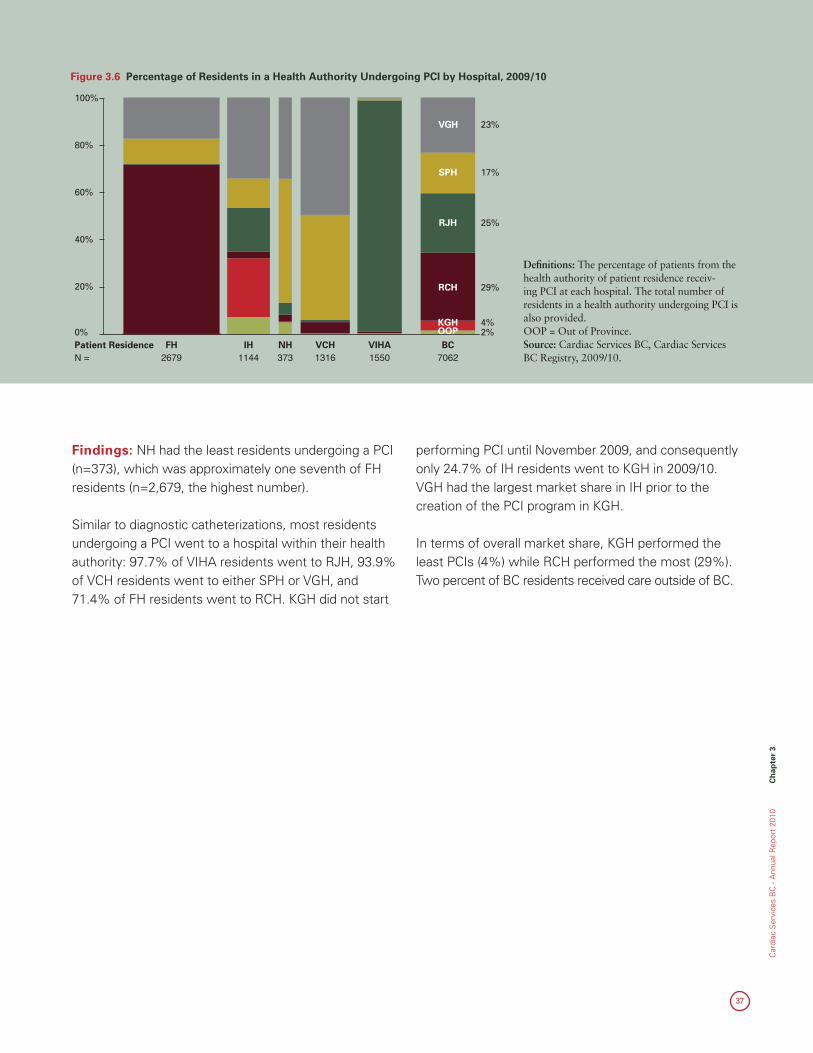
Car
diac
Ser
vice
s B
C -
Ann
ual R
epor
t 20
10
Ch
apte
r 3
37
Figure 3.6 Percentage of Residents in a Health Authority Undergoing PCI by Hospital, 2009/10
Definitions: The percentage of patients from the health authority of patient residence receiv-ing PCI at each hospital. The total number of residents in a health authority undergoing PCI is also provided. OOP = Out of Province. Source: Cardiac Services BC, Cardiac Services BC Registry, 2009/10.
0%
20%
40%
60%
80%
100%
2%4%
29%
25%
17%
23%
N = Patient Residence
2679FH
1144IH
373NH
1316VCH
1550VIHA BC
OOPKGH
RCH
RJH
SPH
VGH
7062
Findings: NH had the least residents undergoing a PCI (n=373), which was approximately one seventh of FH residents (n=2,679, the highest number).
Similar to diagnostic catheterizations, most residents undergoing a PCI went to a hospital within their health authority: 97.7% of VIHA residents went to RJH, 93.9% of VCH residents went to either SPH or VGH, and 71.4% of FH residents went to RCH. KGH did not start
performing PCI until November 2009, and consequently only 24.7% of IH residents went to KGH in 2009/10. VGH had the largest market share in IH prior to the creation of the PCI program in KGH.
In terms of overall market share, KGH performed the least PCIs (4%) while RCH performed the most (29%). Two percent of BC residents received care outside of BC.
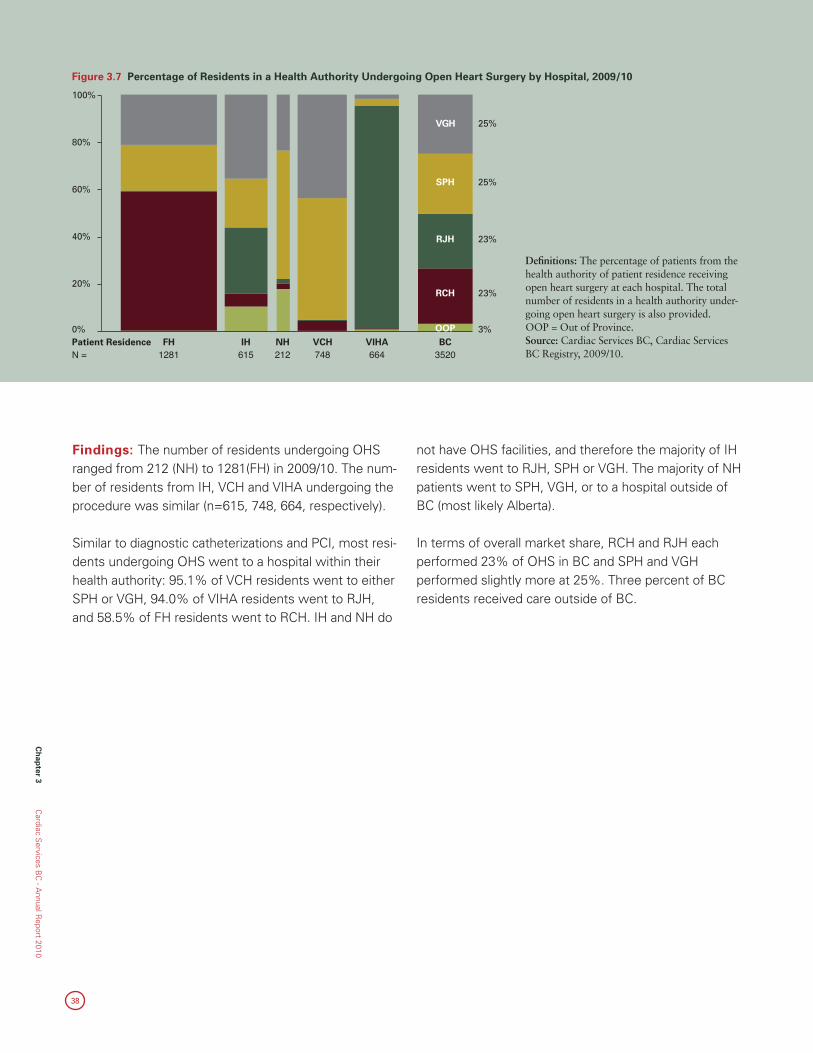
38
Ch
apter 3
Cardiac S
ervices BC
- Annual R
eport 2010
Figure 3.7 Percentage of Residents in a Health Authority Undergoing Open Heart Surgery by Hospital, 2009/10
Definitions: The percentage of patients from the health authority of patient residence receiving open heart surgery at each hospital. The total number of residents in a health authority under-going open heart surgery is also provided. OOP = Out of Province. Source: Cardiac Services BC, Cardiac Services BC Registry, 2009/10.
0%
20%
40%
60%
80%
100%
3%
23%
23%
25%
25%
N = Patient Residence
1281FH
615IH
212NH
748VCH
664VIHA BC
OOP
RCH
RJH
SPH
VGH
3520
Findings: The number of residents undergoing OHS ranged from 212 (NH) to 1281(FH) in 2009/10. The num-ber of residents from IH, VCH and VIHA undergoing the procedure was similar (n=615, 748, 664, respectively).
Similar to diagnostic catheterizations and PCI, most resi-dents undergoing OHS went to a hospital within their health authority: 95.1% of VCH residents went to either SPH or VGH, 94.0% of VIHA residents went to RJH, and 58.5% of FH residents went to RCH. IH and NH do
not have OHS facilities, and therefore the majority of IH residents went to RJH, SPH or VGH. The majority of NH patients went to SPH, VGH, or to a hospital outside of BC (most likely Alberta).
In terms of overall market share, RCH and RJH each performed 23% of OHS in BC and SPH and VGH performed slightly more at 25%. Three percent of BC residents received care outside of BC.

39
Car
diac
Ser
vice
s B
C -
Ann
ual R
epor
t 20
10
Ch
apte
r 4
Chapter 4 Wait Times
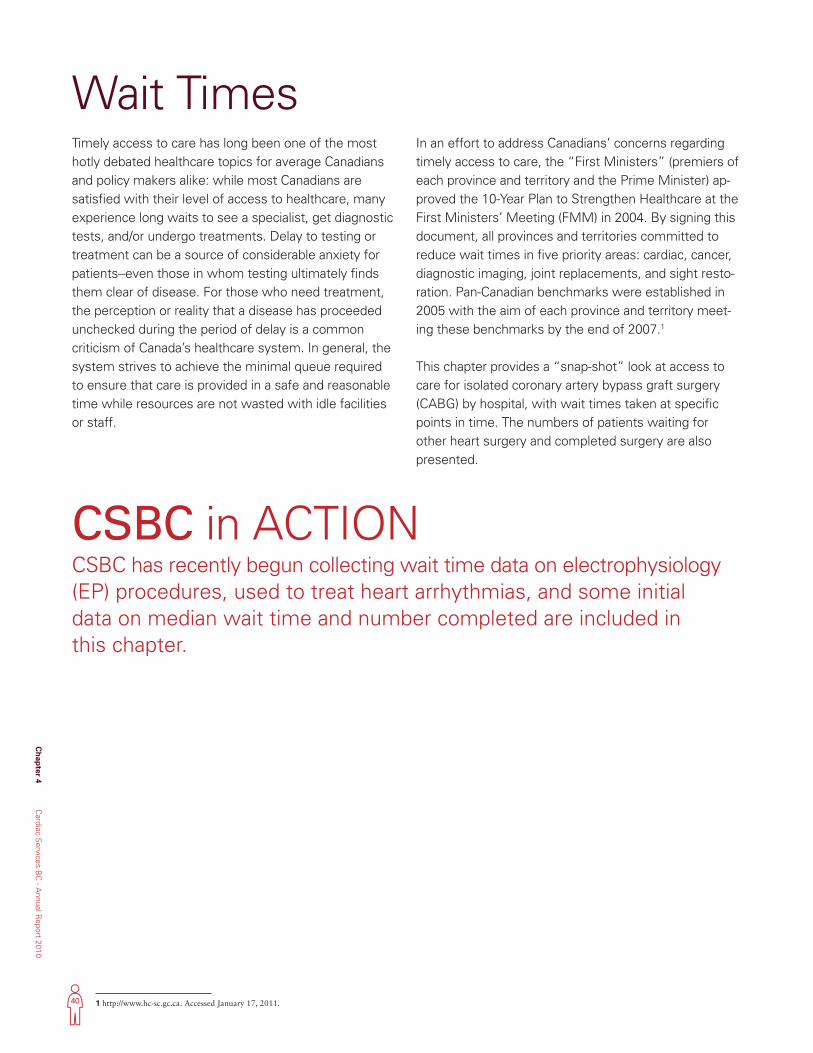
40
Ch
apter 4
Cardiac S
ervices BC
- Annual R
eport 2010
1 http://www.hc-sc.gc.ca. Accessed January 17, 2011.
Timely access to care has long been one of the most hotly debated healthcare topics for average Canadians and policy makers alike: while most Canadians are satisfied with their level of access to healthcare, many experience long waits to see a specialist, get diagnostic tests, and/or undergo treatments. Delay to testing or treatment can be a source of considerable anxiety for patients--even those in whom testing ultimately finds them clear of disease. For those who need treatment, the perception or reality that a disease has proceeded unchecked during the period of delay is a common criticism of Canada’s healthcare system. In general, the system strives to achieve the minimal queue required to ensure that care is provided in a safe and reasonable time while resources are not wasted with idle facilities or staff.
In an effort to address Canadians’ concerns regarding timely access to care, the “First Ministers” (premiers of each province and territory and the Prime Minister) ap-proved the 10-Year Plan to Strengthen Healthcare at the First Ministers’ Meeting (FMM) in 2004. By signing this document, all provinces and territories committed to reduce wait times in five priority areas: cardiac, cancer, diagnostic imaging, joint replacements, and sight resto-ration. Pan-Canadian benchmarks were established in 2005 with the aim of each province and territory meet-ing these benchmarks by the end of 2007.1
This chapter provides a “snap-shot” look at access to care for isolated coronary artery bypass graft surgery (CABG) by hospital, with wait times taken at specific points in time. The numbers of patients waiting for other heart surgery and completed surgery are also presented.
Wait Times
CSBC in ACTIONCSBC has recently begun collecting wait time data on electrophysiology (EP) procedures, used to treat heart arrhythmias, and some initial data on median wait time and number completed are included in this chapter.
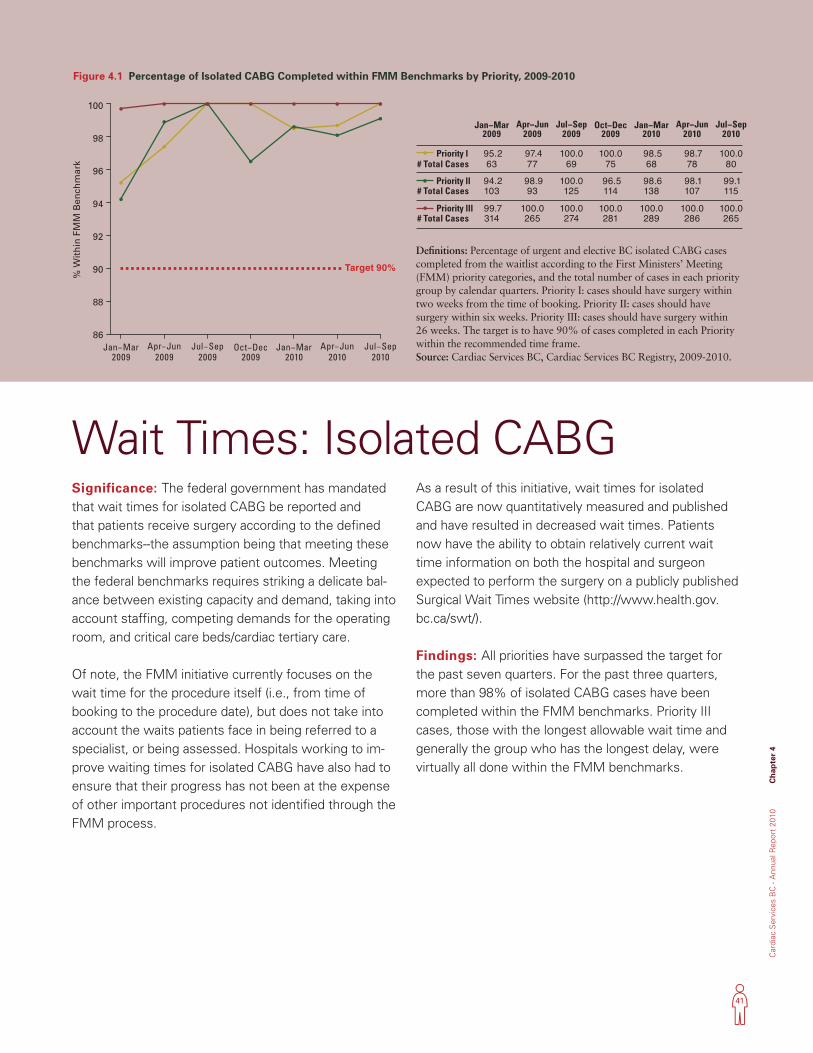
41
Car
diac
Ser
vice
s B
C -
Ann
ual R
epor
t 20
10
Ch
apte
r 4
Significance: The federal government has mandated that wait times for isolated CABG be reported and that patients receive surgery according to the defined benchmarks--the assumption being that meeting these benchmarks will improve patient outcomes. Meeting the federal benchmarks requires striking a delicate bal-ance between existing capacity and demand, taking into account staffing, competing demands for the operating room, and critical care beds/cardiac tertiary care.
Of note, the FMM initiative currently focuses on the wait time for the procedure itself (i.e., from time of booking to the procedure date), but does not take into account the waits patients face in being referred to a specialist, or being assessed. Hospitals working to im-prove waiting times for isolated CABG have also had to ensure that their progress has not been at the expense of other important procedures not identified through the FMM process.
As a result of this initiative, wait times for isolated CABG are now quantitatively measured and published and have resulted in decreased wait times. Patients now have the ability to obtain relatively current wait time information on both the hospital and surgeon expected to perform the surgery on a publicly published Surgical Wait Times website (http://www.health.gov.bc.ca/swt/).
Findings: All priorities have surpassed the target for the past seven quarters. For the past three quarters, more than 98% of isolated CABG cases have been completed within the FMM benchmarks. Priority III cases, those with the longest allowable wait time and generally the group who has the longest delay, were virtually all done within the FMM benchmarks.
Wait Times: Isolated CABG
Figure 4.1 Percentage of Isolated CABG Completed within FMM Benchmarks by Priority, 2009-2010
Definitions: Percentage of urgent and elective BC isolated CABG cases completed from the waitlist according to the First Ministers’ Meeting (FMM) priority categories, and the total number of cases in each priority group by calendar quarters. Priority I: cases should have surgery within two weeks from the time of booking. Priority II: cases should have surgery within six weeks. Priority III: cases should have surgery within 26 weeks. The target is to have 90% of cases completed in each Priority within the recommended time frame. Source: Cardiac Services BC, Cardiac Services BC Registry, 2009-2010.
Priority l
Priority ll
Priority lll
# Total Cases
# Total Cases
# Total Cases
Jan−Mar2009
95.263
94.2103
99.7314
Apr−Jun2009
97.477
98.993
100.0265
Jul−Sep2009
100.069
100.0125
100.0274
Oct−Dec2009
100.075
96.5114
100.0281
Jan−Mar2010
98.568
98.6138
100.0289
Apr−Jun2010
98.778
98.1107
100.0286
Jul−Sep2010
100.080
99.1115
100.0265
86
88
90
92
94
96
98
100
% W
ith
in F
MM
Ben
chm
ark
Target 90%
Jan−Mar2009
Apr−Jun2009
Jul−Sep2009
Oct−Dec2009
Jan−Mar2010
Apr−Jun2010
Jul−Sep2010
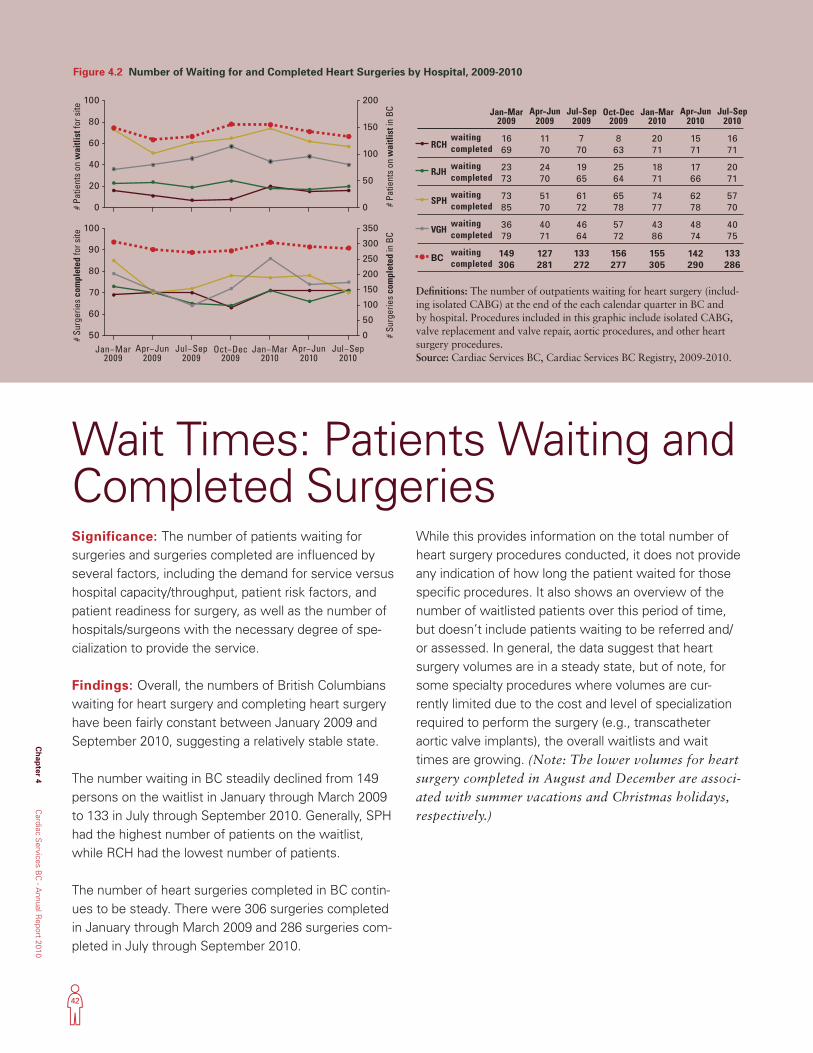
42
Ch
apter 4
Cardiac S
ervices BC
- Annual R
eport 2010
Wait Times: Patients Waiting and Completed Surgeries
Figure 4.2 Number of Waiting for and Completed Heart Surgeries by Hospital, 2009-2010
Definitions: The number of outpatients waiting for heart surgery (includ-ing isolated CABG) at the end of the each calendar quarter in BC and by hospital. Procedures included in this graphic include isolated CABG, valve replacement and valve repair, aortic procedures, and other heart surgery procedures. Source: Cardiac Services BC, Cardiac Services BC Registry, 2009-2010.
Jan−Mar2009
1669
2373
7385
3679
149306
Apr−Jun2009
1170
2470
5170
4071
127281
Jul−Sep2009
770
1965
6172
4664
133272
Oct−Dec2009
863
2564
6578
5772
156277
Jan−Mar2010
2071
1871
7477
4386
155305
Apr−Jun2010
1571
1766
6278
4874
142290
Jul−Sep2010
1671
2071
5770
4075
133286
completed
completed
completed
completed
waiting
waiting
waiting
waiting
waitingcompleted
RCH
RJH
SPH
VGH
BC
0
20
40
60
80
100
0
50
100
150
200
# Pa
tient
s on
wai
tlist
in B
C
50
60
70
80
90
100
0
50
100
150
200
250
300
350
# Su
rger
ies
com
plet
ed in
BC
Jan−Mar2009
Apr−Jun2009
Jul−Sep2009
Oct−Dec2009
Jan−Mar2010
Apr−Jun2010
Jul−Sep2010
# P
atie
nts
on w
aitli
st fo
r site
# S
urge
ries
com
plet
ed fo
r site
Jan−Mar2009
1669
2373
7385
3679
149306
Apr−Jun2009
1170
2470
5170
4071
127281
Jul−Sep2009
770
1965
6172
4664
133272
Oct−Dec2009
863
2564
6578
5772
156277
Jan−Mar2010
2071
1871
7477
4386
155305
Apr−Jun2010
1571
1766
6278
4874
142290
Jul−Sep2010
1671
2071
5770
4075
133286
completed
completed
completed
completed
waiting
waiting
waiting
waiting
waitingcompleted
RCH
RJH
SPH
VGH
BC
0
20
40
60
80
100
0
50
100
150
200
# Pa
tient
s on
wai
tlist
in B
C
50
60
70
80
90
100
0
50
100
150
200
250
300
350
# Su
rger
ies
com
plet
ed in
BC
Jan−Mar2009
Apr−Jun2009
Jul−Sep2009
Oct−Dec2009
Jan−Mar2010
Apr−Jun2010
Jul−Sep2010
# P
atie
nts
on w
aitli
st fo
r site
# S
urge
ries
com
plet
ed fo
r site
Significance: The number of patients waiting for surgeries and surgeries completed are influenced by several factors, including the demand for service versus hospital capacity/throughput, patient risk factors, and patient readiness for surgery, as well as the number of hospitals/surgeons with the necessary degree of spe-cialization to provide the service.
Findings: Overall, the numbers of British Columbians waiting for heart surgery and completing heart surgery have been fairly constant between January 2009 and September 2010, suggesting a relatively stable state.
The number waiting in BC steadily declined from 149 persons on the waitlist in January through March 2009 to 133 in July through September 2010. Generally, SPH had the highest number of patients on the waitlist, while RCH had the lowest number of patients.
The number of heart surgeries completed in BC contin-ues to be steady. There were 306 surgeries completed in January through March 2009 and 286 surgeries com-pleted in July through September 2010.
While this provides information on the total number of heart surgery procedures conducted, it does not provide any indication of how long the patient waited for those specific procedures. It also shows an overview of the number of waitlisted patients over this period of time, but doesn’t include patients waiting to be referred and/or assessed. In general, the data suggest that heart surgery volumes are in a steady state, but of note, for some specialty procedures where volumes are cur-rently limited due to the cost and level of specialization required to perform the surgery (e.g., transcatheter aortic valve implants), the overall waitlists and wait times are growing. (Note: The lower volumes for heart surgery completed in August and December are associ-ated with summer vacations and Christmas holidays, respectively.)
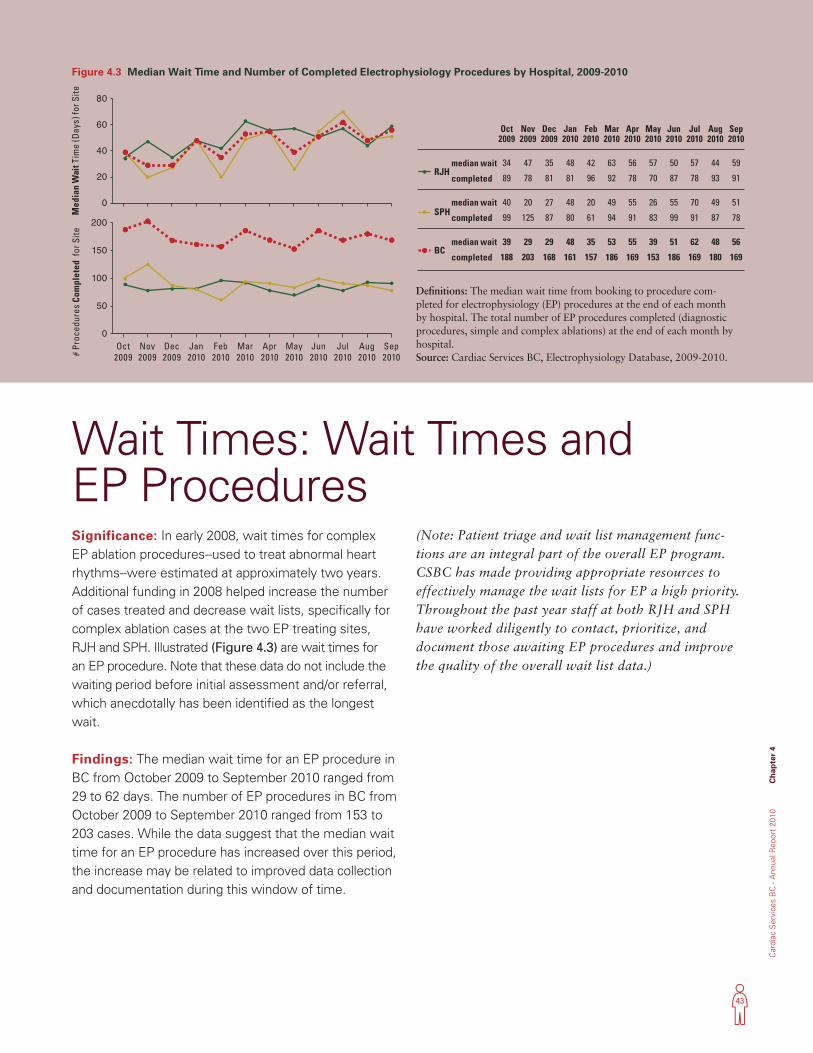
43
Car
diac
Ser
vice
s B
C -
Ann
ual R
epor
t 20
10
Ch
apte
r 4
Significance: In early 2008, wait times for complex EP ablation procedures--used to treat abnormal heart rhythms--were estimated at approximately two years. Additional funding in 2008 helped increase the number of cases treated and decrease wait lists, specifically for complex ablation cases at the two EP treating sites, RJH and SPH. Illustrated (Figure 4.3) are wait times for an EP procedure. Note that these data do not include the waiting period before initial assessment and/or referral, which anecdotally has been identified as the longest wait.
Findings: The median wait time for an EP procedure in BC from October 2009 to September 2010 ranged from 29 to 62 days. The number of EP procedures in BC from October 2009 to September 2010 ranged from 153 to 203 cases. While the data suggest that the median wait time for an EP procedure has increased over this period, the increase may be related to improved data collection and documentation during this window of time.
(Note: Patient triage and wait list management func-tions are an integral part of the overall EP program. CSBC has made providing appropriate resources to effectively manage the wait lists for EP a high priority. Throughout the past year staff at both RJH and SPH have worked diligently to contact, prioritize, and document those awaiting EP procedures and improve the quality of the overall wait list data.)
Wait Times: Wait Times and EP Procedures
Figure 4.3 Median Wait Time and Number of Completed Electrophysiology Procedures by Hospital, 2009-2010
Definitions: The median wait time from booking to procedure com-pleted for electrophysiology (EP) procedures at the end of each month by hospital. The total number of EP procedures completed (diagnostic procedures, simple and complex ablations) at the end of each month by hospital. Source: Cardiac Services BC, Electrophysiology Database, 2009-2010.
0
20
40
60
80
0
50
100
150
200
Oct2009
Nov2009
Dec2009
Jan2010
Feb2010
Mar2010
Apr2010
May2010
Jun2010
Jul2010
Aug2010
Sep2010
completed
median wait 34
89
40
99
39
188
Oct2009
47
78
20
125
29
203
Nov2009
35
81
27
87
29
168
Dec2009
48
81
48
80
48
161
Jan2010
42
96
20
61
35
157
Feb2010
63
92
49
94
53
186
Mar2010
56
78
55
91
55
169
Apr2010
57
70
26
83
39
153
May2010
50
87
55
99
51
186
Jun2010
57
78
70
91
62
169
Jul2010
44
93
49
87
48
180
Aug2010
Sep2010
59
91
51
78
56
169
RJH
completed
median waitSPH
completed
median waitBC
Med
ian
Wai
t Tim
e (D
ays)
for S
ite
# Pr
oced
ures
Com
plet
ed f
or S
ite
0
20
40
60
80
0
50
100
150
200
Oct2009
Nov2009
Dec2009
Jan2010
Feb2010
Mar2010
Apr2010
May2010
Jun2010
Jul2010
Aug2010
Sep2010
completed
median wait 34
89
40
99
39
188
Oct2009
47
78
20
125
29
203
Nov2009
35
81
27
87
29
168
Dec2009
48
81
48
80
48
161
Jan2010
42
96
20
61
35
157
Feb2010
63
92
49
94
53
186
Mar2010
56
78
55
91
55
169
Apr2010
57
70
26
83
39
153
May2010
50
87
55
99
51
186
Jun2010
57
78
70
91
62
169
Jul2010
44
93
49
87
48
180
Aug2010
Sep2010
59
91
51
78
56
169
RJH
completed
median waitSPH
completed
median waitBC
Med
ian
Wai
t Tim
e (D
ays)
for S
ite
# Pr
oced
ures
Com
plet
ed f
or S
ite
44
Ch
apter 4
Cardiac S
ervices BC
- Annual R
eport 2010
CSBC in ACTIONAs part of its commitment to improving quality outcomes and providing better value for patients, CSBC has provided funding for atrial fibrillation clinics to help reduce the patient wait time for a standardized assessment of the need for an EP procedure and to enhance management of the waitlist. In 2011/12, all five cardiac centres will operate an atrial fibrillation clinic. As a result of the investments in EP services, overall EP volumes have substantially increased with a need to further expand capacity in 2011/12 (See Chapter 6, Strategic Plans 1 and 2).

Car
diac
Ser
vice
s B
C -
Ann
ual R
epor
t 20
10
Ch
apte
r 5
45
Chapter 5 Outcomes
Ch
apter 5
Cardiac S
ervices BC
- Annual R
eport 2010
46
Tracking patient outcomes is a crucial component of any healthcare system assessment. Although patients undergo procedures to improve their healthcare, they sometimes experience problems either immediately after the procedure or later.
Unlike longer term outcomes, which can be influenced by factors such as new or pre-existing, unrelated disease, shorter term outcomes--those occurring within
30 days post procedure--are more likely to be directly related to the procedure itself or the ancillary care provided.
This chapter describes four indicators: 30-day mortality post heart surgery (shown separately for isolated CABG, isolated valve, and CABG plus valve) and 30-day mortality post PCI.
Outcomes
Thirty-day mortality rates are applied as a quality of care indicator for surgical and less invasive procedures in many jurisdictions. Since some cardiac procedures are riskier than others, mortality rates are presented according to the type of procedure.
While BC’s mortality rates for cardiac procedures are low and compare favourably with the literature,1 CSBC continues to work with the cardiac surgery and interventional programs to explore opportunities for improvement.
Significance: Mortality rates reflect the quality of care across the continuum of care including:•Theunderlyingriskofthepatientsundergoingthe
procedure;•Selectionfortheprocedure;•Thequalityofcarereceivedduringtheprocedure,and
subsequent hospital care;•Patientadherencewiththetreatmentplan;and,•Carereceivedinthecommunity.Higher mortality rates prompt those delivering care and health administrators to explore each of these factors to determine if modification of any aspect of care is war-ranted to improve care given to patients.
Outcomes: 30-Day Mortality
CSBC in ACTIONThe CSBC Registry currently contains limited data on patients after they leave the hospital and must rely heavily on linkages with other databases to determine longer term outcomes. CSBC has historically collaborated with the BC Ministry of Health to secure death and hospitalization data. Recently, CSBC initiated collaborations with PharmaNet for pharmaceuticals and the Provincial Blood Coordinating Office’s Central Transfusion Registry for blood product transfusions to secure additional data.
1 Shahian et al. Ann Thorac Surg 2009,88:S2–22; O’Brien et al. Ann Thorac Surg 2009,88:S23–42; Shahian et al. Ann Thorac Surg 2009,88:S43–62; Singh et al. J Am Coll Cardiol 2008; 51:2313-20.
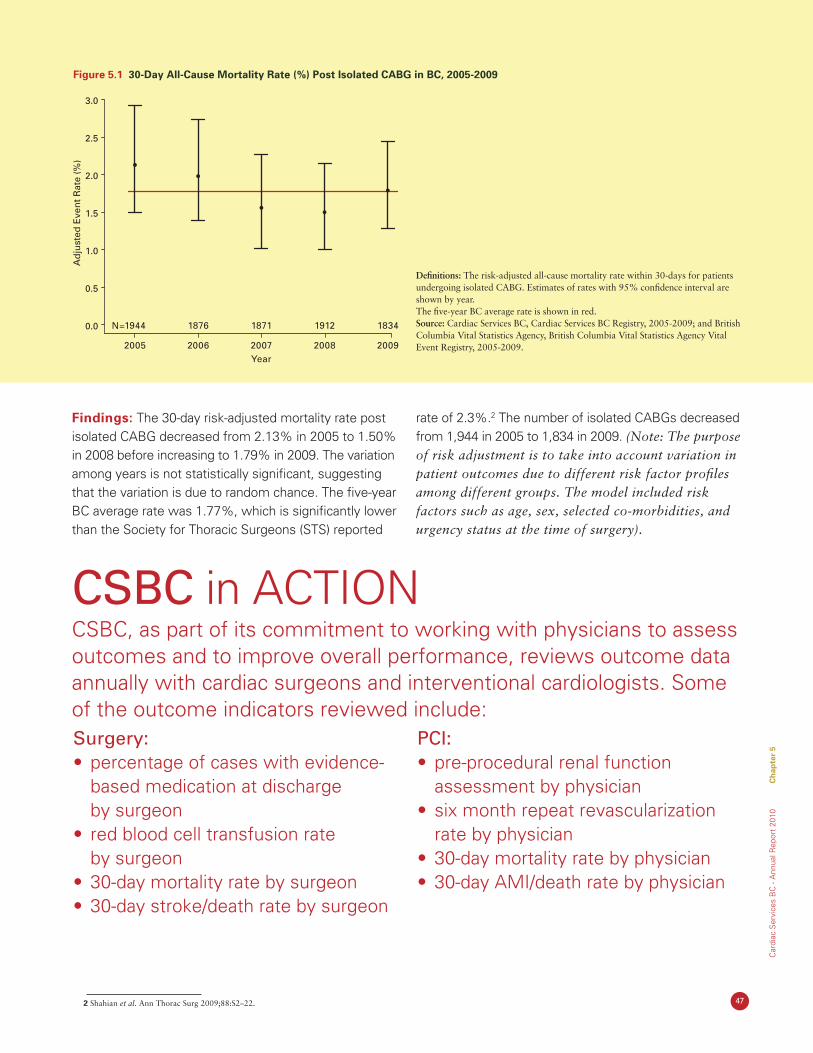
Car
diac
Ser
vice
s B
C -
Ann
ual R
epor
t 20
10
Ch
apte
r 5
47 2 Shahian et al. Ann Thorac Surg 2009;88:S2–22.
Findings: The 30-day risk-adjusted mortality rate post isolated CABG decreased from 2.13% in 2005 to 1.50% in 2008 before increasing to 1.79% in 2009. The variation among years is not statistically significant, suggesting that the variation is due to random chance. The five-year BC average rate was 1.77%, which is significantly lower than the Society for Thoracic Surgeons (STS) reported
rate of 2.3%.2 The number of isolated CABGs decreased from 1,944 in 2005 to 1,834 in 2009. (Note: The purpose of risk adjustment is to take into account variation in patient outcomes due to different risk factor profiles among different groups. The model included risk factors such as age, sex, selected co-morbidities, and urgency status at the time of surgery).
Figure 5.1 30-Day All-Cause Mortality Rate (%) Post Isolated CABG in BC, 2005-2009
Definitions: The risk-adjusted all-cause mortality rate within 30-days for patients undergoing isolated CABG. Estimates of rates with 95% confidence interval are shown by year. The five-year BC average rate is shown in red.Source: Cardiac Services BC, Cardiac Services BC Registry, 2005-2009; and British Columbia Vital Statistics Agency, British Columbia Vital Statistics Agency Vital Event Registry, 2005-2009.
0.0
0.5
1.0
1.5
2.0
2.5
3.0
Ad
just
ed E
ven
t R
ate
(%)
2005
1944
2006
1876
2007
1871
2008
1912
2009
1834N=
Year
CSBC in ACTIONCSBC, as part of its commitment to working with physicians to assess outcomes and to improve overall performance, reviews outcome data annually with cardiac surgeons and interventional cardiologists. Some of the outcome indicators reviewed include:Surgery:• percentageofcaseswithevidence-
based medication at discharge by surgeon
• redbloodcelltransfusionrate by surgeon
• 30-daymortalityratebysurgeon• 30-daystroke/deathratebysurgeon
PCI:• pre-proceduralrenalfunction
assessment by physician• sixmonthrepeatrevascularization
rate by physician• 30-daymortalityratebyphysician• 30-dayAMI/deathratebyphysician
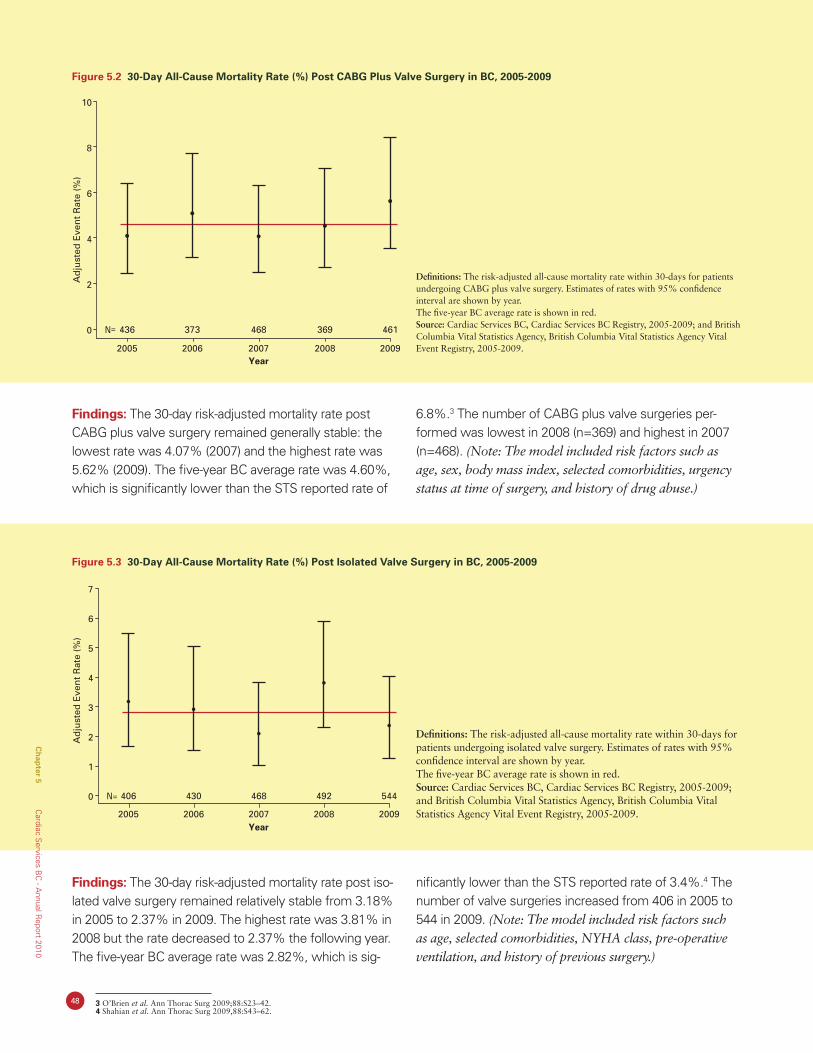
48 3 O’Brien et al. Ann Thorac Surg 2009;88:S23–42. 4 Shahian et al. Ann Thorac Surg 2009,88:S43–62.
Findings: The 30-day risk-adjusted mortality rate post CABG plus valve surgery remained generally stable: the lowest rate was 4.07% (2007) and the highest rate was 5.62% (2009). The five-year BC average rate was 4.60%, which is significantly lower than the STS reported rate of
6.8%.3 The number of CABG plus valve surgeries per-formed was lowest in 2008 (n=369) and highest in 2007 (n=468). (Note: The model included risk factors such as age, sex, body mass index, selected comorbidities, urgency status at time of surgery, and history of drug abuse.)
Figure 5.2 30-Day All-Cause Mortality Rate (%) Post CABG Plus Valve Surgery in BC, 2005-2009
Definitions: The risk-adjusted all-cause mortality rate within 30-days for patients undergoing CABG plus valve surgery. Estimates of rates with 95% confidence interval are shown by year. The five-year BC average rate is shown in red.Source: Cardiac Services BC, Cardiac Services BC Registry, 2005-2009; and British Columbia Vital Statistics Agency, British Columbia Vital Statistics Agency Vital Event Registry, 2005-2009.
0
2
4
6
8
10
2005
436
2006
373
2008
369
2009
461N=
2007
468
Year
Ad
just
ed E
ven
t R
ate
(%)
Figure 5.3 30-Day All-Cause Mortality Rate (%) Post Isolated Valve Surgery in BC, 2005-2009
Definitions: The risk-adjusted all-cause mortality rate within 30-days for patients undergoing isolated valve surgery. Estimates of rates with 95% confidence interval are shown by year. The five-year BC average rate is shown in red.Source: Cardiac Services BC, Cardiac Services BC Registry, 2005-2009; and British Columbia Vital Statistics Agency, British Columbia Vital Statistics Agency Vital Event Registry, 2005-2009.
Findings: The 30-day risk-adjusted mortality rate post iso-lated valve surgery remained relatively stable from 3.18% in 2005 to 2.37% in 2009. The highest rate was 3.81% in 2008 but the rate decreased to 2.37% the following year. The five-year BC average rate was 2.82%, which is sig-
nificantly lower than the STS reported rate of 3.4%.4 The number of valve surgeries increased from 406 in 2005 to 544 in 2009. (Note: The model included risk factors such as age, selected comorbidities, NYHA class, pre-operative ventilation, and history of previous surgery.)
Ad
just
ed E
ven
t R
ate
(%)
0
1
2
3
4
5
6
7
2005
406
2006
430
2008
492
2009
544N=
2007
468
Year
Ch
apter 5
Cardiac S
ervices BC
- Annual R
eport 2010
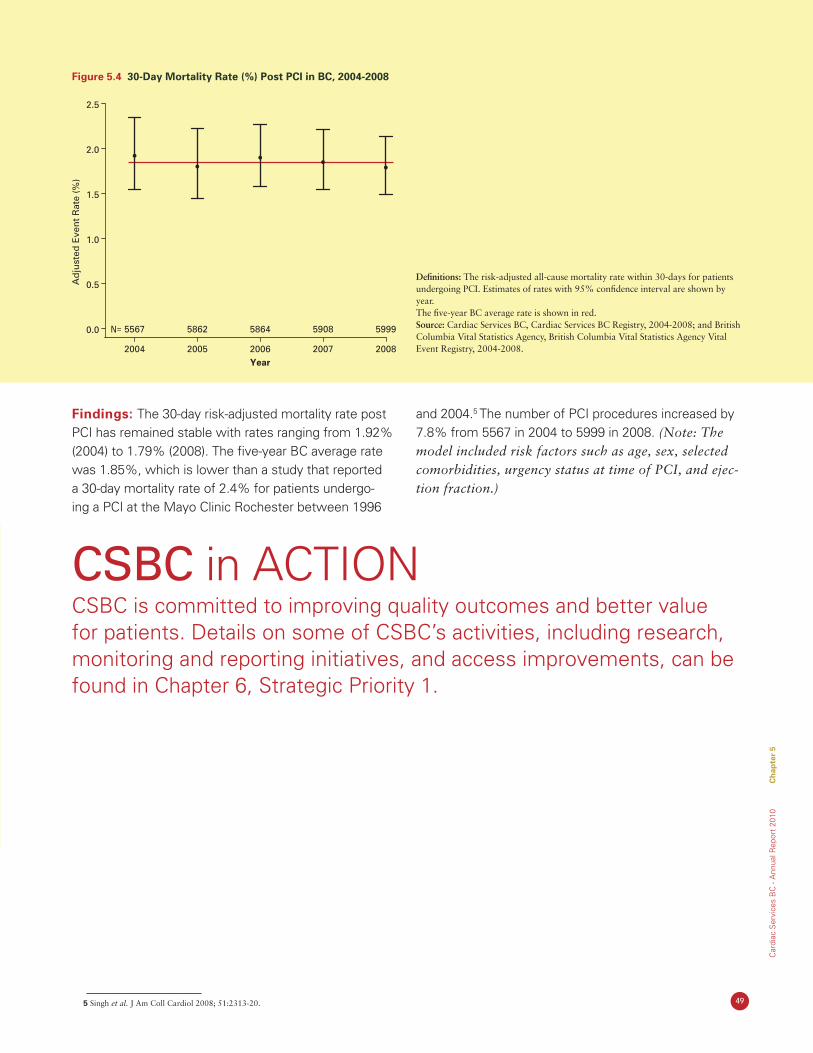
Car
diac
Ser
vice
s B
C -
Ann
ual R
epor
t 20
10
Ch
apte
r 5
49 5 Singh et al. J Am Coll Cardiol 2008; 51:2313-20.
Figure 5.4 30-Day Mortality Rate (%) Post PCI in BC, 2004-2008
Definitions: The risk-adjusted all-cause mortality rate within 30-days for patients undergoing PCI. Estimates of rates with 95% confidence interval are shown by year. The five-year BC average rate is shown in red.Source: Cardiac Services BC, Cardiac Services BC Registry, 2004-2008; and British Columbia Vital Statistics Agency, British Columbia Vital Statistics Agency Vital Event Registry, 2004-2008.
Findings: The 30-day risk-adjusted mortality rate post PCI has remained stable with rates ranging from 1.92% (2004) to 1.79% (2008). The five-year BC average rate was 1.85%, which is lower than a study that reported a 30-day mortality rate of 2.4% for patients undergo-ing a PCI at the Mayo Clinic Rochester between 1996
and 2004.5 The number of PCI procedures increased by 7.8% from 5567 in 2004 to 5999 in 2008. (Note: The model included risk factors such as age, sex, selected comorbidities, urgency status at time of PCI, and ejec-tion fraction.)
Ad
just
ed E
ven
t R
ate
(%)
0.0
0.5
1.0
1.5
2.0
2.5
2004
5567
2005
5862
2007
5908
2008
5999N=
2006
5864
Year
CSBC in ACTIONCSBC is committed to improving quality outcomes and better value for patients. Details on some of CSBC’s activities, including research, monitoring and reporting initiatives, and access improvements, can be found in Chapter 6, Strategic Priority 1.

50
Ch
apter 6
Cardiac S
ervices BC
- Annual R
eport 2010

51
Car
diac
Ser
vice
s B
C -
Ann
ual R
epor
t 20
10
Ch
apte
r 6
Chapter 6Planning Priorities
52
Ch
apter 6
Cardiac S
ervices BC
- Annual R
eport 2010
As an agency of the PHSA, CSBC plans within the framework of the PHSA’s strategic directions. The following highlights CSBC’s main priorities and planning activities.
Planning Priorities
Strategic Priority 1: Improving quality outcomes and better value for patients
Monitor and report on data quality, utilization data, wait time data and outcome performance
•AnnualServiceLevelAgreementsinplacebetween CSBC and regional health authorities
•Monthlydataqualityreportsdevelopedandreviewed with tertiary cardiac sites
•Newcardiacregistryunderdevelopmenttoinclude the full continuum of cardiac care
•AnnualCSBCReportdevelopedanddistributed
Generate new knowledge of application of evidence and leading practices
•ProvincialAdvisoryPanelonCardiacHealthprovides recommendations on new and emerging technologies, indications for use, utilization of services, etc
•CSBCDataAccessandResearchReviewBoard promotes research projects utilizing CSBC Registry data
•Cardiacresearchfellowshippositionssupported within CSBC
•Staffinitiateandcollaboratewithcliniciansonresearch papers
Monitor and report on process and outcomes of care with clinicians
•Annualmeetingwithallcardiacsurgeonsandinterventional cardiologists to review outcomes to promote improved quality of care and patient outcomes
•Regularreportingofcomprehensivesetofindicators for process and quality of care based on international standards
•Qualityoutcomesforelectrophysiologymanagement under development
Improve access to cardiac care for all BC residents
•Provincialplansinplaceforelectrophysiologyand revascularization
•RevascularizationservicesexpandedtoIHdecreasing patient travel time & expense; reducing bed days for patients waiting for transfer
•WaittimesforCABGsurgeryandEPprocedures actively monitored to ensure compliance with national standards
•Atrialfibrillationclinicsestablishedatalltertiarycardiac sites to improve service access
53
Car
diac
Ser
vice
s B
C -
Ann
ual R
epor
t 20
10
Ch
apte
r 6
Strategic Priority 2: Promoting Healthier Populations
Expanding from a treatment centered to a patient centered approach and extending the reach of CSBC into high risk areas of the population
•Athree-yearprovincialheartfailureplanimplemented
•CollaboratewithPHSAPopulationHealthonprimarycareinitiatives(obesity,chronicdiseasemanagement)
•ChairinWomen’sCardiovascularHealthestablishedincollaborationwithUBCFacultyofMedicine,Heart&Stroke Foundation BC & Yukon Division, BC Women’s Hospital and Providence Health Care
•Fiveatrialfibrillationclinicsestablishedacrosstheprovince
Strategic Priority 3: Contributing to a Sustainable Healthcare System
Enhancing system accountability through collaborative planning with service providers
•CardiacServiceSteeringCommitteeestablished in 2009 with senior leadership from each health authority and meets monthly
•AnnualServiceLevelAgreementssignedbetween CSBC and health authorities
•Fundingratesestablishingforcardiacprocedures using activity-based costing model, adjusting for patient complexities and co-morbidities
•Fundingratesandvolumesestablishedwithfunding recovered for all procedures not delivered
Promoting delivery of evidence-based therapies (e.g., safer healthcare now, heart failure, secondary prevention)
Enhancing scrutiny of procedure indications and regional variation in utilization rates
•Standardizedindicationsforhigh-cost,lowvolume procedures (e.g., micro-axial pump, thoracic endovascular aortic stents)
•RegionalvariationinelectrophysiologyandPCIunder review
Enhancing bed utilization through provincial coordination of patient flow
•Dailyteleconferencingwithtriagecoordinators
Reallocating supply cost savings achieved through standardization of cardiac medical/surgical supplies and devices through Health Shared Services BC provincial procurement
Provincial plans developed for Cardiac Revascularization Services (CR), Congestive Heart Failure Services (CHF), and Electrophysiology Services (EP).
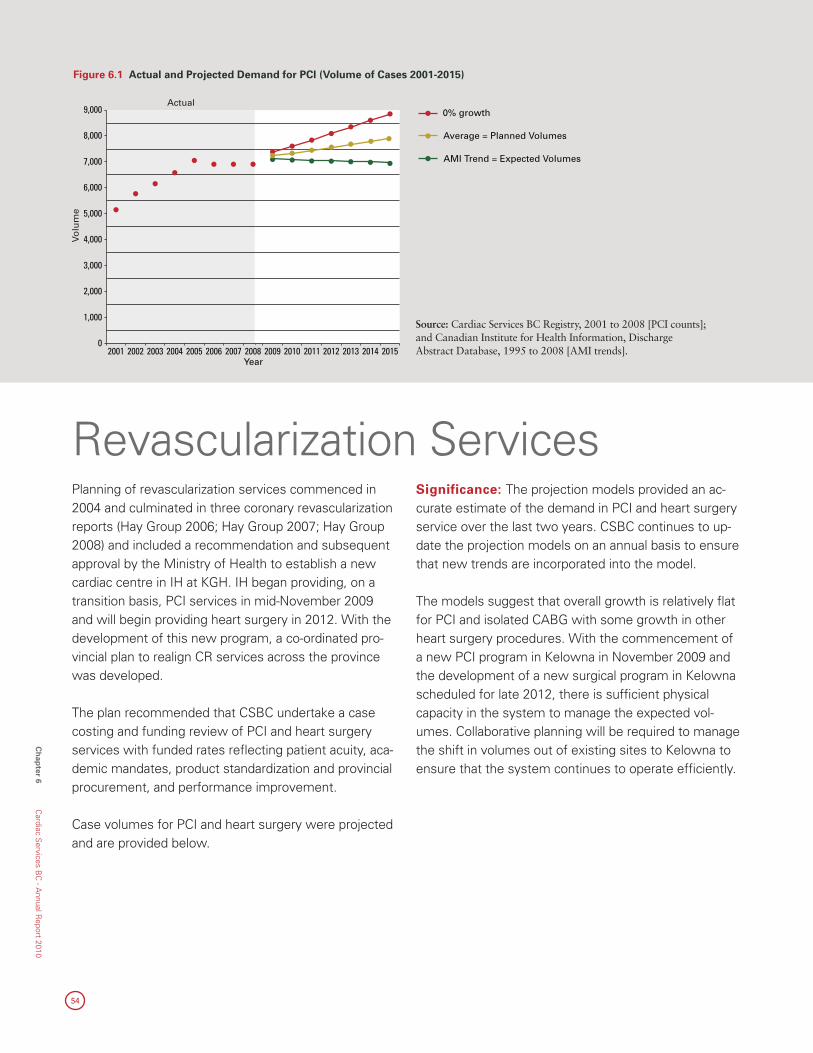
54
Ch
apter 6
Cardiac S
ervices BC
- Annual R
eport 2010
Planning of revascularization services commenced in 2004 and culminated in three coronary revascularization reports (Hay Group 2006; Hay Group 2007; Hay Group 2008) and included a recommendation and subsequent approval by the Ministry of Health to establish a new cardiac centre in IH at KGH. IH began providing, on a transition basis, PCI services in mid-November 2009 and will begin providing heart surgery in 2012. With the development of this new program, a co-ordinated pro-vincial plan to realign CR services across the province was developed.
The plan recommended that CSBC undertake a case costing and funding review of PCI and heart surgery services with funded rates refl ecting patient acuity, aca-demic mandates, product standardization and provincial procurement, and performance improvement.
Case volumes for PCI and heart surgery were projected and are provided below.
Significance: The projection models provided an ac-curate estimate of the demand in PCI and heart surgery service over the last two years. CSBC continues to up-date the projection models on an annual basis to ensure that new trends are incorporated into the model.
The models suggest that overall growth is relatively fl at for PCI and isolated CABG with some growth in other heart surgery procedures. With the commencement of a new PCI program in Kelowna in November 2009 and the development of a new surgical program in Kelowna scheduled for late 2012, there is suffi cient physical capacity in the system to manage the expected vol-umes. Collaborative planning will be required to manage the shift in volumes out of existing sites to Kelowna to ensure that the system continues to operate effi ciently.
Revascularization Services
Figure 6.1 Actual and Projected Demand for PCI (Volume of Cases 2001-2015)
0
1,000
2,000
3,000
4,000
5,000
6,000
7,000
8,000
9,000
2001 2002 2003 2004 2005 2006 2007 2008 2009 2010 2011 2012 2013 2014 2015Year
Actual
Volu
me
0% growth
Average = Planned Volumes
AMI Trend = Expected Volumes
Source: Cardiac Services BC Registry, 2001 to 2008 [PCI counts]; and Canadian Institute for Health Information, Discharge Abstract Database, 1995 to 2008 [AMI trends].
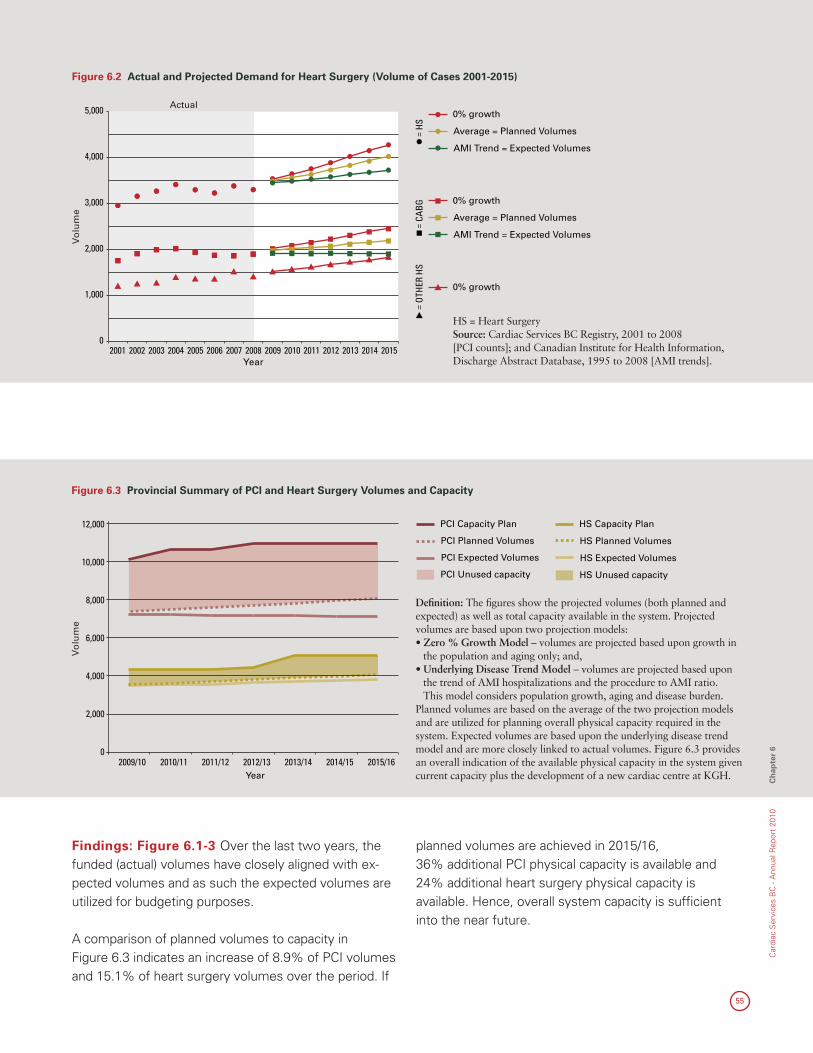
55
Figure 6.2 Actual and Projected Demand for Heart Surgery (Volume of Cases 2001-2015)
0% growth
Average = Planned Volumes
AMI Trend = Expected Volumes
0% growth
Average = Planned Volumes
AMI Trend = Expected Volumes
0% growth
= HS
= CA
BG=
OTHE
R HS
Vo
lum
e
0
1,000
2,000
3,000
4,000
5,000
2001 2002 2003 2004 2005 2006 2007 2008 2009 2010 2011 2012 2013 2014 2015Year
Actual
HS = Heart SurgerySource: Cardiac Services BC Registry, 2001 to 2008 [PCI counts]; and Canadian Institute for Health Information, Discharge Abstract Database, 1995 to 2008 [AMI trends].
Figure 6.3 Provincial Summary of PCI and Heart Surgery Volumes and Capacity
Vo
lum
e
0
2,000
4,000
6,000
8,000
10,000
12,000
Year2009/10 2010/11 2011/12 2012/13 2013/14 2014/15 2015/16
PCI Capacity Plan
PCI Planned Volumes
PCI Expected Volumes
PCI Unused capacity
HS Capacity Plan
HS Planned Volumes
HS Expected Volumes
HS Unused capacity
2009/10 2010/11 2011/12 2012/13 2013/14 2014/15 2015/16
PCI Expected Volumes
PCI Planned Volumes
PCI Capacity Plan
HS Expected Volumes
HS Planned Volumes
HS Capacity Plan
7,235 7,207 7,181 7,163 7,155 7,123 7,084
7,366 7,463 7,565 7,686 7,810 7,920 8,021
10,086 10,600 10,600 10,900 10,900 10,900 10,900
3,484 3,521 3,560 3,637 3,692 3,740 3,786
3,527 3,598 3,674 3,790 3,884 3,973 4,059
4,300 4,300 4,300 4,455 5,050 5,050 5,050
Defi nition: The fi gures show the projected volumes (both planned and expected) as well as total capacity available in the system. Projected volumes are based upon two projection models:• Zero % Growth Model – volumes are projected based upon growth in
the population and aging only; and,• Underlying Disease Trend Model – volumes are projected based upon
the trend of AMI hospitalizations and the procedure to AMI ratio. This model considers population growth, aging and disease burden.
Planned volumes are based on the average of the two projection models and are utilized for planning overall physical capacity required in the system. Expected volumes are based upon the underlying disease trend model and are more closely linked to actual volumes. Figure 6.3 provides an overall indication of the available physical capacity in the system given current capacity plus the development of a new cardiac centre at KGH.
Findings: Figure 6.1-3 Over the last two years, the funded (actual) volumes have closely aligned with ex-pected volumes and as such the expected volumes are utilized for budgeting purposes.
A comparison of planned volumes to capacity in Figure 6.3 indicates an increase of 8.9% of PCI volumes and 15.1% of heart surgery volumes over the period. If
planned volumes are achieved in 2015/16, 36% additional PCI physical capacity is available and 24% additional heart surgery physical capacity is available. Hence, overall system capacity is suffi cient into the near future.
Car
diac
Ser
vice
s B
C -
Ann
ual R
epor
t 20
10
Ch
apte
r 6
56
Ch
apter 6
Cardiac S
ervices BC
- Annual R
eport 2010
1 Primary Health Care Congestive Heart Failure (CCHF) Registry 2008/09. 2 Cardiology Preeminence Roundtable. Beyond Four Walls: Cost-Effective Management of Chronic Congestive Heart Failure. Washington, D.C.: Advisory Board Company, 1994. 3 Johansen H, Strauss B, Arnold JM, Moe G, Liu P. On the rise: The current and projected future burden of congestive heart failure hospitalization in Canada. Can J Cardiol
2003;19(4):430-5. 4 Johnstone DE, Abdulla A, Arnold JMO, Bernstein V, et al. Diagnosis and management of heart failure. Can J Cardiol 1994;10:613-631.
Congestive Heart Failure (CHF)
CSBC in ACTIONCSBC in collaboration with the health authorities have developed a three-year implementation plan. The plan focuses on the development, implementation, and expansion of evidence-based protocols across the province with specific focus on the development of telemedicine strategies and strategies that target specialized populations.
CHF is a significant health problem with over 90,000 BC residents reported to have CHF in 2008/09 with preva-lence expected to nearly double by the year 2030.1-2 CHF care is the most expensive chronic disease in BC (at a cost of more than $500 million per year), the most common cause of hospitalization in people over 65 years of age, and has an average one-year mortality rate of 33%.3
An accurate and timely diagnosis is critical to initiate treatment that will relieve symptoms, improve quality of life, reduce hospitalizations and prolong survival.4 Improved management of these patients can avoid as much as 50% of inpatient care. Family practitioners provide the majority of care while multidisciplinary clin-ics are an important resource for patients and healthcare providers who manage CHF.
An overall framework for CHF care is currently being developed that places the patient and primary care providers at the centre with a stepwise support system for access to CHF care. Regional health authorities have developed plans in line with this structure that include: •Standardsforinfrastructure,educationcurricula,best
practice guidelines, treatment protocols/algorithms;•Seamlessconsultation,referral,andtransferofpa-
tients (from emergency, hospital, and primary care) to the regional centre, to the provincial program, and back to primary care;
•Telemedicineandremotemonitoringstrategiestofacilitate self-management; and,
•Guidelinesfortheroleofend-of-lifedecisionmakingand palliation services (hospital or community based).
57
Car
diac
Ser
vice
s B
C -
Ann
ual R
epor
t 20
10
Ch
apte
r 6
Cardiac electrophysiology is the cardiology subspecialty focused on the heart’s electrical system and dealing primarily with heart rhythm disorders (arrhythmia). EP services span the continuum of care from initial consult, to diagnostic and therapeutic services, to follow up. Information from diagnostic EP studies informs the appropriate therapy for the patient (e.g., medications, surgical or catheter ablation procedure, or implantation of a pacemaker/ICD).
Over the past decade, catheter ablation procedures have expanded dramatically and most recently emerged as a promising approach for treating atrial fibrillation (AF). AF is the most prevalent of all arrhythmias and is responsible for over 580 hospital admissions per 100,000 population annually in Canada. In 2008, there were two EP centres in BC (RJH and SPH) performing approximately 1,250 ablations annually. Significantly long waits were noted with the total wait time for a complex ablation (i.e., from initial consult to procedure) estimated at 2.5 years. As a result of the long waiting times a provincial review of EP services was conducted in May 2008.
Significance: In total 30 recommendations were put forward requiring:•DevelopmentofaprovincialEPdatabaseandwaitlist
management system including a standardized patient triaging system;
•IncreasedEPlabcapacitywithinthesystemtoachieve a target volume of 2,500 EP procedures annu-ally by 2011/12;
•Fundingforadditionalprocedurevolumesandrates;•EstablishmentofAFClinicsateachcentretoprovide
better support to patients and healthcare providers, reduce wait times, allow more efficient and effective use of EP physician time, standardize wait-list man-agement, and enhance the ability to recruit EP physi-cians; and
•DevelopmentofaregionalnetworkofEPservicesinthe lower mainland organized around a single united group of electrophysiologists and linked to BC Chil-dren’s Hospital and RJH through formal and collab-orative efforts in registry development, transparent wait-list management, long-term outcomes research, standards development, and systematic approaches to treating patients presenting with arrhythmias may be possible.
All recommendations were acted upon with new or expanded services in place or under development.
Electrophysiology Services
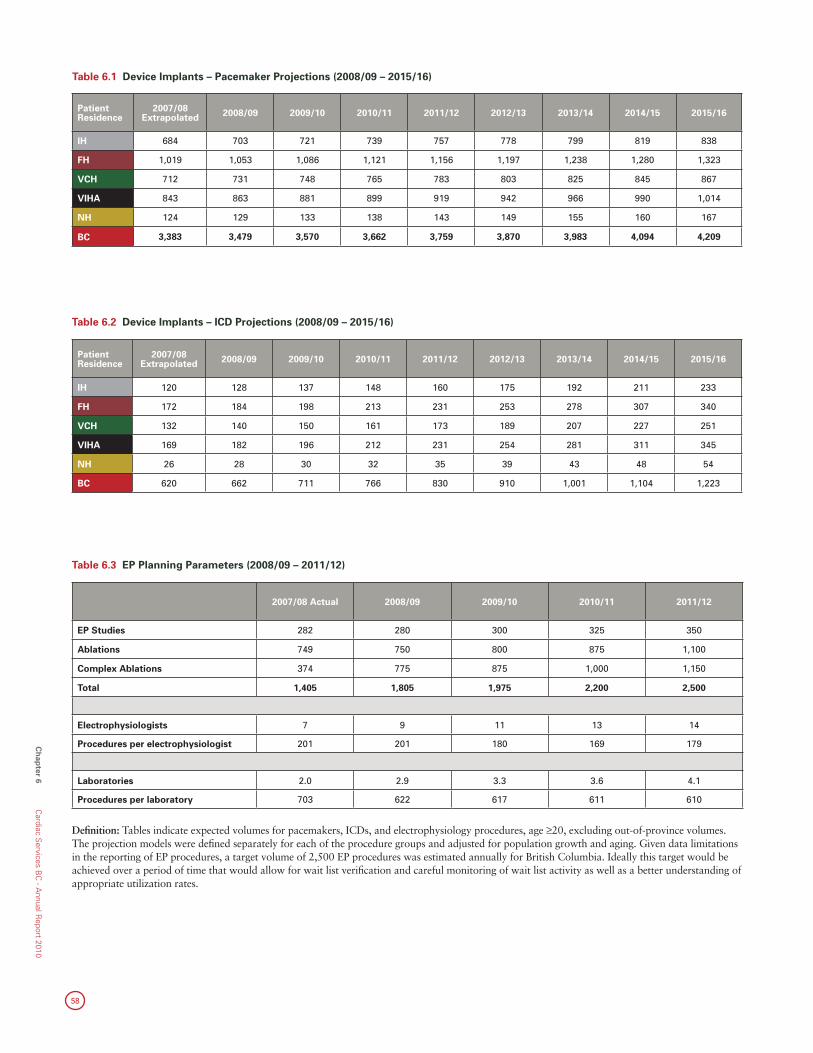
58
Ch
apter 6
Cardiac S
ervices BC
- Annual R
eport 2010
2007/08 Actual 2008/09 2009/10 2010/11 2011/12
EP Studies 282 280 300 325 350
Ablations 749 750 800 875 1,100
Complex Ablations 374 775 875 1,000 1,150
Total 1,405 1,805 1,975 2,200 2,500
Electrophysiologists 7 9 11 13 14
Procedures per electrophysiologist 201 201 180 169 179
Laboratories 2.0 2.9 3.3 3.6 4.1
Procedures per laboratory 703 622 617 611 610
Table 6.3 EP Planning Parameters (2008/09 – 2011/12)
Patient Residence
2007/08 Extrapolated 2008/09 2009/10 2010/11 2011/12 2012/13 2013/14 2014/15 2015/16
IH 120 128 137 148 160 175 192 211 233
FH 172 184 198 213 231 253 278 307 340
VCH 132 140 150 161 173 189 207 227 251
VIHA 169 182 196 212 231 254 281 311 345
NH 26 28 30 32 35 39 43 48 54
BC 620 662 711 766 830 910 1,001 1,104 1,223
Table 6.2 Device Implants – ICD Projections (2008/09 – 2015/16)
Definition: Tables indicate expected volumes for pacemakers, ICDs, and electrophysiology procedures, age ≥20, excluding out-of-province volumes. The projection models were defined separately for each of the procedure groups and adjusted for population growth and aging. Given data limitations in the reporting of EP procedures, a target volume of 2,500 EP procedures was estimated annually for British Columbia. Ideally this target would be achieved over a period of time that would allow for wait list verification and careful monitoring of wait list activity as well as a better understanding of appropriate utilization rates.
Table 6.1 Device Implants – Pacemaker Projections (2008/09 – 2015/16)
Patient Residence
2007/08 Extrapolated 2008/09 2009/10 2010/11 2011/12 2012/13 2013/14 2014/15 2015/16
IH 684 703 721 739 757 778 799 819 838
FH 1,019 1,053 1,086 1,121 1,156 1,197 1,238 1,280 1,323
VCH 712 731 748 765 783 803 825 845 867
VIHA 843 863 881 899 919 942 966 990 1,014
NH 124 129 133 138 143 149 155 160 167
BC 3,383 3,479 3,570 3,662 3,759 3,870 3,983 4,094 4,209
59
Car
diac
Ser
vice
s B
C -
Ann
ual R
epor
t 20
10
Ch
apte
r 6
Findings: Growth in ICD volumes represented the largest budget pressure to CSBC in 2010/11. New clinical trials supported the benefit of expanding indications for ICD implants for primary prevention and enhanced education of physicians about appropriate management of heart failure for traditional indications has resulted in increased need for appropriate ICD implants. As such, the projection models have under-estimated the expected volume of ICDs.
As a result of the report, CSBC invested over $6.5 million in EP services resulting in significant service volume increases for EP from:•1,250ablationsannually(2007/08)to1,750
(forecasted 2010/11);•620ICDsannually(2007/08)to845(forecasted
2010/11); and,•45laserleadextractions(2007/08)to60(forecasted
2010/11).
CSBC has also developed a separate EP module to effectively manage wait times, track volumes, and monitor trends; we have also implemented a triage coordinator at each site to actively manage and prioritize wait listed patients, especially high-risk patients.
In 2010/2011, CSBC developed four AF clinics with an additional clinic at KGH planned for 2011/12. The purpose of the clinics is to enhance patient and healthcare provider access to specialized EP knowledge using nurse educators and nurse practitioners to facilitate telephone intake, case conferencing, group education classes, intake consultation visits, facilitated referral for specialized services, anticoagulation management, follow-up clinics, and case management.
CSBC in ACTIONA Metro Vancouver Heart Rhythm Committee was established to plan EP services in the lower mainland including the expansion of the number of laboratory days, and recruitment of additional electrophysiologists. CSBC has also reviewed current projections, utilization patterns, and funding rates to assess requirements into the future.

60
Ch
apter 7
Cardiac S
ervices BC
- Annual R
eport 2010

Chapter 7 Financial Resources
62
Ch
apter 7
Cardiac S
ervices BC
- Annual R
eport 2010
The 2010/11 operating budget for CSBC is approximate-ly $165 million to support cardiovascular disease-related treatment services and secondary prevention. The budget is managed through service level agreements as well as monthly monitoring of wait lists, wait times, and procedure volumes at the Cardiac Services Steering Committee (CSSC).
Funding is allocated to health authorities based upon a rate-based funding model that incorporates supply cost changes, introduction of new technologies, devices and/or drugs, changes in patient acuity, price savings from provincial tenders, and results of continuous case cost-ing analysis.
Procedure volume projections are reviewed annually against actual utilization, regional utilization variation corrections, changing indications for procedure use, ac-ceptance of new technologies, and corresponding wait times.
This section provides an overview of the budgeted vol-umes and allocation of funds for the 2010/11 fiscal year. Throughout the fiscal year, CSBC, in collaboration with the health authorities, manages cost pressures across the cardiac programs. As such, the budget provides an estimate of future spending at a point in time.
Financial Resources
Financial Resources: Cardiac Procedures Volumes and Budget by Major ProgramSignificance: CSBC’s operating budget is used to set and articulate provincial priorities as well as to compare actual operating results against planned strategies.
The 2010/11 budget represents one year of a four-year budget; i.e., 2010/11 to 2013/14 and therefore, represents progress toward the agency’s overall goals. Ongoing management of throughput, wait lists, and wait times allow CSBC to evaluate performance against planned strategies.
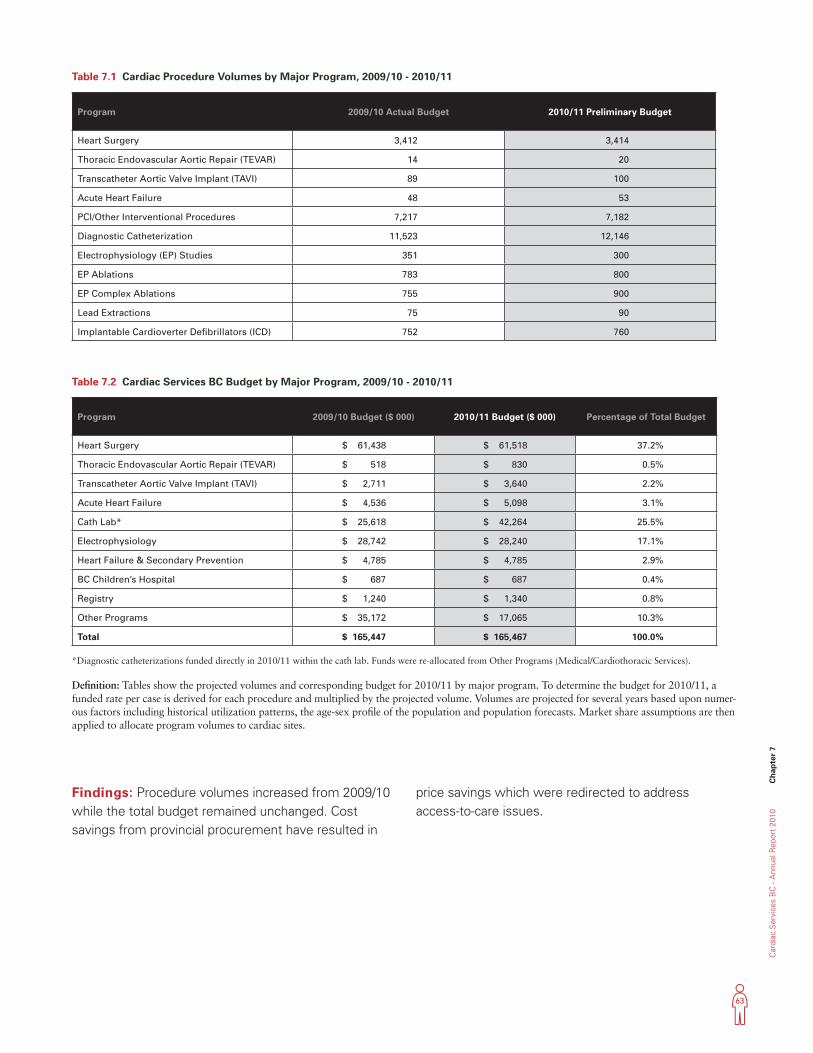
63
Car
diac
Ser
vice
s B
C -
Ann
ual R
epor
t 20
10
Ch
apte
r 7
Table 7.1 Cardiac Procedure Volumes by Major Program, 2009/10 - 2010/11
Findings: Procedure volumes increased from 2009/10 while the total budget remained unchanged. Cost savings from provincial procurement have resulted in
price savings which were redirected to address access-to-care issues.
Definition: Tables show the projected volumes and corresponding budget for 2010/11 by major program. To determine the budget for 2010/11, a funded rate per case is derived for each procedure and multiplied by the projected volume. Volumes are projected for several years based upon numer-ous factors including historical utilization patterns, the age-sex profile of the population and population forecasts. Market share assumptions are then applied to allocate program volumes to cardiac sites.
*Diagnostic catheterizations funded directly in 2010/11 within the cath lab. Funds were re-allocated from Other Programs (Medical/Cardiothoracic Services).
Program 2009/10 Budget ($ 000) 2010/11 Budget ($ 000) Percentage of Total Budget
Heart Surgery $ 61,438 $ 61,518 37.2%
Thoracic Endovascular Aortic Repair (TEVAR) $ 518 $ 830 0.5%
Transcatheter Aortic Valve Implant (TAVI) $ 2,711 $ 3,640 2.2%
Acute Heart Failure $ 4,536 $ 5,098 3.1%
Cath Lab* $ 25,618 $ 42,264 25.5%
Electrophysiology $ 28,742 $ 28,240 17.1%
Heart Failure & Secondary Prevention $ 4,785 $ 4,785 2.9%
BC Children’s Hospital $ 687 $ 687 0.4%
Registry $ 1,240 $ 1,340 0.8%
Other Programs $ 35,172 $ 17,065 10.3%
Total $ 165,447 $ 165,467 100.0%
Table 7.2 Cardiac Services BC Budget by Major Program, 2009/10 - 2010/11
Program 2009/10 Actual Budget 2010/11 Preliminary Budget
Heart Surgery 3,412 3,414
Thoracic Endovascular Aortic Repair (TEVAR) 14 20
Transcatheter Aortic Valve Implant (TAVI) 89 100
Acute Heart Failure 48 53
PCI/Other Interventional Procedures 7,217 7,182
Diagnostic Catheterization 11,523 12,146
Electrophysiology (EP) Studies 351 300
EP Ablations 783 800
EP Complex Ablations 755 900
Lead Extractions 75 90
Implantable Cardioverter Defibrillators (ICD) 752 760
64
CSBC Staff Contributors
The following CSBC staff directly contributed to the creation of this report:
David Babiuk,• Provincial Executive Director
Karin Humphries,• Provincial Director, Data Services, Evaluation and Research
Min Gao,• Director, Biostatistics and Data Manager
Christopher Thompson,• Medical Director
Alexandra Flatt,• Director of Planning, Operations and Finance
Janis McGladrey,• Clinical Services Planning and Operations Lead
Lillian Ding,• Senior Biostatistician
May Lee,• Senior Biostatistician
Sharon Relova,• Epidemiologist
Aihua Pu,• Biostatistician
Ruth Zhang,• Biostatistician
Caroll Co,• Statistical Analyst
Fei Wang,• Statistical Analyst
Julia Zhu,• Data Analyst
Tricia Louis,• Data Integrity Specialist
Crystal Beers• , Business Development Senior Systems Analyst
Appendix
Ap
pen
dix
Cardiac S
ervices BC
- Annual R
eport 2010

person place time