Embed Size (px)
Citation preview
1
Cardiac Biomarkers are Associated with an Increased Risk of Stroke and
Death in Patients with Atrial Fibrillation: A RELY Substudy
Running title: Hijazi et al.; Cardiac biomarkers in atrial fibrillation
Ziad Hijazi, MD1; Jonas Oldgren, MD, PhD1; Ulrika Andersson, MSc2; Stuart J. Connolly, MD3;
Michael D. Ezekowitz, MB, ChB4; Stefan H. Hohnloser, MD5; Paul A. Reilly, PhD6;
Dragos Vinereanu, MD, PhD7; Agneta Siegbahn, MD, PhD8; Salim Yusuf, MD, PhD3;
Lars Wallentin, MD, PhD1
1Uppsala Clinical Research Center & Dept of Medical Sciences, Cardiology, Uppsala University,
Sweden; 2Uppsala Clinical Research Center, Uppsala University, Sweden; 3Population Health Research Institute, Hamilton, Canada; 4Lankenau Institute for Medical Research & the Heart
Center, Wynnewood, PA; 5Dept of Cardiology, J. W. Goethe University, Frankfurt, Germany; 6Boehringer Ingelheim Pharmaceuticals, Ridgefield, CT; 7Dept of Cardiology, University Hospital of Bucharest, Bucharest, Romania; 8Uppsala Clinical Research Center & Dept of
Medical Sciences, Clinical Chemistry, Uppsala University, Sweden
Correspondence:
Ziad Hijazi, MD
Uppsala Clinical Research Center
Dag Hammarskjölds väg 14B, 1st floor
SE- 752 37 Uppsala, Sweden
Tel: +46 18 611 95 00
Fax: +46 18 51 55 70
E-mail: [email protected]
Journal Subject Codes: [5] Arrhythmias, [53] Embolic stroke, [66] Risk Factors for Stroke, [105] Contractile function
by guest on May 21, 2018
http://circ.ahajournals.org/D
ownloaded from
by guest on M
ay 21, 2018http://circ.ahajournals.org/
Dow
nloaded from
by guest on May 21, 2018
http://circ.ahajournals.org/D
ownloaded from
by guest on M
ay 21, 2018http://circ.ahajournals.org/
Dow
nloaded from
by guest on May 21, 2018
http://circ.ahajournals.org/D
ownloaded from
by guest on M
ay 21, 2018http://circ.ahajournals.org/
Dow
nloaded from
2
Abstract:
Background - Cardiac biomarkers are strong predictors of adverse outcomes in several patient
populations. We evaluated the prevalence of elevated troponin I and NT-proBNP and their
association to cardiovascular events in atrial fibrillation (AF) patients in the RELY trial.
Methods and Results - Biomarkers at randomization were analyzed in 6189 patients. Outcomes
were evaluated by Cox proportional hazards models adjusting for established cardiovascular risk
factors and the CHADS2 and CHA2DS2-VASc risk scores. Patients were stratified based on
troponin I concentrations: <0.010 μg/L, n=2663; 0.010-0.019 μg/L, n=2006; 0.020-0.039 μg/L,
n=1023; 0.040 μg/L, n=497; and on NT-proBNP concentrations quartiles: <387; 387-800; 801-
1402; >1402 ng/L. Rates of stroke were independently related to levels of troponin I with
2.09%/year in the highest and 0.84%/year in the lowest troponin I group (hazard ratio (HR) 1.99
[95% confidence interval (CI) 1.17-3.39], p=0.0040), and to NT-proBNP with 2.30%/year vs.
0.92% in the highest vs. lowest NT-proBNP quartile groups, (HR 2.40 [CI 1.41-4.07],
p=0.0014). Vascular mortality was also independently related to biomarker levels with
6.56%/year in the highest and 1.04%/year the lowest troponin I group (HR 4.38 [CI 3.05-6.29]
p<0.0001), and 5.00%/year in the highest and 0.61%/year in the lowest NT-proBNP quartile
groups (HR 6.73 [3.95-11.49] p<0.0001). Biomarkers increased the C-statistic from 0.68 to 0.72,
p<0.0001, for a composite of thromboembolic events.
Conclusions - Elevations of troponin I and NT-proBNP are common in patients with AF and
independently related to increased risks of stroke and mortality. Cardiac biomarkers seem useful
for improving risk prediction in AF beyond currently used clinical variables.
Clinical Trial Registration Information - www.clinicaltrials.gov, NCT00262600
Key words: atrial fibrillation; cardiac biomarkers; natriuretic peptide; risk prediction; troponin by guest on M
ay 21, 2018http://circ.ahajournals.org/
Dow
nloaded from
3
Introduction
The prevalence of atrial fibrillation (AF) is increasing and is projected to reach epidemic
proportions in coming decades1. AF is associated with a 5-fold increase in the rate of ischemic
stroke and doubled total mortality2. Strategies for identifying patients at risk for
thromboembolism are commonly based on clinical variables, e.g. congestive heart failure,
hypertension, age, diabetes mellitus and prior stroke or TIA in the widely used CHADS2 risk
score3. So far no biochemical marker has been shown to provide incremental information.
Cardiac troponin, an intracellular protein involved in heart muscle contraction, is an established
biochemical marker of myocardial cell damage. B-type natriuretic peptide (BNP), a
neurohormone secreted from the cardiac ventricles, is a recognized marker of myocardial wall
tension, as well as its inactive part, N-terminal fragment (NT-proBNP) 4. Elevated levels of
troponin and NT-proBNP have repeatedly been demonstrated as important markers of increased
mortality and morbidity in acute coronary syndromes 5, 6, stable coronary artery disease 7, 8 ,
congestive heart failure 9, 10, and even in general community-based populations 11, 12 . The
prevalence and clinical significance of elevated cardiac troponin I and NT-proBNP in non-
valvular AF patients at risk for stroke is unknown.
The RELY trial recently demonstrated the superiority of dabigatran versus warfarin for
stroke prevention in 18 113 AF patients13. In this prospectively designed biomarker substudy we
investigated the prevalence of elevated troponin I and NT-proBNP and their association to
cardiovascular events in a representative subgroup constituting one third of the RELY cohort.
Methods
Study population and trial design
by guest on May 21, 2018
http://circ.ahajournals.org/D
ownloaded from
4
The study organization, trial design, patient characteristics and outcomes of the Randomized
Evaluation of Long-Term Anticoagulation Therapy (RE-LY) study have been published
previously13. In brief, RE-LY was a prospective, multicenter, randomized trial comparing two
blinded doses of dabigatran with open label warfarin for a minimum of 12 months in 18113
patients. Inclusion criteria were documented atrial fibrillation and at least one of the following
risk factors for stroke: previous stroke or TIA; congestive heart failure or reduced left ventricular
ejection fraction (<40%); at least 75 years of age; or at least 65 years of age with diabetes
mellitus, hypertension, or coronary artery disease. Exclusion criteria included severe heart valve
disorder, recent stroke, increased risk of hemorrhage, creatinine clearance less than 30 mL/min,
or active liver disease. The 6189 (out of 18113) patients in the present study represented 446 out
of 951 sites in 38 out of 44 countries in the RELY trial. The primary efficacy outcome in the
study was fatal and nonfatal stroke (ischemic, hemorrhagic or unspecified) or systemic
embolism, and the secondary outcomes were total mortality, vascular (including hemorrhagic)
mortality, non-vascular mortality, and a composite thromboembolic endpoint consisting of
ischemic stroke, systemic embolism, myocardial infarction, pulmonary embolism and vascular
mortality (excluding hemorrhagic death). The primary safety outcome was major bleeding.
Median follow-up was 2.0 years for the main trial and 2.2 years for the substudy population.
Outcomes were assessed by study visits scheduled at 3-month intervals during the first year and
4-month intervals thereafter. Each event was classified by two independent adjudicators from an
international team, blinded to treatment assignments. Definition of the outcomes has been
described previously13.
Blood sampling
Venous blood was drawn at randomization, before initiation of study treatment, using a 21/22
by guest on May 21, 2018
http://circ.ahajournals.org/D
ownloaded from
5
gauge needle into vacutainer tubes containing EDTA. The blood was centrifuged within 30
minutes at 2000 G for 10 minutes. The tubes were thereafter immediately frozen at -20 degrees
Celsius or colder. Aliquots were stored at -700 C to allow batch analysis.
Laboratory methods
All plasma samples were centrally analyzed in Uppsala Clinical Research Center (UCR) -
laboratory, Sweden. Troponin I was analyzed with the Access AccuTnI assay (Beckman Coulter,
Inc., Fullerton, CA, USA), a two-site immunoenzymatic (sandwich) immunoassay. The lower
limit of detection with this assay is 0.006 μg/L with 0.014 μg/L as the lowest concentration
measurable with a coefficient of variation of <10% and 0.02 μg/L as the 99th percentile upper
reference limit (URL) for subjects aged <60 years14 and 0.04 μg/L as the 99th percentile URL
regardless of age15. With present instrument calibration all troponin I concentrations below 0.010
μg/L are reported as <0.010 μg/L and considered undetectable; levels equal or above 0.010 are
regarded as detectable and reported with two significant figures; levels equal or above 0.020
μg/L are considered elevated.
NT-proBNP was analyzed using the Sandwich Immunoassay, Elecsys, Roche
Diagnostics. The analytical range extends from 20 to 35 000 ng/L according to the manufacturer.
The upper reference level (97.5th percentile) in men and woman aged 40-65 years is 184 and 268
ng/L, respectively, and age 66 to 76 years, 269 and 391 ng/L, respectively 16. The lowest
concentration with a coefficient of variation <10% is 30 ng/L 17.
Statistical analysis
The sample size for the substudy was prospectively estimated to 5744 patients, based on an
expected event rate of 1.6 % / year (corresponding to a total event rate of 3.2 %), and the
assumptions that the biomarker was related to outcome in the following manner: the total event
by guest on May 21, 2018
http://circ.ahajournals.org/D
ownloaded from
6
rate for the lower quartile is 1.6 %, for the middle quartiles 3.2 % and for the upper quartile 6.4
%. A two-sided test of the null hypothesis of no difference in event rate between the lower
quartile and a middle quartile requires 1436 patients per group when the significance level is 5%
and the power is 80%. The number of samples in total was thus calculated to 4*1436=5744, in
order to account for missing information blood samples were planned from approximately 6200
patients out of the 18113 patients in the RELY study. The final number of samples in the present
analysis was 6189, composed of 2561 patients participating in a comprehensive RE-LY
biomarker substudy program and 3628 randomly selected patients with cardiac biomarkers
(troponin I and NT-proBNP) obtained at randomization in the main RE-LY study.
Patients were grouped according to quartiles of NT-proBNP levels, <387 ng/L (n=1547),
387-800 ng/L (n=1547), 801-1402 ng/L (n=1544) and >1402 ng/L (n=1551). Troponin I results
were, as expected, extremely skewed and patients were in the present study grouped according to
cut-off levels based on results from previous studies, instead of four equally sized groups.
Troponin I levels were undetectable (<0.010 μg/L) in 2663 (43.0%) patients, 2006 (32.4%)
patients had detectable troponin I levels = 0.010-0.019 μg/L, i.e. up to the 99th percentile for
apparently healthy individuals <60 years age18. One thousand twenty-three (16.5%) patients had
slightly elevated troponin I levels 0.020-0.039 μg/L and 497 (8.0%) had clearly elevated
troponin I levels 0.040 μg/L, i.e. above the 99th percentile URL for the troponin I assay
regardless of age15.
Demographics and baseline characteristics were summarized for the troponin I and NT-
proBNP level groups using frequencies for categorical variables, and median and 25th and 75th
quartiles for continuous variables. Due to low numbers of patients in the CHADS2 scores 0, 4, 5
and 6 patients were grouped in CHADS2-classes of: 0-1, 2 and 3. For tests of differences among
by guest on May 21, 2018
http://circ.ahajournals.org/D
ownloaded from
7
groups, the chi-square test was used for categorical variables and Kruskal-Wallis test was used
for continuous variables.
The risk of event is reported as percentage per year, which was calculated by dividing the
total number of patients with events by the total number of patient-years of follow-up.
Cumulative hazard plots were used to illustrate the timing of events. The relations between levels
of troponin I and NT-proBNP at randomization and events were investigated using Cox
proportional-hazards regression. Three different models were used. Model A was adjusted for
study treatment, use of (pre-study) anticoagulant treatment at randomization and established risk
factors for cardiovascular disease (age, sex, body mass index, smoking status, sitting systolic
blood pressure, sitting heart rate, AF duration, AF type, creatinine clearance, diabetes, coronary
artery disease, previous stroke/systemic embolism/TIA, heart failure, hypertension, treatment at
randomization with aspirin, angiotensin converting enzyme inhibitors or angiotensin II receptor
blockers, and statins). Model B was only adjusted for study treatment and the CHADS2 score (1
point for each of congestive heart failure, hypertension, age 75 years, diabetes, and two points
for previous stroke/TIA), using six CHADS2 classes (CHADS2 score of 5 and 6 combined).
Model C was only adjusted for study treatment and the CHA2DS2-VASc score (1 point for each
of congestive heart failure, hypertension, age 65 but <75 years, diabetes mellitus, prior stroke or
TIA, vascular disease, and sex category; and two points for each of age or 75 years and prior
stroke or TIA) using 7 classes (scores of 0 and 1 combined, and scores of 7, 8 and 9 combined).
The two cardiac biomarkers were included separately as well as jointly in the models. The results
of hazard ratios for model A are presented in the results text and tables. Models B and C yielded
similar hazard ratios (data not shown). The effects of randomized treatment on outcome in
relation to level of biomarker was evaluated with Cox proportional hazards model with treatment
by guest on May 21, 2018
http://circ.ahajournals.org/D
ownloaded from
8
group, biomarker and their interaction as dependent variables. The proportional hazards
assumption with respect to the cardiac biomarkers were assessed by visual inspection of log-
cumulative hazard plots and by extending the Cox model with a time-by-biomarker interaction
factor. In addition, sensitivity analyses using logistic regression were carried out (results not
shown).
The increased discriminative values of troponin I and NT-proBNP were investigated by
estimating the difference in C statistics between models with and without respective cardiac
biomarker19 and also the integrated discrimination improvement measure (IDI) as described by
Pencina et al20. In these analyses the occurrence/non-occurrence of stroke or systemic embolism
and composite thromboembolic events, respectively, during the follow-up period was used as a
binary response and the C value will be the same as the area under the ROC curve. The relative
IDI was calculated to facilitate interpretation of the IDI21.
A p value of less than 0.05 from two-sided tests was considered to indicate statistical
significance. The statistical software package SAS, version 9.2 for Windows (SAS institute,
Cary, NC, USA) was used for all analyses.
Results
Baseline characteristics in relation to levels of cardiac biomarkers
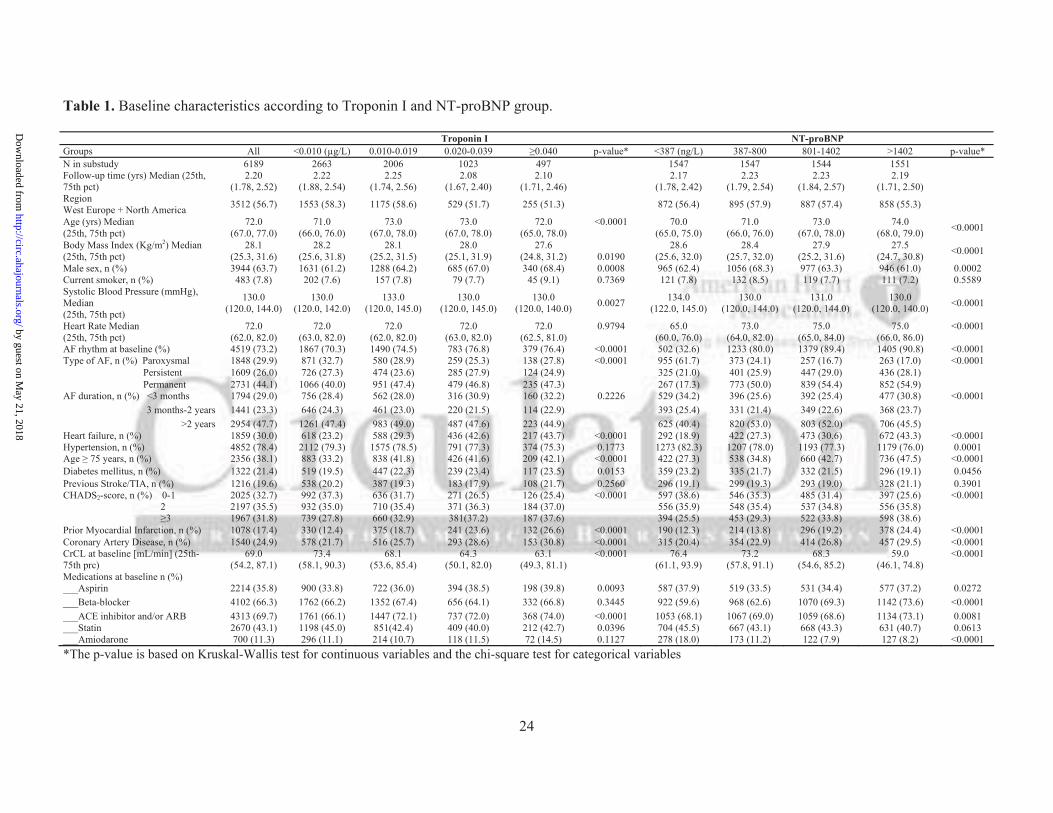
Patient characteristics are summarized in Table 1. Troponin I levels ranged from <0.010 to 7.1
μg/L, with a median of 0.011, 25th and 75th percentile values of <0.010 and 0.019 μg/L.
Detectable levels of troponin I ( 0.010 μg/L) were found in 3526 (57.0%) and elevated levels of
troponin I ( 0.020 μg/L) in 1520 (24.6%) patients (Table 1). Several patient characteristics, e.g.
higher age, previous myocardial infarction, history of congestive heart failure, AF rhythm at
by guest on May 21, 2018
http://circ.ahajournals.org/D
ownloaded from
9
randomization (at the time of blood sampling), and lower creatinine clearance were significantly
associated with higher troponin I levels, all p<0.0001 (Table 1).
NT-proBNP levels ranged from <5 to 44959 ng/L, with a median of 801, 25th and 75th
percentile values of 387 and 1403 ng/L. Several patient characteristics, most prominently age,
AF rhythm at randomization, history of congestive heart failure, and lower creatinine clearance,
were significantly associated with higher NT-proBNP levels, all p<0.0001 (Table 1).
The proportion of patients with CHADS2 risk scores 0-1 was highest (37.3% and 38.6%,
respectively) in groups with the lowest levels of cardiac biomarkers (troponin I <0.010 μg/L and
NT-proBNP <387 ng/L) and lowest (25.4% and 25.6%, respectively) in groups with the highest
levels of cardiac biomarkers (troponin I 0.040 μg/L and NT-proBNP >1402 ng/L, respectively).
The opposite applied to the proportion of patients with a CHADS2 scores 3, which was lowest
(27.8% and 25.5%, respectively) in groups with undetectable troponin I (<0.010 μg/L) and low
NT-proBNP <387 ng/L, and highest (37.6% and 38.6%, respectively) in the groups with highest
troponin I ( 0.040) μg/L and highest NT-proBNP (>1402 ng/L), respectively (Table 1).
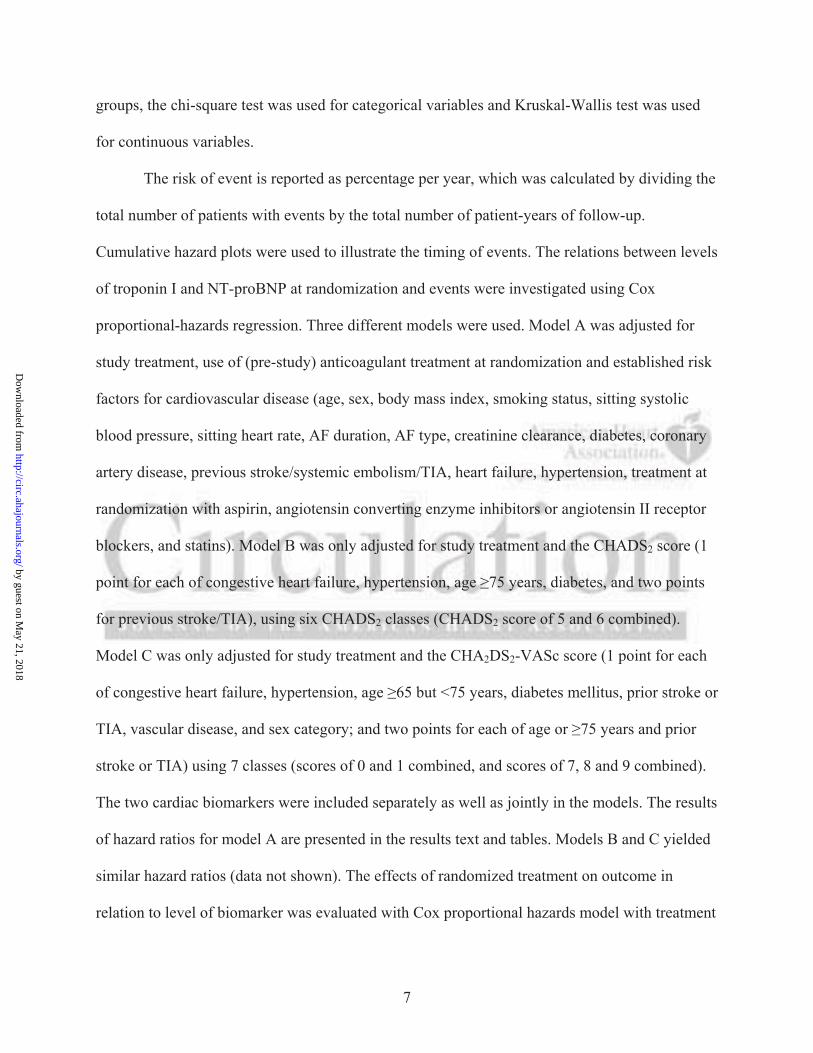
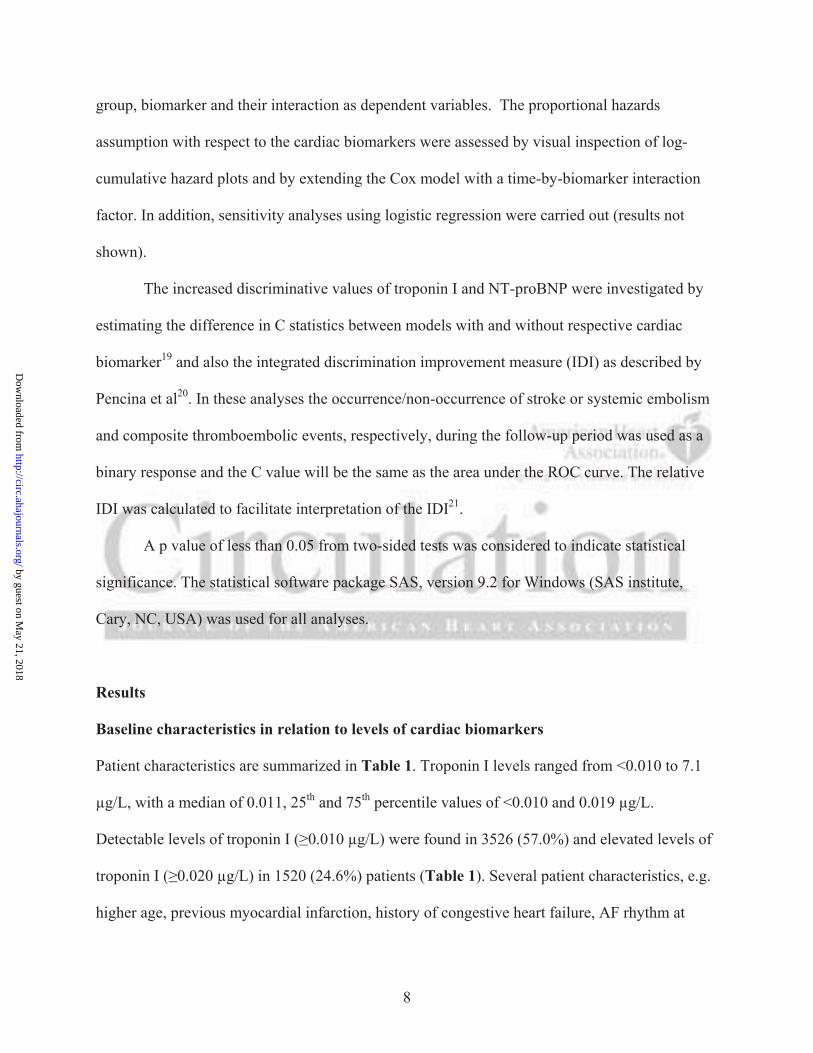
Stroke or systemic embolism
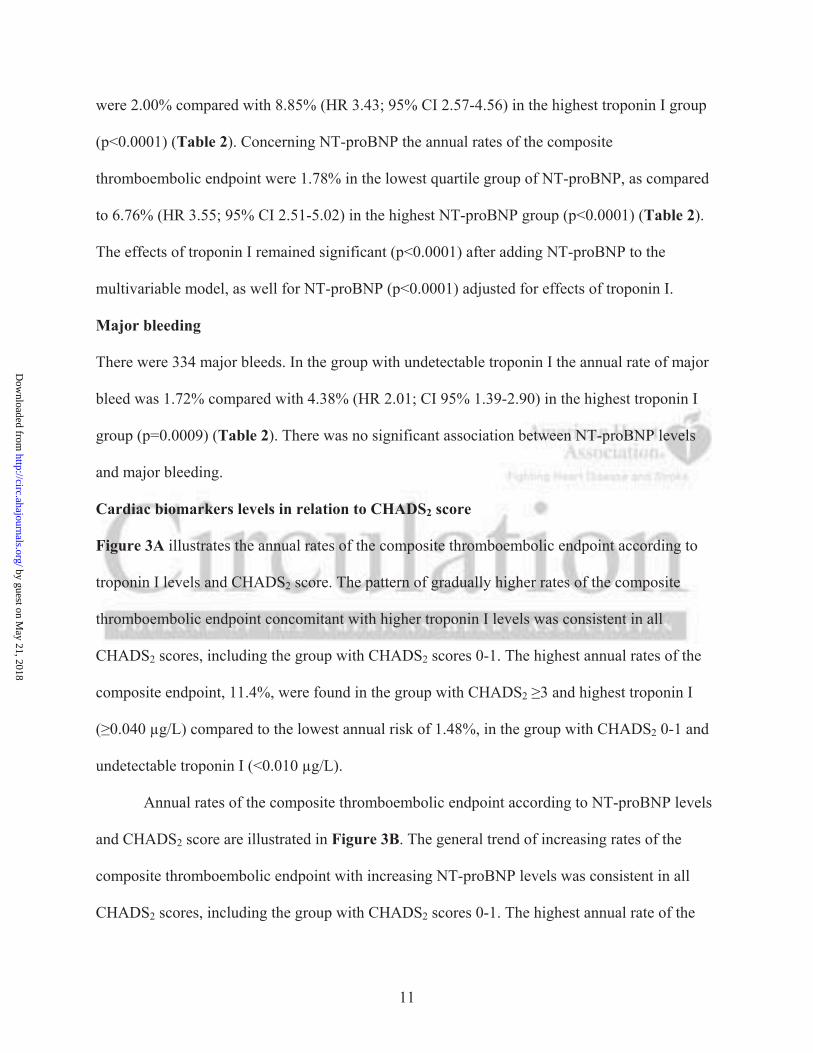
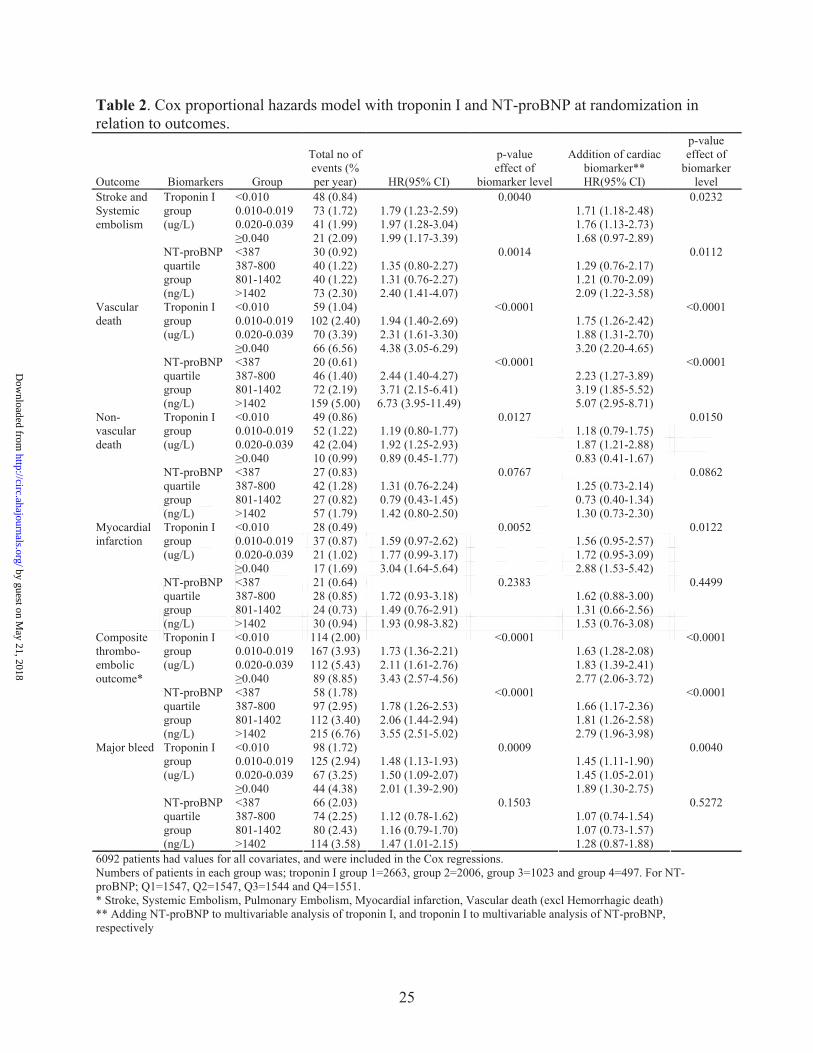
During the median of 2.2 years follow-up, there were 183 events of stroke or systemic embolism.
The annual rates of stroke or systemic embolism were lowest, 0.84%, in the group with
undetectable troponin I, as compared to 2.09% (HR 1.99; 95% CI 1.17-3.39) in the highest
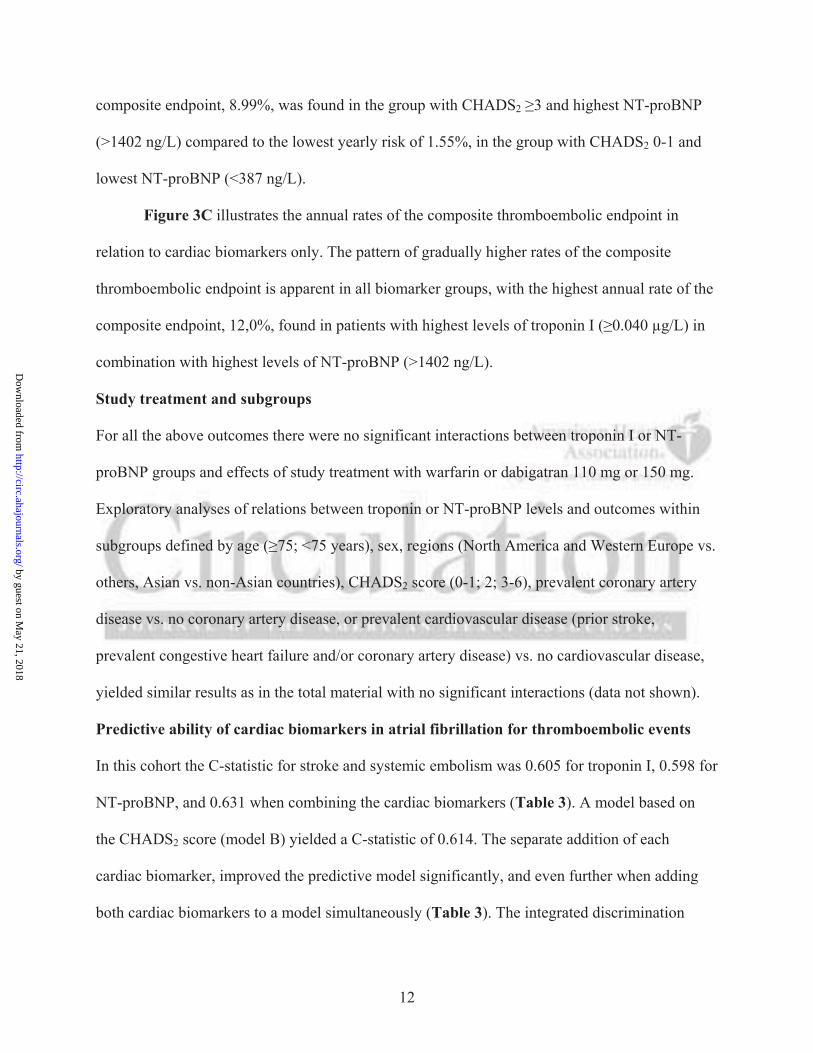
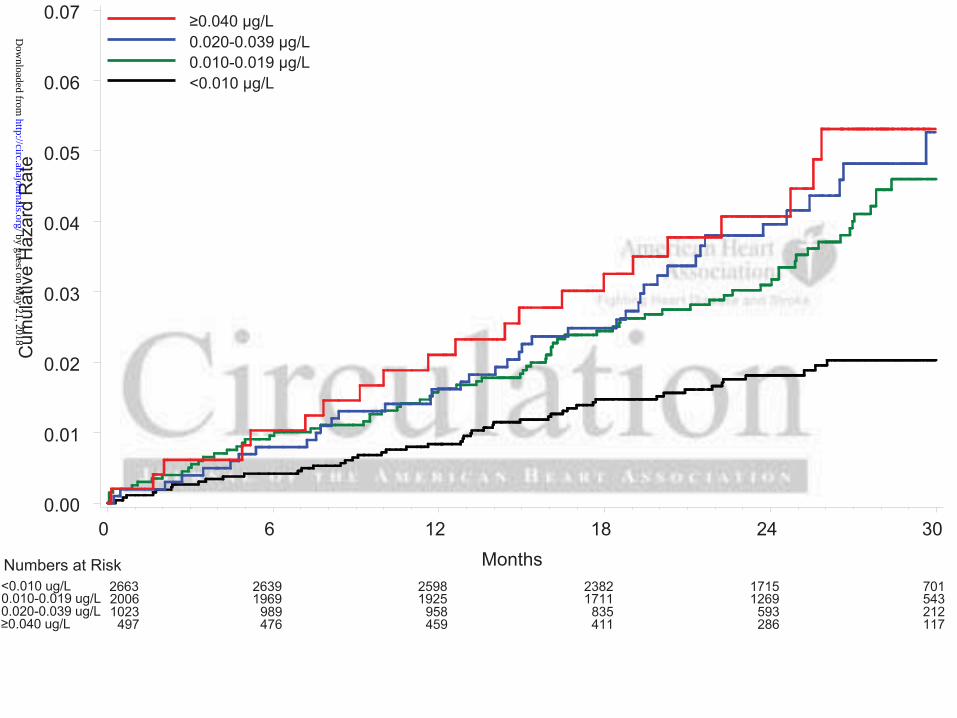
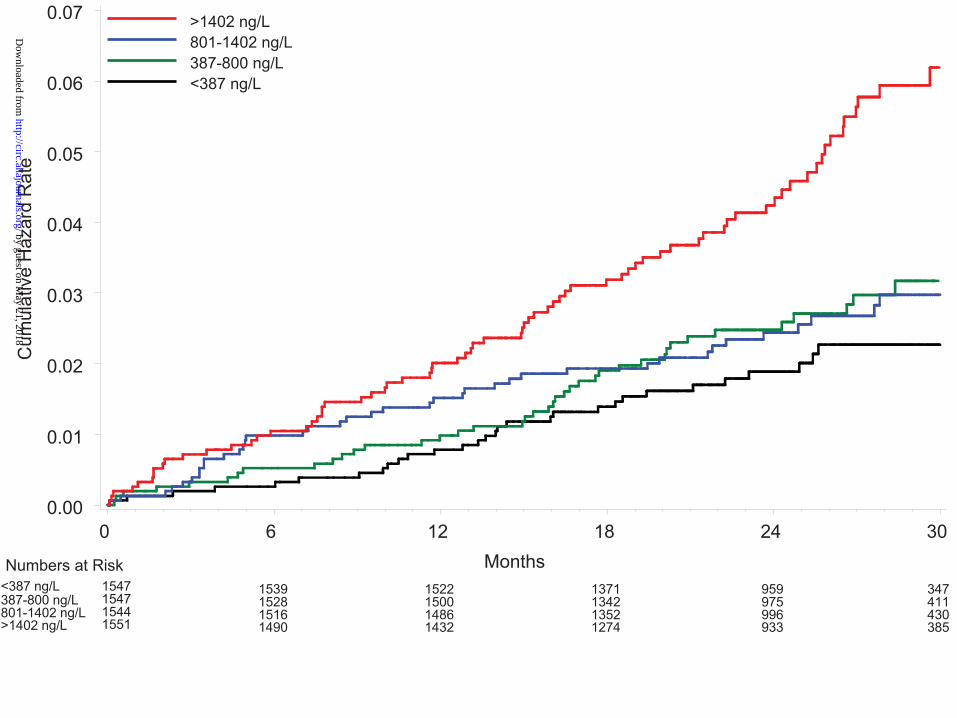
troponin I group (p=0.0040) (Figure 1A, Table 2). In relation to NT-proBNP the annual rates of
stroke or systemic embolism were lowest, 0.92%, in the quartile group with low NT-proBNP, as
compared to 2.30% (HR 2.40; 95% CI 1.41-4.07) in the highest NT-proBNP (p=0.0014) (Figure
1B, Table 2). The effects of troponin I remained significant (p=0.0232) after adjustment for NT-
proBNP in the multivariable model, as well for NT-proBNP (p=0.0112) adjusted for troponin I.
by guest on May 21, 2018
http://circ.ahajournals.org/D
ownloaded from
10
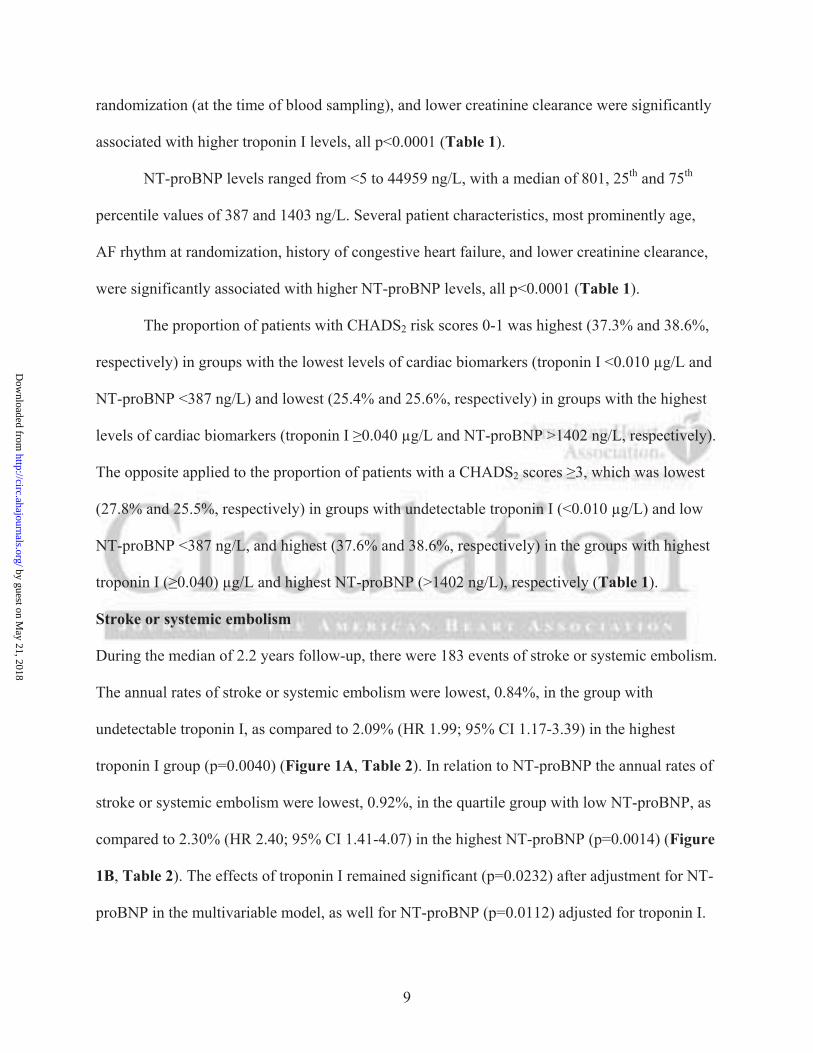
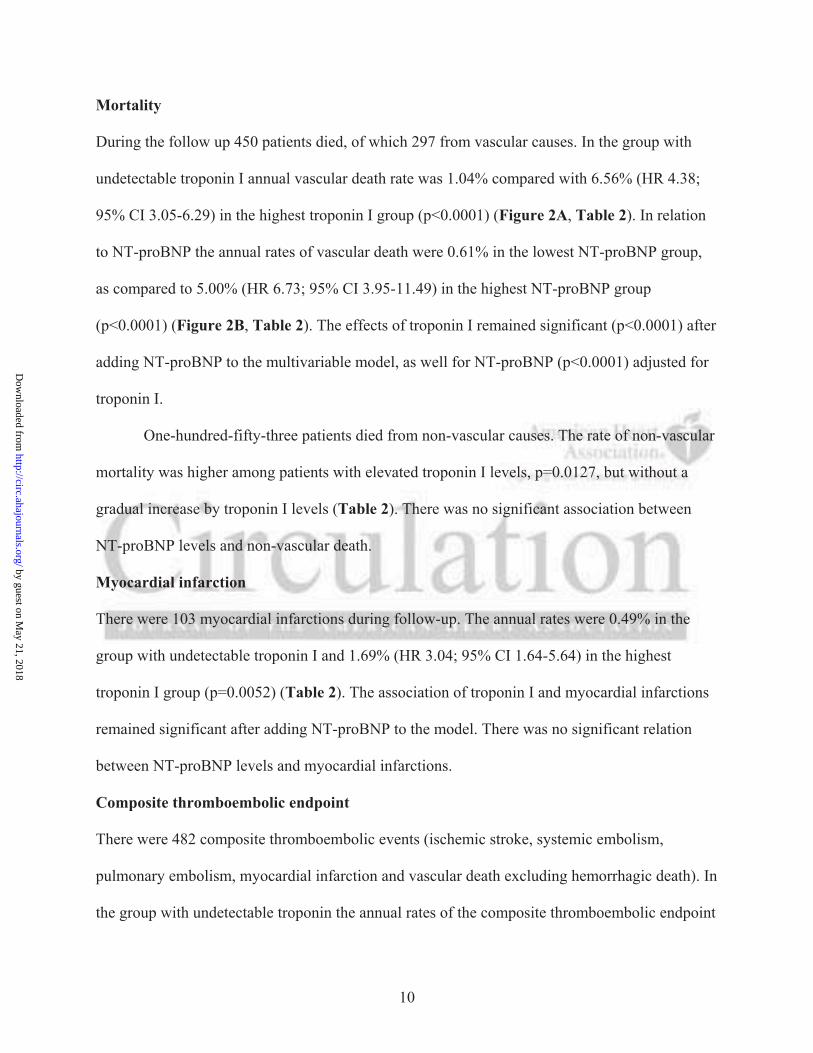
Mortality
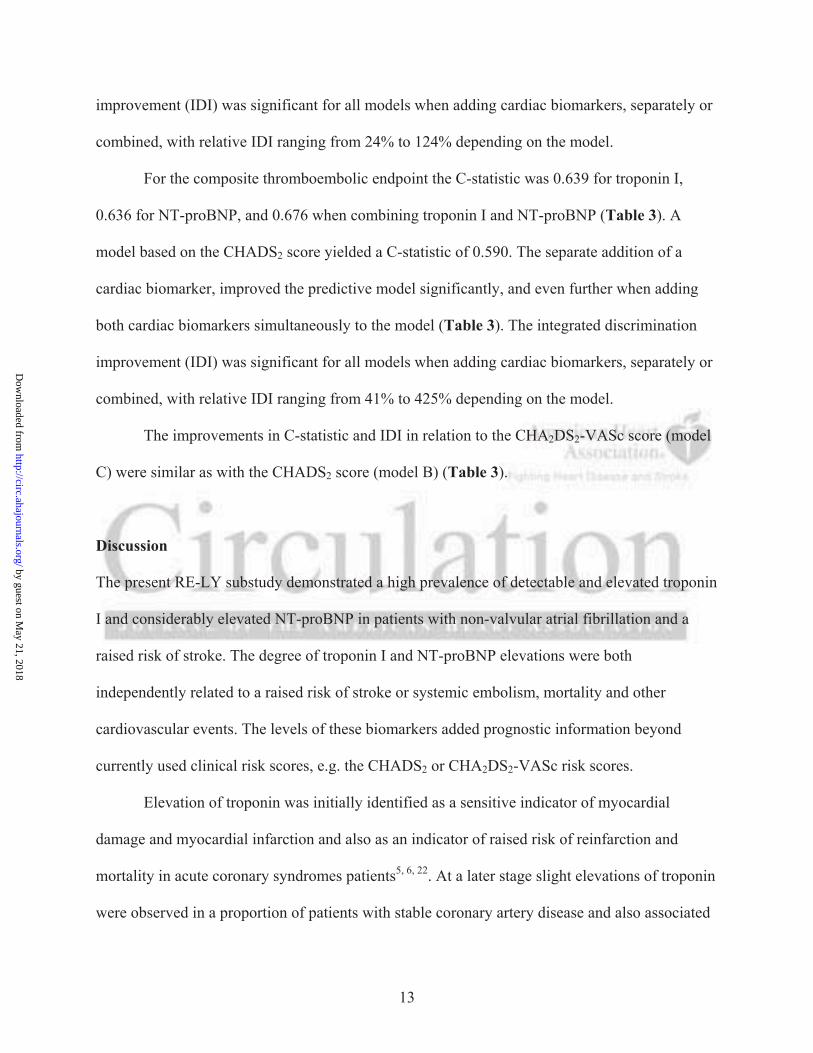
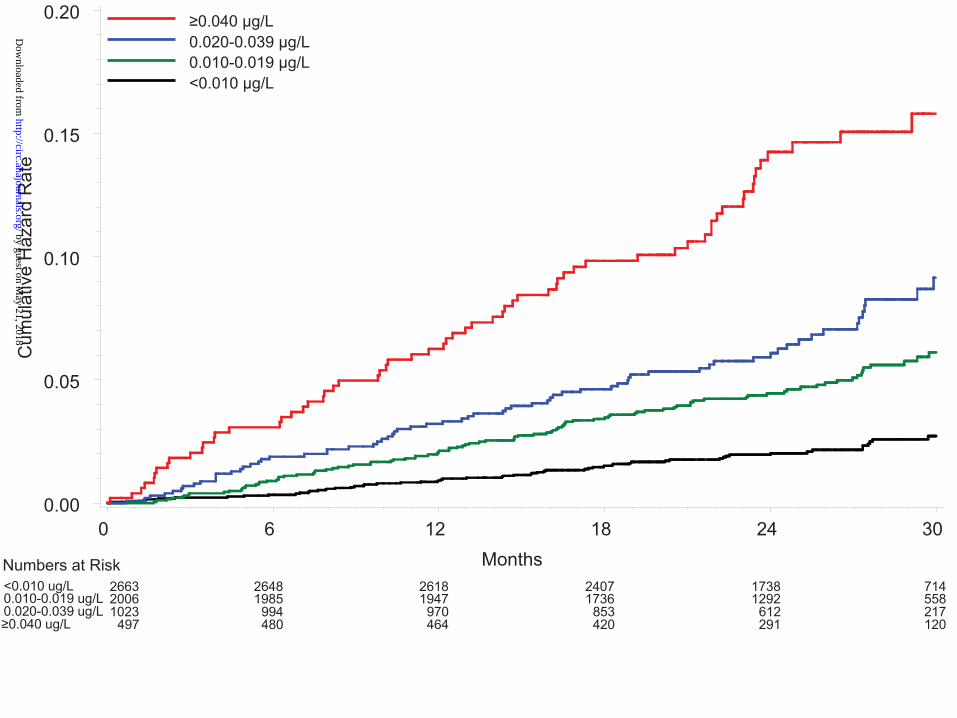
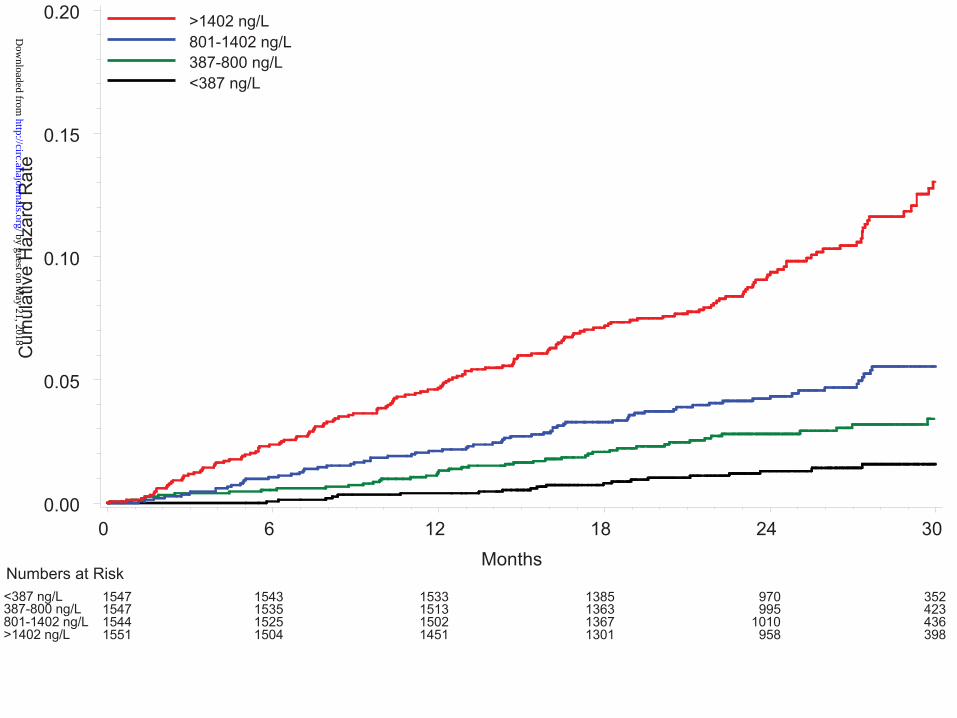
During the follow up 450 patients died, of which 297 from vascular causes. In the group with
undetectable troponin I annual vascular death rate was 1.04% compared with 6.56% (HR 4.38;
95% CI 3.05-6.29) in the highest troponin I group (p<0.0001) (Figure 2A, Table 2). In relation
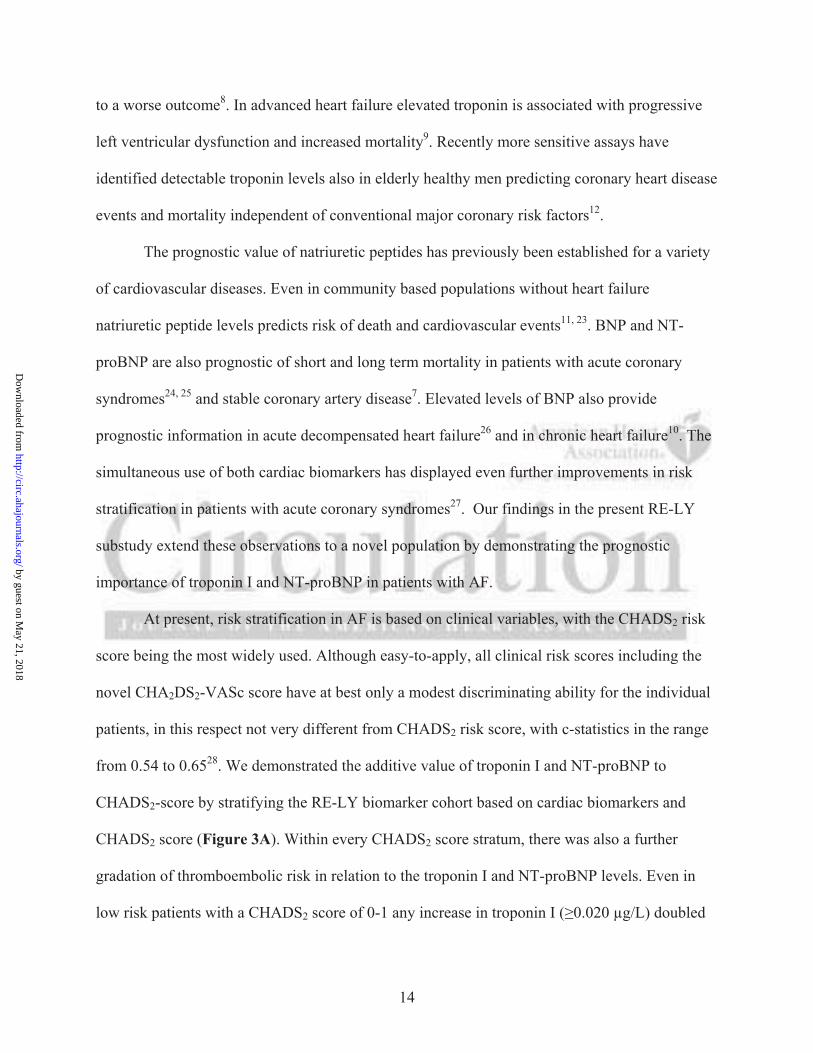
to NT-proBNP the annual rates of vascular death were 0.61% in the lowest NT-proBNP group,
as compared to 5.00% (HR 6.73; 95% CI 3.95-11.49) in the highest NT-proBNP group
(p<0.0001) (Figure 2B, Table 2). The effects of troponin I remained significant (p<0.0001) after
adding NT-proBNP to the multivariable model, as well for NT-proBNP (p<0.0001) adjusted for
troponin I.
One-hundred-fifty-three patients died from non-vascular causes. The rate of non-vascular
mortality was higher among patients with elevated troponin I levels, p=0.0127, but without a
gradual increase by troponin I levels (Table 2). There was no significant association between
NT-proBNP levels and non-vascular death.
Myocardial infarction
There were 103 myocardial infarctions during follow-up. The annual rates were 0.49% in the
group with undetectable troponin I and 1.69% (HR 3.04; 95% CI 1.64-5.64) in the highest
troponin I group (p=0.0052) (Table 2). The association of troponin I and myocardial infarctions
remained significant after adding NT-proBNP to the model. There was no significant relation
between NT-proBNP levels and myocardial infarctions.
Composite thromboembolic endpoint
There were 482 composite thromboembolic events (ischemic stroke, systemic embolism,
pulmonary embolism, myocardial infarction and vascular death excluding hemorrhagic death). In
the group with undetectable troponin the annual rates of the composite thromboembolic endpoint
by guest on May 21, 2018
http://circ.ahajournals.org/D
ownloaded from
11
were 2.00% compared with 8.85% (HR 3.43; 95% CI 2.57-4.56) in the highest troponin I group
(p<0.0001) (Table 2). Concerning NT-proBNP the annual rates of the composite
thromboembolic endpoint were 1.78% in the lowest quartile group of NT-proBNP, as compared
to 6.76% (HR 3.55; 95% CI 2.51-5.02) in the highest NT-proBNP group (p<0.0001) (Table 2).
The effects of troponin I remained significant (p<0.0001) after adding NT-proBNP to the
multivariable model, as well for NT-proBNP (p<0.0001) adjusted for effects of troponin I.
Major bleeding
There were 334 major bleeds. In the group with undetectable troponin I the annual rate of major
bleed was 1.72% compared with 4.38% (HR 2.01; CI 95% 1.39-2.90) in the highest troponin I
group (p=0.0009) (Table 2). There was no significant association between NT-proBNP levels
and major bleeding.
Cardiac biomarkers levels in relation to CHADS2 score
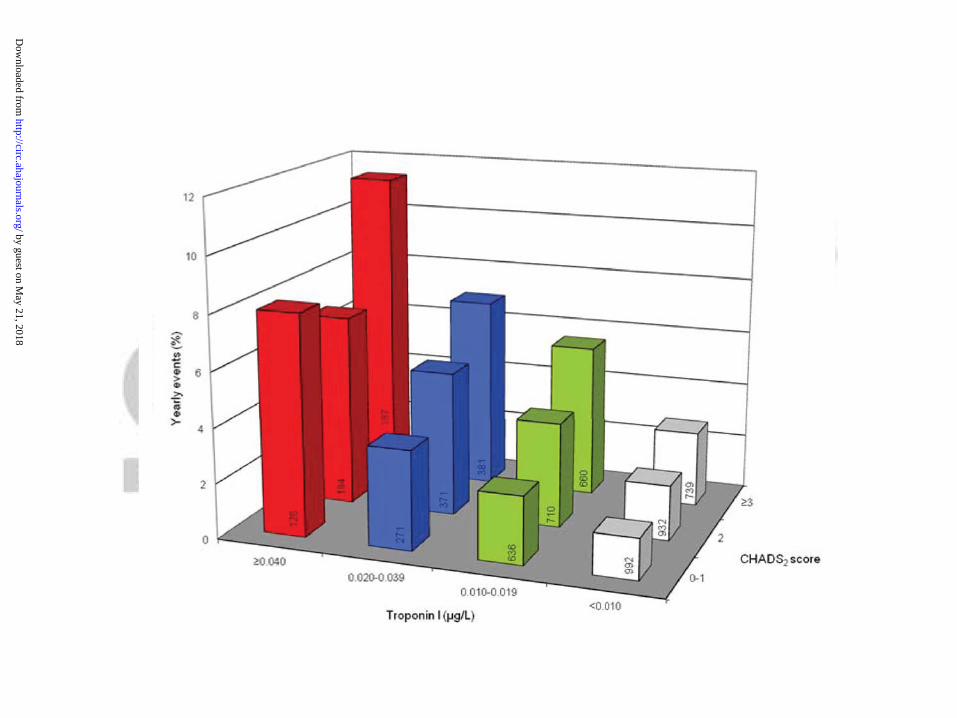
Figure 3A illustrates the annual rates of the composite thromboembolic endpoint according to
troponin I levels and CHADS2 score. The pattern of gradually higher rates of the composite
thromboembolic endpoint concomitant with higher troponin I levels was consistent in all
CHADS2 scores, including the group with CHADS2 scores 0-1. The highest annual rates of the
composite endpoint, 11.4%, were found in the group with CHADS2 3 and highest troponin I
( 0.040 μg/L) compared to the lowest annual risk of 1.48%, in the group with CHADS2 0-1 and
undetectable troponin I (<0.010 μg/L).
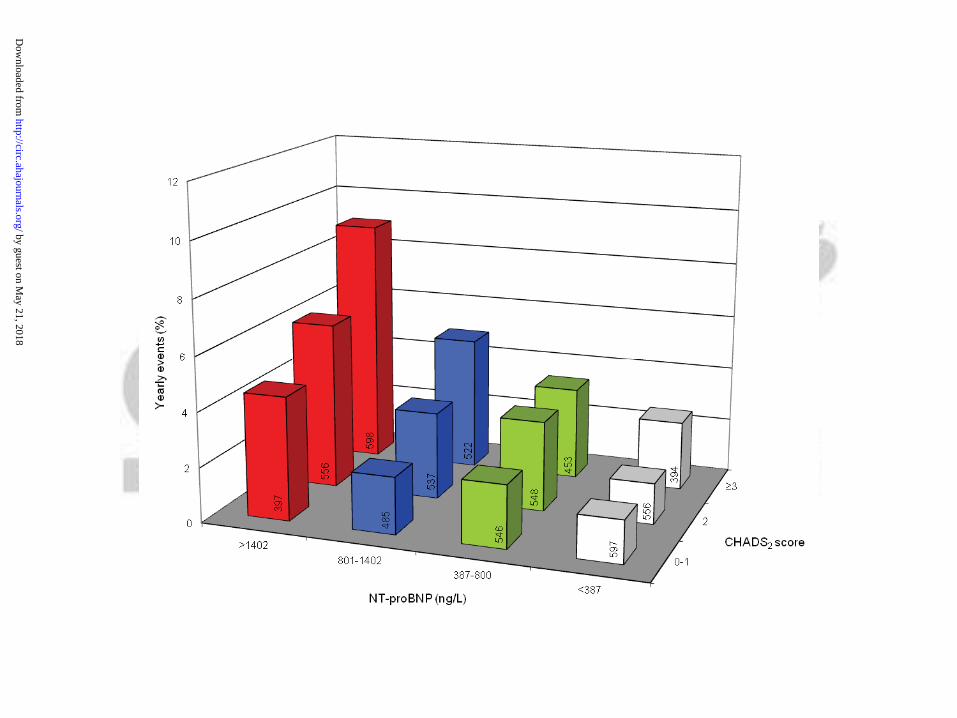
Annual rates of the composite thromboembolic endpoint according to NT-proBNP levels
and CHADS2 score are illustrated in Figure 3B. The general trend of increasing rates of the
composite thromboembolic endpoint with increasing NT-proBNP levels was consistent in all
CHADS2 scores, including the group with CHADS2 scores 0-1. The highest annual rate of the
by guest on May 21, 2018
http://circ.ahajournals.org/D
ownloaded from
12
composite endpoint, 8.99%, was found in the group with CHADS2 3 and highest NT-proBNP
(>1402 ng/L) compared to the lowest yearly risk of 1.55%, in the group with CHADS2 0-1 and
lowest NT-proBNP (<387 ng/L).
Figure 3C illustrates the annual rates of the composite thromboembolic endpoint in
relation to cardiac biomarkers only. The pattern of gradually higher rates of the composite
thromboembolic endpoint is apparent in all biomarker groups, with the highest annual rate of the
composite endpoint, 12,0%, found in patients with highest levels of troponin I ( 0.040 μg/L) in
combination with highest levels of NT-proBNP (>1402 ng/L).
Study treatment and subgroups
For all the above outcomes there were no significant interactions between troponin I or NT-
proBNP groups and effects of study treatment with warfarin or dabigatran 110 mg or 150 mg.
Exploratory analyses of relations between troponin or NT-proBNP levels and outcomes within
subgroups defined by age ( 75; <75 years), sex, regions (North America and Western Europe vs.
others, Asian vs. non-Asian countries), CHADS2 score (0-1; 2; 3-6), prevalent coronary artery
disease vs. no coronary artery disease, or prevalent cardiovascular disease (prior stroke,
prevalent congestive heart failure and/or coronary artery disease) vs. no cardiovascular disease,
yielded similar results as in the total material with no significant interactions (data not shown).
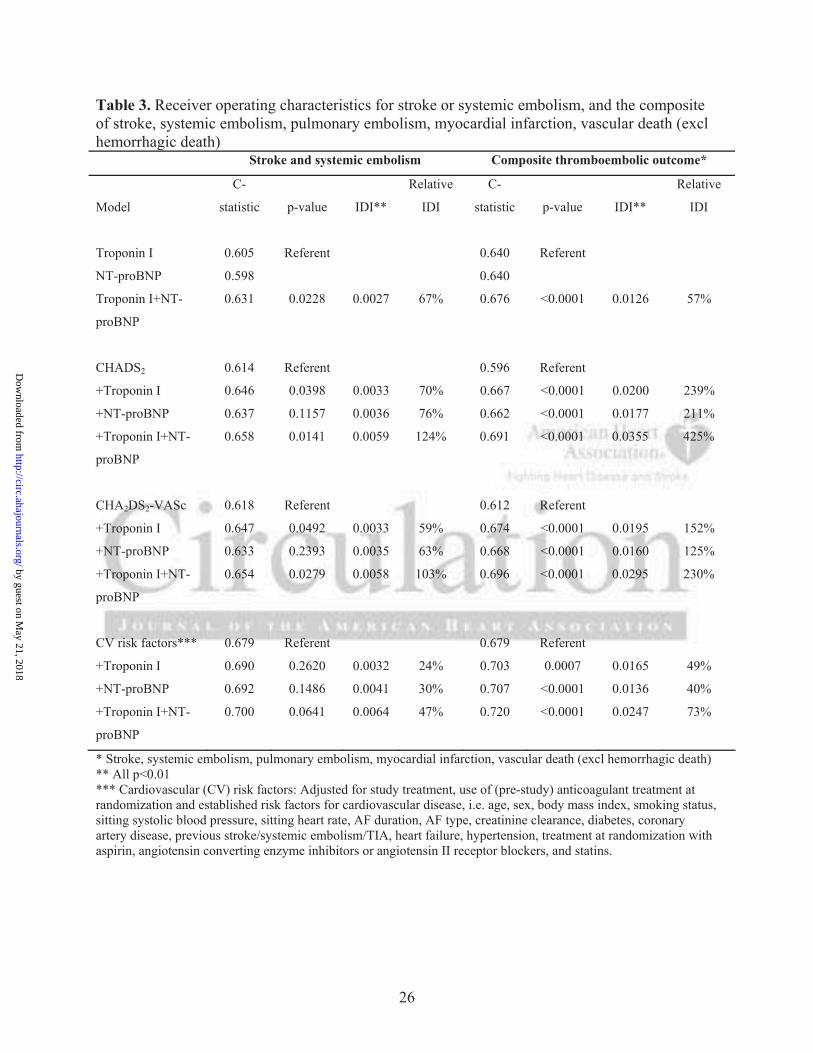
Predictive ability of cardiac biomarkers in atrial fibrillation for thromboembolic events
In this cohort the C-statistic for stroke and systemic embolism was 0.605 for troponin I, 0.598 for
NT-proBNP, and 0.631 when combining the cardiac biomarkers (Table 3). A model based on
the CHADS2 score (model B) yielded a C-statistic of 0.614. The separate addition of each
cardiac biomarker, improved the predictive model significantly, and even further when adding
both cardiac biomarkers to a model simultaneously (Table 3). The integrated discrimination
by guest on May 21, 2018
http://circ.ahajournals.org/D
ownloaded from
13
improvement (IDI) was significant for all models when adding cardiac biomarkers, separately or
combined, with relative IDI ranging from 24% to 124% depending on the model.
For the composite thromboembolic endpoint the C-statistic was 0.639 for troponin I,
0.636 for NT-proBNP, and 0.676 when combining troponin I and NT-proBNP (Table 3). A
model based on the CHADS2 score yielded a C-statistic of 0.590. The separate addition of a
cardiac biomarker, improved the predictive model significantly, and even further when adding
both cardiac biomarkers simultaneously to the model (Table 3). The integrated discrimination
improvement (IDI) was significant for all models when adding cardiac biomarkers, separately or
combined, with relative IDI ranging from 41% to 425% depending on the model.
The improvements in C-statistic and IDI in relation to the CHA2DS2-VASc score (model
C) were similar as with the CHADS2 score (model B) (Table 3).
Discussion
The present RE-LY substudy demonstrated a high prevalence of detectable and elevated troponin
I and considerably elevated NT-proBNP in patients with non-valvular atrial fibrillation and a
raised risk of stroke. The degree of troponin I and NT-proBNP elevations were both
independently related to a raised risk of stroke or systemic embolism, mortality and other
cardiovascular events. The levels of these biomarkers added prognostic information beyond
currently used clinical risk scores, e.g. the CHADS2 or CHA2DS2-VASc risk scores.
Elevation of troponin was initially identified as a sensitive indicator of myocardial
damage and myocardial infarction and also as an indicator of raised risk of reinfarction and
mortality in acute coronary syndromes patients5, 6, 22. At a later stage slight elevations of troponin
were observed in a proportion of patients with stable coronary artery disease and also associated
by guest on May 21, 2018
http://circ.ahajournals.org/D
ownloaded from
14
to a worse outcome8. In advanced heart failure elevated troponin is associated with progressive
left ventricular dysfunction and increased mortality9. Recently more sensitive assays have
identified detectable troponin levels also in elderly healthy men predicting coronary heart disease
events and mortality independent of conventional major coronary risk factors12.
The prognostic value of natriuretic peptides has previously been established for a variety
of cardiovascular diseases. Even in community based populations without heart failure
natriuretic peptide levels predicts risk of death and cardiovascular events11, 23. BNP and NT-
proBNP are also prognostic of short and long term mortality in patients with acute coronary
syndromes24, 25 and stable coronary artery disease7. Elevated levels of BNP also provide
prognostic information in acute decompensated heart failure26 and in chronic heart failure10. The
simultaneous use of both cardiac biomarkers has displayed even further improvements in risk
stratification in patients with acute coronary syndromes27. Our findings in the present RE-LY
substudy extend these observations to a novel population by demonstrating the prognostic
importance of troponin I and NT-proBNP in patients with AF.
At present, risk stratification in AF is based on clinical variables, with the CHADS2 risk
score being the most widely used. Although easy-to-apply, all clinical risk scores including the
novel CHA2DS2-VASc score have at best only a modest discriminating ability for the individual
patients, in this respect not very different from CHADS2 risk score, with c-statistics in the range
from 0.54 to 0.6528. We demonstrated the additive value of troponin I and NT-proBNP to
CHADS2-score by stratifying the RE-LY biomarker cohort based on cardiac biomarkers and
CHADS2 score (Figure 3A). Within every CHADS2 score stratum, there was also a further
gradation of thromboembolic risk in relation to the troponin I and NT-proBNP levels. Even in
low risk patients with a CHADS2 score of 0-1 any increase in troponin I ( 0.020 μg/L) doubled
by guest on May 21, 2018
http://circ.ahajournals.org/D
ownloaded from
15
the risk, and highly elevated troponin I levels ( 0.040 μg/L) raised the risk by a 5-fold
surpassing the annual risk of patients with a CHADS2 score of 2 and undetectable troponin I
levels. The incremental information from NT-proBNP levels was similar, with a more than 2.5-
fold increase in risk when comparing patients with the highest and lowest quartiles of NT-
proBNP within the group of patients with CHADS2 score of 0-1 (Figure 3B). The significantly
improved C-statistics and IDI support the improvement of risk prediction of thromboembolic
events when adding cardiac biomarkers to the CHADS2 and the CHA2DS2-VASc risk scores.
A CHADS2 score equal or above 2 is currently the generally accepted indication for
treatment with oral anticoagulants in AF patients29. Therefore it is noteworthy that in the present
population, a group with low CHADS2 score of 0-1 and elevated levels of any or both of these
cardiac biomarkers had a higher annual rate of a composite of thromboembolic events than
patients with higher CHADS2 scores and undetectable troponin I and/or low NT-proBNP levels.
Conversely patients without elevated cardiac biomarkers might have substantially lower risk than
perceived by the CHADS2 score. Similar findings were shown in relation to the novel CHA2DS2-
VASc risk score. Patients with high CHADS2 or CHA2DS2-VASc risk score and elevated cardiac
biomarkers remain at high risk for thromboembolic events despite preventive treatment with
effective oral anticoagulants. Such patients might be considered for intensified pharmacological
treatment with angiotensin converting enzyme inhibitors, angiotensin receptor blockers or
statins, ablation therapy, left atrial appendage closure devices, left atrial volume reduction – and
perhaps also myocardial perfusion stress test or coronary angiogram for further risk stratification
and potential percutaneous coronary interventions.
The results of this study also document an association between elevated troponin I levels
and risk of major bleeding. In AF several of the variables in scores for estimating stroke risk are
by guest on May 21, 2018
http://circ.ahajournals.org/D
ownloaded from
16
the same components used for assessing bleeding risk30. There are some previous studies in ACS
populations linking peak troponin I levels to subsequent increase of bleeding rate31. The causality
is unknown but elevated troponin I levels might contribute to the identification of a more fragile
AF subpopulation more likely to bleed during anticoagulation. The NT-proBNP levels were not
related to major bleeding risk in the present analysis.
The mechanism for the prognostic value of elevated troponin I levels in patients with AF
can currently only be an area for speculation. In ACS troponin levels reflect necrosis of
myocytes as a consequence of myocardial ischemia. In patients with chronic heart failure, stable
coronary disease, apparently healthy elderly individuals, or as in this cohort of stable AF
patients, there might be alternative explanations such as the increased ventricular rate which
might lead to oxygen demand/mismatch and myocardial ischemia, volume and pressure
overload, changes in microvascular blood flow, atrial calcium overload, oxidative stress, or
alterations in tissue structure29, 32, 33. The pathogenesis of thrombi in AF involves poorly
contractile atrium34, hypercoagulable state35 and endothelial dysfunction36. Troponin release in
AF patients may be connected to several of these mechanisms associated with myocardial
dysfunction, apoptosis, inflammation and fibrosis as well in the atrial as ventricular musculature.
The higher proportion of patients with troponin elevation in permanent AF as an indicator of
increased AF burden and a more advanced cardiac disease supports this hypothesis and also the
relation to major bleeding events.
The mechanism for the prognostic value of elevated NT-proBNP levels in AF seems
easier to understand. Elevated natriuretic peptides reflect the myocytes response to increased
wall tension. This is usually seen in settings of left ventricular systolic or diastolic dysfunction,
ventricular hypertrophy37, increasing age and female gender38. An acute coronary syndrome,
by guest on May 21, 2018
http://circ.ahajournals.org/D
ownloaded from
17
renal dysfunction and high output states may cause elevation of NT-proBNP as well39.
Concerning natriuretic peptides in AF, NT-proBNP level is a predictor of future development of
AF, independent of other risk factors including echocardiographic parameters in older adults40.
In accordance with the present results the levels of NT-proBNP have previously been shown to
be elevated in patients with AF, either with or without structural heart disease as compared to
matched controls in sinus rhythm41. Following restoration of sinus rhythm, either by
cardioversion or ablation therapy, levels of natriuretic peptides falls rapidly42, 43. Therefore, there
are arguments for NT-proBNP being of atrial origin in AF44, in contrast to the pathophysiology
of heart failure where it is derived mainly from the ventricles45. Some studies support this by
indicating that atrial stretch is a source of BNP in patients with AF46. The level of natriuretic
peptides in AF may therefore to some extent reflect atrial dysfunction, which is an established
marker of atrial thrombus formation34, and thereby provide a plausible mechanism for the
prognostic importance of elevated NT-proBNP levels and thromboembolic events as shown in
the present study.
There are several limitations of this study. The findings concern a population with non-
valvular AF with at least one risk factor for stroke. In order to extend and apply the results to AF
patients without any clinical stroke risk factors further studies in other AF populations are
warranted. Furthermore the study design, with all study participants receiving oral
anticoagulants, does not allow final conclusions concerning the optimal cut-off value of cardiac
biomarkers as a decision support tool for improved selections of atrial fibrillation patients for
oral anticoagulation. The mechanisms behind the release and origin of NT-proBNP in atrial
fibrillation patients without congestive heart failure need further clarification as well as the exact
mechanisms behind troponin elevations and their relations to events such as stroke and bleeding
by guest on May 21, 2018
http://circ.ahajournals.org/D
ownloaded from
18
in AF. Although the current troponin I assay has shown robust analytical performance in patients
with coronary artery disease and elderly12, 14, newly developed assays with even higher
sensitivity and precision might provide even better identification of patients at increased risk and
with a potential benefit of oral anticoagulation.
Conclusion
Elevated levels of troponin I and NT-proBNP are common in patients with AF and at least one
risk factor for stroke and associated with an increase in the risk for stroke or systemic embolism
and vascular events. The prognostic information from the troponin I and NT-proBNP levels are
independent of and additive to established clinical risk factors such as the CHADS2 and
CHA2DS2-VASc risk scores.
Funding Sources: The RE-LY trial was funded by Boehringer Ingelheim Pharmaceuticals.
Conflict of Interest Disclosures: All authors have completed and submitted the ICMJE Form for Disclosure of Potential Conflicts of Interest. Dr Hijazi reports receiving lecture fees and an institutional research grant from Boehringer-Ingelheim. Dr Oldgren reports receiving consulting and lecture fees, and grant support from Boehringer Ingelheim, and consultant and lecture fees from Bayer and Bristol-Myers Squibb. Ms Andersson reports no conflicts of interest. Dr Connolly reports receiving consulting fees, lecture fees and grant support from Boehringer Ingelheim. Dr Ezekowitz reports receiving consulting fees, lecture fees, and grant support from Boehringer Ingelheim and Aryx Therapeutics; consulting fees from Sanofi-Aventis; and lecture fees and grant support from Portola Pharmaceuticals. Dr Hohnloser reports receiving consulting fees and lecture fees from Boehringer Ingelheim, St Jude medical and Sanofi Aventis, and lecture fees from Cardiome. Dr Reilly is an employee of Boehringer Ingelheim. Dr Vinereanu reports receiving lecture fees and grant support from Boehringer Ingelheim. Dr Siegbahn reports consulting fees, lecture fees and grant support from Boehringer Ingelheim, lecture fees and grants from Eli Lilly and grant support from AstraZeneca. Dr Yusuf reports receiving consulting fees, lecture fees and grant support from Boehringer Ingelheim; and consulting fees from AstraZeneca, Bristol-Myers Squibb, and Sanofi-Aventis. Dr Wallentin reports receiving consulting and lecture fees, honoraria and research grants from Boehringer Ingelheim; research grants from AstraZeneca, Bristol-Myers Squibb, GlaxoSmithKline, and Schering-Plough; honoraria from AstraZeneca, Bristol-Myers Squibb, Eli Lilly, GlaxoSmithKline, and Schering-Plough; consultant fees from Athera Biotechnologies, AstraZeneca, Eli Lilly, GlaxoSmithKline, and Regado Biotechnologies; lecture fees from AstraZeneca and Eli Lilly.
by guest on May 21, 2018
http://circ.ahajournals.org/D
ownloaded from
19
References:
1. Go AS, Hylek EM, Phillips KA, Chang Y, Henault LE, Selby JV, Singer DE. Prevalence of diagnosed atrial fibrillation in adults: National implications for rhythm management and stroke prevention: The anticoagulation and risk factors in atrial fibrillation (atria) study. JAMA. 2001;285:2370-2375. 2. Wolf PA, Abbott RD, Kannel WB. Atrial fibrillation as an independent risk factor for stroke: The framingham study. Stroke. 1991;22:983-988. 3. Gage BF, Waterman AD, Shannon W, Boechler M, Rich MW, Radford MJ. Validation of clinical classification schemes for predicting stroke: Results from the national registry of atrial fibrillation. JAMA. 2001;285:2864-2870. 4. Boomsma F, van den Meiracker AH. Plasma a- and b-type natriuretic peptides: Physiology, methodology and clinical use. Cardiovasc Res. 2001;51:442-449. 5. James SK, Armstrong P, Barnathan E, Califf R, Lindahl B, Siegbahn A, Simoons ML, Topol EJ, Venge P, Wallentin L. Troponin and c-reactive protein have different relations to subsequent mortality and myocardial infarction after acute coronary syndrome: A gusto-iv substudy. J Am Coll Cardiol. 2003;41:916-924. 6. Lindahl B, Toss H, Siegbahn A, Venge P, Wallentin L. Markers of myocardial damage and inflammation in relation to long-term mortality in unstable coronary artery disease. Frisc study group. Fragmin during instability in coronary artery disease. N Engl J Med. 2000;343:1139-1147. 7. Kragelund C, Gronning B, Kober L, Hildebrandt P, Steffensen R. N-terminal pro-b-type natriuretic peptide and long-term mortality in stable coronary heart disease. N Engl J Med. 2005;352:666-675. 8. Omland T, de Lemos JA, Sabatine MS, Christophi CA, Rice MM, Jablonski KA, Tjora S, Domanski MJ, Gersh BJ, Rouleau JL, Pfeffer MA, Braunwald E. A sensitive cardiac troponin t assay in stable coronary artery disease. N Engl J Med. 2009;361:2538-2547. 9. Horwich TB, Patel J, MacLellan WR, Fonarow GC. Cardiac troponin i is associated with impaired hemodynamics, progressive left ventricular dysfunction, and increased mortality rates in advanced heart failure. Circulation. 2003;108:833-838. 10. Tsutamoto T, Wada A, Maeda K, Hisanaga T, Maeda Y, Fukai D, Ohnishi M, Sugimoto Y, Kinoshita M. Attenuation of compensation of endogenous cardiac natriuretic peptide system in chronic heart failure: Prognostic role of plasma brain natriuretic peptide concentration in patients with chronic symptomatic left ventricular dysfunction. Circulation. 1997;96:509-516.
by guest on May 21, 2018
http://circ.ahajournals.org/D
ownloaded from
20
11. Wang TJ, Larson MG, Levy D, Benjamin EJ, Leip EP, Omland T, Wolf PA, Vasan RS. Plasma natriuretic peptide levels and the risk of cardiovascular events and death. N Engl J Med. 2004;350:655-663. 12. Zethelius B, Johnston N, Venge P. Troponin i as a predictor of coronary heart disease and mortality in 70-year-old men: A community-based cohort study. Circulation. 2006;113:1071-1078. 13. Connolly SJ, Ezekowitz MD, Yusuf S, Eikelboom J, Oldgren J, Parekh A, Pogue J, Reilly PA, Themeles E, Varrone J, Wang S, Alings M, Xavier D, Zhu J, Diaz R, Lewis BS, Darius H, Diener HC, Joyner CD, Wallentin L. Dabigatran versus warfarin in patients with atrial fibrillation. N Engl J Med. 2009;361:1139-1151. 14. Eggers KM, Lagerqvist B, Venge P, Wallentin L, Lindahl B. Persistent cardiac troponin i elevation in stabilized patients after an episode of acute coronary syndrome predicts long-term mortality. Circulation. 2007;116:1907-1914. 15. Uettwiller-Geiger D, Wu AH, Apple FS, Jevans AW, Venge P, Olson MD, Darte C, Woodrum DL, Roberts S, Chan S. Multicenter evaluation of an automated assay for troponin i. Clinical chemistry. 2002;48:869-876. 16. Johnston N, Jernberg T, Lindahl B, Lindback J, Stridsberg M, Larsson A, Venge P, Wallentin L. Biochemical indicators of cardiac and renal function in a healthy elderly population. Clin Biochem. 2004;37:210-216. 17. Yeo KT, Wu AH, Apple FS, Kroll MH, Christenson RH, Lewandrowski KB, Sedor FA, Butch AW. Multicenter evaluation of the roche nt-probnp assay and comparison to the biosite triage bnp assay. Clin Chim Acta. 2003;338:107-115. 18. Venge P, Lagerqvist B, Diderholm E, Lindahl B, Wallentin L. Clinical performance of three cardiac troponin assays in patients with unstable coronary artery disease (a frisc ii substudy). AmJ Cardiol. 2002;89:1035-1041. 19. DeLong ER, DeLong DM, Clarke-Pearson DL. Comparing the areas under two or more correlated receiver operating characteristic curves: A nonparametric approach. Biometrics. 1988;44:837-845. 20. Pencina MJ, D'Agostino RB, Sr., D'Agostino RB, Jr., Vasan RS. Evaluating the added predictive ability of a new marker: From area under the roc curve to reclassification and beyond. Stat Med. 2008;27:157-172; discussion 207-112. 21. Pencina MJ, Sr RBDA, Jr RBDA, Vasan RS. Comments on ‘integrated discrimination and net reclassification improvements—practical advice’. Statistics in Medicine. 2008;27:207-212. 22. Antman EM, Tanasijevic MJ, Thompson B, Schactman M, McCabe CH, Cannon CP, Fischer GA, Fung AY, Thompson C, Wybenga D, Braunwald E. Cardiac-specific troponin i levels to
by guest on May 21, 2018
http://circ.ahajournals.org/D
ownloaded from
21
predict the risk of mortality in patients with acute coronary syndromes. N Engl J Med. 1996;335:1342-1349. 23. Zethelius B, Berglund L, Sundstrom J, Ingelsson E, Basu S, Larsson A, Venge P, Arnlov J. Use of multiple biomarkers to improve the prediction of death from cardiovascular causes. NEngl J Med. 2008;358:2107-2116. 24. de Lemos JA, Morrow DA, Bentley JH, Omland T, Sabatine MS, McCabe CH, Hall C, Cannon CP, Braunwald E. The prognostic value of b-type natriuretic peptide in patients with acute coronary syndromes. N Engl J Med. 2001;345:1014-1021. 25. James SK, Lindahl B, Siegbahn A, Stridsberg M, Venge P, Armstrong P, Barnathan ES, Califf R, Topol EJ, Simoons ML, Wallentin L. N-terminal pro-brain natriuretic peptide and other risk markers for the separate prediction of mortality and subsequent myocardial infarction in patients with unstable coronary artery disease: A global utilization of strategies to open occluded arteries (gusto)-iv substudy. Circulation. 2003;108:275-281. 26. Fonarow GC, Peacock WF, Phillips CO, Givertz MM, Lopatin M. Admission b-type natriuretic peptide levels and in-hospital mortality in acute decompensated heart failure. J Am Coll Cardiol. 2007;49:1943-1950. 27. Sabatine MS, Morrow DA, de Lemos JA, Gibson CM, Murphy SA, Rifai N, McCabe C, Antman EM, Cannon CP, Braunwald E. Multimarker approach to risk stratification in non-st elevation acute coronary syndromes: Simultaneous assessment of troponin i, c-reactive protein, and b-type natriuretic peptide. Circulation. 2002;105:1760-1763. 28. Lip GY, Nieuwlaat R, Pisters R, Lane DA, Crijns HJ. Refining clinical risk stratification for predicting stroke and thromboembolism in atrial fibrillation using a novel risk factor-based approach: The euro heart survey on atrial fibrillation. Chest. 2010;137:263-272. 29. Camm AJ, Kirchhof P, Lip GY, Schotten U, Savelieva I, Ernst S, Van Gelder IC, Al-Attar N, Hindricks G, Prendergast B, Heidbuchel H, Alfieri O, Angelini A, Atar D, Colonna P, De Caterina R, De Sutter J, Goette A, Gorenek B, Heldal M, Hohloser SH, Kolh P, Le Heuzey JY, Ponikowski P, Rutten FH, Vahanian A, Auricchio A, Bax J, Ceconi C, Dean V, Filippatos G, Funck-Brentano C, Hobbs R, Kearney P, McDonagh T, Popescu BA, Reiner Z, Sechtem U, Sirnes PA, Tendera M, Vardas PE, Widimsky P, Agladze V, Aliot E, Balabanski T, Blomstrom-Lundqvist C, Capucci A, Crijns H, Dahlof B, Folliguet T, Glikson M, Goethals M, Gulba DC, Ho SY, Klautz RJ, Kose S, McMurray J, Perrone Filardi P, Raatikainen P, Salvador MJ, Schalij MJ, Shpektor A, Sousa J, Stepinska J, Uuetoa H, Zamorano JL, Zupan I. Guidelines for the management of atrial fibrillation: The task force for the management of atrial fibrillation of the european society of cardiology (esc). Eur Heart J. 2010;31:2369-2429. 30. Pisters R, Lane DA, Nieuwlaat R, de Vos CB, Crijns HJ, Lip GY. A novel user-friendly score (has-bled) to assess one-year risk of major bleeding in atrial fibrillation patients: The euro heart survey. Chest. 2010:1093-1100.
by guest on May 21, 2018
http://circ.ahajournals.org/D
ownloaded from
22
31. Al-Mallah M, Bazari RN, Jankowski M, Hudson MP. Predictors and outcomes associated with gastrointestinal bleeding in patients with acute coronary syndromes. J Thromb Thrombolysis. 2007;23:51-55. 32. Eggers KM, Lind L, Ahlstrom H, Bjerner T, Ebeling Barbier C, Larsson A, Venge P, Lindahl B. Prevalence and pathophysiological mechanisms of elevated cardiac troponin i levels in a population-based sample of elderly subjects. Eur Heart J. 2008;29:2252-2258. 33. Jeremias A, Gibson CM. Narrative review: Alternative causes for elevated cardiac troponin levels when acute coronary syndromes are excluded. Ann Intern Med. 2005;142:786-791. 34. The Stroke Prevention in Atrial Fibrillation Investigators Committee on Echocardiography. Transesophageal echocardiographic correlates of thromboembolism in high-risk patients with nonvalvular atrial fibrillation. The stroke prevention in atrial fibrillation investigators committee on echocardiography. Ann Intern Med. 1998;128:639-647. 35. Asakura H, Hifumi S, Jokaji H, Saito M, Kumabashiri I, Uotani C, Morishita E, Yamazaki M, Shibata K, Mizuhashi K. Prothrombin fragment f1 + 2 and thrombin-antithrombin iii complex are useful markers of the hypercoagulable state in atrial fibrillation. Blood Coagul Fibrinolysis. 1992;3:469-473. 36. Conway DS, Pearce LA, Chin BS, Hart RG, Lip GY. Plasma von willebrand factor and soluble p-selectin as indices of endothelial damage and platelet activation in 1321 patients with nonvalvular atrial fibrillation: Relationship to stroke risk factors. Circulation. 2002;106:1962-1967. 37. Braunwald E. Biomarkers in heart failure. N Engl J Med. 2008;358:2148-2159. 38. Redfield MM, Rodeheffer RJ, Jacobsen SJ, Mahoney DW, Bailey KR, Burnett JC, Jr. Plasma brain natriuretic peptide concentration: Impact of age and gender. J Am Coll Cardiol. 2002;40:976-982. 39. Daniels LB, Maisel AS. Natriuretic peptides. J Am Coll Cardiol. 2007;50:2357-2368. 40. Patton KK, Ellinor PT, Heckbert SR, Christenson RH, DeFilippi C, Gottdiener JS, Kronmal RA. N-terminal pro-b-type natriuretic peptide is a major predictor of the development of atrial fibrillation: The cardiovascular health study. Circulation. 2009;120:1768-1774. 41. Shelton RJ, Clark AL, Goode K, Rigby AS, Cleland JG. The diagnostic utility of n-terminal pro-b-type natriuretic peptide for the detection of major structural heart disease in patients with atrial fibrillation. Eur Heart J. 2006;27:2353-2361. 42. Wozakowska-Kaplon B. Effect of sinus rhythm restoration on plasma brain natriuretic peptide in patients with atrial fibrillation. Am J Cardiol. 2004;93:1555-1558.
by guest on May 21, 2018
http://circ.ahajournals.org/D
ownloaded from
23
43. Yamada T, Murakami Y, Okada T, Okamoto M, Shimizu T, Toyama J, Yoshida Y, Tsuboi N, Ito T, Muto M, Kondo T, Inden Y, Hirai M, Murohara T. Plasma atrial natriuretic peptide and brain natriuretic peptide levels after radiofrequency catheter ablation of atrial fibrillation. Am J Cardiol. 2006;97:1741-1744. 44. Goetze JP, Friis-Hansen L, Rehfeld JF, Nilsson B, Svendsen JH. Atrial secretion of b-type natriuretic peptide. Eur Heart J. 2006;27:1648-1650. 45. Yasue H, Yoshimura M, Sumida H, Kikuta K, Kugiyama K, Jougasaki M, Ogawa H, Okumura K, Mukoyama M, Nakao K. Localization and mechanism of secretion of b-type natriuretic peptide in comparison with those of a-type natriuretic peptide in normal subjects and patients with heart failure. Circulation. 1994;90:195-203. 46. Inoue S, Murakami Y, Sano K, Katoh H, Shimada T. Atrium as a source of brain natriuretic polypeptide in patients with atrial fibrillation. J Card Fail. 2000;6:92-96.
.
by guest on May 21, 2018
http://circ.ahajournals.org/D
ownloaded from
24
Table 1. Baseline characteristics according to Troponin I and NT-proBNP group. Troponin I NT-proBNP Groups All <0.010 (μg/L) 0.010-0.019 0.020-0.039 0.040 p-value* <387 (ng/L) 387-800 801-1402 >1402 p-value* N in substudy 6189 2663 2006 1023 497 1547 1547 1544 1551 Follow-up time (yrs) Median (25th, 75th pct)
2.20 (1.78, 2.52)
2.22 (1.88, 2.54)
2.25 (1.74, 2.56)
2.08 (1.67, 2.40)
2.10 (1.71, 2.46)
2.17 (1.78, 2.42)
2.23 (1.79, 2.54)
2.23 (1.84, 2.57)
2.19 (1.71, 2.50)
Region West Europe + North America 3512 (56.7) 1553 (58.3) 1175 (58.6) 529 (51.7) 255 (51.3) 872 (56.4) 895 (57.9) 887 (57.4) 858 (55.3)
Age (yrs) Median (25th, 75th pct)
72.0 (67.0, 77.0)
71.0 (66.0, 76.0)
73.0 (67.0, 78.0)
73.0 (67.0, 78.0)
72.0 (65.0, 78.0)
<0.0001
70.0 (65.0, 75.0)
71.0 (66.0, 76.0)
73.0 (67.0, 78.0)
74.0 (68.0, 79.0) <0.0001
Body Mass Index (Kg/m2) Median (25th, 75th pct)
28.1 (25.3, 31.6)
28.2 (25.6, 31.8)
28.1 (25.2, 31.5)
28.0 (25.1, 31.9)
27.6 (24.8, 31.2)
0.0190
28.6 (25.6, 32.0)
28.4 (25.7, 32.0)
27.9 (25.2, 31.6)
27.5 (24.7, 30.8) <0.0001
Male sex, n (%) 3944 (63.7) 1631 (61.2) 1288 (64.2) 685 (67.0) 340 (68.4) 0.0008 965 (62.4) 1056 (68.3) 977 (63.3) 946 (61.0) 0.0002 Current smoker, n (%) 483 (7.8) 202 (7.6) 157 (7.8) 79 (7.7) 45 (9.1) 0.7369 121 (7.8) 132 (8.5) 119 (7.7) 111 (7.2) 0.5589 Systolic Blood Pressure (mmHg), Median (25th, 75th pct)
130.0 (120.0, 144.0)
130.0 (120.0, 142.0)
133.0 (120.0, 145.0)
130.0 (120.0, 145.0)
130.0 (120.0, 140.0) 0.0027 134.0
(122.0, 145.0) 130.0
(120.0, 144.0) 131.0
(120.0, 144.0) 130.0
(120.0, 140.0) <0.0001
Heart Rate Median (25th, 75th pct)
72.0 (62.0, 82.0)
72.0 (63.0, 82.0)
72.0 (62.0, 82.0)
72.0 (63.0, 82.0)
72.0 (62.5, 81.0)
0.9794 65.0 (60.0, 76.0)
73.0 (64.0, 82.0)
75.0 (65.0, 84.0)
75.0 (66.0, 86.0)
<0.0001
AF rhythm at baseline (%) 4519 (73.2) 1867 (70.3) 1490 (74.5) 783 (76.8) 379 (76.4) <0.0001 502 (32.6) 1233 (80.0) 1379 (89.4) 1405 (90.8) <0.0001 Type of AF, n (%) Paroxysmal 1848 (29.9) 871 (32.7) 580 (28.9) 259 (25.3) 138 (27.8) <0.0001 955 (61.7) 373 (24.1) 257 (16.7) 263 (17.0) <0.0001 Persistent 1609 (26.0) 726 (27.3) 474 (23.6) 285 (27.9) 124 (24.9) 325 (21.0) 401 (25.9) 447 (29.0) 436 (28.1) Permanent 2731 (44.1) 1066 (40.0) 951 (47.4) 479 (46.8) 235 (47.3) 267 (17.3) 773 (50.0) 839 (54.4) 852 (54.9) AF duration, n (%) <3 months 1794 (29.0) 756 (28.4) 562 (28.0) 316 (30.9) 160 (32.2) 0.2226 529 (34.2) 396 (25.6) 392 (25.4) 477 (30.8) <0.0001
3 months-2 years 1441 (23.3) 646 (24.3) 461 (23.0) 220 (21.5) 114 (22.9) 393 (25.4) 331 (21.4) 349 (22.6) 368 (23.7) >2 years 2954 (47.7) 1261 (47.4) 983 (49.0) 487 (47.6) 223 (44.9) 625 (40.4) 820 (53.0) 803 (52.0) 706 (45.5)
Heart failure, n (%) 1859 (30.0) 618 (23.2) 588 (29.3) 436 (42.6) 217 (43.7) <0.0001 292 (18.9) 422 (27.3) 473 (30.6) 672 (43.3) <0.0001 Hypertension, n (%) 4852 (78.4) 2112 (79.3) 1575 (78.5) 791 (77.3) 374 (75.3) 0.1773 1273 (82.3) 1207 (78.0) 1193 (77.3) 1179 (76.0) 0.0001 Age 75 years, n (%) 2356 (38.1) 883 (33.2) 838 (41.8) 426 (41.6) 209 (42.1) <0.0001 422 (27.3) 538 (34.8) 660 (42.7) 736 (47.5) <0.0001 Diabetes mellitus, n (%) 1322 (21.4) 519 (19.5) 447 (22.3) 239 (23.4) 117 (23.5) 0.0153 359 (23.2) 335 (21.7) 332 (21.5) 296 (19.1) 0.0456 Previous Stroke/TIA, n (%) 1216 (19.6) 538 (20.2) 387 (19.3) 183 (17.9) 108 (21.7) 0.2560 296 (19.1) 299 (19.3) 293 (19.0) 328 (21.1) 0.3901 CHADS2-score, n (%) 0-1 2025 (32.7) 992 (37.3) 636 (31.7) 271 (26.5) 126 (25.4) <0.0001 597 (38.6) 546 (35.3) 485 (31.4) 397 (25.6) <0.0001 2 2197 (35.5) 932 (35.0) 710 (35.4) 371 (36.3) 184 (37.0) 556 (35.9) 548 (35.4) 537 (34.8) 556 (35.8) 3 1967 (31.8) 739 (27.8) 660 (32.9) 381(37.2) 187 (37.6) 394 (25.5) 453 (29.3) 522 (33.8) 598 (38.6) Prior Myocardial Infarction, n (%) 1078 (17.4) 330 (12.4) 375 (18.7) 241 (23.6) 132 (26.6) <0.0001 190 (12.3) 214 (13.8) 296 (19.2) 378 (24.4) <0.0001 Coronary Artery Disease, n (%) 1540 (24.9) 578 (21.7) 516 (25.7) 293 (28.6) 153 (30.8) <0.0001 315 (20.4) 354 (22.9) 414 (26.8) 457 (29.5) <0.0001 CrCL at baseline [mL/min] (25th-75th prc)
69.0 (54.2, 87.1)
73.4 (58.1, 90.3)
68.1 (53.6, 85.4)
64.3 (50.1, 82.0)
63.1 (49.3, 81.1)
<0.0001 76.4 (61.1, 93.9)
73.2 (57.8, 91.1)
68.3 (54.6, 85.2)
59.0 (46.1, 74.8)
<0.0001
Medications at baseline n (%) ___Aspirin
2214 (35.8)
900 (33.8)
722 (36.0)
394 (38.5)
198 (39.8)
0.0093
587 (37.9)
519 (33.5)
531 (34.4)
577 (37.2)
0.0272
___Beta-blocker 4102 (66.3) 1762 (66.2) 1352 (67.4) 656 (64.1) 332 (66.8) 0.3445 922 (59.6) 968 (62.6) 1070 (69.3) 1142 (73.6) <0.0001 ___ACE inhibitor and/or ARB 4313 (69.7) 1761 (66.1) 1447 (72.1) 737 (72.0) 368 (74.0) <0.0001 1053 (68.1) 1067 (69.0) 1059 (68.6) 1134 (73.1) 0.0081 ___Statin 2670 (43.1) 1198 (45.0) 851(42.4) 409 (40.0) 212 (42.7) 0.0396 704 (45.5) 667 (43.1) 668 (43.3) 631 (40.7) 0.0613 ___Amiodarone 700 (11.3) 296 (11.1) 214 (10.7) 118 (11.5) 72 (14.5) 0.1127 278 (18.0) 173 (11.2) 122 (7.9) 127 (8.2) <0.0001 *The p-value is based on Kruskal-Wallis test for continuous variables and the chi-square test for categorical variables
by guest on May 21, 2018
http://circ.ahajournals.org/D
ownloaded from
25
Table 2. Cox proportional hazards model with troponin I and NT-proBNP at randomization in relation to outcomes.
Outcome Biomarkers Group
Total no of events (% per year) HR(95% CI)
p-value effect of
biomarker level
Addition of cardiac biomarker** HR(95% CI)
p-value effect of
biomarker level
<0.010 48 (0.84) 0.0040 0.0232 0.010-0.019 73 (1.72) 1.79 (1.23-2.59) 1.71 (1.18-2.48) 0.020-0.039 41 (1.99) 1.97 (1.28-3.04) 1.76 (1.13-2.73)
Troponin I group (ug/L)
0.040 21 (2.09) 1.99 (1.17-3.39) 1.68 (0.97-2.89) <387 30 (0.92) 0.0014 0.0112 387-800 40 (1.22) 1.35 (0.80-2.27) 1.29 (0.76-2.17) 801-1402 40 (1.22) 1.31 (0.76-2.27) 1.21 (0.70-2.09)
Stroke and Systemic embolism
NT-proBNP quartile group (ng/L) >1402 73 (2.30) 2.40 (1.41-4.07) 2.09 (1.22-3.58)
<0.010 59 (1.04) <0.0001 <0.0001 0.010-0.019 102 (2.40) 1.94 (1.40-2.69) 1.75 (1.26-2.42) 0.020-0.039 70 (3.39) 2.31 (1.61-3.30) 1.88 (1.31-2.70)
Troponin I group (ug/L)
0.040 66 (6.56) 4.38 (3.05-6.29) 3.20 (2.20-4.65) <387 20 (0.61) <0.0001 <0.0001 387-800 46 (1.40) 2.44 (1.40-4.27) 2.23 (1.27-3.89) 801-1402 72 (2.19) 3.71 (2.15-6.41) 3.19 (1.85-5.52)
Vascular death
NT-proBNP quartile group (ng/L) >1402 159 (5.00) 6.73 (3.95-11.49) 5.07 (2.95-8.71)
<0.010 49 (0.86) 0.0127 0.0150 0.010-0.019 52 (1.22) 1.19 (0.80-1.77) 1.18 (0.79-1.75) 0.020-0.039 42 (2.04) 1.92 (1.25-2.93) 1.87 (1.21-2.88)
Troponin I group (ug/L)
0.040 10 (0.99) 0.89 (0.45-1.77) 0.83 (0.41-1.67) <387 27 (0.83) 0.0767 0.0862 387-800 42 (1.28) 1.31 (0.76-2.24) 1.25 (0.73-2.14) 801-1402 27 (0.82) 0.79 (0.43-1.45) 0.73 (0.40-1.34)
Non-vascular death
NT-proBNP quartile group (ng/L) >1402 57 (1.79) 1.42 (0.80-2.50) 1.30 (0.73-2.30)
<0.010 28 (0.49) 0.0052 0.0122 0.010-0.019 37 (0.87) 1.59 (0.97-2.62) 1.56 (0.95-2.57) 0.020-0.039 21 (1.02) 1.77 (0.99-3.17) 1.72 (0.95-3.09)
Troponin I group (ug/L)
0.040 17 (1.69) 3.04 (1.64-5.64) 2.88 (1.53-5.42) <387 21 (0.64) 0.2383 0.4499 387-800 28 (0.85) 1.72 (0.93-3.18) 1.62 (0.88-3.00) 801-1402 24 (0.73) 1.49 (0.76-2.91) 1.31 (0.66-2.56)
Myocardial infarction
NT-proBNP quartile group (ng/L) >1402 30 (0.94) 1.93 (0.98-3.82) 1.53 (0.76-3.08)
<0.010 114 (2.00) <0.0001 <0.0001 0.010-0.019 167 (3.93) 1.73 (1.36-2.21) 1.63 (1.28-2.08) 0.020-0.039 112 (5.43) 2.11 (1.61-2.76) 1.83 (1.39-2.41)
Troponin I group (ug/L)
0.040 89 (8.85) 3.43 (2.57-4.56) 2.77 (2.06-3.72) <387 58 (1.78) <0.0001 <0.0001 387-800 97 (2.95) 1.78 (1.26-2.53) 1.66 (1.17-2.36) 801-1402 112 (3.40) 2.06 (1.44-2.94) 1.81 (1.26-2.58)
Composite thrombo-embolic outcome*
NT-proBNP quartile group (ng/L) >1402 215 (6.76) 3.55 (2.51-5.02) 2.79 (1.96-3.98)
<0.010 98 (1.72) 0.0009 0.0040 0.010-0.019 125 (2.94) 1.48 (1.13-1.93) 1.45 (1.11-1.90) 0.020-0.039 67 (3.25) 1.50 (1.09-2.07) 1.45 (1.05-2.01)
Troponin I group (ug/L)
0.040 44 (4.38) 2.01 (1.39-2.90) 1.89 (1.30-2.75) <387 66 (2.03) 0.1503 0.5272 387-800 74 (2.25) 1.12 (0.78-1.62) 1.07 (0.74-1.54) 801-1402 80 (2.43) 1.16 (0.79-1.70) 1.07 (0.73-1.57)
Major bleed
NT-proBNP quartile group (ng/L) >1402 114 (3.58) 1.47 (1.01-2.15) 1.28 (0.87-1.88)
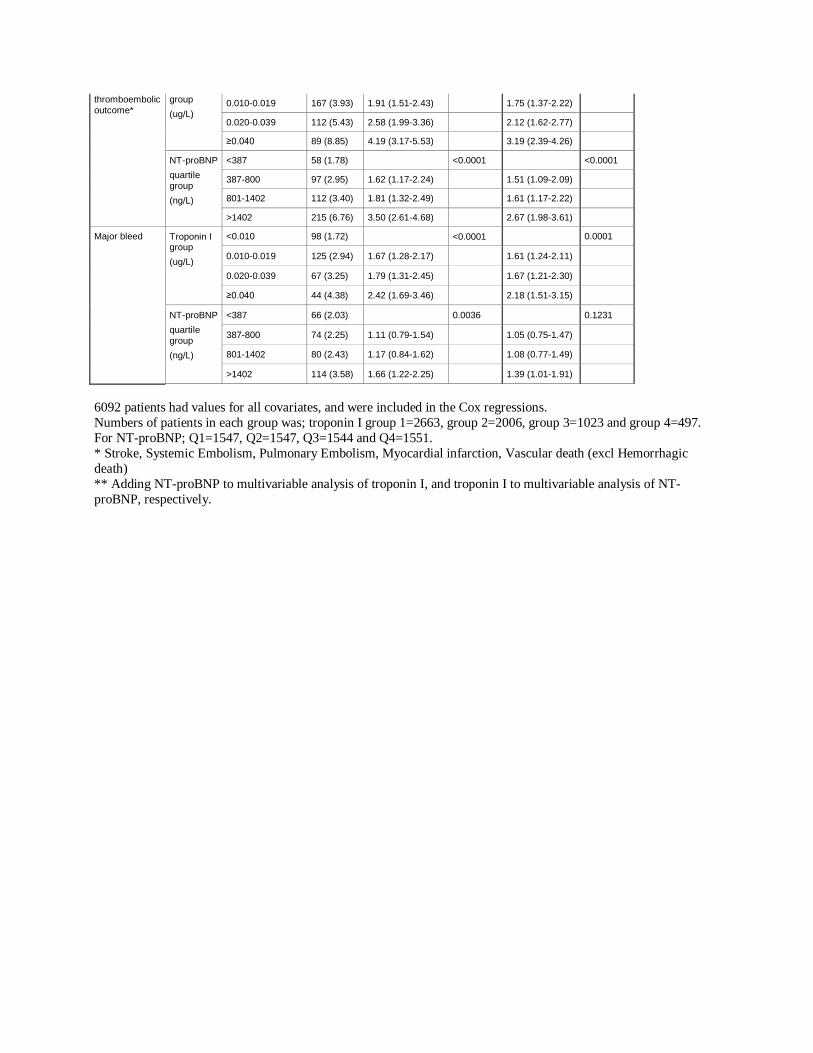
6092 patients had values for all covariates, and were included in the Cox regressions. Numbers of patients in each group was; troponin I group 1=2663, group 2=2006, group 3=1023 and group 4=497. For NT-proBNP; Q1=1547, Q2=1547, Q3=1544 and Q4=1551. * Stroke, Systemic Embolism, Pulmonary Embolism, Myocardial infarction, Vascular death (excl Hemorrhagic death) ** Adding NT-proBNP to multivariable analysis of troponin I, and troponin I to multivariable analysis of NT-proBNP, respectively
by guest on May 21, 2018
http://circ.ahajournals.org/D
ownloaded from
26
Table 3. Receiver operating characteristics for stroke or systemic embolism, and the composite of stroke, systemic embolism, pulmonary embolism, myocardial infarction, vascular death (excl hemorrhagic death)
Stroke and systemic embolism Composite thromboembolic outcome*
Model
C-
statistic p-value IDI**
Relative
IDI
C-
statistic p-value IDI**
Relative
IDI
Troponin I 0.605 Referent 0.640 Referent
NT-proBNP 0.598 0.640
Troponin I+NT-
proBNP
0.631 0.0228 0.0027 67% 0.676 <0.0001 0.0126 57%
CHADS2 0.614 Referent 0.596 Referent
+Troponin I 0.646 0.0398 0.0033 70% 0.667 <0.0001 0.0200 239%
+NT-proBNP 0.637 0.1157 0.0036 76% 0.662 <0.0001 0.0177 211%
+Troponin I+NT-
proBNP
0.658 0.0141 0.0059 124% 0.691 <0.0001 0.0355 425%
CHA2DS2-VASc 0.618 Referent 0.612 Referent
+Troponin I 0.647 0.0492 0.0033 59% 0.674 <0.0001 0.0195 152%
+NT-proBNP 0.633 0.2393 0.0035 63% 0.668 <0.0001 0.0160 125%
+Troponin I+NT-
proBNP
0.654 0.0279 0.0058 103% 0.696 <0.0001 0.0295 230%
CV risk factors*** 0.679 Referent 0.679 Referent
+Troponin I 0.690 0.2620 0.0032 24% 0.703 0.0007 0.0165 49%
+NT-proBNP 0.692 0.1486 0.0041 30% 0.707 <0.0001 0.0136 40%
+Troponin I+NT-
proBNP
0.700 0.0641 0.0064 47% 0.720 <0.0001 0.0247 73%
* Stroke, systemic embolism, pulmonary embolism, myocardial infarction, vascular death (excl hemorrhagic death) ** All p<0.01 *** Cardiovascular (CV) risk factors: Adjusted for study treatment, use of (pre-study) anticoagulant treatment at randomization and established risk factors for cardiovascular disease, i.e. age, sex, body mass index, smoking status, sitting systolic blood pressure, sitting heart rate, AF duration, AF type, creatinine clearance, diabetes, coronary artery disease, previous stroke/systemic embolism/TIA, heart failure, hypertension, treatment at randomization with aspirin, angiotensin converting enzyme inhibitors or angiotensin II receptor blockers, and statins.
by guest on May 21, 2018
http://circ.ahajournals.org/D
ownloaded from
27
Figure Legends:
Figure 1. Cumulative hazard rates for stroke or systemic embolism, according to A. Troponin I
levels at randomization, B. NT-proBNP levels at randomization.
Figure 2. Cumulative hazard rates for vascular death, according to A. Troponin I levels at
randomization, B. NT-proBNP levels at randomization.
Figure 3. Stroke, Systemic Embolism, Pulmonary Embolism, Myocardial infarction, Vascular
death (excl Hemorrhagic death) in relation to A. Troponin I levels and CHADS2 scores, B. NT-
proBNP levels and CHADS2-scores, C. Troponin I and NT-proBNP levels. Total number of
patients given in each bar.
by guest on May 21, 2018
http://circ.ahajournals.org/D
ownloaded from
Cum
ulat
ive
Haz
ard
Rat
e
0.00
0.01
0.02
0.03
0.04
0.05
0.06
0.07
Months0 6 12 18 24 30
Numbers at Risk266320061023
497
26391969
989476
25981925
958459
23821711
835411
17151269
593286
701543212117
0.040 μg/L0.020-0.039 μg/L0.010-0.019 μg/L<0.010 μg/L
<0.010 ug/L0.010-0.019 ug/L0.020-0.039 ug/L0.040 ug/L
by guest on May 21, 2018
http://circ.ahajournals.org/D
ownloaded from
Cum
ulat
ive
Haz
ard
Rat
e
0.00
0.01
0.02
0.03
0.04
0.05
0.06
0.07
Months0 6 12 18 24 30
Numbers at Risk<387 ng/L387-800 ng/L801-1402 ng/L>1402 ng/L
1539152815161490
1522150014861432
1371134213521274
959975996933
347411430385
>1402 ng/L801-1402 ng/L387-800 ng/L<387 ng/L
1547154715441551
by guest on May 21, 2018
http://circ.ahajournals.org/D
ownloaded from
Cum
ulat
ive
Haz
ard
Rat
e
0.00
0.05
0.10
0.15
0.20
Months0 6 12 18 24 30
Numbers at Risk266320061023
497
26481985
994480
26181947
970464
24071736
853420
17381292
612291
714558217120
0.040 μg/L0.020-0.039 μg/L0.010-0.019 μg/L<0.010 μg/L
<0.010 ug/L0.010-0.019 ug/L0.020-0.039 ug/L0.040 ug/L
by guest on May 21, 2018
http://circ.ahajournals.org/D
ownloaded from
Cum
ulat
ive
Haz
ard
Rat
e
0.00
0.05
0.10
0.15
0.20
Months0 6 12 18 24 30
Numbers at Risk1547154715441551
1543153515251504
1533151315021451
1385136313671301
970995
1010958
352423436398
>1402 ng/L801-1402 ng/L387-800 ng/L<387 ng/L
<387 ng/L387-800 ng/L801-1402 ng/L>1402 ng/L
by guest on May 21, 2018
http://circ.ahajournals.org/D
ownloaded from
Hohnloser, Paul A. Reilly, Dragos Vinereanu, Agneta Siegbahn, Salim Yusuf and Lars WallentinZiad Hijazi, Jonas Oldgren, Ulrika Andersson, Stuart J. Connolly, Michael D. Ezekowitz, Stefan H.
Atrial Fibrillation: A RELY SubstudyCardiac Biomarkers are Associated with an Increased Risk of Stroke and Death in Patients with
Print ISSN: 0009-7322. Online ISSN: 1524-4539 Copyright © 2012 American Heart Association, Inc. All rights reserved.
is published by the American Heart Association, 7272 Greenville Avenue, Dallas, TX 75231Circulation published online February 28, 2012;Circulation.
http://circ.ahajournals.org/content/early/2012/02/28/CIRCULATIONAHA.111.038729World Wide Web at:
The online version of this article, along with updated information and services, is located on the
http://circ.ahajournals.org/content/suppl/2012/02/28/CIRCULATIONAHA.111.038729.DC1Data Supplement (unedited) at:
http://circ.ahajournals.org//subscriptions/
is online at: Circulation Information about subscribing to Subscriptions:
http://www.lww.com/reprints Information about reprints can be found online at: Reprints:
document. Permissions and Rights Question and Answer available in the
Permissions in the middle column of the Web page under Services. Further information about this process isOnce the online version of the published article for which permission is being requested is located, click Request
can be obtained via RightsLink, a service of the Copyright Clearance Center, not the Editorial Office.Circulation Requests for permissions to reproduce figures, tables, or portions of articles originally published inPermissions:
by guest on May 21, 2018
http://circ.ahajournals.org/D
ownloaded from
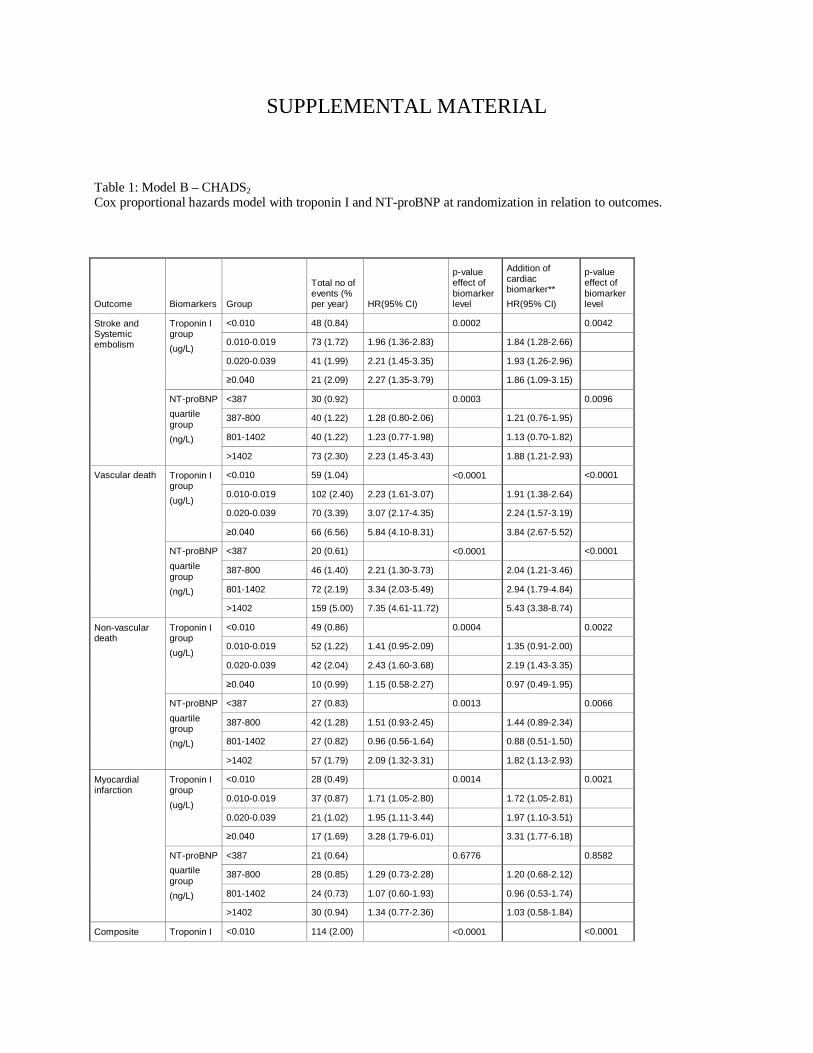
SUPPLEMENTAL MATERIAL Table 1: Model B – CHADS2 Cox proportional hazards model with troponin I and NT-proBNP at randomization in relation to outcomes.
Outcome Biomarkers Group
Total no of events (% per year) HR(95% CI)
p-value effect of biomarker level
Addition of cardiac biomarker** HR(95% CI)
p-value effect of biomarker level
Stroke and Systemic embolism
Troponin I group (ug/L)
<0.010 48 (0.84) 0.0002 0.0042
0.010-0.019 73 (1.72) 1.96 (1.36-2.83) 1.84 (1.28-2.66)
0.020-0.039 41 (1.99) 2.21 (1.45-3.35) 1.93 (1.26-2.96)
≥0.040 21 (2.09) 2.27 (1.35-3.79) 1.86 (1.09-3.15)
NT-proBNP quartile group (ng/L)
<387 30 (0.92) 0.0003 0.0096
387-800 40 (1.22) 1.28 (0.80-2.06) 1.21 (0.76-1.95)
801-1402 40 (1.22) 1.23 (0.77-1.98) 1.13 (0.70-1.82)
>1402 73 (2.30) 2.23 (1.45-3.43) 1.88 (1.21-2.93)
Vascular death Troponin I group (ug/L)
<0.010 59 (1.04) <0.0001 <0.0001
0.010-0.019 102 (2.40) 2.23 (1.61-3.07) 1.91 (1.38-2.64)
0.020-0.039 70 (3.39) 3.07 (2.17-4.35) 2.24 (1.57-3.19)
≥0.040 66 (6.56) 5.84 (4.10-8.31) 3.84 (2.67-5.52)
NT-proBNP quartile group (ng/L)
<387 20 (0.61) <0.0001 <0.0001
387-800 46 (1.40) 2.21 (1.30-3.73) 2.04 (1.21-3.46)
801-1402 72 (2.19) 3.34 (2.03-5.49) 2.94 (1.79-4.84)
>1402 159 (5.00) 7.35 (4.61-11.72) 5.43 (3.38-8.74)
Non-vascular death
Troponin I group (ug/L)
<0.010 49 (0.86) 0.0004 0.0022
0.010-0.019 52 (1.22) 1.41 (0.95-2.09) 1.35 (0.91-2.00)
0.020-0.039 42 (2.04) 2.43 (1.60-3.68) 2.19 (1.43-3.35)
≥0.040 10 (0.99) 1.15 (0.58-2.27) 0.97 (0.49-1.95)
NT-proBNP quartile group (ng/L)
<387 27 (0.83) 0.0013 0.0066
387-800 42 (1.28) 1.51 (0.93-2.45) 1.44 (0.89-2.34)
801-1402 27 (0.82) 0.96 (0.56-1.64) 0.88 (0.51-1.50)
>1402 57 (1.79) 2.09 (1.32-3.31) 1.82 (1.13-2.93)
Myocardial infarction
Troponin I group (ug/L)
<0.010 28 (0.49) 0.0014 0.0021
0.010-0.019 37 (0.87) 1.71 (1.05-2.80) 1.72 (1.05-2.81)
0.020-0.039 21 (1.02) 1.95 (1.11-3.44) 1.97 (1.10-3.51)
≥0.040 17 (1.69) 3.28 (1.79-6.01) 3.31 (1.77-6.18)
NT-proBNP quartile group (ng/L)
<387 21 (0.64) 0.6776 0.8582
387-800 28 (0.85) 1.29 (0.73-2.28) 1.20 (0.68-2.12)
801-1402 24 (0.73) 1.07 (0.60-1.93) 0.96 (0.53-1.74)
>1402 30 (0.94) 1.34 (0.77-2.36) 1.03 (0.58-1.84)
Composite Troponin I <0.010 114 (2.00) <0.0001 <0.0001
6092 patients had values for all covariates, and were included in the Cox regressions. Numbers of patients in each group was; troponin I group 1=2663, group 2=2006, group 3=1023 and group 4=497. For NT-proBNP; Q1=1547, Q2=1547, Q3=1544 and Q4=1551. * Stroke, Systemic Embolism, Pulmonary Embolism, Myocardial infarction, Vascular death (excl Hemorrhagic death) ** Adding NT-proBNP to multivariable analysis of troponin I, and troponin I to multivariable analysis of NT-proBNP, respectively.
thromboembolic outcome*
group (ug/L)
0.010-0.019 167 (3.93) 1.91 (1.51-2.43) 1.75 (1.37-2.22)
0.020-0.039 112 (5.43) 2.58 (1.99-3.36) 2.12 (1.62-2.77)
≥0.040 89 (8.85) 4.19 (3.17-5.53) 3.19 (2.39-4.26)
NT-proBNP quartile group (ng/L)
<387 58 (1.78) <0.0001 <0.0001
387-800 97 (2.95) 1.62 (1.17-2.24) 1.51 (1.09-2.09)
801-1402 112 (3.40) 1.81 (1.32-2.49) 1.61 (1.17-2.22)
>1402 215 (6.76) 3.50 (2.61-4.68) 2.67 (1.98-3.61)
Major bleed Troponin I group (ug/L)
<0.010 98 (1.72) <0.0001 0.0001
0.010-0.019 125 (2.94) 1.67 (1.28-2.17) 1.61 (1.24-2.11)
0.020-0.039 67 (3.25) 1.79 (1.31-2.45) 1.67 (1.21-2.30)
≥0.040 44 (4.38) 2.42 (1.69-3.46) 2.18 (1.51-3.15)
NT-proBNP quartile group (ng/L)
<387 66 (2.03) 0.0036 0.1231
387-800 74 (2.25) 1.11 (0.79-1.54) 1.05 (0.75-1.47)
801-1402 80 (2.43) 1.17 (0.84-1.62) 1.08 (0.77-1.49)
>1402 114 (3.58) 1.66 (1.22-2.25) 1.39 (1.01-1.91)
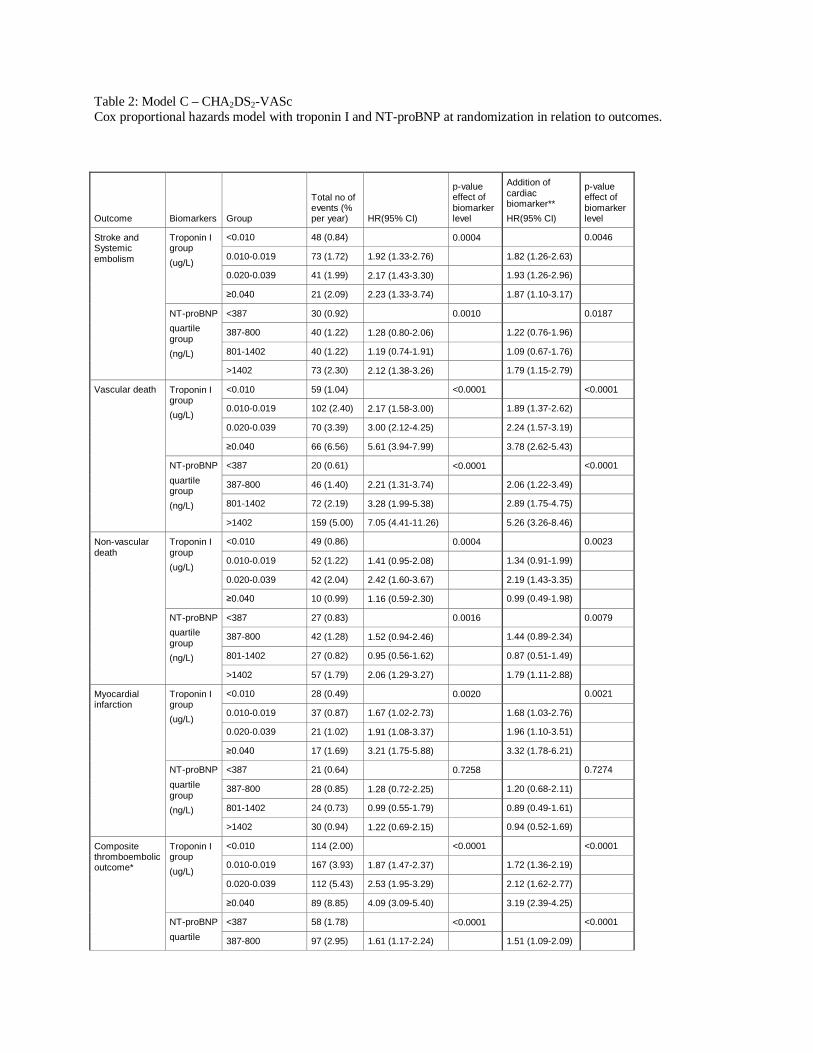
Table 2: Model C – CHA2DS2-VASc Cox proportional hazards model with troponin I and NT-proBNP at randomization in relation to outcomes.
Outcome Biomarkers Group
Total no of events (% per year) HR(95% CI)
p-value effect of biomarker level
Addition of cardiac biomarker** HR(95% CI)
p-value effect of biomarker level
Stroke and Systemic embolism
Troponin I group (ug/L)
<0.010 48 (0.84) 0.0004 0.0046
0.010-0.019 73 (1.72) 1.92 (1.33-2.76) 1.82 (1.26-2.63)
0.020-0.039 41 (1.99) 2.17 (1.43-3.30) 1.93 (1.26-2.96)
≥0.040 21 (2.09) 2.23 (1.33-3.74) 1.87 (1.10-3.17)
NT-proBNP quartile group (ng/L)
<387 30 (0.92) 0.0010 0.0187
387-800 40 (1.22) 1.28 (0.80-2.06) 1.22 (0.76-1.96)
801-1402 40 (1.22) 1.19 (0.74-1.91) 1.09 (0.67-1.76)
>1402 73 (2.30) 2.12 (1.38-3.26) 1.79 (1.15-2.79)
Vascular death Troponin I group (ug/L)
<0.010 59 (1.04) <0.0001 <0.0001
0.010-0.019 102 (2.40) 2.17 (1.58-3.00) 1.89 (1.37-2.62)
0.020-0.039 70 (3.39) 3.00 (2.12-4.25) 2.24 (1.57-3.19)
≥0.040 66 (6.56) 5.61 (3.94-7.99) 3.78 (2.62-5.43)
NT-proBNP quartile group (ng/L)
<387 20 (0.61) <0.0001 <0.0001
387-800 46 (1.40) 2.21 (1.31-3.74) 2.06 (1.22-3.49)
801-1402 72 (2.19) 3.28 (1.99-5.38) 2.89 (1.75-4.75)
>1402 159 (5.00) 7.05 (4.41-11.26) 5.26 (3.26-8.46)
Non-vascular death
Troponin I group (ug/L)
<0.010 49 (0.86) 0.0004 0.0023
0.010-0.019 52 (1.22) 1.41 (0.95-2.08) 1.34 (0.91-1.99)
0.020-0.039 42 (2.04) 2.42 (1.60-3.67) 2.19 (1.43-3.35)
≥0.040 10 (0.99) 1.16 (0.59-2.30) 0.99 (0.49-1.98)
NT-proBNP quartile group (ng/L)
<387 27 (0.83) 0.0016 0.0079
387-800 42 (1.28) 1.52 (0.94-2.46) 1.44 (0.89-2.34)
801-1402 27 (0.82) 0.95 (0.56-1.62) 0.87 (0.51-1.49)
>1402 57 (1.79) 2.06 (1.29-3.27) 1.79 (1.11-2.88)
Myocardial infarction
Troponin I group (ug/L)
<0.010 28 (0.49) 0.0020 0.0021
0.010-0.019 37 (0.87) 1.67 (1.02-2.73) 1.68 (1.03-2.76)
0.020-0.039 21 (1.02) 1.91 (1.08-3.37) 1.96 (1.10-3.51)
≥0.040 17 (1.69) 3.21 (1.75-5.88) 3.32 (1.78-6.21)
NT-proBNP quartile group (ng/L)
<387 21 (0.64) 0.7258 0.7274
387-800 28 (0.85) 1.28 (0.72-2.25) 1.20 (0.68-2.11)
801-1402 24 (0.73) 0.99 (0.55-1.79) 0.89 (0.49-1.61)
>1402 30 (0.94) 1.22 (0.69-2.15) 0.94 (0.52-1.69)
Composite thromboembolic outcome*
Troponin I group (ug/L)
<0.010 114 (2.00) <0.0001 <0.0001
0.010-0.019 167 (3.93) 1.87 (1.47-2.37) 1.72 (1.36-2.19)
0.020-0.039 112 (5.43) 2.53 (1.95-3.29) 2.12 (1.62-2.77)
≥0.040 89 (8.85) 4.09 (3.09-5.40) 3.19 (2.39-4.25)
NT-proBNP quartile
<387 58 (1.78) <0.0001 <0.0001
387-800 97 (2.95) 1.61 (1.17-2.24) 1.51 (1.09-2.09)
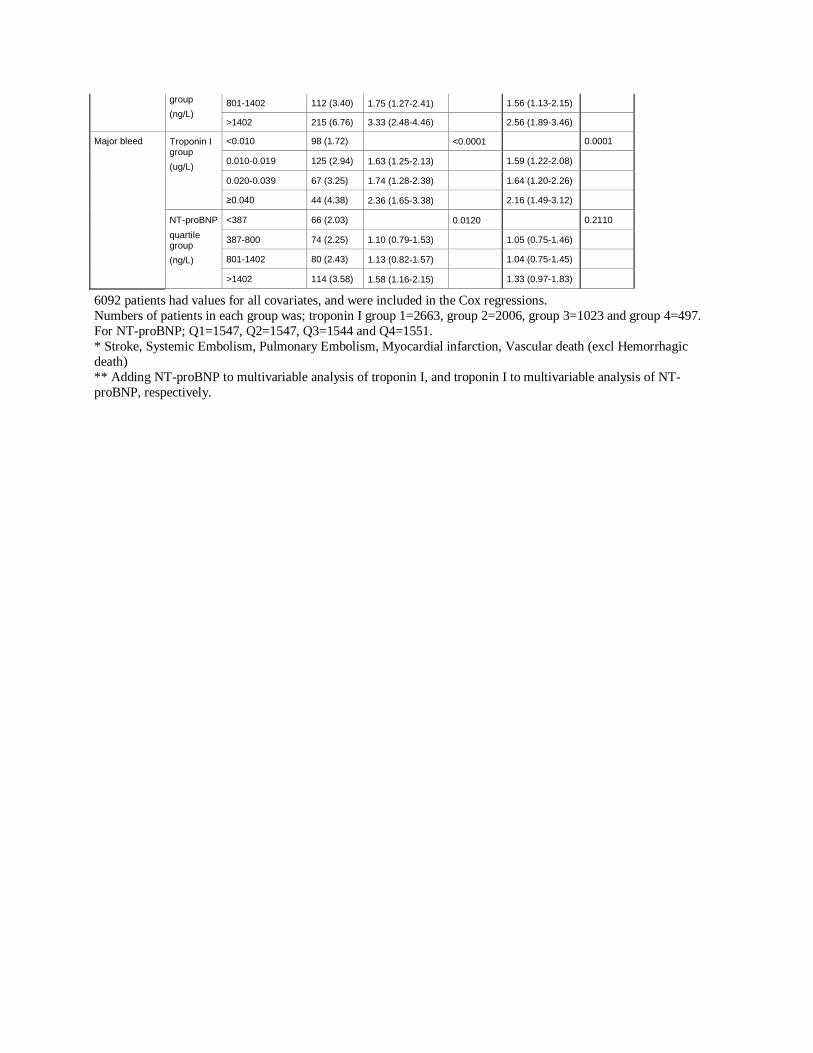
6092 patients had values for all covariates, and were included in the Cox regressions. Numbers of patients in each group was; troponin I group 1=2663, group 2=2006, group 3=1023 and group 4=497. For NT-proBNP; Q1=1547, Q2=1547, Q3=1544 and Q4=1551. * Stroke, Systemic Embolism, Pulmonary Embolism, Myocardial infarction, Vascular death (excl Hemorrhagic death) ** Adding NT-proBNP to multivariable analysis of troponin I, and troponin I to multivariable analysis of NT-proBNP, respectively.
group (ng/L)
801-1402 112 (3.40) 1.75 (1.27-2.41) 1.56 (1.13-2.15)
>1402 215 (6.76) 3.33 (2.48-4.46) 2.56 (1.89-3.46)
Major bleed Troponin I group (ug/L)
<0.010 98 (1.72) <0.0001 0.0001
0.010-0.019 125 (2.94) 1.63 (1.25-2.13) 1.59 (1.22-2.08)
0.020-0.039 67 (3.25) 1.74 (1.28-2.38) 1.64 (1.20-2.26)
≥0.040 44 (4.38) 2.36 (1.65-3.38) 2.16 (1.49-3.12)
NT-proBNP quartile group (ng/L)
<387 66 (2.03) 0.0120 0.2110
387-800 74 (2.25) 1.10 (0.79-1.53) 1.05 (0.75-1.46)
801-1402 80 (2.43) 1.13 (0.82-1.57) 1.04 (0.75-1.45)
>1402 114 (3.58) 1.58 (1.16-2.15) 1.33 (0.97-1.83)