Embed Size (px)
Citation preview

“Carbon Foot Prints in Refineries”
14.12.2013
By Supriya Sapre,
Bharat Petroleum Corporation Limited
Mumbai Refinery (MR)

Agenda
• BPCL MR an overview
• Classification of GHG Emission sources
• Carbon Footprint Baseline-line at BPCL MR
• Learnings
• Path Forward

3.8
0
1
2
3
4
5
6
7
8
9
10
11
12
13
1976
1.0
78-83
1.1
83-88
1.0
88-93
0.6
93-98
1.3
98-03
1.5
’05-06
1.7
’06-07
1.0
13.1
‘07-13
12.0mmta
BPCL Mumbai Refinery overview

BPCL Mumbai Refinery overview
1955-76
Crude unit
Cracking unit
Bitumen unit
Vacuum unit -I
Platformer unit
3 No. Boilers
Solvent unit
7 units
2006 onwardsCrude unit
Cracking unit –I revamped
Bitumen unit-revamped
Vacuum unit-I
Reformer unit-revamped
3 No. Boilers-revamped
New solvent unit
Cracking unit – II -revamped
High Vacuum unit-revamped
Aromatics unit -revamped
Amine treating unit – I & II
New Sulfur recovery unit - I & II
MTBE
Crude unit – II & III
Vacuum unit - III
DHDS unit - revamped
Hydrocracker - revamped
NHDS
Captive Power Plant - (3)
HGU – I & II
LOBS
CCG Splitter
25 units
Capacity expansions
Technology up gradation
Value added products
Product quality / environment
Capacity expansions
Technology up gradation
Value added products
Product quality / environment
1990
Crude unit-revamped
Cracking unit
Bitumen Unit
Vacuum unit-I revamped
Aromatics unit-revamped
3 No. Boilers
Crude Unit II
New solvent unit
Cracking unit – II
High Vacuum unit
Amine treating unit - I
Sulfur recovery unit
12 units

BPCL Mumbai Refinery overview
ISO 90011996 Quality Management
ISRS Level 81997
ISO 140011998
ISO 170252003
OHSAS 180012007
Shell benchmarking2004
Six Sigma2006
World Class Safety
Focusing on Environment
Laboratory competency
ProcessManagement
IdentifyingImprovement opportunities
Occupationalhealth & Safety
RBNQA 2007-12
Solomon benchmarking2010
Shell RPIP/ BPMAI 2011-12

What is the connection between Energy and
Carbon Dioxide?
=Energy Use
HFCs, PFCs &SF6
N2O
CH4
CO2
Burning of fossil fuels

Carbon footprint (FP): is “the total set of GHG
(greenhouse gas) emissions caused directly and
indirectly by an individual, organization, event
or product”
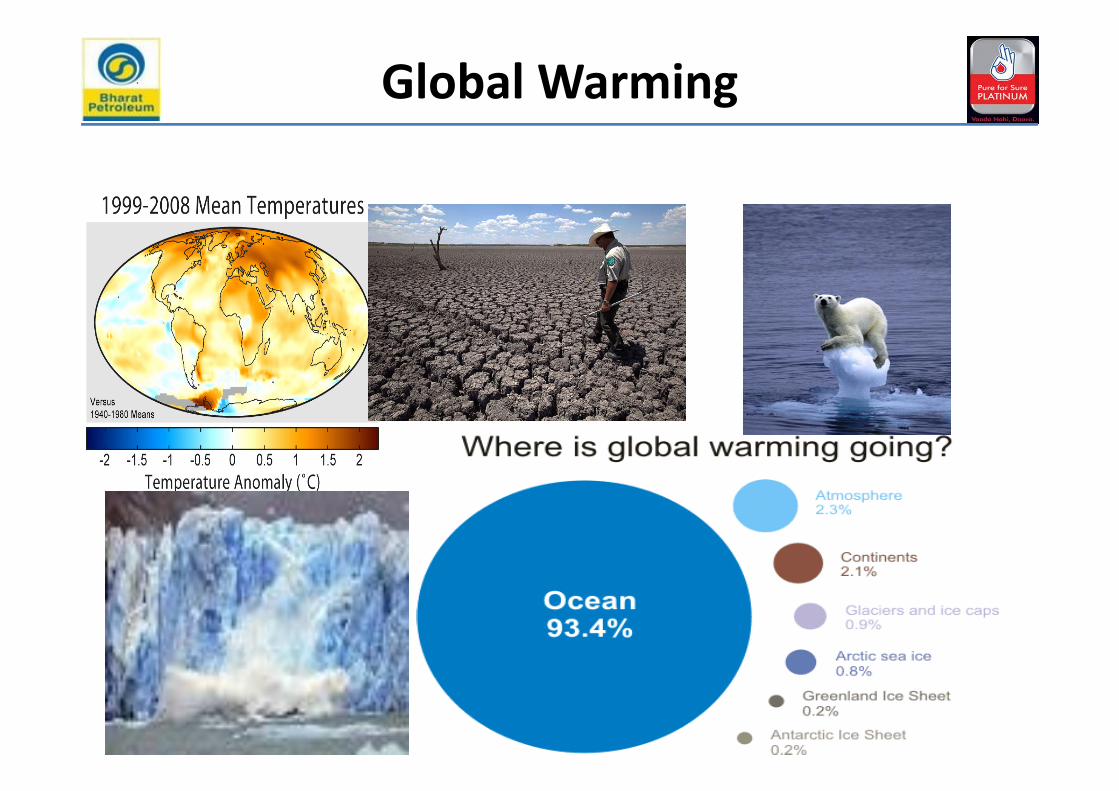
Global Warming

GHG by type of Gas
Total GHG=1771.6 mmtpa
CO2 70.8%
CH4 22.54%
N2O 5.1%
HFCs 1.5%
GHG Sectoral Distribution
Total GHG= 1771.6 mmtpa
Energy
71%
Agriculture
19%
Industry
7%
Waste 3%
India GHG Emission 2007
Agenda
• BPCL MR an overview
• Classification of GHG Emission sources
• Carbon Footprint Baseline-line at BPCL MR
• Learnings
• Path Forward

Classification of GHG Emission Sources
• Petroleum Refineries with varying
complexities consume 6 to 10% of their
crude thruput as fuel, and generate 20 to
30 % CO2

Classification of GHG Emission Sources
• Emissions may be classified as:
– Scope-1 Direct Emissions from sources
that are owned or controlled by the refinery
– Scope-2 Emissions from off site
generation of electricity, steam for on-site
requirement of power, utilities
– Scope-3 Indirect Emissions includes
emissions from sources not owned or directly
controlled, but are related to the activities of the
refinery

Classification of GHG Emission Sources
Category Scope-1 Example of Sources
Combustion Devices
Stationary Sources Boilers , Heaters, Furnaces, Power and Utilities, flares,
Incinerators, thermal/catalytic oxidizers, consumption of
LPG, Biogas plant in canteen
Mobile Sources Company Vehicles
Vented Sources
Process Vents Reactors, distillation columns, absorbers, strippers , mixing
tanks
Other Venting Storage tanks, gas-driven pneumatic devices, loading
racks, loading operations
Maintenance/
turnarounds
Vessel Depressurizing, Equipment Cleaning
Activities Non-
routine
Discharges from Pressure relief Valves and other
emergency shut-down devices
Fugitive Sources Leaks from valves, flanges, pumps, compressor seals
Other Non-point sources Wastewater treatment, waste handling operations

Classification of GHG Emission Sources
Category Scope-2 Example of Sources
Indirect Emissions Import of power and utilities
Category Scope-3 Example of Sources
Mobile Sources Import of raw material, ie crude oil via ships/vessels,
Transportation of finished product via rail, road and
coastally, receipt of other essential materials, travel of
workmen to workplace, business travel etc.

Agenda
• BPCL MR an overview
• Classification of GHG Emission sources
• Carbon Footprint Baseline-line at BPCL MR
• Learnings
• Path Forward

GHG Emission Estimation methods
• API Compendium of Greenhouse gasemissions methodologies for the oil and gasindustry -2009
• ISO 14064 -1
• Central Pollution Control Board (CPCB) reporton vehicular emissions factors
• Central Electricity Authority: CO2 Baselinedatabase
• GHG protocol and IPCC guidelines

GHG Emission Estimation methods
BPCL MR GHG emission estimation using
• Laboratory analysis
• Fossil fuel consumption data
• IPCC emission factors
• Central Pollution Control Board (CPCB) report
on vehicular emissions factors
• Central Electricity Authority: CO2 Baseline
database
• WRI factors
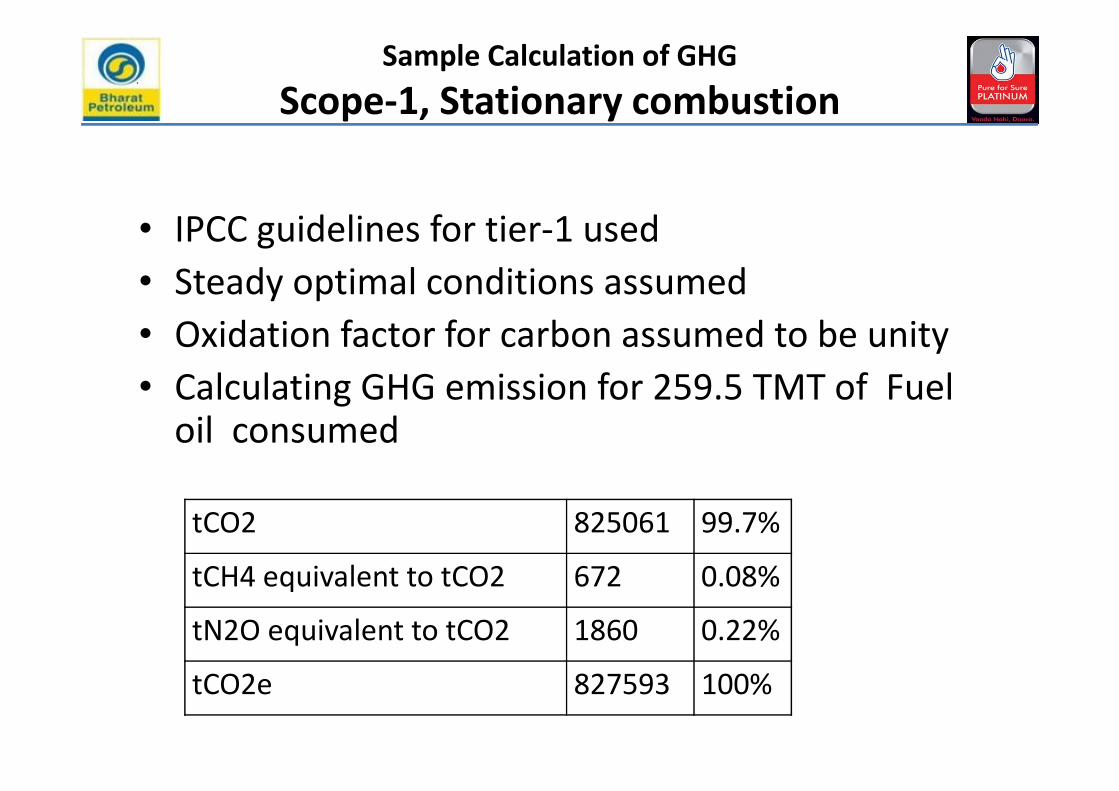
Sample Calculation of GHG
Scope-1, Stationary combustion
• IPCC guidelines for tier-1 used
• Steady optimal conditions assumed
• Oxidation factor for carbon assumed to be unity
• Calculating GHG emission for 259.5 TMT of Fuel oil consumed
tCO2 825061 99.7%
tCH4 equivalent to tCO2 672 0.08%
tN2O equivalent to tCO2 1860 0.22%
tCO2e 827593 100%

Sample Calculation of GHG
Scope-1, Stationary combustion
Year 2011-12 BASIS VALUES
Fuel Type LSHS
X10 6 Kgs A 259.5 Metered
NCV
Kcal/Kgs
B 9817.6 Tested at BPCL MR laboratory
CO2 Kg/TJ C 77400 IPCC Guidelines table 2.2
CH4 Kg/TJ D 3 IPCC Guidelines table 2.2
N2O Kg/TJ E 0.6 IPCC Guidelines table 2.2
tCO2 F A*B*4.184/1E9*C/1
000
Calculated 825061
tCH4 G A*B*4.184/1E9*D/1
000
Calculated 32
tN2O H A*B*4.184/1E9*E/10
00
Calculated 6
tCO2e F+21*G+310*H GWP100 of CH4 and N2O as
compared to CO2
827716
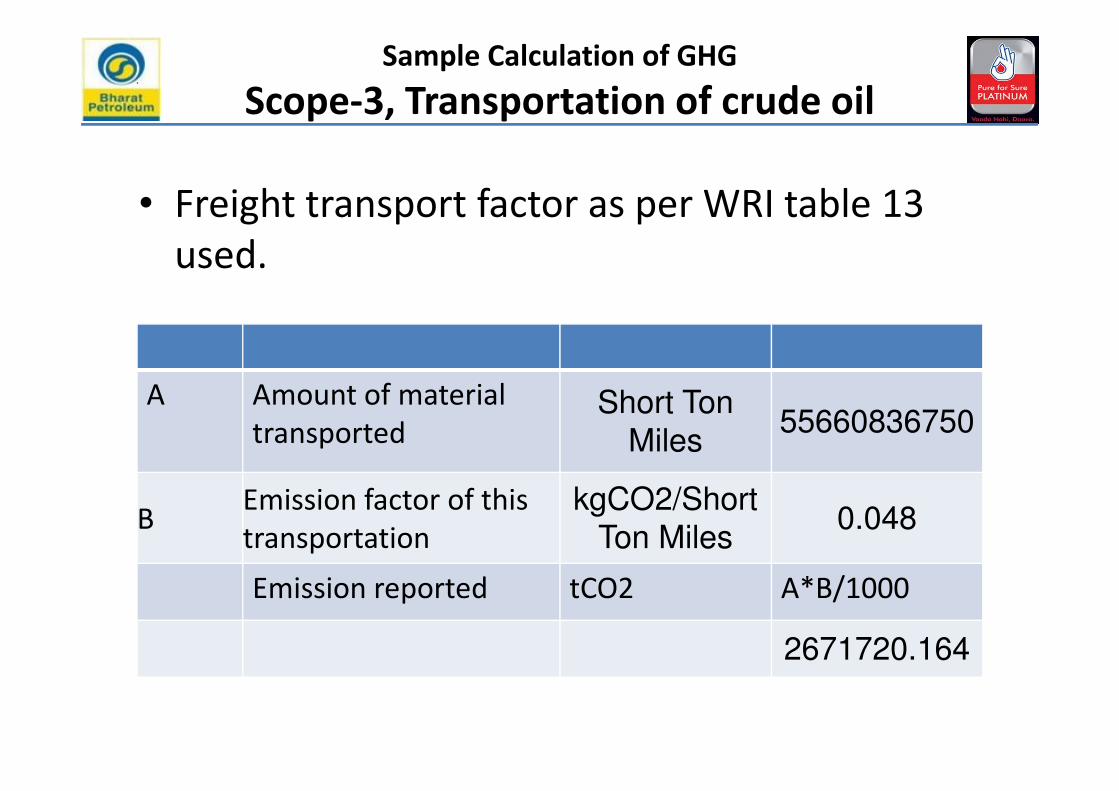
Sample Calculation of GHG
Scope-3, Transportation of crude oil
• Freight transport factor as per WRI table 13
used.
A Amount of material
transportedShort Ton
Miles55660836750
BEmission factor of this
transportation
kgCO2/Short
Ton Miles0.048
Emission reported tCO2 A*B/1000
2671720.164

Summary of Emissions
Category Particulars tCO2
Scope-1Direct Fuel Consumption (Thermal &
Electrical)2057096
Gas Flaring 3279.2
Biogas generation from waste treatment 52.88
LPG consumption in Canteen 252.74
COMPANY TRANSPORT 1235.1
Total refill value in "CO2 fire extinguishers" 1.794
In-plant vehicular movement 0.006
Scope-1 Total 2061918
Scope -1 emissions from BPCL MR: 2.0 million tCO2

Summary of Emissions
Category Particulars tCO2
Scope-2 Electricity Purchased 19486.8
Scope-3 OWN TRANSPORT 795.2
Employee Business Travel 734.85
Inbound Logistics - Ship 2671720.1
Outbound Logistics - Road 23476.9
Outbound Logistics - Ship 2135.5
Scope-3 Total 2698862.5
Scope -3 emissions from BPCL MR: 2.7 million tCO2
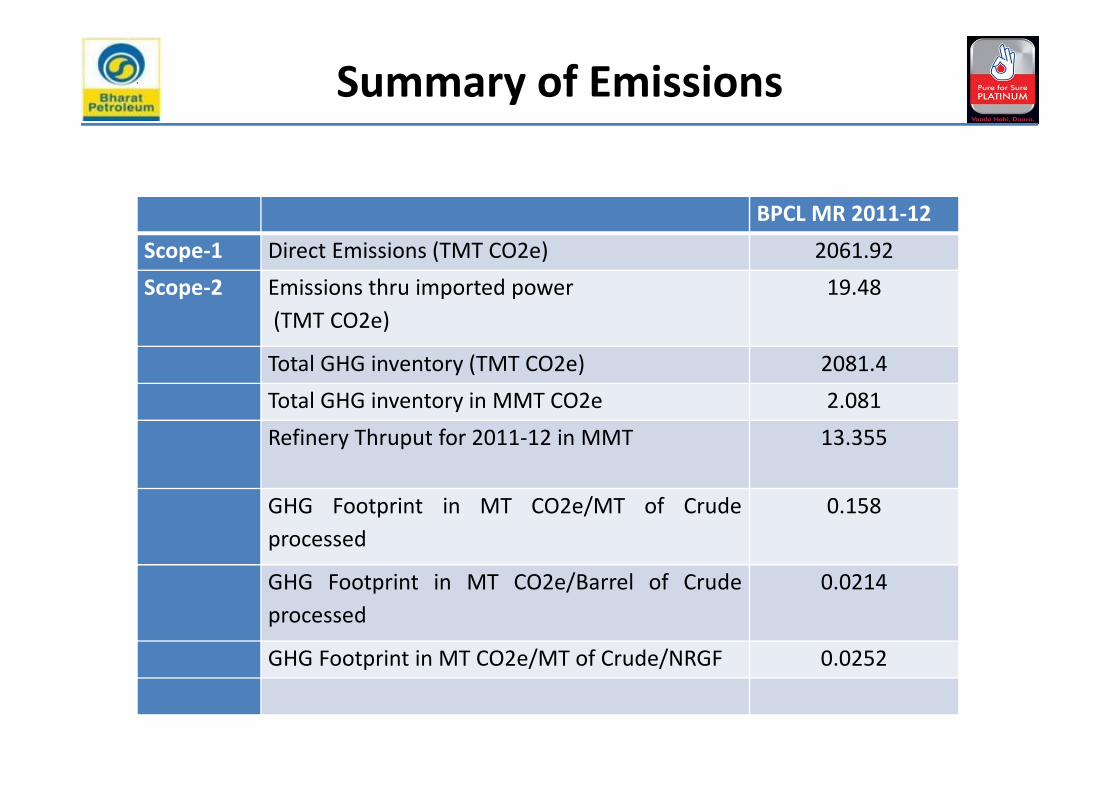
Summary of Emissions
BPCL MR 2011-12
Scope-1 Direct Emissions (TMT CO2e) 2061.92
Scope-2 Emissions thru imported power
(TMT CO2e)
19.48
Total GHG inventory (TMT CO2e) 2081.4
Total GHG inventory in MMT CO2e 2.081
Refinery Thruput for 2011-12 in MMT 13.355
GHG Footprint in MT CO2e/MT of Crude
processed
0.158
GHG Footprint in MT CO2e/Barrel of Crude
processed
0.0214
GHG Footprint in MT CO2e/MT of Crude/NRGF 0.0252
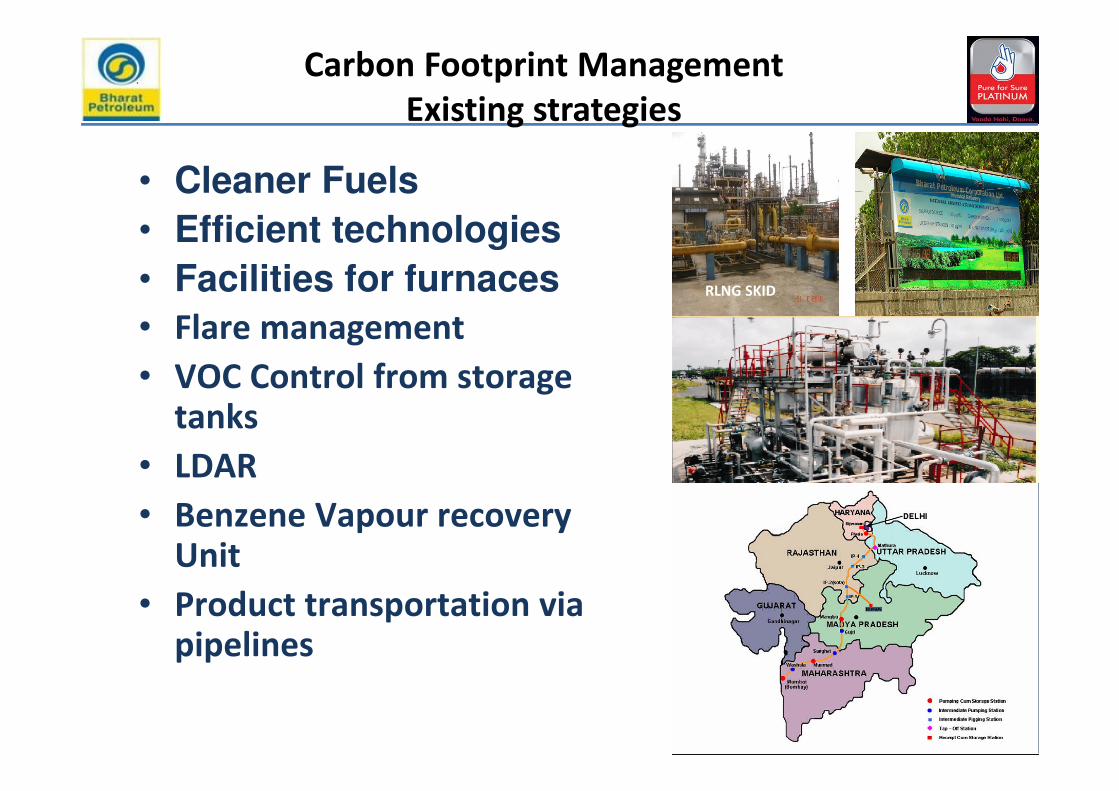
Carbon Footprint Management
Existing strategies
• Cleaner Fuels
• Efficient technologies
• Facilities for furnaces
• Flare management
• VOC Control from storage tanks
• LDAR
• Benzene Vapour recovery Unit
• Product transportation via pipelines
RLNG SKID
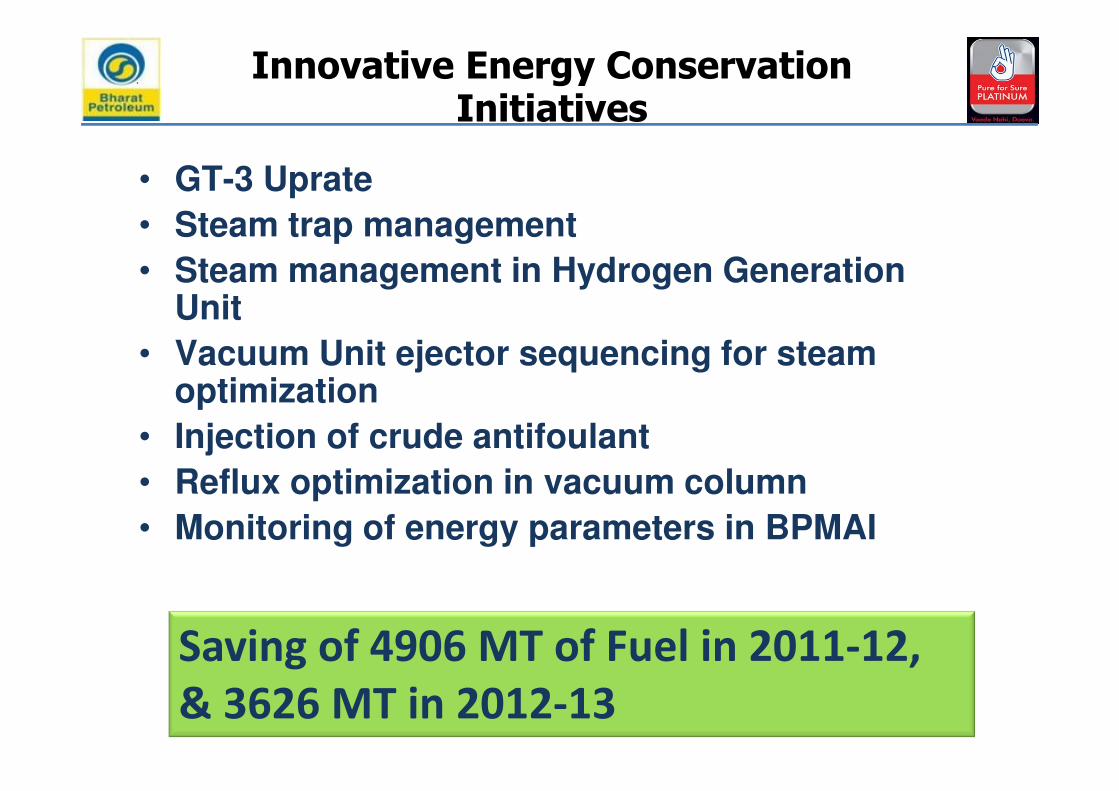
Innovative Energy Conservation Initiatives
• GT-3 Uprate
• Steam trap management
• Steam management in Hydrogen Generation Unit
• Vacuum Unit ejector sequencing for steam optimization
• Injection of crude antifoulant
• Reflux optimization in vacuum column
• Monitoring of energy parameters in BPMAI
Saving of 4906 MT of Fuel in 2011-12,
& 3626 MT in 2012-13

Agenda
• BPCL MR an overview
• Classification of GHG Emission sources
• Carbon Footprint Baseline-line at BPCL MR
• Learnings
• Path Forward

Learnings
• Transportation of raw material, ie crude oil at
BPCL MR contributes to GHG emissions
equivalent to entire scope-1&2 for refinery
processing
2.06
0.02
2.70
Million tCO2e
Scope-1
Scope-2
Part Scope-3

Learnings
8%
21%
22%15%
34%
Breakup of Direct Emissions
Steam
Power
Hydrogen Generation
Coke
Others
• Power and Steam generation constitute
almost one third of the total emissions
from refinery direct fuel consumption

Learnings
43%
2%
12%
1%
23%
15%
4%Emission from individual fuels
LSHS(Residual fuel oil)
BHGO (Gas oil)
FUEL GAS (Refinery Gas)
BHAG (NG from Uran)
RLNG
COKE
PSA OFF GAS
• Fuel oil consumption contributes 43% of emissions from refinery direct fuel consumption
• Emissions from different fuels depend on its composition(molecular wt, calorific value)
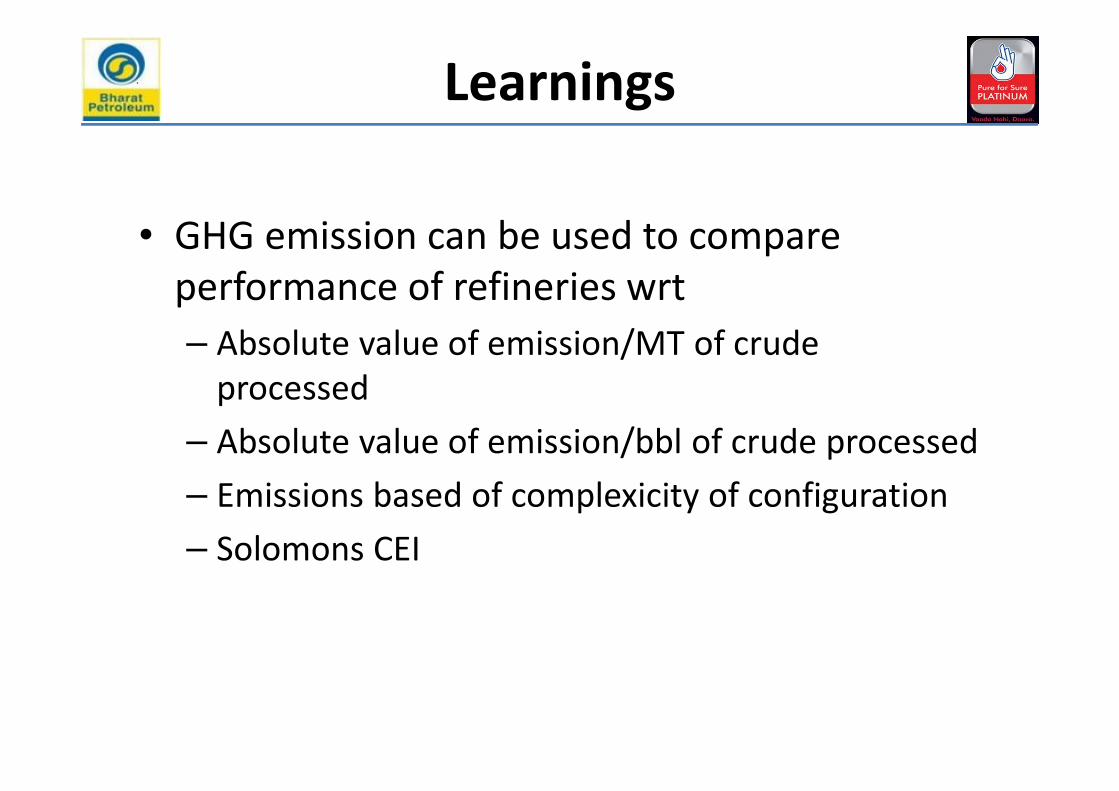
Learnings
• GHG emission can be used to compare
performance of refineries wrt
– Absolute value of emission/MT of crude
processed
– Absolute value of emission/bbl of crude processed
– Emissions based of complexicity of configuration
– Solomons CEI

Learnings
• Refinery fuels can be compared for tons of emissions per ton of fuel consumed.
• Emission factors are dependent on composition affecting accuracy of estimation.
Fuel tCO2/MT % Reduction in tCO2 over FO(Base)
Refinery Fuel oil 3.19 0.0%
Refinery Fuel Gas 2.72 14.7%
LNG 2.70 15.4%
H2 Rich refinery gas 0.67 79.0%

Path Forward
• Carbon management thru innovative, energy efficient technical improvements
• Supply chain strategies for low emissions
• Include climate change reduction targets as part of Sustainability, and Business plan
– Flare gas recovery
– Renewable solar energy at MR
– Steam trap management
– GT Uprate
• Efforts for increasing of green belt, which acts as GHG sink


Rank Country Year Total[1]Hydroelectrici
ty[2]
Wind
Powe
r[3]
Biomass
and
Waste[4]
Solar[5]
Geothe
rmal[6]
1 China 2011 797.4 687.1 73.2 34 3
European
Union[7]2010 699.3 397.7 149.1 123.3 23.1 5.6
2United
States2011 520.1 325.1 119.7 56.7 1.81 17.0
3 Brazil 2011 459.2 424.3 2.71 32.2 0.0002
4 Canada 2011 399.1 372.6 19.7 6.4 0.43
5 Russia 2010 166.6 163.3 0.004 2.8 0 0.47
6 India 2011 162 131 26 4 1
7 Germany 2012 136.1 21.2 45.3 40.9 28.0 0.03
8 Norway 2011 121.4 119.6 1.29 0.48 0.02
9 Japan 2011 116.4 82.5 4.35 23.1 3.80 2.89
10 Italy 2012 89.759 43.25613.33
3
9.281
(2010)[8]18.637 5.252
World top 10 renewable electricity producers[edit]Measurements are in TW·h/year (terawatt-hours per year), equal to 1 billion Kilowatt-hours per year.
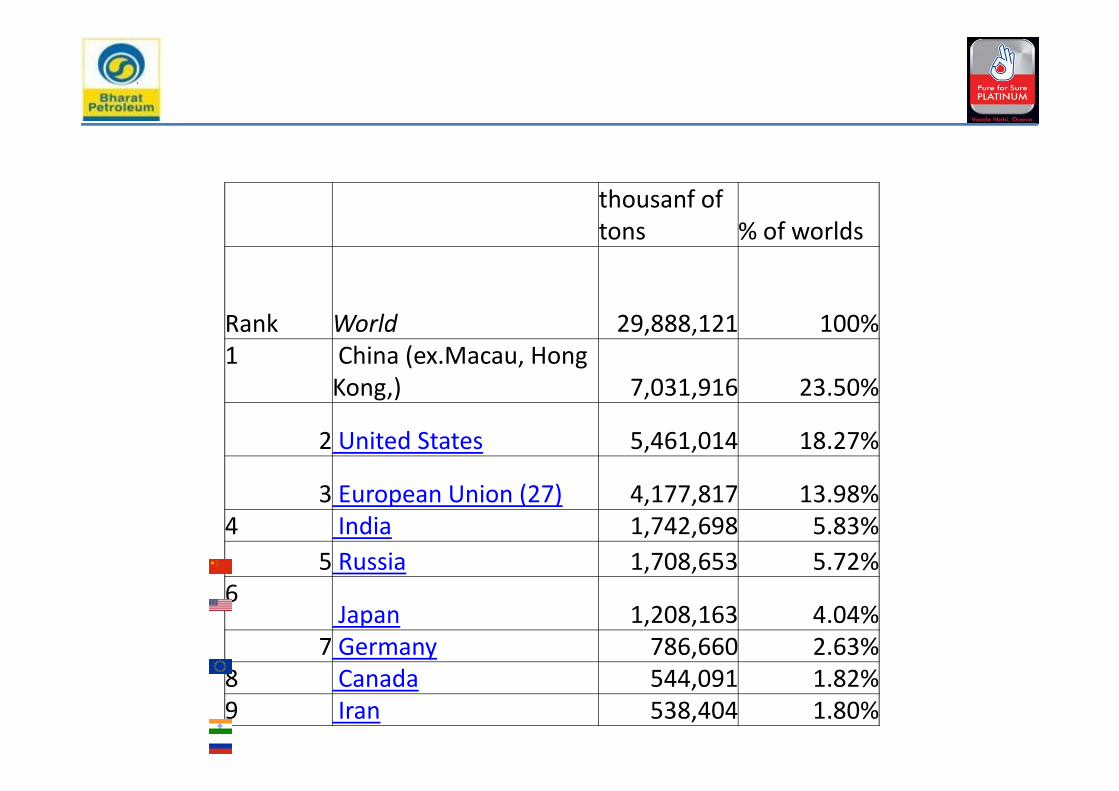
thousanf of
tons % of worlds
Rank World 29,888,121 100%
1 China (ex.Macau, Hong
Kong,) 7,031,916 23.50%
2 United States 5,461,014 18.27%
3 European Union (27) 4,177,817 13.98%
4 India 1,742,698 5.83%
5 Russia 1,708,653 5.72%
6Japan 1,208,163 4.04%
7 Germany 786,660 2.63%
8 Canada 544,091 1.82%
9 Iran 538,404 1.80%