Embed Size (px)
Citation preview

American Mineralogist, Volume 70, pages 581-589, 1985
Carbonate ion disorder in synthetic and biogenic magnesian calcites:a Raman spectral study
Wu; nlrl D. Blscnorr',r Smv K. Srnnul ^l,tqo Fnno T. MlcrnNzrs
D epartment of O ceanogr aphyand Hawaii Institute of Geophysics
Honolulu. Hawaii 96822
Abstrrct
Raman spectra of a series of synthetic and biogenic magnesian calcites with compositionsup to 25 mol% MgCOr, calcite, dolomite and magnesite were recorded. Raman bands in thespectra of synthetic magnesian calcites generally show linear changes in frequency from
calcite to dolomite or magnesite, but positive and negative deviations exist for the v. andtranslational lattice modes, respectively. A synthetic sample of 25 molYo MgCO. showsanomalously low frequency values of lattice modes. Halfwidths of the Raman bands increasesmoothly with magnesium concentration in synthetic phases.
Bands in the spectra ofbiogenic magnesian calcites generally show an increase in frequencywith increasing magnesium concentration, but the variation is not as smooth as in syntheticphases. Halfwidths of Raman bands of biogenic phases are nearly always larger than those of
synthetic phases. Lattice bands of biogenic materials are commonly degraded. Many of the
biogenic specimens show anomalously low frequencies of lattice modes in their Raman spec-
tra. HCO! is present in several biogenic phases as determined by the presence of a Raman
band at - 1014 cm- 1.
The increasing halfwidth of Raman bands with magnesium concentration probably results
from increasing positional disorder (rotation of COI - out of the basal plane) in both synthet-
ic and biogenic magnesian calcites. This disorder has not heretofore been recognized in
magnesian calcites. The amount of disorder is a smooth function of magnesium concentrationin synthetic phases but is irregular in biogenic phases. The interpretation ofpositional disord-er as a mechanism for the halfwidth behavior of Raman bands is also supported by the
behavior ofunit cpll c/a axial ratios.
Introduction
Magnesian calcites are an important mineral componentof modern and Pleistocene carbonate sediments (Land,1967). These phases are found principally in the skeletonsof marine invertebrates and as cements (Chave, 1954a,1954b; Bathurst, 1975). Magnesian calcites of biogenicorigin have been the major materials used to interpret thethermodynamic and kinetic behavior of these phases atearth-surface temperatures and pressures (Mackenzie et al.,1983). There is little information, however, concerning thecrystal chemistry of biogenic and inorganic magnesian cal-cites. Information concerning the microstructures and as-sociated chemical heterogeneities of these phases is essen-tial for interpretation of thsir reactivity and stability(Reeder, 1983). This knowledge is necessary if we are tounderstand the role of magnesian calcites in geochemicalprocesses of diagenesis, invertebrate calcification, cementformation and dissolution, and seawater chemistry.
We are currently investigating the chemistry and miner-alogy of magnesian calcites by comparison of the proper-
1 Present address: Department of Geology, Wichita State Uni-versity, Wichita, Kansas 67208.
0003-o04x/85/0s0ffi 58 1 S02.00
ties of synthetic and natural materials using a variety of
analytical techniques including X-ray diffraction, atomicabsorption, electron microprobe, scanning and transmis-sion electron microscopy, and infrared and Raman spec-troscopy. These investigations are necessary to characterizefully synthetic and natural phases and to form a basis forinterpretation of magnesian calcite stabilities from dissolu-tion and calorimetric measurements (Mackenzie et al.,1983).
We present here the first Raman spectra obtained formagnesian calcites and give spectra from biogenic and syn-thetic materials for comparison. Although Raman spectracannot be used to assess quantitatively MgCO3 con-centration, they can give much information about thestructural behavior of the carbonate ion' Our results sug-gest that the carbonate ion in synthetic and biogenic mag-nesian calcites is disordered.
Band assignments
Successful assignments of first-order Raman bands to theinternal vibrations of carbonate ions in rhombohedral car-bonates (space group Rlc,Z:2) have been accomplishedby factor group analysis (Bhagavantum and Venkataray-
581

s82 BISjH,FF ET AL.: 1ARB,NATE rRoN DTi2RDER rN MAGNESTAN caLcrrEs
udu, 1939; Krishnan, 1945; Porto et al., 1966: Rutt andNicol4 1974; White, 1974a). Raman-active modes of vibra-tion, symmetry assignments and frequencies of vibrationfor rhombohedral carbonates are illustrated in Figure l.Second-order Raman bands, those arising from overtonesand combinations of the first-order Raman bands, alsooccur in rhombohedral carbonates (Krishnan, 1945; Krish-namurti, 1957). One of the strongest of these occurs atl7W-1765 cm-r and is an overtone of the infrared-active.2 x v2 (Ar") mode, as described by Krishnan (1945) andKrishnamurti (1957). It is not, however, a combination ofA,, and E"as described by Rutt and Nicola (1974).
Band assignments of lattice modes are equivocal. In a
same assignments were made by White (1974a). Krishna-murti (1957) described the lattice modes as a mixture ofpart translational and part librational oscillations. Studiesof NaNO. (Rousseau et al., 1968), which crystallizes withthe same symmetry as calcite, show that the lower fre-quency band of the Raman spectrum of NaNO, is thetranslational mode and the higher frequency band is thelibrational mode of the nitrate ion, with little mixing be-tween these modes. The behavior illustrated bv the latticebands of NaNO, (higher frequency, higher intensity : 1i-bration) is generally expected from lattice bands of aniso-tropic groups (Bhagavantam, l94l). Rousseau et al. com-pared polarized Raman spectra of a single crystal ofNaNO, with the corresponding polarized spectra of calcitereported by Porto et al. (1966). On the basis of observed
differences in the polarization characteristics of calcite lat-tice bands, they suggested that considerable mixing is pres-ent in the lattice modes of calcite. At present, we will referto the lower frequency mode as translational (T) and thehigher frequency mode as librational (L), but realize thatsignificant mixing may occur.
Because of the presence of alternating layers of calciumand magnesium ions in the dolomite structure. the sym-metry of dolomite (R3) is lower than that of calcite.'Anadditional lattice mode, which arises from translation ofentire carbonate ions parallel to the c axis, occurs at ap-proximately 335 cm-r. All of the other vibrational modesof the rhombohedral carbonates are found in the spectrumof dolomite (see White, 1974a, or Couture, 1947, for moredetailed descriptions).
Experimental proceduresSynthesis procedures for synthetic samples and pretreatment
methods for biogenic samples are described by Bischoff et al.(1983). Results of atomic absorption and X-ray powder diffractionanalyses of the materials can be found in Mackenzie et al. (1983)or are available from the authors.
Preparation of synthetic sample 25A differed from previous syn-theses in that synthetic magnesite, instead of basic MgCO. (hy-dromagnesite), was used in starting mixtures. This procedure elim-inated previous problems of slight magnesium heterogeneities inrun products with greater than 20 mol% MgCO. (Bischoff et al.,1983). Run product 25A is a homogeneous phase, as indicated bya sharp, single-phase X-ray diffraction pattern. Because a smallamount of periclase, MgO, was also produced in the synthesis of25A, unit cell parameters determined from least squares analysisof the diffraction pattern were used with the X-ray determinativecurves of Bischoff et al., (1983) to estimate the composition of 25A(25+l mol% MgCO.). Synthetic magnesite starting material wasprepared in cold-seal bombs from Fisher reagent grade basicMgCO. wrapped in Ag foil and subjected to a temperature of600"C and a CO, pressure of approxirnately 2000 psi for 48 hours.
Raman spectra were recorded at room temperature with a Spex1402 double monochromator; data acquisition was controlled bya Spex Datamate computer. Powdered samples in glass capillarieswere excited with a 488.0 nm Ar+ laser with a power of 200 mWat the sample. Scattered radiation was collected at 90. to theexcitation beam. Only Stokes lines were recorded. A data col-lection interval of I crn-r and a slit width of 2 or 3 cm-1 wereused in recording Raman spectra.
Experimental results
End membersSubstitution of Mg2+ for Ca2* in the synthetic and bio-
genic magnesian calcites is probably random. There is noevidence from X-ray powder diffraction studies of the sam-ples considered here or elsewhere that magnesium ions arepreferentially substituted into layers in a manner similar tothat found in dolomite (Bischoff et al., 1983; Lippman,1973). The true end members of the solid solution, thus, arecalcite and magnesite. Nevertheless, we have included theRaman spectra of dolomite for comparison purposes andrefer to it as an end member. Raman spectra of calcite,dolomite, and magnesite are shown in Figure 2. Fre-
.ATTICE MODES INTERNAL MODES
UNITCELLAXES
LIIa
o a
a. Ary
2 * u z u ( A r )Out-ot-plane bend
1 7oo- t 765 cr 1
Fig. 1. Schematic drawings of Raman modes of vibration inrhombohedral carbonates (after White, 1974a). Notation and svm_metry of the vibration and the range of Raman shift for allrhombohedral carbonates are included for each mode. Hexagonalunit cell axes are shown for orientation.

329 t
A'o'o
I Ii Ii\ / 't \
-1 * ^ ____j \r1_
7 1 2
o.=cf
6.=-o
Fa,zlrl
z
BISCHOFF ET AL.: CARBONATE IRON DISORDER IN MAGNESIAN CALCITES 583
RAMAN SHIFT (cm 1)
Fig. 2. Raman spectra of calcite, synthctic magnesian calcites, dolornite and magnesite. Percentages in parentheses refer to molTo
UgCO. in solid solution. Scale factors assume an intensity of I for the v, mode of each sample'
quencies of vibrational modes of the end members agreewell with other values reported in the literature, althoughliterature values do show significant variation. The range of
frequencies in literature values depends on the vibrationalmode and is probably the result of variations in the naturalmaterials studied as well as instrumental variation betweeninvestigators. References to the literature available onRaman spectra of carbonates, besides those cited here, can
be found in the reviews by Griffrth (1975), White $97aQ,and Krishnan (1945).
Halfwidths of the Raman bands (full width of the Ramanband at half maximum band height) were also recorded'
Halfwidths are a function of temperature, experimental slitwidth, the data recording interval, crystallinity of thesample (i.e., presence of structural defects and crystallitesize), and substitution of trace elements. In this study'Raman spectra recording conditions were consistent' anddifferences in halfwidths reflect only variations betweensamples. Halfwidths of the internal modes generally in-
crease from small values in calcite to considerably larger
values found in magnesite. The halfwidths of the internalmodes of dolomite fall between the values of calcite andmagnesite (Table 1). For v3 the difference between dolomiteand magnesite is not significant. This overall trend, how-

584 BISCHOFF ET AL.: CARBONATE IR2N DISzRDER IN MAGNELIAN )AL)ITES
Table 1. Raman frequencies and halfwidths: synthetic phases andend members
Composi t i onno le % !19C0?
S a m p l e o . 0 . 1 - " 1
Ca l c i te
8C
9B
't0c
t l A
l 7 4
l9c
l 6 B
1 . 9
end member carbonates should be considered preliminary.Raman spectra of a variety of samples of calcite, dolomiteand magnesite should be recorded under consistent experi-mental conditions to determine if these halfwidth relation-ships apply to these (and other rhombohedral) carbonatesin general. The halfwidths of the Raman bands of calcitereported here, however, do agree within 2 cm-r of similarvalues reported by Krishnan (19a5) and park (1966). In astudy of magnesite, Krishnamurti (1956) described the half-width of the L lattice mode as sharp and that of the v,mode as diffuse ( - 10 cm
- 1). We conclude that the limitedhalfwidth data available suggest that the observed half-width trends are real, and not the result of peculiarities inour samples.
Synthetic materialsRaman sp€ctra for a selection of synthetic magnesian
calcites are also shown in Figure 2. Careful examination ofFigure 2 reveals that the frequencies of all the Ramanbands in the spectra ofsynthetic materials generally appearto increase slightly with increasing magnesium con-centration. To investigate these relationships more closely,we plotted Raman frequencies against mol% MgCO, andconstructed straight lines between calcite and dolomite andcalcite and magnesite (Figs. 3 and 4). These lines have anerror of at least +1 cm-1, the error in measurernent ofRaman frequencies of the end members. Actual error maybe greater because of the ranges in frequencies reportd forthe end members in the literature (see discussion above).When we exclude the results from sample 25A, and withinthe error of measurement of + I cm- 1, Raman frequenciesof synthetic phases plot along the straight lines drawn be-
q _ - - - 1 - :
r--ts-r--l +4ffr #- - + - - - -j
T
- - - a
+-'F -+ Ii
II
ii
o 5 1 0 1 5 2 0 2 5MOLE t McCOg
Fig. 3. Frequencies of the vr, L and T Raman modes vs. com-position of synthetic (squares) and biogenic (circles) magnesiancalcites. Dot-dashed line connects calcite (triangle) and dolomite.Dashed line connects calcite and magnesite.
zxr2
3 . 9
8 0
9 9
I54* 281 7 l I 1085 1434 17486 . 2 1 0 . 1 3 6 2 . 5 2 . 0 3 . 6'155
281 711 ',t085
1435 17478 . 2 ' t 2 . 0
4 . 8 4 . 2 6 . 4 7 . 6
155 ?81 712 1086 1436 17481 0 . 7 1 3 8 5 . 9 5 . 6 7 . 6 8 . 3
1086 1436 17476 . 5 1 0 . 2 9 . 5
1087 1438 17497 . 1 l l . 4 9 . 5
1087 1438 17497 . 6 1 4 . 0 1 0 . 8
1087 1438 I 7499 . 2 I 7 . 8 I 1 . 5
282' I 5 .6
284t 5 I
284r 8 . 3
28320.0
1 56 286 7't6 1086 I 439 I 750i m 1 8 . 3 1 2 . 2 8 . 6 t 9 . l l l . 5
I54 278 7 l5 1088 1439 I 748i n 2 8 . 0 1 6 I 1 ? . 4 i m 1 5 . 3
175 299 724 1097 1441 17565 . 5 9 . 8 9 . 0 6 . 1 3 . 8 4 . 3
?13 329 738 1093 1444 17624 . 0 4 9 1 2 . 2 1 2 . 5 3 . I 4 . 8
1 5 . 0
' t55
| . 57127 . 4
7 1 48 . 7
7 1 49 7
7 1 412.2
1 5 61 3 . 3
1 5 71 4 . 7
l 3 b
254 25( I )
Do lmi te
Magnesi te
'Uppe" uaLue is freque-ney, L@e? uaLue i.s h4lfuidth, Ew?e atu.:1 tu-! md l ! . .5 7-t for ! -requaeies and rul fuidths,
"e 'WetiDelA,tn - Jmcasa?abt? becouse oJ deqtudat.oa.
ever, suggests that cation size may play an important rolein determining halfwidths of the internal modes of rhombo_hedral carbonates.
Magnesite has the smallest halfwidths of lattice modesand those of calcite are larger. Cation size also seems to bea factor controlling halfwidths of lartice modes, but in theopposite sense than the efect of cation size on the half_widths of internal modes. Dolomite exhibits larger half-widths of lattice bands than do magnesite or calcite. Half-widths of the lattice modes of dolomite probably reflect thedifference between vibrational energies of interactions ofcarbonate ions across layers of magnesium ions and thoseacross layers ofcalcium ions.
The trends in the halfwidth data of both internal andlattice modes as a function of cation size probably arisefrom differences in bond strengths between calcite andmagnesite. In both calcite and magnesite, C_O bondlengths in the carbonate ion are essentially the same,whereas the Ca-O bond in calcite (2.36A) is larger and,thus, weaker than the Mg-O bond (2.10A) in magnesite.Because the Mg-O bond in magnesite is stronger, there isless frequency variation in the lattice modes and the half-widths are smaller than those for calcite. The halfwidths ofthe internal modes of calcite are smaller than those of mag-nesite because the weaker Ca-O bond has less effect on theinternal vibrations of the carbonate ion than do thestronger Mg-O bonds in magnesite.
These interpretations of the halfwidth behavior of the
'e eaoo
FEIoz 270
t
1 6 0
f J-+- +1- t - -+--
a. . - t - * - f
- -
l - r r
BISCHOFF ET AL.: CARBONATE IRON DISORDER IN MAGNESIAN CALCITES 585
o
Fq
Ioz
G
MOLE % MgCO3
Fig. 4. Frequencies of the va, v3, and 2 x v, Raman modes vs.composition for synthetic magnesian calcites. Lines and symbolsare the same as in Fig. 3, but lines to dolomite and magnesite aresuperirnposed for the 2 x vr and vnmodes.
tween calcite and dolomite or calcite and magnesite for the
L, ry e4 and 2 x v, modes. Positive deviations from the
straight lines are seen for the v, mode and negative devi-
ations for the T mode. Sample 25A complements the trends
determined by other synthetic phases found in the internal
modes except in the case of the 2 x v, mode, where the
frequency falls 2 crn-1 below that expected for a synthetic
magnesian calcite of 25 moloh MgCO3. The frequencies of
the lattice modes of sample 25A are anomalous. These fre-
quencies are equivalent (for the T mode) or below (for the
L mode) the corresponding frequencies of calcite. Fre-
quencies of the Raman bands and associated halfwidths are
given in Table 1.Halfwidths of the Raman bands of synthetic phases also
increase with increasing magnesium concentration' An in-
crease in halfwidth can eventually lead to complete degra-
dation of Raman bands. In Figure 2, this effect is notice-
able in the lattice modes of the synthetic phases. The in-
crease in halfwidths, as a function of magnesium con-
centration, appears linear for all modes, but is more pro-
nounced in lattice modes than in internal modes. The half-
widths in the spectrum of sample 25A complement the
trends determined by the other synthetic phases in each
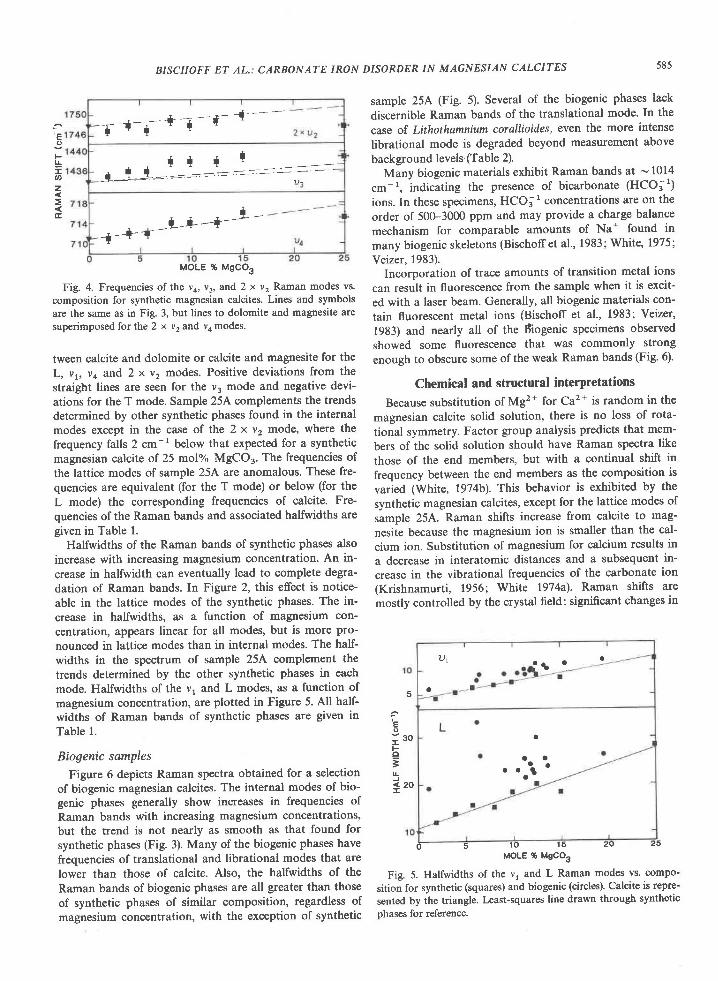
mode. Halfwidths of the v, and L modes, as a function of
magnesium concentration, are plotted in Figure 5. All half-
widths of Raman bands of synthetic phases are given in
Table 1.
Biogenic samples
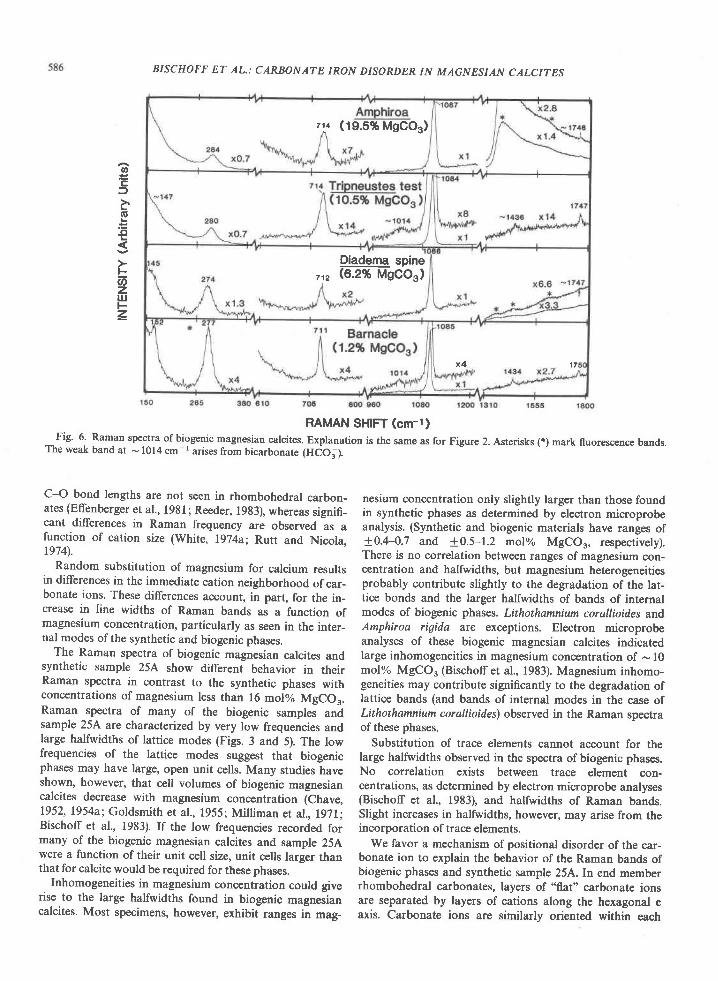
Figure 6 depicts Raman spectra obtained for a selection
of biogenic magnesian calcites. The internal modes of bio-
genic phases generally show increases in frequencies of
Raman bands with increasing magnesium concentrations,
but the trend is not nearly as smooth as that found for
synthetic phases (Fig. 3). Many of the biogenic phases have
frequencies of translational and librational modes that are
lower than those of calcite. Also, the halfwidths of the
Raman bands of biogenic phases are all greater than those
of synthetic phases of similar composition, regardless of
magnesium concentration, with the exception of synthetic
sample 25A (Fig. 5). Several of the biogenic phases lack
discernible Raman bands of the translational mode. In the
case of Lithothamnium corallioiiles, even the more intense
librational mode is degraded beyond measurement above
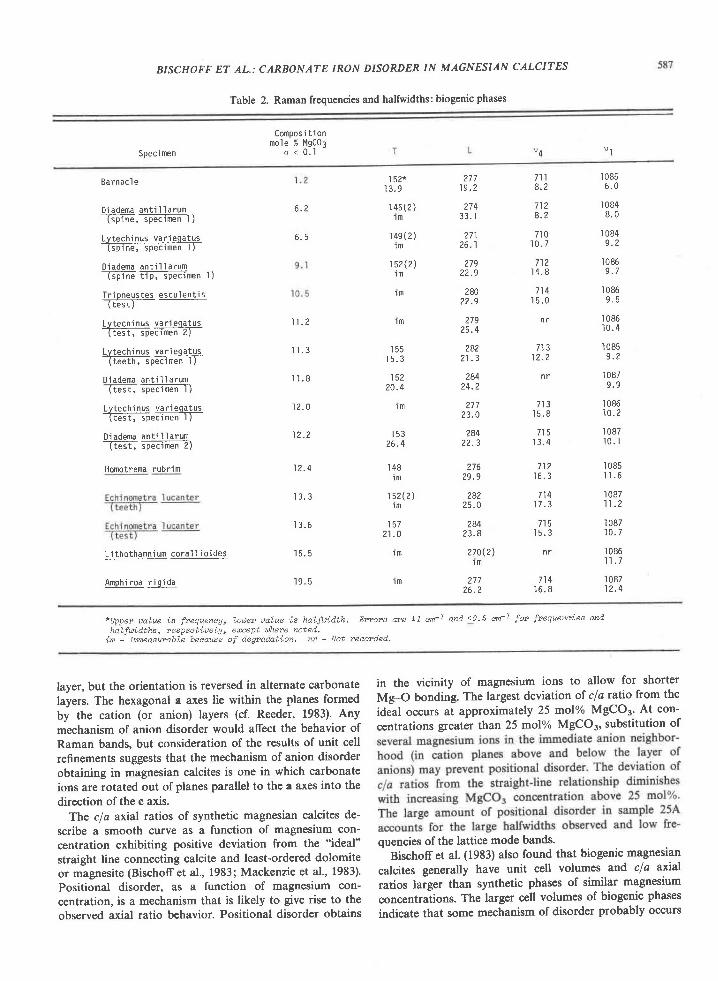
background levels' (Table 2).Many biogenic materials exhibit Raman bands at -l0l4
cm-t, indicating the presence of bicarbonate (HCO, 1)
ions. In these specimens, HCO. 1 concentrations are on the
order of 500-3000 ppm and may provide a charge balance
mechanism for comparable amounts of Na* found in
many biogenic skeletons (Bischoffet al., 1983; White' 1975;Veizer, 1983).
Incorporation of trace amounts of transition metal ions
can result in fluorescence from the sample when it is excit-ed with a laser beam. Generally, all biogenic materials con-
tain fluorescent metal ions (Bischoff et a1., 1983; Yeizer,1983) and nearly all of the Biogenic specimens observedshowed some fluorescence that was commonly strong
enough to obscure some of the weak Raman bands (Fig' 6).
Chemical and structural interpretations
Because substitution of Mg2* for Ca2* is random in the
magnesian calcite solid solution, there is no loss of rota-
tional symmetry. Factor group analysis predicts that mem-
bers of the solid solution should have Raman spectra like
those of the end members, but with a continual shift in
frequency between the end members as the composition is
varied (White, 1974b). This behavior is exhibited by the
synthetic magnesian calcites, except for the lattice modes of
sample 25A. Raman shifts increase from calcite to mag-
nesite because the magnesium ion is smaller than the cal-
cium ion. Substitution of magnesium for calcium results in
a decrease in interatomic distances and a subsequent in-
crease in the vibrational frequencies of the carbonate ion(Krishnamurti, 1956; White 1974a). Raman shifts aremostly controlled by the crystal field: significant changes in
u t . a. t t :
o
a
a a
a aatl '
- 5 l o 1 5 z e z oMOLE % MsCOg
Fig. 5. Halfwidths of the v, and L Raman modes vs. compo'
sition for synthetic (squares) and biogenic (circles). Calcite is repre-
sented by the triangle. Least-squares line drawn through syntheticphases for reference.
c
?'eo: s oIFe=LJ< 2 0I
BISCHOFF ET AL.: CARBONATE IRON DIS?RDER IN MAGNESIAN CALCITES
ct
cf,
(lt
.cl
F6ztuF=
RAMAN SHTFT (cm-1)Fig' 6' Raman spectra of biogenic magnesian calcites. Explanation is the same as for Figure 2. Asterisks (*) mark fluorescence bands.
The weak band at - 1014 crn- I arises from bicarbonate (HCO;).
C-O bond lengths are not seen in rhombohedral carbon_ates (Effenberger et al., l98l; Reeder, 19g3), whereas signifi_cant differences in Raman frequency are observed as afunction of cation size (White, 1974a; Rutt and Nicola.1974\.
Random substitution of magnesium for calcium resultsin differences in the immediate cation neighborhood of car_bonate ions. These differences account, in part, for the in_crease in Iine widths of Raman bands as a function ofmagnesium concentration, particularly as seen in the inter_nal modes of the synthetic and biogenic phases.
The Raman spectra of biogenic magnesian calcites andsynthetic sample 25A show diflerent behavior in theirRaman spectra in contrast to the synthetic phases withconcentrations of magnesium less than 16 mol%o MgCO..Raman spectra of many of the biogenic samples andsample 25A are characterized by very low frequencies andlarge halfwidths of lattice modes (Figs. 3 and 5). The lowfrequencies of the lattice modes suggest that biogenicphases may have large, open unit cells. Many studies haveshown, however, that cell volumes of biogenic magnesiancalcites decrease with magnesium concentration (Chave,1952, 1954a; Goldsmith et al., 1955; Milliman et al.,I97t:Bischoff et al., 1983). If the low frequencies recorded formany of the biogenic magnesian calcites and sample 25Awere a function of their unit cell size, unit cells larger thanthat for calcite would be required for these phases.
Inhomogeneities in magnesium concentration could giverise to the large halfwidths found in biogenic magnesiancalcites. Most specimens, however, exhibit ranges in mag-
nesium concentration only slightly larger than those foundin synthetic phases as determined by electron microprobeanalysis. (Synthetic and biogenic materials have ranges of10.4-0.7 and *0.5-1.2 molo/o MgCO3, respectively).There is no correlation between ranges of magnesium con-centration and halfwidths, but magnesium heterogeneitiesprobably contribute slightly to the degradation of the lat-tice bonds and the larger halfwidths of bands of internalmodes of biogenic phases. Lithothamnium corallioiiles andAmphiroa rigiila are exceptions. Electron microprobeanalyses of these biogenic magnesian calcites indicatedlarge inhomogeneities in magnesium concentration of - 10mol% MgCO. (Bischoff et al., 1983). Magnesium inhomo-geneities may contribute significantly to the degradation oflattice bands (and bands of internal modes in the case ofLithothamnium corallioides) observed in the Raman spectraof these phases.
Substitution of trace elements cannot account for thelarge halfwidths observed in the spectra ofbiogenic phases.No correlation exists between trace element con-centrations, as determined by electron microprobe analyses(Bischoff et d., 1983), and halfwidths of Raman bands.Slight increases in halfwidths, however, may arise from theincorporation of trace elements.
We favor a mechanism of positional disorder of the car-bonate ion to explain the behavior of the Raman bands ofbiogenic phases and synthetic sample 25A. In end memberrhombohedral carbonates, layers of "flat" carbonate ionsare separated by layers of cations along the hexagonal caxis. Carbonate ions are similarly oriented within each
?14 (19.5%MgCOs)
Diadema spine,r" (6.2% MgGO3)
x 4 1 7
BISCHOFF ET AL,: CARBONATE IRON DISORDER IN MAGNESIAN CALCITES
Table 2. Raman frequencies and halfwidths: biogenic phases
Spec i men
Composi t ionmo'le % MgC03
o < 0 . 1 v 4 " l
Ba rnac l e
Diadema an t i l l a rum_Isplne, spdlmen I )
Lvtechinus var ieqatus-1s-jJJrr-oin-e, spEE a
-
D iadema an t i l l a rumGFile TTp, s-, specimen l)
T r i pneus tes escu len t i s-]TEstf-
Ly tech inus va r i eqa tus-TG-st, spefffienZT-
Lvtechinus var ieqatus+ -( t ee th , spec tmen l ,
D iadema an t i l l a rumTAst, spe;im-en T)
Lytechinus var iegatus-TTesI, spedmeilT-
Diadema ant i l larum-(tes t, ;FecI men7)
Homotrema rubrim
Li thothamnium coral I io ides
Amphiroa r ig ida
6 . 2
6 . 5
1 1 . 2
' 1 1 . 3
1 1 . 8
12 .0
12 .2
12 .4
' | 3 . 3
t J - o
' 1 5 . 5
1 9 . 5
152*1 3 . 9
1 4 5 ( 2 )lm
1 4s (2 )t m
152(2)tm
l m
t m
'155
1 5 . 3
15220.4
1 m
1 5 3? 6 . 4
'148
l m
1q,2 l 2 \1 m
1572 1 . 0
1 m
l m
27719 .2
?74? ? I
271z o . I
2792 2 . 9
2802 2 . 9
2792 5 . 4
2822 1 . 3
28424.?
2772 3 . 0
2842 2 . 3
27629.9
2822 5 . 0
2842 3 . 8
27012)t m
?772 6 . 2
7118 . 2
7 1 28 . 2
7 1 01 0 . 7
7121 4 . 8
714' 1 5 . 0
n r
71312 .2
n r
1131 5 . 8
115' I 3 . 4
7121 6 . 3
714I I . J
7151 5 . 3
n r
714'16 . I
'1085
6 . 0
I 0848 . 0
1 0849 . 2
'1086
9 . 7'1086
9 . 5
I 086'10 .4
'1085
9 . 2
I 0879 . 9
'1086
10.2
I 087l 0 . l
'1085
i l . 6
I 0871 1 . 2
I 087'10 . 7
I 0861 1 . 7
I 08712 .4
*[.)pper ualue is frequercy, Louer ualue is halfvLdth'halfuidths, tespectitelA, ereept uhene noted'
in - Imeaswable because of degradation. w - Not
ET"ors tre !1 cn-7 and <0.5 m-1 for frequercies md
recorded.
layer, but the orientation is reversed in alternate carbonatelayers. The hexagonal a axes lie within the planes formedby the cation (or anion) layers (cf. Reeder, 1983). Anymechanism of anion disorder would affect the behavior ofRaman bands, but consideration of the results of unit cellrefinements suggests that the mechanism of anion disorderobtaining in magnesian calcites is one in which carbonateions are rotated out of planes parallel to the a axes into thedirection of the c axis.
The cla axial ratios of synthetic magnesian calcites de-scribe a smooth curve as a function of magnesium con-centration exhibiting positive deviation from the "ideal"straight line connecting calcite and least-ordered dolomiteor magnesite (Bischoff et al., 1983; Mackenzie et al., 1983).Positional disorder, as a function of magnesium con-centration, is a mechanism that is likely to give rise to theobserved axial ratio behavior. Positional disorder obtains
in the vicinity of magnesium ions to allow for shorter
Mg-O bonding. The largest deviation of cf a ratio from the
ideal occurs at approximately 25 mol% MgCOr. At con-
c€ntrations greater than 25 mol% MgCO., substitution of
quencies of the lattice mode bands.Bischoff et al. (1983) also found that biogenic magnesian
calcites generally have unit cell volumes and cfa axial
ratios laiger than synthetic phases of similar magnesium
concentralions. The larger cell volumes of biogenic phases
indicate that some mechanism of disorder probably occurs

BISCHOFF ET AL.: CARBONATE IR2N DIS2RDER IN MAGNESIAN CAL1ITES
in these phases. The variation ofunit cell volumes, cla axialratios, and Raman band halfwidths and frequencies of lat_tice modes in biogenic phases is not as smooth a functionof magnesium concentration as it is for synthetic phases.Generally, biogenic phases exhibit more positional disorderthan synthetic phases of similar magnesium concentration.The differences observed between biogenic and syntheticphases, however, are probably a function of magnesiumheterogeneity and trace element substitution. as well as
"tilt" out of the basal (a axes) planes. All other carbonategroups in this structure are tilted out of the basal plane toprovide shorter Mg-O bonds. Lippman suggested thatsimilar "tilting" mechanisms might occur in magnesian cal-cites because of magnesium substitution.
In a discussion of the "modulated structures" seen inmany TEM analyses of calcite and dolomite, Wenk et al.(1983) suggested that these structures may arise fromperiodic reversals in the orientation of carbonate ionswithin the basal plane. This rotational disorder probably isaccompanied by "tilting" ofcarbonate ions out ofthe basalplane in the vicinity ofthe defects.
A possible interpretation of an X-ray crystal structurerefinement done by Althotr (1977') on an echinoid test isthat positional disorder obtains in this magnesian calcite.On the basis of the thermal parameters of the echinoidinvestigated by Althotr, Reeder (1983) found that the rootmean square amplitudes for the principal axes of the vibra_tional ellipsoids are roughly 40-50% greater than those incalcite. He suggested that whereas it is not unlikely to havegreater thermal vibrations in solid solution, these greaterthermal vibrations probably reflect some positional disor_der. If positional disorder occurs in the vicinity of substitu_ted magnesium ions, averaging the thermal vibrations overthe whole structure by single crystal X-ray diffractionwould increase the value of the thermal parameters.
ConclusionsRaman spectra of synthetic magnesian calcites show be_
havior expected from factor group analysis. Raman fre_quencies of synthetic phases lie between the values for cal-cite and magnesite and shift as a function of magnesiumconcentration. The halfwidths of Raman bands also in_crease as a function of magnesium content. part of theincrease in halfwidths arises from substitution of Mg2* forCa2+ and the subsequent diferences in the immediatecation neighborhood of carbonate anions. The increase in
halfwidths and, probably, the anomalously low frequenciesof its lattice modes.
Biogenic magnesian calcites generally exhibit larger half-widths and lower frequencies of lattice modes than synthet-ic phases of similar magnesium concentrations. This behav-ior of lattice modes arises in part from the presence ofpositional disorder in excess of that found in syntheticphases but probably also from magnesium heterogeneitiesand substitution of trace elements. The fact that biogenicphases generally have larger unit cell volumes and claratios than synthetic phases of similar magnesium con-centration suggests that positional disorder is the majorcontributing factor to the larger halfwidths and low fre-quencies of lattice modes. The presence of trace transitionmetal ions and bicarbonate ions is detectable by the oc-currence of fluorescence and a Raman band at 1014 cm- 1,respectively, in the Raman spectra of biogenic phases.
The presence of positional disorder of the carbonate ionin magnesian calcite has not been previously recognized. Itis likely that positional disorder is an important factor toconsider when modeling the solid solution behavior ofmagnesian calcites at earth surface temperatures and pres-sures. Complete knowledge of the thermodynamic proper-ties of magnesian calcite is essential for an understandingof the widespread occurrence and diagenetic behavior ofmagnesian calcite skeletal materials and cements.
AcknowledgmentsWe gratefully acknowledge Jane Schoonmaker, Keith Chave
and especially Rich Reeder for critically reviewing the manuscript.We thank Murli Manghnani for access to the Ar+ laser and CarolKoyanagi and Pat Sexton for typing the manuscript. Funding forthe Spex Datamate computer was provided by NSF GrantEAR8G26091 (SKS). This work is supported by NSF GrantsEAR82-19513 (FTM) and EAR82-13720 (Finley C. Bishop, North-western University). Hawaii Institute of Geophysics ContributionNo. 1583.
References
Althoff, P. L. (1977) Structural refinements of dolomite and a mag-nesian calcite and implications for dolomite formation in themarine environment. American Mineralogist, 62, 772-783.
Bathurst, R. G. C. (1975) Carbonate Sedimenrs and Their Diage-nesis, 2nd edition. Elsevier, Amsterdam.
Bhagavantam, S. (1941) Raman effect in relation to crystal struc-ture: Lattice oscillations. Proceedings of the Indian Academy ofSciences, A13, 543-563.
Bhagavantam, S. and Venkatarayudu, T. (1939) Raman effect inrelation to crystallographic structure. Proceedings of the IndianAcademy of Sciences, A9,22+258.
Bischo$ W. D., Bishop, F. C., and Mackenzie, F. T. (1983) Bioge-nically produced magnesian calcites: Inhomogeneities in chemi-cal and physical properties; comparison with synthetic phases.American Mineralogist, 68, lt83-1188.
Chave, K. E. (1952) A solid solution between calcite and dolomite.Journal of Geology, 60, l9O-192.
Chave, K. E. (1954a) Aspects of the biogeochemistry of mag-nesium. 1. Calcareous marine organisms. Journal of Geology,62,266-283.
Chave, K. E. (1954b) Aspects of the biogeochemistry of mag-
BISCHOFF ET AL,: CARBONATE IRON DISORDER IN MAGNESIAN CALCITES 589
nesium. 2. Calcareous sediments and rocks. Journal of Geology,62,587-599.
Couture, Lucienne (1947) Etudes des spectres de vibrations demonocristaux ioniques. Annales de Physique (Paris), 17, 88-122.
Effenberger, H., Mereiter, K., and Zemann, J. (1981) Crystal struc-ture refinements of magnesite, calcite, rhodochrosite, siderite,smithsonite and dolomite, with discussion of some aspects ofthe stereochemistry of calcite-type carbonates. Zeitschrift fiirKristallographie, | 56, 233-24f .
Grifiith, W. P. (1975) Raman spectroscopy of tenestrial rninerals.In C. Karr, Jr., Ed., Infrared and Raman Spectroscopy of Lunarand Terrestrial Materials, p.299-323. Academic, New York.
Goldsmith, J. R., Graf, D. L., Joensuu, O. I. (1955) The occurrenceof magnesian calcites in nature. Geochimica et CosmochimicaActa,7,212-230.
Krishnamurti, D. (1956) Raman spectrum of magnesite. Pro-ceedings of the Indian Acadany of Sciences, 443,210-212.
Krishnamurti, D. (1957) The Raman spectrum of calcite and itsinterpretation. Proceedings of the lndian Academy of Sciences,446. 18T202.
Krishnan, R. S. (1945) Raman spectra of the second order in crys-tals. Part 1. Calcite. Proceedings of the Indian Academy ofSciences, A.22, 182-193.
Land, L. S. (1967) Diagenesis of skeletal carbonates. Journal ofSedimentary Petrology, 37, 914-930.
Lippmann, Friedrich (1973) Sedimentary Carbonate Minerals.Springer-Verlag New York.
Mackenzie, F. T., Bischoff, W. D., Bishop, F. C., Loijens, Michele,Schoonmaker, Jane, and Wollast, Roland (1983) Magnesian cal-cites: Low-temperature occurrence, solubility, and solid solu-tion behavior. In R. J. Reeder, Ed., Carbonates: Mineralogy andChemistry. Reviews in Mineralogy, ll, p.97-144. MineralogicalSociety of America, Washington.
Milliman, J. D., Gastner, Manfred, and Muller, Jens (1971) Utili-zation of magnesium in coralline algae. Geological Society ofAmerica Bulletin, 82, 573-580.
Park, K. (1966) New width data of the A,, Raman line in calcite.Physics Letters, 22, 3941.
Porto, S. P. S., Giordmaine, J. A., and Damen, T. C. (1966) Depo-larization of Raman scattering in calcite. Physical Review, 147,608-61 1.
Reeder, R. J. (1983) Crystal chemistry of the rhombohedral car-bonates. In R. J. Reeder, Ed., Carbonates: Mineralogy andChemistry. Reviews in Mineralogy, 11, p. 1-48. MineralogicalSociety of America, Washington.
Rousseau, D. L., Miller, R. F., and Leroi, G. E. (1968) Ramanspectrum of crystalline sodium nitrate. Journal of Chemical
Physics,48, 34W-3413.Rutt, H. N. and Nicola, J. H. (1974) Raman spectra of carbonates
ofcalcite structure. Journal of Physics, C: Solid State Physics, 7,45224528.
Veizer, Jan (1983) Trace elernents and isotopes in sedimentarycarbonates. In R. J. Reeder, Ed., Carbonates: Mineralogy andChemistry. Reviews of Mineralogy, 11, p. 26!300. Mineral-ogical Society of America, Washington.
Wenk, H.-R., Barber, D. J., and Reeder, R. J. (1983) Microstruc-tures in carbonates. In R. J. Reeder, Ed., Carbonates: Mineral-ogy and chemistry. Reviews in Mineralogy, ll, p. 301-367. Min-eralogical Society of America, Washington.
White, A. F. (1975) Sodium and Potassium Coprecipitation inCalcium Carbonate. Ph.D. Thesis, Northwestern University,Evanston.
White, W. B. (1974a) The carbonate minerals. In V. C. Farmer,Ed., The Infra-red Spectra of Minerals. Mineralogical SocietyMonograph 4, p. 227 -284. Mineralogical Society, London.
White, W. B. (1974b) Order-disorder effects. In V. C. Farmer, Ed',The Infra-red Spectra of Minerals. Mineralogical SocietyMonograph 4, p. 87-110. Mineralogical Society, London.
Manuscript receiueil, May 14, 1984;
acceptedfor publication, January 7, 1985.