Embed Size (px)
Citation preview
25. BIOGENIC CARBONATE PRODUCTION AND PRESERVATION CHANGESBETWEEN 5 AND 10 MA FROM THE CEARA RISE, WESTERN EQUATORIAL ATLANTIC1
D.W. Murray2 and L.C. Peterson3
ABSTRACT
This study presents carbonate concentration, accumulation, and preservation data for the middle to late Miocene (~5-10Ma) to examine changes in carbonate sedimentation associated with surface productivity and dissolution at the Ceara Rise inthe western equatorial Atlantic. Time series of magnetic susceptibility-based estimates of calcium carbonate concentration forCeara Rise Sites 925, 928, and 929, which together form a transect that spans approximately 1500 m of water depth (3041-4356 m), show substantial changes in the depth gradient of calcium carbonate concentration between 5 and 10 Ma. The esti-mated carbonate concentrations at the shallow Site 925 were relatively high ( = 77.2%) throughout this whole time interval.Prior to about 5.5 Ma, only trace amounts of carbonate are preserved at the deep Site 929, indicating that the carbonate compen-sation depth (CCD) was close to or shallower than the depth of this site during most of the middle to late Miocene. To furtherexamine these gradients, we generated carbonate concentration, accumulation, and foraminiferal preservation data for four rep-resentative time slices from Sites 925, 928, and 929.
The results show that, during the late Miocene, the quasi-cyclic changes in carbonate concentration at shallow Site 925 canbe attributed to either production or dilution by terrigenous material, depending on the interval. Calcium carbonate sedimenta-tion at Site 925 averaged >20 g/m2/yr, more than twice the Holocene rates. The foraminiferal assemblage was extremely wellpreserved, and the sediment ßuxes reßect carbonate rain rates to the seaßoor. These high accumulation rates are comparable tothe highest sediment trap-measured ßuxes of carbonate from the equatorial PaciÞc. In contrast, calcium carbonate at the deepsites is heavily dissolved and dissolution was the dominant control of concentration changes. This decrease reßects a shoalingof the CCD, which coincides with a period of sea level rise. The results are not consistent with an increase of North AtlanticDeep Water (NADW) during the late Miocene, although further work is necessary to evaluate the relative contributions ofNADW and southern component water at this site.
x
INTRODUCTION
One of the primary objectives of Ocean Drilling Program (ODP)Leg 154 was to recover sediments from a depth transect of sites downthe Ceara Rise to study deep-water chemistry and circulation changesin the tropical Atlantic. Located in the main flow path of the two ma-jor deep-water masses in the Atlantic Ocean, North Atlantic DeepWater (NADW) and Antarctic Bottom Water (AABW), the CearaRise is ideally situated to record variations in the mixing of these wa-ter masses that produce the chemical and physical characteristics ofdeep waters in the worldÕs oceans today. The present mixing zone be-tween NADW and AABW in the western equatorial Atlantic lies be-tween 4000 and 4500 m water depth. Thus, the three shallow sitescored during ODP Leg 154, Sites 925, 926, and 927, are from loca-tions presently bathed by NADW. Site 928 is within the mixing zoneand Site 929 is bathed by AABW (Curry, Shackleton, Richter, et al.,1995). Studies have shown glacial to interglacial changes in the rela-tive proportion and mixing of the deep waters in the Atlantic (e.g.,Oppo and Fairbanks, 1987; Curry et al., 1988; Charles and Fairbanks,1992). During the last glaciation, there was a greater proportion ofSouthern Ocean deep water at the Ceara Rise. Associated with this in-crease in the more corrosive Southern Ocean water during the glacialwas a significant increase in carbonate dissolution at sites below 4000m in the western Atlantic (Curry and Lohmann, 1990). On longertime scales, such changes in dissolution should also have occurred.
1Shackleton, N.J., Curry, W.B., Richter, C., and Bralower, T.J. (Eds.), 1997. Proc.ODP, Sci. Results, 154: College Station, TX (Ocean Drilling Program).
2Department of Geological Sciences, Brown University, Providence, RI, 02912U.S.A. [email protected]
3Rosenstiel School of Marine and Atmospheric Science, University of Miami,Miami, FL 33149, U.S.A.
Table of CTable of CPrevious ChapterPrevious Chapter
Preliminary shipboard data for the 5- to 15-Ma interval show thatcarbonate accumulation at the deeper sites was 60%-100% lowerthan at the shallower sites (Shipboard Scientific Party, 1995a). Thishigh loss of carbonate with depth reflects a shoaling of the carbonatecompensation depth (CCD) close to the depth of Site 928 (currently4012 m) compared to preceding and following time intervals. Forcomparison, the present CCD is below 4600 m for the modern andlast glacial interval (Curry and Lohmann, 1990). A shoaling of theCCD is also observed in the late Miocene in the equatorial Indian andPacific Oceans (ODP Leg 115, Peterson and Backman, 1990; ODPLeg 130, Berger et al., 1993). In contrast, mean carbonate accumula-tion rates during the late Miocene and early Pliocene at the shallowsites on the Ceara Rise were at least twice the modern rates (Ship-board Scientific Party, 1995a). Between 5 and 7 Ma, similar increasesin calcium carbonate accumulation have been observed in all the ma-jor oceans and have been attributed to an increase in surface produc-tion (Peterson et al., 1992; Berger et al., 1993; Dickens and Owen,1994; Farrell et al., 1995). Berger et al. (1993) called upon an in-crease in the production of NADW as being responsible for thechanges observed in the Pacific. Berger et al. (1993) note that thisÒmodulatorÓ of carbonate sedimentation would cause a PacificÐAtlantic asymmetry. The preliminary data on carbonate accumula-tion in the late Miocene from the Ceara Rise (Curry, Shackleton,Richter, et al., 1995) indicate that this asymmetry did not exist, andthe records from the equatorial Pacific, Indian, and Atlantic Oceansall show similar shallow to deep patterns of accumulation.
Because the shipboard results provide only a coarse view of thecalcium carbonate variations, the goal of this study is to examine theAtlantic pattern between 5 and 10 Ma in greater detail. Four discretetime intervals that represent different CaCO3 concentration gradientsat the Ceara Rise were sampled in sufficient detail to resolve orbital-scale variations. Data on carbonate concentration, accumulation, and
375ontentsontents Next ChapterNext Chapter
D.W. MURRAY, L.C. PETERSON
µ µ wy n
thta
sub-orallyers.am- ad- wen:
with
n au-Uni-90).oric sys-suredO00% mg.renced de-am- for
ter-r the
25,onatesesich-
preservation are used to decipher variations attributed to CaCO3 pro-duction, dissolution, and dilution. These data from the western tropi-cal Atlantic will be compared with gradients of carbonate accumula-tion from other oceanic sites to provide a broader perspective of deepsea carbonate changes in the late Miocene and to evaluate the pro-posed basin-to-basin fractionation model (Berger et al., 1993).
METHODS
Between 5 and 10 Ma, four time slices of approximately 400 k.y.in length were sampled at 10-cm intervals from ODP Sites 925 and928 on the Ceara Rise (Fig. 1). The selected time intervals, 5.0−5.4,6.0−6.4, 8.0−8.4, and 9.6−10.0 Ma, were chosen to reflect variationsin the depth gradient of CaCO3 concentrations observed in the lateMiocene (Curry, Shackleton, Richter, et al., 1995). The 5.0−5.4 Matime interval was also sampled at Site 929. Sediments in the threeolder time intervals at Site 929 consisted of either trace amounts ofcarbonate material or contorted sediments thought to be redeposited,slumped material (Shipboard Scientific Party, 1995c).
The 10-cm3 samples were taken from multiple holes at the sitesfollowing the composite section developed during Leg 154 (Curry,Shackleton, Richter, et al., 1995). Preliminary ages based on bio-stratigraphy (Curry, Shackleton, Richter, et al., 1995) were used toguide the sampling. All samples were freeze-dried, then split in half.One-half was weighed, disaggregated in tap water, wet-sievedthrough a 63-µm sieve, and dried at 50°C. The fine fraction (<63was dried and stored for future studies. The coarse fraction (>63was weighed and dry-sieved at 150 µm. The >150 µm portionweighed and divided equally into two aliquots, one for the studfaunal preservation (this study) and the other for stable isotope asis at the University of Miami.
The faunal aliquot work was subdivided to obtain a representasample of approximately 400 whole planktonic foraminifers. Tnumber of whole planktonic foraminifers, planktonic fragmenbenthic foraminifers, and radiolarians were tabulated for each s
376
m)m)as
ofaly-
ivee
s,m-
ple. In some Site 928 and 929 samples where fragmentation wasstantial, small splits with 50−100 whole foraminifers were used tobtain the preservation data. Benthics were relatively rare, geneless than five in samples having 400 whole planktonic foraminifOnly one or two radiolarians were observed in all the samples exined, confirming the lack of biogenic opal in these sediments. Indition to the weight percentage in the sand (>63 µm) fraction,used the following equation as an index of carbonate preservatio
whole planktonic foraminifers (%) = 100 × # whole planktonic foraminifers >150 µm / (# whole planktonic foraminifers >150µm + # planktonic fragments >150 µm).
One-third of the remaining unprocessed sample was ground a mortar and pestle and used to determine CaCO3 concentration. Thecalcium carbonate content of dried samples was measured on atomated, computer-controlled carbonate rig developed at Brown versity and similar to the one described by Ostermann et al. (19Approximately 10 mg of sample were reacted in 100% phosphacid at a constant temperature of 70°C in an evacuated, closedtem. The pressure of the gas evolved from the reaction was meaon a pressure transducer. This pressure was converted to %CaC3 us-ing a linear regression model based on five to six aliquots of a 1carbonate standard in each run with weights ranging from 3 to 12Precision of the standards was better than 1%. The mean diffeof replicates on 103 samples in this study is 3.3% with a standarviation of 3.5%. Because of the longer reaction time needed for sples with a high clay content, we used a reaction time of 30 minsamples <50% CaCO3 and 10 min for samples >50% CaCO3. Pres-sure readings at 1-min intervals for the 10-min runs and 3-min invals for the 30-min runs were retained for each sample to monitoreaction.
Twenty-five of the shipboard carbonate samples from Sites 9928, and 929 spanning the late Miocene were analyzed for carbcontent using the Brown Rig (Table 1). A comparison with analymade during Leg 154 using a Coulometer (Curry, Shackleton, R
Site 929Site 928
Site 925
5° S
5°
0°
10°N50°W 45° 40° 35°
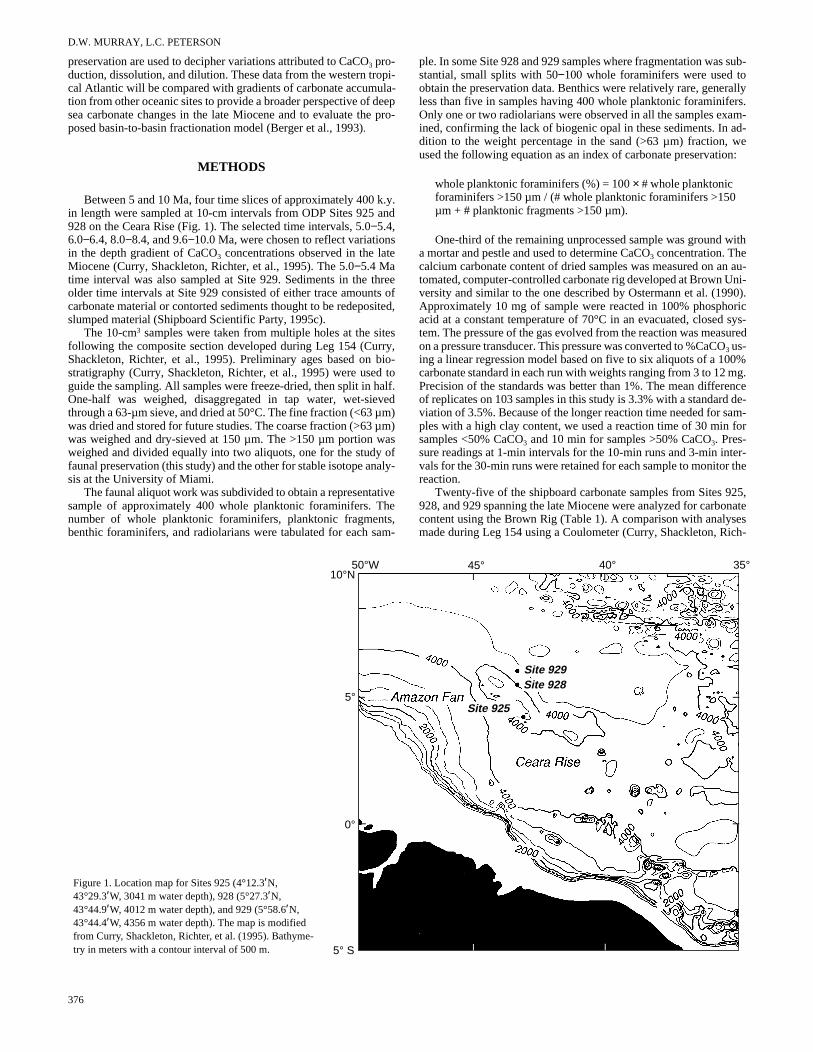
Figure 1. Location map for Sites 925 (4°12.3′N, 43°29.3′W, 3041 m water depth), 928 (5°27.3′N, 43°44.9′W, 4012 m water depth), and 929 (5°58.6′N, 43°44.4′W, 4356 m water depth). The map is modified from Curry, Shackleton, Richter, et al. (1995). Bathyme-try in meters with a contour interval of 500 m.
BIOGENIC CARBONATE PRODUCTION AND PRESERVATION
ter, et al., 1995) shows no systematic offsets (Fig. 2), with the differ-ences within the analytical errors of the two techniques.
RESULTS
Depth Transect of Carbonate Concentrations (5−10 Ma)
Multisensor track measurements provide a rapid analysis of cen-timeter-scale changes in sediment properties and chemistry. The re-sulting records allow an evaluation of both high-frequency and long-term changes in the sediment record that can be examined in the con-text of climate and oceanographic change (Hagelberg et al., 1995a,1995b; Shackleton et al., 1995). During ODP Leg 154, a number ofsediment properties measured with the multisensor track and hand-held Spectrophotometer were compared to the calcium carbonatecontent of the sediments (Curry, Shackleton, Richter, et al., 1995).Because the Ceara Rise sediments are largely a mixture of calciumcarbonate and terrigenous material, properties such as magnetic sus-ceptibility, color reflectance, and natural gamma radiation are highlycorrelated to the carbonate content. However, the shipboard studiesshowed that their relationships to carbonate content were not constantand changed from site to site and among the lithologic units. In thisstudy we compared color reflectance (percentage at 550 nm) andmagnetic susceptibility data to measured %CaCO3 values in samplesfrom Site 925, 928, and 929 spanning the 5- to 10-Ma time interval(Fig. 3; Tables 2−4, see CD-ROM, back pocket, this volume).
Magnetic susceptibility and reflectance values for the sampledepths were obtained by linear interpolation from shipboard measureddepths. Magnetic susceptibility provides the best correlation (r = −0.95)to carbonate and one regression equation based on this relationship canbe applied to all sites (%CaCO3 = 93.624 − [2.164 × magnetic suscep-tibility]). Reflectance exhibits a curvilinear relationship with calciumcarbonate and separate equations are needed for each site. This inter-site difference is evident in Figure 3A where Site 928 values are shown
Table 1. Carbonate comparison of shipboard Coulometer and Brownautomated rig measurements.
aInterval is the top of a 1-cm-wide sample.bFrom Curry, Shackleton, Richter, et al. (1995).c30-min run.d30-min run for samples <50% CaCO3, 10 min for samples >50% CaCO3.eEstimate from magnetic susceptibility using equation given in text.
Core, section, interval (cm)a
CaCO3 (%) Coulometerb
CaCO3 (%) Brown Rig-1c
CaCO3 (%) Brown Rig-2d
CaCO3 (%) Mag. estimatee
154-925B-15H-3, 77 85.6 89.0 92.7 69.316H-3, 115 69.6 71.6 74.2 74.417H-3, 69 66.8 68.5 70.7 58.518H-3, 106 74.6 75.8 79.4 77.319H-3, 132 75.0 78.1 75.5 78.820H-3, 90 83.6 85.9 80.1 83.921H-3, 135 72.8 75.0 74.0 78.222H-3, 50 68.1 70.5 68.9 69.423H-3, 33 59.7 60.6 58.4 64.824H-3, 97 78.4 83.0 79.3 80.625H-3, 100 66.7 69.5 64.8 68.026H-3, 116 81.0 74.5 76.2 74.127H-3, 130 50.7 52.8 51.3 59.228H-3, 56 80.7 79.0 78.1 80.6
154-928A-16H-2, 47 26.0 26.1 25.5 16.816H-3, 73 48.6 49.8 50.4 50.617H-3, 81 39.1 38.6 40.1 26.819H-3, 85 81.8 84.5 79.7 75.720H-3, 81 73.3 75.9 74.9 70.621H-2, 110 0.7 0.5 3.1 9.422H-3, 34 16.0 16.8 21.2 18.123X-3, 75 48.2 51.9 42.4 79.8
154-929A-15H-1, 77 42.5 41.7 46.9 48.815H-3, 79 26.5 24.4 28.1 35.9
to have higher reflectance values for the same calcium carbonate con-centration than either Sites 925 or 929. The accuracy of the magneticsusceptibility-based estimate is shown in Figure 4A. The estimatedCaCO3 concentrations accurately represent the primary cycles in mea-sured concentration with no major systematic offsets. Differences inthe amplitude and structure of some cycles are evident (Fig. 4) andmost likely result from variations in the composition of the non-carbon-ate portion of the sediments.
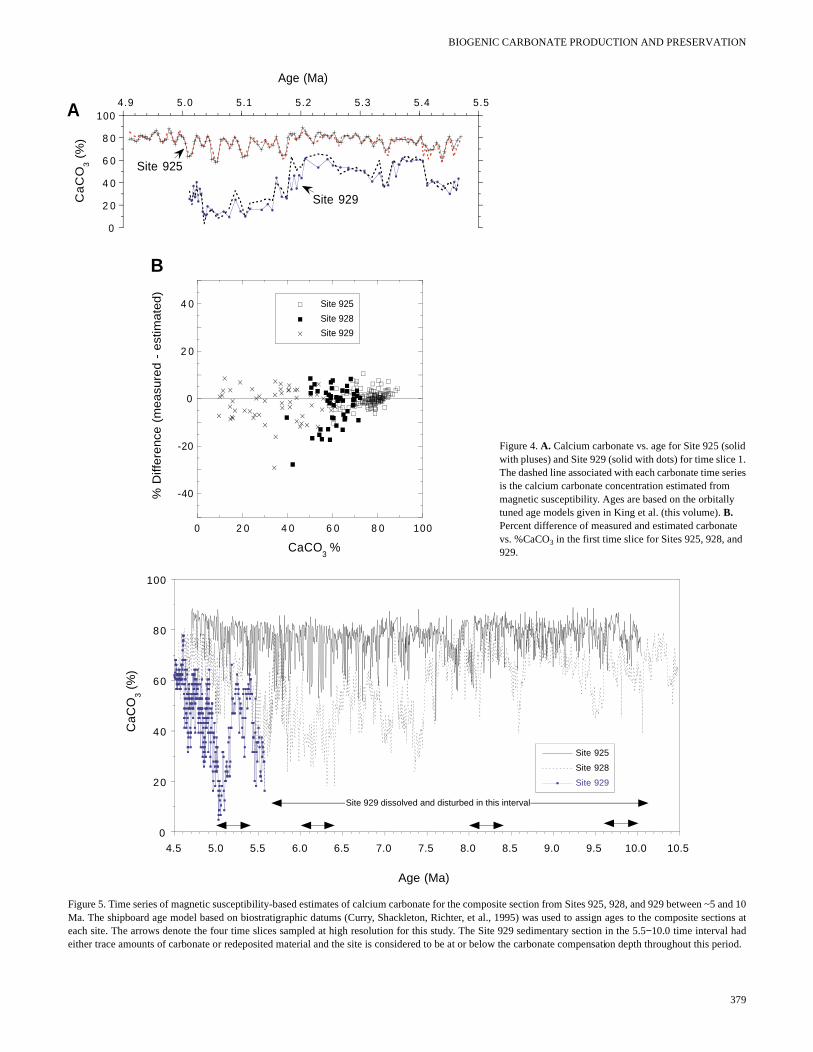
Carbonate concentrations estimated from magnetic susceptibilitydata measured on the shipboard composite of Sites 925, 928, and 929for the intervals spanning approximately 5−10 Ma are shown in Fig-ure 5. As noted previously, sections of Site 929 prior to 5.5 Ma hadeither trace amounts of carbonate or were riddled with redepositedmaterial. We do not include carbonate estimates from this older inter-val of Site 929 and assume that the site was at or below the CCDthroughout this time period. Carbonate concentrations in Site 925 re-mained relatively high ( = 77.2%) between 5 and 10 Ma (Fig. 5),whereas the concentrations in Site 928 (~1000 m deeper) were morevariable. We infer that these changes at the deep site reflect variabledissolution of CaCO3. Alternatively, the lower carbonate at depthcould also reflect the input of terrigenous material from the prograd-ing Amazon Fan. However, preliminary shipboard estimates of meannon-carbonate accumulation rates over this interval and the poorpreservation of CaCO3 in the deeper Sites 928 and 929 suggest thatcarbonate dissolution was responsible for the large-scale changes.The late Miocene Site 925 carbonate record (Fig. 5) exhibits a high-frequency change in carbonate content that exhibits a precessional(23 k.y.) cyclicity (i.e., ~5 cycles/100 k.y.). These cycles do not ap-pear to be well developed at the deeper sites. To determine the originof these cycles and quantify the depth gradients of carbonate dissolu-tion, we selected four intervals to examine in greater detail.
Time Slices
A total of 410 samples from Site 925, 154 samples from Site 928,and 60 samples from Site 929, covering the four time slices between5 and 10 Ma, were analyzed for percentage coarse fraction and calci-
x
0
20
40
60
80
100
0 20 40 60 80 100
Ca
CO
3 % -
Bro
wn
Rig
CaCO3 %-Shipboard Coulometer
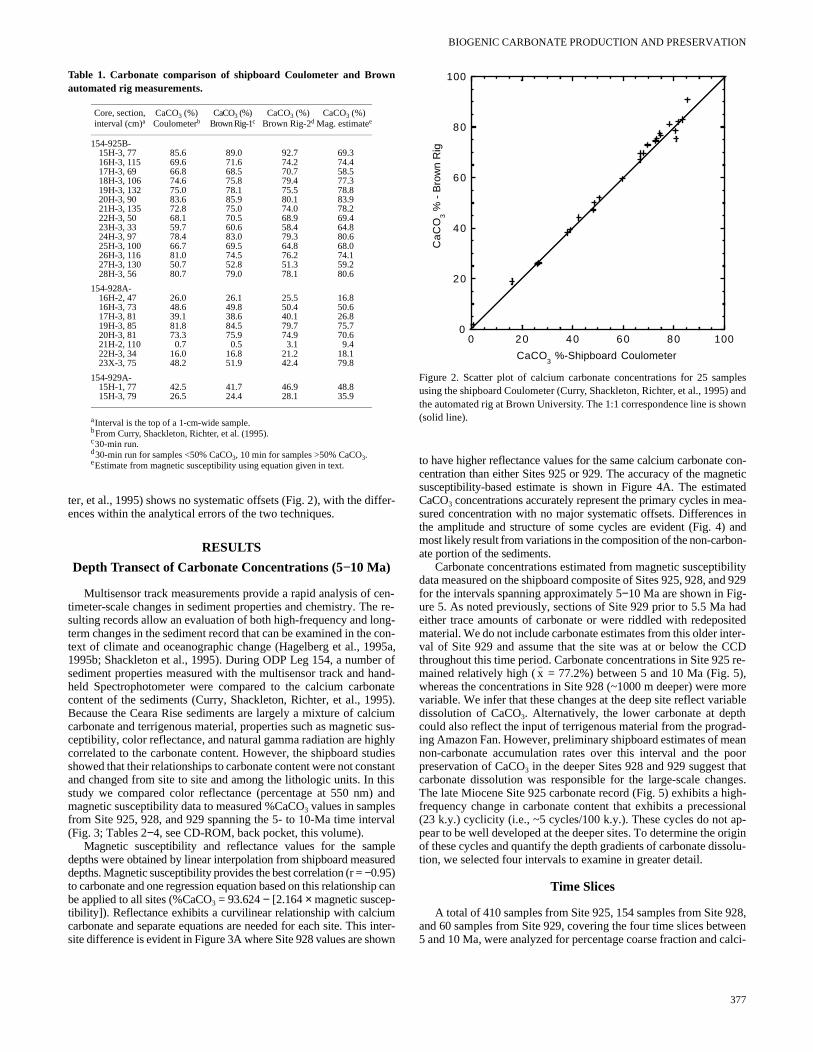
Figure 2. Scatter plot of calcium carbonate concentrations for 25 samplesusing the shipboard Coulometer (Curry, Shackleton, Richter, et al., 1995) andthe automated rig at Brown University. The 1:1 correspondence line is shown(solid line).
377
D.W. MURRAY, L.C. PETERSON
as abearite ma-ut-ion car-
t%
e de-
asso-infereast
po- thatthattionfine-oduc-ate
um carbonate concentration. Foraminiferal preservation data wereobtained for 481 of these samples. These data are given in Tables 2−4 (see CD-ROM, back pocket, this volume). Chronologies for Sites925, 928, and 929 were developed by King et al. (this volume). Theseage models are based on correlation of the carbonate changes at eachsite to the orbitally tuned record of carbonate cycles at Site 926(Shackleton and Crowhurst, this volume). Ages were assigned tosamples in this study through interpolation by assuming a linear sed-imentation rate of composite depth between datums. Sedimentationrates were assigned to each sample by the composite depth and agedifference between a sample and the adjacent older sample:
Sedimentation rate(i) = [Depth(i+1) − Depth(i)] / [Age(i+1) − Age(i)].
Dry densities, needed to calculate mass accumulation rates(MARs), were estimated from shipboard gamma-ray attenuation po-rosity evaluator (GRAPE) measurements. Separate relationships
0
20
40
60
80
100
0 10 20 30 40 50
Site 925Site 928Site 929
Ca
CO
3 % -
Bro
wn
Rig
Magnetic Susceptibility (x10-6 cgs)
A
0
20
40
60
80
100
0 10 20 30 40 50 60
Site 925Site 928Site 929
Ca
CO
3 % -
Bro
wn
Rig
Reflectance (%550 nm)
B
Figure 3. Scatter plots of (A) %CaCO3 and magnetic susceptibility and (B)%CaCO3 and reflectance for the 550-nm band for samples from Sites 925,928, and 929. The linear regression model (%CaCO3 = 93.624 − [2.164 ×magnetic susceptibility]; r2 = 0.90) shown in (A) (solid line) was used to cal-culate calcium carbonate concentrations from the magnetic susceptibilitymeasurements of the composite section between 5 and 10 Ma at the threesites.
378
were developed for each site based on the comparison of discrete drydensity (Curry, Shackleton, Richter, et al., 1995) and GRAPE mea-surements over the interval of study (Table 5). GRAPE values wereassigned to sample depth in this study by linear interpolation. We ap-plied the equations given in Table 5 to calculate the dry-density val-ues given in Tables 2−4. The composites of GRAPE data from allthree sites showed a number of sections with anomalous low valuesthat we consider spurious and unreliable. Data from these sectionswere deleted from the composite, and densities are assumed tochange linearly through these intervals (see notes in Tables 2−4). Be-cause of the small density changes observed, this assumption shouldnot introduce significant errors to the MARs.
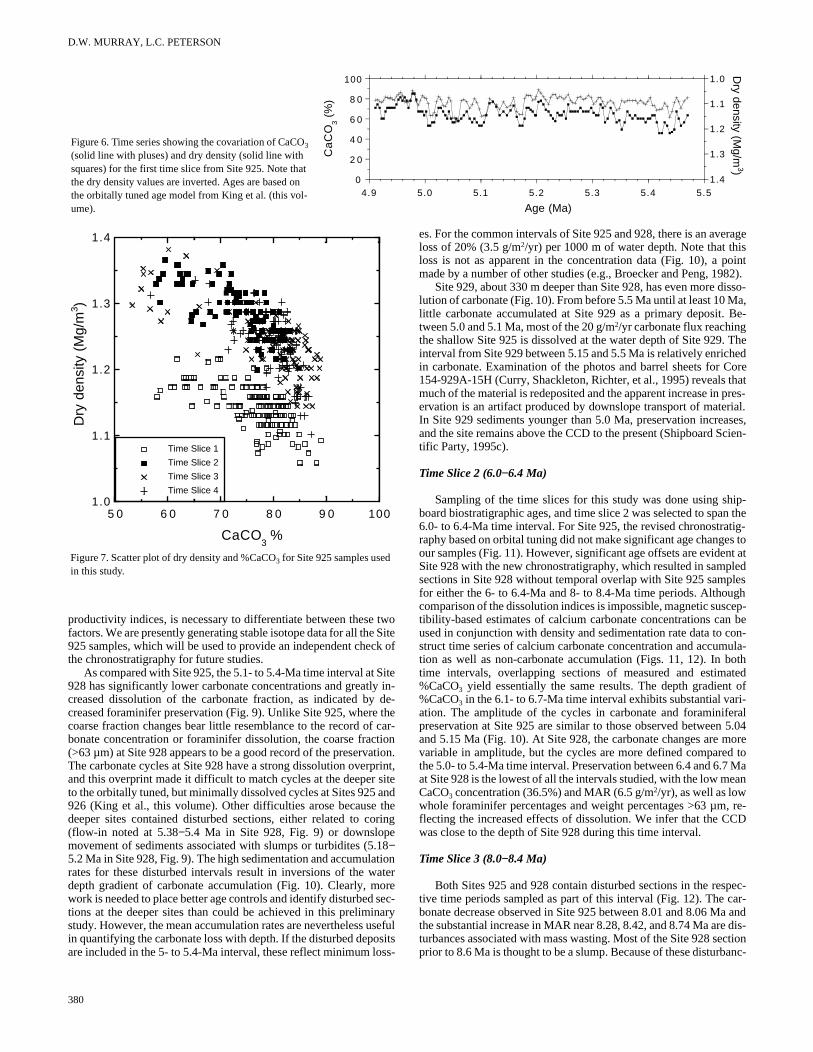
As noted by the shipboard studies (Shipboard Scientific Party,1995b), there is a general correlation of carbonate concentration anddensity at the Ceara Rise sites, with higher densities observed in thecarbonate-poor sections. This relationship is atypical for pelagic ma-rine settings containing mostly carbonate and terrigenous material(Herbert and Mayer, 1991) and may result from differential compac-tion of a lithogenic component that is enriched in quartz (see Herbertet al., this volume). Of the three sites studied, the carbonate and den-sity relationship was best developed at the shallow Site 925 (Figs. 6,7). In addition, Figure 7 shows that the densities in time slice 1 aresignificantly less than those in deeper Site 925 samples with similarcarbonate contents. This reflects the normal downhole increase indensity attributed to compaction. Shipboard scientists observed thatthe depth interval from 210 to 340 mbsf, which includes time slices3 and 4 had an inverse or only a small density change with depth(Shipboard Scientific Party, 1995b). This may explain the lack of thenormal downhole increase in density among time slices 2 through 4(Fig. 7). Detailed investigation of the cause of this lack of gradient inthe densities was beyond the scope of this study.
Time Slice 1 (5.0−5.4 Ma)
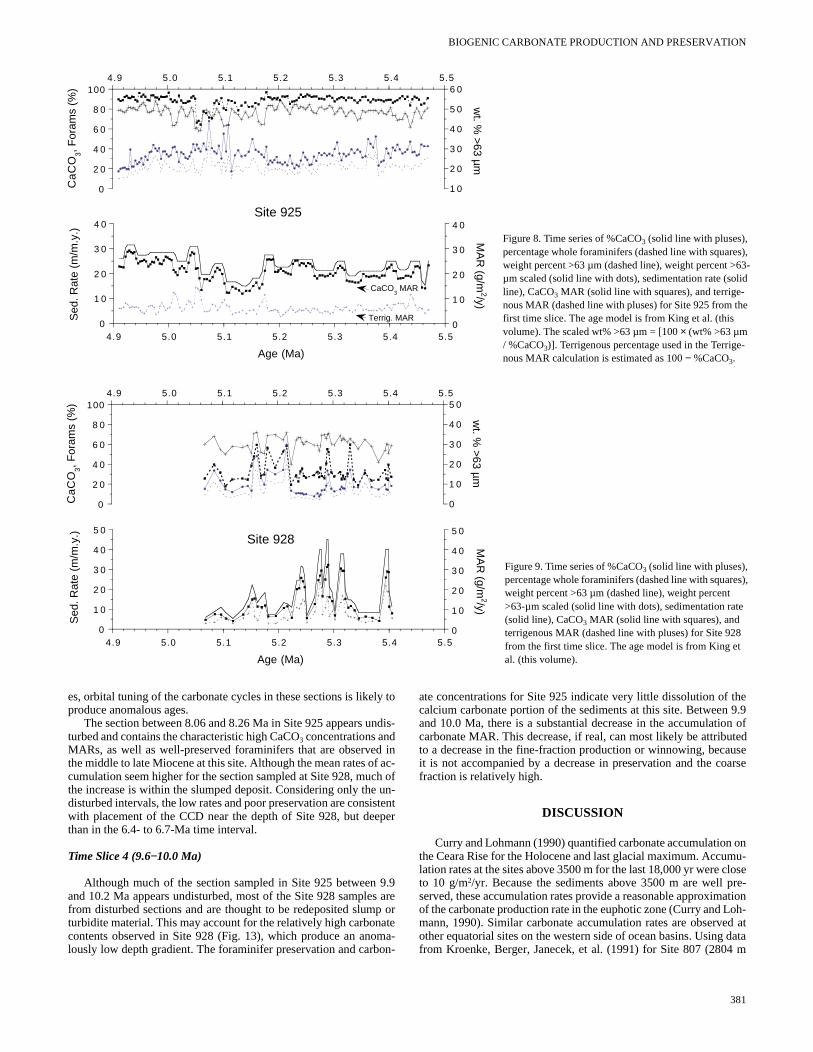
Calcium carbonate concentrations at Site 925 between 4.9 and 5.5Ma have a low amplitude of variability, ranging from 60% to 89%with a cyclic period of close to 23 k.y. (Fig. 8). The largest variationsoccur between 5.0 and 5.18 Ma, with a significant low in carbonateconcentration near 5.06 Ma. This decrease is accompanied by a de-crease in foraminifer preservation (Forams % in Fig. 8). Foraminifersare very well preserved throughout much of this time interval and,with the exception of the event near 5.06 Ma, these data indicate thatdissolution plays a small role in variations in carbonate content at thissite. Variations in coarse fraction (% >63 µm), commonly used dissolution index (Berger et al., 1982; Peterson and Prell, 1985), little resemblance to the foraminifer index of dissolution from S925. Since all the >63 µm fraction consists of biogenic carbonateterial, weight changes in the fine fraction may potentially be attribed to terrigenous dilution. In an attempt to ameliorate the dilutproblem, we scaled the coarse fraction as a function of calciumbonate concentration (Shackleton and Crowhurst, this volume) [w>63 µm-scaled = 100 × (wt% >63 µm / %CaCO3)], to show weightchanges in the carbonate portion of the sediments. Note that thcrease in foraminifer preservation and %CaCO3 near 5.06 Ma is notassociated with a decrease in the scaled coarse fraction, but it isciated with a decrease in weight percentage >63 µm (Fig. 8). We from these data that terrigenous dilution is responsible for at lsome of the %CaCO3 decrease.
The accumulation rates of both carbonate and terrigenous comnents are variable between 5.0 and 5.4 Ma (Fig. 8), suggestingchanges in both production and dilution are likely factors. Note the interval from 5.04 to 5.15 Ma has both high-scaled coarse fracand low carbonate MARs. Taken together, these suggest that fraction carbonate decreased, either as a result of changes in prtion or winnowing. Further work, which includes assessing carbon
BIOGENIC CARBONATE PRODUCTION AND PRESERVATION
0
2 0
4 0
6 0
8 0
1004.9 5.0 5.1 5.2 5.3 5.4 5.5
Ca
CO
3 (
%)
Age (Ma)
A
Site 929
Site 925
-40
-20
0
2 0
4 0
0 2 0 4 0 6 0 8 0 100
Site 925
Site 928
Site 929
% D
iffe
ren
ce (
me
asu
red
- e
stim
ate
d)
CaCO3 %
B
Figure 4. A. Calcium carbonate vs. age for Site 925 (solid with pluses) and Site 929 (solid with dots) for time slice 1. The dashed line associated with each carbonate time series is the calcium carbonate concentration estimated from magnetic susceptibility. Ages are based on the orbitally tuned age models given in King et al. (this volume). B. Percent difference of measured and estimated carbonate vs. %CaCO3 in the first time slice for Sites 925, 928, and 929.
0
20
40
60
80
100
4.5 5.0 5.5 6.0 6.5 7.0 7.5 8.0 8.5 9.0 9.5 10.0 10.5
Site 925
Site 928
Site 929
CaC
O3 (
%)
Age (Ma)
Site 929 dissolved and disturbed in this interval
Figure 5. Time series of magnetic susceptibility-based estimates of calcium carbonate for the composite section from Sites 925, 928, and 929 between ~5 and 10Ma. The shipboard age model based on biostratigraphic datums (Curry, Shackleton, Richter, et al., 1995) was used to assign ages to the composite sections ateach site. The arrows denote the four time slices sampled at high resolution for this study. The Site 929 sedimentary section in the 5.5−10.0 time interval hadeither trace amounts of carbonate or redeposited material and the site is considered to be at or below the carbonate compensation depth throughout this period.
379
D.W. MURRAY, L.C. PETERSON
0
2 0
4 0
6 0
8 0
100
4.9 5.0 5.1 5.2 5.3 5.4 5.5
1.0
1.1
1.2
1.3
1.4
Ca
CO
3 (%
)
Dry density (M
g/m3)
Age (Ma)
Figure 6. Time series showing the covariation of CaCO3 (solid line with pluses) and dry density (solid line with squares) for the first time slice from Site 925. Note that the dry density values are inverted. Ages are based on the orbitally tuned age model from King et al. (this vol-ume).
apsa
oe.1tao n
s
rageisoint82).isso-a,
Be-
Thehed
orehatpres-rial.ses,cien-
ip-n thetig-s to
nt atledlesghcep- beon-ula-othted
t ofri-ral5.04ore
d to Maean
, re-CD
pec-ar-a and dis-ctionanc-
productivity indices, is necessary to differentiate between these twofactors. We are presently generating stable isotope data for all the Site925 samples, which will be used to provide an independent check ofthe chronostratigraphy for future studies.
As compared with Site 925, the 5.1- to 5.4-Ma time interval at Site928 has significantly lower carbonate concentrations and greatly in-creased dissolution of the carbonate fraction, as indicated by de-creased foraminifer preservation (Fig. 9). Unlike Site 925, where thecoarse fraction changes bear little resemblance to the record of car-bonate concentration or foraminifer dissolution, the coarse fraction(>63 µm) at Site 928 appears to be a good record of the preservThe carbonate cycles at Site 928 have a strong dissolution overand this overprint made it difficult to match cycles at the deeper to the orbitally tuned, but minimally dissolved cycles at Sites 925 926 (King et al., this volume). Other difficulties arose because deeper sites contained disturbed sections, either related to c(flow-in noted at 5.38−5.4 Ma in Site 928, Fig. 9) or downslopmovement of sediments associated with slumps or turbidites (5−5.2 Ma in Site 928, Fig. 9). The high sedimentation and accumularates for these disturbed intervals result in inversions of the wdepth gradient of carbonate accumulation (Fig. 10). Clearly, mwork is needed to place better age controls and identify disturbedtions at the deeper sites than could be achieved in this prelimistudy. However, the mean accumulation rates are nevertheless uin quantifying the carbonate loss with depth. If the disturbed depoare included in the 5- to 5.4-Ma interval, these reflect minimum lo
1.0
1.1
1.2
1.3
1.4
5 0 6 0 7 0 8 0 9 0 100
Time Slice 1
Time Slice 2
Time Slice 3
Time Slice 4
Dry
den
sity
(M
g/m
3 )
CaCO3 %
Figure 7. Scatter plot of dry density and %CaCO3 for Site 925 samples usedin this study.
380
tion.rint,itend
thering
8ionterre
sec-arysefulsitss-
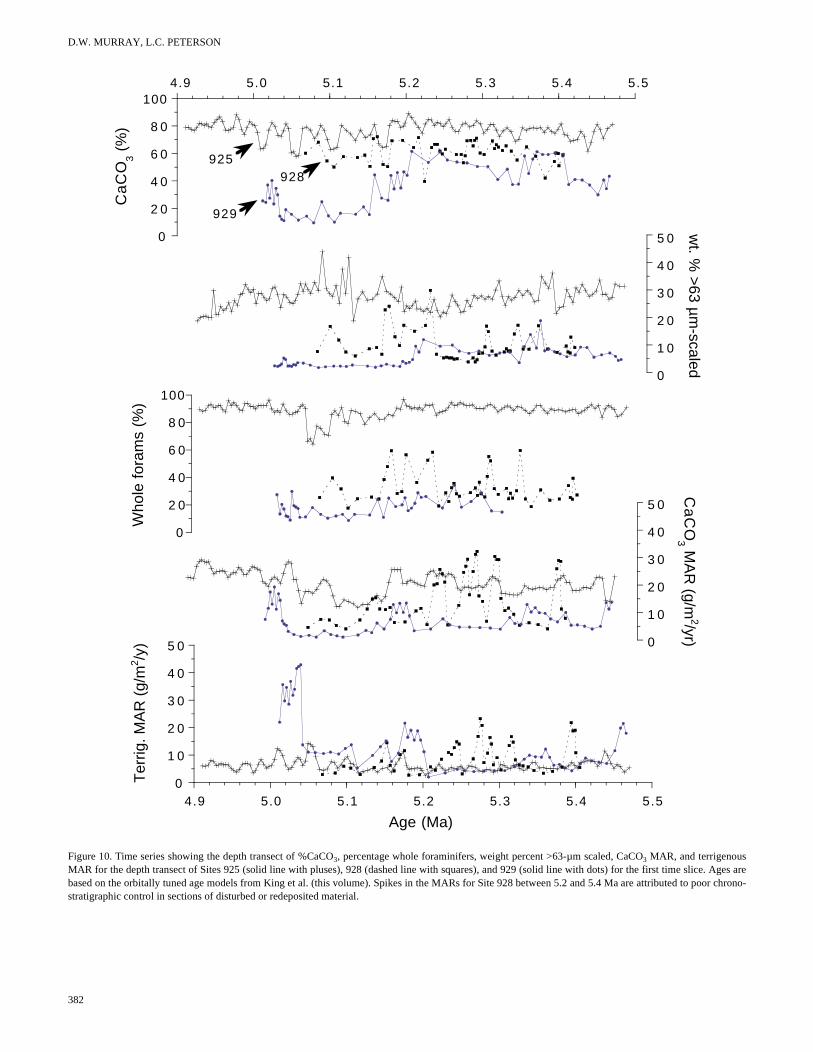
es. For the common intervals of Site 925 and 928, there is an aveloss of 20% (3.5 g/m2/yr) per 1000 m of water depth. Note that thloss is not as apparent in the concentration data (Fig. 10), a pmade by a number of other studies (e.g., Broecker and Peng, 19
Site 929, about 330 m deeper than Site 928, has even more dlution of carbonate (Fig. 10). From before 5.5 Ma until at least 10 Mlittle carbonate accumulated at Site 929 as a primary deposit. tween 5.0 and 5.1 Ma, most of the 20 g/m2/yr carbonate flux reachingthe shallow Site 925 is dissolved at the water depth of Site 929. interval from Site 929 between 5.15 and 5.5 Ma is relatively enricin carbonate. Examination of the photos and barrel sheets for C154-929A-15H (Curry, Shackleton, Richter, et al., 1995) reveals tmuch of the material is redeposited and the apparent increase in ervation is an artifact produced by downslope transport of mateIn Site 929 sediments younger than 5.0 Ma, preservation increaand the site remains above the CCD to the present (Shipboard Stific Party, 1995c).
Time Slice 2 (6.0−6.4 Ma)
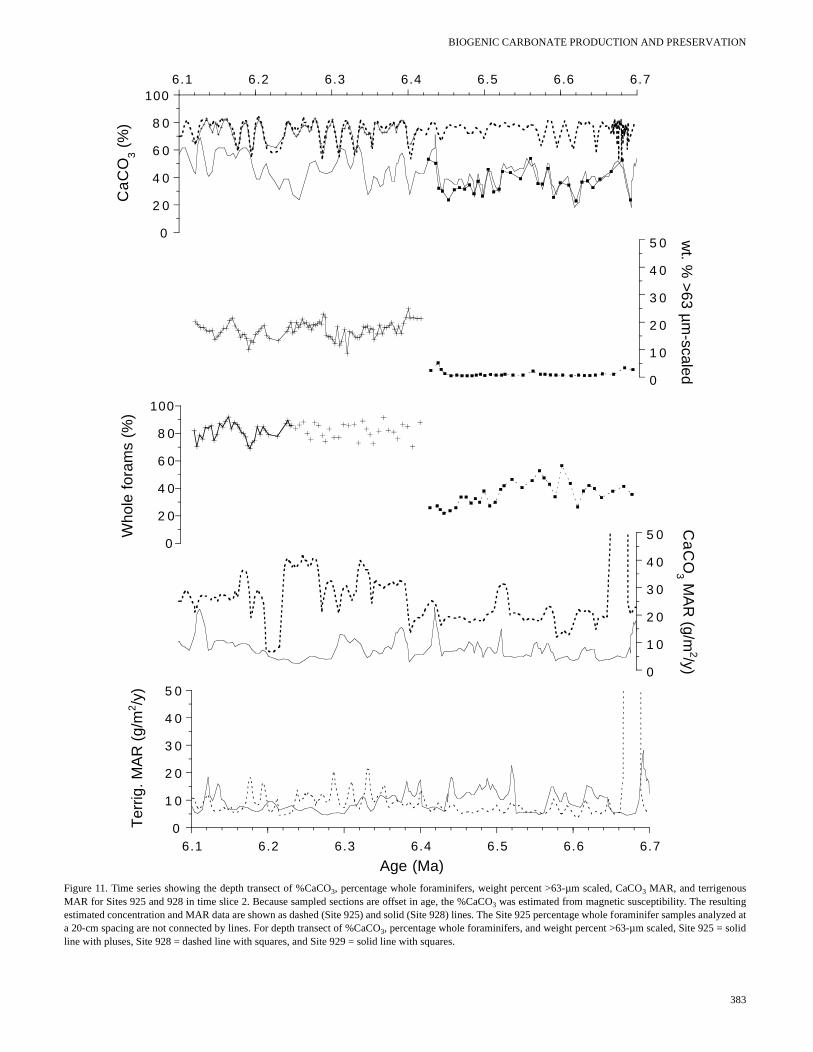
Sampling of the time slices for this study was done using shboard biostratigraphic ages, and time slice 2 was selected to spa6.0- to 6.4-Ma time interval. For Site 925, the revised chronostraraphy based on orbital tuning did not make significant age changeour samples (Fig. 11). However, significant age offsets are evideSite 928 with the new chronostratigraphy, which resulted in sampsections in Site 928 without temporal overlap with Site 925 sampfor either the 6- to 6.4-Ma and 8- to 8.4-Ma time periods. Althoucomparison of the dissolution indices is impossible, magnetic sustibility-based estimates of calcium carbonate concentrations canused in conjunction with density and sedimentation rate data to cstruct time series of calcium carbonate concentration and accumtion as well as non-carbonate accumulation (Figs. 11, 12). In btime intervals, overlapping sections of measured and estima%CaCO3 yield essentially the same results. The depth gradien%CaCO3 in the 6.1- to 6.7-Ma time interval exhibits substantial vaation. The amplitude of the cycles in carbonate and foraminifepreservation at Site 925 are similar to those observed between and 5.15 Ma (Fig. 10). At Site 928, the carbonate changes are mvariable in amplitude, but the cycles are more defined comparethe 5.0- to 5.4-Ma time interval. Preservation between 6.4 and 6.7at Site 928 is the lowest of all the intervals studied, with the low mCaCO3 concentration (36.5%) and MAR (6.5 g/m2/yr), as well as lowwhole foraminifer percentages and weight percentages >63 µmflecting the increased effects of dissolution. We infer that the Cwas close to the depth of Site 928 during this time interval.
Time Slice 3 (8.0−8.4 Ma)
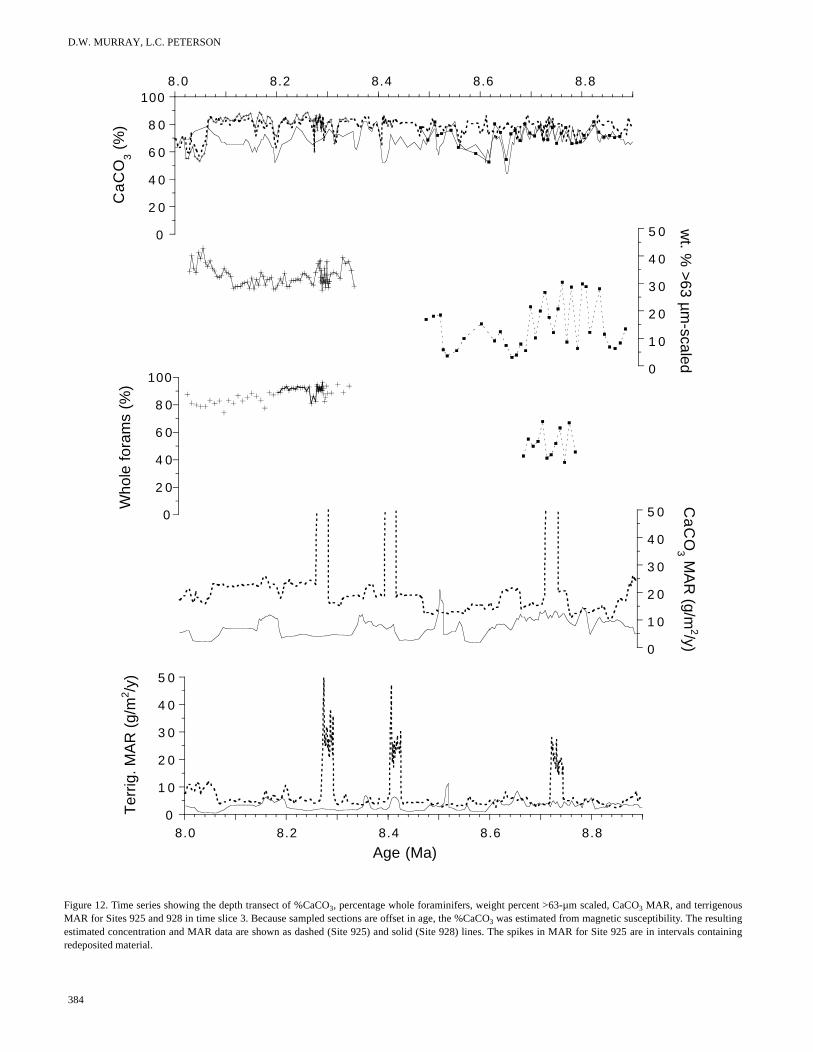
Both Sites 925 and 928 contain disturbed sections in the restive time periods sampled as part of this interval (Fig. 12). The cbonate decrease observed in Site 925 between 8.01 and 8.06 Mthe substantial increase in MAR near 8.28, 8.42, and 8.74 Ma areturbances associated with mass wasting. Most of the Site 928 seprior to 8.6 Ma is thought to be a slump. Because of these disturb
BIOGENIC CARBONATE PRODUCTION AND PRESERVATION
-
0
2 0
4 0
6 0
8 0
1004.9 5.0 5.1 5.2 5.3 5.4 5.5
1 0
2 0
3 0
4 0
5 0
6 0
Ca
CO
3, For
ams
(%)
wt. %
>63 µm
0
1 0
2 0
3 0
4 0
4.9 5.0 5.1 5.2 5.3 5.4 5.50
1 0
2 0
3 0
4 0
MA
R (g/m
2/y)
Sed
. Rat
e (m
/m.y
.)
Age (Ma)
Site 925
CaCO3 MAR
Terrig. MAR
Figure 8. Time series of %CaCO3 (solid line with pluses), percentage whole foraminifers (dashed line with squares), weight percent >63 µm (dashed line), weight percent >63µm scaled (solid line with dots), sedimentation rate (solid line), CaCO3 MAR (solid line with squares), and terrige-nous MAR (dashed line with pluses) for Site 925 from the first time slice. The age model is from King et al. (this volume). The scaled wt% >63 µm = [100 × (wt% >63 µm / %CaCO3)]. Terrigenous percentage used in the Terrige-nous MAR calculation is estimated as 100 − %CaCO3.
0
2 0
4 0
6 0
8 0
1004.9 5.0 5.1 5.2 5.3 5.4 5.5
0
1 0
2 0
3 0
4 0
5 0
Ca
CO
3, For
ams
(%)
wt. %
>63 µm
0
1 0
2 0
3 0
4 0
5 0
4.9 5.0 5.1 5.2 5.3 5.4 5.50
1 0
2 0
3 0
4 0
5 0
MA
R (g/m
2/y)
Sed
. Rat
e (m
/m.y
.)
Age (Ma)
Site 928
Figure 9. Time series of %CaCO3 (solid line with pluses), percentage whole foraminifers (dashed line with squares), weight percent >63 µm (dashed line), weight percent >63-µm scaled (solid line with dots), sedimentation rate (solid line), CaCO3 MAR (solid line with squares), and terrigenous MAR (dashed line with pluses) for Site 928 from the first time slice. The age model is from King et al. (this volume).
es, orbital tuning of the carbonate cycles in these sections is likely toproduce anomalous ages.
The section between 8.06 and 8.26 Ma in Site 925 appears undis-turbed and contains the characteristic high CaCO3 concentrations andMARs, as well as well-preserved foraminifers that are observed inthe middle to late Miocene at this site. Although the mean rates of ac-cumulation seem higher for the section sampled at Site 928, much ofthe increase is within the slumped deposit. Considering only the un-disturbed intervals, the low rates and poor preservation are consistentwith placement of the CCD near the depth of Site 928, but deeperthan in the 6.4- to 6.7-Ma time interval.
Time Slice 4 (9.6−10.0 Ma)
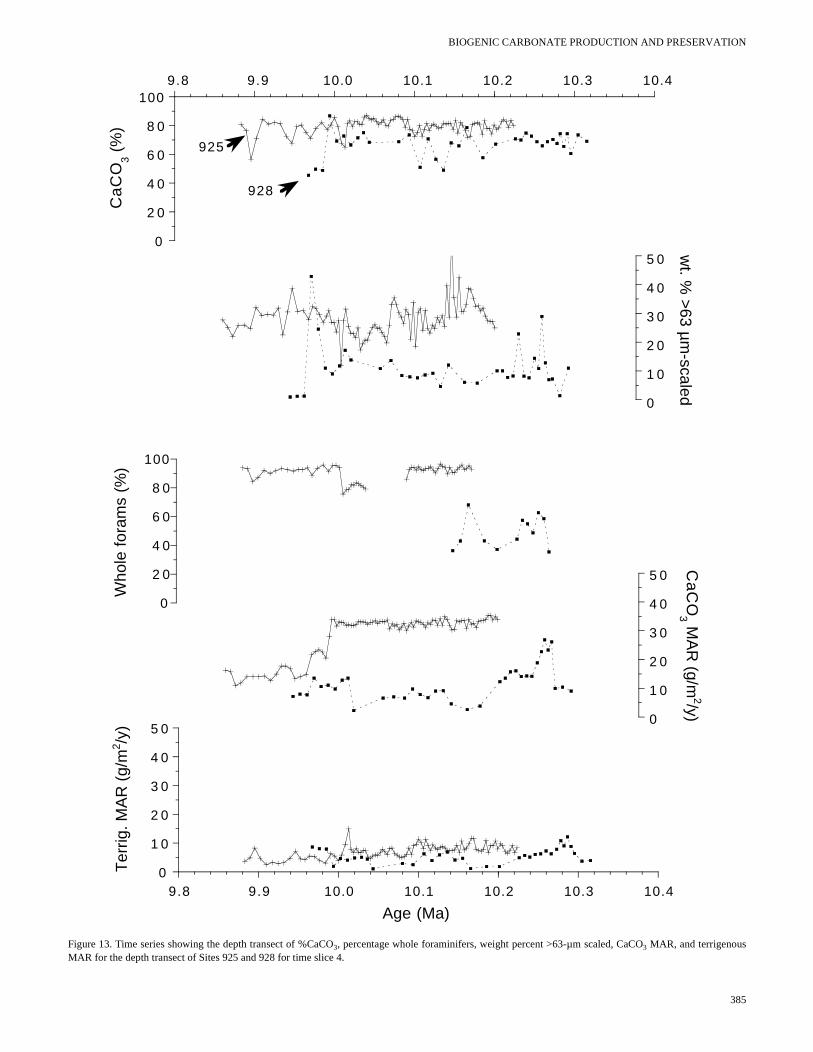
Although much of the section sampled in Site 925 between 9.9and 10.2 Ma appears undisturbed, most of the Site 928 samples arefrom disturbed sections and are thought to be redeposited slump orturbidite material. This may account for the relatively high carbonatecontents observed in Site 928 (Fig. 13), which produce an anoma-lously low depth gradient. The foraminifer preservation and carbon-
ate concentrations for Site 925 indicate very little dissolution of thecalcium carbonate portion of the sediments at this site. Between 9.9and 10.0 Ma, there is a substantial decrease in the accumulation ofcarbonate MAR. This decrease, if real, can most likely be attributedto a decrease in the fine-fraction production or winnowing, becauseit is not accompanied by a decrease in preservation and the coarsefraction is relatively high.
DISCUSSION
Curry and Lohmann (1990) quantified carbonate accumulation onthe Ceara Rise for the Holocene and last glacial maximum. Accumu-lation rates at the sites above 3500 m for the last 18,000 yr were closeto 10 g/m2/yr. Because the sediments above 3500 m are well pre-served, these accumulation rates provide a reasonable approximationof the carbonate production rate in the euphotic zone (Curry and Loh-mann, 1990). Similar carbonate accumulation rates are observed atother equatorial sites on the western side of ocean basins. Using datafrom Kroenke, Berger, Janecek, et al. (1991) for Site 807 (2804 m
381
D.W. MURRAY, L.C. PETERSON
0
2 0
4 0
6 0
8 0
1004.9 5.0 5.1 5.2 5.3 5.4 5.5
Ca
CO
3 (%
)
925928
929
0
1 0
2 0
3 0
4 0
5 0
wt. %
>63 µ
m-scaled
0
2 0
4 0
6 0
8 0
100
Who
le f
oram
s (%
)
0
1 0
2 0
3 0
4 0
5 0
Ca
CO
3 MA
R (g/m
2/yr)
0
1 0
2 0
3 0
4 0
5 0
4.9 5.0 5.1 5.2 5.3 5.4 5.5
Ter
rig. M
AR
(g/
m2 /y
)
Age (Ma)
Figure 10. Time series showing the depth transect of %CaCO3, percentage whole foraminifers, weight percent >63-µm scaled, CaCO3 MAR, and terrigenousMAR for the depth transect of Sites 925 (solid line with pluses), 928 (dashed line with squares), and 929 (solid line with dots) for the first time slice. Ages arebased on the orbitally tuned age models from King et al. (this volume). Spikes in the MARs for Site 928 between 5.2 and 5.4 Ma are attributed to poor chrono-stratigraphic control in sections of disturbed or redeposited material.
382
BIOGENIC CARBONATE PRODUCTION AND PRESERVATION
olid
0
2 0
4 0
6 0
8 0
1006.1 6.2 6.3 6.4 6.5 6.6 6.7
Ca
CO
3 (%
)
0
1 0
2 0
3 0
4 0
5 0 wt. %
>63 µm
-scaled
0
2 0
4 0
6 0
8 0
100
Who
le f
oram
s (%
)
0
1 0
2 0
3 0
4 0
5 0
Ca
CO
3 MA
R (g/m
2/y)
0
1 0
2 0
3 0
4 0
5 0
6.1 6.2 6.3 6.4 6.5 6.6 6.7
Ter
rig. M
AR
(g/
m2 /y
)
Age (Ma)Figure 11. Time series showing the depth transect of %CaCO3, percentage whole foraminifers, weight percent >63-µm scaled, CaCO3 MAR, and terrigenousMAR for Sites 925 and 928 in time slice 2. Because sampled sections are offset in age, the %CaCO3 was estimated from magnetic susceptibility. The resultingestimated concentration and MAR data are shown as dashed (Site 925) and solid (Site 928) lines. The Site 925 percentage whole foraminifer samples analyzed ata 20-cm spacing are not connected by lines. For depth transect of %CaCO3, percentage whole foraminifers, and weight percent >63-µm scaled, Site 925 = sline with pluses, Site 928 = dashed line with squares, and Site 929 = solid line with squares.
383
D.W. MURRAY, L.C. PETERSON
0
2 0
4 0
6 0
8 0
1008.0 8.2 8.4 8.6 8.8
Ca
CO
3 (%
)
0
1 0
2 0
3 0
4 0
5 0 wt. %
>63 µ
m-scaled
0
2 0
4 0
6 0
8 0
100
Who
le f
oram
s (%
)
0
1 0
2 0
3 0
4 0
5 0
Ca
CO
3 MA
R (g/m
2/y)
0
1 0
2 0
3 0
4 0
5 0
8.0 8.2 8.4 8.6 8.8
Ter
rig. M
AR
(g/
m2 /y
)
Age (Ma)
Figure 12. Time series showing the depth transect of %CaCO3, percentage whole foraminifers, weight percent >63-µm scaled, CaCO3 MAR, and terrigenousMAR for Sites 925 and 928 in time slice 3. Because sampled sections are offset in age, the %CaCO3 was estimated from magnetic susceptibility. The resultingestimated concentration and MAR data are shown as dashed (Site 925) and solid (Site 928) lines. The spikes in MAR for Site 925 are in intervals containingredeposited material.
384
BIOGENIC CARBONATE PRODUCTION AND PRESERVATION
0
2 0
4 0
6 0
8 0
1009.8 9.9 10.0 10.1 10.2 10.3 10.4
Ca
CO
3 (%
)
925
928
0
1 0
2 0
3 0
4 0
5 0
wt. %
>63 µ
m-scaled
0
2 0
4 0
6 0
8 0
100
Who
le f
oram
s (%
)
0
1 0
2 0
3 0
4 0
5 0
Ca
CO
3 MA
R (g/m
2/y)
0
1 0
2 0
3 0
4 0
5 0
9.8 9.9 10.0 10.1 10.2 10.3 10.4
Ter
rig. M
AR
(g/
m2 /y
)
Age (Ma)
Figure 13. Time series showing the depth transect of %CaCO3, percentage whole foraminifers, weight percent >63-µm scaled, CaCO3 MAR, and terrigenousMAR for the depth transect of Sites 925 and 928 for time slice 4.
385
D.W. MURRAY, L.C. PETERSON
Modern
Glacial Max.5.05-5.2 Ma6.1-6.4 Ma8.0-8.4 Ma10.05-10.2 Ma
Wat
er D
epth
(km
)
0 10 20 30 402.5
3.0
3.5
4.0
4.5
5.0
Mascarene ~5 Ma
Ontong Java ~5 Ma
Ceara Rise ~ 5 Ma
CaCO3 MAR (g/m2/y)A B
2.5
3.0
3.5
4.0
4.5
5.0
0 10 20 30 40
CaCO3 MAR (g/m2/y)
Site 929 ???
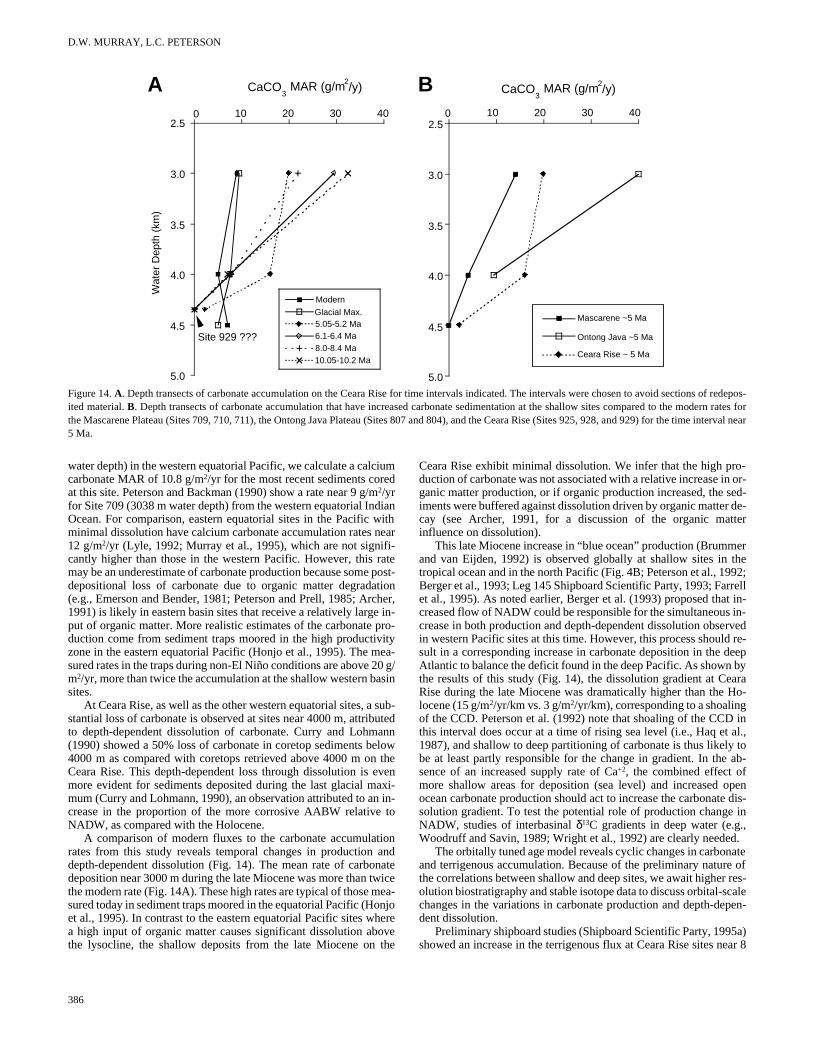
Figure 14. A. Depth transects of carbonate accumulation on the Ceara Rise for time intervals indicated. The intervals were chosen to avoid sections of redepos-ited material. B. Depth transects of carbonate accumulation that have increased carbonate sedimentation at the shallow sites compared to the modern rates forthe Mascarene Plateau (Sites 709, 710, 711), the Ontong Java Plateau (Sites 807 and 804), and the Ceara Rise (Sites 925, 928, and 929) for the time interval near5 Ma.
o- or-ed-de-ter
erhe92;ell in-in-rved re-eepbyarao-
inal., toab-
pen dis- in
.ate ofres-aleen-
a)ar 8
water depth) in the western equatorial Pacific, we calculate a calciumcarbonate MAR of 10.8 g/m2/yr for the most recent sediments coredat this site. Peterson and Backman (1990) show a rate near 9 g/m2/yrfor Site 709 (3038 m water depth) from the western equatorial IndianOcean. For comparison, eastern equatorial sites in the Pacific withminimal dissolution have calcium carbonate accumulation rates near12 g/m2/yr (Lyle, 1992; Murray et al., 1995), which are not signifi-cantly higher than those in the western Pacific. However, this ratemay be an underestimate of carbonate production because some post-depositional loss of carbonate due to organic matter degradation(e.g., Emerson and Bender, 1981; Peterson and Prell, 1985; Archer,1991) is likely in eastern basin sites that receive a relatively large in-put of organic matter. More realistic estimates of the carbonate pro-duction come from sediment traps moored in the high productivityzone in the eastern equatorial Pacific (Honjo et al., 1995). The mea-sured rates in the traps during non-El Niño conditions are above 20 g/m2/yr, more than twice the accumulation at the shallow western basinsites.
At Ceara Rise, as well as the other western equatorial sites, a sub-stantial loss of carbonate is observed at sites near 4000 m, attributedto depth-dependent dissolution of carbonate. Curry and Lohmann(1990) showed a 50% loss of carbonate in coretop sediments below4000 m as compared with coretops retrieved above 4000 m on theCeara Rise. This depth-dependent loss through dissolution is evenmore evident for sediments deposited during the last glacial maxi-mum (Curry and Lohmann, 1990), an observation attributed to an in-crease in the proportion of the more corrosive AABW relative toNADW, as compared with the Holocene.
A comparison of modern fluxes to the carbonate accumulationrates from this study reveals temporal changes in production anddepth-dependent dissolution (Fig. 14). The mean rate of carbonatedeposition near 3000 m during the late Miocene was more than twicethe modern rate (Fig. 14A). These high rates are typical of those mea-sured today in sediment traps moored in the equatorial Pacific (Honjoet al., 1995). In contrast to the eastern equatorial Pacific sites wherea high input of organic matter causes significant dissolution abovethe lysocline, the shallow deposits from the late Miocene on the
Ceara Rise exhibit minimal dissolution. We infer that the high prduction of carbonate was not associated with a relative increase inganic matter production, or if organic production increased, the siments were buffered against dissolution driven by organic matter cay (see Archer, 1991, for a discussion of the organic matinfluence on dissolution).
This late Miocene increase in “blue ocean” production (Brummand van Eijden, 1992) is observed globally at shallow sites in ttropical ocean and in the north Pacific (Fig. 4B; Peterson et al., 19Berger et al., 1993; Leg 145 Shipboard Scientific Party, 1993; Farret al., 1995). As noted earlier, Berger et al. (1993) proposed thatcreased flow of NADW could be responsible for the simultaneous crease in both production and depth-dependent dissolution obsein western Pacific sites at this time. However, this process shouldsult in a corresponding increase in carbonate deposition in the dAtlantic to balance the deficit found in the deep Pacific. As shown the results of this study (Fig. 14), the dissolution gradient at CeRise during the late Miocene was dramatically higher than the Hlocene (15 g/m2/yr/km vs. 3 g/m2/yr/km), corresponding to a shoalingof the CCD. Peterson et al. (1992) note that shoaling of the CCDthis interval does occur at a time of rising sea level (i.e., Haq et 1987), and shallow to deep partitioning of carbonate is thus likelybe at least partly responsible for the change in gradient. In the sence of an increased supply rate of Ca+2, the combined effect ofmore shallow areas for deposition (sea level) and increased oocean carbonate production should act to increase the carbonatesolution gradient. To test the potential role of production changeNADW, studies of interbasinal δ13C gradients in deep water (e.g.,Woodruff and Savin, 1989; Wright et al., 1992) are clearly needed
The orbitally tuned age model reveals cyclic changes in carbonand terrigenous accumulation. Because of the preliminary naturethe correlations between shallow and deep sites, we await higher olution biostratigraphy and stable isotope data to discuss orbital-scchanges in the variations in carbonate production and depth-depdent dissolution.
Preliminary shipboard studies (Shipboard Scientific Party, 1995showed an increase in the terrigenous flux at Ceara Rise sites ne
386
BIOGENIC CARBONATE PRODUCTION AND PRESERVATION
uc-
eane.
88.
s in
ga-edi-
ater
y,teean.
van
.,ificr-
S.,tion.an
sea
di-
ro-ing
opi-
Ma. Because the Ceara Rise sediments are largely a mixture of bio-genic carbonate and terrigenous materials, the non-carbonate accu-mulation rates primarily reflect changes in terrigenous input to theCeara Rise. The present source of these terrigenous sediments is theAmazon River outflow. The terrigenous MARs at Site 925 were sig-nificantly higher in time slice 2 (6−6.4 Ma; 11.2 g/m2/yr) comparedto the older two intervals (6 g/m2/yr), which is consistent with theshipboard findings (Shipboard Scientific Party, 1995a). Although asignificant decrease in terrigenous MAR occurred between time slic-es 1 and 2 (from 11.2 to 6.4 g/m2/yr), the shipboard studies show adramatic increase in terrigenous flux since 5.0 Ma, to rates approach-ing 17 g/m2/yr for the modern. Such a large increase may be relatedto increased erosion of the Andes caused by accelerated uplift (Ben-jamin et al., 1987) and/or global cooling. This topic is considered byother studies in this volume.
SUMMARY AND FUTURE STUDY
Our study of carbonate sedimentation between ~5 and 10 Mashows dramatic changes in both the production and depth-dependentdissolution of calcium carbonate in this time period as compared withthe present. In this time interval, a simple relationship between reflec-tance and carbonate cannot be applied to all Ceara Rise sites to givereliable carbonate concentration changes. However, magnetic sus-ceptibility, which reflects the terrigenous component of the sedi-ments, has a high negative correlation to calcium carbonate concen-tration and is a reliable proxy for carbonate concentration variationsbetween 5 and 10 Ma for Sites 925, 928, and 929. Thus, a depthtransect of magnetic susceptibility-based carbonate concentrationswas constructed for Sites 925, 928, and 929 between 5 and 10 Ma.These time series show that the depth gradient of carbonate concen-tration exhibited substantial changes in the middle and late Miocene.
A high resolution study of four representative intervals shows thatthe high frequency changes at shallow Site 925 can be attributed tovariability in carbonate production and terrigenous dilution. The car-bonate fraction is very well preserved and the measured fluxes are in-dicative of carbonate production in the euphotic zone. In contrast,sites 1000 to 1500 m deeper have a strong overprint of dissolution.During the late Miocene, there is a significant increase in carbonateproduction observed at Site 925, as compared with the Holocene.This increase in relatively shallow-water deposition of carbonate isassociated with a shoaling of the CCD and substantially increaseddissolution at depth. The pattern of shallow to deep fractionation ofcarbonate is observed globally at this time, and the increased NADWflow proposed by Berger et al. (1993) does not appear to be respon-sible for the change. Further work on benthic stable isotope data fromshallow and deep sites, and between basins, will be useful in address-ing the NADW hypothesis. Our future plans also include the use ofstable isotope and high resolution biostratigraphy to help improvecorrelations between the shallow and deep Ceara Rise sites. With re-fined age models, orbital-scale changes in the depth gradients can beexamined along with the distortion of the carbonate flux time seriescaused by dissolution.
ACKNOWLEDGMENTS
We thank a number of laboratory workers at Brown Universitywho helped prepare and analyze the samples in this study, includingMel Waldorf, Jenna Cook, Mike Zani, Jane Donnelly, Julie Maurin,Genevieve Proctor, Andrew Long, Celia Day, Tyler Prell, and ShojiTakahashi. Special thanks to Bob Fifer for designing and assemblingthe automated carbonate rig, and to Bill Curry and Rindy Ostermannfor sharing the design of the WHOI automated carbonate analyzerand their experience in running it. Terri King shared splits of her sam-
ples from the 5- to 5.4-Ma time interval. We appreciate the time-con-suming work in developing and distributing the orbitally tuned agemodels by Nick Shackleton, Terri King, and their staff. We thankNick Shackleton for suggesting a method to normalize the coarsefraction. Thorough reviews by John Farrell and Chris Charles werehelpful and appreciated. Technical support for this project was ob-tained by grants from JOI/USSAC (USSSP 154-20836b) and NSF/OCE (OCE-9302496).
REFERENCES
Archer, D., 1991. Modeling the calcite lysocline. J. Geophys. Res., 96:17037−17050.
Benjamin, M., Johnson, N.M., and Naeser, C.W., 1987. Recent rapid uplift inthe Bolivian Andes: evidence from fission-track dating. Geology,15:680−683.
Berger, W.H., Bonneau, M.-C., and Parker, F.L., 1982. Foraminifera on thedeep-sea floor: lysocline and dissolution rate. Oceanol. Acta, 5:249−258.
Berger, W.H., Leckie, R.M., Janecek, T.R., Stax, R., Takayama, T., 1993.Neogene carbonate sedimentation on Ontong Java Plateau: Highlightsand open questions. In Berger, W.H., Kroenke, L.W., Mayer, L.A., et al.,Proc. ODP, Sci. Results., 130: College Station, TX (Ocean Drilling Pro-gram), 711−744.
Broecker, W.S., and Peng, T.-H., 1982. Tracers in the Sea:Palisades, NY(Lamont-Doherty Geol. Obs.).
Brummer, G.-J.A., and van Eijden, A.J.M., 1992. “Blue-ocean” paleoprodtivity estimates from pelagic carbonate mass accumulation rates. Mar.Micropaleontol., 19:99−117.
Charles, C.D., and Fairbanks, R.G., 1992. Evidence from Southern Ocsediments for the effect of North Atlantic deep-water flux on climatNature, 355: 416−419.
Curry, W.B., Duplessy, J.-C., Labeyrie, L.D., and Shackleton, N.J., 19Changes in the distribution of δ13C of deep water ΣCO2 between the lastglaciation and the Holocene. Paleoceanography, 3:317−341.
Curry, W.B., and Lohmann, G.P., 1990. Reconstructing past particle fluxethe tropical Atlantic Ocean. Paleoceanography, 5:487−505.
Curry, W.B., Shackleton, N.J., Richter, C., et al., 1995. Proc. ODP, Init.Repts., 154: College Station, TX (Ocean Drilling Program).
Dickens, G.R., and Owen, R.M., 1994. Late Miocene-early Pliocene mannese redirection in the central Indian Ocean: expansion of the intermate water oxygen minimum zone. Paleoceanography, 9:169−181.
Emerson, S., and Bender, M., 1981. Carbon fluxes at the sediment-winterface of the deep-sea: calcium carbonate preservation. J. Mar. Res.,39:139−162.
Farrell, J.W., Raffi, I., Janecek, T.R., Murray, D.W., Levitan, M., DadeK.A., Emeis, K.-C., Lyle, M., Flores, J.-A., and Hovan, S., 1995. LaNeogene sedimentation patterns in the eastern equatorial Pacific OcIn Pisias, N.G., Mayer, L.A., Janecek, T.R., Palmer-Julson, A., and Andel, T.H. (Eds.), Proc. ODP, Sci. Results, 138: College Station, TX(Ocean Drilling Program), 717−756.
Hagelberg, T.K., Pisias, N.G., Mayer, L.A., Shackleton, N.J., and Mix, A.C1995a. Spatial and temporal variability of late Neogene equatorial Paccarbonate: Leg 138. In Pisias, N.G., Mayer, L.A., Janecek, T.R., PalmeJulson, A., and van Andel, T.H. (Eds.), Proc. ODP, Sci. Results, 138: Col-lege Station, TX (Ocean Drilling Program), 321−336.
Hagelberg, T.K., Pisias, N.G., Shackleton, N.J., Mix, A.C., and Harris, 1995b. Refinement of a high-resolution, continuous sedimentary secfor studying equatorial Pacific Ocean paleoceanography, Leg 138 InPisias, N.G., Mayer, L.A., Janecek, T.R., Palmer-Julson, A., and vAndel, T.H. (Eds.) Proc. ODP Sci. Results, 138: College Station, TX(Ocean Drilling Program), 31−46.
Haq, B.U., Hardenbol, J., and Vail, P.R., 1987. Chronology of fluctuating levels since the Triassic. Science, 235:1156−1167.
Herbert, T.D., and Mayer, L.A., 1991. Long climatic time series from sement physical property measurements. J. Sediment. Petrol., 61:1089−1108.
Honjo, S., Dymond, J., Collier, R., and Manganini, S.J., 1995. Export pduction of particles to the interior of the equatorial Pacific Ocean durthe 1992 EqPac experiment. Deep-Sea Research II, 42:831−870.
Kroenke, L.W., Berger, W.H., Janecek, T.R., et al., 1991. Proc. ODP, Init.Repts., 130: College Station, TX (Ocean Drilling Program).
Lyle, M., 1992. Composition maps of surface sediments of the eastern trcal Pacific Ocean. In Mayer, L., Pisias, N., Janecek, T., et al., 1992. Proc.
387
D.W. MURRAY, L.C. PETERSON
ODP, Init. Repts., 138 (Pt. 1): College Station, TX (Ocean Drilling Pro-gram), 101-115.
Murray, D.W., Farrell, J.W., and McKenna, V., 1995. Biogenic sedimentationat Site 847, eastern equatorial PaciÞc Ocean, during the past 3 m.y. InPisias, N.G., Mayer, L.A., Janecek, T.R., Palmer-Julson, A., and vanAndel, T.H. (Eds.), Proc. ODP, Sci. Results, 138: College Station, TX(Ocean Drilling Program), 429-459.
Oppo, D.W., and Fairbanks, R.G., 1987. Variability in the deep and interme-diate water circulation of the Atlantic Ocean during the past 25,000years: Northern Hemisphere modulation of the Southern Ocean. Earthand Planet. Sci. Lett., 86:1-15.
Ostermann, D.R., Karbott, D., and Curry, W.B., 1990. Automated system tomeasure carbonate concentration of sediments. WHOI Tech. Rept., 90-103.
Peterson, L.C., and Backman, J., 1990. Late Cenozoic carbonate accumula-tion and the history of the carbonate compensation depth in the westernequatorial Indian Ocean. In Duncan, R.A., Backman, J., and Peterson,L.C., et al., Proc. ODP, Sci. Results, 115: College Station, TX (OceanDrilling Program), 467-507.
Peterson, L.C., Murray, D.W., Ehrmann, W.U., and Hempel, P., 1992. Ceno-zoic carbonate accumulation and compensation depth changes in theIndian Ocean. In Duncan, R.A., Rea, D.K., Kidd, R.B., von Rad, U., andWeissel, J.K. (Eds.), Synthesis of Results from ScientiÞc Drilling in theIndian Ocean, Geophys. Monogr., Am. Geophys. Union, 70:311-333.
Peterson, L.C., and Prell, W.L., 1985. Carbonate dissolution in recent sedi-ments of the eastern equatorial Indian Ocean: preservation patterns andcarbonate loss above the lysocline. Mar. Geol., 64:259-290.
Shackleton, N.J., Crowhurst, S., Hagelberg, T., Pisias, N.G., and Schneider,D.A., 1995. A new late Neogene time scale: application to Leg 138 sites.
388 Table of CTable of CPrevious ChapterPrevious Chapter
In Pisias, N.G., Mayer, L.A., Janecek, T.R., Palmer-Julson, A., and vanAndel, T.H. (Eds.), Proc. ODP, Sci. Results, 138: College Station, TX(Ocean Drilling Program), 73-101.
Shipboard ScientiÞc Party, 1995a. Leg 154 synthesis. In Curry, W.B., Shack-leton, N.J., Richter, C., et al., Proc. ODP, Init. Repts., 154: College Sta-tion, TX (Ocean Drilling Program), 421-442.
Shipboard ScientiÞc Party, 1995b. Site 925. In Curry, W.B., Shackleton, N.J.,Richter, C., et al., Proc. ODP, Init. Repts., 154: College Station, TX(Ocean Drilling Program), 55-152.
Shipboard ScientiÞc Party, 1995c. Site 929. In Curry, W.B., Shackleton, N.J.,Richter, C., et al., Proc. ODP, Init. Repts., 154: College Station, TX(Ocean Drilling Program), 337-417.
Shipboard ScientiÞc Party [ODP Leg 145], 1993. Paleoceanographic recordof North PaciÞc quantiÞed. Eos, 74:406-411.
Woodruff, F., and Savin, S.M., 1989. Miocene deepwater oceanography.Paleoceanogr., 4:87-140.
Wright, J.D., Miller, K.G., and Fairbanks, R.G., 1992. Early and middleMiocene stable isotopes: implications for deepwater circulation and cli-mate. Paleoceanogr., 7:357-389.
Date of initial receipt: 5 December 1995Date of acceptance: 16 August 1996Ms 154SR-117
ontentsontents Next ChapterNext Chapter

![Carbonate Preservation in Shallow Marine Environments ... · [The Journal of Geology, 2007, volume 115, p. 437–456] 2007 by The University of Chicago. ... Carbonate Preservation](https://img.pdfslide.us/doc/110x75/5ad1e1437f8b9a72118c7047/carbonate-preservation-in-shallow-marine-environments-the-journal-of-geology.jpg)