Embed Size (px)
Citation preview

Carbon Footprint of Indian Aviation
2012
August, 2013
Directorate General of Civil Aviation India

Published byDirectorate General of Civil Aviation, India Technical Centre, Opp. Safdarjung AirportNew Delhi-110003 Printed byAkshay Media Pvt Ltd319, Living Style Mall, JasolaNew Delhi - 110025Ph:- +91-11-40526822, 405268233e-mail:- [email protected]

CONTENTS
Executive Summary 5
Introduction 7
Indian Climate Change Initiatives 9 Government Initiatives Airline Initiatives Airport Initiatives Air Navigation Services Initiatives Biofuel Initiatives
Global Aviation Carbon Footprints 14
Carbon Footprint Methodology 16 Stakeholders Data collection Calculation & Reliability
Carbon Footprint for 2012 21
Proposals 28
Conclusions 30


5
EXECUTIVE SUMMARY
Carbon footprint represents an important policy tool to understand the sources and magnitude of CO2 emissions, identify areas for intervention, make comparisons, formulate emission reduction policies, and assess progress. In 2012 the DGCA completed, in cooperation with the EU-India Civil Aviation Cooperation Project, the first-ever detailed carbon footprint of Indian aviation for the year 2011. It was presented at ICAO’s CAEP meeting in Feb 2013 which has drawn significant recognition from the international aviation community.
Given the DGCA’s commitment to environmental improvements, the CO2 emissions report of Indian aviation for the year 2012 has been completed. The report also compares the previous year CO2 emissions data. Salient points contained in the report are presented in the following Table:
SourceCO2 Emissions
(000 tonnes)Change
2011 2012Indian scheduled passenger airlines to/from domestic destinations
6,755 6,135 -9.2%
Indian scheduled passenger airlines to/from international destinations
5,949 5,425 -8.8%
Foreign scheduled airlines to international destinations
3,623 3,829 +5.7%
Total 16,327 15,389 -5.7%
Indian scheduled passenger airlines & foreign scheduled airlines to international destinations
6,597 6,542 -0.8%
Kgs CO2/RTK*2011 2012
Indian scheduled passenger airlines to/from all destinations
1.06 0.99 -6.6%
*RTK: Revenue Tonne Kilometers

6
Significant features of CO2 emissions for the year 2012 are as follows:
¿ Total emissions of 15,389,000 tonnes of CO2 in 2012, represent less than 1% of India’s anthropogenic emissions; which is significantly lower than the global average, which is 2%-3%.
¿ In the absence of reduction measures, CO2 emissions may reach 30,000,000 tonnes in 2020.
¿ Although CO2 emissions (in kgs) per RTK for Indian airlines in 2012 (i.e. 0.99) remains above the 2011 global average of 0.95, it shows a declining trend. Some Indian carriers are below the global average, while others are above, suggesting there is room for improved efficiency.
¿ In 2012, Indian airports emitted around 770,000 tonnes of CO2.
Overall in the year 2012, CO2 emissions from Indian related operations declined. This trend is related to the general passenger developments for 2012, the discontinuation of Kingfisher’s operations, as well as the improved efficiency of some Indian carriers (e.g. higher load factors, use of newer aircraft types).
In this context, the establishment of an aviation climate change task force, development of annual carbon footprints, dissemination of information and reporting, and delivery of workshops, will underscore India’s commitment to addressing the challenge of aviation and climate change in a comprehensive and effective manner thereby safeguarding the industry growth potential.

7
INTRODUCTION
In order to formulate an effective policy to address the challenge of climate change, an important requirement is to determine the sources and level of aviation’s CO2 emissions, identify trends and make predictions about future growth. This is especially important for fast growing industries, such as Indian aviation.
The Director General of Civil Aviation of India and the Secretary General of the International Civil Aviation Organisation (ICAO) presented the first-ever detailed carbon footprint of Indian aviation for 2011 in October 2012 in New Delhi. The carbon footprint, which was developed in cooperation with the EU-India Civil Aviation Cooperation Project, was widely distributed in the general and specialised aviation press and was presented at ICAO’s Committee of Aviation Environmental Protection (CAEP/9) obtaining significant recognition from the aviation community.
As a part of continuous environmental initiatives of the Directorate General of Civil Aviation (DGCA), this report maps in a comprehensive manner the carbon footprint of Indian aviation for 2012 and introduces comparisons with previous data.
Section 1 introduces the climate change initiatives by the government, airlines, airports and other institutions. Section 2 examines the latest developments regarding global aviation carbon footprints, while Section 3 presents the methodology of this report. Section 4 presents and discusses

8
the results of various carbon footprint calculations. More specifically, the analysis focuses on CO2 emissions from the domestic and international operations of Indian scheduled passenger airlines, emissions from foreign airlines, as well as the contribution of airport operations. Predictions of future growth as well as comparisons with 2011 data and global efficiency averages are also made. Section 5 makes proposals in line with current policies and Section 6 provides concluding comments.

9
India has been active in addressing the climate change challenge. India ratified the Kyoto Protocol, has been involved in the international negotiations to develop a successor to this protocol, formulated a National Action Plan on Climate Change (2008), introduced eight National Missions (e.g. enhanced energy efficiency, strategic knowledge for climate change), established the Indian Network for Climate Change Assessment, formulated state climate change plans, and developed several Clean Development Mechanism projects. Within this framework, a number of initiatives are also being implemented in the aviation sector.
Government Initiatives
The DGCA has issued five Circulars by mid 2013 addressing the use of aircraft power supply, fuel efficiency, single engine taxi and data reporting. One of the most important initiatives is Aviation Environment Circular 2 of 2013 on Climate Change Initiatives in Civil Aviation. According to this Circular, the DGCA shall establish a Climate Change Task Force, while airlines and airports shall submit fuel and electricity consumption data on a regular basis and develop their own carbon footprint. The DGCA also undertook the first-ever detailed carbon footprint of Indian aviation for 2011, as discussed later in this report.
Airline Initiatives
Indian airlines play an important role regarding emissions reductions. They operate modern, fuel-efficient aircraft (e.g. Boeing 787 Dreamliner, Airbus 320/B737 NG
INDIAN CLIMATE CHANGE INITIATIVES
Section - 1

101 ICAO, Guidance Material for the Development of States’ Action Plans, p. 87 (September 2011) and Air India, Green Initiatives for Air India.
Table 1Indicative Emissions Reduction Initiatives by
Indian AirlinesUse of Pratt & Whitney’s EcoPower engine wash to clean the aircraft engine fuel path and the turbine blades to improve aerodynamic characteristics is expected to reduce fuel consumption on an average by 1.2%. Air India has also introduced updated procedures to minimize the use of Auxiliary Power Units.1
Blue Dart uses single engine taxi procedures and has provided awareness sessions and training for planning and executing constant descent profiles.IndiGo has opted for the installation of sharklets on new aircraft delivered from January 2013 onwards, which can increase fuel efficiency by 3-4%.Jet Airways has established a program to continuously monitor and reduce the weight of various catering, cabin and galley items, which has contributed to fuel savings. It has also developed an Integrated Emissions Management System (IEMS) for monitoring and optimization of aviation fuel usage.Fuel management improvements regarding extra fuel carried on flights have led to an estimated 0.5% emissions reduction per flight. Additional benefits are realized through systematic implementation of single engine taxi procedures during arrivals.

112 Scope 1 and 2 emissions.
Table 2 Airport Carbon Accreditation in India
Airport Carbon Accreditation was developed and launched by ACI-Europe in 2009. It is currently the only institutionally endorsed carbon management certification standard for airports. The programme consists of four different levels of accreditation:
1) Mapping Development and verification of a carbon footprint
2) Reduction Establishment of carbon management plan & emission reduction target
3) Optimisation Engagement of Third Parties in emission reductions
4) Neutrality Offsetting of the airport operator’s emissions2
As of mid 2013, Airport Carbon Accreditation’s membership includes 75 European airports accounting for over half of Europe’s passenger traffic, such as London, Paris, Frankfurt, Madrid, Amsterdam, Rome, Athens, Zurich, Milan, Brussels and Manchester. Ten airports have been accredited as carbon neutral. This initiative extended to airport operators in the Asia-Pacific and Africa regions in 2011 and 2013 respectively.
As of 2013, New Delhi, Mumbai, and Bangalore airports have been accredited at the Reduction level and Hyderabad airport at the Optimisation level. These airports have established carbon footprints and have taken additional measures, such as adoption of green design principles and energy efficiency initiatives.

12
with sharklets/winglets) resulting in significant fuel savings. At the same time, they have been changing the mode of operations to reduce their emissions as well. Table 1 presents some indicative airline initiatives.
Airport Initiatives
As of 2013, several Indian airports have obtained LEED certifications (Leadership in Energy and Environment Design), use energy efficient systems, operate environmentally friendly vehicles, etc. Further, four Indian airports are participating in Airport Carbon Accreditation (Table 2).
Air Navigation Services Initiatives
India has launched the Future India Air Navigation System (FIANS) initiative, which is based on projects in the fields of communication, navigation and surveillance. Indicative projects include implementation of Performance Based Navigation (PBN), use of Automatic Dependent Surveillance-Broadcast (ADS-B), harmonization with international systems, human resources development and training, etc. A PBN roadmap has been developed and several projects have already been launched. For example, PBN implementation at some airports has already reduced flight distance.3
In 2011, the Indian Ocean Strategic Partnership to Reduce Emissions (INSPIRE) was launched. This project represents a partnership between the Airports Authority of India (AAI), Airservices Australia, Dubai Airports, airlines, and many other organisations, which are “dedicated to 3 Government of India, MOCA, India: The Emerging Aviation Hub (2012).

13
improve the efficiency and sustainability of aviation.” Relevant initiatives include the development of operational procedures, technologies and best practices, establishment of performance indicators, development of systematic processes, and communication initiatives. A number of test flights have been conducted, while the project partners have established recommended procedures, practices and services that are environmentally beneficial. 4
Biofuel Initiatives
There have been encouraging developments regarding biofuels and aviation based on cooperation between Indian companies, public institutions, and foreign entities (e.g. Indian Oil, Airbus, Indian Institute of Technology, Pratt & Whitney Canada, International Science and Technology Partnerships Canada Inc., McGill University) on design and research issues.5 Jet Airways plans to be the first airline to use biofuel on a domestic A330-200 flight; a project developed jointly with Airbus.
In conclusion, India and its aviation industry have taken a number of important steps to address aviation’s contribution to climate change.
4 Information from http://www.inspire-green.com, accessed on 22/3/2013.5 Biofuels and the Aviation Industry, Paper at the 7th International Biofuels Conference, New Delhi, (2010); International Science and Technology Partnerships Canada Inc. at www.istpcanada.ca; R. Sharma, India Seeks to Conduct Flight Trials Using Biofuels, Dow Jones Newswires, (8/3/2012); J. Lane, Aviation Biofuels: Which Airlines are Doing What With Whom?, www.biofuelsdigest.com, (5/6/2012).

14
In 2012, global passenger airline operations emitted approximately 690 million tonnes of CO2, representing around 2%-3% of global anthropogenic CO2 emissions (Figure 1). Within the industry, aircraft emissions represent approximately 95-98% of emissions, while the remaining 2-5% are related to airport activities.6
The methodology is based on analysis of datasets of aircraft operations, average fuel consumption, distance and emissions calculations, etc. According to this report, global emissions from aviation bunker fuels ranged between 360-470 million tonnes of CO2.
7 Emissions from international flights in the Asia-Pacific region were responsible for 106,000,000 tonnes of CO2. 6 Information from http://www.atag.org/facts-and-figures.html, accessed on 26/5/2013. Also, ATAG, Aviation Benefits Beyond Borders, (Geneva, Switzerland, March 2012); IPCC Fourth Assessment Report, WG III, Technical Summary (2007); ACI-Europe & WSP, Airport Carbon Accreditation Annual Report 2010-2011, (2011); D. Southgate, Global Scheduled International Passenger Flights – 2012, (April, 2013), p. 46. 7 D. Southgate compares the study’s results with ICAO, International Energy Agency (IEA), and Air Transport Action Group (ATAG) data.
GLOBAL AVIATION CARBON FOOTPRINTS
Section - 2

15
Other studies have looked into the carbon footprints of states. The carbon footprint of Australian aviation reached 15,900,000 tonnes of CO2, (2011), the United Kingdom’s was 35,000,000 tonnes (2009), while China’s was higher at 44,100,000 tonnes (2009).8
With respect to the situation in India, a detailed carbon footprint of Indian aviation was developed for the first time for 2011 operations. Emissions of Indian scheduled passenger airline operations to/from domestic/international destinations were estimated at around 12,704,000 tonnes of CO2. The CO2 emissions related to bunker fuels from Indian and foreign airlines to international destinations from India reached around 6,597,000 tonnes.
8 U.K. Department of Transport, Factsheets: UK Transport Greenhouse Gas Emissions; JC He and YQ Xu, Estimation of the Aircraft CO2 Emissions of China’s Civil Aviation during 1960-2009, Advances in Climate Change Research 3(2): 99-105, (2012); D. Southgate, The Carbon Footprint of Aircraft Operations in Australia - 2011, (October, 2012). The methodologies of these studies differ.

16
Stakeholders
The development of the carbon footprint of the Indian aviation sector requires the contribution from various entities regarding policy developments, data collection, reviews, development of databases and other initiatives. The following stakeholders were mainly involved with these tasks (Figure 2):
Directorate General of Civil Aviation (DGCA) Nodal point for issuing the relevant Circular, communicating requests to airlines and airports, collecting/presenting data, and undertaking analysis.
EU-India Civil Aviation Cooperation Project (ICCA)Provision of resources, advise, and analysis to produce the carbon footprint.
Airlines/Airports: Submission of information and data regarding their operations.
Others: Provision of additional information regarding fuel consumption, emission levels, etc. by institutions, such as the Ministry of Environment and Forests (MOEF), the Ministry of Petroleum and Natural Gas (MOPNG), and the International Energy Agency.
Data collection
The methodology for the development of the carbon footprint follows the Tier 1 approach of the Intergovernmental Panel on Climate Change (i.e. aggregate Aviation Turbine Fuel (ATF) quantities from airlines and other sources).
CARBON FOOTPRINT METHODOLOGY
Section - 3

17
Information from Indian airlines and airports is based on the form contained in the DGCA’s Circular 2 of 2013 dated 13/6/2013 on Climate Change Initiatives in Civil Aviation. This form focuses on ATF from scheduled airlines as well as electricity and fuel consumption from operations (e.g. vehicles, generators) of large airports (i.e. airports with more that 50,000 annual aircraft movements). Information on ATF uplift of foreign airlines was based on MOPNG aggregate statistics.
In 2012, the Indian aviation industry consisted of seven scheduled passenger airlines, which were responsible for the transportation of more than 70,000,000 passengers. From March-June 2013, the six scheduled passenger airlines and the four joint venture airports submitted the above data (Table 3). Given the lack of data from Kingfisher, which ceased operations in October 2012, assumptions were made on a proportional basis about their emissions in accordance to 2011 data. Additional fuel data were collected from the MOPNG.
Figure 2: Main Stakeholders of the Carbon Footprint of Indian Aviation

18
Calculation & Reliability
This section describes how CO2 emissions were calculated for each emission source as well as the level of data reliability.
Table 3 Main Data Sources
Scheduled Passenger Airlines
Joint Venture Airports
Air India Group* BangaloreGoAir DelhiIndiGo Hyderabad
Jet Airways MumbaiJetLite
KingfisherSpiceJet
*Includes Air India, Air India Express & Alliance Air.
Aviation Turbine Fuel (ATF) For airlines, ATF is in most cases initially reported in the aircraft technical logs and then transferred to a corporate database. Various departments, such as Finance, Quality Control, and Engineering undertake comparisons and quality control checks (e.g. through fuel invoices). On some occasions external verifiers or other institutions (e.g. IATA) certify that the methodology used for data collection is in accordance with international guidelines. Given that fuel has historically been one of the most significant cost and operational inputs for airlines, there is a reliable system of tracking consumption overtime. Therefore, reliability of ATF data is considered high.

19
The MOPNG (Petroleum Planning & Analysis Cell) provided ATF uplift information in India broken down into categories, such as foreign airlines, Indian airlines, and other consumption.9 As this refers to aggregate statistics, there is some level of data uncertainty.
Electricity The joint venture airports implement adequate data collection and verification processes, given the clear boundaries of operation and availability of electricity invoices. Electricity consumption data for the whole airport as well as consumption by the airport operating company only were collected. As a result, it was also possible to estimate the aggregate electricity consumed by third parties (e.g. airlines, handlers, etc.) operating at the airport. The reliability of electricity data is considered high.
Other fuels In the case of petrol, diesel, CNG and LPG, which are mainly used for vehicles, generators, etc., the data sources are mainly related to invoices from refuelling stations. Where possible, quality control is undertaken (e.g. Finance Department through invoices). Potential sources of error may be related to mistakes in data entry, incorrect charging of fuel type, omissions, etc. In general, the joint venture airports have a well-developed system for data collection and analysis, which in some cases is also verified by external institutions (e.g. Bureau Veritas).
Table 4 presents the various fuel types, the emission factors, and the relevant references. Where necessary, airports and airlines provided additional data and clarifications on data collection procedures, validity, calculations, etc. Furthermore, regarding quality control it was possible to 9 “Other” refers to general aviation, resellers, etc.

20
compare the carbon footprint data and indicators of this study with data from different sources (e.g. Ministry of Petroleum & Natural Gas), alternative indicators (e.g. emissions per passenger), 2011 carbon footprint data, as well as other studies that have addressed Indian emissions. All data have been entered in a database.
Table 4 Emissions Factors Information
Fuel Type Emission Factor
Reference
ATF 3.157 tonnes of CO2/tonne
ICAO (2011), Guidance Material for the Development of State Action Plans, p. 19
Petrol 3.14 tonnes of CO2/tonne
DEFRA: 2011 Guidelines to DEFRA / DECC GHG Conversion Factors for Company Reporting, Annex 1, Tables 1a, 1b
Diesel 3.16 tonnes of CO2/tonne
CNG 2.70 tonnes of CO2/tonne
LPG 1.49 tonnes of CO2/m3
Electricity NEWNE*
0.78 tonnes of CO2/MWh
Ministry of Power (2013), Central Electricity Authority, CO2 Baseline Database for the Indian Power Sector, Table S-1
Electricity South*
0.76 tonnes of CO2/MWh
* Two emission factors are available depending on the location of service provision (NEWNE: Integrated North Eastern Western & North-Western regional grids and South: Southern Grid).

21
CARBON FOOTPRINT FOR 2012
This section provides detailed information regarding the carbon footprint of Indian scheduled passenger airlines for 2012 and makes comparisons with 2011 data. Figure 3 delineates the breakdown of CO2 emissions.
The emissions of Indian scheduled passenger airlines to/from domestic destinations for 2012 was 6,135,000 tonnes of CO2, a 9.2% reduction compared to the 6,755,000 tonnes of CO2 emitted in 2011.
The emissions of Indian scheduled passenger airlines to/from international destinations for 2012 was 5,425,000 tonnes of CO2, an 8.8% reduction compared to the 5,949,000 tonnes of CO2 emitted in 2011.
In total, the carbon footprint of Indian scheduled passenger airlines to/from domestic and international destinations for 2012 was 11,559,000 tonnes of CO2, a 9% reduction compared to the 12,704,000 tonnes of CO2 emitted in 2011.10
The emissions of foreign scheduled airlines to international destinations from India for 2012 was 3,829,000 tonnes of CO2, a 5.7% increase compared to the 3,623,000 tonnes of CO2 emitted in 2011. 11
10 In 2010 the respective emissions were estimated at 11,990,000 tonnes. Numbers in this report are rounded.11 Based on ATF uplift data from India obtained from the Ministry of Petroleum & Natural Gas. Only emissions of foreign airlines “to” international destinations are included (and not “from”) in order to be consistent with International Energy Agency guidance on international bunkers and to avoid double counting. Airlines that did not uplift fuel in India are also excluded due to lack of data.
Section - 4

22
Consequently, the total emissions of Indian scheduled passenger airlines to/from domestic and international destinations as well as of foreign scheduled airlines to international destinations from India for 2012 reached
Table 5Global vs. Indian CO2 Aviation Emissions
In 2012, global airline operations were responsible for the emission of 690,000,000 tonnes of CO2, representing approximately 2%-3% of global anthropogenic emissions. In comparison, emissions of Indian scheduled airline operations to/from domestic/international destinations as well as of foreign airlines to international destinations (i.e. 15,389,000 tonnes of CO2) represented less than 1% of India’s anthropogenic emissions.12
12 Latest data available for India refer to 2011, when 1.97 billion tonnes of CO2 were emitted (PBL Netherlands Environmental Assessment Agency & European Commission, Trends in Global CO2 Emissions, (The Hague, Netherlands, 2012).

23
15,389,000 tonnes of CO2, a 5.7% decline compared to the 16,327,000 tonnes of CO2 emitted in 2011. Overall, the decline of Indian airlines emissions and the increase of foreign airlines emissions follow the general passenger trends for 2012.
In accordance with international standards, international aviation bunkers (i.e. emissions from fuel use for international civil aviation) should be reported separately. Emissions of Indian scheduled passenger airlines as well as foreign scheduled airlines to international destinations from India for 2012 reached 6,542,000 tonnes of CO2, a marginal decline of 0.8% compared to the 6,597,000 tonnes of CO2 emitted in 2011.13 Figure 4 depicts the 2012 CO2 emissions by destination and airline.
13 Intergovernmental Panel on Climate Change, Guidelines for National Greenhouse Gas Inventories, Understanding the Common Reporting Framework, (1996). According to ICAO, Guidance Material for the Development of States’ Action Plans, (2011), p. 17, international are flights with one or both terminals in the territory of a country, other than the country in which the air carriers has its principal places of business. Domestic flights are those not classifiable as international. The contribution of Indian airlines to international destinations is calculated as half of their total contribution to/from international destinations.
24
For validation purposes, the results of the previous sections were compared with the outcomes of the Aviation Carbon Footprint-Global Scheduled International Passenger Flights and Global Scheduled Domestic Flights studies for 2012. According to these studies, the emissions from international flights from India were estimated at 7,182,000 tonnes of CO2, and for domestic flights at 6,267,000 tonnes. These estimates are respectively 9.8% and 2.2% more than the numbers estimated in this report. Given the different methodologies used, this outcome provides further evidence about the validity of the results.
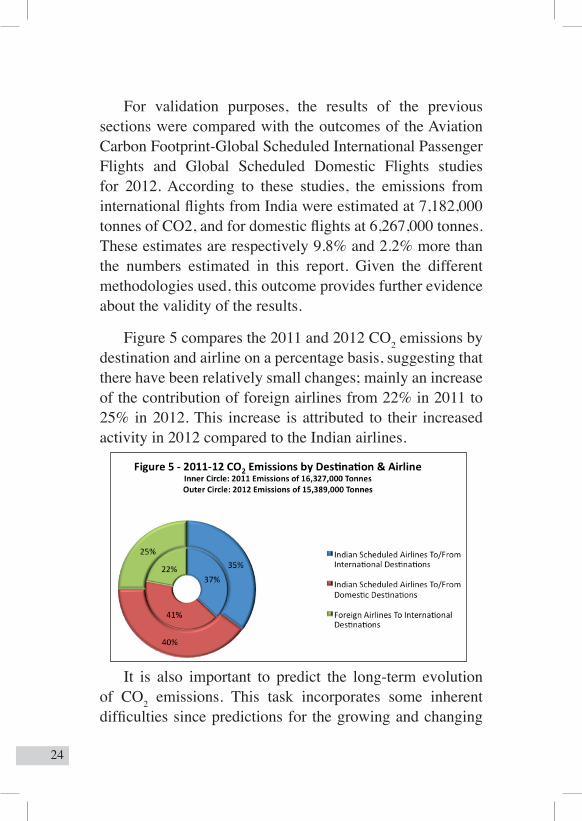
Figure 5 compares the 2011 and 2012 CO2 emissions by destination and airline on a percentage basis, suggesting that there have been relatively small changes; mainly an increase of the contribution of foreign airlines from 22% in 2011 to 25% in 2012. This increase is attributed to their increased activity in 2012 compared to the Indian airlines.
It is also important to predict the long-term evolution of CO2 emissions. This task incorporates some inherent difficulties since predictions for the growing and changing

25
Indian market are difficult to make. However, such a forecast can set the baseline for Indian aviation’s future emissions in the absence of any reduction measures. The Ministry of Petroleum & Natural Gas predicts an annual growth rate of ATF fuel consumption of 9% (2013-2016) and 8% (2017-2020).14 For the period 2021-2050, this report uses a 7% growth rate.
Figure 6 suggests that the baseline emissions of Indian scheduled passenger airlines from domestic and international operations in 2020 are estimated at approximately 12,000,000 and 10,500,000 CO2 tonnes respectively. Emissions of foreign scheduled airlines to international destinations emissions are estimated at 7,300,000 tonnes.
The internationally accepted efficiency indicator for carbon emissions is kgs CO2 per RTK. The average for Indian airlines in 2012 was estimated at 0.99 compared to 1.06 in 2011, a significant improvement of 6.6% over the previous year (Figure 7). Although this number remains above the 2011 global average of 0.95, it shows a declining trend. 14 Information from Ministry of Petroleum & Natural Gas, Petroleum Planning & Analysis Cell, at http://ppac.org.in. See Forecast and Analysis, Demand Projection XII and XIII Plan.

26
Some airlines show a significant reduction, small reduction or small increase. Some Indian scheduled passenger airlines are still above the global average, suggesting there is room for improved efficiency.15
Airline A
2011 GlobalAverage
IndianAverage
Airline B
Airline C
Airline D
Airline E
Airline F
Airline G
15 P. Steele, Air Transport Action Group, Aviation & Environment, Presentation at the 68th
IATA AGM Meeting (Beijing, China, June 2012). Calculations based on the 2011 average global fuel consumption of 37.49 litres/100 RTK. According to D. Southgate, The Carbon Footprint of Aircraft Operations in Australia – 2011, (October 2012) the 2011 average of Australian aviation is 0.96 kgs/RTK. According to S. Korea’s presentation at ICAO’s Symposium on Aviation & Climate Change (14-16 May 2013) regarding the Action Plan to Reduce GHG Emissions from International Aviation in 2010 the country’s fuel efficiency of international aviation was 0.99 kgs/RTK. The global CO2/RTK for 2012 is not yet available.
The trends presented in the previous paragraphs can be attributed to the general passenger developments for 2012, the discontinuation of Kingfisher’s operations (which was also less efficient regarding emissions per RTK compared to the other airlines), as well as the improved efficiency of some Indian airlines, due to higher load factors and use of newer more fuel-efficient aircraft (e.g. SpiceJet’s Q400). At the same time the efficiency level of airlines that fly public service obligations (PSO) routes or for other reasons are obliged to operate with lower load factors, is expected to be lower.

27
As discussed earlier, approximately 95%-98% of aviation’s emissions are emitted from aircraft while the remaining originate from airport related activities. Applying this assumption (i.e. 5%) to the 15,389,000 tonnes of CO2, it is estimated that Indian airports emitted around 770,000 tonnes of CO2. This number is consistent with data provided by four joint venture airports, which was then extrapolated for all Indian airports.
Figure 8 presents the CO2 emissions (in kgs per passenger) for the four joint venture airports. These emissions are related to sources that are owned or controlled by these airports as well to electricity consumption for their operations (excluding third parties). Electricity consumption is the main source of airport emissions. Consequently, differences between airports are not only relevant to variations in efficiencies, but also to infrastructure characteristics (e.g. size of buildings, area, number of runways, etc.).
Although airports make a small contribution to CO2 emissions compared to aircraft operations, they represent a focal point for climate change interventions to improve airline operations, such as taxi times, power provision, etc.
Airport A Airport B Airport C Airport D

28
PROPOSALS
Given the significant expected growth of Indian aviation, inevitably CO2 emissions are likely to increase. In order to minimise the rate of increase and maximise the effectiveness of climate change policies the following recommendations are made, several of which are already included in the Aviation Environment Circular 2 of 2013 on Climate Change Initiatives in Civil Aviation.
Formation of Climate Change Task Force The development of effective solutions in the field of aviation and climate change requires long-term cooperation between all the main stakeholders. The establishment of a permanent Aviation Climate Change Task Force, under the auspices of the DGCA and with the initial participation of representatives from airlines, airports, the MOEF, AAI, fuel companies, etc., is an important initiative already provided in the Aviation Environment Circular 2 of 2013. The Task Force should regularly assess conditions, facilitate data collection and analysis, and formulate initiatives. It should be expected that the inaugural meeting will take place within 2013. In the future, invitation for membership could be extended to additional domestic or international organisations.
Development of Annual Carbon Footprint It is important to continue with the development of annual carbon footprints to establish trends, monitor progress, and identify areas of potential intervention. The annual update is especially important given the evolving nature of the Indian aviation industry (e.g. high growth, new entrants), which influences the level of emissions. Aviation Environment Circular
Section - 5

29
2 of 2013 provides for the development of annual carbon footprints both at the national level as well as at the airport and airline levels.
Dissemination of Information The carbon footprints should also be publicised both within the Indian aviation industry (e.g. airlines, airports, DGCA website), internationally (e.g. ICAO, IATA, ACI), as well as with the general and specialised aviation press, in order to showcase the meaningful efforts of India regarding aviation and climate change.
Delivery of Workshops: Regular workshops should continue to be provided to Indian airlines and airport operators in order to promote increased awareness concerning aviation’s role in climate change, improve data collection procedures, identify areas for efficiency interventions and encourage collaboration amongst aviation’s stakeholders.
Reporting: Airports and airlines should provide information on voluntary measures taken to reduce CO2 emissions, effects, timeline, expected results, especially in relation to fuel efficiency, reduction of emissions from airport functions and ground operations, etc. Also, stakeholders shall also submit to the DGCA the relevant reports if their organizations have been certified in accordance to ISO standards (e.g. ISO-14001, ISO 14064) or are participating in Airport Carbon Accreditation or a similar initiative.

30
CONCLUSIONS
The process of developing the carbon footprint of the Indian aviation sector for 2012 has provided a very good understanding of the sources of CO2 emissions, the availability and reliability of data from airlines and airports, emission trends, as well as required future initiatives.
Within this context, the establishment of an aviation climate change task force, development of annual carbon footprints, dissemination of information and reporting, and delivery of workshops, will underscore India’s commitment to addressing the challenge of aviation and climate change in a comprehensive and effective manner and safeguard the industry’s potential to grow.
Section - 6