Embed Size (px)
Citation preview
Carbon Footprint of Agricultural Products - A Measure of the Impact of Agricultural Production on Climate ChangeDesjardins, R.L. Worth, D.E., Vergé, X.P.C., VanderZaag, A., Janzen, H., Kroebel, R., Maxime, D. Smith, W., Grant, B., Pattey, E., and Dyer, J.A.
2
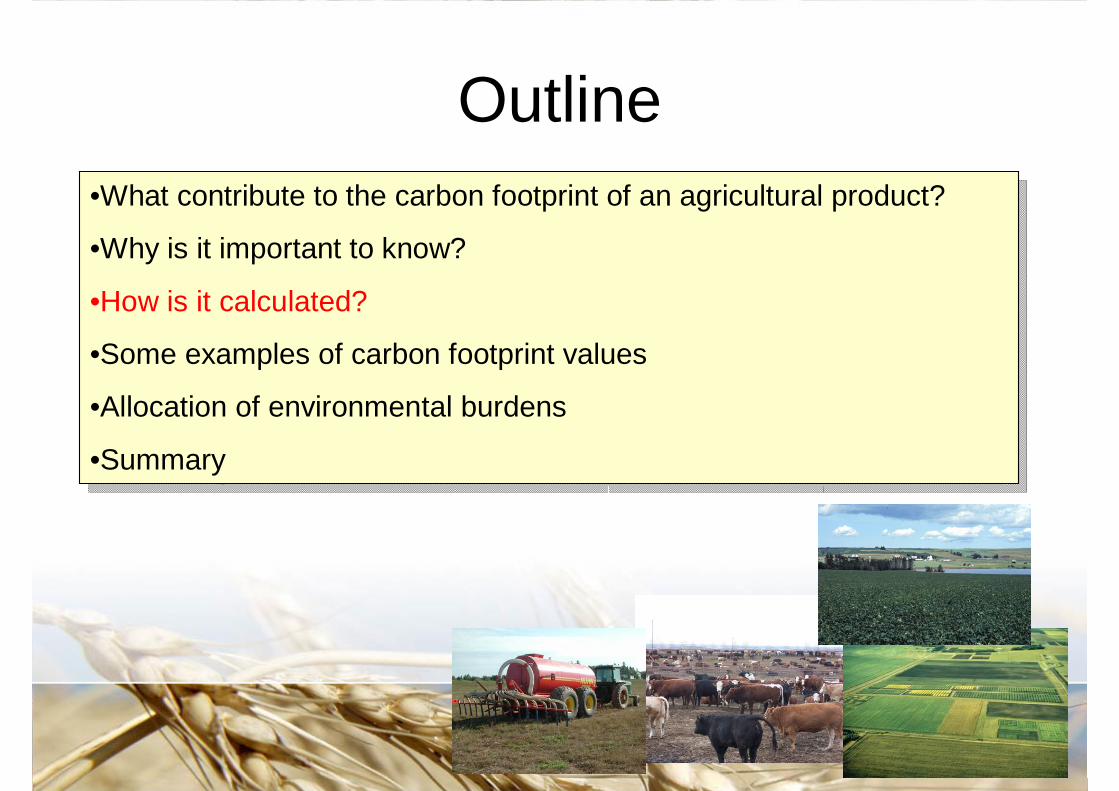
Outline•What contributes to the carbon footprint of an agricultural product?
•Why is it important to know?
•How is it calculated?
•Some examples of carbon footprint values
•Allocation of environmental burdens
•Summary
•What contributes to the carbon footprint of an agricultural product?
•Why is it important to know?
•How is it calculated?
•Some examples of carbon footprint values
•Allocation of environmental burdens
•Summary
3
CH4
CO2
Soil Organic Matter
N2Fertilizer
Legumes
N2O
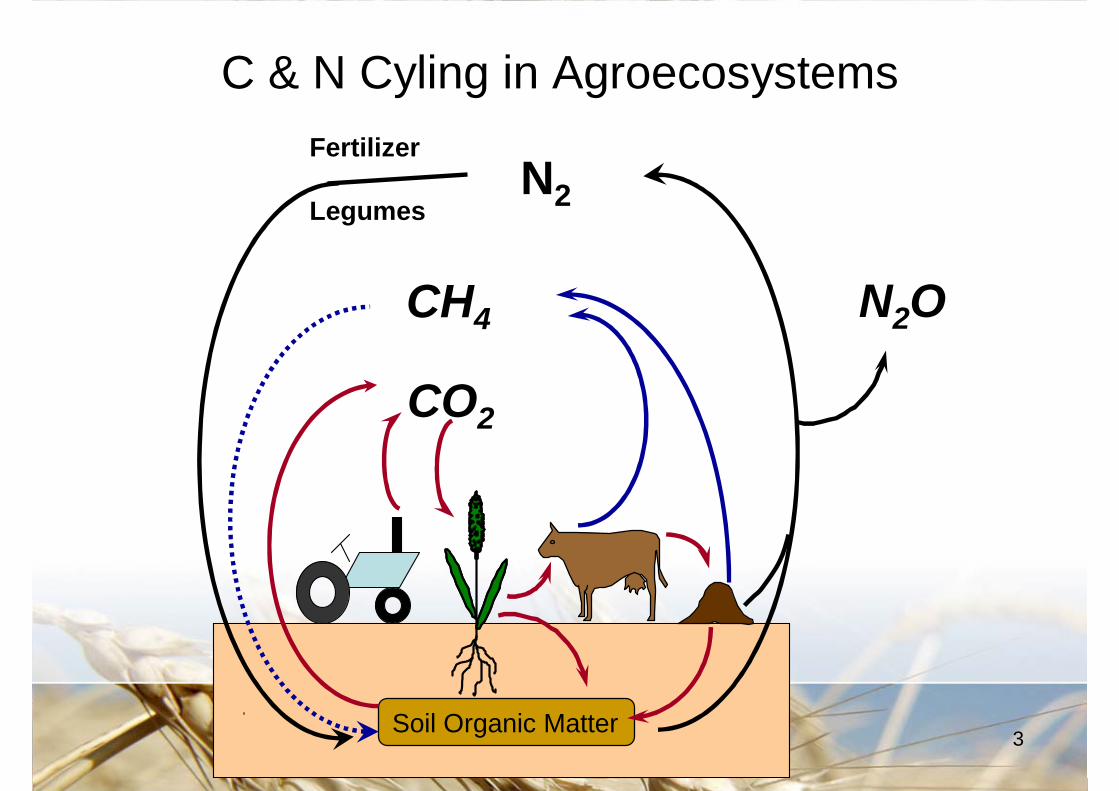
GHG emissions from Canadian agricultureC & N Cyling in Agroecosystems
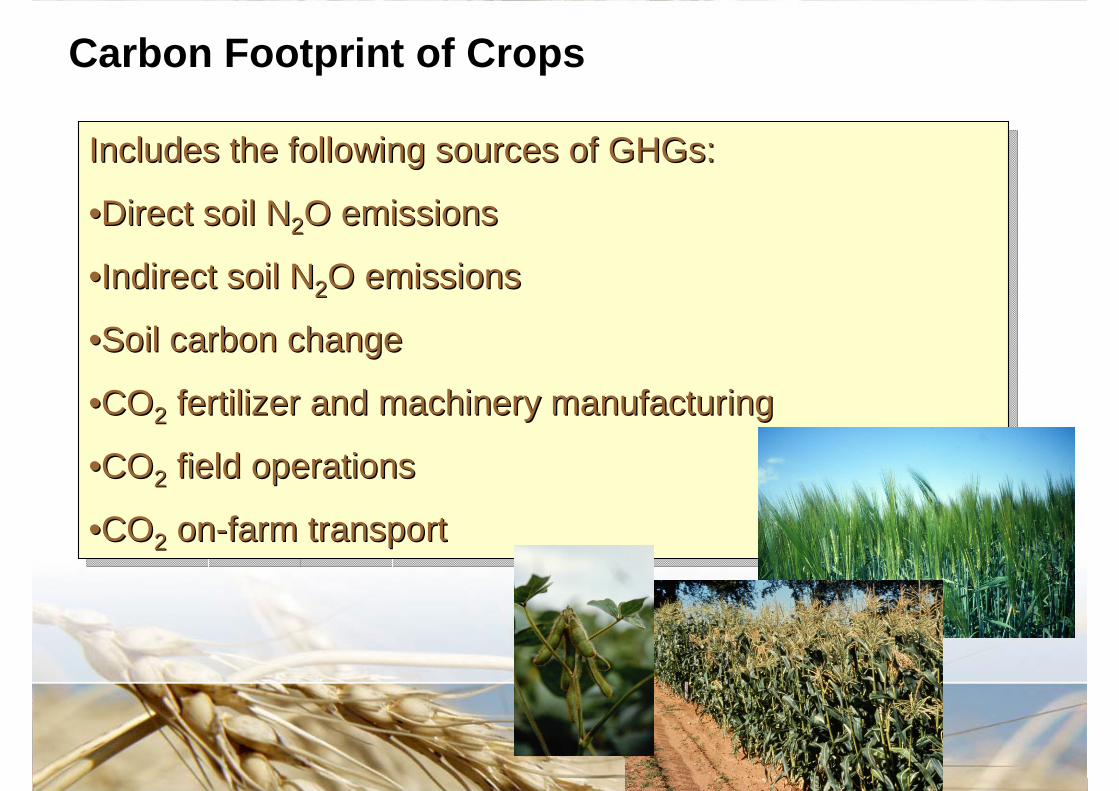
GHG emissions intensity for crops in CanadaCarbon Footprint of Crops
Includes the following sources of GHGs:
•Direct soil N2O emissions
•Indirect soil N2O emissions
•Soil carbon change
•CO2 fertilizer and machinery manufacturing
•CO2 field operations
•CO2 on-farm transport
Includes Includes the following sources of GHGs:the following sources of GHGs:
••Direct soil NDirect soil N22O emissionsO emissions
••Indirect soil NIndirect soil N22O emissionsO emissions
••Soil carbon change Soil carbon change
••COCO22 fertilizer and machinery manufacturingfertilizer and machinery manufacturing
••COCO22 field operationsfield operations
••COCO22 onon--farm transportfarm transport
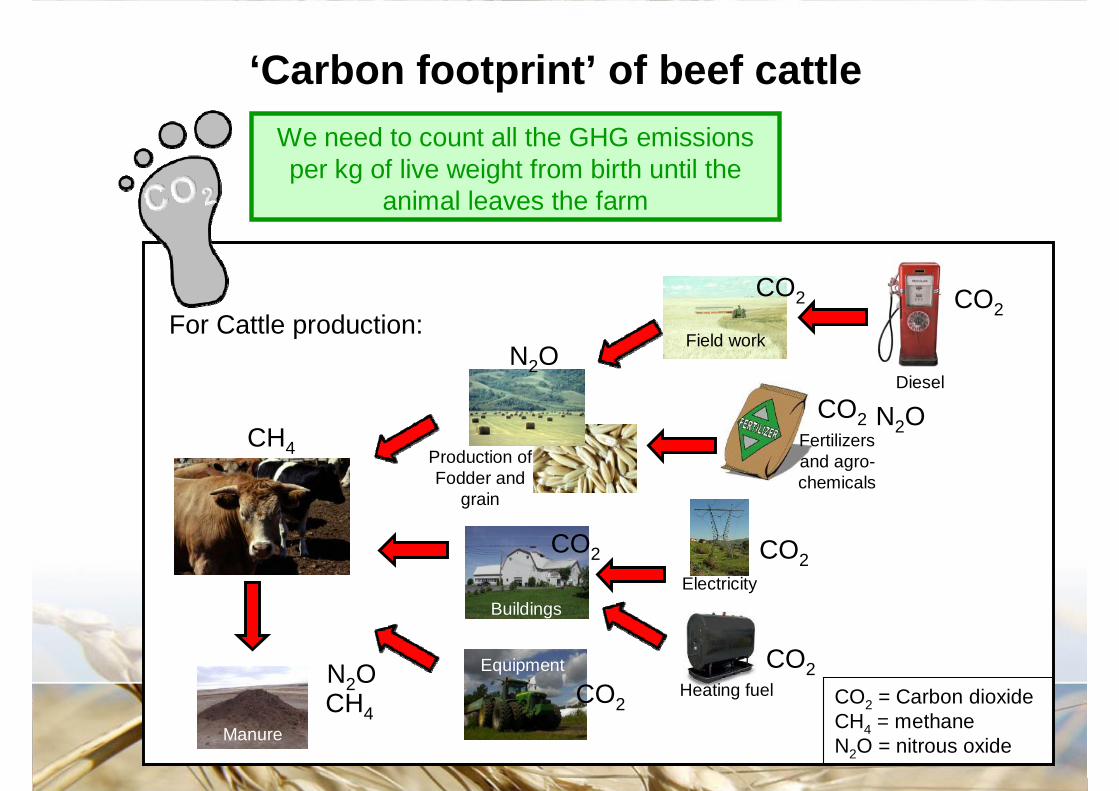
‘Carbon footprint’ of beef cattle We need to count all the GHG emissions per kg of live weight from birth until the
animal leaves the farm
Diesel
For Cattle production:
Manure
Buildings
Equipment
Electricity
Production of Fodder and
grain
Field work
Fertilizers and agro-chemicals
Heating fuel
CH4
N2OCO2
CH4
N2O
CO2
CO2
CO2
N2O
CO2 = Carbon dioxideCH4 = methaneN2O = nitrous oxide
CO2
CO2
CO2
6
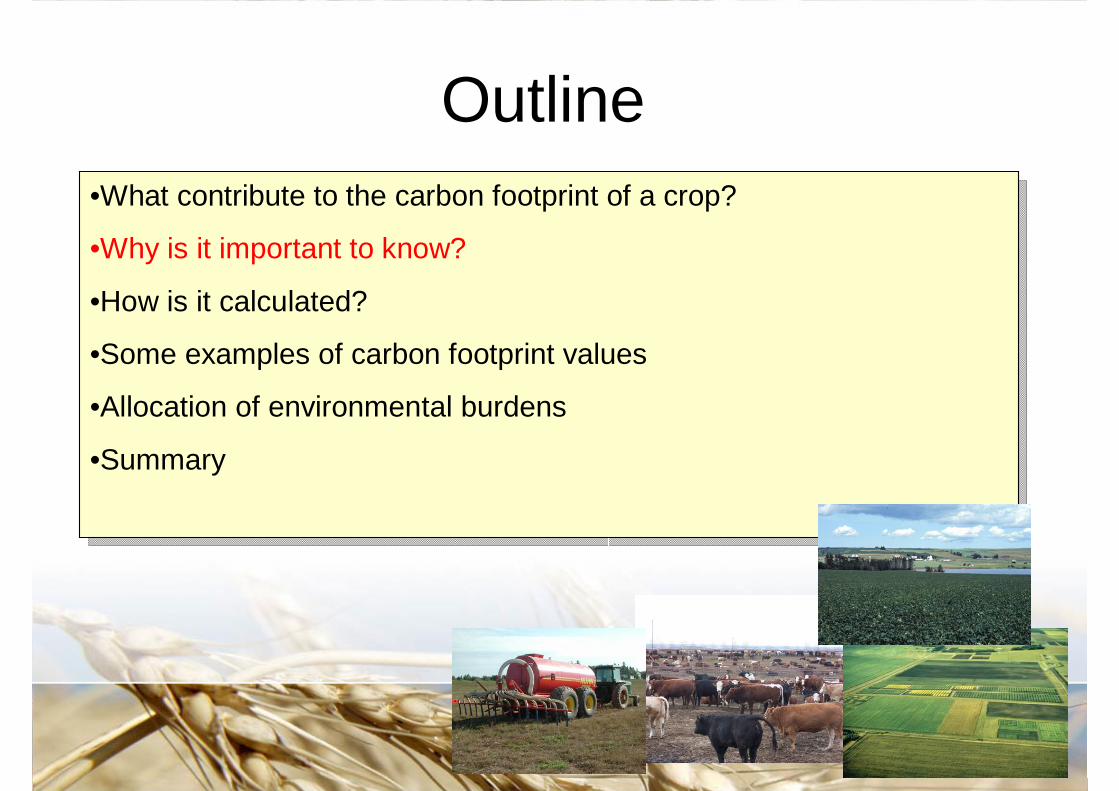
Outline•What contribute to the carbon footprint of a crop?
•Why is it important to know?
•How is it calculated?
•Some examples of carbon footprint values
•Allocation of environmental burdens
•Summary
•What contribute to the carbon footprint of a crop?
•Why is it important to know?
•How is it calculated?
•Some examples of carbon footprint values
•Allocation of environmental burdens
•Summary
7
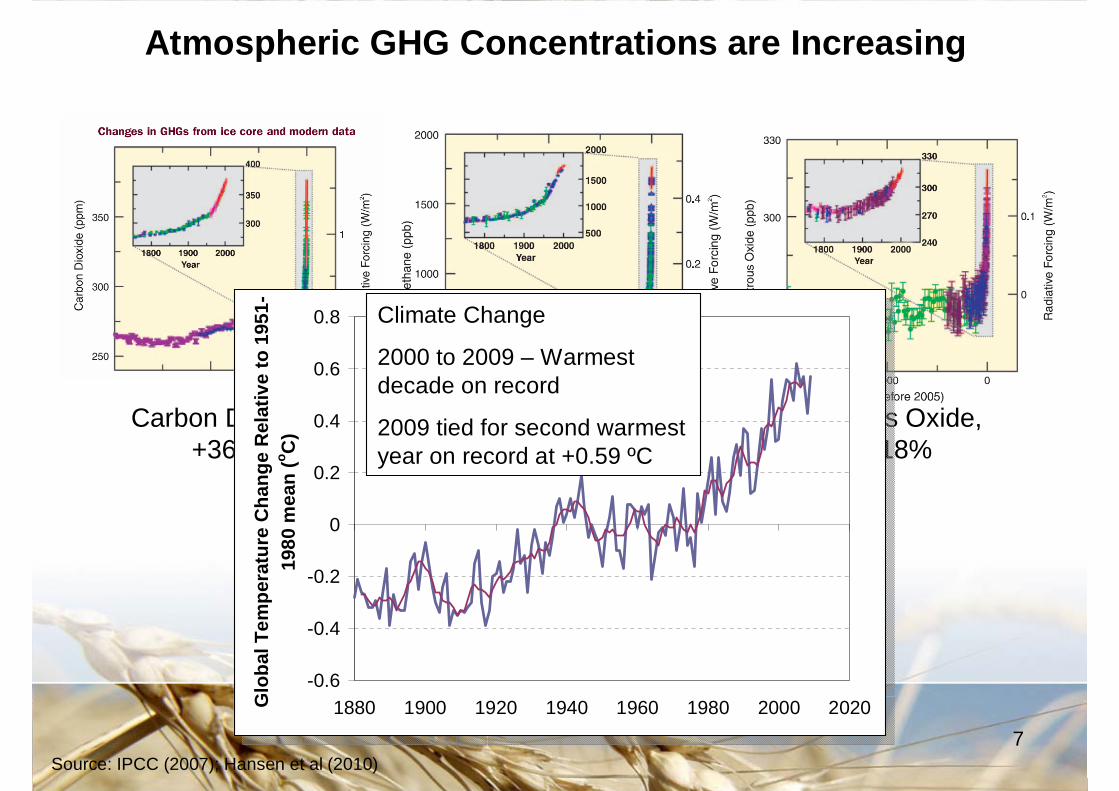
Atmospheric GHG Concentrations are Increasing
Source: IPCC (2007); Hansen et al (2010)
Carbon Dioxide, +36%
Methane, +148%
Nitrous Oxide, +18%
-0.6
-0.4
-0.2
0
0.2
0.4
0.6
0.8
1880 1900 1920 1940 1960 1980 2000 2020Glo
bal T
empe
ratu
re C
hang
e R
elat
ive
to 1
951-
1980
mea
n (o C
)Climate Change
2000 to 2009 – Warmest decade on record
2009 tied for second warmest year on record at +0.59 ºC
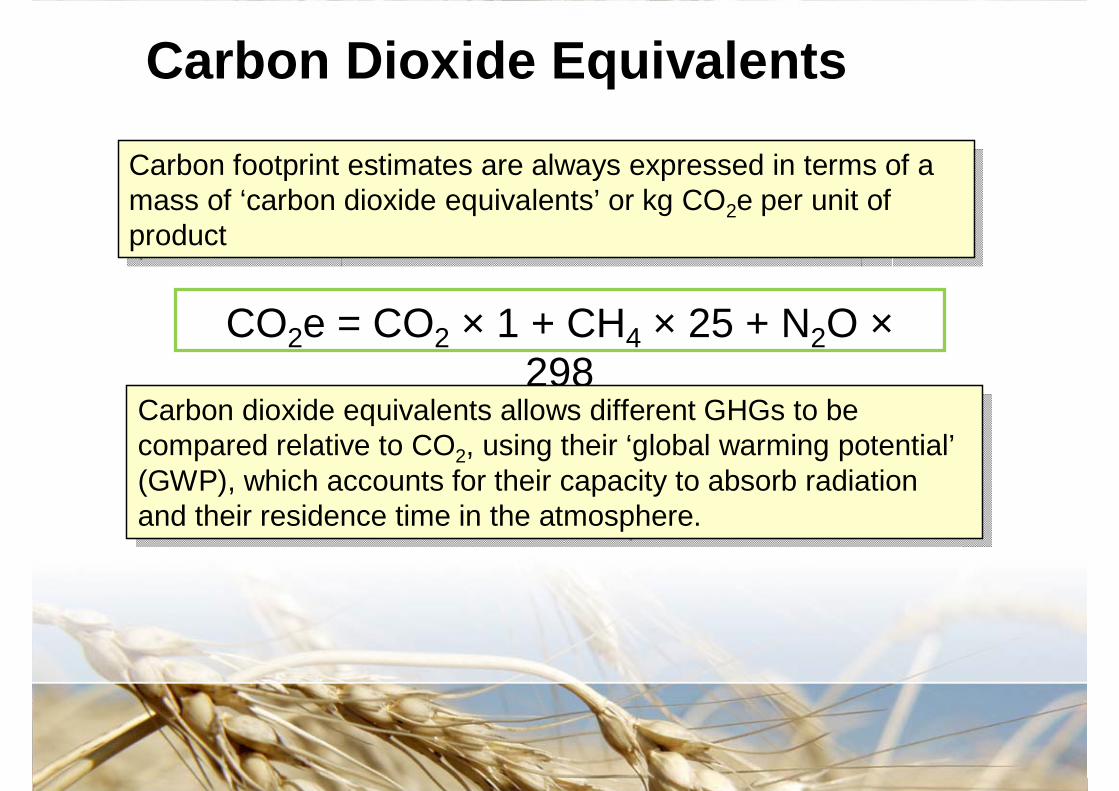
Carbon Dioxide Equivalents
Carbon footprint estimates are always expressed in terms of a mass of ‘carbon dioxide equivalents’ or kg CO2e per unit of product
Carbon footprint estimates are always expressed in terms of a mass of ‘carbon dioxide equivalents’ or kg CO2e per unit of product
CO2e = CO2 × 1 + CH4 × 25 + N2O ×298
Carbon dioxide equivalents allows different GHGs to be compared relative to CO2, using their ‘global warming potential’(GWP), which accounts for their capacity to absorb radiation and their residence time in the atmosphere.
Carbon dioxide equivalents allows different GHGs to be compared relative to CO2, using their ‘global warming potential’(GWP), which accounts for their capacity to absorb radiation and their residence time in the atmosphere.
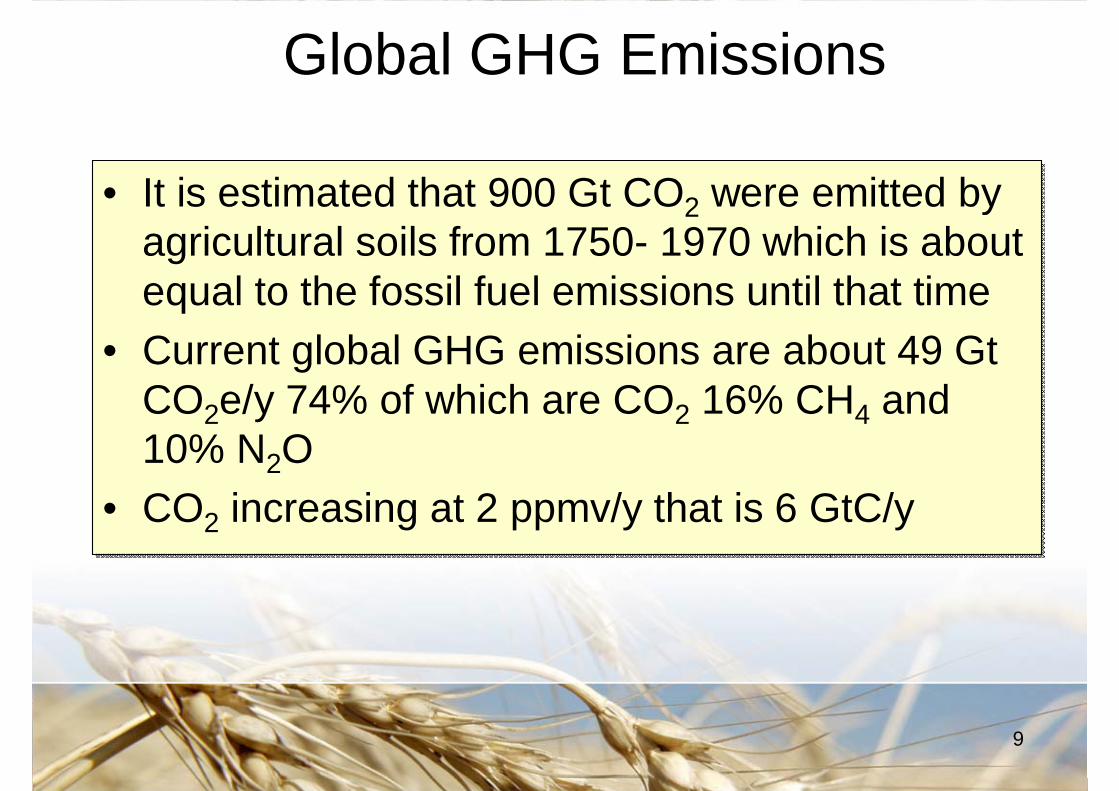
Global GHG Emissions
• It is estimated that 900 Gt CO2 were emitted by agricultural soils from 1750- 1970 which is about equal to the fossil fuel emissions until that time
• Current global GHG emissions are about 49 Gt CO2e/y 74% of which are CO2 16% CH4 and 10% N2O
• CO2 increasing at 2 ppmv/y that is 6 GtC/y
• It is estimated that 900 Gt CO2 were emitted by agricultural soils from 1750- 1970 which is about equal to the fossil fuel emissions until that time
• Current global GHG emissions are about 49 Gt CO2e/y 74% of which are CO2 16% CH4 and 10% N2O
• CO2 increasing at 2 ppmv/y that is 6 GtC/y
9
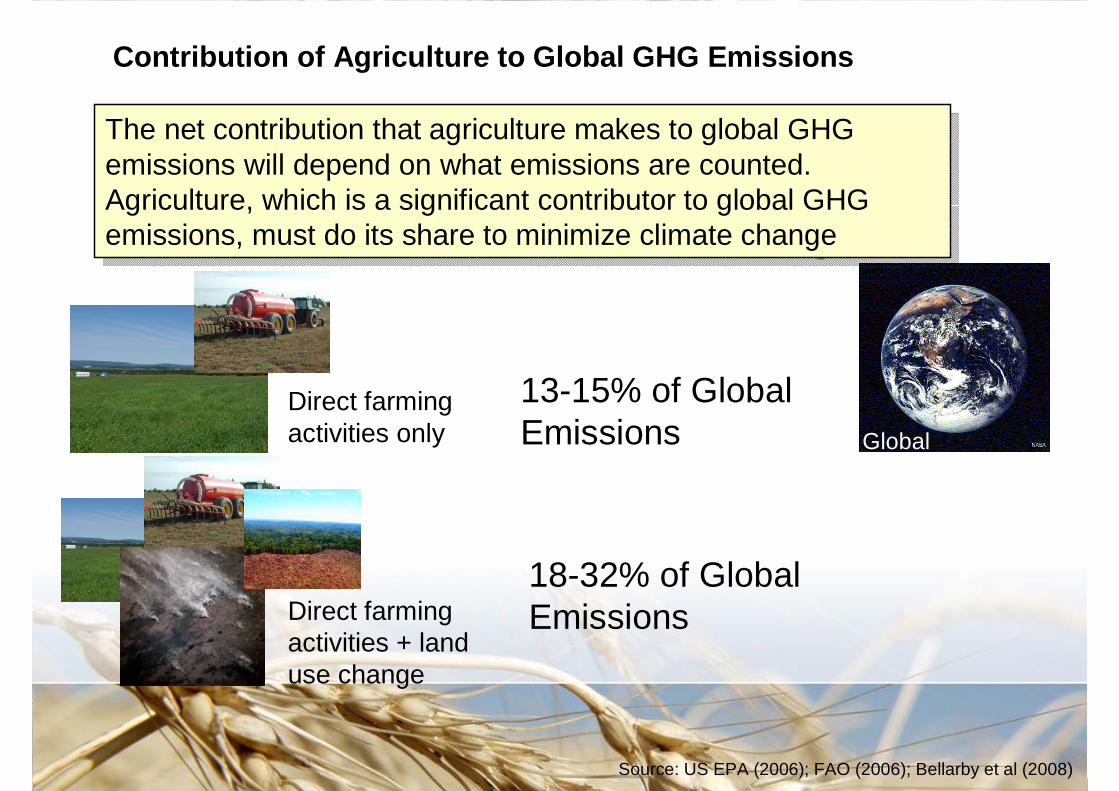
Contribution of Agriculture to Global GHG Emissions
The net contribution that agriculture makes to global GHG emissions will depend on what emissions are counted. Agriculture, which is a significant contributor to global GHG emissions, must do its share to minimize climate change
The net contribution that agriculture makes to global GHG emissions will depend on what emissions are counted. Agriculture, which is a significant contributor to global GHG emissions, must do its share to minimize climate change
Global
Direct farming activities only
13-15% of Global Emissions
Direct farming activities + land use change
18-32% of Global Emissions
Source: US EPA (2006); FAO (2006); Bellarby et al (2008)
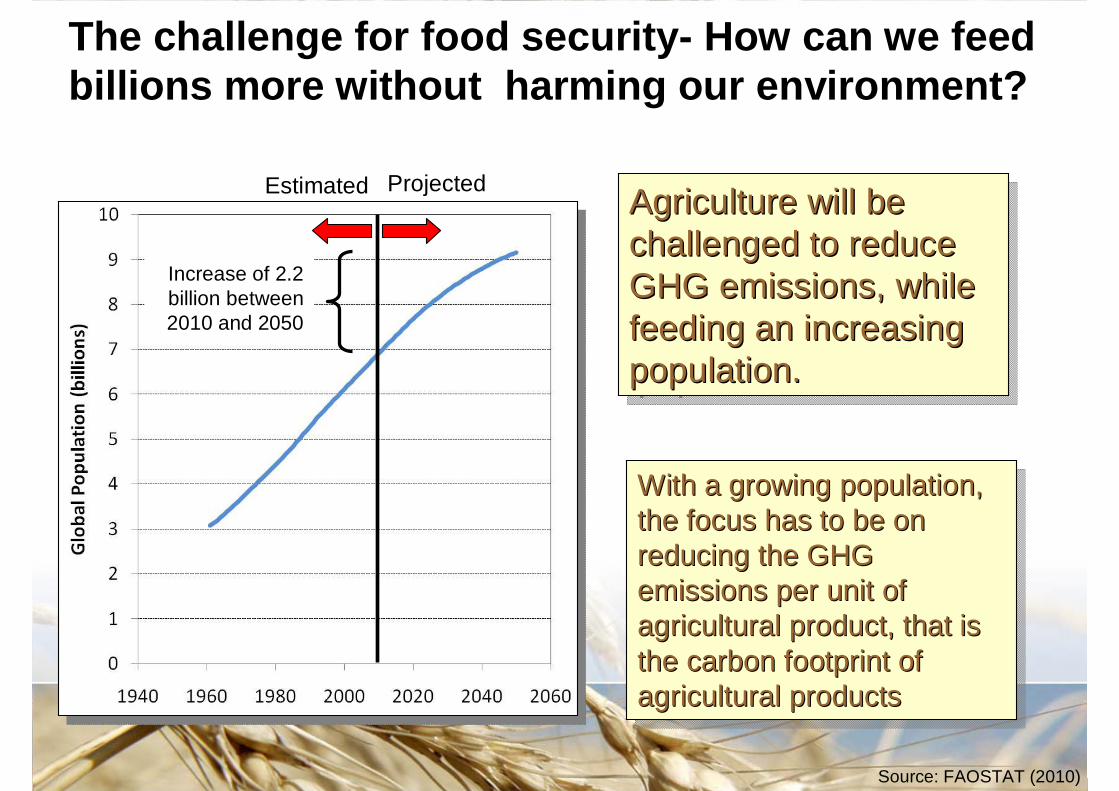
The challenge for food security- How can we feed billions more without harming our environment?
ProjectedEstimated
Increase of 2.2 billion between 2010 and 2050
Agriculture will be challenged to reduce GHG emissions, while feeding an increasing population.
Agriculture will be Agriculture will be challenged to reduce challenged to reduce GHG emissions, while GHG emissions, while feeding an increasing feeding an increasing population.population.
With a growing population, the focus has to be on reducing the GHG emissions per unit of agricultural product, that is the carbon footprint of agricultural products
With a growing population, With a growing population, the focus has to be on the focus has to be on reducing the GHG reducing the GHG emissions per unit of emissions per unit of agricultural product, that is agricultural product, that is the carbon footprint of the carbon footprint of agricultural productsagricultural products
Source: FAOSTAT (2010)
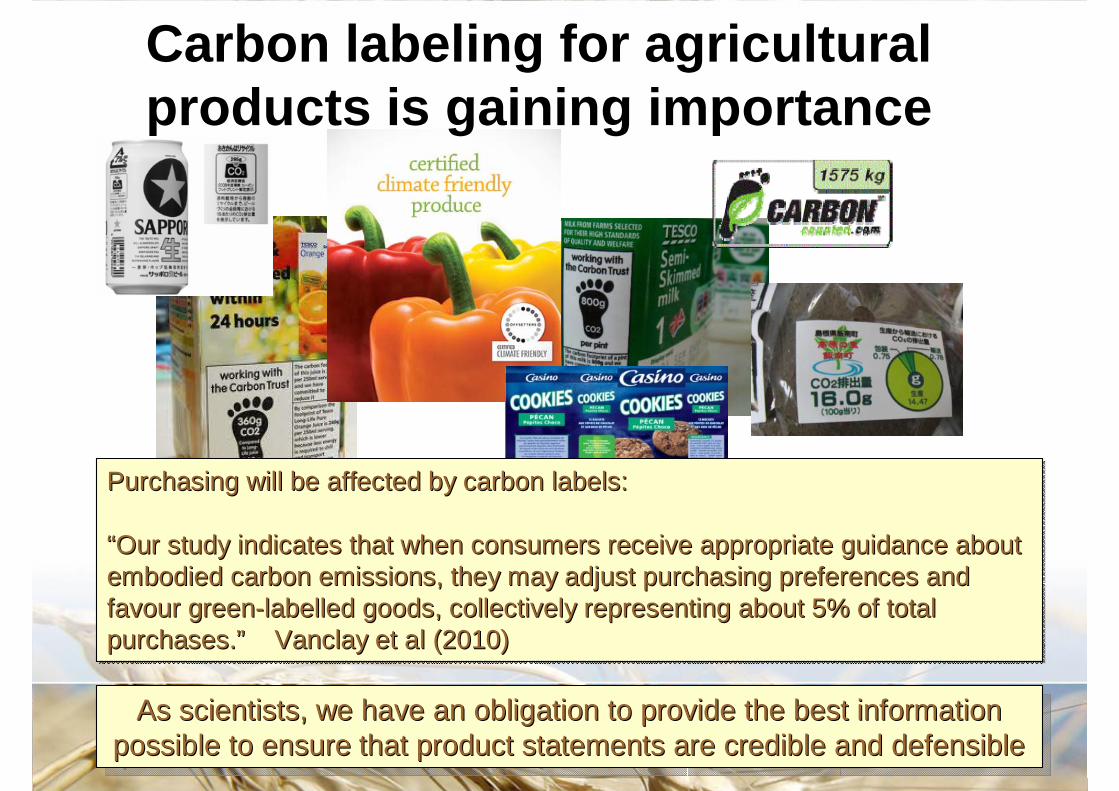
Carbon labeling for agricultural products is gaining importance
As scientists, we have an obligation to provide the best information possible to ensure that product statements are credible and defensibleAs scientists, we have an obligation to provide the best informaAs scientists, we have an obligation to provide the best information tion
possible to ensure that product statements are credible and defepossible to ensure that product statements are credible and defensiblensible
Purchasing will be affected by carbon labels:
“Our study indicates that when consumers receive appropriate guidance about embodied carbon emissions, they may adjust purchasing preferences and favour green-labelled goods, collectively representing about 5% of total purchases.” Vanclay et al (2010)
Purchasing will be affected by carbon labels:Purchasing will be affected by carbon labels:
““Our study indicates that when consumers receive appropriate guidOur study indicates that when consumers receive appropriate guidance about ance about embodied carbon emissions, they may adjust purchasing preferenceembodied carbon emissions, they may adjust purchasing preferences and s and favour greenfavour green--labelled goods, collectively representing about 5% of total labelled goods, collectively representing about 5% of total purchases.purchases.”” Vanclay et al (2010)Vanclay et al (2010)
13
Outline•What contribute to the carbon footprint of an agricultural product?
•Why is it important to know?
•How is it calculated?
•Some examples of carbon footprint values
•Allocation of environmental burdens
•Summary
•What contribute to the carbon footprint of an agricultural product?
•Why is it important to know?
•How is it calculated?
•Some examples of carbon footprint values
•Allocation of environmental burdens
•Summary
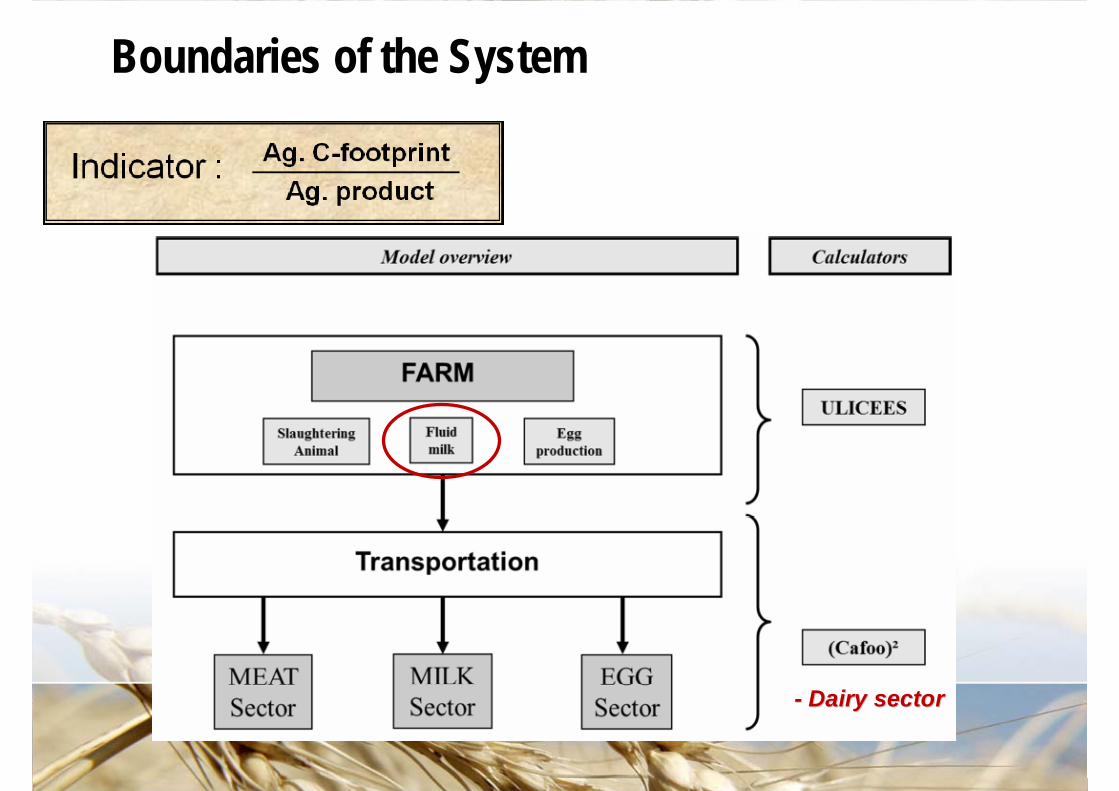
Boundaries of the System
-- Dairy sectorDairy sector
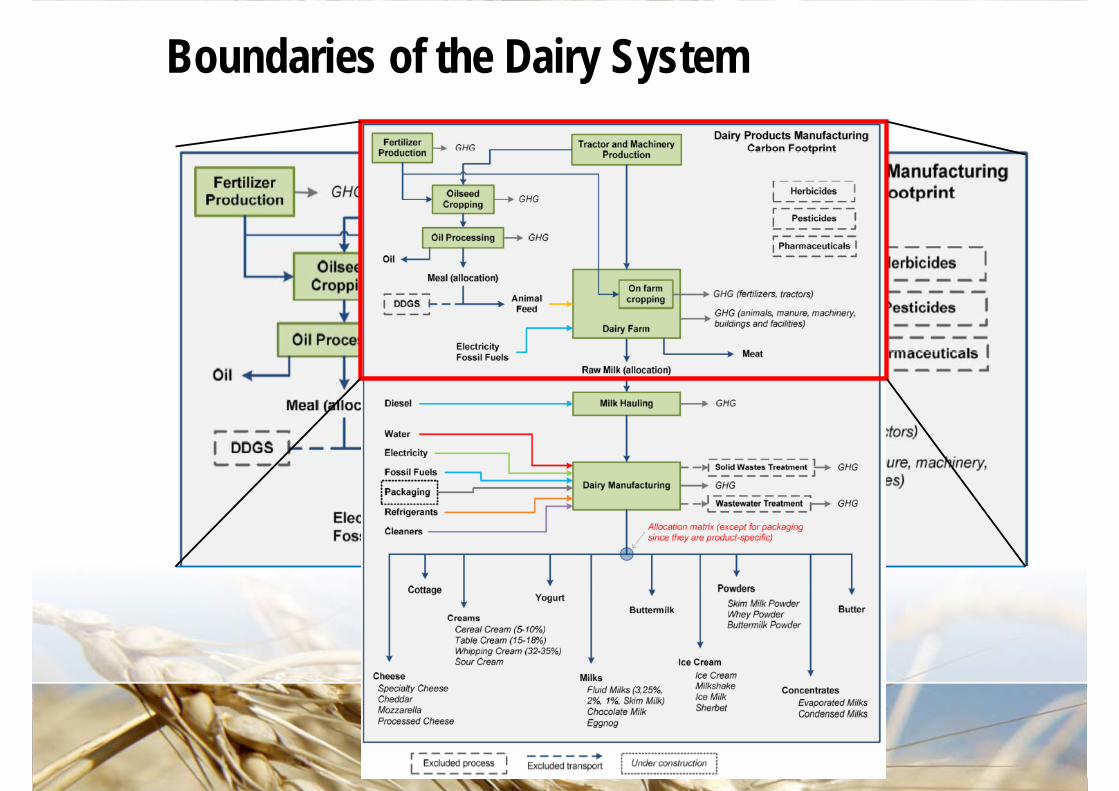
Boundaries of the Dairy System
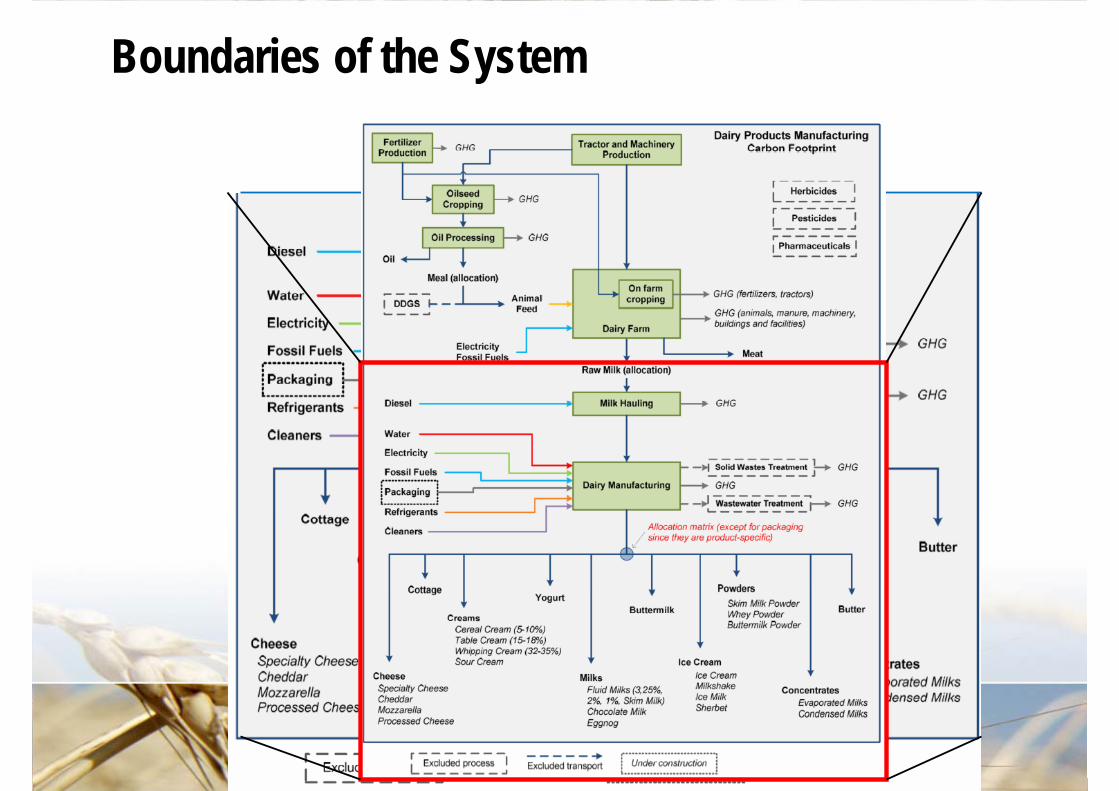
Boundaries of the System
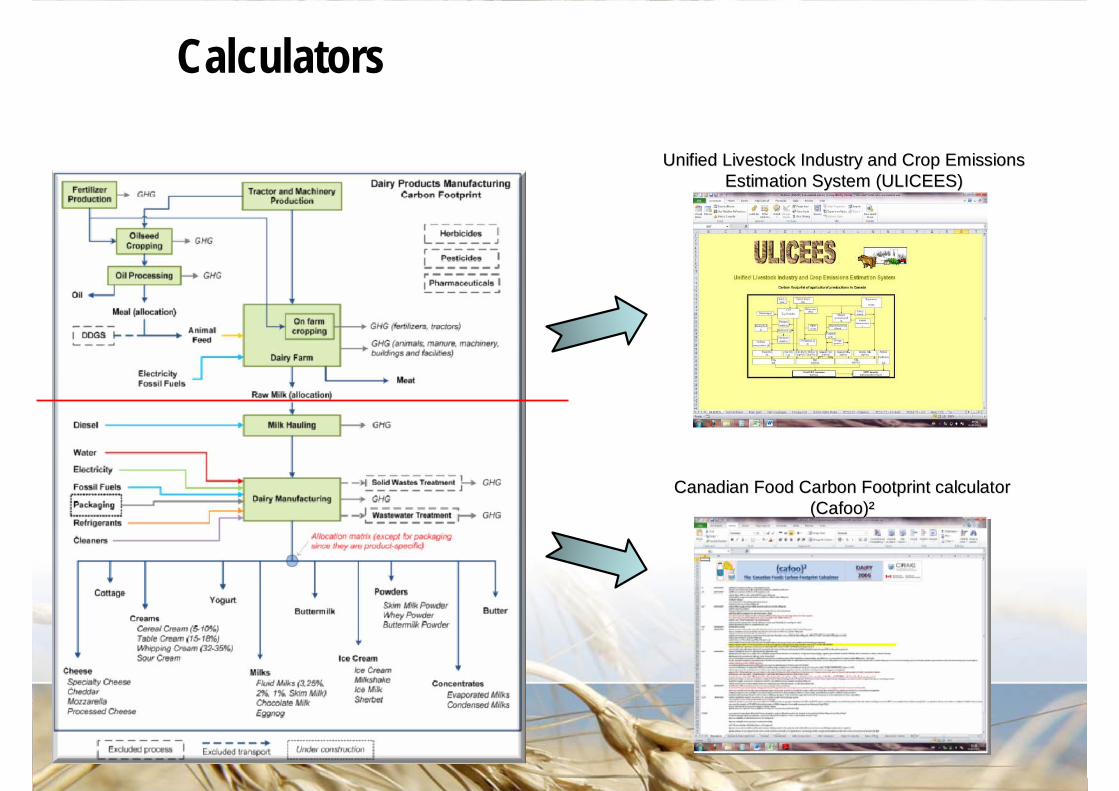
Calculators
Canadian Food Carbon Footprint calculator Canadian Food Carbon Footprint calculator (Cafoo)(Cafoo)²²
Unified Livestock Industry and Crop Emissions Unified Livestock Industry and Crop Emissions Estimation System (ULICEES) Estimation System (ULICEES)
18
Outline•What contribute to the carbon footprint of an agricultural product?
•Why is it important to know?
•How is it calculated?
•Some examples of carbon footprint values
•Allocation of environmental burdens
•A tool for decision making
•Summary
•What contribute to the carbon footprint of an agricultural product?
•Why is it important to know?
•How is it calculated?
•Some examples of carbon footprint values
•Allocation of environmental burdens
•A tool for decision making
•Summary
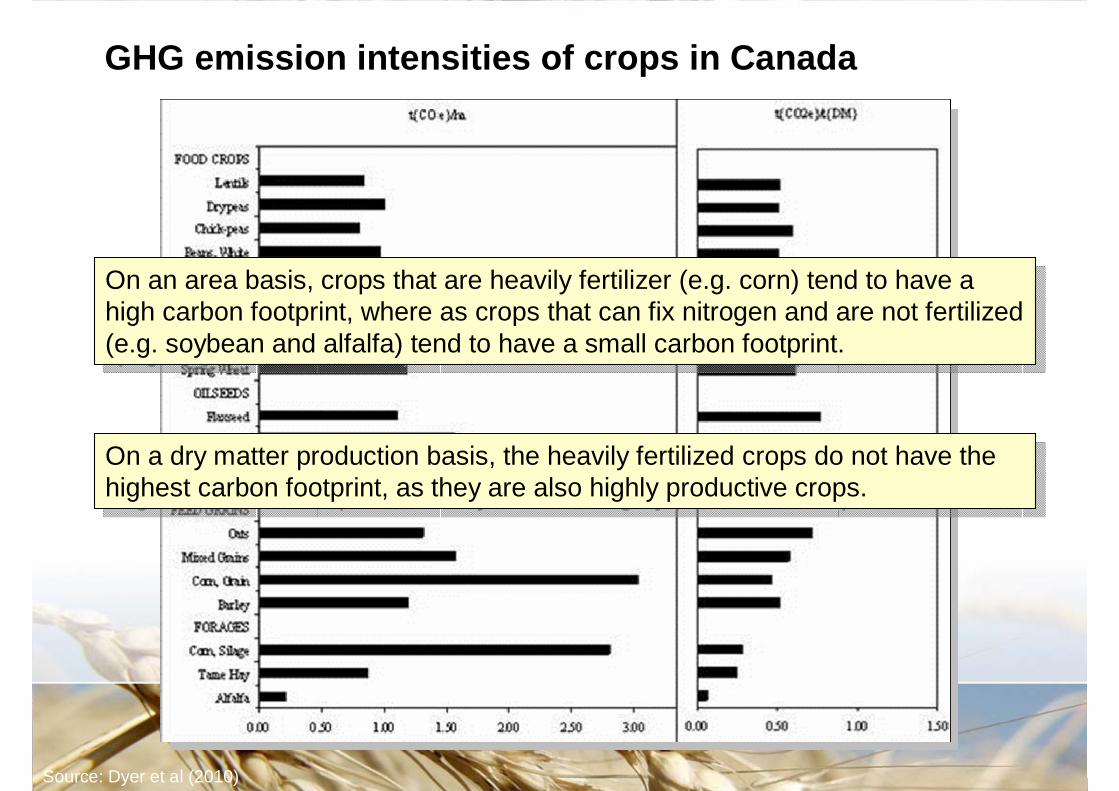
GHG emission intensities of crops in Canada
Source: Dyer et al (2010)
On an area basis, crops that are heavily fertilizer (e.g. corn) tend to have a high carbon footprint, where as crops that can fix nitrogen and are not fertilized (e.g. soybean and alfalfa) tend to have a small carbon footprint.
On an area basis, crops that are heavily fertilizer (e.g. corn) tend to have a high carbon footprint, where as crops that can fix nitrogen and are not fertilized (e.g. soybean and alfalfa) tend to have a small carbon footprint.
On a dry matter production basis, the heavily fertilized crops do not have the highest carbon footprint, as they are also highly productive crops.
On a dry matter production basis, the heavily fertilized crops do not have the highest carbon footprint, as they are also highly productive crops.
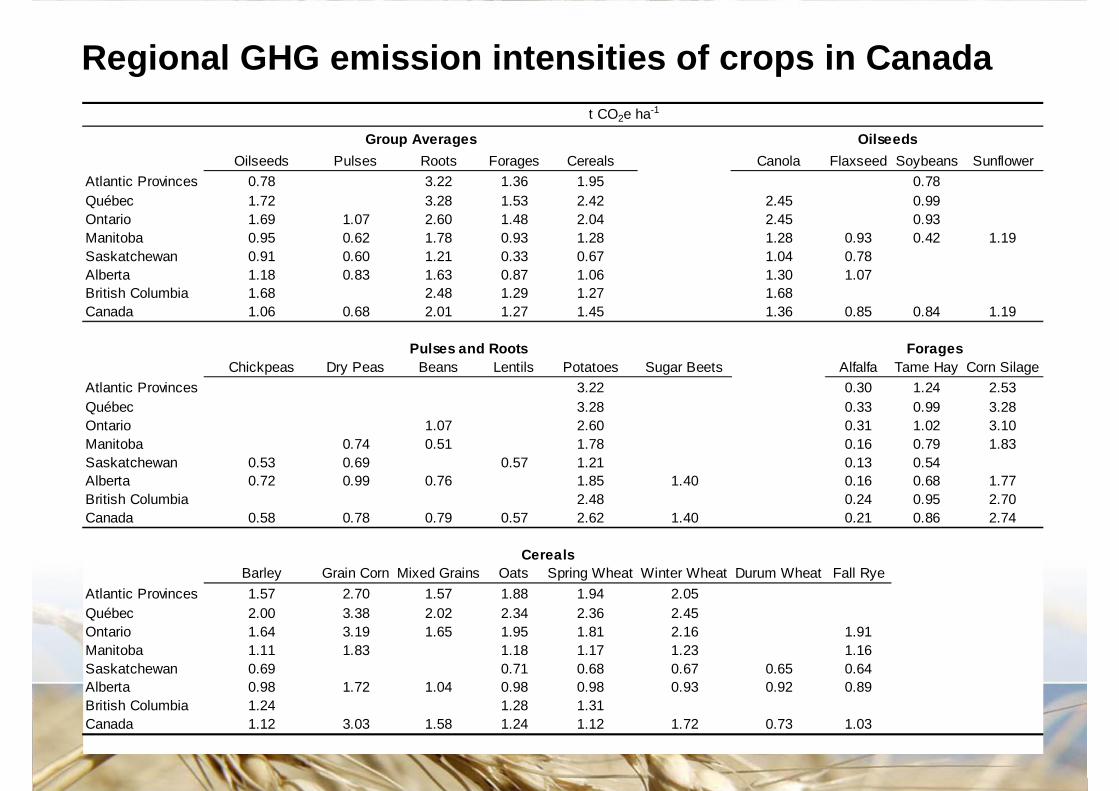
Oilseeds Pulses Roots Forages Cereals Canola Flaxseed Soybeans SunflowerAtlantic Provinces 0.78 3.22 1.36 1.95 0.78Québec 1.72 3.28 1.53 2.42 2.45 0.99Ontario 1.69 1.07 2.60 1.48 2.04 2.45 0.93Manitoba 0.95 0.62 1.78 0.93 1.28 1.28 0.93 0.42 1.19Saskatchewan 0.91 0.60 1.21 0.33 0.67 1.04 0.78Alberta 1.18 0.83 1.63 0.87 1.06 1.30 1.07British Columbia 1.68 2.48 1.29 1.27 1.68Canada 1.06 0.68 2.01 1.27 1.45 1.36 0.85 0.84 1.19
Chickpeas Dry Peas Beans Lentils Potatoes Sugar Beets Alfalfa Tame Hay Corn SilageAtlantic Provinces 3.22 0.30 1.24 2.53Québec 3.28 0.33 0.99 3.28Ontario 1.07 2.60 0.31 1.02 3.10Manitoba 0.74 0.51 1.78 0.16 0.79 1.83Saskatchewan 0.53 0.69 0.57 1.21 0.13 0.54Alberta 0.72 0.99 0.76 1.85 1.40 0.16 0.68 1.77British Columbia 2.48 0.24 0.95 2.70Canada 0.58 0.78 0.79 0.57 2.62 1.40 0.21 0.86 2.74
Barley Grain Corn Mixed Grains Oats Spring Wheat Winter Wheat Durum Wheat Fall RyeAtlantic Provinces 1.57 2.70 1.57 1.88 1.94 2.05Québec 2.00 3.38 2.02 2.34 2.36 2.45Ontario 1.64 3.19 1.65 1.95 1.81 2.16 1.91Manitoba 1.11 1.83 1.18 1.17 1.23 1.16Saskatchewan 0.69 0.71 0.68 0.67 0.65 0.64Alberta 0.98 1.72 1.04 0.98 0.98 0.93 0.92 0.89British Columbia 1.24 1.28 1.31Canada 1.12 3.03 1.58 1.24 1.12 1.72 0.73 1.03
t CO2e ha-1
Pulses and Roots
Group Averages Oilseeds
Forages
Cereals
Regional GHG emission intensities of crops in Canada
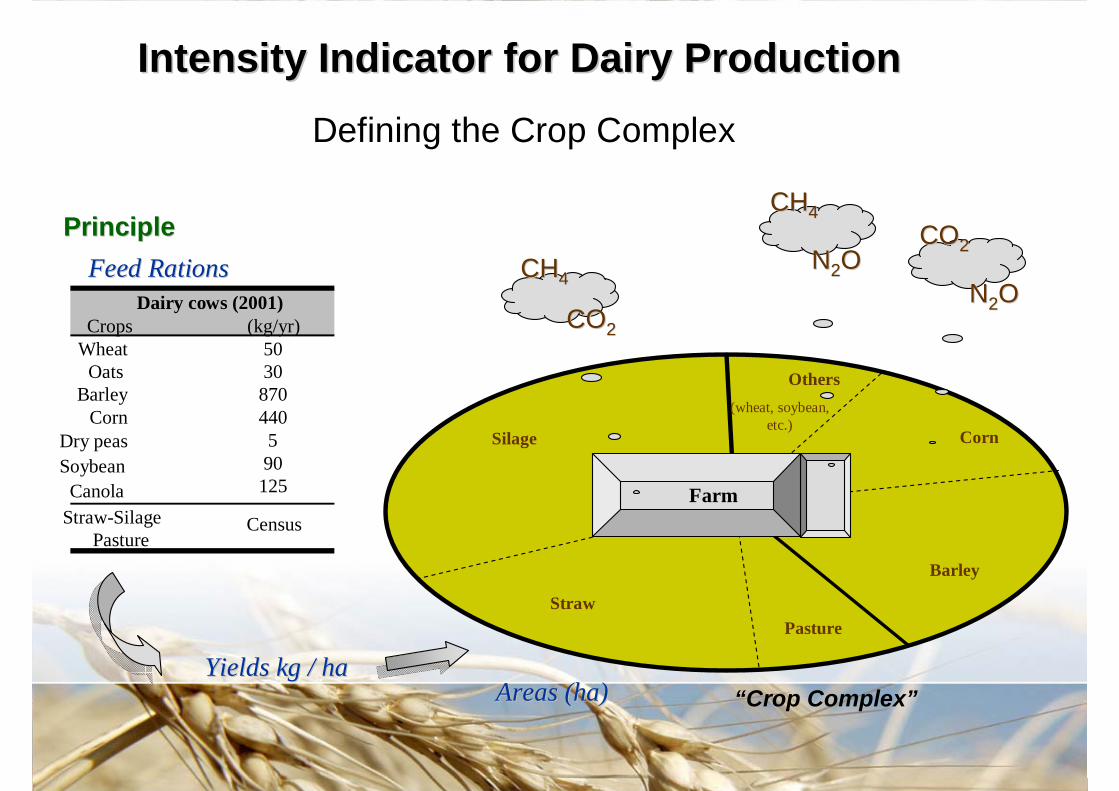
PrinciplePrinciple
Yields kg / haYields kg / ha
Silage
Straw
Barley
Pasture
Corn
Others(wheat, soybean,
etc.)
Farm
NN22OO
CHCH44COCO22
NN22OOCHCH44
COCO22
“Crop Complex”
Feed Rations Feed Rations
Crops (kg/yr)Wheat 50
Oats 30Barley 870
Corn 440Dry peas 5Soybean 90
Canola 125Straw-Silage Census
Pasture
Dairy cows (2001)
Defining the Crop Complex
Intensity Intensity Indicator for Dairy ProductionIndicator for Dairy Production
Areas (ha)Areas (ha)
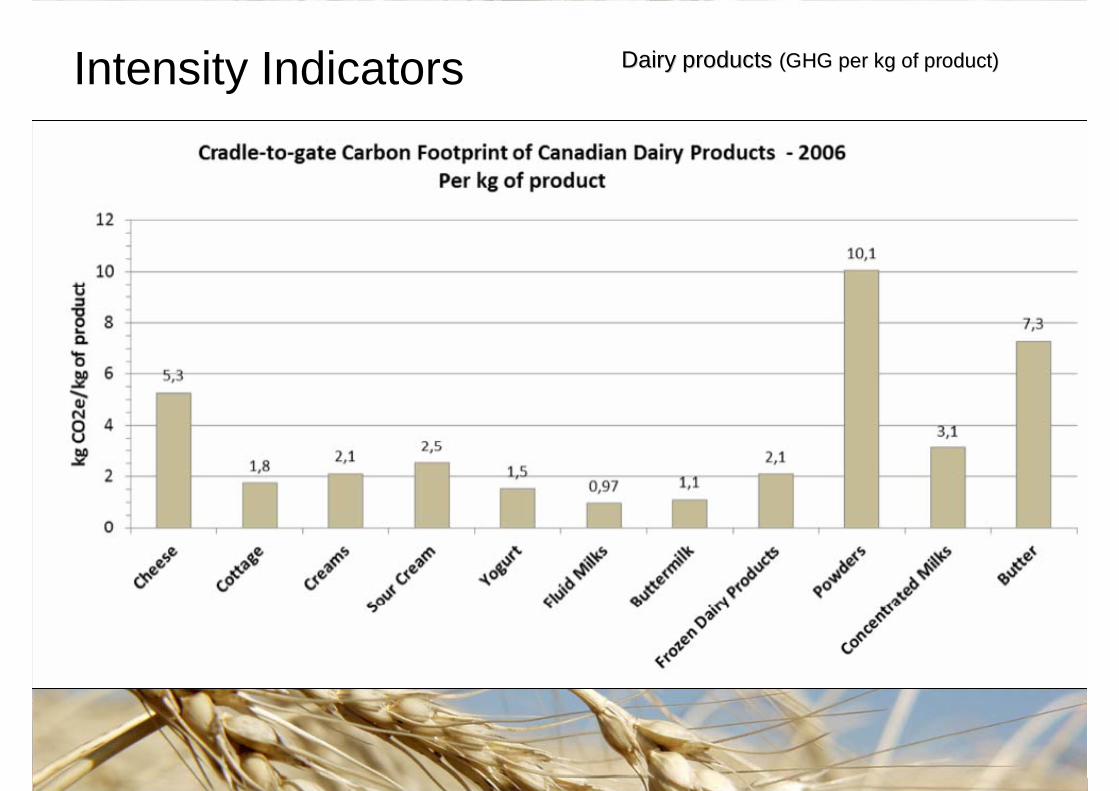
Results Dairy products Dairy products (GHG per (GHG per kg of product)kg of product)Intensity Indicators
GHG Emission Intensities of Milk
Source: FAO 2010
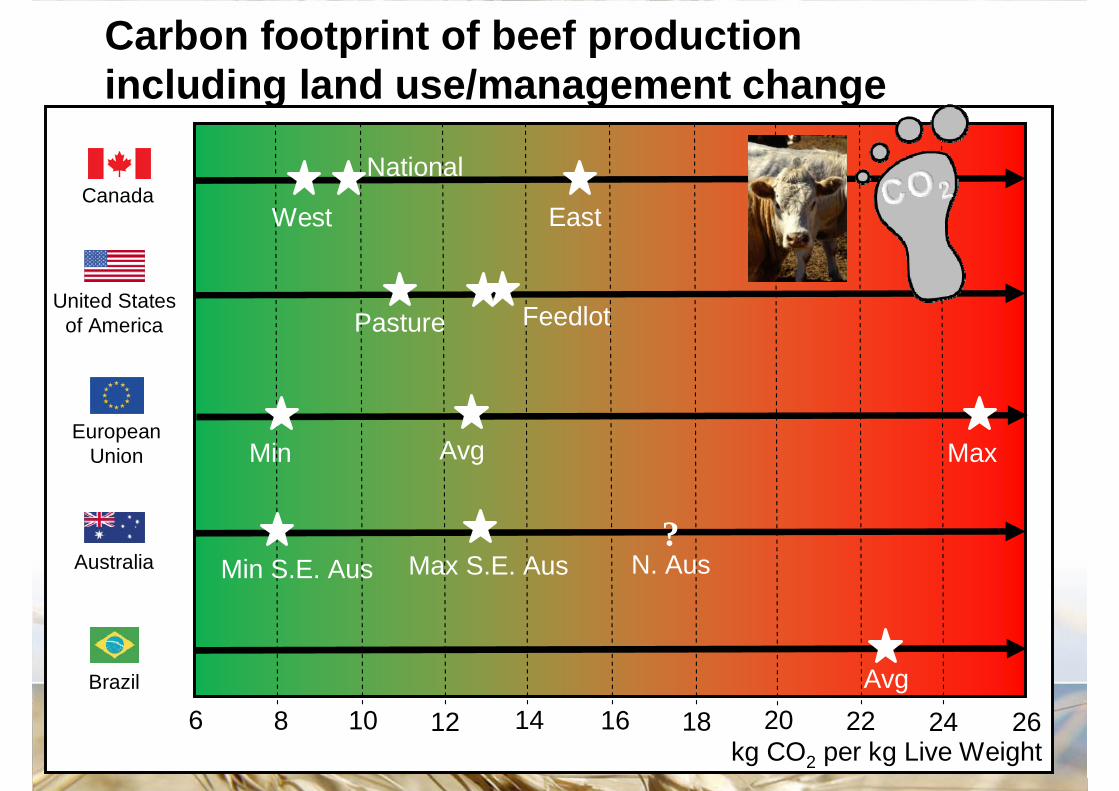
6 8 222010 12 14 16 18
Australia
Canada
United States of America
Brazil
European Union
24 26
EastWest
National
Min MaxAvg
Pasture Feedlot
Min S.E. Aus Max S.E. Aus?
N. Aus
Avg
kg CO2 per kg Live Weight
Carbon footprint of beef production including land use/management change
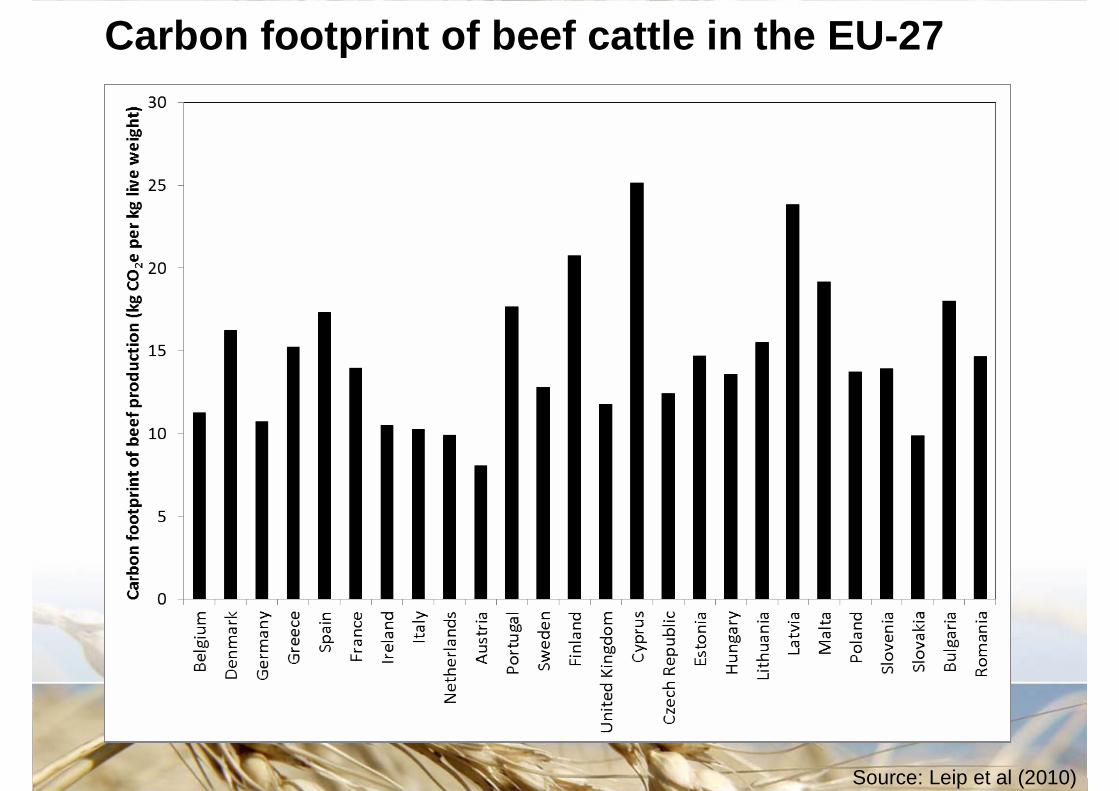
Carbon footprint of beef cattle in the EU-27
Source: Leip et al (2010)
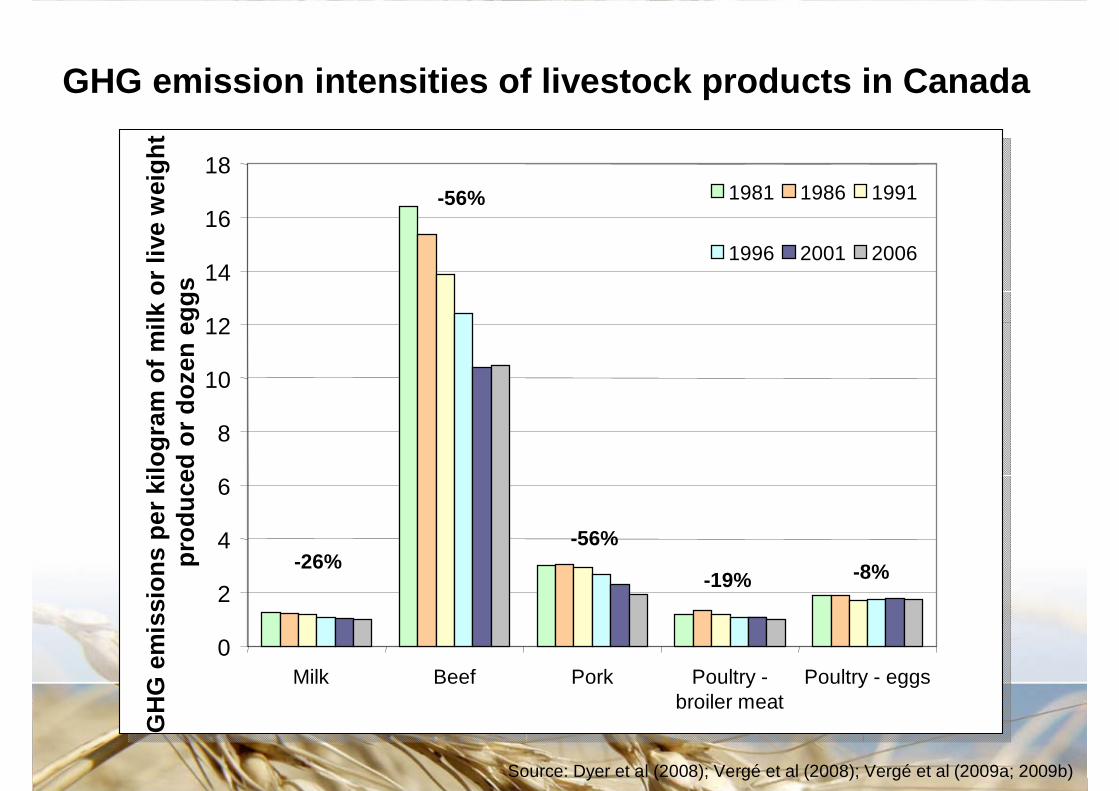
GHG emission intensities of livestock products in Canada
0
2
4
6
8
10
12
14
16
18G
HG
em
issi
ons
per k
ilogr
am o
f milk
or l
ive
wei
ght
prod
uced
or d
ozen
egg
s1981 1986 1991
1996 2001 2006
Source: Dyer et al (2008); Vergé et al (2008); Vergé et al (2009a; 2009b)
Milk
-26%
Beef
-56%
Pork
-56%
Poultry -broiler meat
-19%
Poultry - eggs
-8%
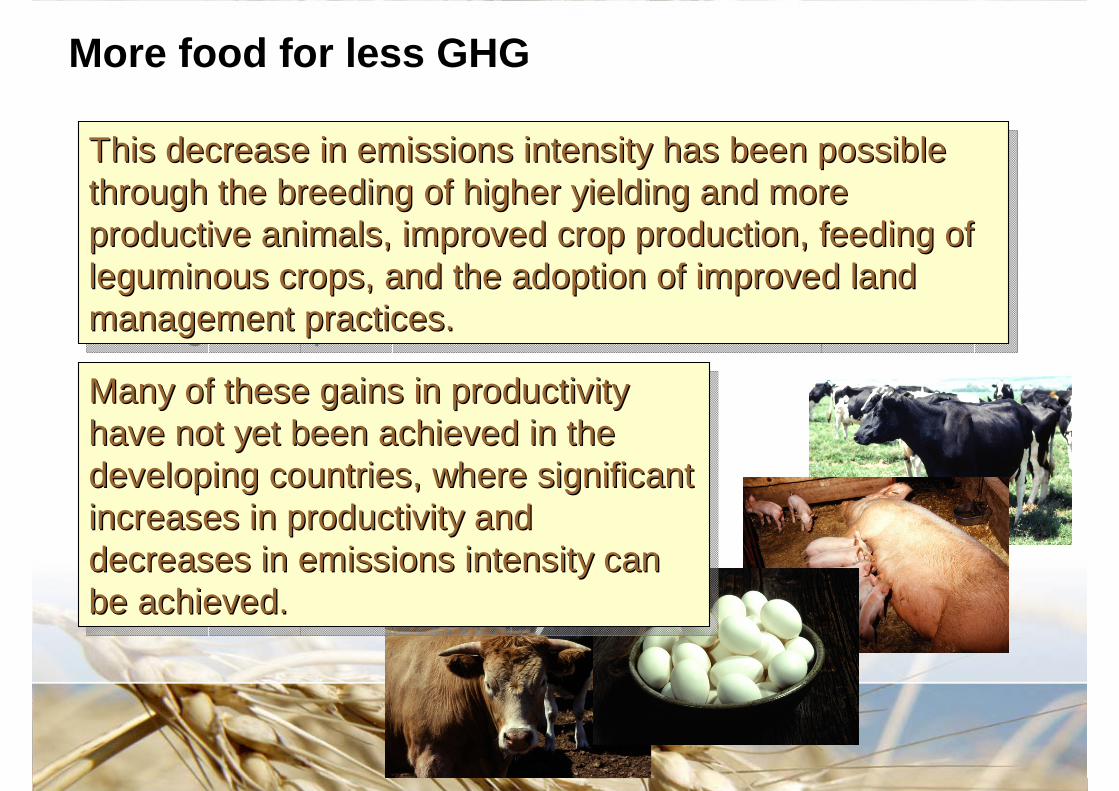
More food for less GHG
This decrease in emissions intensity has been possible through the breeding of higher yielding and more productive animals, improved crop production, feeding of leguminous crops, and the adoption of improved land management practices.
This decrease in emissions intensity has been possible This decrease in emissions intensity has been possible through the breeding of higher yielding and more through the breeding of higher yielding and more productive animals, improved crop production, feeding of productive animals, improved crop production, feeding of leguminous crops, and the adoption of improved land leguminous crops, and the adoption of improved land management practices.management practices.
Many of these gains in productivity have not yet been achieved in the developing countries, where significant increases in productivity and decreases in emissions intensity can be achieved.
Many of these gains in productivity Many of these gains in productivity have not yet been achieved in the have not yet been achieved in the developing countries, where significant developing countries, where significant increases in productivity and increases in productivity and decreases in emissions intensity can decreases in emissions intensity can be achieved.be achieved.
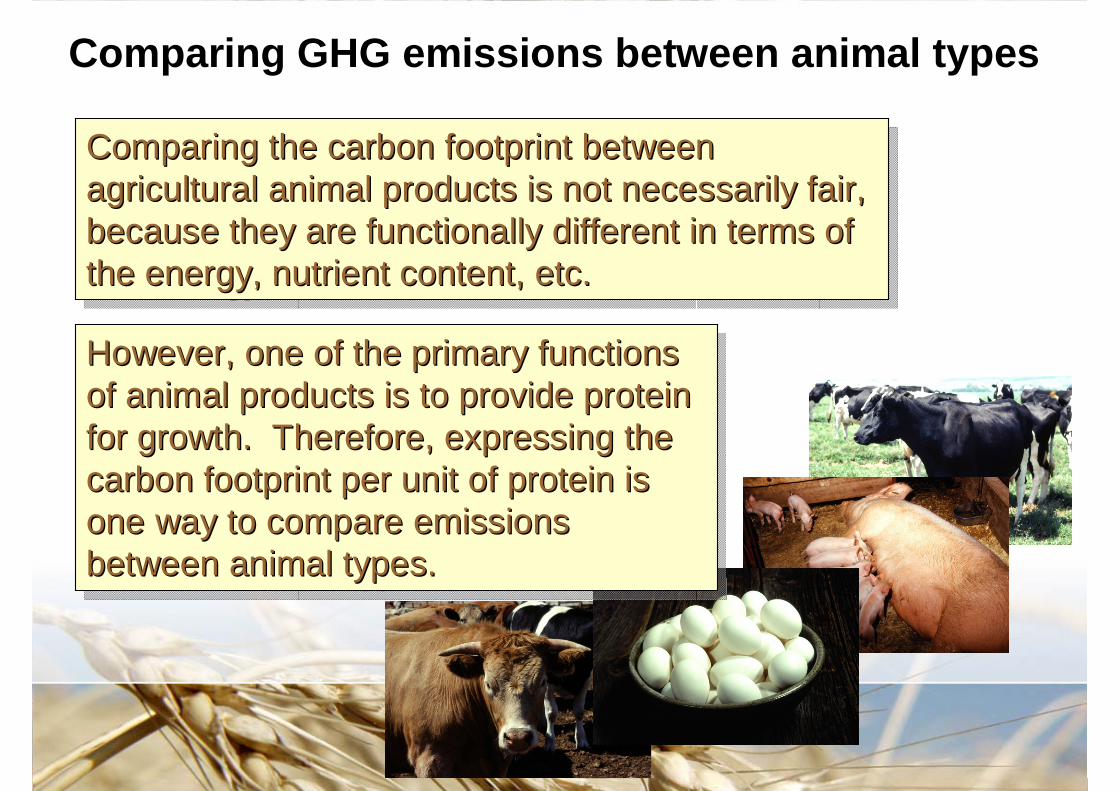
Comparing GHG emissions between animal types
Comparing the carbon footprint between agricultural animal products is not necessarily fair, because they are functionally different in terms of the energy, nutrient content, etc.
Comparing the carbon footprint between Comparing the carbon footprint between agricultural animal products is not necessarily fair, agricultural animal products is not necessarily fair, because because they they are functionally different in terms of are functionally different in terms of the energy, nutrient content, etc. the energy, nutrient content, etc.
However, one of the primary functions of animal products is to provide protein for growth. Therefore, expressing the carbon footprint per unit of protein is one way to compare emissions between animal types.
However, one of the primary functions However, one of the primary functions of animal products is to provide protein of animal products is to provide protein for growth. Therefore, expressing the for growth. Therefore, expressing the carbon footprint per unit of protein is carbon footprint per unit of protein is one way to compare emissions one way to compare emissions between animal types. between animal types.
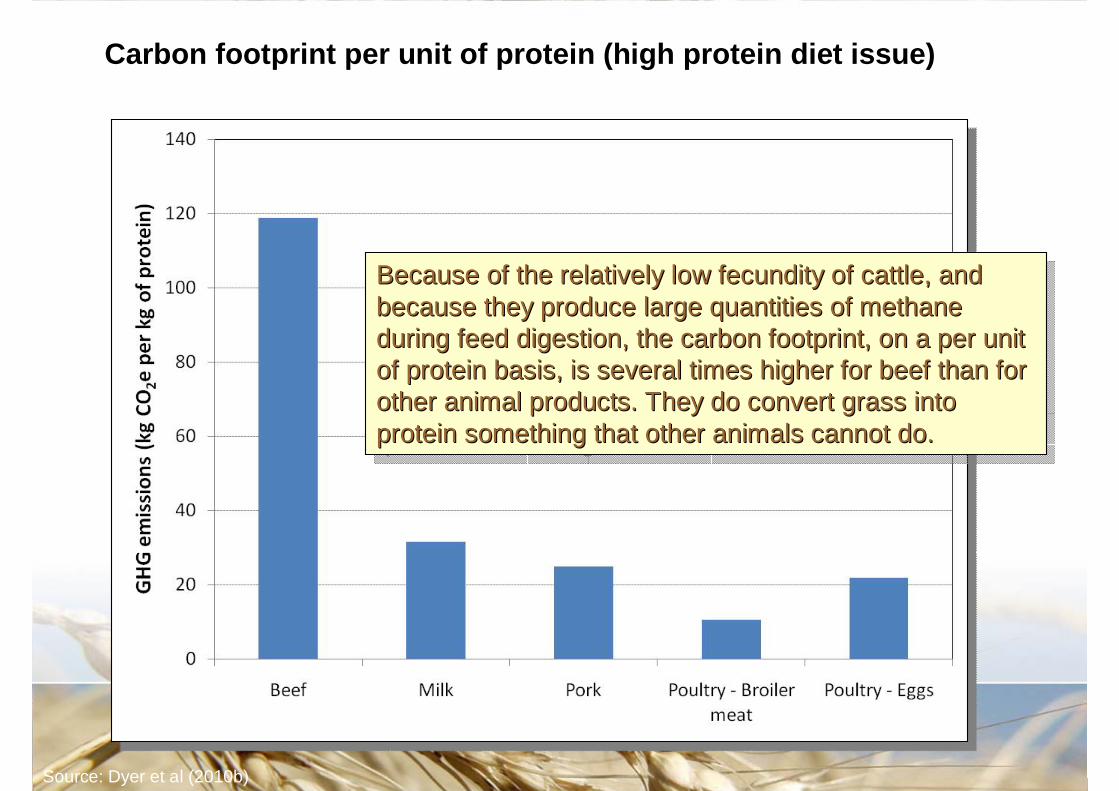
Carbon footprint per unit of protein (high protein diet issue)
Source: Dyer et al (2010b)
Because of the relatively low fecundity of cattle, and because they produce large quantities of methane during feed digestion, the carbon footprint, on a per unit of protein basis, is several times higher for beef than for other animal products. They do convert grass into protein something that other animals cannot do.
Because of the relatively low fecundity of cattle, and Because of the relatively low fecundity of cattle, and because they produce large quantities of methane because they produce large quantities of methane during feed digestion, the carbon footprint, on a per unit during feed digestion, the carbon footprint, on a per unit of protein basis, is several times higher for beef than for of protein basis, is several times higher for beef than for other animal products. other animal products. They do convert grass into They do convert grass into protein something that other animals cannot do.protein something that other animals cannot do.
30
Outline•What contribute to the carbon footprint of an agricultural product?
•Why is it important to know?
•How is it calculated?
•Some examples of carbon footprint values
•Allocation of environmental burdens
•A tool for decision making
•Summary
•What contribute to the carbon footprint of an agricultural product?
•Why is it important to know?
•How is it calculated?
•Some examples of carbon footprint values
•Allocation of environmental burdens
•A tool for decision making
•Summary
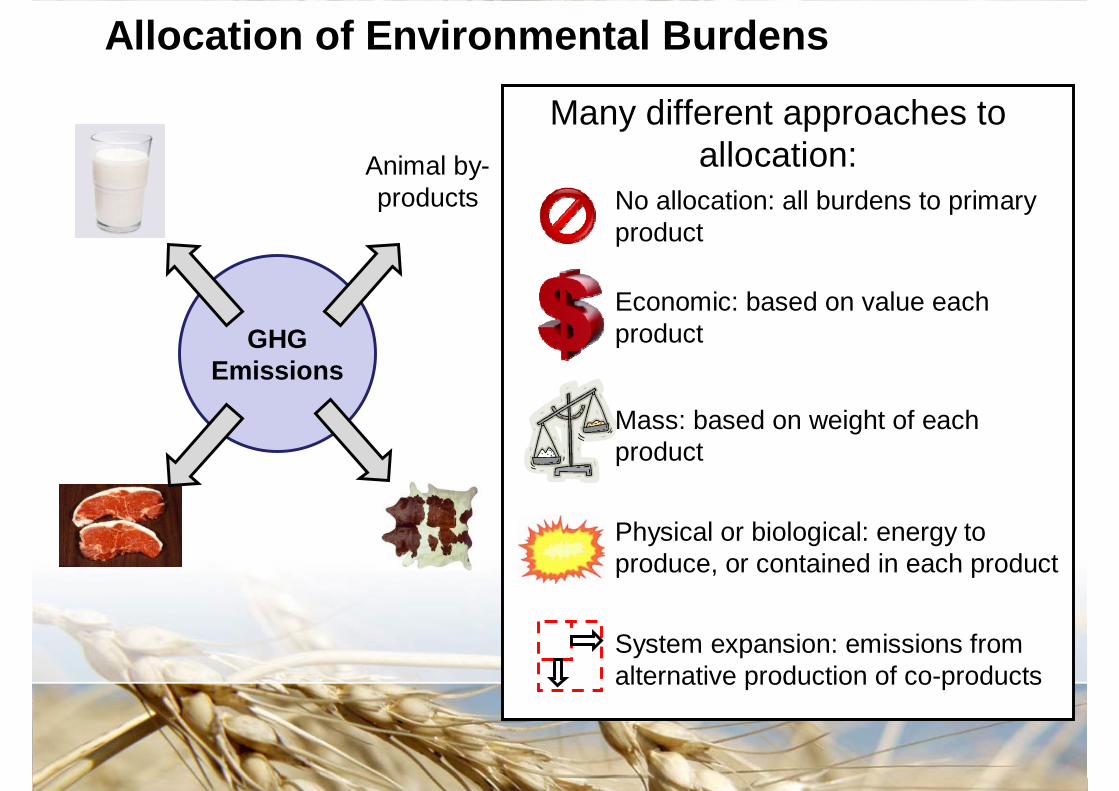
Allocation of Environmental Burdens
GHG Emissions
Many different approaches to allocation:
Economic: based on value each product
Mass: based on weight of each product
Physical or biological: energy to produce, or contained in each product
No allocation: all burdens to primary product
System expansion: emissions from alternative production of co-products
Animal by-products
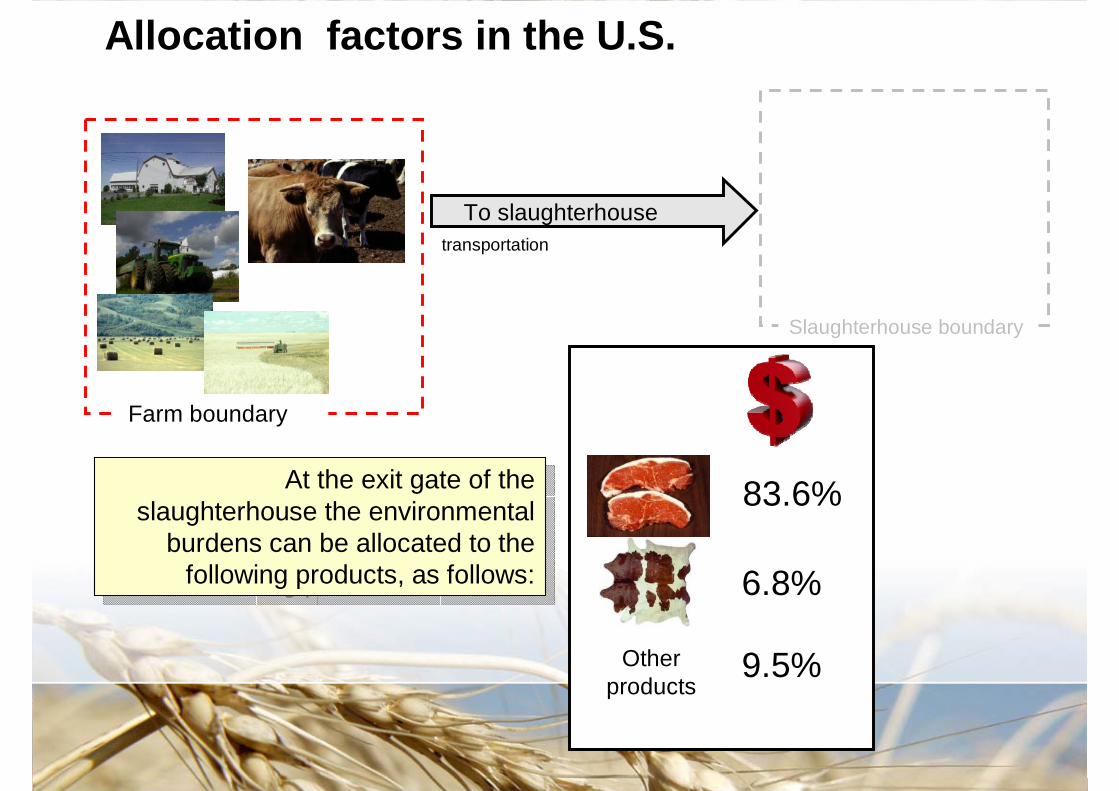
Allocation factors in the U.S.
Farm boundary
To slaughterhouse
At the exit gate of the slaughterhouse the environmental
burdens can be allocated to the following products, as follows:
At the exit gate of the slaughterhouse the environmental
burdens can be allocated to the following products, as follows:
83.6%
6.8%
9.5%Other products
transportation
Slaughterhouse boundary
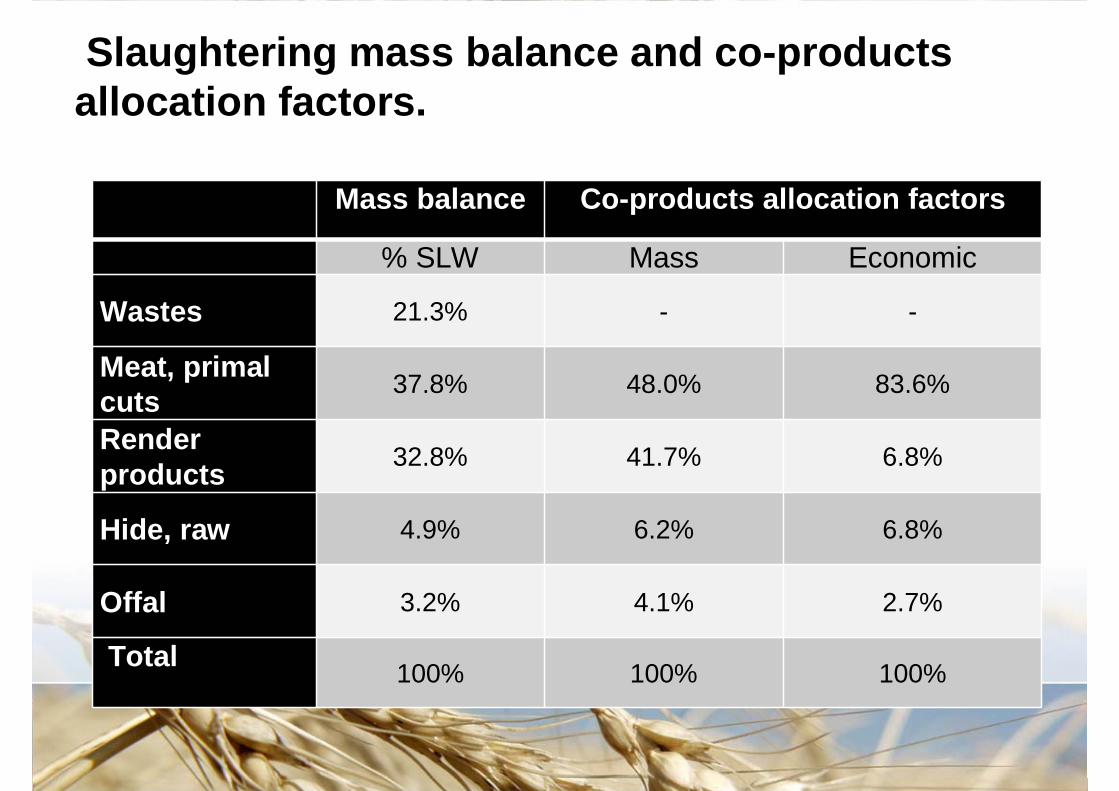
Mass balance Co-products allocation factors
% SLW Mass Economic
Wastes 21.3% - -
Meat, primal cuts 37.8% 48.0% 83.6%
Render products 32.8% 41.7% 6.8%
Hide, raw 4.9% 6.2% 6.8%
Offal 3.2% 4.1% 2.7%
Total 100% 100% 100%
Slaughtering mass balance and co-products allocation factors.
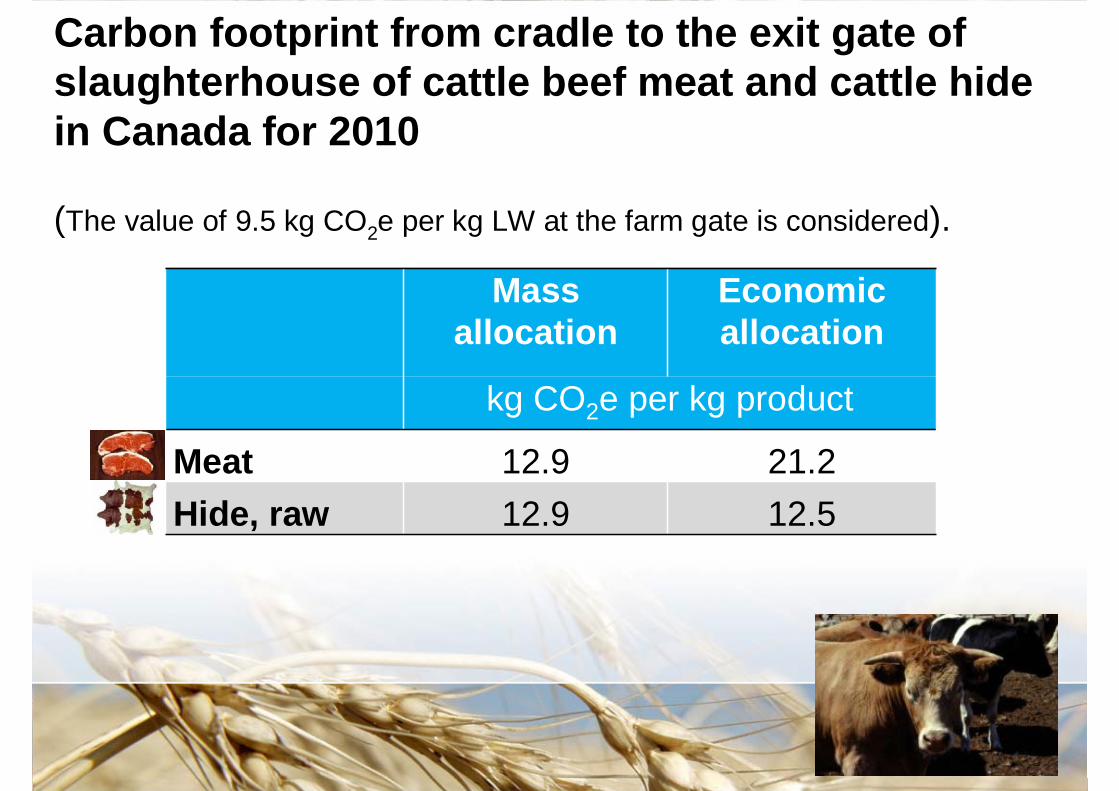
Mass allocation
Economic allocation
kg CO2e per kg product
Meat 12.9 21.2Hide, raw 12.9 12.5
Carbon footprint from cradle to the exit gate of slaughterhouse of cattle beef meat and cattle hide in Canada for 2010
(The value of 9.5 kg CO2e per kg LW at the farm gate is considered).
35
Outline•What contribute to the carbon footprint of an agricultural product?
•Why is it important to know?
•How is it calculated?
•Some examples of carbon footprint values
•Allocation of environmental burdens
•A tool for decision making
•Summary
•What contribute to the carbon footprint of an agricultural product?
•Why is it important to know?
•How is it calculated?
•Some examples of carbon footprint values
•Allocation of environmental burdens
•A tool for decision making
•Summary
36
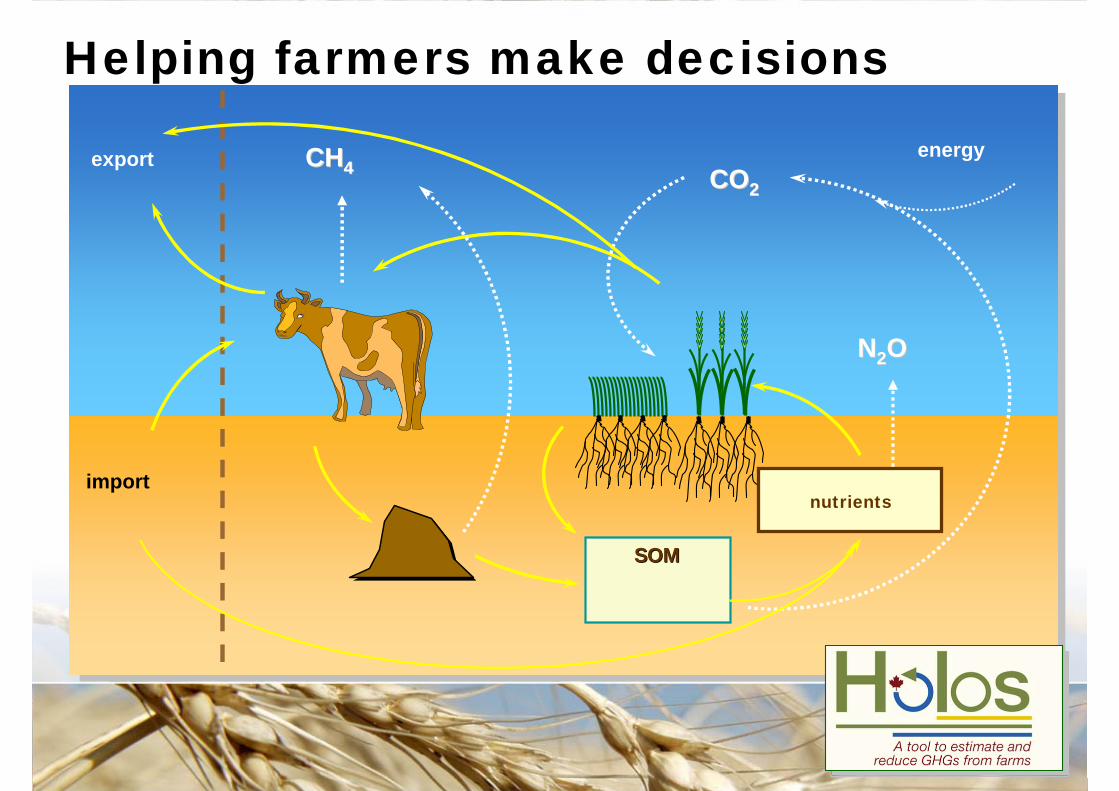
Helping farmers make decisions
SOMSOM
nutrients
NN22OO
CHCH44 COCO22export
import
energy
37
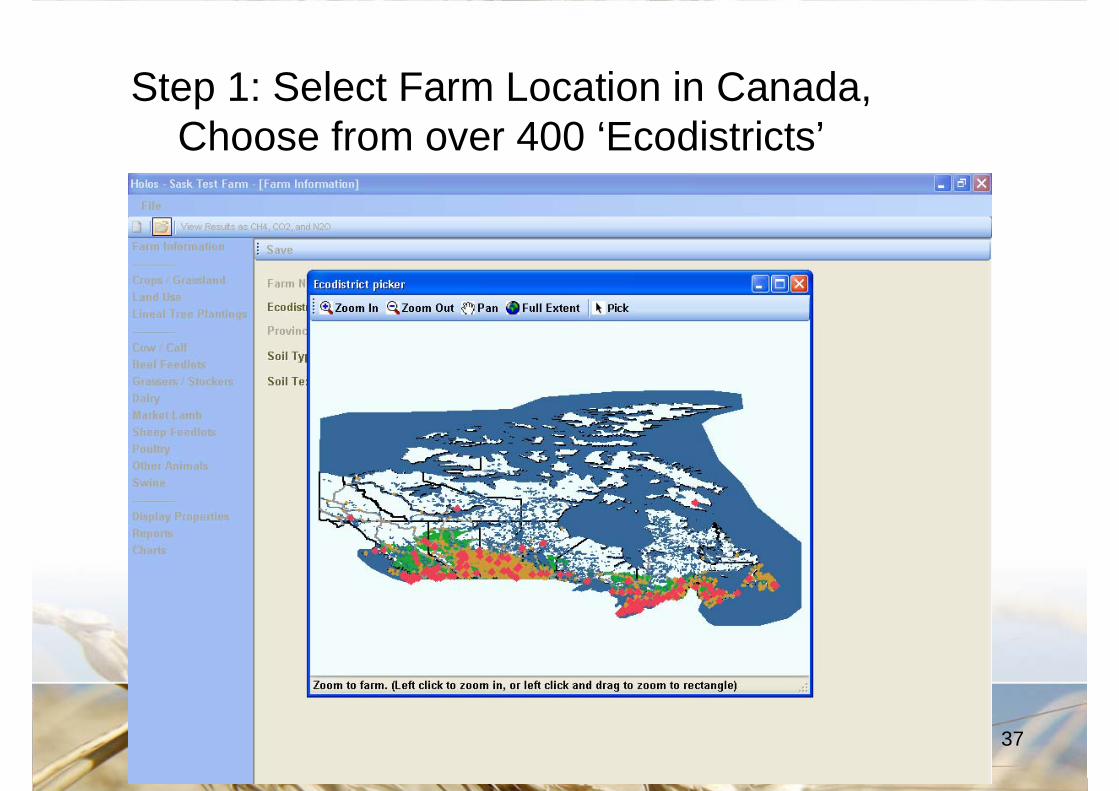
Step 1: Select Farm Location in Canada, Choose from over 400 ‘Ecodistricts’
38
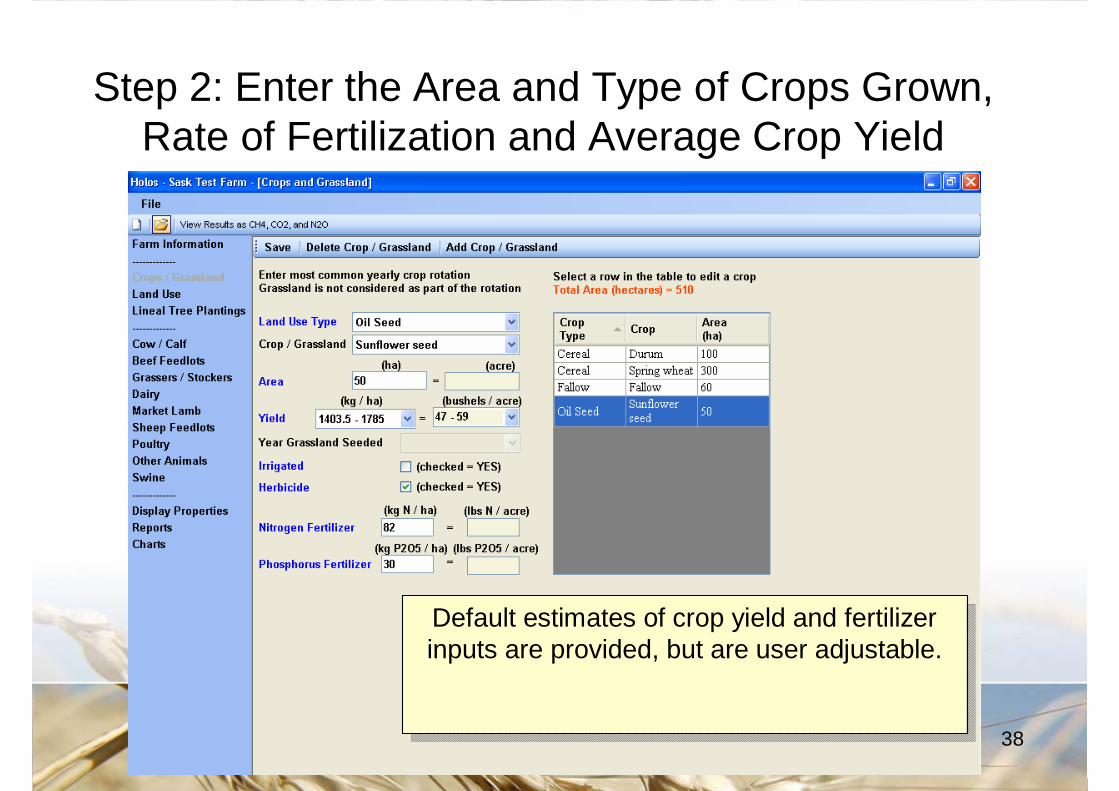
Step 2: Enter the Area and Type of Crops Grown, Rate of Fertilization and Average Crop Yield
Default estimates of crop yield and fertilizer inputs are provided, but are user adjustable.Default estimates of crop yield and fertilizer inputs are provided, but are user adjustable.
39
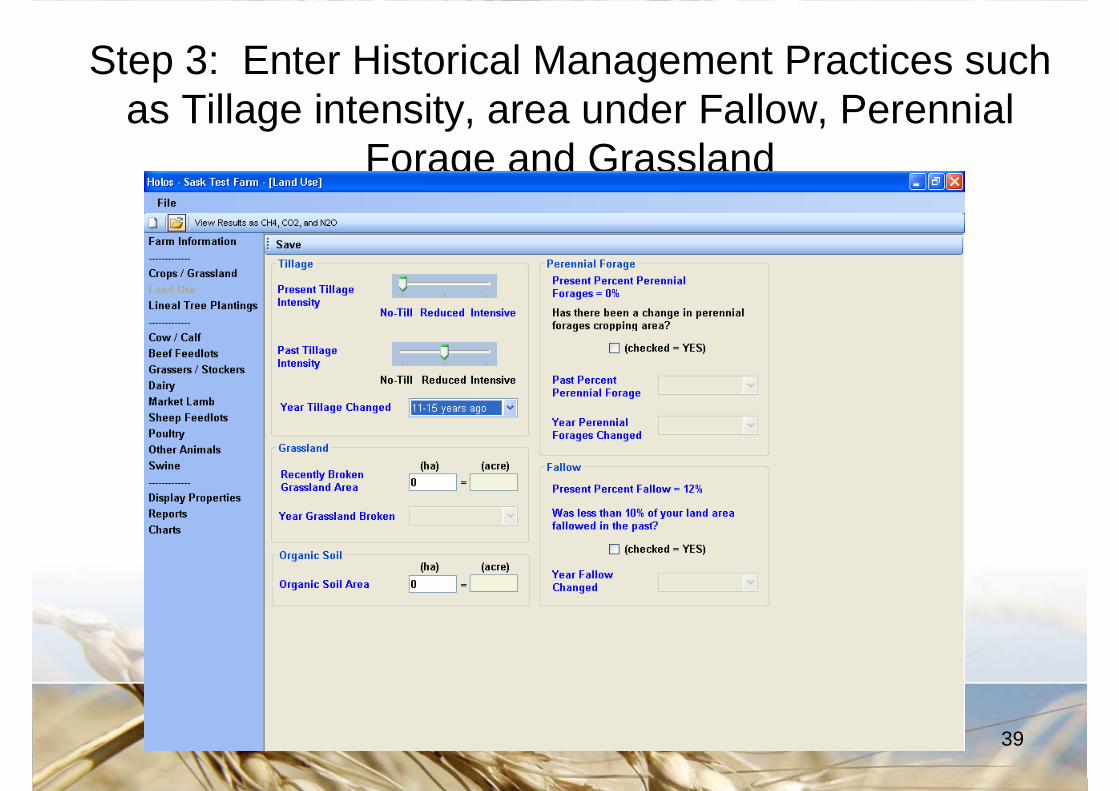
Step 3: Enter Historical Management Practices such as Tillage intensity, area under Fallow, Perennial
Forage and Grassland
40
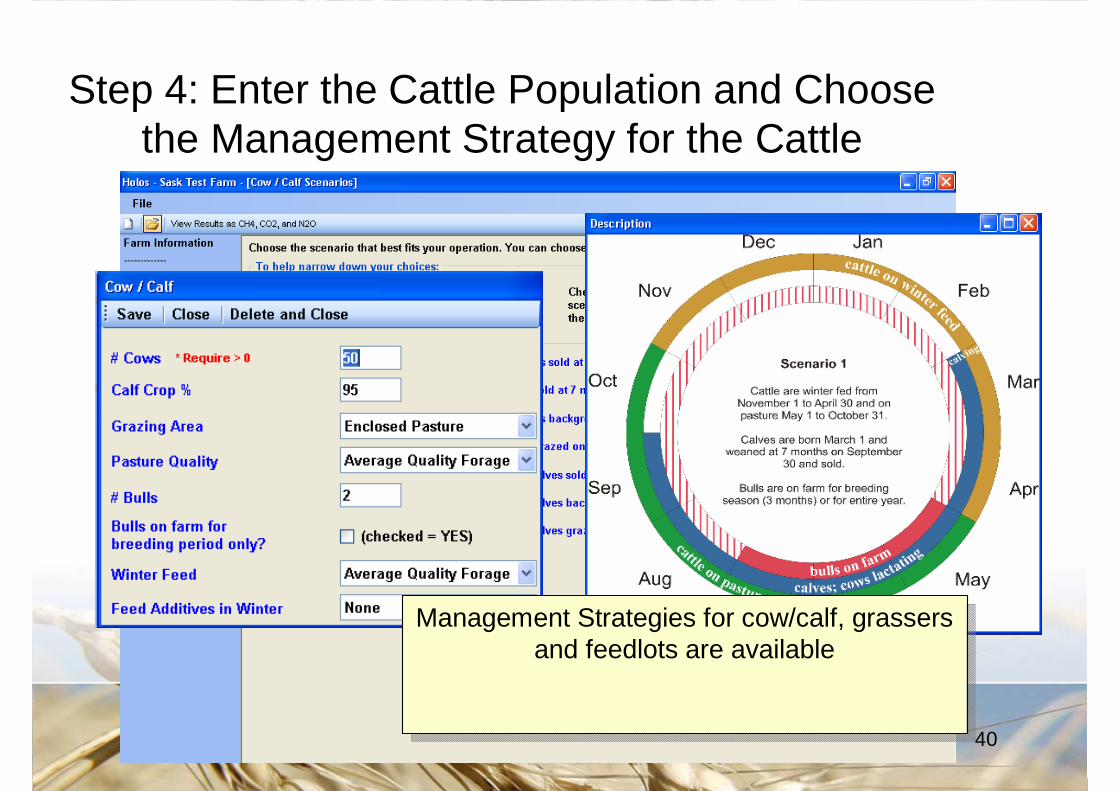
Step 4: Enter the Cattle Population and Choose the Management Strategy for the Cattle
Management Strategies for cow/calf, grassers and feedlots are available
Management Strategies for cow/calf, grassers and feedlots are available
41
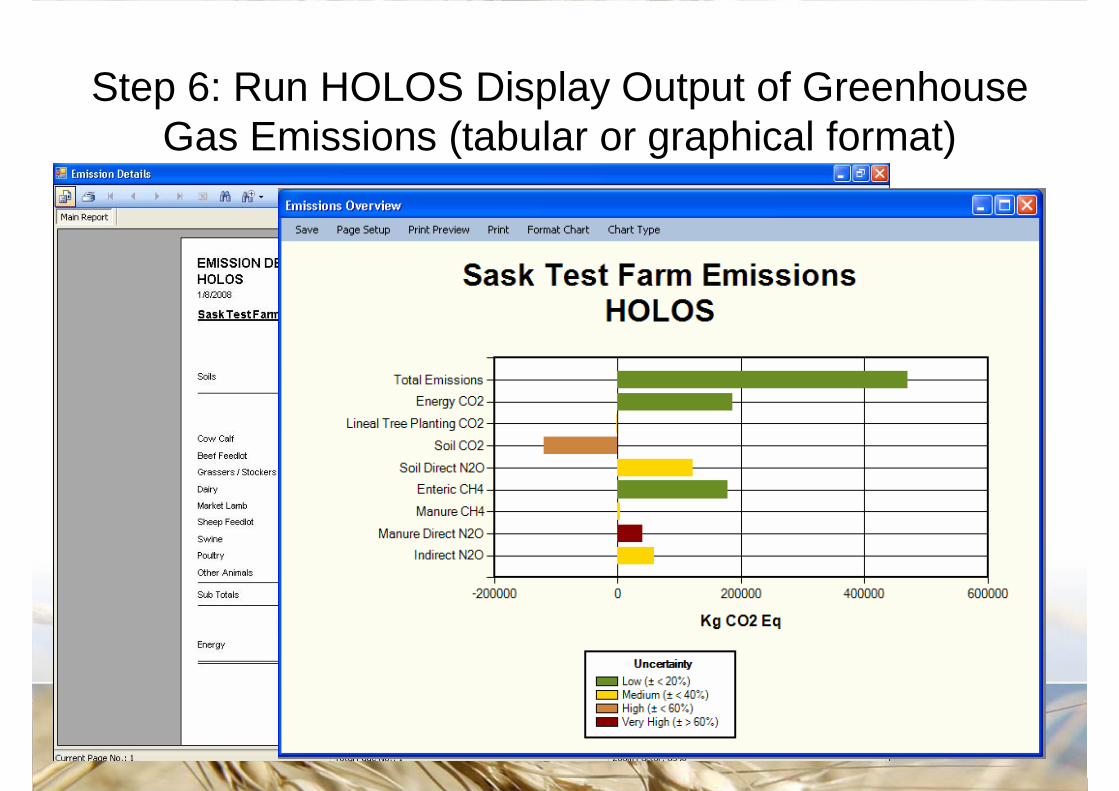
Step 6: Run HOLOS Display Output of Greenhouse Gas Emissions (tabular or graphical format)
42
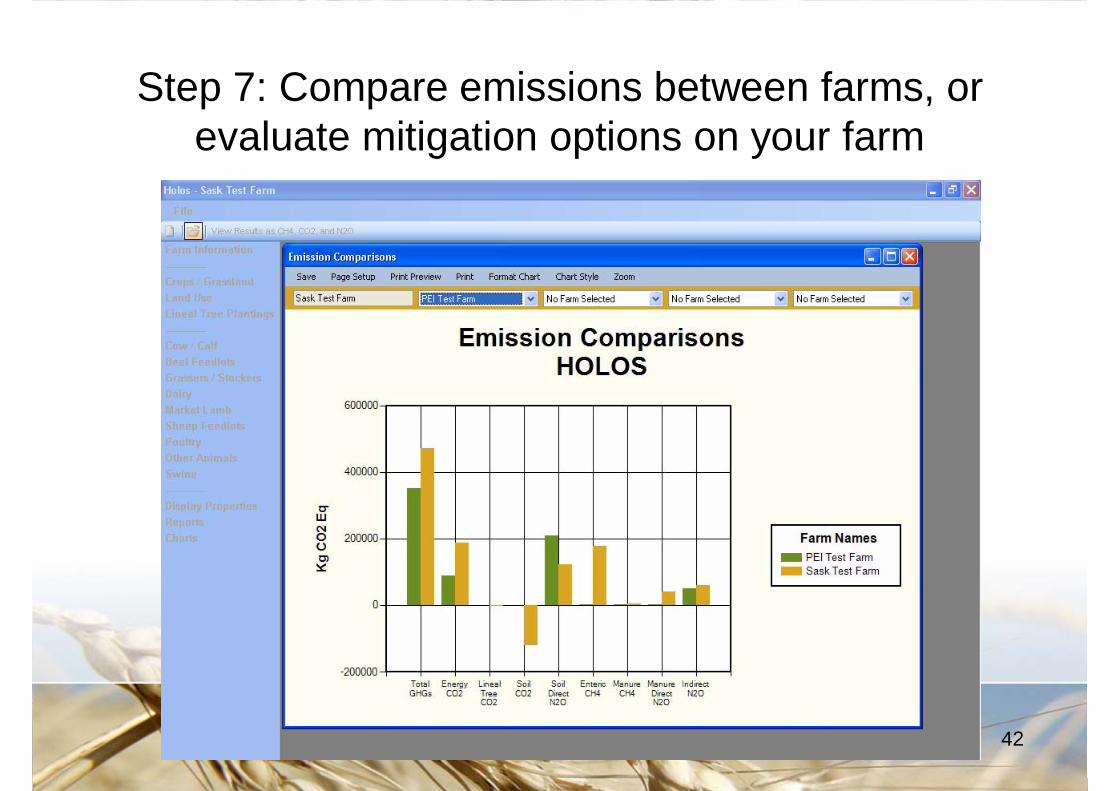
Step 7: Compare emissions between farms, or evaluate mitigation options on your farm
43
Before mitigationBefore mitigation
After mitigationAfter mitigation
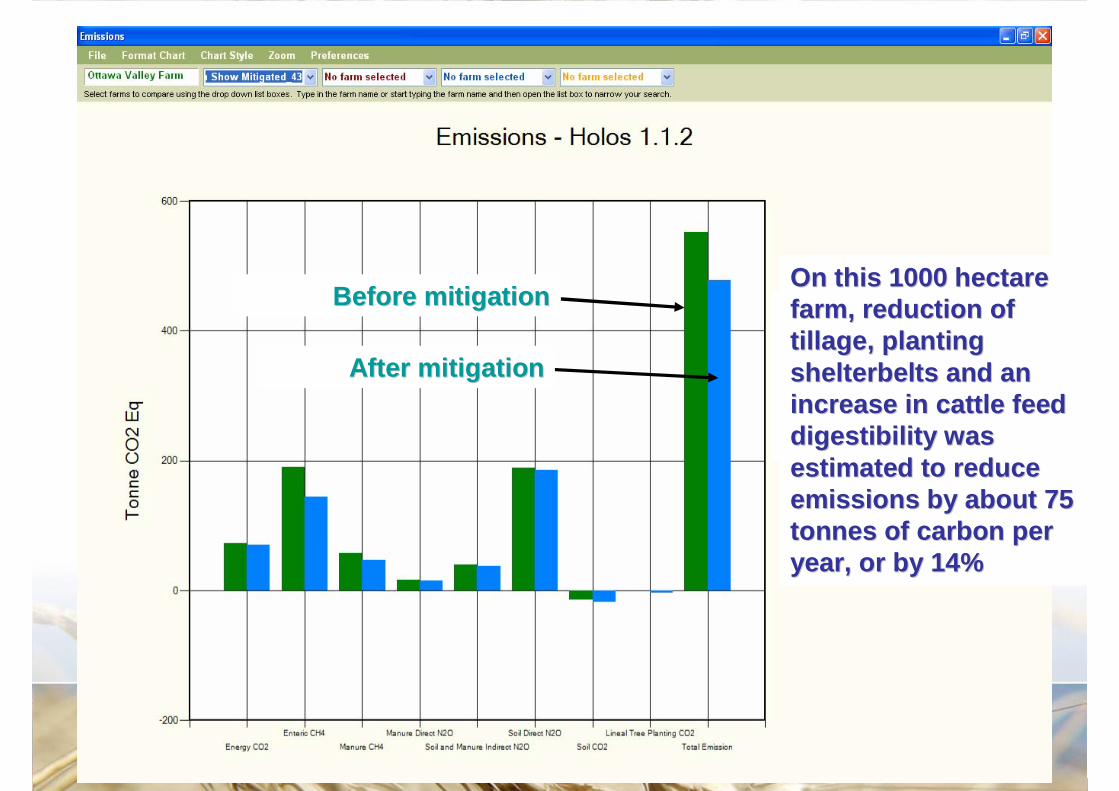
Holos Holos provides an provides an estimate of emissions estimate of emissions before and after before and after implementing the implementing the mitigation measuresmitigation measures
On this 1000 hectare On this 1000 hectare farm, reduction of farm, reduction of tillage, planting tillage, planting shelterbelts and an shelterbelts and an increase in cattle feed increase in cattle feed digestibility digestibility was was estimated to reduce estimated to reduce emissions emissions by about 75 by about 75 tonnes tonnes of carbon per of carbon per year, or by year, or by 14%14%

Summary•We presented tools that we are using to calculate the carbon footprint of agricultural products up to the farm gate and up to the processing gate in Canada. These tools are extremely useful to help sell agricultural products on the international scene.
•Carbon footprint values are very dependent on what is included (boundary conditions, soil carbon change, type of allocation)
•GHG emissions from agricultural sector will continue to increase because of the increasing demand for food however, we have shown great reduction in the emission intensity of agricultural products because of better management practices, better varieties, better breeds, increased yields, Great reductions are possible for developing countries
•We have also shown substantial regional differences in the C footprint of agricultural products due to management practices, climate and soil conditions
•We have shown that a chance in the consumer choice of food could contribute significantly to reducing GHG emissions from the agriculture sector
•We also shown that a tool like HOLOS can help farmers make decisions which will reduce the GHG emissions on their farm and by doing this they will reduce the carbon footprint of their agricultural products
•We presented tools that we are using to calculate the carbon footprint of agricultural products up to the farm gate and up to the processing gate in Canada. These tools are extremely useful to help sell agricultural products on the international scene.
•Carbon footprint values are very dependent on what is included (boundary conditions, soil carbon change, type of allocation)
•GHG emissions from agricultural sector will continue to increase because of the increasing demand for food however, we have shown great reduction in the emission intensity of agricultural products because of better management practices, better varieties, better breeds, increased yields, Great reductions are possible for developing countries
•We have also shown substantial regional differences in the C footprint of agricultural products due to management practices, climate and soil conditions
•We have shown that a chance in the consumer choice of food could contribute significantly to reducing GHG emissions from the agriculture sector
•We also shown that a tool like HOLOS can help farmers make decisions which will reduce the GHG emissions on their farm and by doing this they will reduce the carbon footprint of their agricultural products

Thank [email protected]