Embed Size (px)
Citation preview
S
Cw
ACa
b
3c
a
ARRA
KHwCSP
1
wlmr
potrmip
Adf
c
0h
Ecological Engineering 64 (2014) 57– 61
Contents lists available at ScienceDirect
Ecological Engineering
journa l h om epage: www.elsev ier .com/ locate /eco leng
hort communication
arbon dioxide emissions from horizontal sub-surface constructedetlands in the Mediterranean Basin
ntonio C. Barberaa, Maurizio Borinb, Antonio Ioppoloa, Giuseppe L. Cirelli c,armelo Maucieri a,b,∗
Department of Agriculture and Food Science – DISPA, University of Catania, Via Valdisavoia 5, 95123 Catania, ItalyDepartment of Agronomy, Food, Natural Resources, Animals and Environment – DAFNAE, University of Padua, Agripolis Campus, Viale dell’Università 16,5020 Legnaro, PD, ItalyDepartment of Agri-food and Environmental Systems Management – DiGeSA, University of Catania, Via S. Sofia 100, 95123 Catania, Italy
r t i c l e i n f o
rticle history:eceived 6 August 2013eceived in revised form 7 November 2013ccepted 20 December 2013
eywords:
a b s t r a c t
Constructed wetlands (CWs) are widely used natural-like systems for wastewater treatment whereorganic matter is removed through carbon dioxide (CO2) emissions. Several studies have been conductedregarding emissions and the sequestration of CO2 in CWs in the Northern Hemisphere; however, to thebest of our knowledge, no studies have been performed in the Mediterranean Basin. This work quantifieddaily and cumulative CO2 emissions from a full-scale CW horizontal subsurface flow (HSSF) bed during
orizontal subsurface flow constructedetlandarbon dioxide balancetatic stationary chamber techniquehragmites australis (Cav.) Trin. ex Steud
semiarid Mediterranean spring climate conditions. The average daily CO2-C that was released in the atmo-sphere during the first 50 days ranged from approximately 17.5% to 32.6% of the C that was removed fromwastewater. Considering both the Phragmites australis aerial part dry matter production (0.83 kg m−2) andthe average CO2-C emissions, after 50 days of vegetative regrowth, the HSSF bed was demonstrated toact as a CO2 sink. The cumulative CO2 efflux was 452.15 ± 50.40 CO2 g m−2 and 276.02 ± 12.07 CO2 g m−2
for vegetated and unvegetated sites, respectively.
tHM2weoaCt
e
. Introduction
Constructed wetlands (CWs) are widely used to treat differentastewaters (Vymazal, 2009), where mineral and organic pol-
utants are removed through various physical and biochemicalechanisms. In such natural-like systems, organic matter is further
emoved through carbon dioxide (CO2) evolution.Considering that the ratio of CO2-C that is emitted by bed res-
iration to carbon (C) that is removed from wastewater alone isften >100% during the growing season, this ratio suggests thathe C that is lost to the atmosphere as CO2 exceeds the C that isemoved from wastewater (VanderZaag et al., 2010). This result isost likely due to plant root exudates that increase the C input
nto the bed system by supporting various heterotrophic microbialrocesses (Picek et al., 2007).
∗ Corresponding author at: Department of Agronomy, Food, Natural Resources,nimals and Environment - DAFNAE, University of Padua, Agripolis Campus, Vialeell’Università 16,35020 Legnaro, PD, Italy. Tel.: +39 0498272838;ax: +39 0498272839.
E-mail addresses: [email protected],[email protected] (C. Maucieri).
Mv
2
2
iwT
925-8574/$ – see front matter © 2014 Elsevier B.V. All rights reserved.ttp://dx.doi.org/10.1016/j.ecoleng.2013.12.032
© 2014 Elsevier B.V. All rights reserved.
Several studies have considered CO2 emissions and sequestra-ion, as well as CH4 emissions, in natural wetlands (Brix et al., 2001;einsch et al., 2004; Mitsch et al., 2013) and CWs (Picek et al., 2007;ander et al., 2008) in relation to meteorological (Liikanen et al.,
006) and hydrological conditions (Altor and Mitsch, 2008) becauseetlands can be a C source or sink (Heikkinen et al., 2002; Ström
t al., 2007), depending on their age (Zemanová et al., 2010) andperation, as well as environmental conditions, such as locationnd climate (Scholz, 2011). These studies have been performed inWs in continental areas of the Northern Hemisphere, but not inhe Mediterranean Basin.
The aim of this work was to quantify daily and cumulative CO2mission from a horizontal subsurface flow (HSSF) CW in semiaridediterranean spring climate conditions (Sicily, Italy), comparing
egetated and unvegetated areas.
. Materials and methods
.1. Study site
This research was conducted in a full-scale CW treatment plantn San Michele di Ganzaria (Eastern Sicily, 37◦16′ N, 14◦25′ E),
hich is a rural community of approximately 5000 inhabitants.his area is characterized by a Mediterranean semi-arid climate,
58 A.C. Barbera et al. / Ecological En
wpsia(owtavbdewsts
2
tartd
2
amNPtuevo
2
rCw(Hu0mtd
pewpCccwwbf(wpstoatisttSwtgwtarttCwDsbocCwt1
2
wp1arfat
2
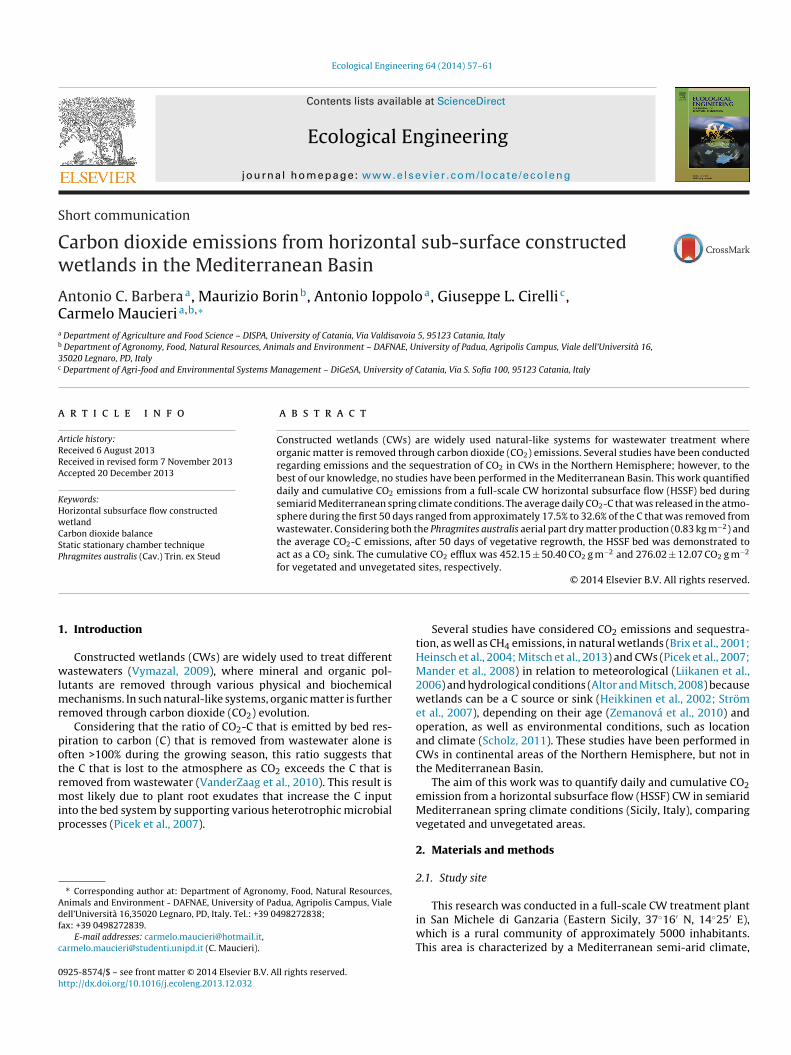
Fig. 1. HSSF bed sampling points.
ith a mean annual rainfall of 600 mm and with a mean daily tem-erature of 18 ◦C (average data 2008–2011). The CW treatmentystem consists of an HSSF bed with a surface area of approx-mately 2080 m2 (33 m × 63 m) and with a design flow rate ofpproximately 455 m3 d−1, which has been in operation since 2006Barbagallo et al., 2011). The CW is used for the tertiary treatmentf the urban effluent (approximately 4 L s−1) from a conventionalastewater treatment plant (trickling filter). The end section of
he HSSF bed functions as a free water surface, with an area ofpproximately 100 m2. The filter bed, which is filled with 8–10 mmolcanic gravel (0.40 porosity), is 0.6 m deep on average and haseen planted with Phragmites australis (Cav.) Trin. ex Steud at aensity of four rhizomes m2. Vegetation cutting were scheduledvery two years; the last vegetation harvesting was performed ininter 2010 by cutting the stems at a height of 10 cm above the sub-
trate surface. The water table in the bed was constant throughouthe study, at approximately 18 cm from the surface, and the bedlope is approximately 1%.
.2. Environmental variables
The following climatic data were recorded by a weather stationhat was close to the experimental site: rain (mm), air temper-ture (◦C), wind speed (m s−1), relative humidity (%), and solaradiation (MJ m−2 d−1). Evapotranspiration was calculated withhe Penman–Monteith model, which used Kc that was previouslyetermined for the experimental site (Milani and Toscano, 2013).
.3. Water sampling and analysis
The following water physicochemical parameters were evalu-ted at the inlet and outlet of the HSSF according to APHA (1998)ethods: total suspended solids (TSS) at 105 ◦C, COD, NH4
+-H,O2
−-N, NO3−-N, total nitrogen (TN) and orthophosphates (PO4
3−-). The evaluation of treatment performance, which was based onhe mass pollutant removal efficiency percentage, was calculatedsing average inflow and outflow pollutant concentrations, consid-ring the sum of wastewater inlet and precipitation as the inletolume and the inlet volume minus the evapotranspiration as theutflow volume.
.4. CO2 emission
The monitoring was performed from April 10th (vegetativeegrowth) to July 18th 2012 for 100 days. In the first 50 days, dailyO2 emissions were measured in 3 areas of the HSSF bed, whichas vegetated with P. australis (6.5 m (P1), 31.5 m (P2) and 56.5 m
P3) from wastewater inflow), and in one unvegetated area of theSSF bed (6.5 m from inflow (P4)) (Fig. 1) with different water col-mn lengths throughout the study site (0.55 m in sites P1 and P4,
.75 m in site P2 and 0.95 m in site P3). In the following 50 days,easurements were only taken in P2 and P4 to calculate cumula-ive CO2 emissions. The CO2 bed respiration included gas emissionsue to microbial metabolism and root respiration; aboveground
8utd
gineering 64 (2014) 57– 61
lant photosynthetic tissue respiration, in agreement with Mandert al. (2008), was not considered because the proportion of C thatas respired by the shoot was first assimilated by plant grosshotosynthesis, with an annual difference that was equal to zero.O2 emissions were estimated in situ using the static-stationaryhamber technique. The cylindrical dark chambers, which wereomposed of PVC with an effective volume of approximately 3 L,ere 35 cm in height and 16 cm wide. The bottom part (20 cm)as permanently inserted in the gravel substrate and the cham-
er was sealed with a lid. In the chamber, CO2 that was emittedrom the bed was continuously trapped in a sodium hydroxideNaOH) solution trap (Knoepp and Vose, 2002). NaOH base trapsere chosen because these traps have been successfully used in arevious field study (Welker et al., 2004), where long-term remoteampling of CO2 efflux was required. However, the CO2 rates fromhis technique are typically conservative because of the reliancen diffusion. To reduce the experimental error of this technique tocceptable levels, we have made the following enhancements: (1)he trap solution was replaced every five days to avoid any dailynfluence on the CO2 flux estimate and to reduce the CO2 atmo-pheric influence when the static chamber was open to replacehe trap; (2) with this frequency, the NaOH solution was main-ained under 70% of its CO2 absorption capacity, in agreement withharkov (1984), who reported no change in the absorption ratehen the alkali was used until 70%; (3) to accelerate CO2 absorp-
ion, a high jar/chamber surface ratio (37.5%) was used that wasreater than values that were reported by Jensen et al. (1996),hich have been used for Danish and New Zealand experimen-
al sites jar traps with a surface of 16% and 26% of the chamberrea, respectively. Moreover, the high jar/chamber surface ratioeduced the underestimated CO2 measures at high soil respira-ion rates (above 300 mg m−2 h−1), which may artificially decreasehe microorganism respiratory activity that reduces the measuredO2 fluxes (Yim et al., 2002). In each sampling area, the chambersere installed in two microsites to replicate the measurements.uring the first 50 days, the ratio of CO2-C emitted in the atmo-
phere, with respect to the C that was removed from wastewatery the CW system, was also considered, taking into account therganic load. The C input by wastewater in the HSSF bed was cal-ulated using the average inflow and outflow water volumes and
concentration. Carbon concentrations in the inflow and outflowaters were calculated using COD that was converted to C using
he multiplicative coefficients of 0.31 and 0.36, respectively (Pitter,999).
.5. Plant biomass
Six samples of five P. australis plants each (thirty plants total)ere collected from the three vegetated sites (P1, P2, and P3). Sam-les were harvested at the end of the first monitoring period at the3th–14th leaf. Biomass dry weight was determined by drying in
thermo-ventilated oven at 65 ◦C until the constant weight waseached. To calculate the CO2-C fixed in the aboveground biomassrom the atmosphere, C dry matter content was determined using
CNS Macrovario combustion analyzer (Elementar Analysensys-eme GmbH, Germany).
.6. Statistical analysis
The statistical analysis was performed using the Statistica
.0 software (StatSoft Inc.). The normality of data was checkedsing the Kolmogorov–Smirnov, Lilliefors’ and Shapiro–Wilk’sests. CO2 emissions from the study site did not show a normalistribution, therefore non-parametric tests, Kruskal–Wallis and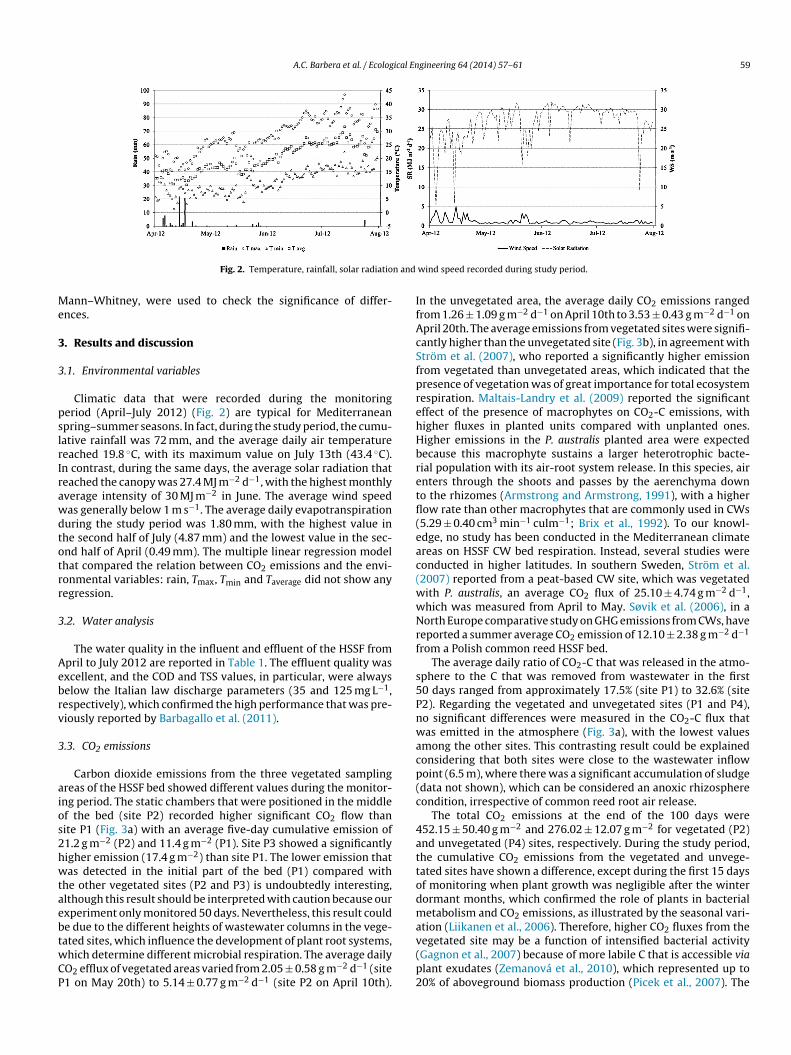
A.C. Barbera et al. / Ecological Engineering 64 (2014) 57– 61 59
n and
Me
3
3
pslrIrawdtotrr
3
Aebrv
3
aios2hwtaebtwCP
IfAcSfprehHbretfl(eac(wwNrf
s5Pnwacp(c
4attodma
Fig. 2. Temperature, rainfall, solar radiatio
ann–Whitney, were used to check the significance of differ-nces.
. Results and discussion
.1. Environmental variables
Climatic data that were recorded during the monitoringeriod (April–July 2012) (Fig. 2) are typical for Mediterraneanpring–summer seasons. In fact, during the study period, the cumu-ative rainfall was 72 mm, and the average daily air temperatureeached 19.8 ◦C, with its maximum value on July 13th (43.4 ◦C).n contrast, during the same days, the average solar radiation thateached the canopy was 27.4 MJ m−2 d−1, with the highest monthlyverage intensity of 30 MJ m−2 in June. The average wind speedas generally below 1 m s−1. The average daily evapotranspirationuring the study period was 1.80 mm, with the highest value inhe second half of July (4.87 mm) and the lowest value in the sec-nd half of April (0.49 mm). The multiple linear regression modelhat compared the relation between CO2 emissions and the envi-onmental variables: rain, Tmax, Tmin and Taverage did not show anyegression.
.2. Water analysis
The water quality in the influent and effluent of the HSSF frompril to July 2012 are reported in Table 1. The effluent quality wasxcellent, and the COD and TSS values, in particular, were alwayselow the Italian law discharge parameters (35 and 125 mg L−1,espectively), which confirmed the high performance that was pre-iously reported by Barbagallo et al. (2011).
.3. CO2 emissions
Carbon dioxide emissions from the three vegetated samplingreas of the HSSF bed showed different values during the monitor-ng period. The static chambers that were positioned in the middlef the bed (site P2) recorded higher significant CO2 flow thanite P1 (Fig. 3a) with an average five-day cumulative emission of1.2 g m−2 (P2) and 11.4 g m−2 (P1). Site P3 showed a significantlyigher emission (17.4 g m−2) than site P1. The lower emission thatas detected in the initial part of the bed (P1) compared with
he other vegetated sites (P2 and P3) is undoubtedly interesting,lthough this result should be interpreted with caution because ourxperiment only monitored 50 days. Nevertheless, this result coulde due to the different heights of wastewater columns in the vege-
ated sites, which influence the development of plant root systems,hich determine different microbial respiration. The average dailyO2 efflux of vegetated areas varied from 2.05 ± 0.58 g m−2 d−1 (site1 on May 20th) to 5.14 ± 0.77 g m−2 d−1 (site P2 on April 10th).v(p2
wind speed recorded during study period.
n the unvegetated area, the average daily CO2 emissions rangedrom 1.26 ± 1.09 g m−2 d−1 on April 10th to 3.53 ± 0.43 g m−2 d−1 onpril 20th. The average emissions from vegetated sites were signifi-antly higher than the unvegetated site (Fig. 3b), in agreement withtröm et al. (2007), who reported a significantly higher emissionrom vegetated than unvegetated areas, which indicated that theresence of vegetation was of great importance for total ecosystemespiration. Maltais-Landry et al. (2009) reported the significantffect of the presence of macrophytes on CO2-C emissions, withigher fluxes in planted units compared with unplanted ones.igher emissions in the P. australis planted area were expectedecause this macrophyte sustains a larger heterotrophic bacte-ial population with its air-root system release. In this species, airnters through the shoots and passes by the aerenchyma downo the rhizomes (Armstrong and Armstrong, 1991), with a higherow rate than other macrophytes that are commonly used in CWs5.29 ± 0.40 cm3 min−1 culm−1; Brix et al., 1992). To our knowl-dge, no study has been conducted in the Mediterranean climatereas on HSSF CW bed respiration. Instead, several studies wereonducted in higher latitudes. In southern Sweden, Ström et al.2007) reported from a peat-based CW site, which was vegetatedith P. australis, an average CO2 flux of 25.10 ± 4.74 g m−2 d−1,hich was measured from April to May. Søvik et al. (2006), in aorth Europe comparative study on GHG emissions from CWs, have
eported a summer average CO2 emission of 12.10 ± 2.38 g m−2 d−1
rom a Polish common reed HSSF bed.The average daily ratio of CO2-C that was released in the atmo-
phere to the C that was removed from wastewater in the first0 days ranged from approximately 17.5% (site P1) to 32.6% (site2). Regarding the vegetated and unvegetated sites (P1 and P4),o significant differences were measured in the CO2-C flux thatas emitted in the atmosphere (Fig. 3a), with the lowest values
mong the other sites. This contrasting result could be explainedonsidering that both sites were close to the wastewater inflowoint (6.5 m), where there was a significant accumulation of sludgedata not shown), which can be considered an anoxic rhizosphereondition, irrespective of common reed root air release.
The total CO2 emissions at the end of the 100 days were52.15 ± 50.40 g m−2 and 276.02 ± 12.07 g m−2 for vegetated (P2)nd unvegetated (P4) sites, respectively. During the study period,he cumulative CO2 emissions from the vegetated and unvege-ated sites have shown a difference, except during the first 15 daysf monitoring when plant growth was negligible after the winterormant months, which confirmed the role of plants in bacterialetabolism and CO2 emissions, as illustrated by the seasonal vari-
tion (Liikanen et al., 2006). Therefore, higher CO2 fluxes from the
egetated site may be a function of intensified bacterial activityGagnon et al., 2007) because of more labile C that is accessible vialant exudates (Zemanová et al., 2010), which represented up to0% of aboveground biomass production (Picek et al., 2007). The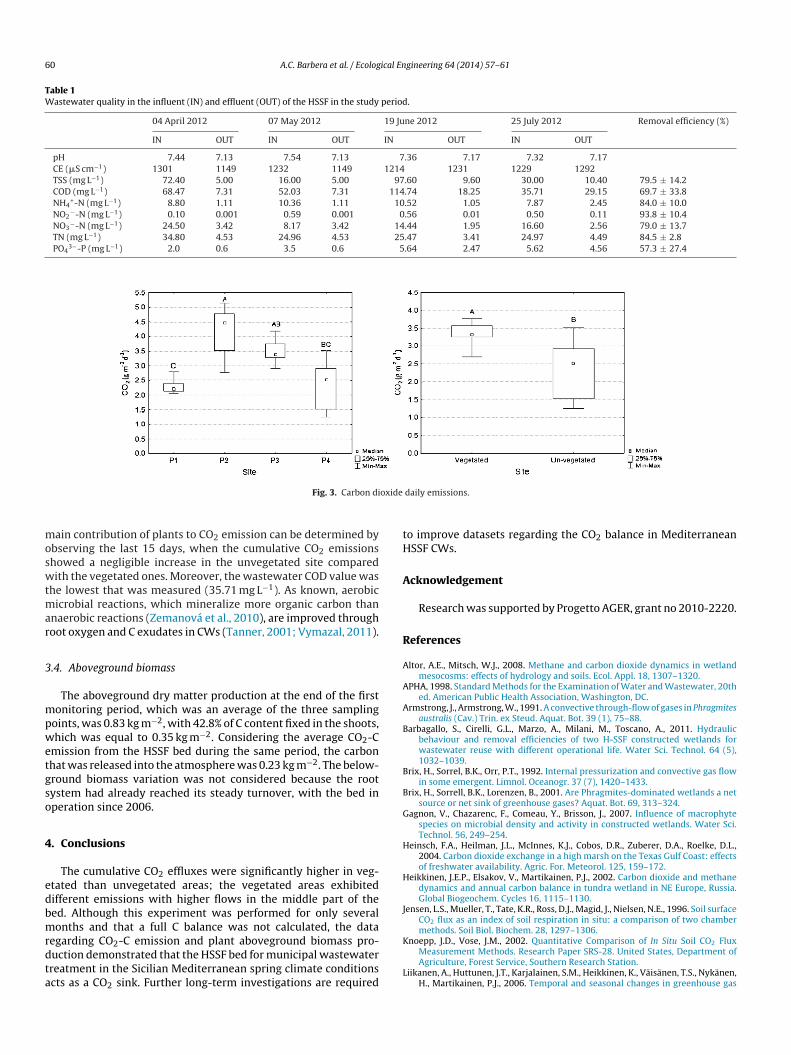
60 A.C. Barbera et al. / Ecological Engineering 64 (2014) 57– 61
Table 1Wastewater quality in the influent (IN) and effluent (OUT) of the HSSF in the study period.
04 April 2012 07 May 2012 19 June 2012 25 July 2012 Removal efficiency (%)
IN OUT IN OUT IN OUT IN OUT
pH 7.44 7.13 7.54 7.13 7.36 7.17 7.32 7.17CE (�S cm−1) 1301 1149 1232 1149 1214 1231 1229 1292TSS (mg L−1) 72.40 5.00 16.00 5.00 97.60 9.60 30.00 10.40 79.5 ± 14.2COD (mg L−1) 68.47 7.31 52.03 7.31 114.74 18.25 35.71 29.15 69.7 ± 33.8NH4
+-N (mg L−1) 8.80 1.11 10.36 1.11 10.52 1.05 7.87 2.45 84.0 ± 10.0NO2
−-N (mg L−1) 0.10 0.001 0.59 0.001 0.56 0.01 0.50 0.11 93.8 ± 10.4NO3
−-N (mg L−1) 24.50 3.42 8.17 3.42 14.44 1.95 16.60 2.56 79.0 ± 13.7TN (mg L−1) 34.80 4.53 24.96 4.53 25.47 3.41 24.97 4.49 84.5 ± 2.8PO4
3−-P (mg L−1) 2.0 0.6 3.5 0.6 5.64 2.47 5.62 4.56 57.3 ± 27.4
oxide
moswtmar
3
mpwetgso
4
edbmrdta
tH
A
R
A
A
A
B
B
B
G
H
H
J
Fig. 3. Carbon di
ain contribution of plants to CO2 emission can be determined bybserving the last 15 days, when the cumulative CO2 emissionshowed a negligible increase in the unvegetated site comparedith the vegetated ones. Moreover, the wastewater COD value was
he lowest that was measured (35.71 mg L−1). As known, aerobicicrobial reactions, which mineralize more organic carbon than
naerobic reactions (Zemanová et al., 2010), are improved throughoot oxygen and C exudates in CWs (Tanner, 2001; Vymazal, 2011).
.4. Aboveground biomass
The aboveground dry matter production at the end of the firstonitoring period, which was an average of the three sampling
oints, was 0.83 kg m−2, with 42.8% of C content fixed in the shoots,hich was equal to 0.35 kg m−2. Considering the average CO2-C
mission from the HSSF bed during the same period, the carbonhat was released into the atmosphere was 0.23 kg m−2. The below-round biomass variation was not considered because the rootystem had already reached its steady turnover, with the bed inperation since 2006.
. Conclusions
The cumulative CO2 effluxes were significantly higher in veg-tated than unvegetated areas; the vegetated areas exhibitedifferent emissions with higher flows in the middle part of theed. Although this experiment was performed for only severalonths and that a full C balance was not calculated, the data
egarding CO2-C emission and plant aboveground biomass pro-uction demonstrated that the HSSF bed for municipal wastewaterreatment in the Sicilian Mediterranean spring climate conditionscts as a CO2 sink. Further long-term investigations are required
K
L
daily emissions.
o improve datasets regarding the CO2 balance in MediterraneanSSF CWs.
cknowledgement
Research was supported by Progetto AGER, grant no 2010-2220.
eferences
ltor, A.E., Mitsch, W.J., 2008. Methane and carbon dioxide dynamics in wetlandmesocosms: effects of hydrology and soils. Ecol. Appl. 18, 1307–1320.
PHA, 1998. Standard Methods for the Examination of Water and Wastewater, 20thed. American Public Health Association, Washington, DC.
rmstrong, J., Armstrong, W., 1991. A convective through-flow of gases in Phragmitesaustralis (Cav.) Trin. ex Steud. Aquat. Bot. 39 (1), 75–88.
arbagallo, S., Cirelli, G.L., Marzo, A., Milani, M., Toscano, A., 2011. Hydraulicbehaviour and removal efficiencies of two H-SSF constructed wetlands forwastewater reuse with different operational life. Water Sci. Technol. 64 (5),1032–1039.
rix, H., Sorrel, B.K., Orr, P.T., 1992. Internal pressurization and convective gas flowin some emergent. Limnol. Oceanogr. 37 (7), 1420–1433.
rix, H., Sorrell, B.K., Lorenzen, B., 2001. Are Phragmites-dominated wetlands a netsource or net sink of greenhouse gases? Aquat. Bot. 69, 313–324.
agnon, V., Chazarenc, F., Comeau, Y., Brisson, J., 2007. Influence of macrophytespecies on microbial density and activity in constructed wetlands. Water Sci.Technol. 56, 249–254.
einsch, F.A., Heilman, J.L., McInnes, K.J., Cobos, D.R., Zuberer, D.A., Roelke, D.L.,2004. Carbon dioxide exchange in a high marsh on the Texas Gulf Coast: effectsof freshwater availability. Agric. For. Meteorol. 125, 159–172.
eikkinen, J.E.P., Elsakov, V., Martikainen, P.J., 2002. Carbon dioxide and methanedynamics and annual carbon balance in tundra wetland in NE Europe, Russia.Global Biogeochem. Cycles 16, 1115–1130.
ensen, L.S., Mueller, T., Tate, K.R., Ross, D.J., Magid, J., Nielsen, N.E., 1996. Soil surfaceCO2 flux as an index of soil respiration in situ: a comparison of two chambermethods. Soil Biol. Biochem. 28, 1297–1306.
noepp, J.D., Vose, J.M., 2002. Quantitative Comparison of In Situ Soil CO2 FluxMeasurement Methods. Research Paper SRS-28. United States, Department ofAgriculture, Forest Service, Southern Research Station.
iikanen, A., Huttunen, J.T., Karjalainen, S.M., Heikkinen, K., Väisänen, T.S., Nykänen,H., Martikainen, P.J., 2006. Temporal and seasonal changes in greenhouse gas

ical En
M
M
M
M
P
P
S
S
S
S
T
V
V
V
W
Y
A.C. Barbera et al. / Ecolog
emissions from a constructed wetland purifying peat mining runoff waters. Ecol.Eng. 26, 241–251.
altais-Landry, G., Maranger, R., Brisson, J., 2009. Effect of artificial aeration andmacrophyte species on nitrogen cycling and gas flux in constructed wetlands.Ecol. Eng. 35 (2), 221–229.
ander, Ü., Löhmus, K., Teiter, S., Mauring, T., Nurk, K., Augustin, J., 2008. Gaseousfluxes in the nitrogen and carbon budgets of subsurface flow constructed wet-lands. Sci. Total Environ. 404 (2/3), 343–353.
ilani, M., Toscano, A., 2013. Evapotranspiration from pilot-scale constructed wet-lands planted with Phragmites australis in a Mediterranean environment. J.Environ. Sci. Health A 48 (5), 568–580.
itsch, W.J., Bernal, B., Nahlik, A.M., Mander, U., Zhang, L., Anderson, C.J., Jørgensen,S.E., Brix, H., 2013. Wetlands, carbon, and climate change. Landscape Ecol. 28,583–597.
icek, T., Cízková, H., Dusek, J., 2007. Greenhouse gas emission from a con-structed wetland—plants as important source of carbon. Ecol. Eng. 31,98–106.
itter, P., 1999. Hydrochemistry. VSCHT, Praha, Czech Republic (in Czech). In: Picek,T., Cízková, H., Dusek, J., 2007. Greenhouse gas emission from a constructed
wetland—plants as important source of carbon. Ecol. Eng. 31, 98–106.cholz, M., 2011. Carbon storage and fluxes within wetland systems. In: WetlandSystems. Springer, London, pp. 127–147.
harkov, I.N., 1984. Determination of the rate of soil CO2 production by the absorp-tion method. Soviet Soil Sci. 16, 102–111.
Z
gineering 64 (2014) 57– 61 61
øvik, A.K., Augustin, J., Heikkinen, K., Huttunen, J.T., Necki, J.M., Karjalainen, S.M.,Kløve, B., Liikanen, A., Mander, Ü., Puustinen, M., Teiter, S., Wachniew, P., 2006.Emission of the greenhouse gases nitrous oxide and methane from constructedwetlands in Europe. J. Environ. Qual. 35, 2360–2373.
tröm, L., Lamppa, A., Christensen, T.R., 2007. Greenhouse gas emissions from aconstructed wetland in southern Sweden. Wetlands Ecol. Manage. 15, 43–50.
anner, C.C., 2001. Plants as ecosystem engineers in subsurface-flow treatmentwetlands. Water Sci. Technol. 44, 9–17.
anderZaag, A.C., Gordon, R.J., Burton, D.L., Jamieson, R.C., Stratton, G.W., 2010.Greenhouse gas emissions from surface flow and subsurface flow constructedwetlands treating dairy wastewater. J. Environ. Qual. 39 (2), 460–471.
ymazal, J., 2009. The use constructed wetlands with horizontal sub-surface flowfor various types of wastewater. Ecol. Eng. 35 (1), 1–17.
ymazal, J., 2011. Plants used in constructed wetlands with horizontal subsurfaceflow: a review. Hydrobiologia 674, 133–156.
elker, J.M., Fahnestock, J.T., Henry, G.H.R., O’Dea, K.W., Chimner, R.A., 2004. CO2
exchange in three Canadian high arctic ecosystems: response to long-termexperimental warming. Global Change Biol. 10, 1981–1995.
im, M.H., Joo, S.J., Nakane, K., 2002. Comparison of field methods for measuring soil
respiration: a static alkali absorption method and two dynamic closed chambermethods. Forest Ecol. Manage. 170, 189–197.emanová, K., Picek, T., Dusek, J., Edwards, K., Santrucková, H., 2010. Carbon, nitro-gen and phosphorus transformations are related to age of a constructed wetland.Water Air Soil Pollut. 207 (1–4), 39–48.


![Untitled-1 [] · The MedVVet action The Mediterranean basin is rich in wetlands of great ecological, social and economic value. Yet these important natural assets have been](https://img.pdfslide.us/doc/110x75/5c0745fe09d3f2e0588b4d0e/untitled-1-the-medvvet-action-the-mediterranean-basin-is-rich-in-wetlands.jpg)