Embed Size (px)
Citation preview

Carbon and Nitrogen Transformations in Alpine
Ecosystems of the Eastern Alps, Austria
Dissertation zur Erlangung des Doktorgrades
Der Naturwissenschaften (Dr. rer. nat.)
Fakultät Naturwissenschaften
Universität Hohenheim
Institut für Botanik
Institut für Bodenkunde und Standortslehre
vorgelegt von
Oliver Koch
aus Stuttgart
2007

Dekan: Prof. Dr. Heinz Breer
1. berichtende Person: Prof. Dr. Ellen Kandeler
2. berichtende Person: Prof. Dr. Manfred Küppers
Eingereicht am: 12.07.2007
Mündliche Prüfung am: 06.11.2007
Die vorliegende Arbeit wurde am 25.09.2007 von der Fakultät Naturwissenschaften der
Universität Hohenheim als „Dissertation zur Erlangung des Doktorgrades der Natur-
wissenschaften“ angenommen.

Erklärung:
Hiermit erkläre ich, dass die vorliegende Arbeit selbständig angefertigt, nur die angegebenen
Quellen und Hilfsmittel benutzt wurden und wörtlich oder inhaltlich übernommene Quellen als
solche kenntlich gemacht worden sind.
(Oliver Koch)

Acknowledgements
First, I would like to thank Prof. Dr. Ellen Kandeler, who supervised my PhD thesis. I am
grateful for her confidence in my competence, the scientific freedom she gave me and the
helpful advice in scientific writing.
For agreeing to act as additional reviewer and for helpful advice, I thank Prof. Dr. Manfred
Küppers.
I am very grateful to Dr. Dagmar Tscherko for her valuable proposals, discussions and
corrective actions. Since the very beginning she was always interested in the progress of my
work and listened to all the problems I encountered during daily life as a PhD student.
The fieldwork in Austria benefited from the infrastructure of the alpine research station
Obergurgl (University of Innsbruck). I thank Prof. Dr. Rüdiger Kaufmann for the use of the
recordings from his weather station and Meinhard Strobel for his hospitality, which eased the
exhausting sampling, especially during the cold winter seasons.
This thesis was funded by a DFG grant of the Graduiertenkolleg (768)
"Vermeidungsstrategien klimarelevanter Gase". Prof. Dr. Jürgen Zeddies, Agnes Bardoll-
Scorl and Jutta Mögle were very committed to all scholarship holders. I thank them for all
their activities and the excellent organization of the numerous supporting programs
(excursions and arrangements).
Thanks to all colleagues and friends in Hohenheim for the talks, discussions and the shared
problems with equipment or red tape.
Last but not least, I am most grateful to my parents for their sympathy and support. The
same thank is also addressed to my partner Ute and to my daughter Jana, who have shared
pride/doubt and joy/sorrow much more than any other persons.

List of figures______________________________________________________________
Table of Contents
1 Summary ____________________________________________________________ 1
2 Zusammenfassung ____________________________________________________ 3
3 General introduction ___________________________________________________ 6
3.1 Methane and carbon dioxide cycle of ecosystems …………….……………………... 7
3.1.1 Carbon pools and C cycle …………………………………….…………………..…………… 73.1.2 Methane cycle ………………………………………….……………...………….…………….. 7 3.1.2 Carbon dioxide cycle …………………………………………………………………………… 9
3.2 Temperature effects on soil C- and N dynamics …………….…………….…….……..10
3.3 References ……………………………………………………………………………….…11
4 Outline of the thesis _____________________________________________________14
5 Seasonal and diurnal net methane emissions from organic soils of the Eastern Alps, Austria: effects of soil temperature, water balance and plant biomass ____15
5.1 Abstract ……………………………………………………………………..…………….…15
5.2 Introduction ………………………………………………………………………………….16
5.3 Material and methods …………………………………………………………..………….17
5.3.1 Study area ……………………………………………………………………………..…………17
5.3.2 Study sites …………………………………………………………………………….………… 18
5.3.3 Methane measurements ………………………………………………………….…………….19
5.3.4 Hydrology …………………………………………………………………….………..….…….. 21
5.3.5 Plant biomass ………………………………………………………………...………………….22
5.3.6 Climate data …………………………………………………………………..………………… 22
5.3.7 Statistics ………………………………………………………………………………………….22
5.4 Results ………………………………………………………………………………………23
5.4.1 Climatic properties …………………………………………………………..…………………..23
5.4.2 Hydrology ……………………………………………………………………..………………….24
5.4.3 Groundwater chemistry of the fen sites (transitional, fen, wet fen) ……..………………… 25
5.4.4 Plant biomass ……………………………………………………………………………………26
5.4.5 Seasonal methane flux of the fen sites (transitional, fen, wet fen) ………...………………26
5.4.6 Seasonal methane flux of the dry alpine meadow (meadow) ………………………………27
5.4.7 Controls of seasonal methane emission at the fen sites (transitional, fen, wet fen) …..…28
5.4.8 Controls of seasonal methane emission at the alpine dry meadow (meadow) ………..… 29
5.4.9 Diurnal methane emission of the fen sites (transitional, fen, wet fen) ………………..……29
5.4.10 Diurnal methane emission of the dry meadow (meadow) …………………………………30
5.5 Discussion ……………………………………………………………………………..……31
5.5.1 Environmental controls of seasonal methane emission at the fen sites (transitional, fen, wet fen) ................................................................................................. 31
5.5.2 Environmental controls of diurnal methane emission at the fen sites (transitional, fen, wet fen) ................................................................................................. 32
5.5.3 Environmental controls of methane oxidation at the alpine meadow site (meadow) …….34
5.5.4 Magnitude of methane flux at the fen sites (transitional, fen, wet fen) ………………..….. 34
Table of contents___________________________________________________________
5.5.5 Magnitude of methane oxidation at the alpine meadow site (meadow) ……………..…… 35
5.5.6 Global aspects of alpine methane flux ………………………………………..……………… 35
5.6 Conclusions ………………………………………………………………….……………..36
5.7 Acknowledgements …………………………………………………………...……………36
5.8 References ……………………………………………………………………………….…36
6 Interannual ecosystem CO2 dynamics in the alpine zone of the Eastern Alps,
Austria ______________________________________________________________40
6.1 Abstract …………………………………………………………………………………… 40
6.2 Introduction ………………………………………………………………….………………41
6.3 Material and methods ………………………………………………………...……………42
6.3.1 Study sites ………………………………………………………………………….…………… 42
6.3.2 CO2 measurements ………………………………………………………………..……………44
6.3.3 Climate data …………………………………………………………………………..………… 45
6.3.4 Plant biomass and plant green area index (GAI) …………………………………………….46
6.3.5 Calculations and statistics …………………………………………………………...…………46
6.4 Results ………………………………………………………………………………………49
6.4.1 Climatic properties and hydrology …………………………………………………..…………49
6.4.2 Vegetation properties …………………………………………………………………...………50
6.4.3 Controls of the net ecosystem CO2 exchange rate during daytime and total ecosystem respiration rate during nighttime ………………………..………………..…51
6.4.4 Seasonal daily CO2 fluxes …………………………………………………...…………………52
6.4.5 Cumulative C fluxes and annual C balance …………………………………..………………53
6.5 Discussion ……………………………………………………………………..……………54
6.5.1 Environmental controls of net ecosystem CO2 exchange rate at daytime (NEClight) …….. 54
6.5.2 Environmental controls of total ecosystem respiration rate (Rtot) …………..…………...… 55
6.5.3 Magnitude of seasonal CO2 fluxes …………………………………………………………….56
6.5.4 Annual C balance in alpine ecosystems and global aspects ……………………………….58
6.6 Conclusions ………………………………………………………………………..………58
6.7 Acknowledgements ………………………………………………………………….…… 59
6.8 References ………………………………………………………………………………….59
7 Temperature sensitivity of microbial respiration, nitrogen mineralization
and potential soil enzyme activities in organic alpine soils ___________________63
7.1 Abstract …………………………………………………………………………………… 63
7.2 Introduction ……………………………………………………………………….…………64
7.3 Material and methods ……………………………………………………………..……….65
7.3.1 Study site description …………………………………………………………………...………65
7.3.2 Soil sampling, chemical soil properties and microbial biomass (Cmic) …………………..…66
7.3.3 Temperature incubation experiment …………………………………………..………………67
7.3.3.1 C mineralization ………………………………………………………….………….…………………67
7.3.3.2 N mineralization ………………………………………………………………….…………………….68
7.3.3.3 Enzyme activity …………………………………………………………………..…………...……….68
7.3.4 Temperature models ……………………………………………………………………………69

Table of contents___________________________________________________________
7.3.5 Data handling and statistics …………………………………………………………………… 70
7.4 Results ………………………………………………………………………………………71
7.4.1 Q10 of the C- and N mineralization ……………………………………………….……………71
7.4.2 Substrate quality index of the C- and N mineralization …………………………..………… 73
7.4.3 Relative temperature sensitivity (RTS) of the C- and N mineralization and enzyme activities (TYRO, LEU, GLUC, XYL, NAC) ………………………………………… 74
7.5 Discussion …………………………………………………………………………..………77
7.5.1 Temperature sensitivity of the C- and N mineralization ……………………………………..77
7.5.1.1 Constant versus flexible temperature response …………………………………….…..……77
7.5.1.2 Q10 values of the C- and N mineralization ……………………………………………….……78
7.5.2 Seasonal pattern in temperature sensitivity of soil-derived activities ………………...……79
7.5.3 Effect of substrate quality on the temperature sensitivity of the C- and N mineralization ………………………………………………………………………………… 80
7.5.4 Relative temperature sensitivity (RTS) of the enzyme activities …………………...……… 81
7.6 Conclusions …………………………………………………………………………..……82
7.7 Acknowledgements …………………………………………………………………...……82
7.8 References …………………………………………………………………………….……82
8 Curriculum vitae _____________________________________________________________86

List of figures________________________________________________________________
List of figures Figure 5.1 (A) Geographical position of the study area in the European Alps (A=Austria, CH=Switzerland, D=Germany, F=France, FL=Liechtenstein, I=Italy, SLO=Slovenia). (B) Distribution of alpine fens in the study area (black locations); the gray area in the map represents the potential tree area below 2250 m a.s.l. (C) Position of the study sites outside and within the Rotmoos fen. (D) Peat profile of the Rotmoos fen (only major sediment layers are illustrated) (Fig. 5.1B - 5.1D modified from Rybníček and Rybníčková, 1977). Figure 5.2 Time course of air temperature and soil temperature (5 cm depth) at the transitional site. Figure 5.3 Time course of water table at the transitional, fen and wet fen sites (A) and water-filled pore space (wfps) at the meadow site during the snow-free periods (B). Figure 5.4 Time course of dissolved methane concentrations in groundwater (to maximum 1 m soil depth) at the transitional, fen and wet fen sites. Figure 5.5 Time course of net methane emissions at the transitional, fen and wet fen sites (A) and the meadow site (B). Figure 5.6 Relation between water table and daily net methane flux at the transitional, fen and wet fen sites for the snow-free period 2003 (n=18) and 2004 (n=12). Second polynomial function was used for both regressions (* P≤0.5, ** P<0.01, *** P<0.001). Figure 5.7 Time course of diurnal net methane emissions and soil temperature (5 cm, 15 cm, 35 cm soil depth) at the wet fen site (17 June 2004) (A) and at the transitional site (28 August 2003) (B). Figure 6.1 Map of the study area and study sites. (A) Overview of alpine fens in the study area (black areas) based on mapping by Rybníček and Rybníčková (1977); gray area in map represents the potential tree area (altitude below 2250 m a.s.l.); legend of the overview of the Alps: A=Austria, D=Germany, CH=Switzerland, F=France, FL=Liechtenstein, I=Italy, SLO=Slovenia. (B) Map section of the Rotmoos valley with locations of study sites. Figure 6.2 Time course of soil temperature in 5 cm soil depth (meadow) and precipitation during the snow-free periods. Figure 6.3 Time course of the water-filled pore space in 5 cm soil depth during the snow-free periods. Figure 6.4 Time course of the plant green area index (GAI) during the snow-free periods. Error bars indicate the maximum critical range (LSD) for sampling date (date) and study site (site).

List of figures________________________________________________________________
Figure 6.5 Time course of the seasonal NECday (A) and Rnight (B) during the snow-free periods. Figure 7.1 Relationship between Q10 values and the exponential constant A (index of soil organic matter quality). Q10 values, A of C mineralization (AC) and N mineralization (AN) were obtained from a simple first-order exponential equation (equation 7.1). Figure 7.2 1:1 dialog between the exponential constant A (index of soil organic matter quality) of C mineralization (AC) and N mineralization (AN); obtained from a simple first-order exponential equation (equation 7.1). Solid line is the linear regression line between C- and N mineralization; dashed line represents the linear regression through origin. Figure 7.3 The relative temperature sensitivity (RTS) of the investigated soil microbial activities as a function of temperature (equation 7.3) (study site: meadow, sampling date: summer): C mineralization (Cmin), N mineralization (Nmin), enzyme activities: Tyrosine aminopeptidase (TYRO), leucine aminopeptidase (LEU), ß-glucosidase (GLUC), ß-xylosidase (XYL), N-acetyl-ß-glucosaminidase (NAG). Figure 7.4 The ratio of the relative temperature sensitivity (RTS(0-5)/RTS(13-18)) for all soil activities (study site: alpine meadow): C mineralization (Cmin), N mineralization (Nmin), enzyme activities: Tyrosine aminopeptidase (TYRO), leucine aminopeptidase (LEU), ß-glucosidase (GLUC), ß-xylosidase (XYL), N-acetyl-ß-glucosaminidase (NAG). Bars represent the mean, whiskers indicate standard error.

List of tables________________________________________________________________
List of tables Table 5.1 Mean values and interpolated values (interpol.) of water table (wt) at the transitional site (trans), the fen site (fen) and the wet fen site (wet fen) (as noted with the acronym:a); water-filled pore space (5 cm soil depth) (wfps) at the alpine meadow site (meadow) (as noted with the acronym:b) and the range of live above-ground standing biomass (pb) for the entire study period and the snow-free periods 2003 and 2004. Table 5.2 Mean net CH4 flux and standard error (se), mean of interpolated values (interpol.) and cumulative CH4 flux (cum. flux) at the transitional site (trans), the fen site (fen), the wet fen site (wet fen) and the alpine meadow site (meadow). Table 5.3 Partial regression coefficients (A) and multiple linear models (B) for daily net methane emission of the entire study period (n=22 for the transitional, fen and wet fen sites; n=10 for the alpine meadow site). Dependent variable: ln transformed methane flux [mg CH4 m
-2 d-1] (ln flux) for transitional, fen and wet fen and methane uptake [mg CH4 m-2 d-1] (flux) for meadow. Independent variables: water table [cm] (wt) (at transitional, fen, wet fen as noted with the acronym:a) and ln-transformed dissolved methane concentration [µg CH4 l
-1] (CH4aq), water-filled pore space [%] (wfps) (at meadow as noted with the acronym:b) and soil temperature [°C] at 5 cm soil depth (st5). Level of significance: P≤0.05 (*** P<0.001, ** P<0.01, * P≤0.05). Table 5.4 Partial regression coefficients (A) and multiple linear models (B) for all diurnal measurements during the snow-free periods (n=73-80 for each site). Dependent variable: ln transformed net methane flux [mg CH4 m
-2 h-1] (ln flux) for the transitional, fen and wet fen sites and methane uptake [mg CH4 m
-2 h-1] (flux) for the meadow site. Independent variables: water table [cm] (wt) (at transitional, fen and wet fen as noted with the acronym:a), water-filled pore space (5 cm soil depth) [%] (wfps) (at meadow as noted with the acronym:b), soil temperature [°C] (soil depth: 5 cm (st5), 15 cm (st15), 35 cm (st35)), global radiation [W m-2] (glob. rad.) and above-ground standing plant biomass [g m-2] (pb). Level of significance: P≤0.05 (*** P<0.001, ** P<0.01, * P≤0.05). Table 6.1 Plant species and coverage [%] of the study sites. Table 6.2 Above- and below-ground plant biomass at peak-standing plant biomass of the two investigated years 2003 and 2004. Different letters in the row indicate significant differences between study sites and years (p≤0.05). Table 6.3 (A) Parameters of the model functions to calculate net ecosystem carbon exchange rates during daytime (NEClight [mg CO2 m
-2 h-1]) and (B) total respiration rate (Rtot [mg CO2 m-2 h-1]);
PAR: photosynthetic active radiation [µmol m-2 s-1], GAI: plant green area index [m2 m-2], st5: soil temperature in 5 cm depth [°C], wfps: water-filled pore space [%]. All model function parameters and correlation coefficients were highly significant (p<0.001).

List of tables________________________________________________________________
Table 6.4
Cumulative CO2 fluxes (ΣNECday [g C m-2 period-1], ΣRw [g C m-2 period-1]) and annual C balances [g C m-2 a-1] of the two investigated study years 2003 and 2004. Table 7.1 Chemical soil properties and Cmic of the study sites (autumn sampling). Different letters in the column indicate significant differences of the means between study sites. Values in parentheses are standard errors. Table 7.2 Model parameters of the simple first-order exponential function (equation 7.1) for C- and N mineralization. Units: AC [µg C-CO2 g
-1 C day-1], AN [µg N-NH4+ g-1 N day-1], B [°C-1]. Values
are means (± standard errors). Table 7.3 Model parameters of the flexible temperature dependence function (equation 7.2) for C- and N mineralization. Units: A1 [µg C-CO2 g-1 C day-1] (C mineralization) and [µg N-NH4
+ g-1 N day-1] (N mineralization) and B1, T0 [K]. Values are means (± standard errors). Table 7.4 Model parameters of the potential enzyme activities using the flexible temperature dependence function (equation 7.2). Units: A1: [nmol MUB g-1 min-1] (ß-glucosidase, ß-xylosidase, N-acetyl-ß-glucosaminidase); [nmol AMC g-1 min-1] (tyrosine aminopeptidase, leucine aminopeptidase) and B1, T0: [K]. Values are means (± standard errors).
List of appendices Appendix 6.1 Cumulative CO2 fluxes (ΣNECdaylight [g C m-2 period-1], ΣRnight [g C m-2 period-1]) and selected ratios of cumulative CO2 fluxes (│ΣRnight/ΣNECdaylight│, │ΣRw/ΣNECday│).

List of abbreviations__________________________________________________________
List of abbreviations AC Substrate quality index for C mineralization AN Substrate quality index for N mineralization AMC 7-amino-4-methyl-coumarin
ANOVA Analysis of variance CFE Chloroform fumigation-extraction CH4aq Dissolved methane Cmic Microbial carbon Cmin C mineralization Corg Organic carbon Ct Total carbon DOC Dissolved organic carbon GAI Green area index of plants Glob. rad. Global radiation GLUC ß-glucosidase LEU Leucine aminopeptidase MUB 4-methylumbelliferyl NAG N-acetyl-ß-glucosaminidase NEC Net ecosystem CO2 exchange NECday Daily net ecosystem CO2 exchange
NECdaylight Daily net ecosystem CO2 exchange during daytime (PAR>0) NEClight Net ecosystem CO2 exchange during daytime (PAR>0)
NECmax Maximum NEClight
Nmin N mineralization Nt Total nitrogen PAR Photosynthetic active radiation wfps Water-filled pore space wt Water table pb green above-ground standing plant biomass ppm Parts per million Q10 Temperature quotient (∆10°C) Rnight Daily ecosystem respiration during nighttime (PAR=0)
Rtot Ecosystem respiration during nighttime (PAR=0)
RTS Relative temperature sensitivity st5 Soil temperature in 5 cm soil depth st15 Soil temperature in 15 cm soil depth st35 Soil temperature in 35 cm soil depth TYRO Tyrosine aminopeptidase XYL ß-xylosidase Study sites: meadow alpine meadow (Curvulo-Nardetum): transitional transient fen site (Carici echinatae-Trichophoretum caespitosi) fen fen site (Carici echinatae-Trichophoretum caespitosi) wet fen fen site (only Carex nigra)

1 Summary________________________________________________________________1
1 Summary
This thesis investigated net CH4 and net CO2 emissions from sites in the alpine region of the
Eastern Alps, Austria. Four mature alpine sites (one dry meadow and three fen sites following
a natural water gradient) were selected and the influence of abiotic (radiation, temperature,
soil water conditions) and biotic (above-ground standing plant biomass) environmental
controls on diurnal and seasonal emission patterns were studied. For a better understanding
of the response of soil C- and N pools to global warming, the temperature sensitivity of
activities involved in C- and N cycling were determined.
The first part of the thesis dealt with net methane fluxes measured over a period of
24 months. During snow-free periods, average methane emissions of the fen sites ranged
between 19 and 116 mg CH4 m-2 d-1. Mean emissions during snow periods were much lower,
being 18 to 59% of annual fluxes. The alpine dry meadow functioned as a small methane sink
during snow-free periods (-2.1 mg CH4 m-2 d-1 (2003); -1.0 mg CH4 m
-2 d-1 (2004)). The diurnal
and seasonal methane uptake of the dry meadow was positively related to soil temperature
and negatively related to water-filled pore space (wfps). In the fen, the seasonal methane
fluxes were related to soil temperature and groundwater table. The live above-ground
standing plant biomass contributed to net methane fluxes only at those sites with higher water
table positions. This study provided evidence that alpine fens acted as methane sources
throughout the year, whereas an alpine meadow site acted as a net methane sink during
snow-free periods.
In the second part of the thesis the CO2 balance was estimated based on diurnal flux
measurements and on the influence of photosynthetic active radiation (PAR), plant green
area index (GAI), soil temperature and wfps. The daylight net ecosystem CO2 emission rate
was influenced by PAR and GAI throughout snow-free seasons. The seasonal net CO2
emission rate at night was positively related to soil temperature, while low wfps reduced flux
rates at the meadow and at the driest fen study site but reinforced carbon loss at the wetter
fen sites. The daily average ecosystem net CO2 gain during snow-free periods at the meadow
was 3.5 g CO2 m-2 d-1 and at the fen sites between 1.5 and 3.4 g CO2 m
-2 d-1. The mean
average daily CO2 emission during snow periods was low, being -0.9 g CO2 m-2 d-1 for the
meadow and between -0.2 and -0.7 g CO2 m-2 d-1 for all fen sites. All sites function as
significant annual net carbon sinks, with a net carbon gain from 50 to 121 g C m-2 a-1
(averaged over both years), irrespective of water balance. The results indicate that alpine fen
sites, that have built up a large carbon stock in the past, are not expected to gain a further
carbon surplus compared with meadows under the current climate.
Temperature is important for regulating biological activities. The third part of the thesis
focused on temperature sensitivity of soil C mineralization, N mineralization and potential
1 Summary________________________________________________________________2
enzyme activities involved in the C- and N cycle (ß-glucosidase, ß-xylosidase,
N-acetyl-ß-glucosaminidase, tyrosine aminopeptidase, leucine aminopeptidase) over a
temperature range of 0-30°C. The objective was to calculate Q10 values and relative
temperature sensitivities (RTS) and to quantify seasonal (summer, autumn, winter) and site-
specific factors.
The Q10 values of C mineralization were significantly higher (average 2.0) than for N
mineralization (average 1.7). The Q10 values of both activities were significantly negatively
related to soil organic matter quality. In contrast, the chemical soil properties, microbial
biomass and sampling date did not influence Q10 values. Analysis of RTS showed that the
temperature sensitivity increased with decreasing temperature. The C- and N mineralization
and potential aminopeptidase activities (tyrosine, leucine) showed an almost constant
temperature dependence over 0-30°C. In contrast, ß-glucosidase, ß-xylosidase and
N-acetyl-ß-glucosaminidase showed a distinctive increase in temperature sensitivity with
decreasing temperature. Low temperature at the winter sampling date caused a greater
increase in the RTS of all activities than in autumn and summer. Our results indicate a
disproportion of the RTS for potential enzyme activities of the C- and N cycle and a
disproportion of the RTS for easily degradable C compounds (ß-glucose, ß-xylose) compared
with the C mineralization of soil organic matter. Thus, temperature may play an important role
in regulating the decay of different soil organic matter fractions.
In conclusion, this study proved that climatic properties are important for net emissions of the
climate-relevant trace gases, CO2 and CH4, derived from alpine ecosystems. Net N2O fluxes
were not found at any study site. Considering the small cover of wetlands in the alpine zone
of Austria (0.14%) compared to alpine grassland (78.3%), and extrapolating our data to a
regional scale (vegetation-free area excluded), this study expect a small net sink for CH4
(│0.14│ g CH4 m-2 a-1) and a net sink for CO2 (│420│ g CO2 m
-2 a-1) under current climate
conditions. This rough estimation requires more detailed investigations because the alpine
environment is very patchy. The influence of temperature on soil activities of the C- and
N cycle in our study showed an apparent decoupling of RTS for the investigated activities,
which may alter the composition of soil organic matter in terms of quality and quantity under
global warming.

2 Zusammenfassung_________________________________________________________3
2 Zusammenfassung
In der vorliegenden Arbeit wurden Netto-CH4- und Netto-CO2-Emissionen alpiner Standorte
der österreichischen Ostalpen untersucht. Vier Standorte (ein Trockenrasen, drei
Moorstandorte innerhalb eines natürlichen Wassergradienten) wurden ausgewählt und der
Einfluss abiotischer (Strahlung, Temperatur, Bodenwassergehalt) und biotischer
(oberirdische Pflanzenbiomasse) Umwelteinflüsse auf das tägliche und saisonale
Emissionsmuster untersucht. Um den Einfluss der Temperatur auf die Kohlenstoff- und
Stickstoff-Vorkommen im Boden zu untersuchen, wurden die Temperaturabhängigkeiten von
C- und N-Umsätzen bestimmt.
Der erste Teil der Arbeit befasst sich mit Netto-Methanflüssen, gemessen über einen
Zeitraum von 24 Monaten. Während der schneefreien Zeit wurden 19-116 mg CH4 m-2 d-1 für
die Moorstandorte ermittelt. Während der schneebedeckten Zeit waren diese Flüsse viel
geringer und betrugen 18-59% der jährlichen Gesamtemissionen. Der Trockenrasen stellte
während der schneefreien Zeit eine kleine Senke für Methan (-2.1 mg CH4 m-2 d-1 (2003);
-1.0 mg CH4 m-2 d-1(2004)) dar. Diese Netto-Methanaufnahme des Trockenrasens korrelierte
positiv mit der Bodentemperatur und negativ mit dem wassergefüllten Porenvolumen des
Bodens (wfps). Im Moor ließ sich eine Beziehung des saisonalen Methanflusses mit der
Bodentemperatur und dem Grundwasserstand finden. Die oberirdische grüne
Pflanzenbiomasse korrelierte nur mit dem Netto-Methanfluss der Moorstandorte mit hohen
Grundwasserständen. Diese Untersuchung belegt, dass alpine Moore ganzjährige
Methanquellen sind, während ein alpiner Trockenrasen eine Methansenke innerhalb der
schneefreien Zeit darstellt.
Gegenstand des zweiten Teiles der Arbeit war die Berechnung einer CO2-Bilanz basierend
auf Tagesgängen von Gasflussmessungen. Berücksichtigt wurden dabei der Einfluss von
photosynthetisch aktiver Strahlung (PAR), der grüne Pflanzenflächenindex (GAI), die
Bodentemperatur und das wfps. Bei Tageslicht wurden die Netto-Emissionsraten innerhalb
der schneefreien Zeit von PAR und GAI gesteuert. Die Netto-Emissionsraten während der
Nachtzeit korrelierten positiv mit der Bodentemperatur. Niedrige wfps-Werte führten dabei zur
Verringerung der Flussraten auf dem Trockenrasen und der trockenen Moorfläche,
wohingegen die Kohlenstoffverluste auf den vernässten Moorstandorten zunahmen. Während
der schneefreien Zeit betrug der durchschnittliche Netto-CO2-Gewinn des Trockenrasens
3.5 g CO2 m-2 d-1 und für die Moorstandorte 1.5 bis 3.4 g CO2 m
-2 d-1. Die durchschnittliche
Atmung der Standorte während der schneebedeckten Periode war niedrig: -0.9 g CO2 m-2 d-1
für den Trockenrasen und -0.2 bis -0.7 g CO2 m-2 d-1 für die Moorstandorte. Unabhängig vom
Wasserhaushalt waren alle Standorte, gemittelt über beide Untersuchungsjahre, signifikante

2 Zusammenfassung_________________________________________________________4
Netto-C-Senken (50 bis 121 g C m-2 a-1). Die Ergebnisse zeigen, dass bei heutigen
Klimaverhältnissen alpine Moore mit ihrem großen Kohlenstoffvorrat keine weitere
Kohlenstofffestlegung im Vergleich zu alpinen Trockenrasen erwarten lassen.
Die Temperatur stellt einen bedeutenden Faktor für die Regulierung biologischer Aktivitäten
dar. Deshalb wurde in der dritten Untersuchung die Temperaturabhängigkeit der
bodenbürtigen C-Mineralisation, N-Mineralisation und potentieller Enzymreaktionen des C-
und N-Kreislaufes (ß-Glucosidase, ß-Xylosidase, N-acetyl-ß-Glucosaminidase, Tyrosin-
Aminopeptidase, Leucin-Aminopeptidase) für einen Temperaturbereich von 0-30°C ermittelt.
Das Ziel war es, Q10-Werte und die relative Temperaturabhängigkeit (RTS) zu berechnen
sowie den Einfluss verschiedener Jahreszeiten (Sommer, Herbst, Winter) und
standortsspezifischer Faktoren zu ermitteln.
Die Q10-Werte der C-Mineralisation (2.0) waren signifikant höher als die der N-Mineralisation
(1.7). Die Q10-Werte beider Aktivitäten korrelierten negativ mit der Substratqualität. Die
chemischen Bodeneigenschaften, der mikrobielle Kohlenstoffgehalt und der Zeitpunkt der
Probenahme zeigten keinen Einfluss auf die Q10-Werte. Die berechneten RTS-Werte
machten deutlich, dass die Temperaturabhängigkeit mit abnehmender Temperatur zunahm.
Die C- und N-Mineralisation und die potentiellen Aminopeptidaseaktivitäten (Tyrosin, Leucin)
wiesen eine fast konstante Temperaturabhängigkeit über den Temperatur-
bereich von 0-30°C auf. Im Gegensatz dazu zeigten ß-Glucosidase, ß-Xylosidase und
N-acetyl-ß-Glucosaminidase einen ausgeprägten Anstieg der Temperaturabhängigkeit mit
abnehmender Temperatur. Die vorherrschende tiefe Temperatur der Probenahme im Winter
verursachte einen stärkeren Anstieg der RTS als dies für die Probenahme im Herbst und
Sommer der Fall war. Diese Ergebnisse deuten zum einen auf eine Disproportionalität der
RTS von potentiellen C-Enzymaktivitäten und N-Enzymaktivitäten hin und zum anderen auf
eine Disproportionalität der Mineralisation von leicht verfügbaren C-Verbindungen
(ß-Glucose, ß-Xylose) im Vergleich zur C -Mineralisation der bodenbürtigen organischen
Substanz in alpinen Böden. Daher könnte die Temperatur eine wichtige Rolle bei der
Regulierung des Abbaus unterschiedlicher Fraktionen der organischen, bodenbürtigen
Substanz darstellen.
Zusammenfassend lässt sich feststellen, dass klimatische Eigenschaften bedeutend für
Netto-Emissionen der Klimagase CO2 und CH4 in alpinen Ökosystemen sind. Netto-N2O-
Flüsse ließen sich auf keinem Standort finden. Geht man von einer geringen
Gesamtmoorfläche der alpinen Zone Österreichs (0.14%) im Vergleich zum alpinen Rasen
(78.3%) aus und überträgt die Daten auf eine regionale Ebene (unter Ausschluss
vegetationsfreier Flächen), so stellen die Alpen eine kleine CH4-Senke (│0.14│g CH4 m-2 a-1)
und CO2-Senke (│420 g│CO2 m-2 a-1) bei heutigen Klimaverhältnissen dar.

2 Zusammenfassung_________________________________________________________5
Diese grobe Abschätzung bedarf jedoch weiterer Untersuchungen, da die alpine Zone sehr
kleinräumige und vielseitige Landschaftsstrukturen aufweist. Der Einfluss der Temperatur auf
die bodenbürtigen C- und N-Aktivitäten war unterschiedlich. Die ausgeprägte Entkopplung
der RTS der untersuchten Aktivitäten könnte die Zusammensetzung der organischen
Bodensubstanz hinsichtlich einer globalen Klimaerwärmung qualitativ und quantitativ
verändern.
3 General introduction_______________________________________________________6
3 General introduction
Today, global climate change is a very important topic of interest for both the public and the
scientific community. A global temperature rise is predicted associated with the increasing
atmospheric concentration of trace gases like methane (CH4), carbon dioxide (CO2) and
nitrous oxide (N2O) [IPCC, 2001]. Since preindustrial time, the CO2 concentration in the
atmosphere has continuously increased from 280 to 367 ppm and is expected to further
increase in a range of 478 to 1099 ppm by the year 2100; during this same period, CH4
emissions have increased, but the current atmospheric concentration has stabilized at
1.75 ppm. The global climate change debate led for example to the “Kyoto Protocol” in 1997,
which was ratified recently. The overall goal is to reduce climate-relevant trace gas
emissions. However, the agreement has only marginally changed the increasing global
emission trend. These climate-relevant gases function like glass panels of a greenhouse,
absorbing long wave radiation reverberating from the Earth’s surface. Thus, the heat energy
remains in the atmosphere and a global temperature increase (range: 1.4 to 5.8°C) is
predicted for the next 100 years [IPCC, 2001]. Global warming may well be unevenly
distributed. A recent study predicted a more intensive increase of mean summer temperature
for the European Alps than for temperate regions in Europe [Heimann and Sept, 2000].
There is a major discussion on whether agro-, forest- or natural ecosystems function as sinks
or sources of climatic trace gases. Global Change may cause positive feedback mechanisms
for the carbon balance of terrestrial ecosystems [Schlesinger and Andrews, 2000]. Moreover,
cold-adapted alpine environments are expected to respond very sensitively to global
warming. Soils are the basis of terrestrial ecosystems, and the contribution of soil nutrients
within the overall ecosystem is much higher in northern- or high-elevation ecosystems than
elsewhere [Körner, 1999]. Carbon and nitrogen are the largest nutrient pools in soils. Since
these pools are linked, the influence of temperature on both carbon and nitrogen
transformations is crucial with respect to global warming.
3 General introduction_______________________________________________________7
3.1 Methane and carbon dioxide cycle of ecosystems
3.1.1 Carbon pools and C cycle
Globally, about 1400 1015 g carbon is stored in soils [Post et al., 1982], while wetlands
contribute more than 30% of this total amount (455 to 700⋅1015 g). This is the third highest
contribution of global carbon stock after oceans (38600⋅1015 g) and sources of fossil fuels
(10000⋅1015 g). Landscapes at northern latitudes and high elevations account for a significant
percentage of the Earth’s land surface and include arctic tundra, boreal forest, temperate
forest, sub alpine forest, and alpine tundra [Bouwman, 1990], while alpine tundra covers
about 8% of the terrestrial global surface (10.5 million km2) [Archibold, 1995].
CO2 and CH4 are the most important components of the C cycle from ecosystems
[e.g. Conrad, 1996]. The metabolic rate of these gases is dynamically coupled with the
atmosphere. Soils function as sources or sinks for CO2 and CH4. However, the absolute
values of the total budget and the percental contribution by soils should be accepted with
caution, because the individual sources and sinks strengths are highly uncertain
[Conrad, 1996]. The problem is that the fluxes generally show a high variability with respect to
site and time. Especially in alpine regions, this landscape pattern is very patchy and
characterized by a high variation in length of vegetation period, vegetation cover, water
regime and climatic or microclimatic properties [Bowman and Fisk, 2001].
3.1.2 Methane cycle
Under anaerobic soil conditions the mineralization end product is mainly CH4, which
contributes about 1% of total carbon mineralization. Important intermediate products of the
anaerobic pathway are acetate, carbon dioxide, hydrogen and various alcohols that are
further reduced to methane [Deppenmeier et al., 1996]. Methanogenic archaea are
widespread and always associated with anaerobic bacteria because they are unable to use
complex organic compounds. Furthermore, methane production competes with anaerobic
bacteria using the same substrates but other potential electron acceptors (NO3-, Mn4+, Fe3+,
SO42-) than CO2. Under aerobic soil conditions, methanothrophic bacteria using O2 as an
electron acceptor can oxidize CH4. Methanotrophs in aerated soil layers of wetland are
characterized by a much lower CH4 affinity than methanotrophs found in upland soils, which
exclusively utilize the atmospheric methane concentration (1.75 ppm) as an energy source
[Conrad, 1996].
Methane flux from wetland soils to the atmosphere is the net result of anoxic methane
production, methane oxidation in aerated soil layers and transport from belowground to the
atmosphere [e.g. Conrad, 1996]. Methane transport is the result of diffusion through water,

3 General introduction_______________________________________________________8
aerated soil matrix or plant-mediated transport via the aerenchyme. For waterlogged soil
conditions, plant-mediated methane transport may account for almost 100% of total net flux
[Kelker and Chanton, 1997]. This is because methane diffusion in air is much higher than in
water. Methane transport by diffusion in drained surface layers of wetlands is controlled by
methanothrophic bacteria, which can oxidize most of methane produced before it reaches the
atmosphere [Hanson and Hanson, 1996]. The main abiotic controls of methane flux from
wetlands are water table position and temperature. The water table triggers the vertical
distribution of anoxic methane production and methane oxidation and transport via water, air
and plants. The influence of temperature on net methane emission depends on the vertical
allocation of methane production (and/or competitive processes) and methane oxidation,
because all processes generally depend on temperature. In addition, the temperature
distribution within the vertical soil matrix may also control net methane flux.
In upland soils, methanotrophs exclusively utilize atmospheric methane concentration as
energy source, leading to net sinks for methane in these ecosystems. Ammonium has been
found to competitively inhibit atmospheric methane oxidation [de Visscher and van Cleemput,
2003]. The main controls of atmospheric net methane uptake are soil porosity and soil water
content, which control gas diffusion into the atmosphere; this is followed by soil temperature,
which seems to be less important [Conrad, 1996].
Wetlands are the largest natural source of methane flux to the atmosphere, and northern and
high-elevation wetlands account for a third of this natural source [IPCC, 2001]. Climatic
properties are important controls for seasonal methane flux. High-latitude and high-elevation
ecosystems are characterized by short vegetation periods and long snow periods; however,
net methane fluxes during snow periods comprise a significant part of the annual budget and
should not be ignored [Schmidt et al., 2001]. Alpine tundra serves as sources and sinks for
atmospheric methane, depending on landscape patterns [West et al., 1999]. However, our
knowledge is limited to studies in the Rocky Mountains [Chimner and Cooper, 2002;
West et al., 1999; Wickland et al., 2002] and the Tibetan Plateau [Hirota et al., 2004], and no
data are available for the European Alps. Because of the complexity of various controls for
net methane flux and the patchy landscape in the alpine environment worldwide, seasonal
investigations of net methane flux and abiotic and biotic controlling factors will improve our
knowledge of the alpine environment with respect to the global budget.
3 General introduction_______________________________________________________9
3.1.2 Carbon dioxide cycle
Ecosystems exchange carbon dioxide with the atmosphere; this cycling is the major part of
the C cycle for ecosystems. Carbon dioxide is sequestered by vegetation via photosynthesis,
stored as carbon in the soil matrix, or released again to the atmosphere by total ecosystem
respiration (plants, animals, microflora) [e.g. Körner, 1999]. Plant photosynthesis is greatly
influenced by irradiation, the phenological status of the vegetation and length of the snow-free
period. Total ecosystem respiration in the alpine environment mainly depends on
temperature, plant biomass and soil water content [Cernusca and Decker, 1989].
The C budget of mature quasi-stable ecosystems is commonly balanced. In contrast,
northern wetlands have built up a large carbon stock (270 to 370 Pg) since the last
deglaciation by accumulating atmospheric carbon dioxide [Turunen et al., 2002]. This is due
to the slow decomposition rate favoured by water-logged anoxic conditions. The long-term
rate of carbon accumulation in wetlands also depends on their age and water balance. The
rate was lower for old than young boreal fens, and lower for drained than undrained fens
[Turunen et al., 2002]. The ecosystem carbon dynamics are sensitive to global change,
leading to slower accumulation of carbon. First, global warming has the effect of reducing soil
organic carbon by stimulating decomposition rates more than net ecosystem productivity
[Kirschbaum, 2000]. Second, the water balance of ecosystems is likely to change. Soils may
become drier during the vegetation period due to lower precipitation in summer and
increasing evapo-transpiration. This may have a higher impact on wetlands than other
ecosystems because the anoxic soil layers are reduced. Third, there is no evidence that an
increasing atmospheric CO2 concentration leads to a higher net ecosystem carbon gain via
photosynthesis. Although leaf photosynthesis of plants is generally more efficient at higher
CO2 partial pressure, ecosystem net carbon gain was not affected by doubled CO2
concentration in alpine tundra compared to ambient conditions [Diemer and Körner, 1998].
This means that we already live in a carbon-saturated environment and other factors are
more important for limiting net plant productivity.
Our knowledge about the annual carbon balance under the present climate in high-elevation
ecosystems (above tree line) is mainly limited to the productivity of the above-ground and
below-ground plant biomass combined with data on ecosystem respiration. Annual or
seasonal ecosystem net CO2 flux data from the alpine tundra (above the tree line) or
high-elevation wetlands are rare; studies are only available from the Rocky Mountains
[Welker et al., 1999; Wickland et al., 2001], the Tibetan plateau [Hirota et al., 2006; Kato et
al., 2004] and the Swiss Alps [Diemer and Körner, 1998]. Literature data show large
differences for ecosystem respiration, ecosystem net carbon gain, contribution of CO2 flux
during snow periods and annual carbon balance. The high variability of data probably reflects

3 General introduction_______________________________________________________10
site-specific differences. Because of the patchy landscape pattern, more investigations are
necessary to estimate the global carbon budget of alpine ecosystems.
3.2 Temperature effects on soil C- and N dynamics
All biochemical processes depend on temperature. The temperature dependence is of great
interest for understanding temperature responses of nutrient cycling to global warming. The
strong effect of temperature on decomposition has been quantified for many soils under
different conditions (e.g. Lloyed and Taylor, 1994; Kirschbaum, 1995; Kätterer et al., 1998;
Fierer et al., 2006). The temperature quotient (Q10) gives the ratio of activities for a 10°C
change and is often used in the literature. First-order exponential functions, yielding constant
Q10 values, have been frequently applied. However, there is still no consensus about the
relation of biochemical processes to temperature. Relative temperature sensitivity, which
describes increasing temperature sensitivity with decreasing temperature using linear, power
and Arrhenius-type functions, has been less used [Kätterer et al., 1998]. Based on this
relative temperature sensitivity (RTS), cold-adapted soils should be more sensitive to global
warming than soils from warmer regions. However, a large range of temperature sensitivity of
C mineralization has been reported in the literature. There is evidence that this variation is
negatively related to substrate quality of the soil organic matter [Fierer et al., 2006].
Furthermore, the variability is due to climatic adaptation, whereby cold-adapted soils have a
lower temperature sensitivity than soils from warmer regions [Dutzler-Franz, 1981;
Fierer et al., 2006].
Net N mineralization appears to be less temperature sensitive than C mineralization
(especially at low temperature) when using data of a wide range of incubation temperatures
and different soils [Kirschbaum, 1995; Kirschbaum, 2000]. Since most ecosystems are
N limited, a low temperature dependence of activities in the N cycle could also be an
adaptation to maintain sufficient nutrient supply, especially during cold seasons. Since
N mineralization depends on the C- to N ratio of substrate, the high variability is also linked to
chemical soil properties. So far, no efforts have been made to relate the temperature
sensitivity of gross N mineralization to substrate quality of soil organic matter. Moreover, no
investigations are available about the climatic adaptation on the temperature sensitivity of soil
N mineralization and the comparison of different N dynamics within a soil.
Differences in the temperature sensitivity between C- and N dynamics may cause a
decoupling of soil processes, leading to qualitative and/or quantitative changes of soil organic
matter with respect to global warming. Extra-cellular soil enzymes are involved in these
processes and catalyze the rate-limiting steps of decomposition and nutrient cycling
3 General introduction_______________________________________________________11
[Sinsabaugh, 1994]. In a recent study, Trasar-Cepeda et al. [2007] investigated the
temperature sensitivity of a wide range of enzyme activities within a given soil; they reported
differences in temperature sensitivity and temperature optimum. No comparison of
temperature effects on enzyme activities and the overall mineralization of C- and N pools has
yet been conducted.
3.3 References
Archibold, O.W. (1995), Ecology of World Vegetation, Chapman Hall, London.
Bouwman, A.F. (1990), Global distribution of the major soils and land cover types,
In: Bouwman, A.F. (Ed.), Soils and the Greenhouse Effect, John Wiley, New York.
Livingston, G.P., and G.L. Hutchinson (1995), Enclosure-based measurement of trace gas
exchange: applications and sources of error, In: Matson, P.A., and R.C. Harrison (Eds.),
Biogenic Trace Gases: Measuring Emissions from Soil and Water. Blackwell Sciences
Ltd., Oxford.
Cernusca, A., and P. Decker (1989), Faktorenabhängigkeit der respiratorischen
Kohlenstoffverluste einer alpinen Grasheide (Caricetum Curvulae) in 2300 m MH in den
hohen Tauern, In: Cernusca et al. (Eds.), Veröffentlichungen des österreichischen
MaB-Programms, Band 13, 372-396.
Chapman, S.J., and M. Thurlow (1996), The influence of climate on CO2 and CH4 emissions
from organic soils, Agr. Forest Meteorol., 79, 205-217.
Chimner, R.A., and D.J. Cooper (2003), Carbon dynamics of pristine and hydrologically
modified fens in the southern Rocky Mountains, Can. J. Bot., 81, 477-491.
Conrad, R. (1996), Soil microorganisms as controllers of atmospheric trace gases (H2, CO,
CH4, OCS, N2O and NO), Microbiol. Rev., 60, 609-640.
Deppenmeier, U., Müller, V., and G. Gottschalk (1996), Pathways of energy conservation in
methanogenic archaea, Arch. Microbiol., 165, 149-163.
Diemer, M., and Ch. Körner (1998), Transient enhancement of carbon uptake in an alpine
grassland ecosystem under elevated CO2, Arct. Antarct. Alp. Res., 30 (4), 381-387.
Dutzler-Franz, G. (1981), Einfluss der Temperatur auf die mikrobielle Aktivität einiger Böden
aus der temperierten und hochalpinen Klimaregion, in: Bodenbiologische
Untersuchungen in den Hohen Tauern 1974-1978, In: Cernusca et al. (Eds.),
Veröffentlichungen des österreichischen MaB-Programms, Band 4.
Fierer, N., Colman, B.P., Schimel, J.P. and R.B. Jackson (2006), Predicting the temperature
dependence of microbial respiration in soil: A continental-scale analysis, Global
Biogeochem. Cycles, 20, GB3026, doi:10.1029/2005GB002644.

3 General introduction_______________________________________________________12
Hanson, R.S., and T.E. Hanson (1996), Methanotrophic Bacteria, Microbiol. Rev., 60 (2),
439-471.
Heimann, D., and V. Sept (2000), Climate Change estimates of summer temperature and
precipitation in the alpine region, Theor. Appl. Climatol., 66, 1-12.
Hirota, M., Tang, Y., Hu, Q., Hirata, S., Kato, T., Mo, W., Cao, G., and S. Mariko (2004),
Methane emissions from different vegetation zones in a Quinghai-Tibetan plateau
wetland, Soil Biol. Biochem., 36, 737-748.
Hirota, M., Tang, Y., Hu, Q., Hirata, S., Kato, T., Mo, W., Cao, G., and S. Mariko (2006),
Carbon dioxide dynamics and controls in a deep-water wetland on the Quinghai-Tibetan
Plateau, Ecosystems, 9, 673-688.
IPCC 2001, Developing and applying scenarios, In: J.J McCarthy et al. (Eds.), Climate
Change 2001: Impacts, Adaptation & Vulnerability, Contribution of Working Group II to the
Third Assessment Report of the Intergovernmental Panel on Climate Change,
Cambridge, UK: Cambridge University Press.
Kätterer, T., Reichstein, M., Andrén, O., and A. Lomander (1998), Temperature dependence
of organic matter decomposition: a critical review using literature data analyzed with
different models, Biol. Fertil. Soils, 27, 258-262.
Kato, T., Tang, Y., Gu, S., Cui, X., Hirota, M., Du, M., Li, Y., Zhao, X., and T. Oikawa (2004),
Carbon dioxide exchange between the atmosphere and an alpine meadow ecosystem on
the Qinghai-Tibetan Plateau, China, Agr. Forest Meteorol., 124, 121-134.
Kelker, D., and J. Chanton (1997), The effect of clipping on methane emissions from Carex,
Biogeochemistry, 39, 37-44.
Kirschbaum, M.U.F. (2000), Will changes in soil organic carbon act as a positive or negative
feedback on global warming, Biogeochemistry, 48, 21-51.
Kirschbaum, M.U.F. (1995), The temperature dependence of soil organic matter
decomposition, and the effect of global warming on soil organic C storage, Soil Biol.
Biochem., 27 (6),753-760.
Körner, Ch. (1999), alpine plant live. Functional plant ecology of high mountain ecosystems.
Springer, Berlin.
Lloyed, J., and J.A. Taylor (1994), On the temperature dependence of soil respiration, Funct.
Ecol., 8, 315-323.
Mast, M.A., and K.P. Wickland (1998), Winter fluxes of CO2 and CH4 from subalpine soils in
Rocky Mountain National Park, Colorado, Global Biogeochem. Cycles, 12 (4), 607-620.
Post, W.M., Emanuel, W.R., Zinke, P.J., and A.G., Stangenberger (1982), Soil carbon pools
and world life zones. Nature, 298, 156-159.
Sinsabaugh, R.L. (1994), Enzymatic analysis of microbial pattern and process, Biol. Fertil.
Soils, 17, 69-74.
3 General introduction_______________________________________________________13
Schmidt, S.K., West, A.E., Brooks, P.D., Smith, L.K., Jaeger, Ch.H., Fisk, M.C., and
A.H. Holland (2001), Soil-atmosphere gas exchange, In: Bowman, W.D., and
T.R. Seastedt (Eds.), Structure and function of an alpine ecosystem: Niwot Ridge
Colorado. Oxford University Press.
Trasar-Cepeda, C., Gil-Sotres, F., and M.C. Leirós (2007), Thermodynamic parameters of
enzymes in grassland soils from Galicia, NW Spain, Soil Biol. Biochem., 39, 311-319.
Turunen, J., Tomppo, E., Tolonen, K., and A. Reinikainen (2002), Estimating carbon
accumulation rates of undrained mires in Finland-application to boreal and subarctic
regions. The Holocene, 12, 69-80.
de Visscher, A., and O. van Cleemput (2003), Induction of enhanced CH4 oxidation in soils:
NH4+ inhibition patterns, Soil Biol. Biochem., 35, 907-913.
Welker, J.M., Brown, K.B., and J.T. Fahnestock (1999), CO2 flux in arctic and alpine dry
tundra: Comparative field responses under ambient and experimentally warmed
conditions, Arct. Antarct. Alp. Res., 31 (3), 272-277.
West, A.E., Brooks, P.D., Fisk, M.C., Smith, L.K., Holland, E.A., Jaeger, C.H., Babcock, S.,
Lai, R.S., and S.K. Schmidt (1999), Landscape patterns of CH4 Fluxes in an alpine tundra
ecosystem, Biogeochemistry, 45, 243-264.
Wickland, K.P., Striegl, R.G., Mast, M.A., and D.W. Clow (2001), Carbon gas exchange at a
southern Rocky Mountain wetland, 1996-1998, Global Biogeochem. Cycles, 15, 321-335.

4 Outline of the thesis_____________________________________________________ _14
4 Outline of the thesis
Investigations about climate-relevant trace gas emissions from alpine regions are still rare.
The objectives of this study were to quantify net CH4 and net CO2 fluxes from alpine sites in
the Eastern Alps, Austria. The aim was to identify abiotic and biotic drivers influencing the
diurnal and seasonal net fluxes of these climatically relevant trace gases in alpine
environemnt. The third part of this thesis deals with the temperature sensitivity of different
soil activities of the C- and N cycling in order to deepen our understanding of temperature
effects on nutrient cycling in alpine soils.
Four study sites (2250 m a.s.l.) in the Eastern Alps, Austria, were selected for analysis: one
alpine meadow site (used as pasture) and three fen sites following a natural water gradient.
All study sites are characterized by different plant communities representing quasi-stable
major ecosystem stages being developed for 5000 to 10000 years.
In the first and second part of this thesis, the diurnal and seasonal variation of net CH4 and
net CO2 fluxes were measured in a field study using the “closed chamber method” over an
entire period of 24 months. Net fluxes were related to potential drivers: soil temperature
(in 5, 15, 35 cm), water-filled pore space (in 5 cm), water table position, radiation and
above-ground standing plant biomass. Based on empirical models, we upscaled trace gas
emissions to quantify diurnal and seasonal (snow-free, snow period) flux in order to gain
information about the annual C budget in this alpine region.
In alpine environments, temperature is important for regulating biological processes. In the
third part of the thesis, the temperature sensitivities (0-30°C) of activities in the C- and
N cycle (C-, N mineralization and enzyme activities of the C- and N cycle) were determined
for three seasons (summer, autumn, winter). It was hypothesized that (i) C mineralization
has a higher temperature sensitivity than N mineralization, (ii) the temperature sensitivity of
both activities depends on substrate quality of the soil organic matter, (iii) all activities of the
winter sampling are less temperature dependent than during the vegetation period and (iv)
that the relative temperature sensitivity of all activities increases with decreasing
temperature.

5 Seasonal and diurnal net methane emissions of the Eastern Alps___________________15
5 Seasonal and diurnal net methane emissions from organic soils
of the Eastern Alps, Austria: effects of soil temperature, water
balance and plant biomass
5.1 Abstract
Although the contribution of methane emission to global change is well recognized, analyses
of net methane emissions derived from alpine regions are rare. Therefore, three fen sites
differing in water balance and plant community, as well as one dry meadow site, were used
to study the importance of soil temperature, water table and plant biomass as controlling
factors for net methane emission in the Eastern Alps, Europe during a period of 24 months.
Average methane emissions during snow-free periods in the fen ranged between 19 and
116 mg CH4 m-2 d-1. Mean wintertime emissions were much lower and accounted for
18 to 59% of annual flux. The alpine dry meadow functions as a methane sink during
snow-free periods, with mean flux of -2.1 mg CH4 m-2 d-1 (2003) and -1.0 mg CH4 m
-2 d-1
(2004). Seasonal methane emissions of the fen were related to soil temperature and
groundwater table. During the snow-free periods the water table was the main control for
seasonal methane emission. The net methane flux related to water table was much higher
for the distinctly drier year 2003 than for the wetter year 2004. Methane emissions differed
diurnally at sites where the water table position was high or very low. The influence of total
above-ground biomass on methane emission was apparent only for those sites with high
water table positions. Seasonal and diurnal methane uptake of the dry meadow was related
to soil temperature and water-filled pore space, whereas plant biomass did not significantly
influence methane fluxes. Our studies gave evidence that fens in the Eastern Alps act as a
source of methane throughout the whole year and that a dry meadow site act as net methane
sink during snow-free periods.

5 Seasonal and diurnal net methane emissions of the Eastern Alps___________________16
5.2 Introduction
Methane is an important greenhouse gas and the atmospheric concentration has increased
(0.8% a-1) during the past few decades more than CO2 (0.5% a-1) [Moisier et al., 1998].
Methane emission from wetlands accounts for roughly 70% of natural methane sources
[Khalil, 2000]. Recent studies of methane sources have focused on high-latitude wetlands
because they store about 30% of the global carbon pool in the soil [Gorham, 1991]. Methane
emissions from alpine tundra regions are often compared with northern tundra ecosystems.
Our knowledge of net methane emissions from alpine environments, however, is only limited
to North America [Chimner and Cooper, 2003; Mast et al., 1998; West et al., 1999;
Wickland et al., 2001] and to recent investigations in the Tibetan Plateau [Hirota et al., 2004].
Model estimations from ecosystems across the entire pan-arctic region (area north of 45°N)
revealed a net methane flux of 51.0 Tg CH4 a-1 including a small net gain for Austria of
0 to -1 g CH4 m-2 a-1 [Zhuang et al., 2004]. A wide range of mean daily net methane fluxes
from various alpine dry or wet tundra (-0.77 mg CH4 m-2 d-1 to 8.45 mg CH4 m-2 d-1) and
alpine wetlands (33 mg CH4 m-2 d-1 to 251 mg CH4 m
-2 d-1) have been reported. However,
there are no available data for net methane flux from alpine environments of the European
Alps. Since alpine tundra covers an area of roughly 10.5 million km2 globally [Archibold,
1995] and the variability of net methane fluxes from alpine ecosystems is high, more precise
investigations are necessary to estimate the role of alpine environments for the global CH4
budget.
In general, methane flux rates from wetlands are the net result of CH4 production
(anaerobic), CH4 oxidation (aerobic) and CH4 transport from belowground to the atmosphere
[Bubier and Moore, 1994; Conrad, 1996]. The main controls for various methane-emitting
environments are water table, temperature [Bubier et al., 2005; Rask et al., 2002] but also
peat chemistry [Yavitt et al., 2005]. In addition, plant community and plant biomass have
been found to influence net methane emissions considerably [Bellisario et al., 1999;
Schimel, 1995].
Methane is released from soils either from ebullition of biogenic gas bubbles, diffusion or
plant-mediated transport [e.g. Bubier and Moore, 1994]. The diffusion of methane is only
important for aerated soil pores because diffusion in air is 104 times higher than in water
[Schachtschabel et al., 1998]. The role of plant communities may be important, since
diffusion of methane via plants may account for 37 to 100% of total net methane flux in
various moist tundra regions and wetlands [Schimel, 1995; Kelker and Chanton, 1997;
Hirota et al., 2004]. Diurnal variations of net methane emissions have been investigated for
various methane-emitting environments [Mikkelä et al., 1995; Thomas et al., 1998]. Diurnal
emission patterns have been related to radiation, plant biomass, soil temperature or redox
potential. So far, only a few plant species or plant communities have been investigated.

5 Seasonal and diurnal net methane emissions of the Eastern Alps___________________17
Hence, the overall daily variation of methane emission remains poorly understood; but it
often differs considerably between vegetation types and depends on total plant biomass and
soil water conditions.
In well-drained soils, methanotrophs can utilize atmospheric CH4 (1.75 ppm) for biomass
production. These adapted “high affinity” methanotrophs are related, but not identical, to
type II methanotrophs and are different from those (“low affinity” methanotrophs) of wetlands
[Conrad, 1996]. Hence, unsaturated soils represent the only biological net sink for
atmospheric methane, in contrast to wetlands [Conrad, 1996]. Alpine tundra ecosystems
have been found to act as net sinks and sources for atmospheric methane depending on the
moisture conditions and soil temperature [Mast et al., 1998; Wickland et al., 1999;
West et al., 1999].
The objectives of this study were to (I) quantify the seasonal variation of net methane
emissions and (II) determine key factors controlling the diurnal and seasonal patterns of net
methane emission derived from soils of the alpine zone in the European Alps. Four study
sites (dry meadow and three sites in a fen) differing in vegetation type and water balance
were selected and monitored over a period of two years.
5.3 Material and methods
5.3.1 Study area
This research was conducted in the Ötztal range (46°50´N, 11°03´E) in Tyrol, Austria, at an
altitude of 2250 m a.s.l. The research area lies in the Rotmoos valley above the present tree
line (Fig. 5.1B). The valley is flanked by the mountain Hohe Mut (2659 m a.s.l.) and the
mountain Hangerer (3021 m a.s.l.) and is exposed south to northwest. According to
Hoinkes and Thöni [1993], the principal basic material consists mainly of mica slate and
silicate. The climate has a continental character with cool summers and cold, snowy winters.
The snow-free period is about 4.5 months (June to mid-October) (M. Strobel, University of
Innsbruck, personal communication) with a mean annual precipitation of 820 mm
(1970-1996). The mean annual air temperature for 1997-1998 was -1.3°C [Kaufmann, 2001].
The study sites are located in the Rotmoos fen (Fig. 5.1C). The Rotmoos measures 8.5 ha,
with an average peat depth of 1.5 m (range 0.5-2.9 m) [Rybníček and Rybníčková, 1977]
(Fig. 5.1D). It is fed mainly by the water flowing down the hill slopes of the flanking
mountains. The peat water drains into the glacial stream of the Rotmoosferner glacier. The
oldest organic layer at the bottom of the peat is around 5200 years old
[Bortenschlager, 1970]. During peat formation the Rotmoos was periodically overwhelmed
with 15 layers (1-27 cm) of silt or sand sediments (or both). The deepest and oldest layer is

5 Seasonal and diurnal net methane emissions of the Eastern Alps___________________18
eolian while the others were glacial or colluvial [Rybníček and Rybníčková, 1977]. Nearly all
sediment layers are located 2 m below the peat surface.
Figure 5.1: (A) Geographical position of the study area in the European Alps (A=Austria, CH=Switzerland, D=Germany, F=France, FL=Liechtenstein, I=Italy, SLO=Slovenia). (B) Distribution of alpine fens in the study area (black locations); the gray area in the map represents the potential tree area below 2250 m a.s.l. (C) Position of the study sites outside and within the Rotmoos fen. (D) Peat profile of the Rotmoos fen (only major sediment layers are illustrated) (Fig. 5.1B - 5.1D modified from Rybníček and Rybníčková, 1977).
5.3.2 Study sites
Four study sites were chosen (one alpine dry meadow and three sites in the Rotmoos fen).
They differ in water balance and vegetation community. All sites have a southwest exposure
and 1-4° slope. The study sites are traditionally used as a pasture for sheep and horses. At
the dry meadow site, these domestic animals were more frequent compared to the fen sites.
The first site is an alpine meadow (meadow), which was classified as a Curvulo-Nardetum
(G.-H. Zeltner, University of Hohenheim, personal communication) and is relative rich in
herbs. The soil (maximum depth 50 cm) is a Cambisol out of loamy sand over scree.
The meadow is well-drained over the snow-free period, and 90% (10% small boulders) of the
soil surface is covered by vegetation. The herbs here are Alchemilla vulgaris L.,

5 Seasonal and diurnal net methane emissions of the Eastern Alps___________________19
Anthoxanthum odoratum L., Anthyllis vulneraria L., Campanula cochlearifolia Lamk.,
Campanula scheuchzeri Vill., Dianthus carthusianorum L., Euphrasia alpina Lamk.,
Euphrasia minima Jacq. Ex. DC., Gentiana ramosa L., Geum montanum L., Hippocrepis
comosa L., Leonthodon helveticus Mérat, Ligusticum mutellina (L.) Crantz, Phyteuma
hemisphaericum L., Potentilla aurea L., Rhinantus angustifolius C.C. Gmelin, Silene vulgaris
(Moench.) Garcke. Grass species are Carex curvula All., Carex flava L., Carex
sempervirens Vill., Deschampsia cespitosa (L.) P.B., Luzula campestris (L.) DC., Nardus
stricta L., Poa alpina L. The shrubs are Calluna vulgaris (L.) Hull, Salix herbacea L.,
Rhododendron ferrugineum L. and Vaccinium myrtillus L. The surface cover of each species
was less than 5%, except for Nardus stricta (10%).
The second study site (transitional) is located in the transition area between meadow and the
Rotmoos fen. The vegetation is described as a Carici echinatae-Trichophoretum caespitosi
community [Rybníček and Rybníčková, 1977]. Additionally, a relative high cover of plant
species belonging to Curvulo-Nardetum was observed. The surface of the transitional site is
completely covered by vegetation, with the dominant species (and their cover) being,
Herbs: Bartsia alpina L. (<5%), Homogyne alpina (L.) Cass. (<5%), Leonthodon hispidus L.
(<5%), Ligusticum mutellina (5%), Potentilla aurea (10%), grass species: Carex echinata
Murray (5%), Eriophorum angustifolium Honck. (20%), Nardus stricta (20%), Trichophorum
caespitosum (L.) Hartman (30%), shrubs: Calluna vulgaris (<5%). The third site (fen) is
located in the Rotmoos fen and is characterized by a typical Carici echinatae-Trichophoretum
caespitosi plant community. The fen site has lower species richness than the transitional site.
Dominant species and their cover (in parentheses) are Carex echinata (5%), Carex nigra (L.)
Reichard (<5%), Eriophorum angustifolium (40%) and Trichophorum caespitosum (60%).
The fourth study site (wet fen) is located in the centre of the Rotmoos fen and consists solely
of Carex nigra, which covers 30% of the soil surface. This site can be temporarily flooded by
groundwater. All soils of the Rotmoos fen (transitional, fen and wet fen) were classified as
Rheic Histosols, with observed soil depths deeper than one meter (Fig. 5.1D).
5.3.3 Methane measurements
The methane flux rates were measured using the static closed chamber method. During the
snow-free period, we used chambers consisting of a quadratic frame (40 cm x 40 cm x
30 cm) and a lid with an inserted septum. The chambers were equipped with a small
battery-driven fan that allowed circulation of the enclosed air. The material was acrylic glass,
highly porous for photosynthetic active radiation (89%). Three chambers per site were
carefully inserted 3 cm into the soil at least 15 h before each measurement started. Because
of moderate grazing (sheep and horses) the frames had to be removed between the
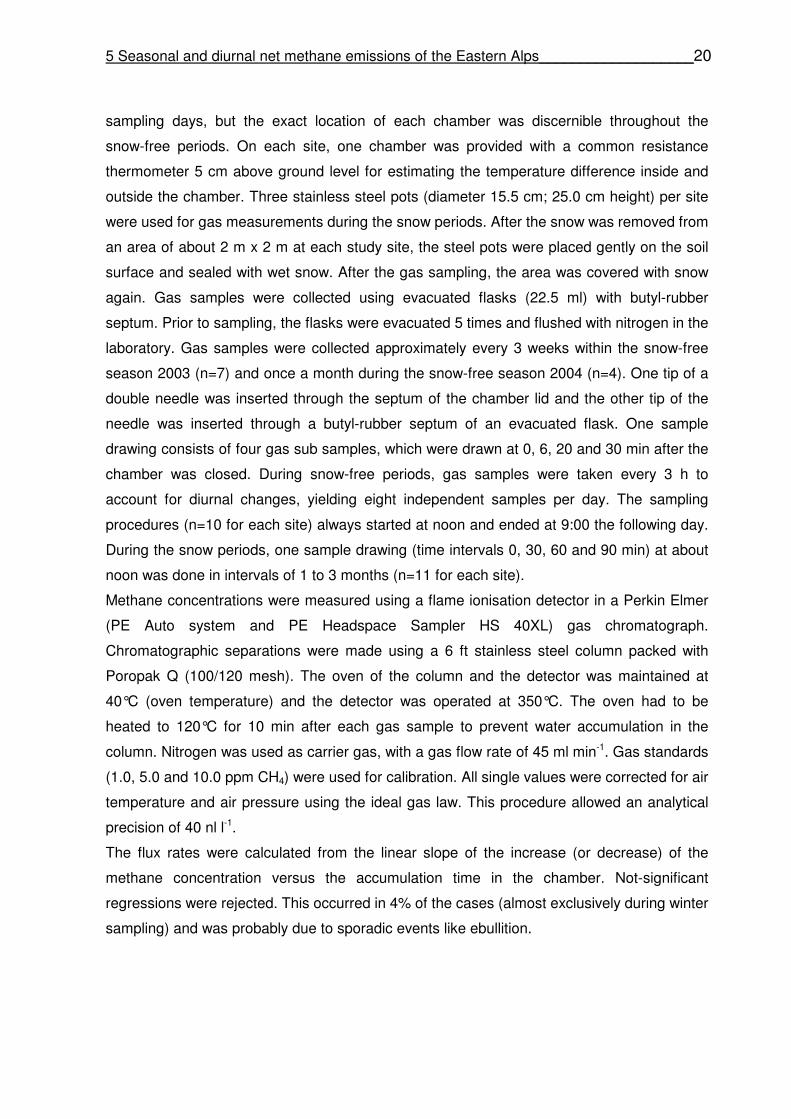
5 Seasonal and diurnal net methane emissions of the Eastern Alps___________________20
sampling days, but the exact location of each chamber was discernible throughout the
snow-free periods. On each site, one chamber was provided with a common resistance
thermometer 5 cm above ground level for estimating the temperature difference inside and
outside the chamber. Three stainless steel pots (diameter 15.5 cm; 25.0 cm height) per site
were used for gas measurements during the snow periods. After the snow was removed from
an area of about 2 m x 2 m at each study site, the steel pots were placed gently on the soil
surface and sealed with wet snow. After the gas sampling, the area was covered with snow
again. Gas samples were collected using evacuated flasks (22.5 ml) with butyl-rubber
septum. Prior to sampling, the flasks were evacuated 5 times and flushed with nitrogen in the
laboratory. Gas samples were collected approximately every 3 weeks within the snow-free
season 2003 (n=7) and once a month during the snow-free season 2004 (n=4). One tip of a
double needle was inserted through the septum of the chamber lid and the other tip of the
needle was inserted through a butyl-rubber septum of an evacuated flask. One sample
drawing consists of four gas sub samples, which were drawn at 0, 6, 20 and 30 min after the
chamber was closed. During snow-free periods, gas samples were taken every 3 h to
account for diurnal changes, yielding eight independent samples per day. The sampling
procedures (n=10 for each site) always started at noon and ended at 9:00 the following day.
During the snow periods, one sample drawing (time intervals 0, 30, 60 and 90 min) at about
noon was done in intervals of 1 to 3 months (n=11 for each site).
Methane concentrations were measured using a flame ionisation detector in a Perkin Elmer
(PE Auto system and PE Headspace Sampler HS 40XL) gas chromatograph.
Chromatographic separations were made using a 6 ft stainless steel column packed with
Poropak Q (100/120 mesh). The oven of the column and the detector was maintained at
40°C (oven temperature) and the detector was operated at 350°C. The oven had to be
heated to 120°C for 10 min after each gas sample to prevent water accumulation in the
column. Nitrogen was used as carrier gas, with a gas flow rate of 45 ml min-1. Gas standards
(1.0, 5.0 and 10.0 ppm CH4) were used for calibration. All single values were corrected for air
temperature and air pressure using the ideal gas law. This procedure allowed an analytical
precision of 40 nl l-1.
The flux rates were calculated from the linear slope of the increase (or decrease) of the
methane concentration versus the accumulation time in the chamber. Not-significant
regressions were rejected. This occurred in 4% of the cases (almost exclusively during winter
sampling) and was probably due to sporadic events like ebullition.

5 Seasonal and diurnal net methane emissions of the Eastern Alps___________________21
5.3.4 Hydrology
Groundwater tables were measured at every fen site (transitional, fen, wet fen) with
horizontally slotted (width 0.3 mm) PVC wells (total length 100 cm). One tube was installed
on each fen site with a standard bucket auger. The space between the tubes and the peat
soil was filled with silica sand (grain size 1.2-1.7 mm) to avoid accumulation of mud. The top
was sealed with a PVC cap to prevent the direct contact of the groundwater with
precipitation. Water tables were determined at every gas sampling date (n=22). Soil moisture
on the meadow site was measured hourly with a soil moisture sensor SMS3 (Cylobios,
Austria) at 5 cm below the soil surface. For calibrating the soil moisture sensor, three
undisturbed soil cores (100 cm3) were taken from 0-5 cm soil depth at every sampling date
during the snow-free periods. The volumetric water content (θ) was determined
gravimetrically after drying at 105°C for 48 h. For the conversion of the volumetric water
content to water-filled pore space (wfps), the maximum saturation water content [g cm-3] for
the soil depth was determined in the laboratory. Briefly, undisturbed soil cores (100 cm3; n=5)
were slowly saturated with degassed water over a 4-day period and weighed before and after
drying at 105°C for 48 h. A density for water of 1 g cm-3 was assumed and wfps [%] was
calculated by the proportion of water content to the maximum saturation water content.
Moisture data for the winter period were not used because values were not reliable due to
frozen water.
Groundwater samples for chemical analysis and for the determination of dissolved methane
concentration were taken from the PVC tubes at 20 cm below the water table. One sample
per site was taken at each sampling date. Before sampling, the water in the tubes was
pumped out and the soil solution that drained into the tubes was sampled after reaching the
prior water level. Groundwater samples were collected with a syringe. Evacuated flasks
(22.5 ml) were immediately filled one third and the remaining vacuum was balanced later
with pure N2 in the laboratory. The methane concentration in the headspace was measured
by the same GC procedure as described above and was related to the sampled water. The
amount of water and the corresponding headspace volume was determined gravimetrically.
Dissolved methane concentrations were corrected by the Bunsen solubility coefficient for
methane. All water samples for chemical analysis were filtered (PET 45/25; Macherey-Nagel,
Germany) and kept frozen until analysis. DOC was determined with a Dimatoc 100 TOC/TN-
analyzer, Dimatec, Germany, and ammonium and nitrate were photometrically determined.
The pH was measured potentiometrically.

5 Seasonal and diurnal net methane emissions of the Eastern Alps___________________22
5.3.5 Plant biomass
Above-ground standing plant biomass was determined for every sampling date during the
snow-free periods in 2003 and 2004. The plant biomass was calculated from 25 x 25 cm soil
surface areas. Five replicates for each site were collected after randomly positioned a frame
on the soil surface. After sampling, the plant material was stored in plastic bags and frozen at
-20°C until analysis. The green and non-green biomass was separated and oven dried at
60°C for 72 h before weighing. Only the green biomass was considered for above-ground
standing biomass.
5.3.6 Climate data
The climate data used in this study were provided by R. Kaufmann (University of Innsbruck;
personal communication). The weather station (2270 m a.s.l.) is located 2 km away from the
study sites, with an altitude difference of about 20 m. Air temperature, global radiation,
precipitation and relative humidity were recorded every 15 min. The soil temperature at every
study site was recorded hourly at 5 cm below the soil surface using temperature loggers
(UTL-1, Geotest AG, Switzerland). Since June 2003, temperature was additionally recorded
at 15 cm, as well as at 35 cm below the soil surface at all fen sites (transitional, fen, wet fen).
5.3.7 Statistics
In the snow-free periods, the net methane flux values per day [mg CH4 m-2 d-1] were obtained
by summarizing the diurnal measurements [mg CH4 m-2 h-1] of one day (n=8 per day). For the
snow periods the single measurement per day was assumed to be constant during the day.
The cumulative annual flux was roughly estimated by linear interpolation between the
sampling dates during the snow-free season and the mean flux during the snow periods
(which was not statistically different between sampling dates). The length of the snow-free
periods was defined as the time-frame between an abrupt increase and decrease of soil
temperature (5 cm soil depth). Water tables were linearly interpolated. All given errors are
standard errors.
The methane flux values were logarithmically transformed to obtain homogeneity of variance
(Levene´s test). Differences in the methane flux of meadow between the sampling dates
were tested by univariate analysis of variance. For the fen sites (transitional, fen, wet fen), a
simple two-factorial analysis of variance (time and site) was applied to quantify variations in
methane emissions according to sampling time and study site. The ANOVA was calculated
separately for each snow and snow-free period. Additionally, the effect of season and study

5 Seasonal and diurnal net methane emissions of the Eastern Alps___________________23
site on the plant biomass was quantified using simple two-factorial analysis of variance (time
and site). Stepwise multiple linear regression analyses were applied to evaluate the
relationship between methane flux rates and environmental properties. The data of the
seasonal and diurnal measurements were separated. The water table (transitional, fen,
wet fen), water-filled pore space (meadow), soil temperature (5 cm soil depth) and dissolved
methane concentration in the groundwater were used in the regression model to explain
seasonal net methane flux. For the diurnal net methane flux, water table (transitional, fen,
wet fen), water-filled pore space (meadow), soil temperature (5, 15, 35 cm soil depth), global
radiation and plant biomass were included in the model. Partial correlation analysis was
applied to determine the contribution of each environmental factor to the variation of methane
emissions, while holding the other remaining factors in the regression equation constant. All
calculations were carried out using Statistica 6.0 (StatSoft. Inc., Tulsa, USA).
5.4 Results
5.4.1 Climatic properties
The annual mean air temperature was -0.4°C (2003) and -1.3°C (2004). The mean annual
soil temperature (5 cm) ranged between 3.5°C (wet fen; 2004) and 4.6°C (wet fen; 2003)
(Fig. 5.2). The average snow-free period was 149 days (May 9 to October 5) and 123 days
(May 27 to October 4) for 2003 and 2004, respectively. Temperature and precipitation
differed considerably for both snow-free periods. The mean air temperature was
8.9°C (2003) and 6.4°C (2004). Precipitation during snow-free period was 276 mm (2003)
and 326 mm (2004). In contrast, the mean global radiation was more balanced, being
218 W m-2 and 207 W m-2 for 2003 and 2004, respectively. The mean soil temperature
ranged from 10.4°C (wet fen; -35 cm) to 13.0°C (transitional; -5 cm) and 8.4°C (wet fen;
-35 cm) to 10.9°C (transitional; -5 cm) for the snow-free periods 2003 and 2004, respectively.
Soil temperature showed large diurnal differences during the snow-free periods. The
maximum temperature in 5 cm soil depth occurred at about 14:00–15:00 (Central European
time) and minimum temperature at about 5:00–6:00. The maximum and minimum
temperatures in 15 cm soil depth were roughly four to six hours later than at 5 cm, and the
amplitudes between diurnal minimum and maximum temperature were much more
dampened with increasing soil depth. During the snow periods, mean soil temperature was
almost constant and ranged between 0.1°C (meadow, fen, wet fen) and 0.2°C (transitional)
(Fig. 5.2). Due to the insulation of the deep snow cover (maximum 235 cm), the absolute
minimum soil temperature (hourly recordings) reached -0.5°C in the topsoil. Neither diurnal
differences nor differences between study sites were observed during snow periods.

5 Seasonal and diurnal net methane emissions of the Eastern Alps___________________24
Figure 5.2: Time course of air temperature and soil temperature (5 cm depth) at the transitional site.
5.4.2 Hydrology
The interpolated average water table position for the entire study period increased in the
order transitional (-32 cm) > fen (-9 cm) > wet fen (+1 cm) (Tab 5.1). The water table
position for all fen sites remained almost constant during the winter (Fig. 5.3A). During the
snow-free periods, the water tables of all fen sites decreased, reaching minimum values in
August and then increasing again and remaining constant for the following winter period.
The decline was much more pronounced during the snow-free period 2003 than for 2004. At
meadow, the mean water-filled pore space (wfps) was much lower in 2003 (47%) than
in 2004 (66%) throughout the snow-free season (Tab. 5.1). Four distinctive desiccation
periods were observed in 2003, whereas wfps was much more balanced in 2004
(Fig. 5.3B).
Table 5.1: Mean values and interpolated values (interpol.) of water table (wt) at the transitional site (trans), the fen site (fen) and the wet fen site (wet fen) (as noted with the acronym:a); water-filled pore space (5 cm soil depth) (wfps) at the alpine meadow site (meadow) (as noted with the acronym:b) and the range of above-ground standing plant biomass (pb) for the entire study period and the snow-free periods 2003 and 2004.
Hydrology and plant biomass
entire study period (731 days) snow-free period 2003
(149 days) snow-free period 2004 (123 days)
transa fena wet fena transa fena wet fena meadowb transa fena wet fena meadowb
wta [cm] wfpsb [%]
mean -34 -12 -2 -53 -33 -19 47 -27 -8 -1 66 interpol. -32 -9 +1 -51 -31 -16 -19 -5 +3 pb [g m-2] min 81 33 19 54 65 7 4 96 max 239 204 64 242 290 222 71 237
-20
-10
0
10
20te
mpe
ratu
re [°
C]
airsoil (-5 cm)
O N D J F M A M J J A S O N D J F M A M J J A S
2002 2003 2004
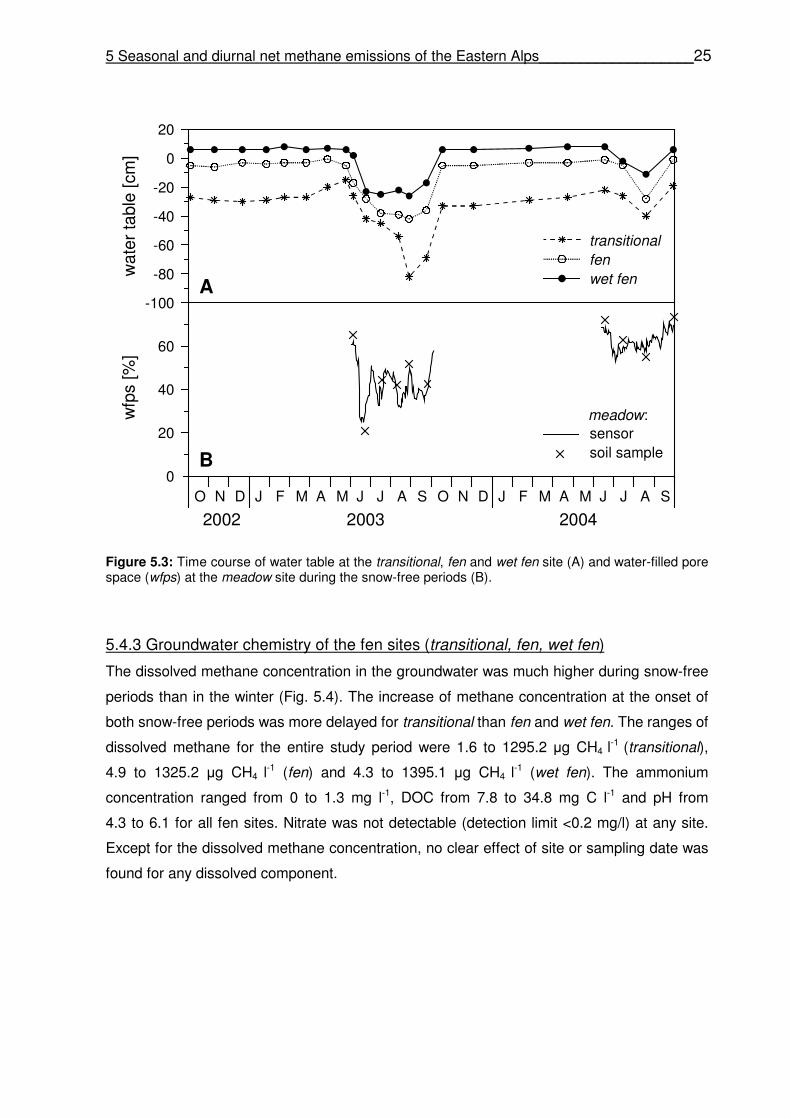
5 Seasonal and diurnal net methane emissions of the Eastern Alps___________________25
Figure 5.3: Time course of water table at the transitional, fen and wet fen site (A) and water-filled pore space (wfps) at the meadow site during the snow-free periods (B).
5.4.3 Groundwater chemistry of the fen sites (transitional, fen, wet fen)
The dissolved methane concentration in the groundwater was much higher during snow-free
periods than in the winter (Fig. 5.4). The increase of methane concentration at the onset of
both snow-free periods was more delayed for transitional than fen and wet fen. The ranges of
dissolved methane for the entire study period were 1.6 to 1295.2 µg CH4 l-1 (transitional),
4.9 to 1325.2 µg CH4 l-1 (fen) and 4.3 to 1395.1 µg CH4 l-1 (wet fen). The ammonium
concentration ranged from 0 to 1.3 mg l-1, DOC from 7.8 to 34.8 mg C l-1 and pH from
4.3 to 6.1 for all fen sites. Nitrate was not detectable (detection limit <0.2 mg/l) at any site.
Except for the dissolved methane concentration, no clear effect of site or sampling date was
found for any dissolved component.
-100
-80
-60
-40
-20
0
20w
ater
tabl
e [c
m]
0
20
40
60
wfp
s [%
]
meadow:
A
B
O N D J F M A M J J A S O N D J F M A M J J A S
2002 2003 2004
sensorsoil sample
transitionalfenwet fen

5 Seasonal and diurnal net methane emissions of the Eastern Alps___________________26
Figure 5.4: Time course of dissolved methane concentrations in groundwater (to maximum 1 m soil depth) at the transitional, fen and wet fen sites.
5.4.4 Plant biomass
The total green above-ground standing plant biomass was determined for the snow-free
periods. Peak biomass was reached during 2003 in mid-July on meadow, transitional and fen
and in late August on wet fen. The snow-free period in 2004 started about three weeks later
and maximum biomass was reached in August at all study sites. Plant biomass at wet fen
was much lower than at the other sites (Tab. 5.1). Significant differences for sampling date
and study site for both snow-free periods were found (2003: F(site)=83.55, P<0.001;
F(date)=49.25, P<0.001; F (site x date)=34.9, P<0.001; 2004: F(site)=74.55, P<0.001; F(date)=34.05,
P<0.001; F(site x date) =8.9, P<0.001).
5.4.5 Seasonal methane flux of the fen sites (transitional, fen, wet fen)
Seasonal methane emission was higher and more variable during the snow-free periods than
during winter (Fig. 5.5A). For the snow periods the net methane flux was two orders of
magnitude lower than during the snow-free periods. In winter, the mean methane emission
was 14±11 mg CH4 m-2 d-1 for transitional, 15±11 mg CH4 m-2 d-1 for fen and
13±11 mg CH4 m-2 d-1 for wet fen. No significant differences between study sites and
sampling dates were found (F(site)=0.42, P=0.659, F(date)=0.45, P=0.897; F(site x date)=0.39,
P=0.984). In the snow-free periods, transitional had the lowest emission rate, followed by fen
and wet fen (Tab. 5.2, Fig. 5.5A). Significant differences between sampling dates and study
sites were found for the snow-free period 2003 (F(site)=130.02, P<0.001, F(date)=18.61,
P<0.001; F(site x date)=10.05, P<0.001), whereas only significant differences between study
0
250
500
750
1000
1250
1500C
H4
[µg
l-1]
O N D J F M A M J J A S O N D J F M A M J J A S
2002 2003 2004
transitionalfenwet fen

5 Seasonal and diurnal net methane emissions of the Eastern Alps___________________27
sites were detected in 2004 (F(site)=8.24, P=0.002, F(date)=0.39 P=0.765, F(site x date)=0.05,
P=0.999). The cumulative annual methane flux for 2003 at transitional was 7 g CH4 m-2 a-1
(snow period 47%), followed by 14 g CH4 m-2 a-1 (snow period 31%) for fen and
15 g CH4 m-2 a-1 (snow period 27 %) for wet fen. For 2004 the cumulative annual methane
emission was 6 g CH4 m-2 a-1 (snow period 59%) for transitional, 13 g CH4 m-2 a-1
(snow period 29%) for fen and 17 g CH4 m-2 a-1 (snow period 18%) for wet fen.
5.4.6 Seasonal methane flux of the dry alpine meadow (meadow)
The alpine meadow was a net sink for atmospheric methane during the snow-free periods,
whereas no detectable methane emission or consumption was found for the snow periods
(Fig. 5.5B). The net methane consumption during the two snow-free periods differed
considerably, being higher in 2003 than in 2004 (Tab. 5.2). The net methane flux differed
significantly between sampling dates in 2003 (F(date)=6.28; P=0.004), but not in 2004
(F(date)=1.24, P=0.38).
Figure 5.5: Time course of net methane emissions at the transitional, fen and wet fen sites (A) and the meadow site (B).
0
25
50
75
100
125
CH
4 [m
g m
-2 d
-1]
-4
-3
-2
-1
0
CH
4 [m
g m
-2 d
-1]
O N D J F M A M J J A S O N D J F M A M J J A S
2002 2003 2004
A
B
150
transitionalfenwet fen
meadow

5 Seasonal and diurnal net methane emissions of the Eastern Alps___________________28
Table 5.2: Mean net CH4 flux and standard error (se), mean of interpolated values (interpol.) and cumulative CH4 flux (cum. flux) at the transitional site (trans), the fen site (fen), the wet fen site (wet fen) and the alpine meadow site (meadow).
Seasonal net CH4 flux entire study period
(731 days) snow-free period 2003
(149 days) snow-free period 2004
(123 days)
trans fen wet fen trans fen wet fen meadow trans fen wet fen meadow
net CH4 flux [mg m-2 d-1] mean 19 46 57 28 76 89 -2.1 19 83 116 -1.0 se 5 13 10 4 18 18 0.5 2 18 20 0.2 interpol. 17 36 43 24 67 78 -1.9 19 71 112 -0.8 cum. flux [g m-2] 12 26 32 4 10 11 -0.3 2 9 14 -0.1
5.4.7 Controls of seasonal methane emission at the fen sites (transitional, fen,
wet fen)
Multiple linear regression analysis identified water table and soil temperature as major
controls of methane emission in alpine fen sites (Tab. 5.3B). The derived models explained
38% (transitional) to 76% (wet fen) of the seasonal variance. Seasonal methane emissions
during the entire study period tended to be positively related to soil temperature and water
table (Tab. 5.3A). The dissolved methane concentration had no influence on methane
emission at any study site.
For the snow-free periods, the water table was the most important environmental control for
within- and among-site variability of the seasonal net methane emission (Fig. 5.6). However,
this relationship differed considerably, being much higher for the dryer snow-free period 2003
than for 2004.
Table 5.3: Partial regression coefficients (A) and multiple linear models (B) for daily net methane emission of the entire study period (n=22 for the transitional, fen and wet fen sites; n=10 for the alpine meadow site). Dependent variable: ln transformed methane flux [mg CH4 m-2 d-1] (ln flux) for transitional, fen and wet fen and methane uptake [mg CH4 m-2 d-1] (flux) for meadow. Independent variables: water table [cm] (wt) (at transitional, fen, wet fen as noted with the acronym:a) and ln-transformed dissolved methane concentration [µg CH4 l
-1] (CH4aq), water-filled pore space [%] (wfps) (at meadow as noted with the acronym:b) and soil temperature [°C] at 5 cm soil depth (st5). Level of significance: P≤0.05 (*** P<0.001, ** P<0.01, * P≤0.05).
A Partial regression coefficients (R) of the daily net methane flux transitionala fena wet fena transitionala, fena, wet fena meadowb
wta wfpsb 0.59** 0.37 0.33 0.54* 0.57 st5 0.52* 0.61** 0.53* 0.50* -0.58 CH4aq -0.19 -0.17 0.20 -0.10 B Multiple linear models of the daily net methane flux transitional: ln flux = 0.023 wt + 0.048 st5 + 3.209 R = 0.61* fen: ln flux = 0.007 wt + 0.117 st5 + 2.912 R = 0.87*** wet fen: ln flux = 0.008 wt + 0.091 st5 + 1.952 R = 0.82*** transitional, fen, wet fen: ln flux = 0.022 wt + 0.107 st5 + 2.624 R = 0.74** meadow: flux = 0.038 wfps - 0.167 st5 - 1.658 R = 0.86**

5 Seasonal and diurnal net methane emissions of the Eastern Alps___________________29
Figure 5.6: Relation between water table and daily net methane flux at the transitional, fen and wet fen sites for the snow-free period 2003 (n=18) and 2004 (n=12). Second polynomial function was used for both regressions (* P≤0.5, ** P<0.01, *** P<0.001).
5.4.8 Controls of seasonal methane emission at the alpine dry meadow (meadow)
Partial regression analysis showed that seasonal net methane emission was positively
related to wfps and negatively related to soil temperature (Tab. 5.3A). The derived multiple
regression model explained 74% of the seasonal variance (Tab. 5.3B). Nonetheless, the
partial correlation coefficients were not significant for both variables.
5.4.9 Diurnal methane emission of the fen sites (transitional, fen, wet fen)
Diurnal changes in methane flux tended to be highest if the water table position was very
high or very low. No clear changes were found at intermediate water table positions. For
water-saturated soil conditions, methane flux was highest in the afternoon, whereas at low
groundwater level the methane flux was highest at night (Fig. 5.7). The biggest difference
between daily maximum and minimum methane emissions was found at water-saturated
conditions at wet fen, with methane emissions twice as high in the afternoon as at night. For
all study sites the average difference between the diurnal maximum and minimum methane
flux was 155%.
The water table was the most powerful control of diurnal methane flux, followed by soil
temperature (Tab. 5.4A). At transitional, methane emission was positively correlated with the
temperature in 35 cm soil depth, whereas at fen and wet fen the influence of temperature
was most significant in 15 cm soil depth. The above-ground plant biomass positively
influenced fen and wet fen, but not transitional. Global radiation was not important for any
study site. The empirical linear multiple regression model explained 61% (fen) to 69%
(transitional) of the variance (Tab. 5.4B).
0
25
50
75
100
125
150
-100 -80 -60 -40 -20 0
transitionalfenwet fen
CH
4 [m
g m
-2 d
-1]
2003 2004
water table [cm]
R=0.76**R=0.92***
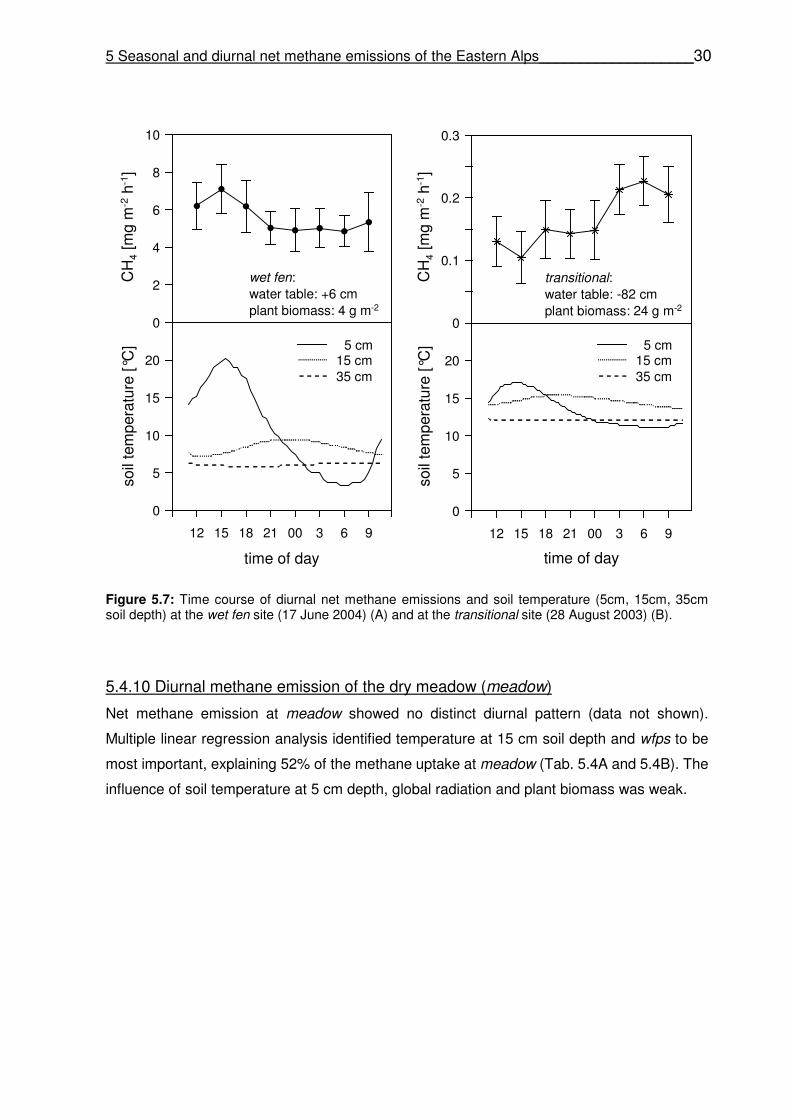
5 Seasonal and diurnal net methane emissions of the Eastern Alps___________________30
Figure 5.7: Time course of diurnal net methane emissions and soil temperature (5cm, 15cm, 35cm soil depth) at the wet fen site (17 June 2004) (A) and at the transitional site (28 August 2003) (B).
5.4.10 Diurnal methane emission of the dry meadow (meadow)
Net methane emission at meadow showed no distinct diurnal pattern (data not shown).
Multiple linear regression analysis identified temperature at 15 cm soil depth and wfps to be
most important, explaining 52% of the methane uptake at meadow (Tab. 5.4A and 5.4B). The
influence of soil temperature at 5 cm depth, global radiation and plant biomass was weak.
0
0.1
0.2
0.3
CH
4 [m
g m
-2 h
-1]
0
5
10
15
20
soil
tem
pera
ture
[°C
]
12 15 18 21 00 3 6 9
time of day
transitional:water table: -82 cmplant biomass: 24 g m-2
0
2
4
6
8
10
0
5
10
15
20
12 15 18 21 00 3 6 9
time of day
wet fen:water table: +6 cmplant biomass: 4 g m-2
5 cm15 cm35 cm
5 cm15 cm35 cm
CH
4 [m
g m
-2 h
-1]
soil
tem
pera
ture
[°C
]

5 Seasonal and diurnal net methane emissions of the Eastern Alps___________________31
Table 5.4: Partial regression coefficients (A) and multiple linear models (B) for all diurnal measurements during the snow-free periods (n=73-80 for each site). Dependent variable: ln transformed net methane flux [mg CH4 m
-2 h-1] (ln flux) for the transitional, fen and wet fen sites and methane uptake [mg CH4 m
-2 h-1] (flux) for the meadow site. Independent variables: water table [cm] (wt) (at transitional, fen and wet fen as noted with the acronym:a), water-filled pore space (5 cm soil depth) [%] (wfps) (at meadow as noted with the acronym:b), soil temperature [°C] (soil depth: 5 cm (st5), 15 cm (st15), 35 cm (st35)), global radiation [W m-2] (glob. rad.) and above-ground standing plant biomass [g m-2] (pb). Level of significance: P≤0.05 (*** P<0.001, ** P<0.01, * P<0.05).
5.5 Discussion
5.5.1 Environmental controls of seasonal methane emission at the fen sites
(transitional, fen, wet fen)
Seasonal methane flux was positively related to soil temperature and water table position.
Several studies confirm the importance of water table and soil temperature. However, the
influence for environmental properties can change seasonally or between study years
[Bubier et al., 2005; Shannon and White, 1994]. Q10 values derived from the multiple linear
regression models in this study were 1.6 (transitional), 3.1 (fen) and 2.6 (wet fen) or 2.9 if all
plots were pooled. These values fit to the lower range (1.6 to 11) of in situ data calculated by
simple Arrhenius equations from various water-saturated environments [Chapman and
Thurlow, 1996]. The water table was the main driver for net methane emissions during snow-
free periods. The water table fluctuation during 2003 was much more pronounced than
during 2004 and resulted in much higher net CH4 emission related to the water table depth
in 2003. Net methane flux was even observed at a water table position of -82 cm at the
transitional site. Chimner and Cooper [2003] found a similar pattern on a drained alpine fen
exposed to a large water table drop. A mean annual water table position of about -15 cm as
a critical threshold factor for zero net flux was found for temperate soils [Fiedler and
Sommer, 2000] and for several boreal ecosystems [Rask et al., 2002]. However, the history
of water table fluctuations may be crucial, leading to long- and short term effects for the
microbial community composition and function [Moore and Dalva, 1993; Shannon and White,
A Partial regression coefficient (R) of the diurnal net methane flux transitionala fena wet fena transitionala, fena, wet fena meadowb wta wfpsb 0.72*** 0.73*** 0.80*** 0.87*** 0.21 st5 0.01 -0.24* 0.30* 0.02 -0.13 st15 0.06 0.61** 0.40* 0.01 -0.22 st35 0.54** -0.16 0.01 0.62*** glob. rad. -0.07 0.06 0.12 -0.06 -0.14 pb 0.19 0.28* 0.54** -0.03 -0.10
B Multiple linear models of the diurnal net methane flux transitional: ln flux = 0.046 wt + 0.250 st35 + 0.425 R = 0.83*** fen: ln flux = 0.015 wt - 0.012 st5 + 0.074 st15 + 0.001 pb+ 0.619 R = 0.78*** wet fen: ln flux = 0.033 wt + 0.017 st5 + 0.052 st15 + 0.008 pb+ 0.618 R = 0.81*** transitional, fen, wet fen: ln flux = 0.053 wt + 0.191 st35 + 0.014 R = 0.87*** meadow: flux = 0.004 wfps - 0.234 st15 - 0.342 R = 0.72***
5 Seasonal and diurnal net methane emissions of the Eastern Alps___________________32
1994]. During a three-year study, Shannon and White [1994] found long-term effects after a
desiccation period during the summer: methane flux was influenced even for the subsequent
snow-free period. Large fluctuations in the water table may cause long-term effects by
disturbing the location of an effective methanotroph population. This is because the highest
methanotrophic activity in wetland soils is often found around the mean standing water table
position [Conrad, 1996]. In contrast, the spatial distribution of strictly anaerobic methanogens
may be limited to deeper soil layers [Chimner and Cooper, 2003]. Besides the altering of the
microbial community, temporarily aerated soils may also favour the formation of alternative
electron acceptors (sulphate, nitrate, ferric iron), which play a greater role in overall
anaerobic respiration than methanogenesis [Conrad, 1996; Moore and Dalva, 1993]. On the
other hand, the water table may also imply short-term effects for flooded soils. Enhanced
methane flux from a Canadian wetland ecosystem could be observed after the water table
dropped below the soil surface probably due to the reduced resistance of methane transfer in
air [Bellisario et al., 1999]. Furthermore, a dropping water table from submerged soils
uncovers plant parts responsible for plant-mediated CH4 emissions [Kelker and Chanton,
1997]. In our study, methane fluxes related to the water table position were lower for the
snow-free period 2004 than for 2003, indicating more long-term effects caused by the severe
desiccation in 2003.
5.5.2 Environmental controls of diurnal methane emission at the fen sites
(transitional, fen, wet fen)
Diurnal differences of methane emission were only apparent for low or high water tables.
Low water tables increased methane flux during the night, whereas at high water tables
methane flux peaked together with the temperature of the topsoil in the afternoon. Similar
results were obtained for boreal wetlands in north Sweden, with higher night time flux for
drained sites but smaller differences at high water tables [Mikkelä et al., 1995]. The influence
of temperature on diurnal methane emission differed with soil depth. The net flux at the driest
fen site (transitional) was controlled more by temperature in deeper soil layers, whereas fen
and wet fen, with higher water tables, were controlled more by temperature in shallower soil
depths. The importance of soil temperature may be influenced by standing water table,
because anearobic methane production is linked to water-saturated soil conditions.
According to Rask et al. [2002], stronger positive correlations of net methane flux with
temperature at certain soil depths indicate the main location of CH4 formation; this agrees
with our results. The negative relationship between net methane flux and the topsoil

5 Seasonal and diurnal net methane emissions of the Eastern Alps___________________33
temperature at the fen study site can be explained by the highest methane oxidation potential
just above standing water table [Conrad, 1996].
Total above-ground plant biomass had no significant influence on diurnal methane emission
for the driest fen site, transitional, but the influence increased with higher mean water table
positions of fen and wet fen. The lack of influence for transitional may be attributed to the
deeply aerated upper soil layer. Hence, the proportion of plant-mediated methane flux should
be low and less important than at wetter ecosystems [Kutzbach et al., 2004]. The partial
influence of total plant biomass was eight times higher for wet fen than for fen. This leads to
the assumption that the Carex nigra-dominated wet fen has a more pronounced effect on
plant-derived methane flux than the Trichophorum caespitosum-dominated fen.
Trichophorum caespitosum has a relative shallow root system with no root aerenchyma and
tolerates saturated but not flooded soil conditions [Bragazza and Gerdol, 1996]. In contrast,
the Carex species and Eriophorum angustifolia have distinctive root aerenchyma down to
about 80 cm and may therefore more important for methane transport via plants in the fen
and wet fen. Evidence for species-specific methane transport is given by Schimel [1995],
who showed that the plant-mediated methane transport of Eriophorum angustifolia was
higher than that of Carex aquatilis. The greater influence of plant biomass on methane flux at
wet fen compared to fen might also be attributed to passive methane transport by diffusion,
as reported for different Carex species and several sedges [Hirota et al., 2004; Kelker and
Chanton, 1997; Kutzbach et al., 2004].
Global radiation was not correlated with diurnal methane flux. Accordingly, methane flux
seems not to be controlled by stomata conductivity. Field studies have shown different
results in relation to radiation. Hirota et al. [2004] found no response of Carex allivescers
V. Krez. to radiation, in contrast to the response of different sedges. In a laboratory
experiment, Thomas et al. [1998] reported that plant-mediated methane transport from Carex
species and Eriophorum species largely responded to light under constant temperature due
to higher stomata conductance. The authors concluded that the diurnal temperature course
might mask the stomata effect for in situ measurements. Since many alpine plants have their
maximum diurnal stomatal conductivity in the afternoon [Körner and Mayr, 1981] together
with the maximum diurnal soil temperature, this effect could explain the lack of a relationship
between global radiation and net methane flux in our study.

5 Seasonal and diurnal net methane emissions of the Eastern Alps___________________34
5.5.3 Environmental controls of methane oxidation at the alpine meadow site
(meadow)
The meadow site functions as a net sink for methane during snow-free periods. Diurnal and
seasonal net methane emissions were negatively correlated with temperature and positively
with water-filled pore space. Moreover, for diurnal net methane emissions, soil temperature
in 15 cm soil depth was more important than in 5 cm. Similar results were reported by
West et al. [1999] for alpine meadows in the Colorado Front Range. These results lead to the
assumption that atmospheric methane oxidation in alpine environments is located in deeper
soil layers as found for many other environments [Conrad, 1996]. The maximum atmospheric
methane oxidation in the deeper soil layer can be explained by the higher inorganic nitrogen
concentrations usually found in the topsoil, since ammonium is known to be a competitive
inhibitor for methane oxidation [de Visscher and van Cleemput, 2003].
5.5.4 Magnitude of methane flux at the fen sites (transitional, fen, wet fen)
The range of the mean seasonal net CH4 flux during the snow-free periods was
19 mg CH4 m-2 d-1 (transitional, 2004) to 116 mg CH4 m
-2 d-1 (wet fen, 2003), with a maximum
value of 145 mg CH4 m-2 d-1 at waterlogged soil conditions at wet fen. Mean net methane
emissions of the study sites in the Rotmoos fen were in the order wet fen > fen > transitional,
with mean water table levels having the same order. The estimated annual flux rates
corresponded to the lower range of flux values reported from alpine wetlands in the Rocky
Mountains [Chimner and Cooper, 2003; Mast et al., 1998; Wickland et al., 1999] and in the
Tibetan Plateau [Hirota et al., 2004]. The relatively low methane flux at wet fen may be partly
due to the low plant productivity, because 4% of the daily net CO2 assimilation is emitted as
methane as found for Canadian submerged wetlands [Bellisario et al., 1999].
The range of the mean net methane flux during the snow periods was remarkably similar
being 13 mg CH4 m-2 d-1 (wet fen) to 15 mg CH4 m
-2 d-1 (fen) with no obtained seasonal
differences. During the snow periods 2003/2004 the relatively constant soil temperature at all
fen sites in 15 cm and in 35 cm depth (0.3°C and 1.0°C, respectively) and the high and
constant water table levels may be responsible for similar net methane flux between study
sites and the lack of seasonal differences. In contrast, Mast et al. [1998] found differences in
methane flux rates for moist alpine (4.4 mg CH4 m-2 d-1) and water saturated soils
(45.9 mg CH4 m-2 d-1) in the Rocky Mountains. Much lower net methane flux (minimum
1.6 mg CH4 m-2 d-1) was obtained for an alpine wetland by Wickland et al. [1999]. These
differences of reported net methane flux during snow periods may be partly attributed to the
different gas measurement methods. A comparison of the chamber method with the snow-
5 Seasonal and diurnal net methane emissions of the Eastern Alps___________________35
gradient method resulted in higher net methane flux values if chambers were used
[Alm et al., 1999].
The contribution of wintertime emission to annual methane flux ranged from 18% (wet fen) to
59% (transitional). These values fit to the broad range observed for alpine wetland
ecosystems in the Rocky Mountains having similar length of snow-periods compared to our
study site [Mast et al., 1998; Wickland et al., 1999].
5.5.5 Magnitude of methane oxidation at the alpine meadow site (meadow)
The average net methane uptake at meadow differed considerably for the two investigated
snow-free periods, with much higher methane consumption for 2003 (-2.1 mg m-2 d-1) than
2004 (-1.0 mg m-2 d-1). In contrast to Sommerfeld et al. [1993], we found no methane flux at
snow-covered soil conditions. Methane consumption during the snow-free periods was
higher than mean values reported for several alpine tundra ecosystems (+8.5 to
-0.8 mg CH4 m-2 d-1) [Neff et al., 1994; West et al., 1999; Whalen and Reeburgh, 1990].
However, the net oxidation rates in this study were comparable with the range observed from
arctic tundra ecosystems [Christensen, 1993; Whalen and Reeburgh, 1992]. The higher rates
found in our study may be also caused by higher soil fertility due to the traditional use of the
study sites as pasture [Kruse and Iversen, 1995].
5.5.6 Global aspects of alpine methane flux
In the alpine zone of Austria (2000 m to 3800 m a.s.l.) wetlands cover about 0.14%
(5.5 km2), alpine grassland (meadow) about 78.3% (3150 km2) and forested land about
21.7% (875 km2) of the vegetation area [Steiner, 1992]. Within the Rotmoos fen, transitional,
fen and wet fen represent roughly 10%, 85% and 5%, respectively. If we extrapolate our data
to the alpine environment in Austria, we would expect, that alpine regions are a small net
sink for methane (-0.14 g CH4 m-2 a-1) in areas with no forest sites. So far, there are no data
from other alpine regions in Europe. This rough estimation agrees with findings from Niwot
Ridge, Colorado Rocky Mountains, acting as a small net methane sink [West et al., 1999].
West et al. [1999] estimated that the global alpine area (10.5 million km2) might be
responsible for -1 to +10 Tg CH4 a-1. Based on a model dealing with the entire pan-arctic
region, the entire European Alps may act as a small net sink of methane (0 to
-1 g CH4 m-2 a-1) [Zhuang et al., 2004]. There are still high uncertainties about net methane
fluxes from alpine regions and more investigations are necessary to estimate the role of
alpine areas in the global methane budget.

5 Seasonal and diurnal net methane emissions of the Eastern Alps___________________36
5.6 Conclusions
Abiotic environmental properties were mainly responsible for regulating seasonal and diurnal
net methane emissions of an alpine ecosystem. The influence of water table was found to be
most important for seasonal within- and among-site variability. The effect of temperature on
methane emission rates varied in the different soil depths presumably due to differences in
the vertical distribution of methanogenes and methane oxidizers. Our results indicate that
plant-mediated methane transport is only important for water saturated soil conditions,
whereas at drier soil conditions diffusion through the soil matrix becomes more important.
Methane fluxes during the winter period substantially contributed to the methane flux rate of
a year and should be considered in future studies. We conclude that alpine wetlands act as a
methane source, while well-drained alpine grassland could function as a net sink of methane
in the Eastern Alps of Europe. More investigations of methane fluxes from alpine landscapes
are necessary to evaluate the role of alpine areas in the global methane budget.
5.7 Acknowledgements
This research was financed by the DFG project 768. Support was also received from
R. Kaufmann, University of Innsbruck, who provided the climate data from the weather
station used in this study and from I. Oberleitner, Federal Environmental Agency of Austria,
who provided data of the distribution of wetlands in Austria. Additionally, we thank
M. Stachowitsch in editing the text and M. Strobel from the alpine research station Obergurgl
(University of Innsbruck, Austria) for technical support and hospitality during field
measurements.
5.8 References
Alm, J., Saarnio, S., Nykänen, H., Silova, J., and P. Martikainen (1999), Winter CO2, CH4 and
N2O fluxes on some natural and drained boreal peatlands, Biogeochemistry, 44, 163-186.
Archibold, O.W. (1995), Ecology of World Vegetation, Chapman Hall, London.
Bellisario, L.M., Bubier, J.L., and T.R. Moore (1999), Controls on CH4 emissions from a
northern peatland, Global Biogeochem. Cycles, 13 (1), 81-91.
Bortenschlager, S. (1970), Waldgrenz- und Klimaschwankungen im Pollenanalytischen Bild
des Gurgler Rotmooses, Mitteilungen der Ostalpin-Dinarischen Gesellschaft für
Vegetationskunde, 11, 19-26.
Bragazza, L., and R. Gerdol (1996), Response surface of species along water-table depth
and pH gradients in a poor mire on the southern Alps (Italy), Ann. Bot. Fen., 33, 11-20.

5 Seasonal and diurnal net methane emissions of the Eastern Alps___________________37
Bubier, J.L., and T.R. Moore (1994), An ecological perspective on methane emissions from
northern wetlands, Tree, 9 (12), 460-464.
Bubier, J., Moore, T., Savage, K., and P. Crill (2005), A comparison of methane flux in a
boreal landscape between a dry and a wet year, Global Biogeochem. Cycles, 19, GB
1023, doi: 10.1029/2004GB002351.
Chapman, S.J., and M. Thurlow (1996), The influence of climate on CO2 and CH4 emissions
from organic soils, Agr. Forest Meteorol., 79, 205-217.
Chimner, R.A., and D.J. Cooper (2003), Carbon dynamics of pristine and hydrologically
modified fens in the southern Rocky Mountains, Can. J. Bot., 81, 477-491.
Christensen, T.R. (1993), Methane emission from arctic tundra, Biogeochemistry, 21, 117-
139.
Conrad, R. (1996), Soil microorganisms as controllers of atmospheric trace gases (H2, CO,
CH4, OCS, N2O and NO), Microbiol. Rev., 60, 609-640.
Fiedler, S., and M. Sommer (2000), Methane emissions, groundwater table and redox
potentials along a gradient of redoximorphic soils in a temperate-humid climate, Global
Biogeochem. Cycles, 14, 1081-1093.
Gorham, E. (1991), Northern peatlands; role in the carbon cycle and probable responses to
climatic warming, Ecol. Appl., 1, 182-195.
Hirota, M., Tang, Y., Hu, Q., Hirata, S., Kato, T., Mo, W., Cao, G., and S. Mariko (2004),
Methane emissions from different vegetation zones in a Quinghai-Tibetan plateau
wetland, Soil Biol. Biochem., 36, 737-748.
Hoinkes, G., and M. Thöni (1993), Evolution of the Ötztal-Stubai, Scarl-Campo and Ulten
Basement Units, In: von Raumer, J.F., and F. Neubauer (Eds.), Pre-Mesozonic Geology
in the Alps. Springer, Berlin-Heidelberg.
Kaufmann, R. (2001), Invertebrate succession on an alpine glacier foreland, Ecology, 82,
2261-2278.
Kelker, D., and J. Chanton (1997), The effect of clipping on methane emissions from Carex,
Biogeochemistry, 39, 37-44.
Khalil, M.A.K. (2000), Atmospheric methane: an introduction, in: Khalil, M. (Ed.), Atmospheric
Methane: Its Role in the Global Environment, Springer, New York.
Körner, Ch., and R. Mayr (1981), Stomatal behaviour in alpine plant communities between
600 and 2600 meters above see level, in: Grace, J. et al. (Eds), Plants and their
atmospheric environment. Blackwell, Oxford.
Kruse, C.W., and N. Iversen (1995), Effect of plant succession, plowing, and fertilization on
the microbiological oxidation of atmospheric methane in a heathland soil, FEMS
Microbiol. Ecol., 18 (2), 121-128.

5 Seasonal and diurnal net methane emissions of the Eastern Alps___________________38
Kutzbach, L., Wagner, D., and E.-M. Pfeiffer (2004), Effect of microrelief and vegetation on
methane emission from wet polygonal tundra, Lena Delta, Northern Siberia,
Biogeochemistry, 69, 341-362.
Mast, M.A., Wickland, K.P., Striegl, R.T., and D.W. Clow (1998), Winter fluxes of CO2 and
CH4 from subalpine soils in Rocky Mountain National Park, Colorado, Global
Biogeochem. Cycles, 12 (4), 607-620.
Mikkelä, C., Sundh, I., Svensson, B.H., and M. Nilsson (1995), Diurnal variation in methane
emission in relation to the water table, soil temperature, climate and vegetation cover in a
Swedish acid mire, Biogeochemistry, 28, 93-114.
Moisier, A.R., Duxbury, J.M., Freney, J.R., Heinemeyer, O., and K. Minami (1998),
Assessing and mitigating N2O emissions from agricultural soils, Climatic Change, 40, 7-
38.
Moore, T.R., and M. Dalva (1993), The influence of temperature and water-table position on
carbon-dioxide and methane emission from laboratory colums of peatland soils, J. Soil
Sci., 44, 651-664.
Neff, J.C., Bowman, W.D., Holland, E.A., Fisk, M.C., and S.K. Schmidt (1994), Fluxes of
nitrous oxide and methane from nitrogen amended soils in the Colorado Alpine,
Biogeochemistry, 27, 23-33.
Rask, H., Schoenau, J., and D. Anderson (2002), Factors influencing methane flux from a
boreal forest wetland in Saskatchewan, Canada, Soil Biol. Biochem., 34, 435-443.
Rybníček, K., and E. Rybníčková (1977), Mooruntersuchungen im oberen Gurgltal, Ötztaler
Alpen, Folia Geobot. Phytotx., 12, 245-291.
Schachtschabel, P., Blume, H.-P., Brümmer, G., Hartge, K.H., and U. Schwertmann (1998),
Lehrbuch der Bodenkunde, Enke, Stuttgart.
Schimel, J.P. (1995), Plant transport and methane production as controls on methane flux
from arctic wet meadow tundra, Biogeochemistry, 28, 183-200.
Shannon, R.D., and J.R. White (1994), A three-year study of controls on methane from two
Michigan peatlands, Biogeochemistry, 27, 35-60.
Sommerfeld, R.A., Moisier, A.R., and R.C. Musselman (1993), CO2, CH4, and N2O flux
through Wyoming snowpack and implications for global budgets, Nature, 361, 140-142.
Steiner, G.M. (1992), Österreichischer Moorschutzkatalog, Grüne Reihe des
Bundesministeriums für Umwelt, Jugend und Familie, Band 1, Wien.
Thomas, K.L., Benstead, J., Lloyd, S.H., and D. Lloyd (1998), Diurnal Oscillations of gas
production and effluxes (CO2 and CH4) in cores from a peat bog, Biol. Rhythm Res., 29,
247-259.
de Visscher, A., and O. van Cleemput (2003), Induction of enhanced CH4 oxidation in soils:
NH4+ inhibition patterns, Soil Biol. Biochem., 35, 907-913.

5 Seasonal and diurnal net methane emissions of the Eastern Alps___________________39
West, A.E., Brooks, P.D., Fisk, M.C., Smith, L.K., Holland, E.A., Jaeger, C.H., Babcock, S.,
Lai, R.S., and S.K. Schmidt (1999), Landscape patterns of CH4 Fluxes in an alpine tundra
ecosystem, Biogeochemistry, 45, 243-264.
Whalen, S.C., and W.S. Reeburgh (1990), Consumption of atmospheric methane by tundra
soils, Nature, 346, 160-162.
Whalen, S.C., and W.S. Reeburgh (1992), Interannual variations in tundra methane
emission: a 4-year time series at fixed sites, Global Biogeochem. Cycles, 6, 139-150.
Wickland, K.P., Striegl, R.G., Mast, M.A., and D.W. Clow (2001), Carbon gas exchange at a
southern Rocky Mountain wetland, 1996-1998, Global Biogeochem. Cycles, 15, 321-335.
Wickland, K.P., Striegl, R.G., Schmidt, S.K., and M.A. Mast (1999), Methane flux in subalpine
wetland and unsaturated soils in the southern Rocky Mountains, Global Biogeochem.
Cycles, 13, 101-113.
Yavitt, J.B., Williams, C.J., and R.K. Wieder (2005), Soil chemistry versus environmental
controls on production of CH4 and CO2 in northern peatlands, Eur. J. Soil Sci., 56, 169-
178.
Zhuang, Q., Melillo, J.M., Knicklighter, D.W., Prinn, R.G., McGuire, A.D., Steudler, P.A.,
Felzer, B.S., and S. Hu (2004), Methane fluxes between terrestrial ecosystems and the
atmosphere at northern high latitudes during the past century: A retrospective analysis
with a process-based biogeochemistry model, Global Biogeochem. Cycles, 18, GB3010,
doi: 10.1029/2004GB002239.

6 Seasonal ecosystem CO2 dynamics of the Eastern Alps___________________________40
6 Interannual ecosystem CO2 dynamics in the alpine zone of the
Eastern Alps, Austria
6.1 Abstract
Information about the annual carbon fluxes of fen and meadow ecosystems in alpine
environment is rare. We studied the influence of photosynthetic active radiation (PAR), plant
green area index (GAI), soil temperature and water filled pore space (wfps) on the net CO2
emission at four alpine sites (one meadow and three fen sites), differing in water balance and
plant community. Measurements over two years were made in the Eastern Alps, Austria,
including two snow-free periods and two snow periods. During snow-free periods, net CO2
gain during daylight periods (NEClight, PAR>0) depended on PAR and GAI. The net CO2
emission rate at night (Rtot, PAR=0) was positively related to soil temperature, while low wfps
reduced the carbon loss via Rtot of the meadow and driest fen study site but reinforced
carbon loss of the wetter fen sites. Daily average ecosystem net CO2 gain (NECday) during
snow-free periods (averaged over both years) at the meadow was 3.5 g CO2 m-2 d-1 and
ranged from 1.5 to 3.4 g CO2 m-2 d-1 at the fen sites. The average mean daily wintertime CO2
emission was low, being only -0.9 g CO2 m-2 d-1 for meadow and between -0.2 and
-0.7 g CO2 m-2 d-1 for all fen sites. All sites function as significant annual net carbon sinks,
with a net carbon gain from 50 to 121 g C m-2 a-1 (averaged over both years) irrespective of
water balance. Our results indicate that alpine fen sites that have built up a large carbon
stock in the past are not expected to gain a further carbon surplus compared with meadows
under the current climate.

6 Seasonal ecosystem CO2 dynamics of the Eastern Alps___________________________41
6.2 Introduction
Investigations dealing with the carbon balance of terrestrial ecosystems are important
because changes in the global climate cause positive feedback mechanisms here
[Schlesinger and Andrews, 2000]. Arctic and alpine ecosystems store much carbon and
cover a large part of the global land surface [Rastetter et al., 1991]. Therefore, investigations
on CO2 dynamics derived from alpine environments are necessary to understand global
carbon cycling.
The C cycle of quasi-stable ecosystems over long time scales and large areas must be
balanced [Körner, 1999]. In contrast, pristine peatlands are characterized by accumulation of
atmospheric carbon because of the slow decomposition rate favoured by water-logged and
anoxic conditions. The formation of present peatlands in the Eastern Alps, Austria, started at
the last ice age (about 5000 years ago) [Bortenschlager, 1970]. However, the fate of these
ecosystems under current climate conditions remains to be investigated.
In general, net ecosystem CO2 exchange (NEC) is the result of gross photosynthesis (Pg)
derived by green plants minus the total respiration of the overall ecosystem (Rtot), consisting
of plants, soil fauna and soil microbes [e.g. Rustad et al., 2000]. Atmospheric CO2 is
sequestered by vegetation via photosynthesis. Carbon is accumulated as organic carbon in
the soil or respired again to the atmosphere. Photosynthesis in alpine plants is mainly
influenced by irradiation, the phenological status of plants, the length of vegetation period
and to a lesser extent by temperature [Körner, 1999]. Although the above-ground plant
biomass is much smaller compared to lowland plant communities due to different
C allocation, alpine plant species use more efficiently CO2 for photosynthesis than lowland
plants [Körner, 1999].
Total ecosystem respiration in alpine environment depends on temperature, soil water
content and plant biomass [Cernusca and Decker, 1989]. Moreover, Rtot is more sensitive to
temperature than photosynthesis [Kirschbaum, 2000] and may be crucial for the present
ecosystem carbon balance if global temperature increases due to climate change. Although
the productivity of alpine meadows is reasonably well understood, the seasonal and annual
net CO2 balance of alpine wetland ecosystems has been investigated on only a few
occasions.
We therefore (i) determined plant community properties by harvesting the above- and below-
ground biomass, (ii) empirically modelled the seasonal ecosystem CO2 dynamics using
meteorological data and the plant green area index (GAI) and (iii) roughly estimated the
annual C budget of four alpine sites in the Eastern Alps, Austria. Four study plots along a soil
moisture gradient (one dry meadow and three sites in a fen) were selected differing in
vegetation community and water balance. Net CO2 flux, plant biomass and climatic

6 Seasonal ecosystem CO2 dynamics of the Eastern Alps___________________________42
properties (radiation, air temperature, precipitation, soil temperature and water filled pore
space in 5 cm soil depth) were monitored over a two-year period.
6.3 Material and methods
6.3.1 Study sites
The study area is located in the Ötztal range (46°50´N, 11°03´E) in Tyrol, Austria. The study
sites are located in the Rotmoos valley above the present tree line (2250 m a.s.l.) (Fig. 6.1).
The valley is exposed south to northwest and flanked by the mountains Hohe Mut
(2659 m a.s.l.) and Hangerer (3121 m a.s.l.). The climate is relatively continental with cold,
snowy winters and cool summers with a mean snow-free period of about 4.5 months
(June to mid-October) (M. Strobel, University of Innsbruck, personal communication). Mean
annual precipitation amounts to 820 mm (1970-1996) and mean annual air temperature
(1997-1998) is -1.3°C [Kaufmann, 2001].
Four study plots along a moisture transect were chosen (one alpine dry meadow and three
plots in the Rotmoos fen); they differ in water balance and vegetation community. The dry
study plot (meadow) was chosen in an alpine meadow site classified as a Curvulo-Nardetum
(G.-H. Zeltner, University of Hohenheim, personal communication) (Tab. 6.1). Its soil is a
Cambisol of loamy sandy silicates with a maximum observed soil depth of 50 cm. The
meadow is well drained, and 90% of the soil surface is covered by vegetation (10% small
boulders). The other three sites are located in the Rotmoos fen. The Rotmoos fen measures
8.5 ha and the average peat depth is 1.5 m (range 0.5-2.9 m) [Rybníček and Rybníčková,
1977]. The fen is mainly fed by surface water from runnels flowing down the hill slopes of the
flanking mountains. Its soils are classified as Rheic Histosols. According to Bortenschlager
[1970], the fen was periodically overwhelmed with 15 layers (1-27 cm) of silt or sand
sediments (or both) mainly located in deeper than 2 m soil depth. One of the three fen sites
(transitional) is located in the transition area between alpine dry meadow and the Rotmoos
fen. According to Rybníček and Rybníčková [1977], the vegetation of the transitional site can
be defined as a Carici echinatae-Trichophoretum caespitosi community. A relative high cover
of plant species also belongs to Curvulo-Nardetum (Tab. 6.1). The second fen plot (fen) is
located deeper in the Rotmoos fen and is characterized by a typical Carici echinatae-
Trichophoretum caespitosi plant community [Rybníček and Rybníčková, 1977]. The species
richness of the fen site is lower than the transitional site (Tab. 6.1). The wettest fen site
(wet fen) is located in the center of the Rotmoos fen and consists solely of Carex nigra L.
(Tab. 6.1). The vegetation cover was only 30% and this site can be temporarily flooded.
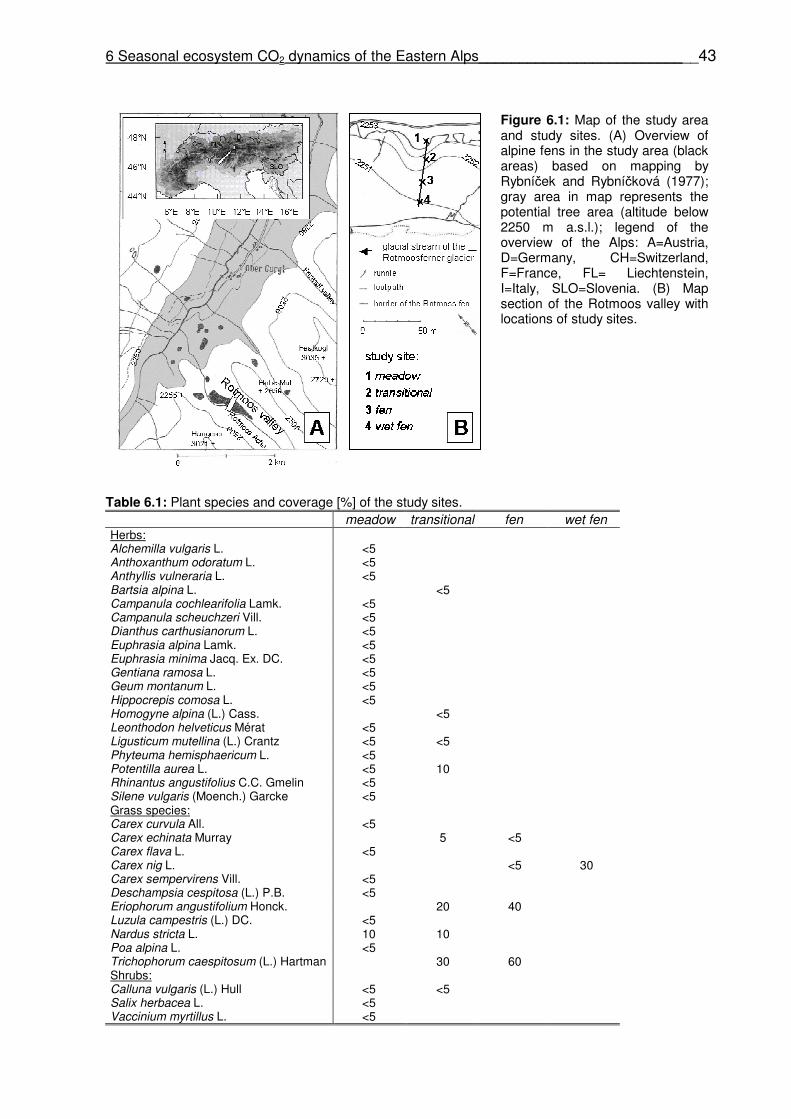
6 Seasonal ecosystem CO2 dynamics of the Eastern Alps___________________________43
Figure 6.1: Map of the study area and study sites. (A) Overview of alpine fens in the study area (black areas) based on mapping by Rybníček and Rybníčková (1977); gray area in map represents the potential tree area (altitude below 2250 m a.s.l.); legend of the overview of the Alps: A=Austria, D=Germany, CH=Switzerland, F=France, FL= Liechtenstein, I=Italy, SLO=Slovenia. (B) Map section of the Rotmoos valley with locations of study sites.
Table 6.1: Plant species and coverage [%] of the study sites. meadow transitional fen wet fen Herbs: Alchemilla vulgaris L. <5 Anthoxanthum odoratum L. <5 Anthyllis vulneraria L. <5 Bartsia alpina L. <5 Campanula cochlearifolia Lamk. <5 Campanula scheuchzeri Vill. <5 Dianthus carthusianorum L. <5 Euphrasia alpina Lamk. <5 Euphrasia minima Jacq. Ex. DC. <5 Gentiana ramosa L. <5 Geum montanum L. <5 Hippocrepis comosa L. <5 Homogyne alpina (L.) Cass. <5 Leonthodon helveticus Mérat <5 Ligusticum mutellina (L.) Crantz <5 <5 Phyteuma hemisphaericum L. <5 Potentilla aurea L. <5 10 Rhinantus angustifolius C.C. Gmelin <5 Silene vulgaris (Moench.) Garcke <5 Grass species: Carex curvula All. <5 Carex echinata Murray 5 <5 Carex flava L. <5 Carex nig L. <5 30 Carex sempervirens Vill. <5 Deschampsia cespitosa (L.) P.B. <5 Eriophorum angustifolium Honck. 20 40 Luzula campestris (L.) DC. <5 Nardus stricta L. 10 10 Poa alpina L. <5 Trichophorum caespitosum (L.) Hartman 30 60 Shrubs: Calluna vulgaris (L.) Hull <5 <5 Salix herbacea L. <5 Vaccinium myrtillus L. <5

6 Seasonal ecosystem CO2 dynamics of the Eastern Alps___________________________44
6.3.2 CO2 measurements
The net CO2 flux was determined by measuring CO2 concentration changes using the “closed
chamber” technique under depletion state. Plexiglas chambers with inserted septums in the
lid (frame: 40 cm x 40 cm x 30 cm; lid 40 cm x 40 cm) were used during the snow-free
periods. On average, PAR was reduced by 11% due to the plexiglas screen. Each chamber
(n=12) was equipped with a small battery-driven fan that ensured an adequate circulation of
the enclosed air. Per study plot, three frames fitting to the lids were carefully inserted 3 cm
into the soil at least 15 h before each measurement. Because of grazing (sheep and horses)
the frames had to be removed between the sampling days. On each plot, one chamber was
provided with a common resistance thermometer 5 cm above the soil surface to estimate the
temperature difference inside and outside the chambers. The maximum temperature in the
chamber headspace during the time of measurements was on average 8.6°C (range 4.6 to
14.1°C depending on incident radiation) higher during daytime and 1.1°C (range 0.2
to 2.0°C) during nighttime compared to ambient conditions; theses values were similar for all
study sites. Vapour pressure deficit (vpd) of the enclosed air was reduced compared to the
ambient conditions. Gas samples were collected for analysis approximately every 3 weeks
within the snow-free season 2003 (n=6) and every 4 weeks during the snow-free season
2004 (n=4). Gas samples were taken with double needles connecting the chamber with
butyl-rubber septums of evacuated flasks. The flasks were evacuated and washed with
nitrogen 5 times in the laboratory prior to sampling. One sample drawing consists of four sub-
samples, which were drawn 0, 6, 20 and 30 min after the chamber was closed. For the
measurements during daylight, we additionally drew a sub-sample after 10 min. Since we
simultaneously measured CH4, the chambers had to be closed for a minimum of 30 min. The
sampling procedure was repeated every 3 hours (n=8); it started at noon and ended at 9:00
in the following day. During snow periods, gas samples were collected every 1 to 3 months
(n=11 for each plot) using three stainless steel pots (diameter 15.5 cm; 25.0 cm height) per
site. After the snow was removed from an area of about 2 x 2 m at each study plot, the steel
pots were gently placed on the soil surface and sealed with wet snow. After gas sampling
and removal of pots, the area was recovered with snow. One sample drawing was made at
noon and consisted of four sub-samples, which were taken at 0, 30, 60 and 90 min.
In the laboratory, CO2 concentrations of the collected air probes were measured using a
flame ionisation detector in a Perkin Elmer (PE Auto system and PE Headspace Sampler
HS 40XL) gas chromatograph. Chromatographic separations were made using a 6 ft
stainless steel column packed with Poropak Q (100/120 mesh). The oven of the column was
maintained at 40 °C and the detector was operated at 350°C. Nitrogen was used as a carrier
gas (gas flow rate: 45 ml min-1). Gas standards (200 ppm, 1000 ppm and 3000 ppm) were
used for calibration and CO2 flux was calculated according to Livingston and
6 Seasonal ecosystem CO2 dynamics of the Eastern Alps___________________________45
Hutchinson [1995]. The CO2 release during nighttime and snow periods was calculated from
linear regressions. During daytime, the measured net CO2 flux followed a first-order
exponential decrease caused by declining CO2 concentrations in the chambers. The first
derivative of simple first-order exponential curve fits (f(x)=aebx) was used to calculate the CO2
flux. At high PAR and high above-ground standing plant biomass, the first three sub-samples
of the sample drawings were used for calculations only, yielding better curve fittings.
Regressions coefficients of the curve fits lower than R2=0.90 were rejected. All rates are
expressed on a ground surface basis.
6.3.3 Climate data
The climate data were provided by R. Kaufmann (University of Innsbruck, personal
communication). The weather station (2270 m a.s.l.) is located 2 km away from the study
sites. Air temperature [°C], global radiation [W m-2], precipitation [mm] and relative
humidity [%] were recorded two meters above ground every 15 min. PAR [µmol m-2 s-1] was
monitored directly at our study location every minute during diurnal gas measurements using
a PAR quantum sensor and data hog2 (skye instruments, United Kingdom). PAR and global
radiation at the weather station were significantly correlated (R2=0.96; n=326; p<0.001). This
linear function was used to convert the global radiation data from the weather station to PAR;
it was in the range of the conversion factors of the typical light situations (cloudy, sunny
conditions) given by McCree [1972]. Soil temperature and soil moisture were recorded hourly
at every study site in 5 cm soil depth using temperature loggers (UTL-1; Geotest AG, Suisse)
and soil moisture sensors (SMS3; Cylobios, Austria). For calibration of the soil moisture
sensors, soil cores (100 cm3; n=3) were taken from 0-5 cm soil depth at every sampling date
and on every study site during the snow-free periods (n=10). Volumetric water content [θ]
was determined gravimetrically after drying at 105°C for 48 h. Water filled pore
space (wfps) [%] was calculated by the proportion of volumetric water content (θ) from the
maximum saturation water content. Maximum saturation water content [g cm-3] was
determined in the laboratory. Soil cores (100 cm3; n=5) were saturated with degassed water
over a 4-day period and weighed before and after drying at 105°C for 48 h. Our determined
wfps sometimes exceeded 100% (maximum 107%), probably because desiccation and
rewetting events were not congruously taken in the calibration curve. Then we set these
values to 100%. Recorded moisture data of snow periods were rejected because values
were not reliable due to frozen water conditions.

6 Seasonal ecosystem CO2 dynamics of the Eastern Alps___________________________46
6.3.4 Plant biomass and plant green area index (GAI)
Above-ground standing plant biomass [g m-2 ground area] and plant green area index
(GAI [m2 m-2]) were determined for each study site during the snow-free periods in 2003
(n=6) and 2004 (n=4). Plant material was clipped from a 25 x 25 cm area (n=5 for each site)
inside a frame randomly positioned on the soil surface. Standing green biomass and non-
green biomass was separated visually and oven dried at 60°C for 72 h before weighing.
Specific projected leaf surface area [g m-2 leaf area] of the entire plant community was
determined with an ordinary flatbed scanner and the software rootedge (Version 2.3, Iowa
State University, Inc.). GAI represents the projected area of green biomass per ground area
[Wohlfahrt et al., 2001].
Below-ground plant biomass was estimated when peak above-ground standing biomass was
observed in 2003 by sampling the fine roots (diameter<2 mm) from 0-10 cm soil depth (n=5
for each site). A bucket auger (diameter=8 cm) was used. In the laboratory, live roots were
visually separated from dead roots after being washed out with a sieve (mesh size 0.5 mm2)
according to Leuschner et al. [2004], and weighed after being dried at 60°C (72 h).
6.3.5 Calculations and statistics
Net CO2 flux rate at daytime (PAR>0) during the snow-free periods represents the net
ecosystem CO2 exchange rate at daytime (NEClight [mg CO2 m-2 h-1]). NEClight was described
by a modified response function [Diemer and Körner, 1998; Küppers and Schulze, 1985]
based on PAR [µmol m-2 s-1] and GAI (equation 6.1):
(6.1) ( )( ) GAIeNECNEC PARk
light GAIPAR⋅−⋅=
Γ−⋅−1max),(
,
where NECmax is maximum NEClight in full sunlight at a given GAI, Γ is the ecosystem light
compensation point and k a coefficient affecting the curvature of the function. PAR values
were reduced by 11% to account for the reduction of PAR by the chambers. Temperature
(soil, air) and wfps did not significantly contribute when additionally added to the model
function. High leaf temperature have a negative affect on net photosynthesis, resulting in
about 30% lower CO2 assimilation when leaf temperature is 5°C higher than optimum
temperature at full sunlight [Küppers and Schulze, 1985]. The influence of the temperature
difference of chambers compared to ambient temperature condition (∆T°Ccham-amb) on the
function parameters used in equation (6.1) was tested by dividing NEClight values

6 Seasonal ecosystem CO2 dynamics of the Eastern Alps___________________________47
into ∆T°C(cham-amb) categories. No significant effect of ∆T°C(cham-amb) was detected for any
function parameter.
The CO2 flux rates during nighttime (PAR=0) of the snow-free period were used as an
estimate for total ecosystem respiration (Rtot [mg CO2 m-2 h-1]). Rtot was described by a
multiple linear regression model (equation 6.2):
(6.2) wfpsbstbbRwfpssttot ⋅+⋅+= 3521),( 5
ln ,
where st5 [°C] represents soil temperature, and wfps [%] the water filled pore space in 5 cm
soil depth. GAI did not significantly contribute when additionally added to the model function.
Winter-time CO2 flux was not included in the model because measurements were made after
removal of the snow cover. In equations (6.1) and (6.2), we used the data of both snow-free
periods to obtain better curve fittings. Here, Rtot (carbon loss) is presented as negative and
NEClight as positive values (if there was a positive net carbon gain for the ecosystem).
Calculations of the daily net ecosystem CO2 flux during snow-free periods
(NECday [g CO2 m-2 d-1]) were based on day-based integration on hourly data (t in hours) of
NEClight presented as NECdaylight [g CO2 m-2 d-1] and day-based integration on hourly data of
Rtot presented as Rnight [g CO2 m-2 d-1]:
(6.3) dtNECNECt
t
tlightdaylight ⋅= ∫ )(
2
1, PAR>0
(6.4) dtRRt
t
ttotnight ⋅= ∫ )(
2
1, PAR=0
(6.5) nightdaylightday RNECNEC += .
For seasonal ecosystem C fluxes, all day-based values were summed over the snow-free
periods, expressed as g C m-2 season-1:
(6.6) dtNECNECd
ddaylightdaylight ⋅= ∫∑
2
1,
(6.7) ∫∑ ⋅=2
1
d
ddayday dtNECNEC ,
(6.8) dtRRd
dnightnight ⋅= ∫∑
2
1.

6 Seasonal ecosystem CO2 dynamics of the Eastern Alps___________________________48
During snow periods we assumed that the measured CO2 emission rate was constant over
the entire day. Daily CO2 flux during the snow period (Rw [g CO2 m-2 d-1]) was calculated
taking the averaged hourly flux values for each site. Seasonal ecosystem C fluxes during
winter [g C m-2 season-1] are presented as:
(6.9) dtRRd
dww ⋅= ∫∑
2
1.
Annual ecosystem C balance (NECyear [g C m-2 a-1]) was calculated:
(6.10) ∑∑ += wdayyear RNECNEC .
The lengths of snow periods were defined by the abrupt decrease and increase of top soil
temperatures (daily values). GAI values of the sites were linearly interpolated between
sampling dates. To fill the gaps of missing data from the beginning of the snow-free period
until the first measurement, as well as between the last measurement during the snow-free
period and the onset of the snow period, we assumed a constant GAI, taking its value at the
nearest sampling date.
Effects of the study site and study years on peak above-ground standing biomass and
below-ground biomass were tested by univariate analysis of variance followed by a
Student-Newman-Keuls test. Additionally, a simple two-factorial analysis of variance
(sampling date and study site) was applied to quantify differences of the seasonal course of
GAI. Both study years were treated separately. The Student-Newman-Keuls multiple range
test was used to calculate maximum critical range (LSD) using time or site as the main
factor.

6 Seasonal ecosystem CO2 dynamics of the Eastern Alps___________________________49
6.4 Results
6.4.1 Climatic properties and hydrology
The mean annual air temperature differed considerably between the two studied years, being
-0.4°C (2003) and -1.3°C (2004), while mean annual soil temperatures (in 5 cm soil depth) at
all study sites ranged between 3.5°C and 4.6°C for both years. The length of the
snow-free period started 19 days earlier in 2003 (149 days) than in 2004 (123 days). During
snow-free periods, the mean soil temperature was on average 2.2°C higher in 2003 than
in 2004. Diurnal soil temperature varied according to time of day (data not shown). The
maximum temperature span was reached on a clear day at mid season (2003), ranging
from 6.2°C to 29.4°C. During snow periods, soil temperature was almost constant, with no
diurnal change because of the insulation effect of a deep snow cover (maximum 235 cm). On
average it was between 0°C and 0.1°C. Total precipitation during snow-free period was lower
in 2003 (276 mm) than in 2004 (326 mm) (Fig. 6.2). Average water filled pore space (wfps) of
both snow-free periods increased in the order meadow (46%) < transitional (59%) < fen
(77%) < wet fen (81%) (Fig. 6.3). The year 2003 was much drier than 2004 at all sites.
During snow-free periods, wfps decreased, reaching minimum values in August and early
September; it increased again later in the season. In 2003, four distinctive desiccation
periods were observed, whereas wfps was much more balanced during 2004. During the
entire snow period, soils were water saturated for fen and wet fen. The soil of the meadow
and the transitional site remained wet during snow periods.
Figure 6.2: Time course of soil temperature in 5 cm soil depth (meadow) and precipitation during the snow-free periods.
May Jun Jul Aug Sep Oct May Jun Jul Aug Sep Oct
2003 2004
soil
tem
pera
ture
[°C
]
soil temperature (meadow)precipitation
0
10
20
30 [m
m]
0
5
10
15
20

6 Seasonal ecosystem CO2 dynamics of the Eastern Alps___________________________50
Figure 6.3: Time course of the water-filled pore space in 5 cm soil depth during the snow-free periods.
6.4.2 Vegetation properties
The green above-ground standing plant biomass was similar at the meadow, transitional and
fen sites, but about three to four times lower at the wet fen site (Tab. 6.2). No significant
differences between the study years were found at any study site. The ratio between green
and non-green above-ground standing plant biomass (mainly necromass) was highest for
meadow and lowest for wet fen (Tab. 6.2). In the wetter year 2004, this ratio increased for
the fen sites. Highest root biomass (0-10 cm soil depth) was observed at meadow followed
by fen and transitional (Tab. 6.2). Root biomass at wet fen was small, being three to four
times lower than at the other sites. The plant green area index (GAI) peaked in July (2003)
and August (2004) at all sites (Fig. 6.4). Wet fen had the lowest GAI throughout the snow-
free periods, while all other sites had similar values. Maximum GAI for both study years
were: meadow (4.3) > transitional (3.7) > fen (3.2) > wet fen (1.0).
Table 6.2: Above- and below-ground plant biomass at peak-standing plant biomass of the two investigated years 2003 and 2004. Different letters in the row indicate significant differences between study sites and years (p≤0.05).
site meadow transitional fen wet fen year 2003 2004 2003 2004 2003 2004 2003 2004 above-ground: green biomass [g m-2] 242a 237a 239a 280a 204a 222a 64b 71b green biomass/ non-green biomass 0.98a 0.89a 0.71ab 0.83a 0.66b 0.85a 0.53b 0.74ab below-ground (0-10 cm): live biomass [g m-2]: 349a 273ab 278ab 95b
wfp
s [%
]
meadowtransitionalfenwet fen
May Jun Jul Aug Sep Oct May Jun Jul Aug Sep Oct
2003 2004
0
25
50
75
100
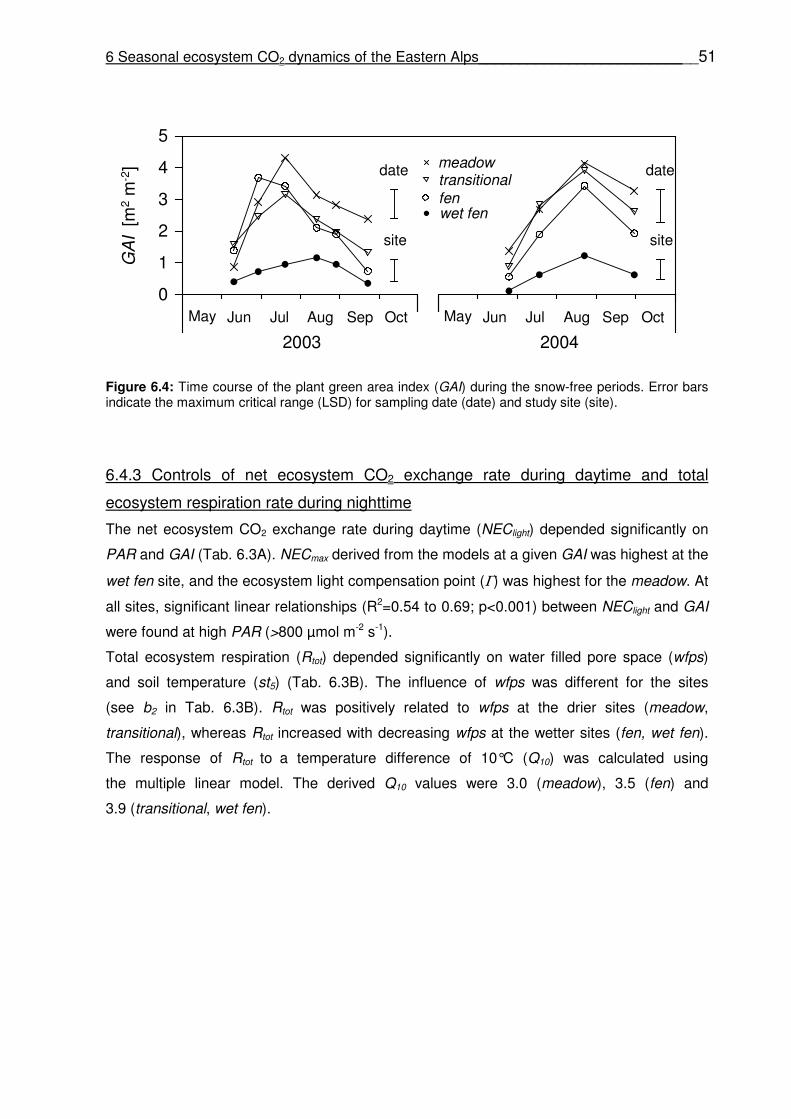
6 Seasonal ecosystem CO2 dynamics of the Eastern Alps___________________________51
Figure 6.4: Time course of the plant green area index (GAI) during the snow-free periods. Error bars indicate the maximum critical range (LSD) for sampling date (date) and study site (site).
6.4.3 Controls of net ecosystem CO2 exchange rate during daytime and total
ecosystem respiration rate during nighttime
The net ecosystem CO2 exchange rate during daytime (NEClight) depended significantly on
PAR and GAI (Tab. 6.3A). NECmax derived from the models at a given GAI was highest at the
wet fen site, and the ecosystem light compensation point (Γ) was highest for the meadow. At
all sites, significant linear relationships (R2=0.54 to 0.69; p<0.001) between NEClight and GAI
were found at high PAR (>800 µmol m-2 s-1).
Total ecosystem respiration (Rtot) depended significantly on water filled pore space (wfps)
and soil temperature (st5) (Tab. 6.3B). The influence of wfps was different for the sites
(see b2 in Tab. 6.3B). Rtot was positively related to wfps at the drier sites (meadow,
transitional), whereas Rtot increased with decreasing wfps at the wetter sites (fen, wet fen).
The response of Rtot to a temperature difference of 10°C (Q10) was calculated using
the multiple linear model. The derived Q10 values were 3.0 (meadow), 3.5 (fen) and
3.9 (transitional, wet fen).
GA
I [m
2 m
-2] meadow
transitionalfenwet fen
date
site
date
site
May Jun Jul Aug Sep Oct May Jun Jul Aug Sep Oct
2003 2004
0
1
2
3
4
5

6 Seasonal ecosystem CO2 dynamics of the Eastern Alps___________________________52
Table 6.3: (A) Parameters of the model functions to calculate net ecosystem carbon exchange rates during daytime (NEClight [mg CO2 m-2 h-1]) and (B) total respiration rate (Rtot [mg CO2 m-2 h-1]); PAR: photosynthetic active radiation [µmol m-2 s-1], GAI: plant green area index [m2 m-2], st5: soil temperature in 5 cm depth [°C], wfps: water filled pore space [%]. All model function parameters and correlation coefficients were highly significant (p<0.001).
6.4.4 Seasonal daily CO2 fluxes
The calculated seasonal courses of NECday during snow-free periods increased until
July (2003) or August (2004) and decreased towards the end of seasons (Fig. 6.5). The
pattern follows the trend of GAI and PAR, resulting in a sharper increase and decrease of
NECday in 2003 versus 2004. Wet fen had the overall lowest NECday values during both
snow-free seasons compared to all other sites. Average NECday of both study years were in
the order: meadow (4.56 g CO2 m-2 d-1) > transitional (4.00 g CO2 m-2 d-1) >
fen (3.45 g CO2 m-2 d-1) > wet fen (1.77 g CO2 m
-2 d-1).
Daily nighttime ecosystem respiration (Rnight) increased (became more negative) from the
beginning of the snow-free periods and peaked at all study sites in August (both study years)
(Fig. 6.5B). Rnight decreased again towards the end of snow-free periods. Average Rnight
values (both seasons) were meadow (-1.21 g CO2 m-2 d-1) > transitional (-0.89 g CO2 m
-2 d-1)
> fen (-0.74 g CO2 m-2 d-1) > wet fen (-0.36 g CO2 m
-2 d-1).
Rw during snow periods was on average highest at meadow (-0.87 g CO2 m-2 d-1)
followed by transitional (-0.65 g CO2 m-2 d-1), fen (-0.21 g CO2 m-2 d-1) and wet fen
(-0.16 mg CO2 m-2 d-1). Significant differences were calculated between sites (F(site)=5.81;
p<0.009) but not between sampling dates (F(date)=1.73; p=0.26).
meadow transitional fen wet fen A ( )( ) GAIeNECNEC
TPARk
GAIPARlight ⋅−⋅=−−
1max),(
(n=36 for each study site)
maxNEC 233.72 250.78 228.04 324.44
k 0.0028 0.0027 0.0038 0.0044 T 128.91 109.13 106.86 93.03 R2 0.71 0.67 0.60 0.59
B wfpsbstbbRwfpsstTOT 2510),( 5
ln)1( ++=− (n=30 for each study site)
0b 4.05 3.52 4.94 6.94
1b 0.17 0.14 0.12 0.14
2b 0.007 0.005 -0.017 -0.045 R2 0.80 0.81 0.88 0.86

6 Seasonal ecosystem CO2 dynamics of the Eastern Alps___________________________53
N
EC
day
[g C
O2
m-2
d-1
] meadowtransitionalfenwet fen
May Jun Jul Aug Sep Oct May Jun Jul Aug Sep Oct
0
4
8
May Jun Jul Aug Sep Oct May Jun Jul Aug Sep Oct
2003 2004
Rni
ght
[g C
O2
m-2
d-1
]
-2
-1
0
meadowtransitionalfenwet fen
2003 2004
A
B
Figure 6.5: Time course of the seasonal NECday (A) and Rnight (B) during the snow-free periods.
6.4.5 Cumulative C fluxes and annual C balance
All study sites function as net annual carbon sinks during snow-free seasons (ΣNECday).
ΣNECday was highest at meadow for both study years (Tab. 6.4). However, ΣNECday at
transitional and fen was almost as high as for meadow, while wet fen had the lowest values,
being about two to almost three times lower than for all other sites. ΣRw was highest for
meadow, while transitional, fen and wet fen have ΣRw values being about two to five times
lower compared to meadow. The annual C balance (ΣNECyear) is the sum of ΣNECday and
ΣRw. All sites were net annual carbon sinks, ranging from 96 to 125 g C m-2 a-1 for meadow,
transitional and fen (average of both years). Wet fen had the lowest net annual carbon gain
about two times lower than all other sites.
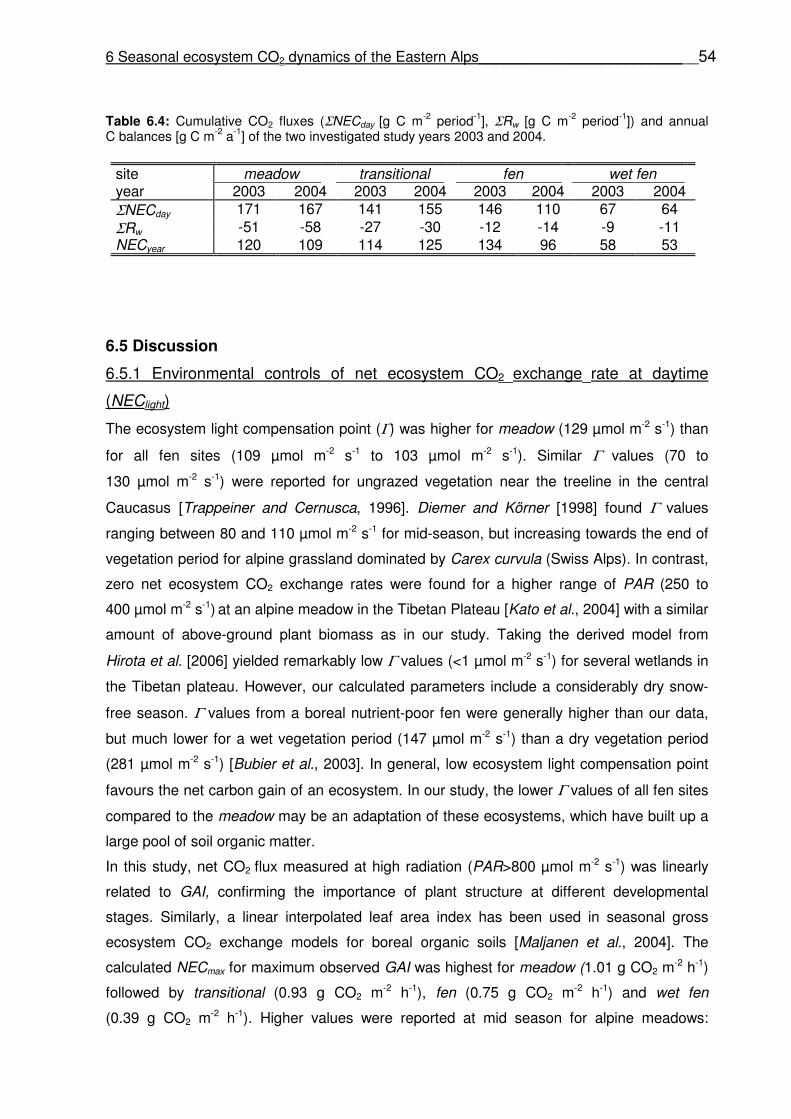
6 Seasonal ecosystem CO2 dynamics of the Eastern Alps___________________________54
Table 6.4: Cumulative CO2 fluxes (ΣNECday [g C m-2 period-1], ΣRw [g C m-2 period-1]) and annual C balances [g C m-2 a-1] of the two investigated study years 2003 and 2004.
site meadow transitional fen wet fen year 2003 2004 2003 2004 2003 2004 2003 2004 ΣNECday 171 167 141 155 146 110 67 64 ΣRw -51 -58 -27 -30 -12 -14 -9 -11 NECyear 120 109 114 125 134 96 58 53
6.5 Discussion
6.5.1 Environmental controls of net ecosystem CO2 exchange rate at daytime
(NEClight)
The ecosystem light compensation point (Γ) was higher for meadow (129 µmol m-2 s-1) than
for all fen sites (109 µmol m-2 s-1 to 103 µmol m-2 s-1). Similar Γ values (70 to
130 µmol m-2 s-1) were reported for ungrazed vegetation near the treeline in the central
Caucasus [Trappeiner and Cernusca, 1996]. Diemer and Körner [1998] found Γ values
ranging between 80 and 110 µmol m-2 s-1 for mid-season, but increasing towards the end of
vegetation period for alpine grassland dominated by Carex curvula (Swiss Alps). In contrast,
zero net ecosystem CO2 exchange rates were found for a higher range of PAR (250 to
400 µmol m-2 s-1) at an alpine meadow in the Tibetan Plateau [Kato et al., 2004] with a similar
amount of above-ground plant biomass as in our study. Taking the derived model from
Hirota et al. [2006] yielded remarkably low Γ values (<1 µmol m-2 s-1) for several wetlands in
the Tibetan plateau. However, our calculated parameters include a considerably dry snow-
free season. Γ values from a boreal nutrient-poor fen were generally higher than our data,
but much lower for a wet vegetation period (147 µmol m-2 s-1) than a dry vegetation period
(281 µmol m-2 s-1) [Bubier et al., 2003]. In general, low ecosystem light compensation point
favours the net carbon gain of an ecosystem. In our study, the lower Γ values of all fen sites
compared to the meadow may be an adaptation of these ecosystems, which have built up a
large pool of soil organic matter.
In this study, net CO2 flux measured at high radiation (PAR>800 µmol m-2 s-1) was linearly
related to GAI, confirming the importance of plant structure at different developmental
stages. Similarly, a linear interpolated leaf area index has been used in seasonal gross
ecosystem CO2 exchange models for boreal organic soils [Maljanen et al., 2004]. The
calculated NECmax for maximum observed GAI was highest for meadow (1.01 g CO2 m-2 h-1)
followed by transitional (0.93 g CO2 m-2 h-1), fen (0.75 g CO2 m-2 h-1) and wet fen
(0.39 g CO2 m-2 h-1). Higher values were reported at mid season for alpine meadows:

6 Seasonal ecosystem CO2 dynamics of the Eastern Alps___________________________55
1.5 g CO2 m-2 h-1 derived by single measurement in the Swiss Alps at full sunlight
[Diemer, 1994] or for an alpine meadow in the Tibetan plateau (1.58 g CO2 m-2 h-1)
[Kato et al., 2004]. In contrast, a lower maximum NEClight value (0.7 g CO2 m-2 h-1) over the
entire growing season was found in a dry alpine tundra ecosystem, namely Niwot Ridge,
Colorado [Welker et al., 1999]. The seasonal NECmax for the fen sites in our study
(0.4 to 0.9 g CO2 m-2 h-1) were comparable with the range of seasonal NECmax values
(0.18 g CO2 m-2 h-1 to 0.71 g CO2 m-2 h-1) of different wetlands in the Tibetan plateau
[Hirota et al., 2006]. Lower NECmax values might be due to grazing. Remarkably reduced
CO2 uptake was observed for a grazed sub-alpine meadow [Rogiers et al., 2005] during
vegetation period and for alpine wetlands [Hirota et al., 2005] in comparison to control sites.
Moreover, Gilmanov et al. [2007] reported reduced maximal net ecosystem carbon gain and
reduced light-use efficiency (defined as the ratio of gross ecosystem carbon gain to incident
PAR) after hay-mowing events or grazing for several European grassland sites (temperate to
sub-alpine).
6.5.2 Environmental controls of total ecosystem respiration rate (Rtot)
During snow-free periods, the ecosystem respiration rate (Rtot) was related to soil
temperature and wfps in 5 cm depth. Q10 values were lowest at the meadow site (3.0)
compared to the fen sites (3.4 (fen) and 3.9 (transitional, wet fen)). Our Q10 values (corrected
for soil moisture) fit to values calculated for other alpine ecosystems. Cao et al. [2004] found
Q10 values based on soil temperature in 0-10 cm being 2.75 and 3.22 in a heavily grazed
alpine meadow and lightly grazed alpine meadow, respectively. Q10 values for the entire
snow-free season in alpine wetlands at the Tibetan plateau ranged from 2.7 to 5.1
[Hirota et al., 2006]. An average Q10 of 3.5 was found for sub-alpine wetlands in the Rocky
Mountains [Wickland et al., 2001]. However, the wide range of temperature sensitivity found
for ecosystem respiration is difficult to compare and probably reflects several variables: Q10
values were found to be higher for a lower temperature range and/or for a higher ratio of root
to soil respiration [Kirschbaum, 2000], but do also highly depend on the quality of soil organic
matter [Fierer et al., 2006]. Moreover, soil respiration is exponentially related to temperature
in contrast to respiration of above-ground plant biomass, which was linearly related to
temperature in an alpine meadow [Cernusca et al., 1978]. Beside soil temperature, wfps was
the second important control of Rtot. The influence, however, differed depending on study
site. In the meadow and the driest fen site (transitional), Rtot was positively related to wfps.
Since we used the sign convention of Rtot having negative values, this means that the
absolute value of Rtot decreased with decreasing wfps, which is an indication of water stress.
This is remarkable because most alpine environments are expected to be not water limited

6 Seasonal ecosystem CO2 dynamics of the Eastern Alps___________________________56
[Körner, 1999]. Incubation experiments yielded an optimum of 40 to 50% water holding
capacity for soil respiration in forest and mineral soils [Bowden et al., 1998]. In our
experiments, however, meadow and transitional were exposed to very low wfps in 5 cm soil
depth, especially during the snow-free period in 2003. These results identify topsoil as the
major source for soil-derived CO2 emissions and explain the greater carbon loss via Rtot with
decreasing wfps in topsoil even at one of the fen sites (transitional). The influence of wfps on
Rtot was negative for the fen and wet fen. Accordingly, the absolute value of Rtot increased if
wfps decreased. The positive influence of wfps can be explained by the shift of anoxic to oxic
soil conditions at low wfps because aerobic respiration is the main source of CO2 emission
[e.g. Conrad, 1996]. Also, water-logging may prevent CO2 diffusion in the soil matrix,
resulting in lower soil CO2 emission. Our results are in agreement with several studies for
alpine [Hirota et al., 2006] or boreal wetland ecosystems [e.g. Alm et al., 1997;
Bubier et al., 2003].
6.5.3 Magnitude of seasonal CO2 fluxes
In quasi-stable ecosystems, the gross annual primary production is positively correlated with
total ecosystem respiration, while low annual temperatures negatively influence both
processes [Gilmanov et al., 2007]. The magnitude of NECday and the duration of snow-free
periods are the main factors for the ecosystem net carbon gain; here, Rnight is the carbon loss
of NECday during nighttime. At meadow, the averages (both snow-free periods) of modelled
NECday and Rnight were 3.50 g CO2 m-2 d-1 and -1.11 g CO2 m-2 d-1, respectively. In
comparison with the meadow site, a high range of CO2 fluxes have been reported from
alpine meadow ecosystems. For example, Diemer and Körner [1998] found a higher average
NECday (8.41 g CO2 m-2 d-1) and a similar average Rnight (-1.18 g CO2 m
-2 d-1) for a Swiss
alpine meadow dominated by Carex curvula. A much lower average NECday
(0.17 g CO2 m-2 d-1) was calculated for an alpine dry tundra ecosystem at Niwot Ridge,
Colorado [Welker et al., 1999], even thought maximum Rtot during nighttime was comparable
with our data. Kato et al. [2004] reported an average NECday of 4.3 g CO2 m-2 d-1, yet the
maximum Rnight (-9.2 g CO2 m-2 d-1) was more than four times higher than our data. Lower
Rnight values are likely a result of grazing: Cao et al. [2004] found 30% lower total ecosystem
respiration for heavily grazed than for lightly grazed meadows in the Tibetan plateau.
At our fen sites, average NECday and Rnight values (both study years) were lower than at
meadow, ranging from 1.58 to 3.38 g CO2 m-2 d-1 and -0.26 to -0.66 g CO2 m-2 d-1,
respectively. Similar NECday values (0.53 to 3.26 g CO2 m-2 d-1) were found for various
wetlands in the Tibetan plateau [Hirota et al., 2006]. Those authors reported day-based total
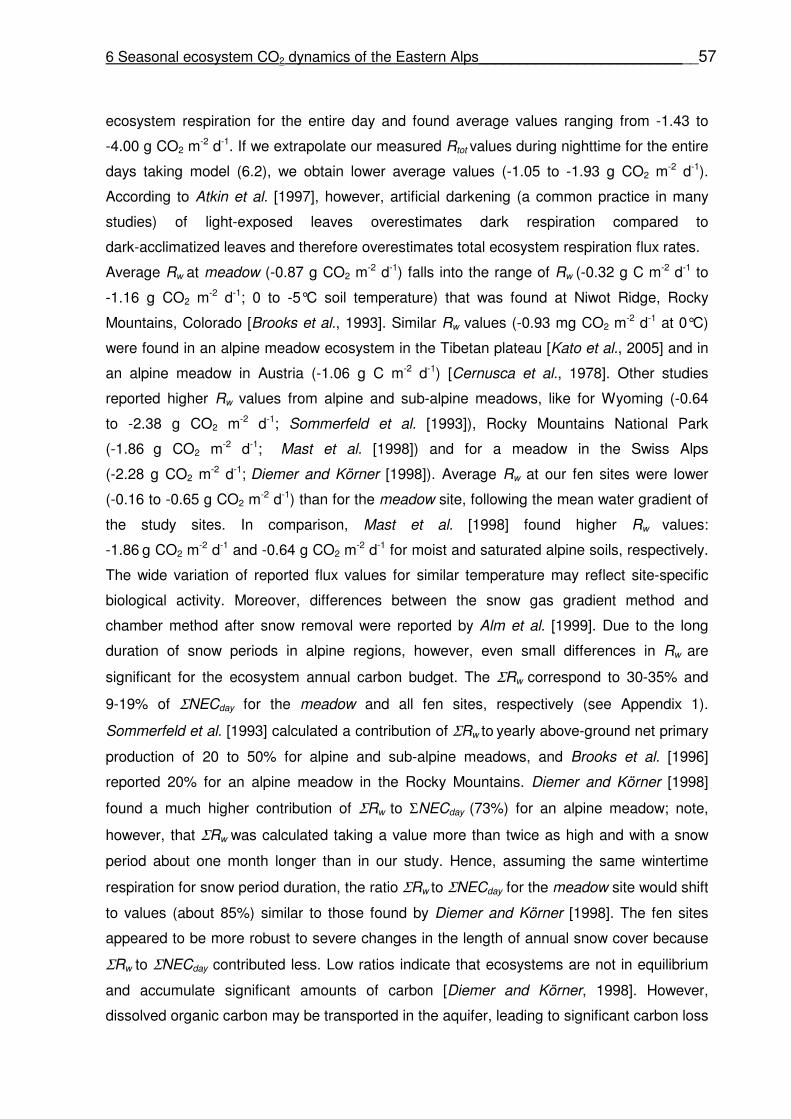
6 Seasonal ecosystem CO2 dynamics of the Eastern Alps___________________________57
ecosystem respiration for the entire day and found average values ranging from -1.43 to
-4.00 g CO2 m-2 d-1. If we extrapolate our measured Rtot values during nighttime for the entire
days taking model (6.2), we obtain lower average values (-1.05 to -1.93 g CO2 m-2 d-1).
According to Atkin et al. [1997], however, artificial darkening (a common practice in many
studies) of light-exposed leaves overestimates dark respiration compared to
dark-acclimatized leaves and therefore overestimates total ecosystem respiration flux rates.
Average Rw at meadow (-0.87 g CO2 m-2 d-1) falls into the range of Rw (-0.32 g C m-2 d-1 to
-1.16 g CO2 m-2 d-1; 0 to -5°C soil temperature) that was found at Niwot Ridge, Rocky
Mountains, Colorado [Brooks et al., 1993]. Similar Rw values (-0.93 mg CO2 m-2 d-1 at 0°C)
were found in an alpine meadow ecosystem in the Tibetan plateau [Kato et al., 2005] and in
an alpine meadow in Austria (-1.06 g C m-2 d-1) [Cernusca et al., 1978]. Other studies
reported higher Rw values from alpine and sub-alpine meadows, like for Wyoming (-0.64
to -2.38 g CO2 m-2 d-1; Sommerfeld et al. [1993]), Rocky Mountains National Park
(-1.86 g CO2 m-2 d-1; Mast et al. [1998]) and for a meadow in the Swiss Alps
(-2.28 g CO2 m-2 d-1; Diemer and Körner [1998]). Average Rw at our fen sites were lower
(-0.16 to -0.65 g CO2 m-2 d-1) than for the meadow site, following the mean water gradient of
the study sites. In comparison, Mast et al. [1998] found higher Rw values:
-1.86 g CO2 m-2 d-1 and -0.64 g CO2 m
-2 d-1 for moist and saturated alpine soils, respectively.
The wide variation of reported flux values for similar temperature may reflect site-specific
biological activity. Moreover, differences between the snow gas gradient method and
chamber method after snow removal were reported by Alm et al. [1999]. Due to the long
duration of snow periods in alpine regions, however, even small differences in Rw are
significant for the ecosystem annual carbon budget. The ΣRw correspond to 30-35% and
9-19% of ΣNECday for the meadow and all fen sites, respectively (see Appendix 1).
Sommerfeld et al. [1993] calculated a contribution of ΣRw to yearly above-ground net primary
production of 20 to 50% for alpine and sub-alpine meadows, and Brooks et al. [1996]
reported 20% for an alpine meadow in the Rocky Mountains. Diemer and Körner [1998]
found a much higher contribution of ΣRw to ΣNECday (73%) for an alpine meadow; note,
however, that ΣRw was calculated taking a value more than twice as high and with a snow
period about one month longer than in our study. Hence, assuming the same wintertime
respiration for snow period duration, the ratio ΣRw to ΣNECday for the meadow site would shift
to values (about 85%) similar to those found by Diemer and Körner [1998]. The fen sites
appeared to be more robust to severe changes in the length of annual snow cover because
ΣRw to ΣNECday contributed less. Low ratios indicate that ecosystems are not in equilibrium
and accumulate significant amounts of carbon [Diemer and Körner, 1998]. However,
dissolved organic carbon may be transported in the aquifer, leading to significant carbon loss
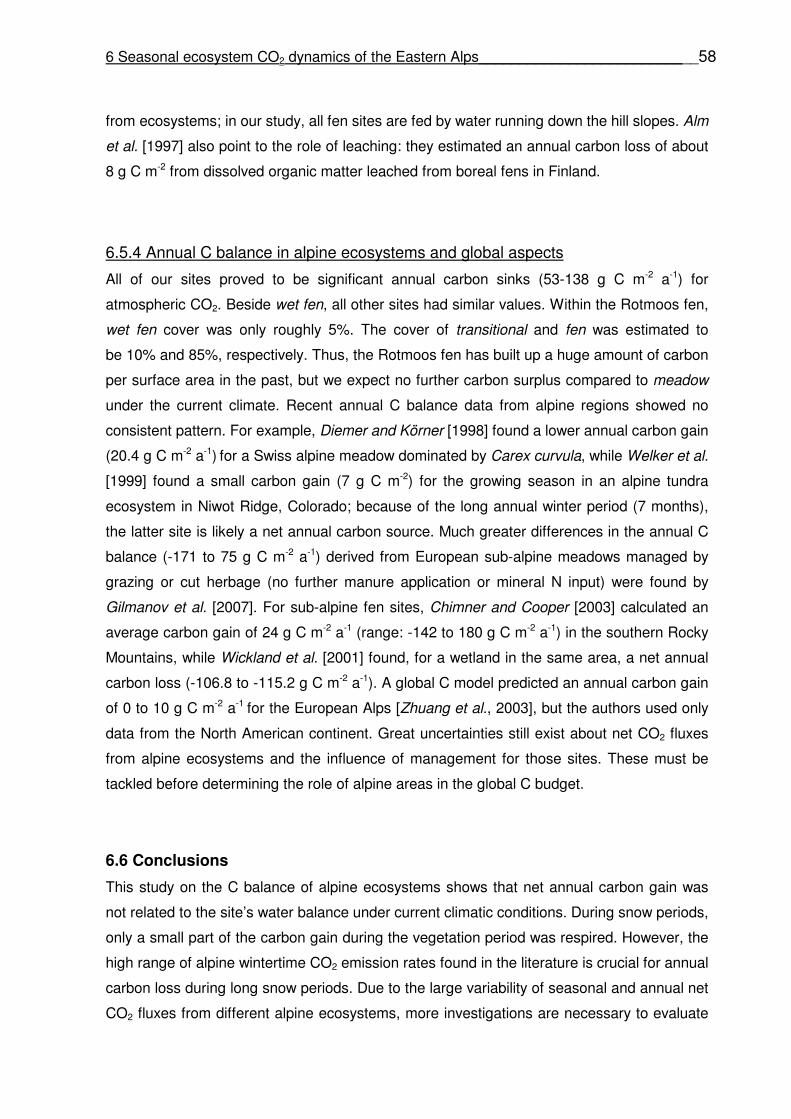
6 Seasonal ecosystem CO2 dynamics of the Eastern Alps___________________________58
from ecosystems; in our study, all fen sites are fed by water running down the hill slopes. Alm
et al. [1997] also point to the role of leaching: they estimated an annual carbon loss of about
8 g C m-2 from dissolved organic matter leached from boreal fens in Finland.
6.5.4 Annual C balance in alpine ecosystems and global aspects
All of our sites proved to be significant annual carbon sinks (53-138 g C m-2 a-1) for
atmospheric CO2. Beside wet fen, all other sites had similar values. Within the Rotmoos fen,
wet fen cover was only roughly 5%. The cover of transitional and fen was estimated to
be 10% and 85%, respectively. Thus, the Rotmoos fen has built up a huge amount of carbon
per surface area in the past, but we expect no further carbon surplus compared to meadow
under the current climate. Recent annual C balance data from alpine regions showed no
consistent pattern. For example, Diemer and Körner [1998] found a lower annual carbon gain
(20.4 g C m-2 a-1) for a Swiss alpine meadow dominated by Carex curvula, while Welker et al.
[1999] found a small carbon gain (7 g C m-2) for the growing season in an alpine tundra
ecosystem in Niwot Ridge, Colorado; because of the long annual winter period (7 months),
the latter site is likely a net annual carbon source. Much greater differences in the annual C
balance (-171 to 75 g C m-2 a-1) derived from European sub-alpine meadows managed by
grazing or cut herbage (no further manure application or mineral N input) were found by
Gilmanov et al. [2007]. For sub-alpine fen sites, Chimner and Cooper [2003] calculated an
average carbon gain of 24 g C m-2 a-1 (range: -142 to 180 g C m-2 a-1) in the southern Rocky
Mountains, while Wickland et al. [2001] found, for a wetland in the same area, a net annual
carbon loss (-106.8 to -115.2 g C m-2 a-1). A global C model predicted an annual carbon gain
of 0 to 10 g C m-2 a-1 for the European Alps [Zhuang et al., 2003], but the authors used only
data from the North American continent. Great uncertainties still exist about net CO2 fluxes
from alpine ecosystems and the influence of management for those sites. These must be
tackled before determining the role of alpine areas in the global C budget.
6.6 Conclusions
This study on the C balance of alpine ecosystems shows that net annual carbon gain was
not related to the site’s water balance under current climatic conditions. During snow periods,
only a small part of the carbon gain during the vegetation period was respired. However, the
high range of alpine wintertime CO2 emission rates found in the literature is crucial for annual
carbon loss during long snow periods. Due to the large variability of seasonal and annual net
CO2 fluxes from different alpine ecosystems, more investigations are necessary to evaluate

6 Seasonal ecosystem CO2 dynamics of the Eastern Alps___________________________59
the role of alpine areas in the global carbon budget under present und future climate
conditions.
6.7 Acknowledgements
This research was funded by the DFG project 768. We would like to thank R. Kaufmann
(University of Innsbruck), who provided the climate data from the weather station. We are
very grateful to M. Strobel from the alpine research station Obergurgl (University of
Innsbruck, Austria) for personal communication and hospitality during the field
measurements. Additional thanks to G.-H. Zeltner (University of Hohenheim) for personal
communication and M. Erbs (University of Hohenheim) for lending us the PAR sensor used
in this study.
6.8 References
Alm, J., Talanov, A., Saarnio, S., Silova, J., Ikkonen, E., Aaltonen, H., Nykänen, H., and J.
Martikainen (1997), Reconstruction of the carbon balance for microsites in a boreal
oligotrophic pine fen, Finland, Oecologia, 110, 423-431.
Alm, J., Saarnio, S., Nykänen, H., Silova, J., and P.J. Martikainen (1999), Winter CO2, CH4
and N2O fluxes on some natural and drained boreal peatlands, Biogeochemistry, 44,
163-186.
Atkin, O.K., Westbeek, M.H.M., Cambridge, M.L., Lambers, H. and T.L. Pons (1997), Leaf
Respiration in light and darkness, Plant Physiol., 113, 961-965.
Bortenschlager, S. (1970), Waldgrenz- und Klimaschwankungen im Pollenanalytischen Bild
des Gurgler Rotmooses, Mitteilungen der Ostalpin-Dinarischen Gesellschaft für
Vegetationskunde, 11, 19-26.
Bowden, R.D., Newkirk, K.M., and G.M. Rullo (1998), Carbon dioxide and methane fluxes by
a forest soil under laboratory-controlled moisture and temperature conditions, Soil Biol.
Biochem., 30 (12), 1591-1597.
Brooks, P.D., Schmidt, S.K., and M.W. Williams (1997), Winter production of CO2 and N2O
from alpine tundra: environmental controls and relationships inter-system C and N fluxes,
Oecologia, 110, 403-413.
Brooks, P.D., Williams, M.W., and S.K. Schmidt (1996), Microbial activity under alpine
snowpacks, Niwot Ridge, Colorado, Biogeochemistry, 32, 93-113.
Bubier, J.L., Bhatia, G., Moore, T.R., Roulet, N.T., and P.M. Lafleur (2003), Spatial and
temporal variability in growing-season net ecosystem carbon dioxide exchange at a large
peatland in Ontario, Canada, Ecosystems, 6, 353-367.
6 Seasonal ecosystem CO2 dynamics of the Eastern Alps___________________________60
Cao, G., Tang, Y., Mo, W., Wang, Y., Li, Y., and X. Zhao (2004), Grazing intensity alters soil
respiration in an alpine meadow on the Tibetan plateau, Soil Biol. Biochem., 36, 237-243.
Cernusca, A., and P. Decker (1989), Faktorenabhängigkeit der respiratorischen
Kohlenstoffverluste einer alpinen Grasheide (Caricetum Curvulae) in 2300 m MH in den
hohen Tauern, In: Cernusca, A. et al. (Eds.), Veröffentlichungen des österreichischen
MaB-Programms, Band 13.
Cernusca, A., Decker, P., and J. Hager (1978), Bestandes- und Bodenatmung im Bereich
einer aufgelassenen Alm im Gasteiner Tal, In: Cernusca, A. et al. (Eds.),
Veröffentlichungen des österreichischen MaB-Programms, Band 2.
Chimner, R.A. and D.J. Cooper (2003), Carbon dynamics of pristine and hydrologically
modified fens in the southern Rocky Mountains, Can. J. Bot., 81, 477-491.
Conrad, R. (1996), Soil microorganisms as controllers of atmospheric trace gases (H2, CO,
CH4, OCS, N2O and NO), Microbiol. Rev., 60, 609-640.
Diemer, M.W. (1994), Mid-season gas exchange of an alpine grassland under elevated CO2,
Oecologia, 98, 429-435.
Diemer, M., and Ch. Körner (1998), Transient enhancement of carbon uptake in an alpine
grassland ecosystem under elevated CO2, Arct. Antarct. Alp. Res., 30 (4), 381-387.
Fierer, N., Colman, B.P., Schimel, J.P., and R.B. Jackson (2006), Predicting the temperature
dependence of microbial respiration in soil: A continental scale analysis, Global
Biogeochem. Cycles, 20, GB3026, doi:10.1029/2005GB002644.
Gilmanov , T.G., Soussana, J.F., Aires, L., Allard, V., Ammann, C., Balzarolo, M., Barcza, Z.,
Bernhofer, C., Campbell, C.L., Cernusca, A., Cescatti, A., Clifton-Brown, J., Dirks,
B.O.M., Dore, S., Eugster, W., Fuhrer, J., Gimeno, C., Gruenwald, T., Haszpra, L.,
Hensen, A., Ibrom, A., Jacobs, A.F.G., Jones, M.B., Lanigan, G., Laurila, T., Lohila, A.,
Manca, G., Marcolla, B., Nagy, Z., Pilegaard, K., Pinter, K., Pio, C., Raschi, A., Rogiers,
N., Sanz, M. J., Stefani, P., Sutton, M., Tuba, Z., Valentini, R., Williams, M.L., and G.
Wohlfahrt (2007), Partitioning European grassland net ecosystem CO2 exchange into
gross primary productivity and ecosystem respiration using light response function
analysis, Agr. Ecosys. Environ., Doi:10.1016/j.agee.2006.12.008.
Hirota, M., Tang, Y., Hu, Q., Hirata, S., Kato, T., Mo, W., Cao, G., and S. Mariko (2006),
Carbon dioxide dynamics and controls in a deep-water wetland on the Quinghai-Tibetan
Plateau, Ecosystems, 9, 673-688.
Hirota, M., Tang, Y., Hu, Q., Kato, T., Hirata, S., Mo, W., Cao, G., and S. Mariko (2005), The
potential importance of grazing to the fluxes of carbon and methane in an alpine wetland
on the Qinghai-Tibetan Plateau, Atmos. Environ., 39, 5255-5259.

6 Seasonal ecosystem CO2 dynamics of the Eastern Alps___________________________61
Kato, T., Hirota, M., Tang, Y., Cui, X., Li, Y., Zhao, X., and T. Oikawa (2005), Strong
temperature dependence and no moss photosynthesis in winter CO2 flux for a Kobresia
meadow on the Qinghai-Tibetan plateau, Soil Biol. Biochem., 37, 1966-1969.
Kato, T., Tang, Y., Gu, S., Cui, X., Hirota, M., Du, M., Li, Y., Zhao, X., and T. Oikawa (2004),
Carbon dioxide exchange between the atmosphere and an alpine meadow ecosystem on
the Qinghai-Tibetan Plateau, China, Agr. Forest Meteorol., 124, 121-134.
Kaufmann, R. (2001), Invertebrate succession on an alpine glacier foreland, Ecology, 82,
2261-2278.
Kirschbaum, M.U.F. (2000), Will changes in soil organic carbon act as a positive or negative
feedback on global warming, Biogeochemistry, 48, 21-51.
Körner, Ch. (1999), Alpine plant live. Functional plant ecology of high mountain ecosystems.
Springer, Berlin.
Küppers, M., and E.D. Schulze (1985), An empirical model of net photosynthesis and leaf
conductance for the simulation of diurnal courses of CO2 and H2O exchange, Aust. J.
Plant Physiol., 12, 513-526.
Leuschner, Ch., Hertel, D., Schmid, I., Koch, O., Muhs, A., and D. Hölscher (2004), Stand
fine root biomass and fine root morphology in old-growth beech forests as a function of
precipitation and soil fertility, Plant Soil, 258, 43-56.
Livingston, G.P., and G.L. Hutchinson (1995), Enclosure-based measurement of trace gas
exchange: applications and sources of error, In: Matson, P. A., and R. C. Harrison,
(Eds.), Biogenic Trace Gases: Measuring Emissions From Soil and Water. Blackwell
Sciences Ltd., Oxford.
Maljanen, M., Komulainen, V.-M., Hytönen, J., Martikainen, P.J., and J. Laine (2004), Carbon
dioxide, nitrous oxide and methane dynamics in boreal organic agricultural soils with
different soil characteristics, Soil Biol. Biochem., 36, 1801-1808.
Mast, M.A., Wickland, K.P., Striegl, R.G., and D.W. Clow (1998), Winter fluxes of CO2 and
CH4 from subalpine soils in Rocky Mountain National Park, Colorado, Global
Biogeochem. Cycles, 12 (4), 607-620.
McCree, K.J. (1972), Test of current definitions of photosynthetically active radiation against
leaf photosynthesis data, Agric. Meteorol., 10, 443-453.
Rastetter, E.B., Ryan, M.G., Shaver, G.R., Melillo, J.M., Nadelhoffer, K.J., Hobbie, J.E., and
J.D. Aber (1991), A general biochemical model describing the responses of the C and N
cycles in terrestrial ecosystems to changes in CO2, climate, and N deposition, Tree
Physiol., 9, 101-126.
Rogiers, N., Eugster, W., Furger, M., and R. Siegwolf (2005), Effect of land management on
ecosystem carbon fluxes at a subalpine grassland site in the Swiss Alps, Theor. Appl.
Climatol., 80, 187-203.
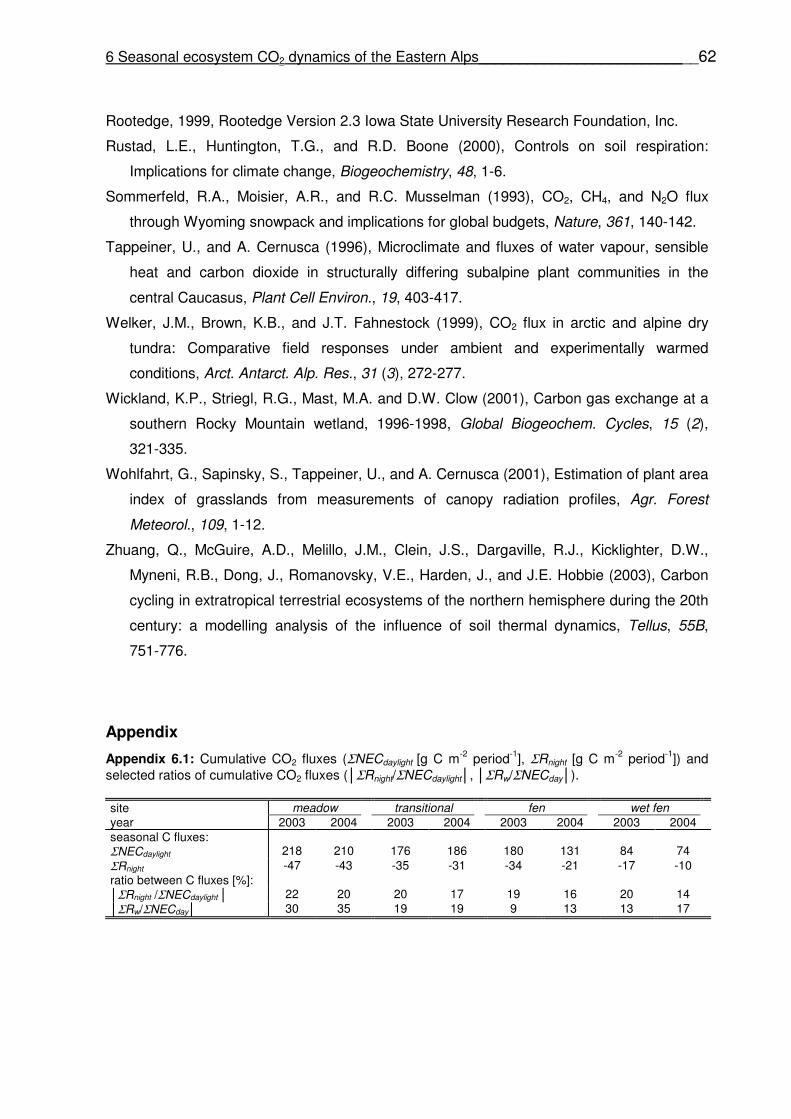
6 Seasonal ecosystem CO2 dynamics of the Eastern Alps___________________________62
Rootedge, 1999, Rootedge Version 2.3 Iowa State University Research Foundation, Inc.
Rustad, L.E., Huntington, T.G., and R.D. Boone (2000), Controls on soil respiration:
Implications for climate change, Biogeochemistry, 48, 1-6.
Sommerfeld, R.A., Moisier, A.R., and R.C. Musselman (1993), CO2, CH4, and N2O flux
through Wyoming snowpack and implications for global budgets, Nature, 361, 140-142.
Tappeiner, U., and A. Cernusca (1996), Microclimate and fluxes of water vapour, sensible
heat and carbon dioxide in structurally differing subalpine plant communities in the
central Caucasus, Plant Cell Environ., 19, 403-417.
Welker, J.M., Brown, K.B., and J.T. Fahnestock (1999), CO2 flux in arctic and alpine dry
tundra: Comparative field responses under ambient and experimentally warmed
conditions, Arct. Antarct. Alp. Res., 31 (3), 272-277.
Wickland, K.P., Striegl, R.G., Mast, M.A. and D.W. Clow (2001), Carbon gas exchange at a
southern Rocky Mountain wetland, 1996-1998, Global Biogeochem. Cycles, 15 (2),
321-335.
Wohlfahrt, G., Sapinsky, S., Tappeiner, U., and A. Cernusca (2001), Estimation of plant area
index of grasslands from measurements of canopy radiation profiles, Agr. Forest
Meteorol., 109, 1-12.
Zhuang, Q., McGuire, A.D., Melillo, J.M., Clein, J.S., Dargaville, R.J., Kicklighter, D.W.,
Myneni, R.B., Dong, J., Romanovsky, V.E., Harden, J., and J.E. Hobbie (2003), Carbon
cycling in extratropical terrestrial ecosystems of the northern hemisphere during the 20th
century: a modelling analysis of the influence of soil thermal dynamics, Tellus, 55B,
751-776.
Appendix
Appendix 6.1: Cumulative CO2 fluxes (ΣNECdaylight [g C m-2 period-1], ΣRnight [g C m-2 period-1]) and selected ratios of cumulative CO2 fluxes (│ΣRnight/ΣNECdaylight│, │ΣRw/ΣNECday│). site meadow transitional fen wet fen year 2003 2004 2003 2004 2003 2004 2003 2004 seasonal C fluxes: ΣNECdaylight
218
210
176
186
180
131
84
74
ΣRnight -47 -43 -35 -31 -34 -21 -17 -10 ratio between C fluxes [%]: │ΣRnight /ΣNECdaylight │ 22 20 20 17 19 16 20 14 │ΣRw/ΣNECday│ 30 35 19 19 9 13 13 17

7 Temperature sensitivity of C- and N processes in organic alpine soils________________63
7 Temperature sensitivity of microbial respiration, nitrogen
mineralization and potential soil enzyme activities in organic alpine
soils
7.1 Abstract
Investigations focusing on the temperature sensitivity of microbial activity and nutrient
turnover in soils improve our understanding of potential effects of global warming. This study
investigates the temperature sensitivity of C mineralization, N mineralization and potential
enzyme activities involved in the C- and N cycle (tyrosine aminopeptidase, leucine
aminopeptidase, ß-glucosidase, ß-xylosidase, N-acetyl-ß-glucosidase). Four different study
sites in the Austrian alpine zone were selected and soils were sampled in three seasons
(summer, autumn, winter). A simple first-order exponential equation was used to calculate
constant Q10 values for the C- and N mineralization over the investigated temperature range
(0-30°C). The Q10 values of the C mineralization (average 2.0) for all study sites were
significantly higher than for the N mineralization (average 1.7). The Q10 values of both
activities were significantly negatively related to a soil organic matter quality index calculated
by the ratios of respiration to the organic soil carbon and mineralized N to the total soil
nitrogen. The chemical soil properties or microbial biomass did not affect the Q10 values of C-
and N mineralization. Moreover, the Q10 values showed no distinct pattern according to
sampling date, indicating that the substrate quality and other factors are more important.
Using a flexible model function, the analysis of relative temperature sensitivity (RTS) showed
that the temperature sensitivity of activities increased with decreasing temperature. The
C- and N mineralization and potential aminopeptidase activities (tyrosine, leucine) showed an
almost constant temperature dependance over 0-30°C. In contrast, ß-glucosidase,
ß-xylosidase and N-acetyl-ß-glucosaminidase showed a distinctive increase in temperature
sensitivity with decreasing temperature. Low temperature at winter sampling date caused a
greater increase in the RTS of all microbial activities than for autumn and summer sampling
date. Our results indicate (I) a disproportion of the RTS for potential enzyme activities of the
C- and N cycle and (II) a disproportion of the RTS for easily degradable C compounds
(ß-glucose, ß-xylose) compared with the C mineralization of soil organic matter. Thus,
temperature may play an important role in regulating the decay of different soil organic
matter fractions due to differences in the relative temperature sensitivities of enzyme
activities.
7 Temperature sensitivity of C- and N processes in organic alpine soils________________64
7.2 Introduction
Alpine soils store a large pool of soil organic matter [Körner, 1999]. The alpine zone is
adapted to a cool environment characterized by a long seasonal snow cover and a short
vegetation period. A recent study predicted an increase of mean summer temperature
between 3-5°C for the next 100 years, being more intensive for the European Alps than for
temperate regions in Europe [Heimann and Sept, 2000]. The strong influence of temperature
on carbon mineralization has been reviewed for different conditions [e.g. Kirschbaum, 1995;
Kirschbaum, 2000; Lloyed and Taylor, 1994]. The hypothesis that respiration depends more
on temperature than net photosynthesis is crucial for the ecosystem C balance [Kirschbaum,
2000]. This makes investigations on the temperature sensitivity of C mineralization very
important. The temperature quotient (Q10) describes the ratio of activity for a 10°C (or 10 K)
change of temperature. However, there is still no consensus about the form of the
relationship between temperature and decomposition [Kätterer et al., 1998]. The temperature
quotient (Q10) is often calculated by simple first-order exponential functions yielding a
constant Q10 over the investigated temperature range. Q10 values of soil respiration are
influenced by substrate quality [Fierer et al., 2006; Mikan et al., 2002]. On the other hand,
flexible exponential functions implying an increasing temperature sensitivity at low
temperatures have been found to best describe the temperature response for C- or N
mineralization over a wide temperature range [Kirschbaum, 1995; Lloyed and Taylor, 1994].
The temperature sensitivity of N mineralization is more difficult to investigate because of
methodological problems in distinguishing between different soil N turnover processes. In
general, the temperature sensitivity of net N mineralization appeared to be slightly lower than
of C mineralization for a wide range of investigated soils [Kirschbaum, 1995]. Kirschbaum
[1995], however, pointed out that the high individual range of reported values precludes a
final conclusion. Magit et al. [2001] found that the decay of plant residues at low
temperatures resulted in a higher proportion of mineralized nitrogen compared with C
mineralization. The net N mineralization is a result of the mineralization-immobilization
turnover (MIT). There was no relationship between net N mineralization rate of various
humus samples and incubation temperatures below 15°C [Niklińska et al., 1999].
The 15N pool dilution technique showed a higher temperature sensitivity of gross
N immobilization versus gross N mineralization for soils being treated with green manure
[Andersen and Jensen, 2001]. This temperature-dependent decoupling of MIT may be crucial
in understanding the temperature dependency of N cycling of easily degradable substrates
like plant residues in agro-ecosystems. However, little information is available about the
temperature sensitivity of C- and N processes in organic soils in alpine regions. Additionally,
the temperature sensitivity of soil microbial activities in the alpine environment may change
seasonally as an adaptation to seasonal changes in microbial biomass [Lipson et al., 2002].
7 Temperature sensitivity of C- and N processes in organic alpine soils________________65
Extracellular enzymes are important because they catalyze the rate-limited steps of
decomposition and nutrient cycling [Sinsabaugh, 1994]. Surprisingly, there are very few
published data about temperature sensitivities of a wider range of potential enzyme activities
within a given soil [Trasar-Cepeda et al., 2007]. In general, potential enzyme activities have
been found to depend less on temperature compared to the C mineralization with Q10
values < 2 [Browman and Tabatabai, 1978; Tabatabai, 1982].
This study investigates the C- and N mineralization as well as the potential activity of soil
enzymes involved in C- and N cycling over a temperature range of 0-30°C. We tested the
hypothesis that (I) the Q10 value of C mineralization is higher than that of N mineralization,
(II) Q10 values of C- and N mineralization are lower in winter than in summer as an
adaptation of the microbial biomass, (III) the relative temperature sensitivity (RTS) of C- and
N mineralization as well as enzyme activity increases with decreasing temperature, and
(IV) the quality of soil organic matter influences the temperature sensitivity of C- and
N mineralization. Four alpine study sites were selected (one meadow and three fen plots),
and soil samples were taken in three seasons (summer, autumn and winter).
7.3 Material and methods
2.3.1 Study sites description
The study sites are located in the Rotmoos valley of the Ötztal range (46°50´N, 11°03´E) in
Tyrol (Austria) above the present tree line (2250 m a.s.l.). The snow-free period is about
4.5 months (June to mid-October) (M. Strobel, University of Innsbruck, personal
communication), mean annual precipitation is 820 mm (1970-1996) and mean annual air
temperature (1997-1998) is -1.3°C [Kaufmann, 2001].
Four study sites were chosen along a natural moisture transect (one alpine dry meadow and
three sites in the Rotmoos fen); they differed in water balance and plant community. The first
site is a well-drained alpine dry meadow (meadow) classified as a Curvulo-Nardetum
(G.-H. Zeltner, University of Hohenheim, personal communication). The other three sites are
located in the Rotmoos fen. The fen is mainly fed by surface water from runnels flowing down
the hill slopes of the flanking mountains. The first site in the Rotmoos fen (transitional) is a
Carici echinatae-Trichophoretum caespitosi community [Rybníček and Rybníčková, 1977].
This transitional site is located closer to the meadow site than the other fen sites and
contains a high cover of plant species belonging also to the Curvulo-Nardetum. The second
fen site (fen) is located deeper in the Rotmoos fen and is characterized by a typical
Carici echinatae-Trichophoretum caespitosi plant community [Rybníček and Rybníčková,
1977]. The species richness was lower than at the transitional site. The third fen site
(wet fen) is located in the centre of the Rotmoos fen and consists solely of Carex nigra L.

7 Temperature sensitivity of C- and N processes in organic alpine soils________________66
with a sparse vegetation cover compared to all other study sites. This site can be temporarily
flooded by ground water.
7.3.2 Soil sampling, chemical soil properties and microbial biomass (Cmic)
All soils represent mature alpine stages and have been developed since the last ice age
(5000-10000 years ago) [Bortenschlager, 1970]. The parent material of the meadow soil
consists of loamy sandy silicates and granite with a maximum soil depth of 50 cm. The
substrate is silty sand and the soil is classified as an acid Cambisol. All soils in the fen are
rheic Histosols with soil depths deeper than 1 m. The sites were randomly sampled in 0-5 cm
soil depth (n=5 for each study site) at three sampling dates: the first sampling date was in
autumn (a: October 3, 2002), the second date in summer (s: July 5, 2003) and third date in
winter (w: February 2 2004) under a snow cover of about 180 cm. The mean daily soil
temperature in 5 cm depth for ± 2 weeks around the sampling date was similar for all study
sites. The overall order was: s (14.2°C) > a (3.9°C) > w (0.0°C). The samples were carefully
homogenised by hand and the roots were sorted out. The homogenised soil was stored
frozen (-20°C) in plastic bags until analysis. The chemical soil properties (pH(CaCl2), Corg, Nt)
and microbial carbon (Cmic) were determined for every sampling date. The pH(CaCl2) was
potentiometrically determined using 5 g soil and 10 ml 0.01 M CaCl2 solution. The total
carbon (Ct) and total nitrogen (Nt) were determined on air-dried soil by dry combustion at
1200°C using a LECO CNS 2000 element analyser with infrared and thermal conductivity
detector. Since all soils were acidic, Ct was considered as soil organic carbon (Corg). Cmic was
determined from field-moist soil samples with the chloroform fumigation-extraction (CFE)
method. The soil samples (1 g, n=3) were fumigated for one day in chloroform vapour,
followed by extraction (0.5 M K2SO4), filtration and analysis of the dissolved organic carbon
(DOC) by flow injection analysis (Dimatoc 100 TOC/TN-analyzer, Dimatec, Germany). The
DOC of blanks (n=3) was extracted from each soil sample without fumigation. Cmic was
calculated by the difference between fumigated samples and the blanks with the recovery
factor of 0.45 proposed for peat soils [Sparling et al., 1990]. The chemical properties and Cmic
of the autumn samples are listed in Tab. 7.1. There were no significant differences between
the sampling dates for any soil property at any study site (F(date)≤2.9; p≥0.06;
two-way ANOVA).

7 Temperature sensitivity of C- and N processes in organic alpine soils________________67
Table 7.1: Chemical soil properties and Cmic of the study sites (autumn sampling). Different letters in the column indicate significant differences of the means between study sites. Values in parentheses are standard errors.
pH(CaCl2) Corg [%] Nt [%] Corg Nt-1 [% %-1] Cmic Corg
–1 [mg g C-1] meadow 3.9 (0.1) a 17.0 (1.9) a 1.0 (0.1) a 17.1 (1.6) a 42.8 (6.2) a transitional 4.3 (0.1) a 28.2 (1.8) b 1.6 (0.1) b 17.2 (0.7) a 23.3 (4.1) b fen 4.3 (0.1) a 30.8 (2.2) b 1.5 (0.1) b 21.1 (0.8) b 17.2 (3.8) b wet fen 4.0 (0.1) a 35.1 (1.3) b 1.6 (0.1) b 22.0 (0.9) b 18.9 (5.2) b
7.3.3 Temperature incubation experiment
C mineralization, N mineralization and enzyme activities involved in C- and N cycling were
measured in all soil samples over a temperature range of 0-30°C (5°C steps). Two
incubators (Heraeus BK 600) and a climate chamber (SBS C120) were used to regulate the
temperature with a precision (±1°C) that prevented any sample in any analysis from freezing
during the incubation time at 0°C.
7.3.3.1 C mineralization
The frozen soil samples were allowed to thaw at 4°C for 10 days before the incubation
experiment started. The water content of the soil samples was not adjusted prior the
incubation experiment to avoid disturbance and/or adaptation to surrounding temperature
during time of adjustment. However, the water content of the soils was not expected to limit
soil respiration; all samples corresponded to a range of 79 to 98% maximum water holding
capacity. Temperature sensitivity was determined by measuring the activity response of a
soil sample to the different temperature steps. Soil samples (10 g) were incubated in air-tight
flasks and the CO2 evolved was trapped in 2 ml of NaOH (1 M) and titrated by HCL (0.1 M)
after treated with 0.5 ml saturated BaCl2. Blanks (n=3) were run in the same procedure for
each incubation temperature. The soil samples were allowed to adapt to the incubation
temperature in open flasks for at least 2 hours before the measurement started. The
incubation time varied depending on incubation temperature, starting with 9 days at 0°C and
ending with 1 day at 30°C (in total 25 days). During the experiment, soil moisture was kept
constant. A preliminary experiment showed that soil respiration was constant for all study
sites after 7 days and that cumulative CO2 evolution (at 20°C) for all study sites was linear
(R2>0.98) for at least 6 weeks (data not shown). We therefore conclude that the temperature
sensitivity during the total incubation time is not affected by decreasing respiration rates due
to changes in the substrate quality of the soil organic matter.
7 Temperature sensitivity of C- and N processes in organic alpine soils________________68
7.3.3.2 N mineralization
The N mineralization was measured under water-logged anaerobic conditions according to
Keeney [1982] and Kandeler [1996]. Thus, 3 sub-samples (5 g) of each soil sample were
mixed with 15 ml deionized water and incubated for 4 days. The N-NH4+ produced was
measured colorimetrically (Berthelot colour reaction) at 660 nm after being extracted with
KCL (2 M) and filtered (N-free filters). Blanks were run in triplicates for each soil sample
(immediately extracted and measured without incubation). The N mineralization activity was
determined as the difference between samples and blanks (zero-order reaction). A
preliminary study was conducted to investigate the effect of incubation time (2, 4, 6, 8 and
12 days) on NH4+ production at different incubation temperatures (0°C, 15°C and 30°C) for
the summer soil samples. For all soils and all incubation temperatures, the NH4+ production
was constant for at least 4 days. After this period, values fell or were even slightly negative
(probably indicating N immobilization) (data not shown). Water-logging of soil samples may
not immediately result in anaerobic soil conditions, especially at low incubation temperatures
with their usually low activity. N mineralization may therefore be underestimated because
ammonium is oxidized during incubation. The potential nitrification activity of the study soils
was tested according to Berg and Rosswall [1985] and no significant nitrification activity was
detected. Thus, ammonium oxidation is not important for these acidic alpine soils and does
not influence the N mineralization rates in our study.
7.3.3.3 Enzyme activity
Hydrolytic enzymes involved in C- and N processes were investigated using a fluorimetric
microplate assay [Marx et al., 2001]. The activities of ß-glucosidase (GLUC; E.C. 3.2.1.21),
ß-xylosidase (XYL; E.C. 3.2.2.37) and N-acetyl-ß-glucosaminidase (NAG; E.C. 3.2.1.30)
were measured using 4-methylumbelliferyl (MUB)-ß-1,4-glucoside, MUB-ß-xylopyranoside
and MUB-N-acetyl-ß-1,4-glucosaminide, respectively. The activity of leucine aminopeptidase
(LEU; E.C. 3.4.11.1) and tyrosine aminopeptidase (TYRO; E.C. 3.4.11) were measured
using L-leucine-7-amino-4-methyl-coumarin and L-tyrosine-7-amido-4-methyl-coumarin,
respectively. The enzyme activity was determined as the hydrolytic cleavage of
4-methylumbelliferone (MUB) and 7-amido-methylcoumarin (AMC) from MUB- and
AMC-labelled substrate, respectively. Before measuring the enzyme activities, suspensions
(soil:water=1:100) were prepared from each soil sample using low-energy sonication
(50 J s-1 output energy for 2 min according to Stemmer et al. [1998]) and 20 µl were
transferred into vials of a 96-well microplate. 80 µl of buffer (100 mM
2-[N-morpholino]ethanesulfonic acid buffer (pH 6.1) for MUB substrate or TRIZMA buffer

7 Temperature sensitivity of C- and N processes in organic alpine soils________________69
(pH 7.8) for AMC substrate and 100 µl of substrat (1 mM) were added to each sample and
incubated at the respective temperature using incubators or the climate chamber. All
solutions and soil suspensions were prepared with autoclaved deionized water. Impurities of
the solutions and/or the stability of the substrates were proved with blanks (samples without
soil suspension). All temperature steps were conducted with each soil solution within 12 h.
The release of MUB or AMC was measured using an automated luminescense
spectrophotometer (FLx 800 microplate, Bio-Tex Instruments, Inc.; emission 446 nm,
extinction 377 nm) at 20 to 40 min intervals for at least 2 h (depending on incubation
temperature). After each measurement (∼1 min) the microplates were immediately returned
to the incubators or the climate chamber. The produced fluorescense was converted into
amounts of MUB or AMC with soil-specific standards to correct for possible quenching
effects of the soil matrix on the fluorescense intensity.
7.3.4 Temperature models
Two different temperature models were used to calculate the temperature sensitivity of the
investigated activities. The first model is a simple first-order exponential equation 7.1:
(7.1) )(
)(
BT
T eAf ⋅= ; T: temperature [°C],
A is the exponential constant, or activity at 0°C, and B the exponential parameter of the
equation.
The second model is a flexible exponential equation 7.2 [Lloyed and Taylor, 1994]:
(7.2) ))/((
1)(01 TTB
T eAf−−
⋅= ; T: temperature [K],
A1 is the exponential constant, while B1 (loosely related to the activation energy) and T0 are
the exponential parameters [see Kirschbaum, 2000; Lloyed and Taylor, 1994]. This function
implies a temperature sensitivity decreasing with increasing temperature and was found to
be safely applicable for soil respiration at a temperature range of –10°C to almost 40°C

7 Temperature sensitivity of C- and N processes in organic alpine soils________________70
[Lloyed and Taylor, 1994]. The relative temperature sensitivity (RTS) was calculated
according to equation 7.3:
(7.3) 2
0
1)(
)(
)()(
)1
(TT
B
dT
df
fRTS
T
T
T−
=⋅= ,
Equation 7.3 is a derivation function of equation 7.2 and allows the temperature sensitivity to
be calculated for a given temperature [Lloyed and Taylor, 1994].
Equation 7.1 was used to calculate constant Q10 values of the C- and N mineralization.
Q10 values of the potential enzyme activities were not calculated because the hydrolytic
cleavage of MUB- or AMC substrates may bias the activation energy and therefore the
temperature dependency [Fey and Conrad, 2003]. Hence, the mutated activation energy of
the artificial substrates influences the absolute temperature sensitivity (according to the
Arrhenius theory) and is therefore not useful in interpreting these values.
Equation 7.2 was used to calculate the RTS of the activities (C mineralization, N
mineralization, potential enzyme activities) for two different temperature frames (∆5°C). We
select the temperature frames 0-5°C: RTS(0-5) and 13-18°C: RTS(13-18), which incorporated the
average mean daily soil temperatures (±2 weeks) at the three sampling dates for all study
sites. Since at a given temperature RTS depends on the activation energy, the ratio
RTS(0-5)/RTS(13-18) was calculated. This procedure allows comparing the RTS of all
investigated activities. Hence, a higher RTS(0-5)/RTS(13-18) ratio indicates a greater increase of
the RTS with decreasing temperature than a lower RTS(0-5)/RTS(13-18).
7.3.5 Data handling and statistics
All results are calculated on an oven-dry weight basis (105°C, 2 days). The
C mineralization (µg C-CO2 g-1 C day-1) was calculated on a Corg basis. This relation is an
index for substrate quality [e.g. Fierer et al., 2006; Mikan et al., 2002]. Higher respiration
rates related to the Corg indicate a better substrate quality. The N mineralization
(µg N-NH4+ g-1 N day-1) was calculated on a Nt basis. The potential enzyme activities
(nmol MUB g-1 min-1 or nmol AMC g-1 min-1) were related to the bulk soil. The Q10 values were
linearly correlated with the chemical soil properties (pH(CaCl2), Corg, Nt, Corg Nt-1), Cmic and the
exponential constant A derived by equation 7.1 (AC: exponential constant A of

7 Temperature sensitivity of C- and N processes in organic alpine soils________________71
C mineralization; AN: exponential constant A of N mineralization) in order to investigate the
influence of these parameters on the temperature sensitivity. An a priori inverse auto-
correlation between A and Q10 values (as demonstrated by Reichstein et al. [2005] when only
one individual data set was used) did not exist because our A- and Q10 values are derived
from more individual data sets (n=60 for each activity). Normal distribution of the data was
tested by the Kolmogorow-Smirnoff-goodness-of-fit test, and homogeneity of variances was
tested by Levene´s test. Differences of the Q10 values (C-, N mineralization) and the
RTS(0-5)/RTS(13-18) ratios (C-, N mineralization and enzymes (GLUC, XYL, NAG, TYRO, LEU))
were tested by a simple two-factorial analysis of variance (factor 1: sampling date (Fdate);
factor 2: study site (Fsite)). Differences of the mean Q10 values between the C- and
N mineralization were tested with a mixed linear model using the restricted maximum
likelihood (REML) measure. The model contains a fixed three-factorial design (factor 1,
element of mineralization (C or N): Felement; factor 2: Fdate and factor 3: Fsite) combined with a
repeated random subject term (date x site x replicate (within the site x date interaction)). This
random interaction term accounts for the correlation of both activities within soil samples.
Differences of the RTS(0-5)/RTS(13-18) between activities (C-, N mineralization and enzymes
(GLUC, XYL, NAG, TYRO, LEU)) were tested with the same mixed linear model design
(factor 1: activity (Factivity); factor 2: Fdate; factor 3: Fsite and the repeated interaction of
date x site x replicate (within the site x date interaction)). All values in the figures and tables
are means (± standard error). For ease of interpretation, all temperatures in the figures are
given in the Celsius scale.
7.4 Results
7.4.1 Q10 of the C- and N mineralization
The simple first-order exponential equation was used to calculate constant Q10 values for the
entire investigated temperature range (0-30°C) (Tab. 7.2). The predicting ability (R2) of the
fitted model for the individual field replicates was 0.85 to 0.99 (C mineralization) and
0.78 to 0.96 (N mineralization).
The mean (±SE) Q10 value of the C mineralization for all field replicates, study sites and
sampling dates was 2.0 (±0.04). There was only a small significant difference for sampling
date (Fdate=4.3, p=0.019; two-way ANOVA), with a higher mean Q10 value in autumn (2.1)
than in summer (1.9) and winter (2.0). The mean (±SE) Q10 value of the N mineralization for
all field replicates, sampling date and study sites was 1.7 (±0.03). Significant differences
were found for sampling date (Fdate=7.1, p=0.002; two-way ANOVA), with a higher mean Q10
value in winter (1.8) than in summer (1.6) and autumn (1.6). The study site (Fsite) or the factor

7 Temperature sensitivity of C- and N processes in organic alpine soils________________72
interaction Fsite x Fdate were not significant for C mineralization (p≥0.113) and N mineralization
(p≥0.211).
The mixed model identified an overall (all sampling dates and study sites) higher mean Q10
value for C mineralization than for N mineralization (Felement=37.8, p<0.001). However, there
was also a small significant Felement x Fdate interaction (Felement x date =5.2, p=0.007), mirroring
the different results of the C- and N mineralization for Fdate in the two-way ANOVA. In
addition, a small significant difference was found for sampling date (Fdate=5.8, p=0.004), with
a lower mean Q10 value in summer (1.7) than in autumn (1.9) and winter (1.9). The factor
study site (F(site)) and all other factor interactions were not significant (p≥0.112).
Table 7.2: Model parameters of the simple first-order exponential function (equation 7.1) for C- and N mineralization. Units: AC [µg C-CO2 g-1 C day-1], AN [µg N-NH4
+ g-1 N day-1], B [°C-1]. Values are means (± standard errors).
The correlation of the Q10 values with the exponential constant A (index for substrate quality)
was examined to investigate the influence of substrate quality on the temperature sensitivity
of C- and N mineralization. The index for substrate quality of the C mineralization (AC) and
N mineralization (AN) was inversely related to the corresponding Q10 values (Fig. 7.1). The
regressions explained 44% (C mineralization) and 54% (N mineralization) of the variability of
Q10 values. The slopes of the linear regressions and the y-axis intercepts were almost
similar, being slightly lower for the C- than for N mineralization. There were no significant
correlations between Q10 values and all other independent soil properties (pH(CaCl2), Corg, Nt,
Corg Nt-1 and Cmic (p>0.115)).
simple first-order model : )(
)(
BT
T eAf ⋅= ; T [°C] C mineralization N mineralization
AC B Q10 R2 AN B Q10 R2 summer: meadow 49.3 (9.1) 0.059 (0.004) 1.8 (0.1) 0.87-0.94 73.6 (10.1) 0.048 (0.003) 1.6 (0.1) 0.83-0.95 transitional 36.3 (6.2) 0.054 (0.006) 1.7 (0.1) 0.91-0.98 82.3 (9.3) 0.039 (0.004) 1.5 (0.1) 0.86-0.93 fen 34.1 (7.3) 0.063 (0.004) 1.9 (0.1) 0.85-0.93 94.7 (8.2) 0.044 (0.004) 1.5 (0.1) 0.82-0.92 wet fen 22.9 (6.7) 0.068 (0.005) 2.0 (0.1) 0.87-0.98 51.5 (11.6) 0.053 (0.005) 1.7 (0.1) 0.83-0.91 autumn: meadow 53.0 (9.9) 0.073 (0.004) 2.1 (0.1) 0.88-0.99 103.6 (14.3) 0.041 (0.005) 1.5 (0.1) 0.84-0.96 transitional 27.4 (5.1) 0.076 (0.005) 2.1 (0.1) 0.91-0.97 55.0 (6.1) 0.054 (0.004) 1.7 (0.1) 0.84-0.94 fen 34.1 (7.1) 0.070 (0.005) 2.0 (0.1) 0.88-0.96 75.7 (5.3) 0.041 (0.005) 1.5 (0.1) 0.81-0.91 wet fen 24.4 (4.1) 0.081 (0.004) 2.3 (0.1) 0.89-0.97 87.0 (8.4) 0.043 (0.003) 1.5 (0.1) 0.78-0.90 winter: meadow 95.3 (16.1) 0.056 (0.005) 1.7 (0.1) 0.89-0.95 144.6 (17.3) 0.047 (0.003) 1.6 (0.1) 0.84-0.95 transitional 17.4 (3.9) 0.078 (0.004) 2.2 (0.1) 0.87-0.97 58.4 (7.5) 0.061 (0.004) 1.8 (0.1) 0.85-0.94 fen 48.5 (5.1) 0.057 (0.005) 1.8 (0.1) 0.89-0.96 64.0 (8.3) 0.061 (0.004) 1.8 (0.1) 0.80-0.90 wet fen 20.2 (4.2) 0.076 (0.004) 2.1 (0.1) 0.88-0.97 38.8 (5.4) 0.056 (0.004) 1.7 (0.1) 0.78-0.92

7 Temperature sensitivity of C- and N processes in organic alpine soils________________73
Figure 7.1: Relationship between Q10 values and the exponential constant A (index of soil organic matter quality). Q10 values, A of C mineralization (AC) and N mineralization (AN) were obtained from a simple first-order exponential equation (equation 7.1).
7.4.2 Substrate quality index of the C- and N mineralization
The substrate quality index of the C mineralization (AC) was related to the substrate quality
index of the N mineralization (AN) (Fig. 7.2). If both soil-derived activities were in
quasi- equilibrium with the available soil substrate (Corg, Nt), we would expect a 1:1 dialog.
A significant linear relationship between AC and AN was found, being almost parallel to the
1:1 line. The regression line, however, did not go through the origin. If the regression line
was forced to go through the origin, the relationship between AC and AN was not significant.
Thus, both activities were much better described by including a constant y-axis intercept term
(41.6) in the regression equation. This leads to the assumption that the different methods
employed here to study C- and N mineralization may use different pools of soil organic
matter and are not directly related.
Figure 7.2: 1:1 dialog between the exponential constant A (index of soil organic matter quality) of C mineralization (AC) and N mineralization (AN); obtained from a simple first-order exponential equation (equation 7.1). Solid line is the linear regression line between C- and N mineralization; dashed line represents the linear regression through origin.
0
50
100
150
200
0 50 100 150 200
1:1
y=1.90xR2=0.10; p>0.05
y=1.06x + 41.6R2=0.53; p=0.009
Ac [µg CO2-C g C day-1]
AN [µ
g N
H4+
-N g
N d
ay-1
]
N mineralizationy=-0.43x + 3.52R2=0.54, p<0.001
Q10
ln AC [µg C-CO2 g-1 C day-1]
C mineralizationy=-0.37x + 3.30R2=0.44, p<0.001
ln AN [µg N-NH4+ g-1 N day-1]
0
1
2
3
2 3 4 5
0
1
2
3
2 3 4 5
Q10

7 Temperature sensitivity of C- and N processes in organic alpine soils________________74
7.4.3 Relative temperature sensitivity (RTS) of the C- and N mineralization and
enzyme activities (TYRO, LEU, GLUC, XYL, NAG)
The flexible temperature dependance model [Lloyed and Taylor, 1994] was used to
determine the relative temperature sensitivity (RTS) of all activities (Tab. 7.3, Tab. 7.4). The
equation follows the hypothesis that temperature sensitivity increases with decreasing
temperature. The predicting ability (R2) of the fitted flexible model for the individual field
replicates of all activities (all sampling dates and study sites) were between 0.78 to 0.96. Its
predicting ability was similar to the simple first-order exponential equation model for C- and
N mineralization (Tab. 7.2, Tab. 7.3). RTS values (C- and N mineralization, enzyme
activities) were plotted against temperature in Fig. 7.3. The C- and N mineralization and the
aminopeptidases (TYRO, LEU) showed almost no increase of the RTS with decreasing
temperature. In contrast, GLUC, XYL and NAG more closely followed the flexible model, with
much higher RTS values at low than at higher temperatures. This relative trend of the curves
was generally observed for all study sites and all sampling dates (data not shown).
Table 7.3: Model parameters of the flexible temperature dependance function (equation 7.2) for C- and N mineralization. Units: A1 [µg C-CO2 g-1 C day-1] (C mineralization) and [µg N-NH4
+ g-1 N day-1] (N mineralization) and B1, T0 [K]. Values are means (± standard errors).
flexible model [Lloyd and Taylor, 1994]: ))/((
1)(01 TTB
T eAf−−
⋅= ; T [K]
C mineralization N mineralization A1 B1 T0 R2 A1 B1 T0 R2 summer: meadow 3.12 108 (4.23 107) 3853 (582) 56 (9) 0.88-0.94 8.92 106 (1.12 106) 2553 (306) 88 (13) 0.84-0.95 transitional 5.68 108 (5.24 107) 4216 (564) 46 (12) 0.91-0.98 6.78 105 (7.58 104) 1720 (196) 114 (15) 0.85-0.93 fen 2.24 107 (2.80 106) 3284 (539) 63 (6) 0.85-0.93 3.24 105 (4.35 104) 1357 (171) 137 (19) 0.82-0.92 wet fen 8.46 106 (6.18 105) 2841 (432) 87 (14) 0.87-0.97 6.17 104 (5.68 103) 1167 (132) 143 (17) 0.85-0.91 autumn: meadow 4.27 107 (5.14 106) 2887 (349) 87 (16) 0.87-0.98 2.89 105 (3.96 104) 1207 (140) 149 (24) 0.84-0.97 transitional 2.84 106 (3.18 105) 2353 (326) 99 (13) 0.91-0.97 5.88 106 (8.35 105) 2667 (253) 79 (11) 0.84-0.94 fen 4.46 107 (6.42 106) 3221 (432) 73 (10) 0.87-0.96 6.48 105 (8.22 104) 1494 (186) 137 (26) 0.81-0.92 wet fen 3.13 106 (2.53 105) 2479 (335) 96 (18) 0.89-0.98 1.38 105 (2.26 104) 1124 (152) 151 (20) 0.78-0.90 winter: meadow 2.70 107 (3.72 106) 2955 (345) 64 (9) 0.89-0.95 7.94 104 (9.69 103) 814 (67) 172 (17) 0.83-0.96 transitional 1.03 105 (9.93 103) 1367 (132) 148 (21) 0.86-0.97 4.27 104 (4.02 103) 889 (99) 167 (26) 0.85-0.94 fen 2.96 107 (4.27 106) 3278 (423) 53 (8) 0.90-0.96 1.35 104 (1.67 103) 710 (103) 174 (31) 0.80-0.90 wet fen 1.08 106 (1.63 105) 2162 (301) 111 (13) 0.88-0.97 2.31 104 (3.20 103) 950 (169) 162 (19) 0.77-0.91
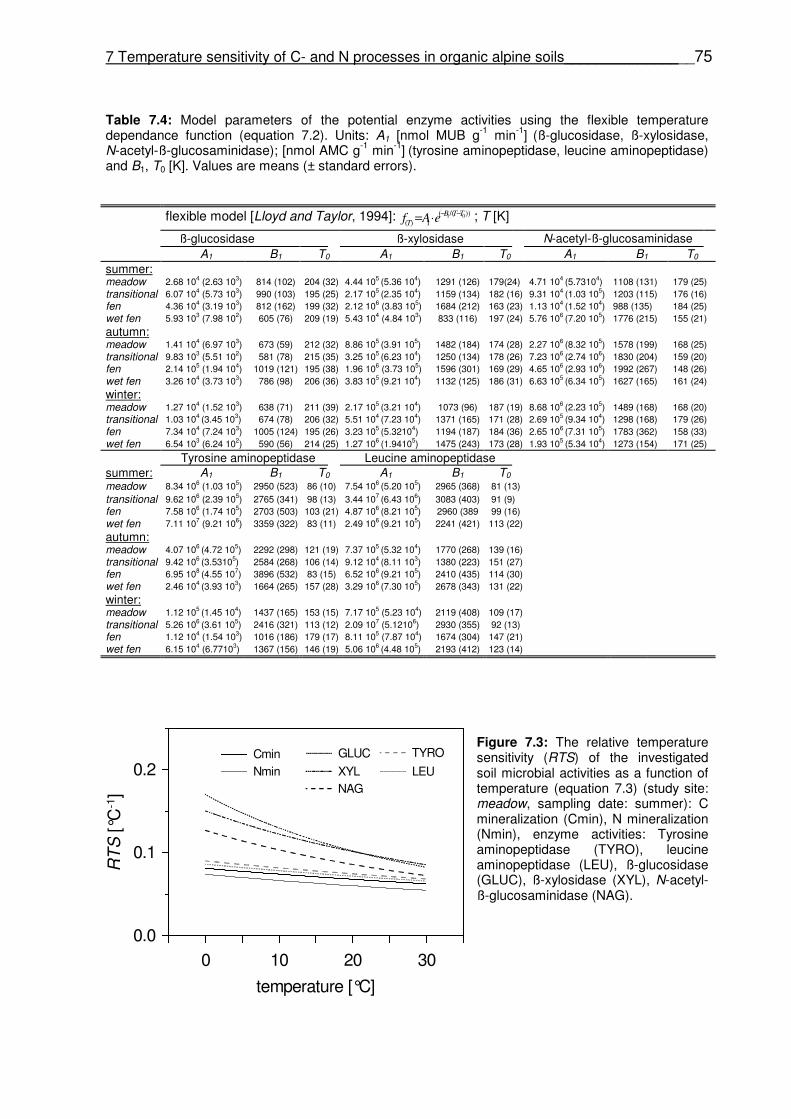
7 Temperature sensitivity of C- and N processes in organic alpine soils________________75
Table 7.4: Model parameters of the potential enzyme activities using the flexible temperature dependance function (equation 7.2). Units: A1 [nmol MUB g-1 min-1] (ß-glucosidase, ß-xylosidase, N-acetyl-ß-glucosaminidase); [nmol AMC g-1 min-1] (tyrosine aminopeptidase, leucine aminopeptidase) and B1, T0 [K]. Values are means (± standard errors).
Figure 7.3: The relative temperature sensitivity (RTS) of the investigated soil microbial activities as a function of temperature (equation 7.3) (study site: meadow, sampling date: summer): C mineralization (Cmin), N mineralization (Nmin), enzyme activities: Tyrosine aminopeptidase (TYRO), leucine aminopeptidase (LEU), ß-glucosidase (GLUC), ß-xylosidase (XYL), N-acetyl-ß-glucosaminidase (NAG).
flexible model [Lloyd and Taylor, 1994]: ))/((
1)(01 TTB
T eAf−−
⋅= ; T [K]
ß-glucosidase ß-xylosidase N-acetyl-ß-glucosaminidase A1 B1 T0 A1 B1 T0 A1 B1 T0 summer: meadow 2.68 104 (2.63 103) 814 (102) 204 (32) 4.44 105 (5.36 104) 1291 (126) 179(24) 4.71 104 (5.73104) 1108 (131) 179 (25) transitional 6.07 104 (5.73 103) 990 (103) 195 (25) 2.17 105 (2.35 104) 1159 (134) 182 (16) 9.31 104 (1.03 105) 1203 (115) 176 (16) fen 4.36 104 (3.19 103) 812 (162) 199 (32) 2.12 106 (3.83 105) 1684 (212) 163 (23) 1.13 104 (1.52 104) 988 (135) 184 (25) wet fen 5.93 103 (7.98 102) 605 (76) 209 (19) 5.43 104 (4.84 103) 833 (116) 197 (24) 5.76 106 (7.20 105) 1776 (215) 155 (21)
autumn: meadow 1.41 104 (6.97 103) 673 (59) 212 (32) 8.86 105 (3.91 105) 1482 (184) 174 (28) 2.27 106 (8.32 105) 1578 (199) 168 (25) transitional 9.83 103 (5.51 102) 581 (78) 215 (35) 3.25 105 (6.23 104) 1250 (134) 178 (26) 7.23 106 (2.74 106) 1830 (204) 159 (20) fen 2.14 105 (1.94 104) 1019 (121) 195 (38) 1.96 106 (3.73 105) 1596 (301) 169 (29) 4.65 106 (2.93 106) 1992 (267) 148 (26) wet fen 3.26 104 (3.73 103) 786 (98) 206 (36) 3.83 105 (9.21 104) 1132 (125) 186 (31) 6.63 105 (6.34 105) 1627 (165) 161 (24)
winter: meadow 1.27 104 (1.52 103) 638 (71) 211 (39) 2.17 105 (3.21 104) 1073 (96) 187 (19) 8.68 106 (2.23 105) 1489 (168) 168 (20) transitional 1.03 104 (3.45 103) 674 (78) 206 (32) 5.51 104 (7.23 104) 1371 (165) 171 (28) 2.69 105 (9.34 104) 1298 (168) 179 (26) fen 7.34 104 (7.24 103) 1005 (124) 195 (26) 3.23 105 (5.32104) 1194 (187) 184 (36) 2.65 106 (7.31 105) 1783 (362) 158 (33) wet fen 6.54 103 (6.24 102) 590 (56) 214 (25) 1.27 106 (1.94105) 1475 (243) 173 (28) 1.93 105 (5.34 104) 1273 (154) 171 (25)
Tyrosine aminopeptidase Leucine aminopeptidase
summer: A1 B1 T0 A1 B1 T0
meadow 8.34 106 (1.03 105) 2950 (523) 86 (10) 7.54 106 (5.20 105) 2965 (368) 81 (13) transitional 9.62 106 (2.39 105) 2765 (341) 98 (13) 3.44 107 (6.43 106) 3083 (403) 91 (9) fen 7.58 106 (1.74 105) 2703 (503) 103 (21) 4.87 106 (8.21 105) 2960 (389 99 (16) wet fen 7.11 107 (9.21 106) 3359 (322) 83 (11) 2.49 106 (9.21 105) 2241 (421) 113 (22)
autumn: meadow 4.07 106 (4.72 105) 2292 (298) 121 (19) 7.37 105 (5.32 104) 1770 (268) 139 (16) transitional 9.42 106 (3.53105) 2584 (268) 106 (14) 9.12 104 (8.11 103) 1380 (223) 151 (27) fen 6.95 108 (4.55 107) 3896 (532) 83 (15) 6.52 106 (9.21 105) 2410 (435) 114 (30) wet fen 2.46 104 (3.93 103) 1664 (265) 157 (28) 3.29 106 (7.30 105) 2678 (343) 131 (22)
winter: meadow 1.12 105 (1.45 104) 1437 (165) 153 (15) 7.17 105 (5.23 104) 2119 (408) 109 (17) transitional 5.26 106 (3.61 105) 2416 (321) 113 (12) 2.09 107 (5.12106) 2930 (355) 92 (13) fen 1.12 104 (1.54 103) 1016 (186) 179 (17) 8.11 105 (7.87 104) 1674 (304) 147 (21) wet fen 6.15 104 (6.77103) 1367 (156) 146 (19) 5.06 106 (4.48 105) 2193 (412) 123 (14)
0.0
0.1
0.2
0 10 20 30
RT
S [°
C-1
]
temperature [°C]
CminNmin
GLUC
XYLNAG
LEU
TYRO
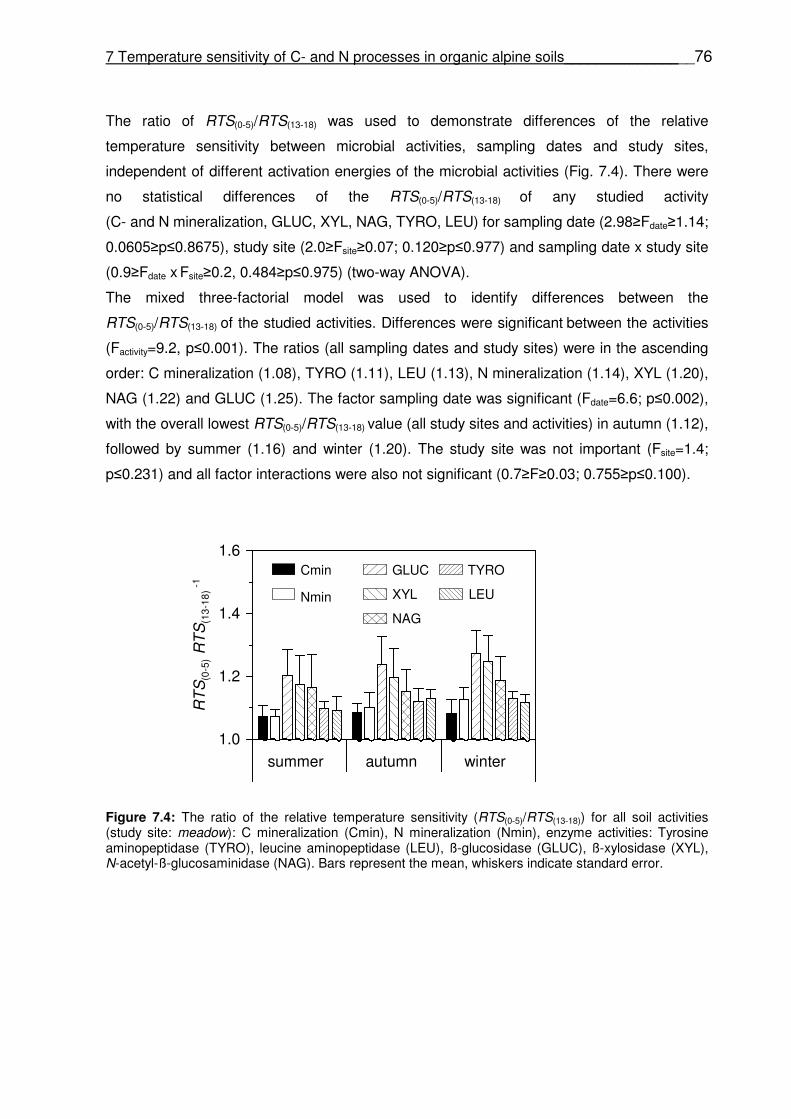
7 Temperature sensitivity of C- and N processes in organic alpine soils________________76
The ratio of RTS(0-5)/RTS(13-18) was used to demonstrate differences of the relative
temperature sensitivity between microbial activities, sampling dates and study sites,
independent of different activation energies of the microbial activities (Fig. 7.4). There were
no statistical differences of the RTS(0-5)/RTS(13-18) of any studied activity
(C- and N mineralization, GLUC, XYL, NAG, TYRO, LEU) for sampling date (2.98≥Fdate≥1.14;
0.0605≥p≤0.8675), study site (2.0≥Fsite≥0.07; 0.120≥p≤0.977) and sampling date x study site
(0.9≥Fdate x Fsite≥0.2, 0.484≥p≤0.975) (two-way ANOVA).
The mixed three-factorial model was used to identify differences between the
RTS(0-5)/RTS(13-18) of the studied activities. Differences were significant between the activities
(Factivity=9.2, p≤0.001). The ratios (all sampling dates and study sites) were in the ascending
order: C mineralization (1.08), TYRO (1.11), LEU (1.13), N mineralization (1.14), XYL (1.20),
NAG (1.22) and GLUC (1.25). The factor sampling date was significant (Fdate=6.6; p≤0.002),
with the overall lowest RTS(0-5)/RTS(13-18) value (all study sites and activities) in autumn (1.12),
followed by summer (1.16) and winter (1.20). The study site was not important (Fsite=1.4;
p≤0.231) and all factor interactions were also not significant (0.7≥F≥0.03; 0.755≥p≤0.100).
Figure 7.4: The ratio of the relative temperature sensitivity (RTS(0-5)/RTS(13-18)) for all soil activities (study site: meadow): C mineralization (Cmin), N mineralization (Nmin), enzyme activities: Tyrosine aminopeptidase (TYRO), leucine aminopeptidase (LEU), ß-glucosidase (GLUC), ß-xylosidase (XYL), N-acetyl-ß-glucosaminidase (NAG). Bars represent the mean, whiskers indicate standard error.
summer autumn winter
Cmin
Nmin
GLUC
XYL
NAG
TYRO
LEU
1.0
1.2
1.4
1.6
RT
S(0
-5) R
TS
(13-
18)
-1
7 Temperature sensitivity of C- and N processes in organic alpine soils________________77
7.5 Discussion
7.5.1 Temperature sensitivity of the C- and N mineralization
7.5.1.1 Constant versus flexible temperature response
The temperature sensitivity of activities may vary depending on the investigated temperature
range. In our study, there was no significant increase in the relative temperature sensitivity of
C- and N mineralization with decreasing temperature at any study site and sampling date
within the investigated temperature range (0 to 30°C). The predicting
ability (R2) of both models (simple exponential equation and flexible model according to
Lloyed and Taylor [1994]) was similar for a given data set. This result indicated that the
temperature sensitivity of C- and N mineralization is adequately explained by a constant
temperature response. Mikan et al. [2002] found similar correlation coefficients of both
models for six arctic tundra soils, although the temperature range (+0.5 to 14°C) was
considerably smaller than in our study. A constant relation of basal respiration to temperature
was also reported for larger temperature ranges in alpine [Reichstein et al., 2000], antarctic
[Hopkins et al., 2006; Smith, 2003], temperate [Pietikäinen et al., 2005] and mediterranean
[Fierer et al., 2003] regions in recent studies. In contrast, a considerable increase of the
relative temperature sensitivity with decreasing temperature for C mineralization was found
by Kirschbaum [1995] and Lloyed and Taylor [1994]. Calculating the temperature response
from published data of several decomposition studies, Kirschbaum [1995] found a
temperature sensitivity about three times higher at 0°C than at 20°C. Using 15 data sets from
field experiments, Lloyed and Taylor [1994] detected a relative temperature increase about
two times higher at 0°C than at 20°C. In contrast, a study has even reported an
increasing temperature sensitivity of C mineralizaiton with increasing temperature for
cold-adapted arctic soils [Nadelhoffer et al., 1991].
The temperature sensitivity of net N mineralization has also been found to be constant over a
wide temperature range and different soils [Kladivko and Keeney, 1987 (temperature range:
10 to 30°C); Stanford et al., 1973 (temperature range: 5 to 35°C)]. In contrast, Kirschbaum
[1995] reported that net N mineralization and denitrification appeared to have an overall
lower temperature response with decreasing temperature than C mineralization. However, he
concluded that the high variability in the published data prohibits any final conclusion. For
net N mineralization, a lower increase of the relative temperature sensitivity at lower
temperature may be influenced by nitrification and/or denitrification losses; these probably
have different temperature responses than ammonification. Since potential nitrification rates
were below the detection limit, we suggest that nitrification and/or denitrification did not
influence net N mineralization in our study. There is evidence, however, that the
mineralization immobilization turnover (MIT) may bias the temperature dependency.
7 Temperature sensitivity of C- and N processes in organic alpine soils________________78
Niklińska et al. [1999] found no relationship in the net N mineralization rate of seven
European humus samples with incubation temperatures below 15°C compared to higher
incubation temperatures. They concluded that, at lower temperatures, net N immobilization is
more dominant than net N mineralization. In agricultural soils incorporated with green
manure, gross N immobilization showed a higher temperature dependency than gross N
mineralization using the 15N pool dilution technique [Andersen and Jensen, 2001]. Thus, the
relative temperature sensitivity of net N mineralization may depend on the MIT, suggesting
an increasing temperature response at lower incubation temperatures. In accordance with
the classical C- to N-concept, there was no net immobilization (at any incubation
temperature) for our investigated soils (C- to N-ratios between 17 and 22% %-1). Our method,
however, does not distinguish between N immobilization and gross N mineralization. Based
on the constant temperature dependance we found over a wide temperature range,
N immobilization may not be a major N flux during the short incubation period. This is also
supported by Wang et al. [2001], who found lower N immobilization under water-logged
conditions than under aerobic conditions for 20 different soils.
7.5.1.2 Q10 values of the C- and N mineralization
Incubation experiments have been criticized as underestimating temperature sensitivity
because the quality of soil organic matter pools changes during incubation [Kirschbaum,
1995]. Accordingly, Reichstein et al. [2000] suggested to calculate Q10 values from rate
constants derived from longer incubation periods rather than from instantaneously derived
activities at different temperature intervals. There is not much evidence that respiration was
affected by changes in soil organic matter quality during incubation: the respiration rate over
six weeks (at 20°C) was fairly constant in a preliminary experiment. The incubation
experiment for the temperature response of C mineralization was carried out by increasing
incubation temperature stepwise. Temperature sensitivity did not decrease with increasing
temperature, which can also be interpreted to reflect constant substrate quality throughout
the incubation. A highly uniform organic matter pool is supported for cold-adapted organic
arctic soils [Weintraub and Schimel, 2003] and for humus layers from boreal regions
[Niklińska et al., 1999]. Hence, the available Corg pool seems to be relatively large and
uniform in cold-adapted environments.
The methodologies for calculating Q10 values can vary significantly, and direct comparisons
require caution [Fierer et al., 2005]. Therefore, we only compared absolute Q10 values
derived by simple first-order exponential models (constant Q10 values). The average Q10
value of C mineralization for all study sites and all sampling dates was 2.0 (range 1.5-2.7).
The range of Q10 values of soil respiration fit into the range of reported temperature

7 Temperature sensitivity of C- and N processes in organic alpine soils________________79
sensitivities (Q10=1.2 to 3.9) from different alpine soils [Duzler-Franz, 1981]. Schinner and
Gstraunthaler [1981] found a low Q10 value (1.5; 5-15°C) for an alpine meadow site in
Austria, whereas higher values were reported for sub-alpine organic layers (2.5) and
soils (2.8) between 5 to 25°C in the Swiss Alps [Reichstein et al., 2000] and from 8 alpine
soils (>3000 m a.s.l.) of the north American continent (Q10=2.5 to 3.8) [Fierer et al., 2006].
Very high temperature dependancies (Q10=4.6 to 9.4) were reported for arctic tundra soils
[Mikan et al., 2002], while Smith [2003] found a median Q10 value of 2.0 (range 1.8 to 2.5)
for 100 sites representing 21 habitats on a sub-antarctic island.
The average Q10 value of the N mineralization under water-logged conditions in this study
was 1.7 (range 1.3-2.8) for all soils. Our results are in line with Stanford et al. [1973] and
Kladivko and Keeney [1987], who found an average of 2.0 for a temperature range of 5
to 35°C (11 different soils) and 10 to 35°C (one soil). Both studies were carried out under
aerobic conditions. There might be differences in the Q10 of aerobic and water-logged
conditions. However, Kladivko and Keeney [1987] found no water-temperature interaction
using a wide range of water potentials (-0.1 to -3.0 bar). Thus, there is no expectation that
water-logged conditions yield lower temperature sensitivities than aerobic incubations.
7.5.2 Seasonal pattern in temperature sensitivity of soil-derived activities
Our data showed no distinct seasonal pattern. The Q10 values of C mineralization were
slightly lower in summer than in autumn and winter. The Q10 values of N mineralization were
highest in winter, but the differences between seasons were generally small. During the
relative long incubation time (25 days) of the C mineralization experiment, soils may have
adapted to the corresponding incubation temperature. However, a 4-day incubation might
reveal no evidence for an adaptation of N mineralization rates. The RTS increase with
decreasing temperature was greatest in winter for all investigated activities (C-,
N mineralization, enzyme activities). Little information is available about the seasonal
adaptation of the temperature response of soil activities. Fierer et al. [2006] found that 17%
of the variability in Q10 values of C mineralization (77 soil samples) was positively correlated
to the mean monthly soil temperature but not to the mean annual temperatures at the study
sites - even though soils may have adapted to the surrounding temperature after being
sampled and transported to laboratory. Similarly, a seasonal adaptation of potential
respiration (substrate: potassium glutamate) occurred in an alpine meadow of the Rocky
Mountains [Lipson et al., 2002]. Those authors found lower temperature sensitivity in winter
than in summer. Also, the temperature response of oxygen consumption was seasonally
affected in coastal sediment, being higher in summer than in winter [Thamdrup et al., 1998].
In contrast, Niklińska et al. [1999] found increasing Q10 values of respiration from humus
7 Temperature sensitivity of C- and N processes in organic alpine soils________________80
samples as mean annual temperatures at the study sites dropped. The relatively low
differences we found in the temperature response for the C- and N mineralization over the
year indicates that the soil activities are well adapted to enable nutrient cycling in this cold
environment.
7.5.3 Effect of substrate quality on the temperature sensitivity of the C- and
N mineralization
The Q10 values of C- and N mineralization were inversely related to substrate quality indices.
Other studies also report an inverse relationship between Q10 values of C mineralization and
the substrate quality index [e.g. Fierer et al., 2005, Fierer et al., 2006, Mikan et al., 2002].
This supports the substrate quality-to-temperature sensitivity hypothesis, which implies
higher activation energy for lower substrate quality. According to Bosatta and Ågren [1999],
the carbon quality of the soil organic matter can be defined as the total number of enzymatic
steps required to mineralize carbon to the end product CO2. Hence, more enzymatic steps
lead to higher activation energy for the C mineralization and greater temperature sensitivity.
In contrast, no substrate quality-to-temperature sensitivity relationship was found in mineral
soils [Kätterer et al., 1998, Reichstein et al., 2005]. Soil mineral particles can stabilize
organic carbon through adsorption to surfaces, potentially resulting in different temperature
sensitivities [Mikan et al., 2002]. Therefore, organic soils may better reflect the temperature
sensitivity of biological processes than mineral soils.
The nitrogen quality of soil organic matter was defined following the same concept. The
relationship (slope and y-axis intercept of the regression line) between the substrate quality
index and the Q10 were similar for C- and N mineralization. This suggests similar temperature
sensitivity for both processes under equal substrate quality conditions. Assuming a generally
constant C- to N-ratio in soils over longer time periods, we would expect a similar quality
index for both activities. However, the index was higher for N- than C mineralization, pointing
to differences in the use of soil organic matter pools. For C mineralization, soils were allowed
to equilibrate until the respiration rate was constant (after the hyper-labile substrate pool was
respired). According to Boone [1990], N transformations measured under water-logged
conditions partly use easily degradable substrates from aerobic soil organisms killed by the
anaerobic test conditions. This may help explain the higher substrate quality indices of N
mineralization (AN) than C mineralization (AC) in our study.
It has been shown that the temperature sensitivity depend on the substrate quality index
rather than on any other soil chemical property or microbial biomass. Similarly, Fierer et al.
[2006] found Q10 values of C mineralization to be unrelated to soil chemical properties or
microbial biomass (Cmic). Accepting that substrate quality is the key factor in the temperature

7 Temperature sensitivity of C- and N processes in organic alpine soils________________81
sensitivity of soil-derived processes, the turnover of more recalcitrant components should
more strongly depend on temperature. In the framework of the global warming issue, this
could alter the composition of the soil organic matter in peat soils.
7.5.4 Relative temperature sensitivity (RTS) of the enzyme activities
Extracellular enzymes are important because they catalyze the rate-limiting steps of
decomposition and nutrient cycling [Sinsabaugh, 1994]. Our study revealed significant
differences in the relative temperature sensitivity (RTS) between aminopeptidases
(LEU, TYRO) and enzymes involved in the C cycle (GLUC, XYL, NAG). The greater increase
of the RTS for GLUC, XYL and NAG at lower temperature compared to the aminopeptidases
(TYRO, LEU) and C- and N mineralization suggest that temperature is an important factor
regulating the use of different substrates. Hopkins et al. [2006] found a much higher
temperature response for glucose-activated respiration at a lower temperature range
(Q10=3.3 to 6.9; temperature range: -0.5 to 20°C) versus an upper temperature range
(Q10=2.0 to 3.6; temperature range: 9 to 20°C) for five different antarctic soils. In contrast, the
temperature sensitivity of C mineralization of these soils was constant over the entire
temperature range, having lower Q10 values (1.2 to 3.3). The almost constant RTS for TYRO
and LEU in our study suggests that polypeptide decay is more favoured at lower
temperatures. Similarly, N mineralization is disproportionally high (versus C mineralization) in
easily degradable green manures at low temperatures in cool temperate agro-ecosystems
[Magid et al., 2001]. However, soils from different climate regions may behave differently.
Trasar-Cepeda et al. [2007] found much smaller RTS differences for a range of investigated
enzymes of the C, N and S cycles in mediterranean soils in NW Spain. In our study, the
disproportional RTS pattern for different enzymes of the N and C cycle may be characteristic
for alpine ecosystems and allow a sufficient supply of nitrogen during the cold season in
these N-limited cold environments.
7 Temperature sensitivity of C- and N processes in organic alpine soils________________82
7.6 Conclusions
This study revealed a temperature sensitivity of C- and N mineralization in the lower range of
reported values from the literature. The relative low temperature response may be an
adaptation to a cold environment in order to maintain nutrient cycling during the cold winter
periods. No distinct seasonal adaptation was evident, but the within- and among-site
variability in the temperature response was inversely related to substrate quality. However,
the wide range of temperature responses for C- and N mineralization reported in the
literature cannot be explained by substrate quality alone. This calls for future investigations to
better understand the temperature sensitivity of soil-derived processes. The degradation of
easily available C polymers was more strongly inhibited by low temperature than the decay
of peptides by peptidases. Moreover, a surplus of easily available N compounds versus
C compounds at lower temperature may be important for ecosystem functioning in cold-
adapted and N-limited environments. Our results underline the key role of temperature in
regulating the substrate use from different fractions of soil organic matter.
7.7 Acknowledgements
This research was funded by the DFG project 768. We would like to thank Meinhard Strobel
(alpine research station, University of Innsbruck) for his hospitality during soil sampling.
Additionally, we thank A. Büchse (University of Hohenheim) for helpful hints about the
statistics used in this study.
7.8 References
Andersen, M.K., and L.S. Jensen (2001), Low soil temperature effects on short-term gross N
mineralisation-immobilisation turnover after incorporation of green manure, Soil Biol.
Biochem., 33, 511-521.
Berg, P., and T. Rosswall (1985), Amonium oxidizer numbers, potential and actual oxidation
rates in two swedish arable soils, Biol. Fertil. Soils, 1, 131-140.
Boone, R.D. (1990), Soil organic matter as a potential net nitrogen sink in a fertilized
cornfield, South Deerfield, Massachusetts, USA, Plant Soil, 128, 191-198.
Bortenschlager, S. (1970), Waldgrenz- und Klimaschwankungen im Pollenanalytischen Bild
des Gurgler Rotmooses, Mitteilungen der Ostalpin-Dinarischen Gesellschaft für
Vegetationskunde, 11, 19-26.
Bosatta, E., and G.I. Ågren (1999), Soil organic matter quality interpreted thermodynamically,
Soil Biol. Biochem., 31, 1889-1891.

7 Temperature sensitivity of C- and N processes in organic alpine soils________________83
Browman, M.G., and M.A. Tabatabai (1978), Phosphodiesterase activity of soils, Soil Sci.
Soc. Am. J., 42, 284-290.
Dutzler-Franz, G. (1981), Einfluss der Temperatur auf die mikrobielle Aktivität einiger Böden
aus der temperierten und hochalpinen Klimaregion, In: Cernusca, A. et al. (Eds.),
Veröffentlichungen des österreichischen MaB-Programms, Band 4.
Fey, A., and R. Conrad (2003), Effect of temperature on the rate limiting step in the
methanogenic degradation pathway in rice field soil, Soil Biol. Biochem., 35, 1-8.
Fierer, N., Allen, A.S., Schimel, J.P., and P.A. Holden (2003), Controls on microbial CO2
production: a comparison of surface and subsurface soil horizons, Global Change
Biol., 9, 1322-1332.
Fierer, N., Colman, B.P., Schimel, J.P. and, R.B. Jackson (2006), Predicting the temperature
dependence of microbial respiration in soil: A continental-scale analysis, Global
Biogeochem. Cycles, 20, GB3026, doi:10.1029/2005GB002644.
Fierer, N., Craine, J.M., McLauchlan, K., and J.P. Schimel (2005), Litter quality and the
temperature sensitivity of decomposition, Ecology, 86 (2), 320-326.
Heimann, D., and V. Sept (2000), Climate Change estimates of summer temperature and
precipitation in the alpine region, Theor. Appl. Climatol., 66, 1-12.
Hopkins, D.W., Sparrow, A.D., Elberling, B.E., Gregorich, G.P., Novis, M., Greenfield, L.G.,
and E.L. Tilston (2006), Carbon, nitrogen and temperature controls on microbial activity
in soils from an Antarctic dry valley, Soil Biol. Biochem., 38, 3130-3140.
Kandeler, E. (1996), N-mineralization under water-logged conditions, In: Schinner, F. et al.
(Eds.), Methods in Soil Biology, Springer, Berlin, Heidelberg, New York.
Kätterer, T., Reichstein, M., Andrén, O., and A. Lomander (1998), Temperature dependence
of organic matter decomposition: a critical review using literature data analyzed with
different models, Biol. Fertil. Soils, 27, 258-262.
Kaufmann, R. (2001), Invertebrate succession on an alpine glacier foreland, Ecology, 82,
2261-2278.
Keeney, D.R. (1982), Nitrogen-availability indices, In: Page, A.L. et al. (Eds.), Methods of soil
analysis, part 2, Agron. Monogr. 9, ASA and SSSA, Madison Wisconsin, USA.
Kirschbaum, M.U.F. (2000), Will changes in soil organic carbon act as a positive or negative
feedback on global warming, Biogeochemistry, 48, 21-51.
Kirschbaum, M.U.F. (1995), The temperature dependence of soil organic matter
decomposition, and the effect of global warming on soil organic C storage, Soil Biol.
Biochem., 27 (6), 753-760.
Kladivko, E.J., and D.R. Keeney (1987), Soil nitrogen mineralization as affected by water and
temperature interactions, Biol. Fertil. Soils, 5, 248-252.

7 Temperature sensitivity of C- and N processes in organic alpine soils________________84
Körner, Ch. (1999), Alpine plant live. Functional plant ecology of high mountain ecosystems.
Springer, Berlin.
Lipson, D.A., Schadt, C.W., and S.K. Schmidt (2002), Changes in soil microbial community
structure and function in an alpine dry meadow following spring snow melt, Microbial
Ecol., 43, 307-314.
Lloyed, J., and J.A. Taylor (1994), On the temperature dependence of soil respiration, Funct.
Ecol., 8, 315-323.
Magid, J., Henriksen, O., Thorup-Kristensen, K., and T. Mueller (2001), Disproportionately
high N mineralisation rates from green manures at low temperatures-implications for
modelling and management in cool temperate agro-ecosystems, Plant Soil, 228, 73-82.
Marx, M.-C., Wood, M. and S.C. Jarvis (2001), A microplate fluorimetric assay for the study
of enzyme diversity in soil, Soil Biol. Biochem., 33, 1633-1640.
Mikan, C., Schimel, J.P., and A.P. Doyle (2002), Temperature controls of microbial
respiration in arctic tundra soils above and below freezing, Soil Biol. Biochem., 34,
1785-1795.
Nadelhoffer, K.J., Giblin, A.E., Shaver, G.R., and J.A. Laundre (1991), Effects of temperature
and substrate quality on element mineralization in six arctic soils, Ecology, 72, 242-253.
Niklińska, M., Maryański, M., and R. Laskowski (1999), Effect of temperature on humus
respiration and nitrogen mineralization: Implications for global climate change,
Biogeochemistry, 44, 239-257.
Pietikäinen, J., Pettersson, M., and E. Bååth (2005), Comparison of temperature effects on
soil respiration and bacterial and fungal growth rates, FEMS Microbiol. Ecol., 52, 49-58.
Reichstein, M., Bednorz, F., G. Broll, and T. Kätterer (2000), Temperature dependence of
carbon mineralization: conclusions from a long-term incubation of subalpine soil samples,
Soil Biol. Biochem., 32, 947-958.
Reichstein, M., Kätterer, T., Andrén, O., Ciais, P., Schulze, E.D., Cramer, W., Papale, D.,
and R. Valentini (2005), Temperature sensitivity of decomposition in relation to soil
organic matter pools: Critique and outlook, Biogeosciences, 2, 317-321.
Rybníček, K., and E. Rybníčková (1977), Mooruntersuchungen im oberen Gurgltal, Ötztaler
Alpen, Folia Geobotanica et Pytotaxonomia, 12, 245-291.
Schinner, F., and G. Gstraunthaler (1981), Adaption of microbial activities to the
environmental conditions in alpine soils, Oecologia, 50, 113-116.
Sinsabaugh, R.L. (1994), Enzymatic analysis of microbial pattern and process, Biol. Fertil.
Soils, 17, 69-74.
Smith, V.R. (2003), Soil respiration and its determinants on a sub-Antarctic island, Soil Biol.
Biochem., 35, 77-91.

7 Temperature sensitivity of C- and N processes in organic alpine soils________________85
Sparling, G.P., Feltham, C.W., Reynolds, J., West, A.W., and P. Singleton (1990), Estimation
of soil microbial C by fumigation-extraction method: use on soil of high organic matter
content, and reassessment of the ksc-factor, Soil Biol. Biochem., 22, 3101-307.
Stanford, G., Frere, M.H., and D.H. Schwaninger (1973), Temperature coefficient of soil
nitrogen mineralization, Soil Sci., 115 (4), 321-323.
Stemmer, M., Gerzabek, M.H., and E. Kandeler (1998), Organic matter and enzyme activity
in particle-size fractions of soils obtained after low-energy sonication, Soil Biol.
Biochem., 30 (1), 9-17.
Tabatabai, M.A. (1982), Soil enzymes, In : Page, A.L. et al. (Eds.), Methods of Soil Analysis,
Part 2, Am. Soc. Agron. Inc., Soil Sci. Soc. Am. Inc., Madison Wisconsin USA.
Thamdrup, B., Hansen, J.W., and B.B. Jørgensen (1998), Temperature dependence of
aerobic respiration in a coastal sediment, FEMS Microbiol. Ecol., 25, 189-200.
Trasar-Cepeda, C., Gil-Sotres, F., and M.C. Leirós (2007), Thermodynamic parameters of
enzymes in grassland soils from Galicia, NW Spain, Soil Biol. Biochem., 39, 311-319.
Wang, W.J., Chalk, P.M., Chen, D., and C.J. Smith (2001), Nitrogen mineralization,
immobilisation and loss, and their role in determining differences in net nitrogen
production during waterlogged and aerobic incubation of soils, Soil Biol. Biochem., 33,
1305-1315.
Weintraub, M.N., and J.P. Schimel (2003), Interactions between carbon and nitrogen
mineralization and organic matter chemistry in Arctic tundra soils, Ecosystems, 6,
129-143.

Curriculum vitae___________________________________________________________86
8 Curriculum vitae
Name: Oliver Koch
Date of birth: 26 October 1974 in Stuttgart
Nationality: German
Marital status: conjugal community, one child
Higher Education
1996 - 2002 Studies of Biology with focus on Botany, Nature Conservation and Soil
Science at the University of Göttingen
02/2002 Dipl. Biologe
since 08/2002 PhD thesis at the Institute of Soil Science, University of Hohenheim,
supported by a DFG grant of the Graduiertenkolleg (768)
"Vermeidungsstrategien klimarelevanter Gase"
International Experience
10/1998 - 07/1999 Study visit in Sweden, University of Umeå, supported by an Erasmus
grant
08/2000 - 10/2000 Work experience in the DFG project " Hypsometrischer Wandel
naturnaher Bergregenwaldökosysteme in den Yungas Boliviens",
supported by a DAAD grant
Other Experience
10/1994 - 06/1995 Indivudual travel abroad (India, Nepal, Tibet, China, Russia)
07/1995 - 07/1996 Civilian national service in a nursing home, Hamburg
09/1999 - 04/2002 Several activities as graduate assistant (herbarium, tutor, field work) at
the University of Göttingen
10/2005 - 02/2006 Graduate assistant (laboratory) at the University of Rostock
since 03/2007 Tutor in a coaching agency, Trier
School Education
1981 - 1985 Primary school, Stuttgart
1985 - 1986 Grammar school (Friedrich Eugen Gymnasium), Stuttgart
1986 - 1994 Grammar school (Theodor Heuss Gymnasium), Esslingen a. N.
07/1994 Abitur