Embed Size (px)
Citation preview
Discussion Paper No. 2/2009
Using panel data to estimate the effect of rainfall shocks on smallholders food security and
vulnerability in rural Ethiopia
Abera Birhanu Demeke and Manfred Zeller
Forschung zur Entwicklungsökonomie und -politik Research in Development Economics and Policy
Universität Hohenheim Institut für Agrar- und Sozialökonomie in den Tropen und Subtropen Department of Agricultural Economics and Social Sciences in the Tropics and Subtropics Tropenzentrum Centre for Agriculture in the Tropics and Subtropics
Abera Birhanu Demeke1 and Manfred Zeller2: Using panel data to estimate the effect of rainfall shocks on smallholders food security and vulnerability in rural Ethiopia.
Department of Agricultural Economics and Social Sciences in the Tropics and Subtropics (Ed.), Forschung zur Entwicklungsökonomie und -politik – Research in Development Economics and Policy, Discussion Paper No. 2/2009.
ISSN 1439-4952
© 2009 Institut für Agrar- und Sozialökonomie in den Tropen und Subtropen Universität Hohenheim (490), 70593 Stuttgart, Germany E-mail: [email protected]
All rights reserved.
Printed in Germany. Druck: F. u. T. Müllerbader GmbH Forststr. 18, 70794 Filderstadt, Germany
VERLAG ULRICH E. GRAUER Hohenzollernstr.12, 70178 Stuttgart, Germany Tel.: +49 (0)711 4704309, Fax: +49 (0)711 2485219 Internet: http://www.grauer.de/, E-mail: [email protected]
1 Abera Birhanu Demeke – Doctoral candidate (490a), [email protected] 2 Prof. Dr. Manfred Zeller – Chair of Rural Development Theory and Policy (490a), [email protected]
Department of Agricultural Economics and Social Sciences in the Tropics and Subtropics
• Chair: Rural Development Theory and Policy (490a) • Chair: International Agricultural Trade and Food Security (490b) • Chair: Farming and Rural Systems (490c) • Chair: Land Use Economics in the Tropics and Subtropics (490d)
Centre for Agriculture in the Tropics and Subtropics Discussion papers in this series are intended to stimulate discussion among researchers, practitioners and policy makers. The papers mostly reflect work in progress. This paper has been reviewed by Dr. Gezahegn Ayele (Ethiopian Development Research Institute (EDRI)) and Dr. Daniel Tsegai (Center for Development Research (ZEF), Bonn) whom we thank for their valuable comments.

i
Table of Contents
ABSTRACT ii
1. INTRODUCTION 1
2. DATA AND STUDY AREAS 3
3. METHODOLOGY 4
4. RESULTS 11
5. SUMMARY AND CONCLUSION 21
REFERENCES 23
List of Tables
Table 1: Component loadings of the food security indicators ................................................... 6
Table 2: Correlation between food security index and other measures of food security ........... 7
Table 3: Description of the variables included in the estimation............................................. 10
Table 4: Differences in household characteristics by food security groups............................. 13
Table 5: Households responses to drought by food security group ......................................... 15
Table 6: Transition matrix for quintiles of the food security factor......................................... 16
Table 7: Food security mobility (1994-2004) .......................................................................... 16
Table 8: Estimation results of the fixed effects regression model ........................................... 18
Table 9: Determinants of being always-more-secured, vulnerable, and always-less-secured: 20
ii
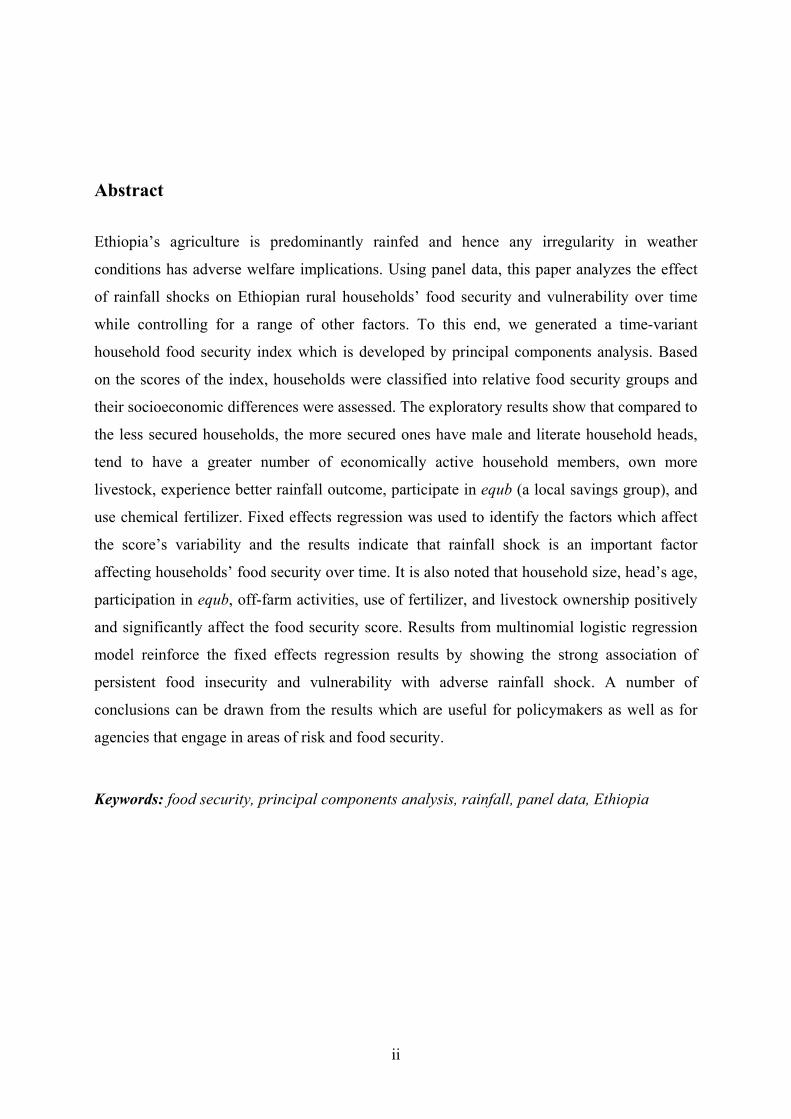
Abstract
Ethiopia’s agriculture is predominantly rainfed and hence any irregularity in weather
conditions has adverse welfare implications. Using panel data, this paper analyzes the effect
of rainfall shocks on Ethiopian rural households’ food security and vulnerability over time
while controlling for a range of other factors. To this end, we generated a time-variant
household food security index which is developed by principal components analysis. Based
on the scores of the index, households were classified into relative food security groups and
their socioeconomic differences were assessed. The exploratory results show that compared to
the less secured households, the more secured ones have male and literate household heads,
tend to have a greater number of economically active household members, own more
livestock, experience better rainfall outcome, participate in equb (a local savings group), and
use chemical fertilizer. Fixed effects regression was used to identify the factors which affect
the score’s variability and the results indicate that rainfall shock is an important factor
affecting households’ food security over time. It is also noted that household size, head’s age,
participation in equb, off-farm activities, use of fertilizer, and livestock ownership positively
and significantly affect the food security score. Results from multinomial logistic regression
model reinforce the fixed effects regression results by showing the strong association of
persistent food insecurity and vulnerability with adverse rainfall shock. A number of
conclusions can be drawn from the results which are useful for policymakers as well as for
agencies that engage in areas of risk and food security.
Keywords: food security, principal components analysis, rainfall, panel data, Ethiopia

1
Using panel data to estimate the effect of rainfall shocks on
smallholders food security and vulnerability in rural Ethiopia Abera Birhanu Demeke and Manfred Zeller
1. Introduction
Over the last decades many developing countries have experienced notable progress in their
economic growth and managed to improve the welfare status of their population considerably.
Technological changes in agricultural production combined with the prevalent favourable
economic policies have played a major role in their overall economic development in general
and the availability and access to food in particular. Nevertheless, food security has not been
attained in most developing countries and in several Sub-Saharan African (SSA) countries
food insecurity continues to be a deep seated problem. Statistics shows that between 1990/92
and 2003/05 the number of undernourished in Africa escalated from 169 million to 212
million (FAO 2008). Also, per capita food production has declined steadily over the past
decades while it increased in the other parts of the world (FAO 2006). The state of food self-
sufficiency deteriorates with each passing year thus increasing the number of food deprived
households. Even now developing countries are overwhelmed by heightened food security
crises making the problem of food security an issue of great concern.
As in other SSA countries, Ethiopia has persistently suffered widespread food insecurity. The
results of a nation-wide Welfare-Monitoring-Survey conducted in 2004 indicate that 31% of
Ethiopian households have had difficulty meeting their food demands in the past 12 months.
The same data further show that 51.2% of households indicate their own production will last
only 4-9 months; only 2% of the households surveyed expect to cover their food needs from
their own production (Abebe 2007). Since the country’s economy is mainly based on rainfed
agriculture, food production is highly vulnerable to the influence of adverse weather
conditions such as drought3. According to Von Braun (1991) a 10% decline in the amount of
rainfall below the long run average leads to a 4.4 % reduction in the country’s national food
production. Drought has been an increasing occurrence over the last decades as has the
proportion of the population adversely affected by it. For example, Adnew (2003) indicates
that the proportion of drought affected people almost doubled from 8% of the total population
3 For example, the annual agricultural growth rate has been negative between 1999/2000 and 2003/04 due to drought (MOFED, 2002).
2
in 1975 to 16% in 2003. Consequently, the country has been dependent on food aid to bridge
its huge food gap. Even in a year where rainfall is favourable it is estimated that around 4-5
million Ethiopians depend on food aid (Devereux 2006) reflecting how deep-rooted food
insecurity is in the country. Thus, increasing food production and ensuring its steady access to
the fast growing population on one hand and designing effective drought mitigation strategies
on the other remains to be a major challenge for Ethiopia’s development endeavour.
Previous studies have shown that changes in climatic condition largely affect food security
(Rosenzweig et al. 1995) and the effect is more pronounced particularly in developing
countries (Downing 1992) such as Ethiopia as much of agricultural production depends on a
highly variable rainfall and the capacity to cope in the event of shock is low. The impact of
change in climatic condition on agricultural production and productivity in different parts of
Africa has been widely studied (Downing 1992; Schulze et al. 1993; Mohamed et al. 2002a, b;
Chipanshi et al. 2003; Deressa 2007; Yesuf et al. 2008). However, as Gregory et al. (2005)
state, while several studies delve into assessing the link between changes in weather
conditions and crop production and productivity, direct assessments of the effect of climate
change on food security remain limited. Hence, the present study attempts to contribute
towards this literature by empirically assessing the impact of rainfall shock which is a critical
climatic factor in Ethiopia on changes in households’ food security over time.
Many studies have been conducted and published so far using the same data as utilized here.
Nevertheless, given the pervasive nature of food insecurity in the country, the issue requires
more attention than given in prior studies. Furthermore, many governmental and non-
governmental agencies look for a relatively easy measure of food security so they can monitor
the prevalence of food security or insecurity, which makes deriving alternative measures
desirable. Accordingly, the present study attempts to construct a relatively simple and time-
variant food security index using Principal Components Analysis (PCA) and thereby assess
the dynamics of food security and how it is related to rainfall variation at household level.
The present study is different from earlier works in two important aspects. Firstly, earlier
works on food security and vulnerability commonly concentrate on employing a single
measure of food security such as calorie availability, per capita food expenditure, self-
reported food security status, and daily meal intake frequency. Yet, food security is a broad
concept and it is difficult to capture by simply applying a single indicator (Von Braun et al.
1992). In the present study, however, a time-variant food security and vulnerability index has
been built from a combination of several factors which capture its different dimensions as
3
well as its validity and evolution over time assessed. Secondly, previous research on food
security and vulnerability mainly used cross-sectional data and assessed the problem of food
security at one point in time while the present study, using panel data, tries to address the
dynamics of food security and examine the impact of rainfall shock and other variables on
household food security. The results of the present study provide useful information to
policymakers which can help them fine-tune and adjust how they address the problem of food
insecurity. The remainder of the paper is organized as follows. The next section gives
overview of the data and the third section provides methods of analysis employed in the study.
The results are presented in the fourth section and the last section offers the conclusions.
2. Data and study areas
The study used a dataset commonly called the Ethiopian Rural Household Survey (ERHS) - a
longitudinal dataset collected from randomly selected farm households in rural Ethiopia. Data
collection and supervision was conducted by the Department of Economics at Addis Ababa
University, Centre for the Study of African Economies (CSAE)-University of Oxford, UK and
International Food Policy Research Institute (IFPRI) in collaboration. Data collection started
in 1989 on seven study sites mainly those which suffered from the 1984-85 drought and
others that occurred between 1987 and 1989. The sample size was 450 households. The
primary intention of the survey was to study smallholders’ responses to food crisis (Dercon
and Hoddinott 2004).
The 1989 survey was expanded in 1994 by incorporating other survey sites in different
regions of the country. From 1994 onwards data collection has been conducted in a panel
framework. Six of the study areas covered in 1989 have been included and one site was
excluded due to security reasons. The number of study areas was increased to fifteen with the
resulting sample size totalling 1477 households. The newly included study villages were
selected in order to represent the country’s diverse farming systems.
Before a household was chosen, a numbered list of all households (sampling frame) was
developed with the help of local Peasant Association (PA) authorities. Once the list had been
constructed, stratified sampling procedure was applied to select sample households in each
village (Kebede, 2002). In each study sites sample size was determined by the proportion of
the entire population of the respective village and hence the samples are self-weighting
(Dercon and Hoddinott 2004).
4
A total of six rounds (from 1994 till 2004) of data collection have been undertaken with an
emphasis on emerging current issues in each wave although the main module of the
questionnaire was kept as it was. The data is an unbalanced panel and the spacing between the
survey rounds was inconsistent. It has been indicated that these data are not nationally
representative, however they give a good picture of the major farming systems of the
Ethiopian highlands. The main parts of the questionnaire include demography, asset
ownership, farm input use, outputs, livestock production, and health. The present study
utilized three rounds of the dataset (1994a, 1999 and 2004) which are spaced at five year
intervals.
3. Methodology
3.1 Generating index of household food security: Application of PCA
Although food security has been defined in many different ways most of these definitions are
more or less similar to that of the World Food Summit in 1996 which states “Food security
exists when all people, at all times, have physical and economic access to sufficient, safe and
nutritious food to meet their dietary needs and food preferences for an active and healthy life”
(FAO 1996). There are three important components imbedded in this definition. The first
component is the availability of food in a given country/household through any means
(production, imports or food aid, for example). The second aspect concerns the access to food
by people/households as reflected by their ability to get food through purchases from market,
from own stock/home production, gift or borrowing. The third component relates to the actual
processing and absorption capacity of the body of the supplied nutrients. These three
components, though they are theoretically hypothesized to reflect different dimensions of food
security, in actual terms are indeed not separate but interlinked.
Maxwell et al. (2008) describe the frequently available and utilized indicators which
potentially measure food security as the following: nutritional status, actual food consumption
at the household level by a 24-hr recall, coping strategies index, as well as proxy indicators
such as calorie intake, household income, productive assets, food shortage, under 5 nutritional
status, dietary diversity, and household food insecurity access scale. Although these indicators
reasonably capture and designate a small portion of the problem, they do not provide a
comprehensive picture. Maxwell et al. (2008: 534) further note that “although some progress
has been made, the search for more broadly applicable measures of food security continues”.
5
Hence, in the present study we try to develop a relatively simple measure of food security
which encompasses its access and availability components in the context of rural Ethiopian
households and thereby make a contribution to the improvement of food security
measurement. To this end we employ a multivariate statistical technique known as Principal
Components Analysis (PCA). We incorporated several indicators that are hypothesized to
capture the different dimensions of food security. PCA extracts the linear combination of
these variables which give the maximum variance and transform them into one index (Zeller,
et al. 2006). The new index represents “the best summary of the linear relationship among the
initial variables” (Conte 2005). Stated mathematically, from an initial set of n correlated
variables (x1, x2, x3, . . ., xn), PCA creates uncorrelated indices or components whereby each
component is a linear weighted combination of the initial variables (Vyas and Kumaranayake
2006) as follows:
PCm=am1x1 + am2x2 + am3x3 + . . . + amnxn (1)
Where amn represents the weight for the mth principal component and the nth variable. The
components are ordered so that the first component explains the largest amount of variance in
the data subject to the constraint that the sum of the squared weights (a2m1 + a2
m2 + a2m3 + . . .
+ a2mn) is equal to one. Each subsequent component explains additional but less proportion of
variation of the variables. The higher the degree of correlation among the original variables,
the fewer components required to capture common information ((Vyas and Kumaranayake
2006). Once the first component is identified, we can derive the food security index for each
household as follows:
FSIj=∑Fi[(xji-xi)/Si] (2)
Where Fi is the weight for the ith variable in the PCA model, xji is the jth household’s value for
the ith variable, and xi and si are the mean and standard deviations of the ith variable for overall
households. Since we are using three rounds of household panel dataset, we need to generate
the index that is comparable over time. To this end, following the innovative approach of
Cavatassi et al. (2004) we pooled the data for the three rounds and estimated the principal
components over the combined data. The resulting weight is then applied to the variable
values for each rounds of the data using equation (2) above. According to Cavatassi et al.
(2004) this approach helps to facilitate the index’s comparability over time. Since the
6
variables used to construct the index and their respective weights remained the same in all the
three rounds, we can use it to compare changes over time (Vyas and Kumaranayake 2006).
Identification and selection of indicator variables was driven by the data available and food
security literature in Ethiopia or elsewhere. Accordingly, five indicator variables4 were used
to construct the index: size of land cultivated, the availability of food stocks, variety of food
groups consumed, the variety of crops planted, and oxen ownership. In general, these
variables reflect the access and availability dimensions of food security. World Food Program
routinely applies PCA in generating food security index and household profiling. A study by
Qureshi (2007) also employed PCA generated food security measurement index for rural
households in the Bolivian Amazon.
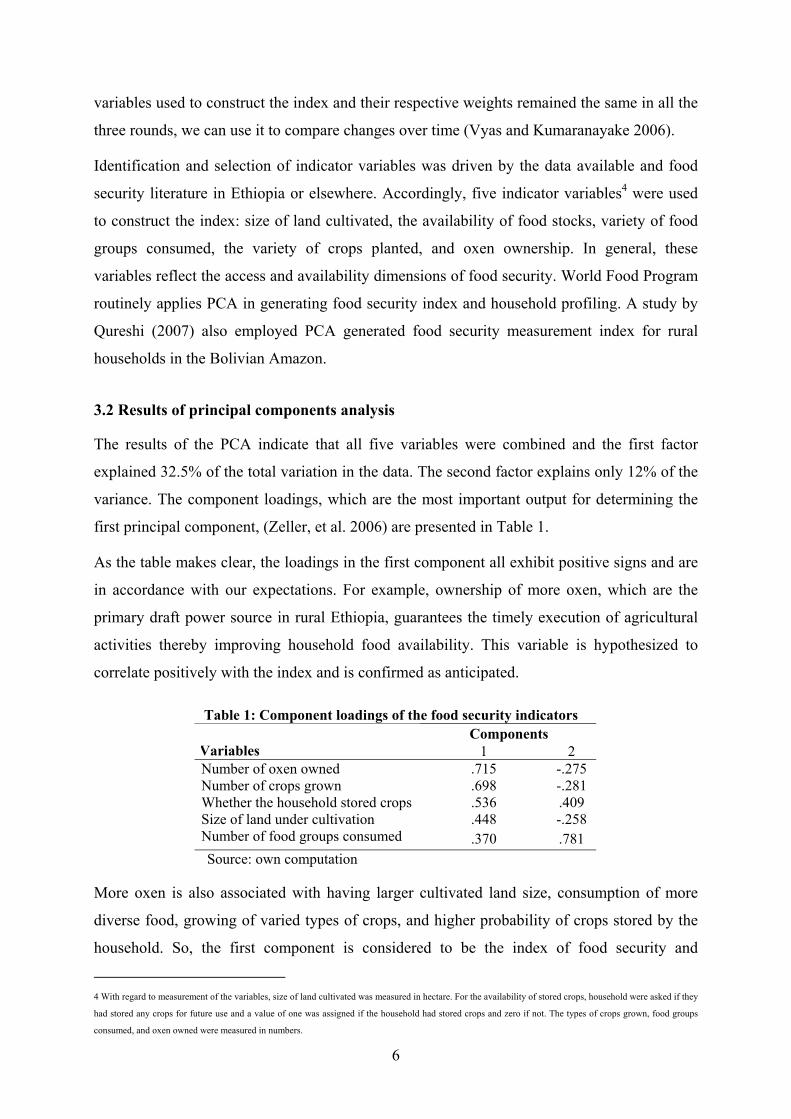
3.2 Results of principal components analysis
The results of the PCA indicate that all five variables were combined and the first factor
explained 32.5% of the total variation in the data. The second factor explains only 12% of the
variance. The component loadings, which are the most important output for determining the
first principal component, (Zeller, et al. 2006) are presented in Table 1.
As the table makes clear, the loadings in the first component all exhibit positive signs and are
in accordance with our expectations. For example, ownership of more oxen, which are the
primary draft power source in rural Ethiopia, guarantees the timely execution of agricultural
activities thereby improving household food availability. This variable is hypothesized to
correlate positively with the index and is confirmed as anticipated.
Table 1: Component loadings of the food security indicators Components
Variables 1 2 Number of oxen owned .715 -.275 Number of crops grown .698 -.281 Whether the household stored crops .536 .409 Size of land under cultivation .448 -.258 Number of food groups consumed .370 .781
Source: own computation
More oxen is also associated with having larger cultivated land size, consumption of more
diverse food, growing of varied types of crops, and higher probability of crops stored by the
household. So, the first component is considered to be the index of food security and
4 With regard to measurement of the variables, size of land cultivated was measured in hectare. For the availability of stored crops, household were asked if they
had stored any crops for future use and a value of one was assigned if the household had stored crops and zero if not. The types of crops grown, food groups
consumed, and oxen owned were measured in numbers.
7
vulnerability for our purpose. The value of the Kaiser-Meyer-Olkin (KMO) measure of
sampling adequacy is 0.66 which justifies the model as fairly acceptable (Henry et al. 2003).
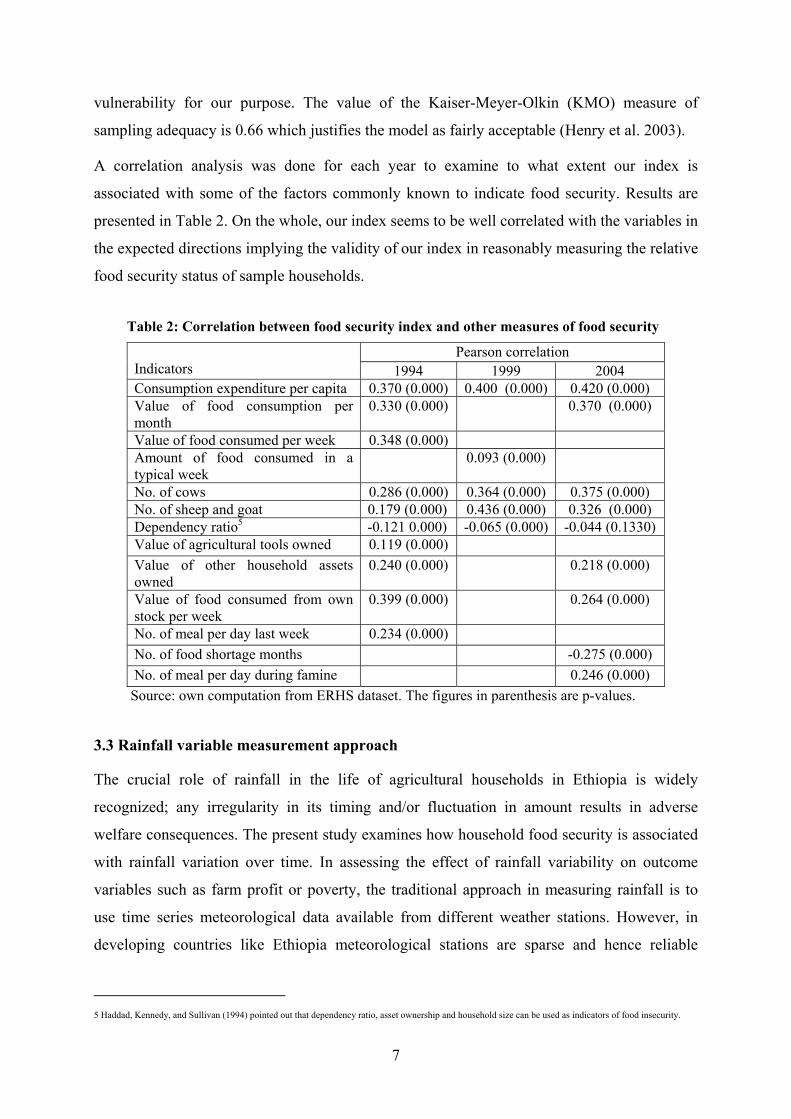
A correlation analysis was done for each year to examine to what extent our index is
associated with some of the factors commonly known to indicate food security. Results are
presented in Table 2. On the whole, our index seems to be well correlated with the variables in
the expected directions implying the validity of our index in reasonably measuring the relative
food security status of sample households.
Table 2: Correlation between food security index and other measures of food security
Pearson correlation Indicators 1994 1999 2004 Consumption expenditure per capita 0.370 (0.000) 0.400 (0.000) 0.420 (0.000) Value of food consumption per month
0.330 (0.000) 0.370 (0.000)
Value of food consumed per week 0.348 (0.000) Amount of food consumed in a typical week
0.093 (0.000)
No. of cows 0.286 (0.000) 0.364 (0.000) 0.375 (0.000) No. of sheep and goat 0.179 (0.000) 0.436 (0.000) 0.326 (0.000) Dependency ratio5 -0.121 0.000) -0.065 (0.000) -0.044 (0.1330) Value of agricultural tools owned 0.119 (0.000) Value of other household assets owned
0.240 (0.000) 0.218 (0.000)
Value of food consumed from own stock per week
0.399 (0.000) 0.264 (0.000)
No. of meal per day last week 0.234 (0.000) No. of food shortage months -0.275 (0.000) No. of meal per day during famine 0.246 (0.000)
Source: own computation from ERHS dataset. The figures in parenthesis are p-values.
3.3 Rainfall variable measurement approach
The crucial role of rainfall in the life of agricultural households in Ethiopia is widely
recognized; any irregularity in its timing and/or fluctuation in amount results in adverse
welfare consequences. The present study examines how household food security is associated
with rainfall variation over time. In assessing the effect of rainfall variability on outcome
variables such as farm profit or poverty, the traditional approach in measuring rainfall is to
use time series meteorological data available from different weather stations. However, in
developing countries like Ethiopia meteorological stations are sparse and hence reliable
5 Haddad, Kennedy, and Sullivan (1994) pointed out that dependency ratio, asset ownership and household size can be used as indicators of food insecurity.

8
rainfall data at micro-level is scarce. So, given this difficulty, the present study uses the recall
method to measure rainfall.
The rainfall index is calculated to represent households experience in rainfall quality based on
their recall of the preceding agricultural season. More specifically, households were asked
whether rain came and stopped on time, whether there was enough rain at the beginning and
during the growing season and whether it rained at harvest time. The responses for these
questions were dichotomized in such a way that those who respond “on time” coded into one
and others (early /late) into zero. We summed them up and divided them by the number of
rain related questions (5). So the most favourable rainfall outcome is one and the least is zero.
Quisumbing (2003) in a study of food aid and child nutrition in Ethiopia also followed similar
approach in generating a rainfall variable.
3.4 Econometric Models and variables
The present analysis is performed on three rounds of household panel data sets which are
spaced five years apart. The panel nature of the data calls for the use of models which are
appropriate for it. Accordingly, econometric estimations are done applying the two prominent
panel data models: fixed effects and random effects models. These models, by virtue of their
capacity to account for intertemporal as well as individual differences, provide a better control
for the influence of missing or unobserved variables (Chan and Gemayel 2004). Let us
consider the following simple panel data model:
Yit = βXit + αi + uit (3)
Where:
Yit is the dependent variable observed for household i at time t, in our case it is the food
security index derived from PCA procedure.
Xit is a vector of explanatory variables for household i at time t
ß is a vector of coefficients.
αi denotes unobserved household specific effects which are assumed to be fixed over time
and vary across household i.
uit is the error term

9
The assumption behind the relationship between the Xit and αi makes the fixed effects and
random effects models different. The fixed effects approach assumes that αi is treated as non-
random and hence make the correlation between the observed explanatory variables (Xit) and
αi possible. On the other hand, the random effects approach is applicable under the
assumption that αi is random and not correlated with Xit and puts it into the error term
(Wooldridge 2003). We used a Hausman test to check whether there is such a correlation
between the observed explanatory variables and αi so that the suitable model specification is
decided. According to Hill et al. (2008) if there is no correlation, in large samples the results
obtained in applying the two estimators should be alike. Yet if there is correlation, the
estimated results of the two estimators are different. Specifically, in the presence of such a
correlation the random effects estimator is inconsistent whereas that of the fixed effects
remains consistent. We also conducted a test to detect whether there is autocorrelation and
whether the variance of the residuals is homeskedastic in the model specified.
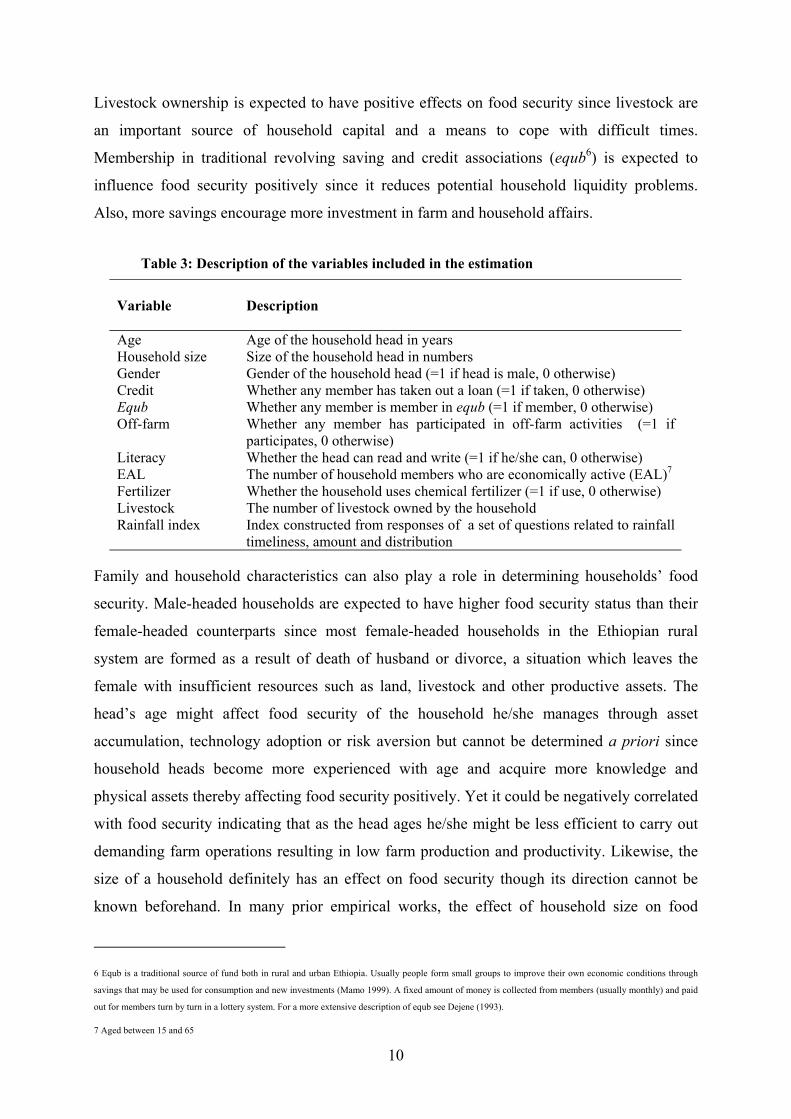
In the following, we describe the variables included in the model and our prior expectations
about their relationship with food security. Table 3 presents the definitions of the variables
included in the empirical model. Although the focus is effect of rainfall shock on food
security and vulnerability, we also controlled for other factors that are hypothesized to
associate with food security index. Thus, a number of demographic, social, and economic
variables are included in the model. Prevalence of favourable rainfall is hypothesized to affect
food security positively as most sample households engage predominantly in agriculture
which is entirely rain dependant. We expect food security to be positively associated with
modern technology use, such as fertilizer, since its application might augment both food and
income. Access to credit is anticipated to have a positive influence because it enables farmers
apply more inputs by easing short term liquidity constraints thereby influencing food
production. Credit can also be used as a consumption smoothing mechanism in the event of
food shortage in the household (Zeller and Sharma 2000). Involvement in off-farm activities
is also hypothesized to affect household food security but its effect cannot be determined
beforehand. This is because engagement in these activities might bring about more money
thereby corroborating the food security situation of the household. If, however, farmers spend
more of their time on off-farm activities, there is less time for farm operation and particularly
if the wage they earn is not commensurate with the forgone farm income, their food security
situation will be in jeopardy.
10
Livestock ownership is expected to have positive effects on food security since livestock are
an important source of household capital and a means to cope with difficult times.
Membership in traditional revolving saving and credit associations (equb6) is expected to
influence food security positively since it reduces potential household liquidity problems.
Also, more savings encourage more investment in farm and household affairs.
Table 3: Description of the variables included in the estimation
Variable
Description
Age Age of the household head in years Household size Size of the household head in numbers Gender Gender of the household head (=1 if head is male, 0 otherwise) Credit Whether any member has taken out a loan (=1 if taken, 0 otherwise) Equb Whether any member is member in equb (=1 if member, 0 otherwise) Off-farm Whether any member has participated in off-farm activities (=1 if
participates, 0 otherwise) Literacy Whether the head can read and write (=1 if he/she can, 0 otherwise) EAL The number of household members who are economically active (EAL)7 Fertilizer Whether the household uses chemical fertilizer (=1 if use, 0 otherwise) Livestock Rainfall index
The number of livestock owned by the household Index constructed from responses of a set of questions related to rainfall timeliness, amount and distribution
Family and household characteristics can also play a role in determining households’ food
security. Male-headed households are expected to have higher food security status than their
female-headed counterparts since most female-headed households in the Ethiopian rural
system are formed as a result of death of husband or divorce, a situation which leaves the
female with insufficient resources such as land, livestock and other productive assets. The
head’s age might affect food security of the household he/she manages through asset
accumulation, technology adoption or risk aversion but cannot be determined a priori since
household heads become more experienced with age and acquire more knowledge and
physical assets thereby affecting food security positively. Yet it could be negatively correlated
with food security indicating that as the head ages he/she might be less efficient to carry out
demanding farm operations resulting in low farm production and productivity. Likewise, the
size of a household definitely has an effect on food security though its direction cannot be
known beforehand. In many prior empirical works, the effect of household size on food
6 Equb is a traditional source of fund both in rural and urban Ethiopia. Usually people form small groups to improve their own economic conditions through
savings that may be used for consumption and new investments (Mamo 1999). A fixed amount of money is collected from members (usually monthly) and paid
out for members turn by turn in a lottery system. For a more extensive description of equb see Dejene (1993).
7 Aged between 15 and 65

11
security is mixed. Some studies identify household size negatively associated with food
security since larger sized households need more resources to fulfil household food needs
whereas others read this positively as it means that there is a larger available labour force.
Availability of economically active manpower helps to carry out farm operations timely and
effectively. The subjects might also be involved in other farm or non-farm activities thereby
diversifying and increasing the income source of the household which in turn affects food
security in a positive way. In any development endeavour the role of education is well-
acknowledged. In the present study we hypothesize a household with literate head will have a
better food security status.
In addition to the model specified above, we also estimated a multinomial logit model. Based
on the evolution of their index values over the three periods, households were classified into
three states of food security: always-less-secured (households whose index value is
persistently negative across the three survey periods), vulnerable (households whose index
value is sometimes positive and sometimes negative), and always-more-secured (households
whose index value is persistently positive). Using the multinomial logistic model we tried to
identify the factors that affect the likelihood of the household becoming always-less-secure,
vulnerable, and always-more-secure. The model compares the probability of two states of
food security to the probability of the third (the reference category). The explanatory variables
described above are used in this model as well.
4. Results
4.1 Descriptive analysis
Applying the index derived earlier, sample households are classified into a relative food
security groups. Those households with a positive index values are categorized as a relatively
more food secured whereas those with negative index values as less food secured. In the
following we examine differences between these groups thereby evaluating the validity of the
index in differentiating the households into the two groups in a logical fashion. Results of the
investigation of the differences between the more and the less food secure groups in several
demographic, economic and institutional variables are provided in Table 4.
12
Human capital
One can identify from the table that in all the three rounds of the data the more food secure
households tend to consistently have more family members than the less secured ones.
Moreover, the number of household members who are economically active is far higher in
more secured households indicating that these households are better endowed with
economically active labour resource which is vital for agricultural production. Similarly, in all
the three rounds the less secured households tend to have larger number of dependents than
the relatively more secured ones. In each of the cases the analysis reveals that the difference is
statistically significant at 1% level of probability. With regard to household head attributes
such as gender and education, the results show that the index score is significantly higher for
households whose head is male and literate signifying that secured households are in a better
position in human capital. Concerning the head’s age, in 1994 data, more secured households
tend to have relatively older heads than the less secured ones and the difference is statistically
significant at 1%. However, in 1999 and 2004, there is no statistically significant age
difference between the two groups.
Ownership of livestock, land, and production
Livestock is an integral part of smallholders’ production system in Ethiopia. It can serve as a
critical input in farm operations as it enhances production and is also an important source of
capital through which considerable income is generated. In our analysis of all of survey
periods the two groups noticeably differ in the number of livestock owned, i.e. more livestock
was kept by households that were more food secured. The difference is statistically significant
at 1%. This implies that if households’ livestock possession were increased, their food
security status would also respond positively. Specifically, the two groups also differ in oxen
possession. The more secured households possess more oxen compared to the less secured
ones over the three survey periods and the difference is highly significant at 1%. Likewise,
there is a significant variation in the area under cultivation between the two groups in all the
three years. On average the more secured households command 1.2 ha of land compared to
0.56 ha for less secured ones. The difference is statistically significant at 1%. Agricultural
production is mainly dependent on the availability of sufficient rain. Over the three survey
periods the two groups significantly differ in their experience of rainfall quality in that the
more secured ones persistently experiencing relatively better rainfall outcome than the less
secured counterparts. These results confirm the centrality of land, oxen and rainfall in
household food production system in Ethiopia and in line with the common knowledge that
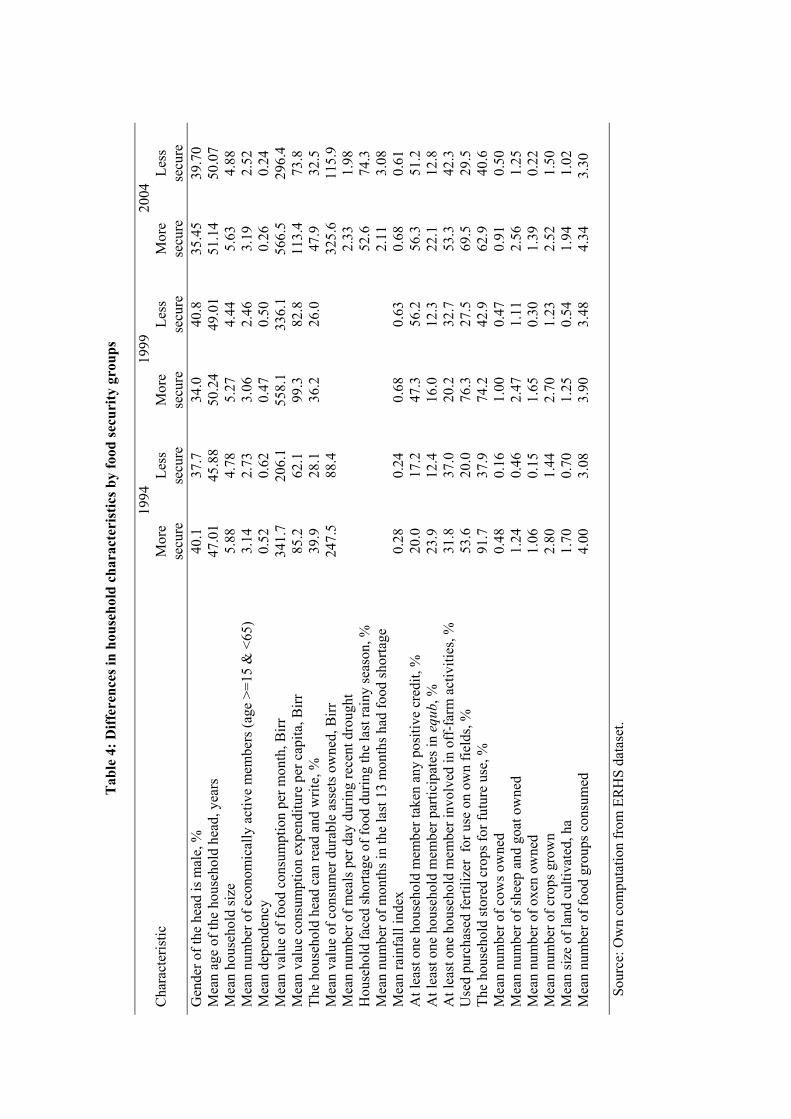
13
Tab
le 4
: Diff
eren
ces i
n ho
useh
old
char
acte
rist
ics b
y fo
od se
curi
ty g
roup
s
1994
19
99
2004
C
hara
cter
istic
M
ore
secu
re
Less
se
cure
M
ore
secu
re
Less
se
cure
M
ore
secu
re
Less
se
cure
G
ende
r of t
he h
ead
is m
ale,
%
40.1
37
.7
34.0
40
.8
35.4
5 39
.70
Mea
n ag
e of
the
hous
ehol
d he
ad, y
ears
47
.01
45.8
8 50
.24
49.0
1 51
.14
50.0
7 M
ean
hous
ehol
d si
ze
5.88
4.
78
5.27
4.
44
5.63
4.
88
Mea
n nu
mbe
r of e
cono
mic
ally
act
ive
mem
bers
(age
>=1
5 &
<65
) 3.
14
2.73
3.
06
2.46
3.
19
2.52
M
ean
depe
nden
cy
0.52
0.
62
0.47
0.
50
0.26
0.
24
Mea
n va
lue
of fo
od c
onsu
mpt
ion
per m
onth
, Birr
34
1.7
206.
1 55
8.1
336.
1 56
6.5
296.
4 M
ean
valu
e co
nsum
ptio
n ex
pend
iture
per
cap
ita, B
irr
85.2
62
.1
99.3
82
.8
113.
4 73
.8
The
hous
ehol
d he
ad c
an re
ad a
nd w
rite,
%
39.9
28
.1
36.2
26
.0
47.9
32
.5
Mea
n va
lue
of c
onsu
mer
dur
able
ass
ets o
wne
d, B
irr
247.
5 88
.4
325.
6 11
5.9
Mea
n nu
mbe
r of m
eals
per
day
dur
ing
rece
nt d
roug
ht
2.33
1.
98
Hou
seho
ld fa
ced
shor
tage
of f
ood
durin
g th
e la
st ra
iny
seas
on, %
52
.6
74.3
M
ean
num
ber o
f mon
ths i
n th
e la
st 1
3 m
onth
s had
food
shor
tage
2.
11
3.08
M
ean
rain
fall
inde
x 0.
28
0.24
0.
68
0.63
0.
68
0.61
A
t lea
st o
ne h
ouse
hold
mem
ber t
aken
any
pos
itive
cre
dit,
%
20.0
17
.2
47.3
56
.2
56.3
51
.2
At l
east
one
hou
seho
ld m
embe
r par
ticip
ates
in e
qub,
%
23.9
12
.4
16.0
12
.3
22.1
12
.8
At l
east
one
hou
seho
ld m
embe
r inv
olve
d in
off
-far
m a
ctiv
ities
, %
31.8
37
.0
20.2
32
.7
53.3
42
.3
Use
d pu
rcha
sed
ferti
lizer
for
use
on
own
field
s, %
53
.6
20.0
76
.3
27.5
69
.5
29.5
Th
e ho
useh
old
stor
ed c
rops
for f
utur
e us
e, %
91
.7
37.9
74
.2
42.9
62
.9
40.6
M
ean
num
ber o
f cow
s ow
ned
0.
48
0.16
1.
00
0.47
0.
91
0.50
M
ean
num
ber o
f she
ep a
nd g
oat o
wne
d
1.24
0.
46
2.47
1.
11
2.56
1.
25
Mea
n nu
mbe
r of o
xen
owne
d
Mea
n nu
mbe
r of c
rops
gro
wn
Mea
n si
ze o
f lan
d cu
ltiva
ted,
ha
Mea
n nu
mbe
r of f
ood
grou
ps c
onsu
med
1.06
2.
80
1.70
4.
00
0.15
1.
44
0.70
3.
08
1.65
2.
70
1.25
3.
90
0.30
1.
23
0.54
3.
48
1.39
2.
52
1.94
4.
34
0.22
1.
50
1.02
3.3
0
Sour
ce: O
wn
com
puta
tion
from
ER
HS
data
set.
14
prevalence of adverse weather conditions, lack of oxen and smaller size of land holding as the
underlying causes of food insecurity.
The number of crops grown and food groups consumed also differ between the two groups.
The more secured households grow relatively more number of crops and consume a more
diverse diet with a statistically significant difference at 1% level. Similarly, the proportion of
households who stored crops for future use is higher in more secured category than the less
secured ones and the difference is statistically valid at 1% level of significance.
Off-farm employment, input use, and credit
In all survey rounds under consideration, we found a clear and consistent pattern of
association of fertilizer use and participation in equb with higher level of food security index
score. The results indicate that those households who use fertilizer and are members in equb
consistently registered a significantly higher score of the food security index. This
observation might justify the role fertilizer use and traditional savings associations play in
strengthening household food security in sample households. The pattern in households’
credit access and participation in off-farm activities is rather mixed. In 1994 and 2004 those
households who had access to credit exhibit a significantly higher index value whereas in
1999 survey period the trend is reversed. Likewise, participation in off-farm activities shows
an inconsistent picture. In 2004 those who participated in these activities were found to have a
significantly higher index score but the reverse holds true for 1999.
Coping with food crisis
Rural households in Ethiopia operate under entirely rainfed conditions and hence they are
highly exposed to several types of climatic risks and shocks. Here we briefly highlight the
differences between the more secured and less secured households in managing and coping
with food crises situation emanated from rainfall shock. To this end we used the 2004 round
dataset as prior to it there was an occurrence of a widespread drought in the country. At the
worst time of the drought the average number of meals per day for the more secured
households was 2.33 and for the less secured ones it was 1.98 and the difference is significant
statistically at 1%. The proportion of households who suffered food shortage in the year prior
to the 2004 survey was 74.3% for the less food secured groups and 52.6% for the more
secured groups with a difference statistically significant at 1%. Likewise, there is also
variation in the number of months households have food shortage in a given year. On average
15
less food secured households suffer 3.1 months of food shortage compared to the more
secured ones who suffer only 2.1 months.
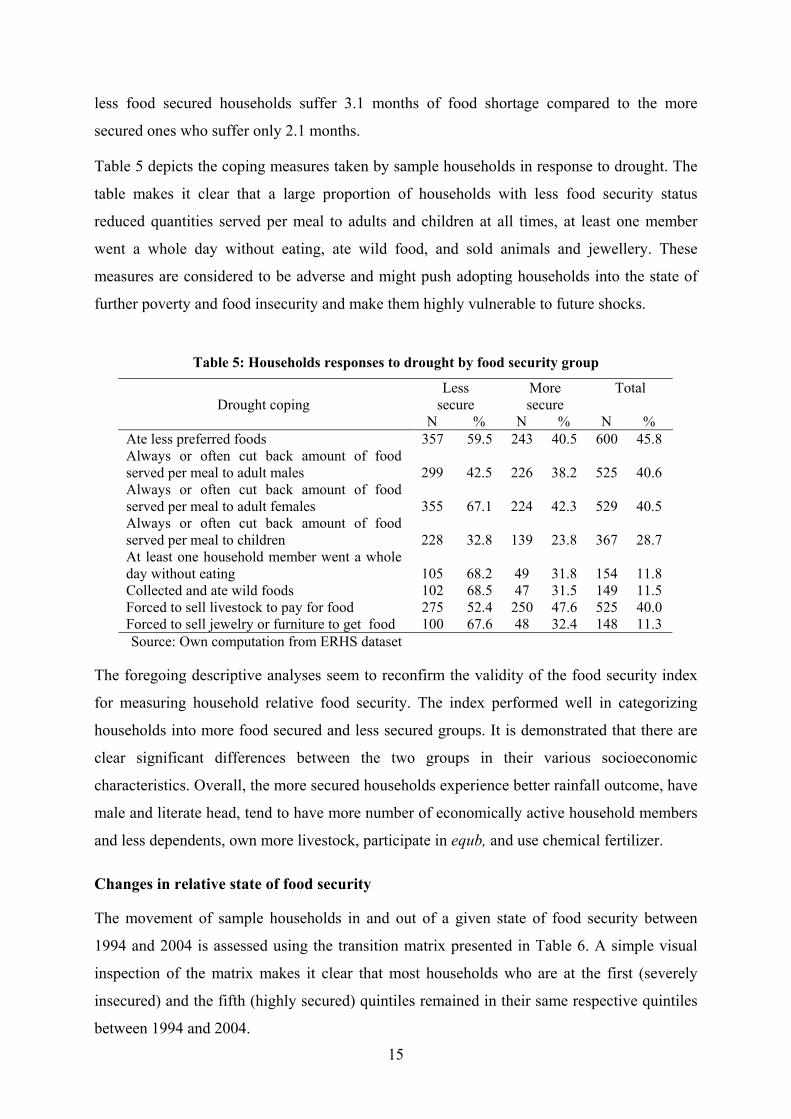
Table 5 depicts the coping measures taken by sample households in response to drought. The
table makes it clear that a large proportion of households with less food security status
reduced quantities served per meal to adults and children at all times, at least one member
went a whole day without eating, ate wild food, and sold animals and jewellery. These
measures are considered to be adverse and might push adopting households into the state of
further poverty and food insecurity and make them highly vulnerable to future shocks.
Table 5: Households responses to drought by food security group
Less secure
More secure
Total Drought coping
N % N % N % Ate less preferred foods 357 59.5 243 40.5 600 45.8 Always or often cut back amount of food served per meal to adult males
299
42.5
226
38.2
525
40.6
Always or often cut back amount of food served per meal to adult females
355
67.1
224
42.3
529
40.5
Always or often cut back amount of food served per meal to children
228
32.8
139
23.8
367
28.7
At least one household member went a whole day without eating
105
68.2
49
31.8
154
11.8
Collected and ate wild foods 102 68.5 47 31.5 149 11.5 Forced to sell livestock to pay for food 275 52.4 250 47.6 525 40.0 Forced to sell jewelry or furniture to get food 100 67.6 48 32.4 148 11.3
Source: Own computation from ERHS dataset
The foregoing descriptive analyses seem to reconfirm the validity of the food security index
for measuring household relative food security. The index performed well in categorizing
households into more food secured and less secured groups. It is demonstrated that there are
clear significant differences between the two groups in their various socioeconomic
characteristics. Overall, the more secured households experience better rainfall outcome, have
male and literate head, tend to have more number of economically active household members
and less dependents, own more livestock, participate in equb, and use chemical fertilizer.
Changes in relative state of food security
The movement of sample households in and out of a given state of food security between
1994 and 2004 is assessed using the transition matrix presented in Table 6. A simple visual
inspection of the matrix makes it clear that most households who are at the first (severely
insecured) and the fifth (highly secured) quintiles remained in their same respective quintiles
between 1994 and 2004.
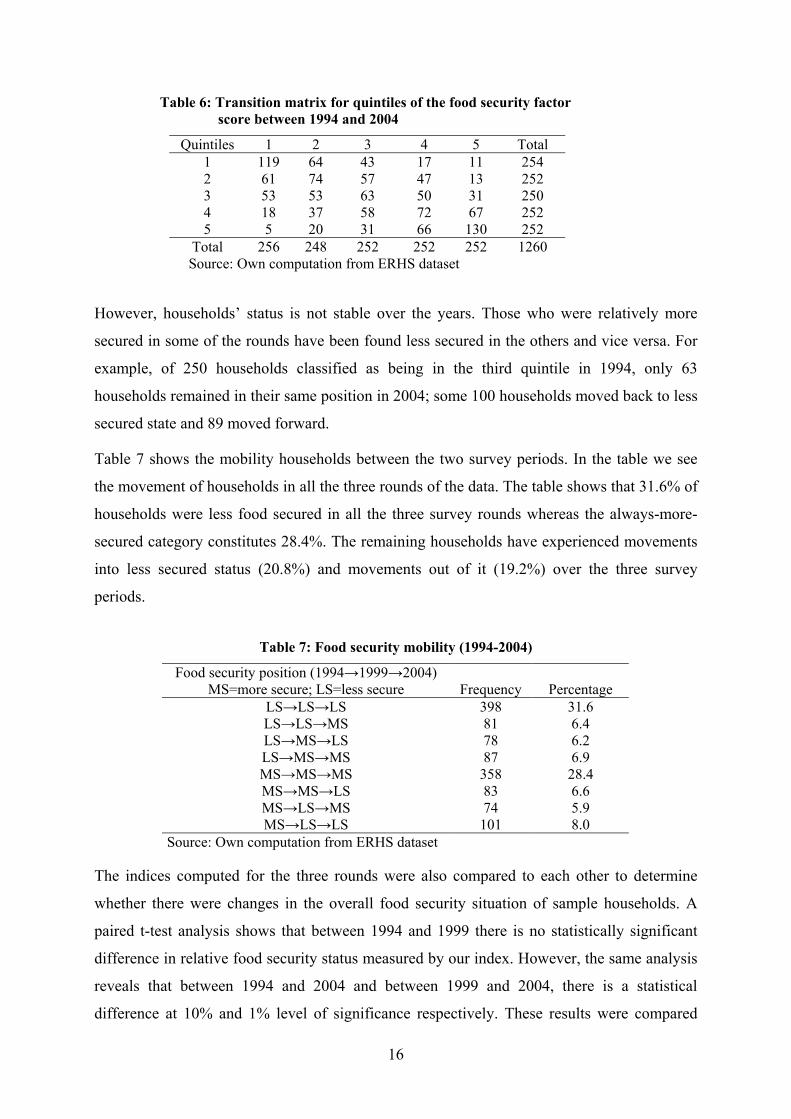
16
Table 6: Transition matrix for quintiles of the food security factor score between 1994 and 2004
Quintiles 1 2 3 4 5 Total 1 119 64 43 17 11 254 2 61 74 57 47 13 252 3 53 53 63 50 31 250 4 18 37 58 72 67 252 5 5 20 31 66 130 252
Total 256 248 252 252 252 1260 Source: Own computation from ERHS dataset
However, households’ status is not stable over the years. Those who were relatively more
secured in some of the rounds have been found less secured in the others and vice versa. For
example, of 250 households classified as being in the third quintile in 1994, only 63
households remained in their same position in 2004; some 100 households moved back to less
secured state and 89 moved forward.
Table 7 shows the mobility households between the two survey periods. In the table we see
the movement of households in all the three rounds of the data. The table shows that 31.6% of
households were less food secured in all the three survey rounds whereas the always-more-
secured category constitutes 28.4%. The remaining households have experienced movements
into less secured status (20.8%) and movements out of it (19.2%) over the three survey
periods.
Table 7: Food security mobility (1994-2004)
Food security position (1994→1999→2004) MS=more secure; LS=less secure
Frequency
Percentage
LS→LS→LS 398 31.6 LS→LS→MS 81 6.4 LS→MS→LS 78 6.2 LS→MS→MS 87 6.9 MS→MS→MS 358 28.4 MS→MS→LS 83 6.6 MS→LS→MS 74 5.9 MS→LS→LS 101 8.0
Source: Own computation from ERHS dataset
The indices computed for the three rounds were also compared to each other to determine
whether there were changes in the overall food security situation of sample households. A
paired t-test analysis shows that between 1994 and 1999 there is no statistically significant
difference in relative food security status measured by our index. However, the same analysis
reveals that between 1994 and 2004 and between 1999 and 2004, there is a statistical
difference at 10% and 1% level of significance respectively. These results were compared
17
against the results of prior studies which report poverty is showing a declining trend over the
period from 1994 and 2004 in the same households (Dercon et al. 2007) and in line with these
findings. This suggests the strong link between poverty and food security in the sample
households.
4.2 Econometric analysis
Estimations employing both fixed effects and random effects model were done and the results
compared using the Hausman test under the null hypothesis that the unobserved household
effects are uncorrelated with the explanatory variables included in the model. The analysis
rejected the null hypothesis (Prob>chi2=0.000). This implies that the unobserved effect and
the other regressors are correlated hence a random effect model produces inconsistent results
and we should use the fixed effects estimator (Hill et al. 2008). Thus, we report here the fixed
effects model estimation results. The model was diagnosed to identify whether problems of
heteroskedasticity and autocorrelation occur in it. In testing heteroskedasticity, we used the
modified Wald statistics (Greene 2000) and the results suggest the model is not
homoskedastic. With regard to autocorrelation, a test was done by employing a procedure
suggested by Wooldridge (2002) and we cannot reject the no autocorrelation hypothesis
(Prob>F=0.3347). These results indicate that if we do not take the problem of
heteroskedasticity into consideration in the estimation, the parameter estimates will be less
efficient. Hence, in the fixed effects estimation we used robust and consistent standard errors
corrected for heteroskedasticity. The estimation results are presented in Table 8. The
estimated results show both head and farm characteristics matter in explaining sample
households food security score. Most of the variables have their expected sign except credit
which carried unexpected sign.
The effect of rainfall shock is as anticipated, positively and significantly associated with food
security over time. The result suggests that if rainfall is favourable (in terms of timeliness,
amount and distribution), then households experience a relatively better food security
condition. This finding confirms the notion that climate is one of the critical “drivers of food
security” in many African agrarian households (Gregory et al. 2005). As expected, education
of the household head affects food security positively though the coefficient is not statistically
different from zero. The positive sign suggests educated heads might have better knowledge
in acquiring and information processing potential which eventually translates into better farm
input use, resource management and consequently better food security. The findings of the
study by Ramakrishna and Demeke (2002) lend support to this result.

18
Table 8: Estimation results of the fixed effects regression model
Food security index
Coef.
Robust std. Err.
t
Gender 0.0021 0.216 0.01 Age 0.0149* 0.008 1.81 Age2 -0.0002** 0.000 -2.06 Literacy 0.0144 0.051 0.28 Household size 0.0382*** 0.010 4.03 EAL 0.1685 0.108 1.56 Fertilizer 0.2731*** 0.042 6.55 Equb 0.1697*** 0.045 3.75 Credit -0.0617* 0.033 -1.90 Off-farm 0.0678** 0.034 1.97 Livestock 0.0128*** 0.004 3.06 Rainfall index 0.0883** 0.046 1.94 Constant -0.8056* 0.252 -3.20 R-sq within 0.0690 R-sq between 0.3276 R-sq overall 0.2557 Number of observations 3296
Note: *, **, *** indicate significance levels at 10, 5, and 1% respectively.
The gender of the household head is positively but insignificantly associated with food
security. A positive gender variable implies that male-headed households tend to be more
food secured than female headed ones as expected. The result reflects the fact that female-
headed households in rural Ethiopia, by virtue of their formation, are often less privileged in
terms of asset and productive capital ownership. A study by Riber and Hameric (2003) assert
that female-headed households face a high risk of being food insufficient in the US, a finding
similar to ours. Household head’s age is associated with food security positively and
significantly whereas its squared value registers negatively. The higher the age the more food
secured a household will be yet the negative and significant squared age value suggests age
and food security score go together only to a certain age after which increased age has a food
security diminishing effect. However, this result differs from results of Alene and Manyong
(2006) for Nigeria and Muluken et al. (2008) for Ethiopia.
The parameter estimates for household size is significant and positive reflecting that a
household with more family members is in a more advantageous position to enhance its food
security. The positive sign is consistent with the findings of Alene and Manyong (2006) in
Nigeria. A study by Toulmin (1986) in rural Mali also suggests that larger sized households
tend to have diverse income sources and have the advantages of economies of scale that can
be realized by higher family assets such as oxen and labour income sources. However, this
result is contradicted by other studies done in Ethiopia (Feleke and Gladwin 2003;
19
Ramakrishna and Demeke 2002; Muluken et al. 2008; Kidane et al. 2005) and elsewhere
(Nyariki et al. 2002; Wilde and Nord 2005).
In line with our hypothesis, the number of economically active members in the household has
been found to affect food security positively yet significant at 11.8% level suggesting that
increases in household endowment with more of active and capable labor force affects its
food security status positively. Labour is one of the most important capitals rural families
possess.
Consistent with our expectation, livestock asset endowments are positively and significantly
associated with food security implying that the more livestock a household has the better its
food security position. This is similar to the finding of Ramakrishna and Demeke (2002) in
Ethiopia. Economists have long stated that the welfare status of a household is determined by
its resource endowment. Our results are consistent with this notion.
In accordance with our expectation, use of chemical fertilizer a proxy for modern technology
use has its expected positive sign and is highly significant. This implies that households
could improve their food security situation by increasing use of modern technological inputs
in their farm operations. Feleke and Gladwin (2003), Ramakrishna and Demeke (2002),
Muluken et al. (2008), and Kidane et al. (2005) also found use of fertilizer positively and
significantly related to food security.
Membership in equb, a local savings group, significantly contributes to household food
security. This result was anticipated because in rural Ethiopia, where the existence and
operation of formal financial institutions is limited or nonexistent, one would expect the
positive role played by such local savings and credit associations. Households who are
members of these associations are in a better condition to access financial resources for
making investments in their farm and/or for bridging the food gap in times of scarcity.
Contrary to our expectation, access to credit was found to be negatively and significantly
associated with food security. The negative sign perhaps partly indicates that credit was not
mainly used for investment but rather for food consumption, which could trigger repayment
problems. As a result, households are forced to sell off their scarce holdings such as livestock
and stored grains. Participation in off-farm activities was found to be significantly and
positively associated with food security, a finding similar with Nyariki et al. (2002) who
found involvement in off-farm activities positively and significantly affect food security in
Kenya. Contrary findings to this were the Zona de Mata households in Brazil where the
likelihood of malnourishment was higher for households who depend more on off-farm
20
employment sources for their income than other households in the sample (Von Braun and
Pandya-Lorch 1992:42). Overall, the empirical results presented here correspond to the results
of foregoing descriptive analysis.
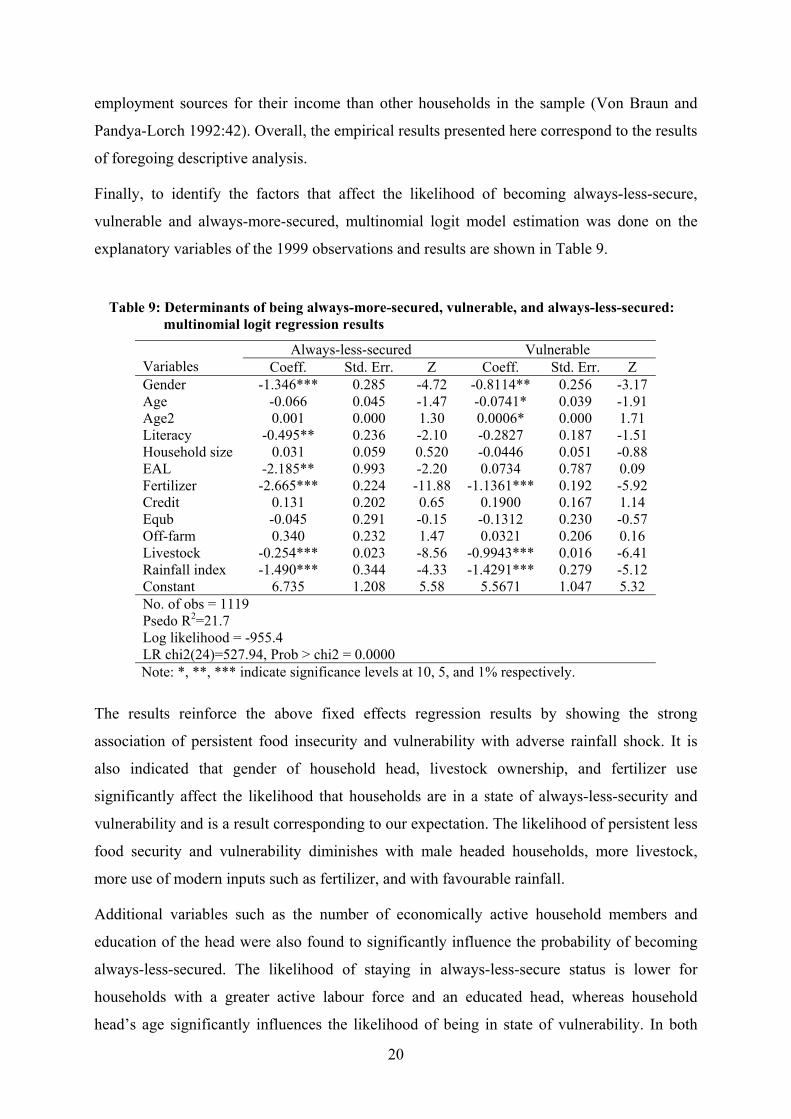
Finally, to identify the factors that affect the likelihood of becoming always-less-secure,
vulnerable and always-more-secured, multinomial logit model estimation was done on the
explanatory variables of the 1999 observations and results are shown in Table 9.
Table 9: Determinants of being always-more-secured, vulnerable, and always-less-secured: multinomial logit regression results
Always-less-secured Vulnerable Variables Coeff. Std. Err. Z Coeff. Std. Err. Z Gender -1.346*** 0.285 -4.72 -0.8114** 0.256 -3.17 Age -0.066 0.045 -1.47 -0.0741* 0.039 -1.91 Age2 0.001 0.000 1.30 0.0006* 0.000 1.71 Literacy -0.495** 0.236 -2.10 -0.2827 0.187 -1.51 Household size 0.031 0.059 0.520 -0.0446 0.051 -0.88 EAL -2.185** 0.993 -2.20 0.0734 0.787 0.09 Fertilizer -2.665*** 0.224 -11.88 -1.1361*** 0.192 -5.92 Credit 0.131 0.202 0.65 0.1900 0.167 1.14 Equb -0.045 0.291 -0.15 -0.1312 0.230 -0.57 Off-farm 0.340 0.232 1.47 0.0321 0.206 0.16 Livestock -0.254*** 0.023 -8.56 -0.9943*** 0.016 -6.41 Rainfall index -1.490*** 0.344 -4.33 -1.4291*** 0.279 -5.12 Constant 6.735 1.208 5.58 5.5671 1.047 5.32 No. of obs = 1119 Psedo R2=21.7 Log likelihood = -955.4 LR chi2(24)=527.94, Prob > chi2 = 0.0000 Note: *, **, *** indicate significance levels at 10, 5, and 1% respectively.
The results reinforce the above fixed effects regression results by showing the strong
association of persistent food insecurity and vulnerability with adverse rainfall shock. It is
also indicated that gender of household head, livestock ownership, and fertilizer use
significantly affect the likelihood that households are in a state of always-less-security and
vulnerability and is a result corresponding to our expectation. The likelihood of persistent less
food security and vulnerability diminishes with male headed households, more livestock,
more use of modern inputs such as fertilizer, and with favourable rainfall.
Additional variables such as the number of economically active household members and
education of the head were also found to significantly influence the probability of becoming
always-less-secured. The likelihood of staying in always-less-secure status is lower for
households with a greater active labour force and an educated head, whereas household
head’s age significantly influences the likelihood of being in state of vulnerability. In both
21
models, the coefficients for the credit variable and in the vulnerability model for the labour
size variable carried unexpected signs though insignificant. The explanatory variables
included in the model are jointly significant at 1% error probability (Prob>Chi2=0.0000) and
the Psedo R2 associated with the model is 0.217 indicating that both always-less-secure and
vulnerable states of food insecurity are well predicted by the model.
5. Summary and conclusion
The main objective of this study was to investigate how household food security is associated
with an important climatic variable, rainfall variation, over time. To this end, we developed a
food security index using a combination of food security indicators and used this new index to
examine the dynamics and determinants of food security and vulnerability among selected
farm households using panel data in rural Ethiopia. We employed a principal components
analysis technique to estimate a relative food security index which can be comparable over
time. Descriptive statistical analysis showed that the index performed well at categorizing
households into relative food security groups. Accordingly, the results showed that the more
food secured households tend to consistently endowed with more human capital, livestock,
and land assets and experience favorable rainfall outcome compared to less secured
households. As well, the more secured households use more modern inputs, such as fertilizer,
which play a considerable role in their agricultural production and hence contributing to food
availability. Correlation analysis indicates our index is correlated strongly with some
alternative indicators of food security suggesting the validity of the index in reasonably
measuring the relative food security status of sample households. Results from regression
analyses are consistent with the descriptive analysis. In the regression analysis rainfall has
emerged as an important factor influencing household food security. In addition, age of the
household head, family size, fertilizer use, equb membership, livestock ownership, and off-
farm participation variables are also positively and significantly associated with household
food security. Similarly, the results from a multinomial logistic regression analysis reveal the
critical role of favorable rainfall in reducing food insecurity and alleviating vulnerability. It is
also noted that gender of household head, fertilizer use, and livestock ownership are
associated with the likelihood of remaining in always-less-secured and being vulnerable. In
addition, education and number of active family members are significantly associated with the
state of always-less-secured whereas age is associated with the state of household
vulnerability.
22
Several important lessons can be drawn from these results. Firstly, both the descriptive and
regression results highlight the critical role rainfall and assets play in household food security.
This calls for policies that enhance the asset base of households thereby strengthening their
food production capability on one hand and coping capacity in the event of rainfall shock on
the other. Included in this would be measures which improve the productivity of the
household labor such as education and training, actions that improve the diversity and
productivity of the livestock asset such as provision of improved feed and fodder crops and
improvement in animal health and market infrastructure. As well, the study suggests strong
consideration of programs which encourage irrigation development schemes and water
resources conservation activities. Interventions that assist the expansion of traditional savings
associations as potential avenues for financial resources should also be given due emphasis.
Secondly, the positive and significant association of food security with participation in off-
farm activities highlights the importance of programs that create employment opportunities
for farmers to diversify their income sources.
Thirdly, fertilizer use is found to significantly impact food security indicating that
development interventions should coordinate efforts to encourage farmers to use modern farm
technologies by providing them technical assistance through effective extension programs.
There are widespread problems surrounding fertilizer use in Ethiopia including non-
timeliness, repayment timing and exorbitant price. Policymakers have to make efforts to curb
these problems and encourage use of fertilizers as recommended by agronomic researchers.
Given that food insecured groups are characterized by deep-rooted asset deprivations, targeted
support should be designed for these vulnerable groups to assist them use more productive
inputs thereby benefiting from its potential in augmenting farm output.
However, our analysis is restricted to the non-pastoralist households and hence, although
suggestive, the results cannot be generalized to all rural households in Ethiopia. Furthermore,
due to inconsistency in the data available for constructing the index of food security, the set of
indicators ultimately considered are limited and by no means complete. Also the method
developed here in measuring relative household food security has to be tested in different
settings to validate its usefulness in measuring food security and all these issues should be
taken into consideration at future research.
23
References
Abebe, G. (2007) Review of country poverty eradication/reduction strategies with particular reference to the progress in achievement of the MDGs.
Adenew, B. (2003) The food security role of agriculture in Ethiopia. Paper prepared for the Roles of Agriculture International Conference 20-22 October, 2003 – Rome, Italy.
Alene, A., Manyong, V. M. (2006) Endogenous technology adoption and household food security: the case of improved cowpea varieties in northern Nigeria. Quarterly Journal of International Agriculture, 45(3): 211-230.
Aredo, D. (1993) The Informal and Semi-Formal Financial Sectors in Ethiopia. A study of Iquib, Iddir, and savings and credit cooperatives. AERC, Nairobi.
Cavatassi, R., Davis, B., Lipper, L. (2004) Estimating poverty over time and space: Construction of a time-variant poverty index for Costa Rica. Working Papers 04-21, Agricultural and Development Economics Division, FAO - ESA.
Chan, K. K., Gemayel, E. R. (2004) Risk Instability and the pattern of foreign direct investment in the Middle East and North Africa Region. IMF Working Paper /04/139.
Chipanshi, A. C., Chanda, R., Totolo, O. (2003) Vulnerability assessment of the maize and sorghum crops to climate change in Botswana. Climatic Change, 61, 339–360.
Conte, A. (2005) Household food security profiles: Thematic guidelines. WFP. Rome Dercon, S., Hoddinott, J. (2004) The Ethiopian rural household surveys: Introduction. Data
description, ERHS. Dercon, S., Hoddinott, J., Woldehanna, T. (2005) Shocks and consumption in 15 Ethiopian
Villages, 1999-2004. Journal of African Economies, 14 (4) 559 - 585. Deressa, T. (2007) Measuring the economic impact of climate change on Ethiopian
agriculture: Ricardian approach. World Bank Policy Research Paper No. 4342. Washington D.C. World Bank.
Devereux, S. (2006) Distinguishing between chronic and transitory food insecurity in emergency needs assessments. World Food Program, Emmergency Needs Assessment Branch.
Downing, T. E. (1992) Climate change and vulnerable places: Global food security and country studies in Zimbabwe, Kenya, Senegal and Chile. Research Report No. 1, Environmental Change Unit, University of Oxford, Oxford.
FAO (1996) Rome declaration on world food security. World Food Summit. 13-17 Nov. 1996, Rome, Italy.
FAO (2006) The state of food insecurity in the world: Eradicating world hunger–taking stock ten years after the World Food Summit. FAO: Rome, Italy.
Feleke, S. T., Kilmer, R. L., Gladwin, C. H. (2005) Determinants of food security in Southern Ethiopia at the household level. Agricultural Economics, 33 (3) 351 – 363.
Greene, W. H. (2000) Econometric Analysis. Prentice Hall. Gregory, P. J., Ingram, J. S. I., Brklacich, M. (2005) Climate change and food security.
Philosophical Transactions of the Royal Society B. 360, 2139-2148. Haddad, L., Kennedy, E., Sullivan, J. (1994) Choice of indicators for food security and
nutrition monitoring. Food Policy 19 (3) 329-343. Henry, C., Sharma, M., Lapenu, C., Zeller, M. (2003) Microfinance poverty assessment
tool. CGAP/The International Bank for Reconstruction and Development, Technical Tools Series No. 5.
Hill, R. C., Griffiths, W. E., Lim, G. (2008) Principles of econometrics. John Wiley & Sons Inc.
Hoddinott, J. (1999) Choosing outcome indicators of household food security. Technical Guide #7. IFPRI-Washington D.C.
24
Hoddinott, J., Yohannes, Y. (2002) Dietary diversity as a food security indicator. FCND Discussion Paper No. 136, Washington DC: IFPRI.
Kebede, B. (2002) Land tenure and common pool resources in rural Ethiopia: A study based on fifteen sites. African Development Reveiew, 14:1 113.
Kidane, H., Alemu, Z. G., Kundhlande, G. (2005) Causes of Household Food Insecurity in Koredegaga PA, Oromiya Zone, Ethiopia. Agrekon, Vol 44, No. 4.
Mamo, T. (1999) The paradox of African poverty: the role of indigenous knowledge, traditional practices, and local institutions-the case of Ethiopia. The Red Sea Press.
Maxwell, D., Caldwell, R., Langworthy, M. (2008) Measuring food insecurity: Can an indicator based on localized coping behaviors be used to compare across contexts? Food Policy, 33, 533–540.
Ministry of Economic Development and Cooperation (MDaC) (1999) Poverty situation in Ethiopia. Welfare Monitoring Unit. Addis Ababa.
Ministry of Finance and Economic Development (MOFED) (2002) Poverty profile of Ethiopia: Analysis based on the 1999/00 HICE & WM Survey Results.
Mohamed, A. B., Duivenbooden, N. V., Abdoussallam, S. (2002) Impact of climate change on agricultural production in the Sahel - Part 1: Methodological approach and case study for groundnut and cowpea in Niger. Climatic Change, 54, 327–348.
Muluken, Y., Bogale, A., Negatu, W. (2008) Measuring rural household food security and its determinants in Assosa district of the Benishangul Gumuz region, Ethiopia. Quarterly Journal of International Agriculture, 47, No. 4.
Nyariki, D. M., Wiggins, S. L., Imungi, J. K. (2002) Levels and causes of household food and nutrition insecurity in dryland Kenya. Ecology of Food and Nutrition, 41:2,155-176.
Nyariki, D. M., Wiggins, S. L. (1997). Household food insecurity in sub-Saharan Africa: Lessons from Kenya. British Food Journal, 99: 249–262.
Quisumbing, A. R. (2003) Food aid and child nutrition in rural Ethiopia. World Development, 31(7): 1309-1324.
Qureshi, S. (2007) Creating an index to measure food security: Identifying the components and determinants and testing usefulness. Heller School for Social Policy and Management, Brandeis University.
Ramakrishna, G., Demeke, A. (2002) An empirical analysis of food insecurity in Ethiopia: the case of North Wello. African Development, Vol. XXVII, Nos. 1 & 2, pp. 127-143.
Ribar, D. C., Hamrick, K. S. (2003) Dynamics of poverty and food sufficiency. USDA Food Assistance and Nutrition Research Report No. 36.
Rosenzweig, C., Parry, M, L., Fischer, G. (1995) World food supply: In Strzepek, K. M. and Smith, J. B., (eds.), As Climate Changes: International Impacts and Implications, Cambridge University Press, New York, pp. 27–56.
Schulze, R. E., Kiker, G. A., Kunz, R. P. (1993) Global climate change and agricultural productivity in southern Africa. Global EnvironmentalChange, 3, 330-349.
Smith, L. C., Subandoro, A. (2007) Measuring food Security using household expenditure surveys, Food security in Practice technical guide series. Washington, D.C.: IFPRI.
Toulmin, C. (1986) Access to food, dry season strategies and household size amongst the Bambara of Central Mali. International Development Studies Bulletin, 17(3):58-66
Von Braun, J. (1991) A policy agenda for famine prevention in Africa. IFPRI-Food Policy Statement #13
Von Braun, J., Bouis, H., Kumar, S., Pandya-Lorch, R. (1992) Improving food security of the poor: Concept, policy and programs. Washington, D.C.: IFPRI.
Vyas, S., Kumaranayake, L. (2006) Constructing socioeconomic status indices: how to use PCA. Health Policy Planning, 21/6 (459-468).
Wild, P., Nord, M. (2005) The effect of food stamps on food security: A panel data approach. Review of Agricultural Economics, 27:3, 425-432.
25
Wooldridge, J. (2002) Econometric analysis of cross section and panel data. The MIT Press. Yesuf, M., Di Falco, S., Deressa, T., Ringler, C., Kohlin, G. (2008) The impact of climate
change and adaptation on food production in low-income countries. IFPRI Discussion Paper 00828.
Zeller, M., Sharma, M. (2000) Many borrow, more save, and all insure: implications for food and micro-finance policy. Food Policy, 25 (2000) 143–167
Zeller, M., Sharma, M., Henry, C., Lapenu, C. (2006) An operational method for assessing the poverty outreach performance of development policies and projects: Results of case studies in Africa, Asia, and Latin America. World Development, 34 (3), 446-464.

26
Recent Discussion Papers
No. 01/1999 Heidhues, F. and G. Schrieder, Rural Financial Market Development. No. 02/1999 Heidhues, F., C. Karege, B. Schaefer and G. Schrieder, The Social Dimension
of Policy Reforms. No. 03/1999 Heidhues, F., W. Erhardt, A. Gronski and G. Schrieder, The Social Dimension
of Policy Reforms and World Bank Case Studies. No. 04/1999 Erhardt, W., Credit for Poor and Low-Income Entrepreneurs in Urban and
Rural Northern Thailand. No. 05/1999 Senahoun, J., F. Heidhues and D. Deybe, Structural Adjustment Programs and
Soil Erosion: A Bio-Economic Modelling Approach for Northern Benin. No. 06/1999 Kyi, T. and M. von Oppen, An Economic Analysis of Technical Efficiency of
Rice Farmers at the Delta Region in Myanmar. No. 07/1999 Schrieder, G., J. Munz, and R. Jehle, Rural Regional Development in
Transition Economies: Country Case Romania. No. 08/1999 Hartwich, F. and T. Kyi, Measuring Efficiency in Agricultural Research:
Strength and Limitations of Data Envelopment Analysis (DEA). No. 09/1999 Hartwich, F., Weighting of Agricultural Research Results: Strength and
Limitations of the Analytic Hierarchy Process. No. 01/2000 Neubert, D., Poverty Alleviation as Intervention in Complex and Dynamic
Social Fields. No. 02/2000 Neef, A., C. Sangkapitux and K. Kirchmann, Does Land Tenure Security
Enhance Sustainable Land Management? - Evidence from Mountainous Regions of Thailand and Vietnam.
No. 03/2000 Breitschopf, B. and G. Schrieder, The Development of the Rural Nonfarm Sector in Transition Economies – Implication of Capital Intensity on Labor Productivity and Employment.
No. 04/2000 Erhardt, W., Urban Bias in Reverse: Have Urban Small Enterprises Been Neglected by Policy Makers and Bankers in Thailand?
No. 05/2000 Senahoun, J., F. Heidhues and D. Deybe, Impact of Agricultural Policy and Food Security: An Agricultural Sector Modelling Approach for Benin.
No. 06/2000 Heidhues, F., Globalisierung, Einkommensverteilung und ländliche Regionalentwicklung in Entwicklungsländern.
No. 07/2000 Heidhues, F., The Future of World, National and Household Food Security. No. 08/2000 Buchenrieder, G. (née Schrieder) and I. Theesfeld, Improving Bankability of
Small Farmers in Northern Vietnam. No. 09/2000 Dufhues, T.B., Economic Appraisal of Sugarcane Production in Peasant
Households in the Son La Province, Northern Vietnam. No. 10/2000 Heuft, A. and G. Buchenrieder (née Schrieder), Decentralisation in Peru’s
Agricultural Policy: A Critical Review from 1993 to 1998. No. 01/2001 Knüpfer, J., Landnutzungsentscheidungen ethnischer Minderheiten im Kontext
der institutionellen Rahmenbedingungen Nordthailands. No. 02/2001 Daude, S., WTO and Food Security: Strategies for Developing Countries. No. 03/2001 Knüpfer, J. and G. Buchenrieder, Rural Poverty Alleviation Through Non-farm
Income in Transition Economies. No. 04/2001 Dufhues, T., P.T.M. Dung, H.T. Hanh, and G. Buchenrieder, Fuzzy Information
Policy of the Vietnam Bank for the Poor in Lending to and Targeting of the Poor in Northern Vietnam.
27
No. 01/2002 Brüntrup, M. and F. Heidhues, Subsistence Agriculture in Development: Its Role in Processes of Structural Change.
No. 02/2002 Alker, D. and F. Heidhues, Farmers’ Rights and Intellectual Property Rights – Reconciling Conflicting Concepts.
No. 03/2002 Buchenrieder, G., J. Knüpfer and F. Heidhues, A Cross-Country Comparison of Non-farm Rural Employment in the Balkans.
No. 04/2002 Knüpfer, J., S. Xhema und G. Buchenrieder, Armutsreduzierung durch Einkommens-diversifizierung - Eine Studie im ländlichen Kosovo.
No. 01/2003 Dufhues, T., G. Buchenrieder, F. Heidhues and Pham Thi My Dung, Towards demand-driven financial services in Northern Vietnam: A participatory analysis of customer preferences.
No. 02/2003 Geppert, M. and T. Dufhues, Visualizing rural financial market research in Northern Vietnam through pictures.
No. 01/2004 Nguyen Manh Hai and F. Heidhues, Comparative advantage of Vietnam’s rice sector under different liberalisation scenarios – A Policy Analysis Matrix (PAM) study
No. 02/2004 Breisinger, C. and F. Heidhues, Regional Development Perspectives in Vietnam – Insights from a 2002 Provincial Social Accounting Matrix (SAM)
No. 03/2004 Basu, A.K. and M. Qaim, On the Distribution and Adoption of Genetically Modified Seeds in Developing Countries
No. 04/2004 Fischer, I., Media Supported Communication in Agricultural Extension and Participatory Rural Development in Northern Thailand
No. 05/2004 Dufhues, T., U. Lemke and I. Fischer, Constraints and Potential of Livestock Insurance Schemes – A Case Study from Vietnam
No. 06/2004 Neef, A. and D. Neubert, Assessing Participation in Agricultural Research Projects:An Analytical Framework
No. 01/2005 Dufhues, T. and Buchenrieder, G., Outreach of credit institutes and households’ access constraints to formal credit in Northern Vietnam
No. 02/2005 Houssou, N. and F. Heidhues, Debt position of developing countries and new initiatives for debt reduction – A panel data fixed effects estimation of the impacts of the HIPC Initiatives
No. 01/2006 Piotrowski, S. and X. Jia, Land property, tenure security and credit access: a historical perspective of change processes in China
No. 02/2006 Friederichsen, R., Agricultural Sciences in Upland Northern Vietnam: Situating Research in a Dynamic Environment.
No. 03/2006 Hönicke, M., O. Ecker, M. Qaim, and K. Weinberger, Vitamin A and iron consumption and the role of indigenous vegetables: A household level analysis in the Philippines.
No. 04/2006 Stein, A.J., M. Qaim, J.V. Meenakshi, P. Nestel, H.P.S. Sachdev and Z.A. Bhutta, Potential Impacts of Iron Biofortification in India
No. 05/2006
Stein, A.J., H.P.S. Sachdev and M. Qaim, Can genetic engineering for the poor pay off? An ex-ante evaluation of Golden Rice in India
28
No. 01/2008 Alcaraz V., G. and M. Zeller, Use of household food insecurity scales for assessing poverty in Bangladesh and Uganda
No. 02/2008 Seeberg-Elverfeldt, C., S. Schwarze and M. Zeller, Payment for Environmental Services – Incentives through Carbon Sequestration Compensation for Cocoa-based Agroforestry-Systems in Central Sulawesi, Indonesia
No. 03/2008 Saint-Macary, C., A. Keil, M. Zeller, F. Heidhues and Pham Thi My Dung, Land titling policy and soil conservation in the Uplands of Northern Vietnam
No. 04/2008 Keil, A., C. Saint-Macary and M. Zeller, Maize boom in the uplands of Northern Vietnam: What are the socio-economic and environmental implications?
No. 05/2008 Fischer, I. and G. Buchenrieder, Insurance preferences of smallholders: Results from an Adaptive Conjoint Analysis in Northern Vietnam
No. 06/2008 Zeller, M., T. Beuchelt, I. Fischer and F. Heidhues, Linkages between poverty and sustainable agricultural and rural development in the uplands of Southeast Asia.
No. 01/2009 Houssou, N., Zeller, M., Targeting the poor and smallholder farmers: Empirical evidence from Malawi.
No. 02/2009 Demeke, A. B., and Zeller, M., Using panel data to estimate the effect of rainfall shocks on smallholders food security and vulnerability in rural Ethiopia.