Embed Size (px)
Citation preview
ABSTRACT
Title of Document: INVESTIGATION OF REFRIGERANT DISTRIBUTION IN
A HOUSEHOLD REFRIGERATOR WITH A FOCUS ON
THE ROLE OF THE ACCUMULATOR
Cara Sanderson Martin, M.S. Mechanical Engineering, 2007
Directed By: Professor Reinhard Radermacher, Ph.D. Department of Mechanical Engineering
In order to maximize household refrigerator performance, it is important to
understand the basic relationship between each component as well as the relationship
between refrigerant and lubricant used in the system.
This study examines the particular role of the accumulator in a household
refrigeration system as well as the oil and refrigerant distribution within the compressor
and accumulator. Data and video images were collected to understand the fluid motion
throughout the system, particularly in the compressor shell, accumulator, accumulator
outlet, and suction and discharge lines. General trends and relationships between the oil
and refrigerant were established and the beneficial use of the accumulator for compressor
protection was verified.
Testing was also conducted without the accumulator. Removal of the accumulator
caused changes in oil and refrigerant flow patterns and presented a danger for the
compressor at low ambient temperatures during cycling and defrost periods.
INVESTIGATION OF REFRIGERANT DISTRIBUTION IN HOUSEHOLD
REFRIGERATORS WITH A FOCUS ON THE ROLE OF THE ACCUMULATOR
By
Cara Sanderson Martin
Thesis submitted to the Faculty of the Graduate School of the University of Maryland, College Park, in partial fulfillment
of the requirements for the degree of Masters of Science
2007
Advisory Committee: Professor Dr. Reinhard Radermacher, Chair Associate Professor Dr. Linda Schmidt Assistant Professor Dr. Bao Yang

© Copyright by
Cara Martin
2007
ii
Dedication
Dedicated to my father, Robert W. Sanderson
October 13, 1944 – January 21, 2000
I know you’d be proud.
iii
Acknowledgements
I would like to thank Dr. Reinhard Radermacher and the Center for
Environmental Energy Engineering (CEEE) for giving me the opportunity to research in
an academic setting and interact with a variety of peers, colleagues, and business
professionals. The experiences that I have gained from my work here are invaluable and
will forever impact the way that I think, act, and learn. Dr. Radermacher’s support,
critical thinking, and positive attitude have continuously provided a constructive
atmosphere for developing new ideas, solving problems, and exercising engineering
principles. For his leadership in research, I’d also like to thank Dr. Yunho Hwang. Dr.
Hwang awarded me my first opportunity within CEEE as an undergraduate research
assistant and I am deeply thankful for the chance to experience research at such an early
point in my college career. His persistence and breadth of knowledge have also taught me
to examine problems at multiple angles and to never be completely satisfied with results;
there will always be something else to learn and explore.
For their friendship, advice, conversation, laughs, support, and dedication, I’d like
to thank all the guys of CEEE. Magnus Eisele, Ethan Lust, and Jon Schonfeld, thank you
for your willingness to pursue the energy project of the summer of 2007 and for your
moral support through tough research moments. Nick Fernandez, Kyle Gluessenkamp
and all of the software folks, thanks for your camaraderie and all of our Friday lunches.
Mr. Jin (now Dr. Jin) and Xudong Wang (soon to be Dr. Xudong Wang), thank you for
showing me the ropes around the CEEE labs and for answering all of my questions at any
time. Ahmet Ors, thank you for getting me started with this project and providing so
much support in its early stages. And last, but certainly not least, many, many thanks to

iv
Jan Muehlbauer. Without your skills, talent, brute force, and determined thinking, much
of my project would have gone undone. You have made my experience here at CEEE all
the more worthwhile and I thank you for all of the many lessons you’ve taught me along
the way.
Finally, thank you to all of my friends and family, especially my mother and my
husband. Without your love, support, willingness to listen, and kind words I never would
have made it through. To “Helpful Corn” and the players of Maryland Ultimate, thank
you for your constant smiles and jokes about running refrigerators. Matt, thank you for
your patience and understanding at all times. Mom, thank you for your constant support
and continued encouragement to follow my dreams.
v
Table of Contents
Dedication ........................................................................................................................... ii
Acknowledgements............................................................................................................ iii
Table of Contents................................................................................................................ v
List of Tables ...................................................................................................................... x
List of Figures ................................................................................................................... xv
List of Figures ................................................................................................................... xv
Nomenclature................................................................................................................. xxiii
1 Introduction................................................................................................................. 1
2 Background ................................................................................................................. 3
2.1 The Working Principle of Vapor Compression Cycles ...................................... 3
2.2 Literature Review................................................................................................ 6
2.2.1 Effects and Characteristics of Oil and Refrigerant Migration and
Distribution ................................................................................................................. 6
2.2.2 Measurement of Oil and Refrigerant Mixture Concentrations ................... 9
2.2.3 Accumulator Studies................................................................................. 16
3 Motivation and Objectives........................................................................................ 20
3.1 Motivation......................................................................................................... 20
3.2 Objectives ......................................................................................................... 20
4 Experimentation with the Accumulator .................................................................... 21
4.1 Experimental Set-up.......................................................................................... 21
4.1.1 Refrigerator/Freezer .................................................................................. 21
4.1.2 Compressor ............................................................................................... 22
vi
4.1.3 Evaporator and Accumulator .................................................................... 25
4.1.4 System Sight Glasses ................................................................................ 27
4.1.5 Refrigerant and Oil Flow Visualization.................................................... 28
4.1.5.1 Compressor Visualization..................................................................... 28
4.1.5.2 Accumulator Visualization ................................................................... 29
4.1.5.3 Accumulator Outlet Visualization ........................................................ 31
4.1.5.4 Suction and Discharge Line Visualization............................................ 31
4.1.6 Experimental Measurements..................................................................... 32
4.1.6.1 Pressure Measurements......................................................................... 32
4.1.6.2 Temperature Measurements.................................................................. 35
4.1.6.3 Power Measurement.............................................................................. 38
4.1.6.4 Humidity Measurement ........................................................................ 39
4.1.7 Environmental Chamber ........................................................................... 40
4.1.8 Data Acquisition System........................................................................... 41
4.1.9 Power Supply............................................................................................ 41
4.1.10 Cabinet Door Sealing................................................................................ 42
4.1.11 Refrigerant ................................................................................................ 43
4.2 Experimental Method........................................................................................ 43
4.2.1 Experimental Procedures .......................................................................... 43
4.2.2 Experimental Analysis .............................................................................. 44
4.2.2.1 Calculation of the Cycle Properties ...................................................... 44
4.2.2.2 Uncertainty Analysis............................................................................. 54
4.2.2.3 Sample Collection................................................................................. 57
vii
4.3 Experimental Results ........................................................................................ 66
4.3.1 Data Results and Trends ........................................................................... 67
4.3.1.1 Pressure Results .................................................................................... 67
4.3.1.2 Temperature Results ............................................................................. 70
4.3.1.3 Power Results........................................................................................ 74
4.3.1.4 Specific Capacity Results ..................................................................... 76
4.3.1.5 Total Superheat Results ........................................................................ 79
4.3.1.6 Solubility Results .................................................................................. 80
4.3.1.7 Mixture Density and Correction Factor Results ................................... 82
4.3.2 Visualization Results and Trends with the Accumulator.......................... 86
4.3.2.1 Compressor Visualization Results ........................................................ 86
4.3.2.2 Accumulator Visualization Results....................................................... 89
4.3.2.3 Accumulator Outlet Visualization Results............................................ 93
4.3.2.4 Suction and Discharge Line Visualization Results............................... 95
4.3.3 Refrigerant and Oil Mass Analysis Results .............................................. 96
4.3.3.1 Mass Balance Trends during Pull-down ............................................... 96
4.3.3.2 Mass Balance Trends during Cycling ................................................. 101
4.3.3.3 Mass Balance Trends during Defrost.................................................. 104
4.3.3.4 Issues with mass balance calculations ................................................ 107
4.4 Summary of Oil and Refrigerant Flow with the Accumulator ....................... 108
4.5 Conclusions..................................................................................................... 110
5 Experimentation without the Accumulator ............................................................. 112
5.1 Experimental Set-up........................................................................................ 112
viii
5.1.1 Compressor ............................................................................................. 112
5.1.2 Evaporator............................................................................................... 113
5.1.3 System Sight Glasses .............................................................................. 114
5.1.4 Refrigerant and Oil Flow Visualization.................................................. 115
5.1.5 Experimental Measurements................................................................... 115
5.2 Experimental Methods .................................................................................... 115
5.2.1 Experimental Procedures ........................................................................ 115
5.2.2 Experimental Analysis ............................................................................ 116
5.3 Experimental Results ...................................................................................... 116
5.3.1 Data Results and Trends ......................................................................... 119
5.3.1.1 Pressure Results .................................................................................. 119
5.3.1.2 Temperature Results ........................................................................... 124
5.3.1.3 Power Results...................................................................................... 128
5.3.1.4 Specific Capacity Results ................................................................... 130
5.3.1.5 Total Superheat Results ...................................................................... 133
5.3.1.6 Solubility Results ................................................................................ 135
5.3.2 Visualization Results and Trends without the Accumulator................... 136
5.3.2.1 Compressor Visualization Results ...................................................... 136
5.3.2.2 Evaporator Outlet Visualization Results............................................. 139
5.3.2.3 Suction and Discharge Line Visualization Results............................. 141
5.3.3 Refrigerant and Oil Mass Analysis Results ............................................ 143
5.3.3.1 Mass Balance Trends during Pull-down ............................................. 143
5.3.3.2 Mass Balance Trends during Cycling ................................................. 146
ix
5.3.3.3 Mass Balance Trends during Defrost.................................................. 148
5.4 Summary of Oil and Refrigerant Flow without the Accumulator .................. 149
5.5 Advantages and Disadvantages of Removing the Accumulator..................... 151
5.6 Conclusions..................................................................................................... 152
6 Recommendations and Future Work ...................................................................... 154
7 Appendices.............................................................................................................. 157
7.1 Mass Balance Data for Results with the Accumulator ................................... 157
7.1.1 Pull-down Data ....................................................................................... 157
7.1.2 Cycling Data ........................................................................................... 160
7.1.3 Defrost Data ............................................................................................ 164
7.2 Mass Balance Data for Results without the Accumulator .............................. 169
7.2.1 Pull-down Data ....................................................................................... 169
7.2.2 Cycling Data ........................................................................................... 171
7.2.3 Defrost Data ............................................................................................ 177
8 References............................................................................................................... 180
x
List of Tables
Table 1: Refrigerator-Freezer Specifications [16] ............................................................ 22
Table 2: Compressor Specifications [16].......................................................................... 22
Table 3: Visualization Pipe Liquid Line Levels ............................................................... 24
Table 4: Compressor Oil Specifications [17].................................................................... 24
Table 5: Properties of the UView Dye [18] ...................................................................... 25
Table 6: Liquid Level Lines with Corresponding Total Volume for the Accumulator .... 26
Table 7: Pressure Transducer Specifications [19] ............................................................ 33
Table 8: Thermocouple Specifications [20]...................................................................... 35
Table 9: Watt Meter Specifications [21]........................................................................... 39
Table 10: Specifications for the Relative Humidity Sensor [22] ...................................... 40
Table 11: R600a Refrigerant Properties [23].................................................................... 43
Table 12: Experimental Matrix......................................................................................... 44
Table 13: Average Cycle Properties for 5°C Ambient Condition .................................... 55
Table 14: Average Cycle Properties for 32°C Ambient Condition .................................. 56
Table 15: Error Analysis for 5°C Ambient Condition ...................................................... 56
Table 16: Error Analysis for 32°C Ambient Condition.................................................... 56
Table 17: Specifications for the Ohaus Explorer High Accuracy Scale [27] ................... 62
Table 18: Test Results Summary ...................................................................................... 67
Table 19: Pressure Ratios for Each Ambient Condition with the Accumulator ............... 70
Table 20: Compressor Liquid Level Results for Each Ambient Condition for Testing with
the Accumulator................................................................................................................ 89
xi
Table 21: Accumulator Liquid Level Results for Each Ambient Condition for Testing
with the Accumulator........................................................................................................ 92
Table 22: Compressor Data Points for Mass Balance for Pull-down at the 5°C Ambient
Condition for Testing with the Accumulator .................................................................... 97
Table 23: Accumulator Data Points for Mass Balance for Pull-down at the 5°C Ambient
Condition for Testing with the Accumulator .................................................................... 97
Table 24: Liquid Level Scale for New Compressor ....................................................... 113
Table 25: Extended Experimental Matrix....................................................................... 116
Table 26: Comparison of Test Results for Tests completed with and without the
Accumulator at the 5°C Ambient Condition................................................................... 117
Table 27: Comparison of Test Results for Tests completed with and without the
Accumulator at the 32°C Ambient Condition................................................................. 118
Table 28: Average Comparison of Test Results for Tests completed with and without the
Accumulator at 5°C ........................................................................................................ 118
Table 29: Average Comparison of Test Results for Tests completed with and without the
Accumulator at 32°C ...................................................................................................... 119
Table 30: Pressure Ratios for Conditions without the Accumulator .............................. 121
Table 31: Data Comparison with and without Accumulator for Compressor On-Time
during Cycling at the 5°C Ambient Condition ............................................................... 123
Table 32: Data Comparison with and without Accumulator for Compressor On-Time
during Cycling at the 32°C Ambient Condition ............................................................. 124
Table 33: Compressor Liquid Level Results for Each Ambient Condition for Testing
without the Accumulator................................................................................................. 139
xii
Table 34: Compressor Data Points for Mass Balance for Pull-down at 5°C, 44g Charge,
for Testing without the Accumulator.............................................................................. 144
Table 35: Compressor Mass Balance Data for Pull-down for 32°C, I ........................... 157
Table 36: Compressor Mass Balance Data for Pull-down for 32°C, II .......................... 157
Table 37: Accumulator Mass Balance Data for Pull-down for 32°C, I .......................... 158
Table 38: Accumulator Mass Balance Data for Pull-down for 32°C, II......................... 158
Table 39: Compressor Mass Balance Data for Pull-down for 43°C, I ........................... 159
Table 40: Compressor Mass Balance Data for Pull-down for 43°C, II .......................... 159
Table 41: Accumulator Mass Balance Data for Pull-down for 43°C, I .......................... 159
Table 42: Accumulator Mass Balance Data for Pull-down for 43°C, II......................... 160
Table 43: Compressor Mass Balance Data for Cycling for 5°C, I ................................. 160
Table 44: Compressor Mass Balance Data for Cycling for 5°C, II ................................ 161
Table 45: Accumulator Mass Balance Data for Cycling for 5°C, I ................................ 161
Table 46: Accumulator Mass Balance Data for Cycling for 5°C, II............................... 162
Table 47: Compressor Mass Balance Data for Cycling for 32°C, I ............................... 162
Table 48: Compressor Mass Balance Data for Cycling for 32°C, II .............................. 162
Table 49: Accumulator Mass Balance Data for Cycling for 32°C, I .............................. 163
Table 50: Accumulator Mass Balance Data for Cycling for 32°C, II............................. 163
Table 51: Compressor Mass Balance Data for Defrost for 5°C, I .................................. 164
Table 52: Compressor Mass Balance Data for Defrost for 5°C, II................................. 164
Table 53: Accumulator Mass Balance Data for Defrost for 5°C, I................................. 165
Table 54: Accumulator Mass Balance Data for Defrost for 5°C, II ............................... 165
Table 55: Compressor Mass Balance Data for Defrost for 32°C, I ................................ 166
xiii
Table 56: Compressor Mass Balance Data for Defrost for 32°C, II............................... 166
Table 57: Accumulator Mass Balance Data for Defrost for 32°C, I............................... 166
Table 58: Accumulator Mass Balance Data for Defrost for 32°C, II ............................. 167
Table 59: Compressor Mass Balance Data for Defrost for 43°C, I ................................ 167
Table 60: Compressor Mass Balance Data for Defrost for 43°C, II............................... 167
Table 61: Accumulator Mass Balance Data for Defrost for 43°C, I............................... 168
Table 62: Accumulator Mass Balance Data for Defrost for 43°C, II ............................. 168
Table 63: Compressor Mass Balance Data for Pull-down for 32°C, 44g Charge, I ....... 169
Table 64: Compressor Mass Balance Data for Pull-down for 32°C, 44g Charge, II...... 169
Table 65: Compressor Mass Balance Data for Pull-down for 32°C, 48g Charge, I ....... 170
Table 66: Compressor Mass Balance Data for Pull-down for 32°C, 48g Charge, II...... 170
Table 67: Compressor Mass Balance Data for Cycling for 5°C, 44g Charge, I ............. 171
Table 68: Compressor Mass Balance Data for Cycling for 5°C, 44g Charge, II............ 172
Table 69: Compressor Mass Balance Data for Cycling for 5°C, 48g Charge, I ............. 172
Table 70: Compressor Mass Balance Data for Cycling for 5°C, 48g Charge, II............ 172
Table 71: Compressor Mass Balance Data for Cycling for 5°C, 52g Charge, I ............. 173
Table 72: Compressor Mass Balance Data for Cycling for 5°C, 52g Charge, II............ 174
Table 73: Compressor Mass Balance Data for Cycling for 32°C, 44g Charge, I ........... 175
Table 74: Compressor Mass Balance Data for Cycling for 32°C, 44g Charge, II.......... 175
Table 75: Compressor Mass Balance Data for Cycling for 32°C, 50g Charge, I ........... 175
Table 76: Compressor Mass Balance Data for Cycling for 32°C, 50g Charge, II.......... 176
Table 77: Compressor Mass Balance Data for Defrost for 5°C, 44g Charge, I.............. 177
Table 78: Compressor Mass Balance Data for Defrost for 5°C, 44g Charge, II ............ 177

xiv
Table 79: Compressor Mass Balance Data for Defrost for 32°C, 44g Charge, I............ 178
Table 80: Compressor Mass Balance Data for Defrost for 32°C, 44g Charge, II .......... 178
Table 81: Compressor Mass Balance Data for Defrost for 32°C, 48g Charge, I............ 178
Table 82: Compressor Mass Balance Data for Defrost for 32°C, 48g Charge, II .......... 179
xv
List of Figures
Figure 1: Schematic of a Vapor Compressor System ......................................................... 3
Figure 2: Sample P-h Diagram for an Ideal Refrigeration Cycle [1].................................. 4
Figure 3: Sample Schematic with SLHX, Accumulator, and Filter Dryer ......................... 5
Figure 4: Measurement Principle for Fukuta et al. Experimentation [9].......................... 11
Figure 5: Changing Vapor Pressure with Time for Different Temperature Conditions [12]
........................................................................................................................................... 14
Figure 6: Concentration Dependence on Vapor Pressure for R600a/Mineral Oil Solution
[12].................................................................................................................................... 15
Figure 7: Concentration Dependence on Density for R600a/Oil Solution [12]................ 15
Figure 8: Accumulator and Saturated Temperatures Showing Refrigerant Trapped in the
Accumulator after Start-up [3].......................................................................................... 17
Figure 9: Accumulator View during Compressor Start-up [6] ......................................... 19
Figure 10: Commercial Frost Free Bottom Freezer Refrigerator-Freezer [16] ................ 21
Figure 11: Unmodified Commercial Compressor............................................................. 22
Figure 12: Compressor with Visualization Tube and UV Dye......................................... 23
Figure 13: System Evaporator with Installed Clear Accumulator .................................... 25
Figure 14: Clear Accumulator Installed with Calibration Lines....................................... 26
Figure 15: Suction (solid circle) and Discharge (dotted circle) Sight Glasses ................. 27
Figure 16: Accumulator Outlet Sight Glass...................................................................... 28
Figure 17: Camera View of Compressor .......................................................................... 29
Figure 18: Unmodified Evaporator Panels in front of the Accumulator within the Freezer
Compartment..................................................................................................................... 29
xvi
Figure 19: Heater Removed from the Rear of the Fan Panel............................................ 30
Figure 20: Modified Evaporator Panels for Accumulator Visualization.......................... 30
Figure 21: Camera View of Accumulator with LED Lights............................................. 30
Figure 22: Camera View of the Accumulator Outlet with LED Lights............................ 31
Figure 23: Camera View of the Suction and Discharge Lines.......................................... 31
Figure 24: Pressure Transducer and Thermocouple Placement........................................ 32
Figure 26: Setra Pressure Transducer [19]........................................................................ 33
Figure 26: Pressure Transducers Outside of the Unit ....................................................... 33
Figure 27: Evaporator Inlet Pressure Transducer Connection.......................................... 34
Figure 28: T-type Thermocouple [20] .............................................................................. 35
Figure 29: Air Side Evaporator Thermocouples ............................................................... 36
Figure 30: Food Compartment Thermocouples................................................................ 37
Figure 31: Freezer Compartment Thermocouples ............................................................ 37
Figure 32: Environmental Chamber Temperature Measurements.................................... 38
Figure 34: Watt Meter....................................................................................................... 39
Figure 34: Vaisala Humidity Sensor................................................................................. 40
Figure 35: Environmental Chamber and Computer Controls ........................................... 40
Figure 36: Hewlett Packard Data Acquisition Unit (HP 3497A) ..................................... 41
Figure 37: Voltage and Frequency Inverters (Manufactured by LeMarche) .................... 42
Figure 38: Silicon Sealant for Refrigerator and Freezer Doors ........................................ 42
Figure 39: System Schematic with State Points ............................................................... 46
Figure 40: State Points of the Refrigeration Cycle on a P-h Diagram.............................. 46
xvii
Figure 41: Original Solubility Data for Freol S-10 Mineral Oil and R600a (Provided by
the Manufacturer).............................................................................................................. 48
Figure 42: Solubility Curve Developed in TableCurve® 3D ........................................... 50
Figure 43: Original Mixture Density Data Provided by the Manufacturer for Freol S-10
Oil and R600a ................................................................................................................... 51
Figure 45: Mixture Density Correlation Developed by TableCurve® 3D ....................... 52
Figure 45: Cycles Used for Random Error Calculations from a 5°C Ambient Test ........ 55
Figure 46: Cycles Used for Random Error Calculations from a 32°C Ambient Test ...... 55
Figure 47: Sample Collection Pipe through the Sight Tube at the bottom of the
Compressor ....................................................................................................................... 58
Figure 48: Sample Pipe in the Accumulator (front view)................................................. 58
Figure 49: Sample Pipe in Accumulator (rear view) ........................................................ 59
Figure 50: Oil/Refrigerant Collection Vessel ................................................................... 60
Figure 51: Valve System for Sample Collection .............................................................. 60
Figure 52: Oil Charging "U" Tube.................................................................................... 61
Figure 53: Oil Port U-tube Assembly in the Suction Line................................................ 61
Figure 54: Valve System for the Oil Port U-tube Assembly ............................................ 61
Figure 56: Ohaus Explorer High Accuracy Scale............................................................. 62
Figure 56: Suction Pressure for Each Ambient Condition for Testing with the
Accumulator...................................................................................................................... 68
Figure 57: Discharge Pressure for Each Ambient Condition for Testing with the
Accumulator...................................................................................................................... 69
xviii
Figure 58: P-h Diagram for Each Ambient Condition at Averaged Values for
Compressor-On Time Periods for Testing with the Accumulator .................................... 70
Figure 59: Inside Oil Temperature at the Base of the Compressor for Each Ambient
Condition for Testing with the Accumulator .................................................................... 71
Figure 60: Average Accumulator Temperature for the 5°C and 32°C Conditions for
Testing with the Accumulator........................................................................................... 72
Figure 61: Accumulator Inlet and Outlet Temperatures for the 5°C Ambient Condition
for Testing with the Accumulator ..................................................................................... 73
Figure 62: Evaporator Inlet and Outlet Temperatures for the 5°C Ambient Condition for
Testing with the Accumulator........................................................................................... 74
Figure 63: System Power for Each Ambient Condition for Testing with the Accumulator
........................................................................................................................................... 75
Figure 64: Pull-down, Cycling, and Defrost Periods for the 32°C Condition for Testing
with the Accumulator........................................................................................................ 76
Figure 65: Evaporator Specific Capacity vs. Time for 5°C and 32°C Conditions for
Testing with the Accumulator........................................................................................... 78
Figure 66: Condenser Specific Capacity vs. Time for 5°C and 32°C Conditions for
Testing with the Accumulator........................................................................................... 78
Figure 67: Degrees of Superheat for Each Ambient Condition for Testing with the
Accumulator...................................................................................................................... 79
Figure 68: Compressor Solubility for Each Ambient Condition for Testing with the
Accumulator...................................................................................................................... 81
xix
Figure 69: Accumulator Solubility for Each Ambient Condition for Testing with the
Accumulator...................................................................................................................... 82
Figure 70: Compressor Mixture Density for Each Ambient Condition............................ 83
Figure 71: Accumulator Mixture Density for Each Ambient Condition .......................... 84
Figure 72: Ideal and Actual Mixture Density for the 5°C Condition for Testing with the
Accumulator...................................................................................................................... 85
Figure 73: Correction Factors for R600a and Freol S-10 Mineral Oil Based on Calculated
Ideal and Mixture Densities .............................................................................................. 85
Figure 74: Start-up Trends in the Compressor for a) 5°C, b) 32°C and c) 43°C Ambient
Conditions for Testing with the Accumulator .................................................................. 87
Figure 75: Cycling Trends for the Compressor at the 32°C Condition while a)
Compressor is on and b) Compressor is off for Testing with the Accumulator ............... 88
Figure 76: Accumulator Start-up Trends at the 32°C Condition at a) initial start-up and b)
just prior to defrost............................................................................................................ 90
Figure 77: Mass Balance for the Pull-down Period for the 5°C Ambient Condition for
Testing with the Accumulator........................................................................................... 98
Figure 78: Mass Balance for the Pull-down Period for the 32°C Ambient Condition for
Testing with the Accumulator......................................................................................... 100
Figure 79: Mass Balance for the Pull-down Period for the 43°C Ambient Condition for
Testing with the Accumulator......................................................................................... 101
Figure 80: Mass Balance for the Cycling Period at the 5°C Ambient Condition for
Testing with the Accumulator......................................................................................... 103
xx
Figure 81: Mass Balance for the Cycling Period at the 32°C Ambient Condition for
Testing with the Accumulator......................................................................................... 103
Figure 82: Mass Balance for the Defrost Period at the 5°C Ambient Condition for Testing
with the Accumulator...................................................................................................... 105
Figure 83: Mass Balance for the Defrost Period at the 32°C Ambient Condition for
Testing with the Accumulator......................................................................................... 106
Figure 84: Mass Balance for the Defrost Period for the 43°C Ambient Condition for
Testing with the Accumulator......................................................................................... 106
Figure 85: New Compressor with Modified Sight Glass Liquid Level Scale ................ 113
Figure 86: Accumulator Removal and Pipe Replacement.............................................. 114
Figure 87: System Schematic for Testing without the Accumulator .............................. 114
Figure 88: Suction and Discharge Pressures for Tests with and without the Accumulator
at Various Charges at the 5°C Ambient Condition......................................................... 120
Figure 89: Suction and Discharge Pressures for Tests with and without the Accumulator
at Various Charges at the 32°C Ambient Condition....................................................... 121
Figure 90: P-h Diagram for Tests with and without the Accumulator at Various Charges
at the 5°C Ambient Condition ........................................................................................ 122
Figure 91: P-h Diagram for Tests with and without the Accumulator at Various Charges
at the 32°C Ambient Condition ...................................................................................... 123
Figure 92: Suction and Inside Compressor Temperatures for Tests with and without the
Accumulator at Various Charges at the 5°C Ambient Condition................................... 125
Figure 93: Suction and Inside Compressor Temperatures for Tests with and without the
Accumulator at Various Charges at the 32°C Ambient Condition................................. 126
xxi
Figure 94: Evaporator Temperatures for Tests with and without the Accumulator at
Various Charges at the 5°C Ambient condition.............................................................. 127
Figure 96: Evaporator Temperatures for Tests with and without the Accumulator at
Various Charges at the 32°C Ambient condition............................................................ 128
Figure 96: Power Results for Tests with and without the Accumulator at Various Charges
at the 5°C Ambient Condition ........................................................................................ 129
Figure 97: Power Results for Tests with and without the Accumulator at Various Charges
at the 32°C Ambient Condition ...................................................................................... 129
Figure 98: Evaporator Capacity for Tests with and without the Accumulator at Various
Charges at the 5°C Ambient Condition .......................................................................... 131
Figure 99: Evaporator Capacity for Tests with and without the Accumulator at Various
Charges at the 32°C Ambient Condition ........................................................................ 131
Figure 100: Condenser Capacity for Tests with and without Accumulator at Various
Charges at the 5°C Ambient Condition .......................................................................... 132
Figure 101: Condenser Capacity for Tests with and without Accumulator at Various
Charges at the 32°C Ambient Condition ........................................................................ 132
Figure 102: Superheat Results for Tests with and without the Accumulator for Various
Charges at the 5°C Ambient Condition .......................................................................... 134
Figure 103: Superheat Results for Tests with and without the Accumulator for Various
Charges at the 32°C Ambient Condition ........................................................................ 134
Figure 104: Compressor Solubility for Tests with and without the Accumulator for
Various Charges at the 5°C Ambient Condition............................................................. 135
xxii
Figure 105: Compressor Solubility for Tests with and without the Accumulator for
Various Charges at the 32°C Ambient Condition........................................................... 136
Figure 106: Mass Balance for Pull-down Period for 5°C Ambient Condition, 44g Charge,
for Testing without the Accumulator.............................................................................. 144
Figure 107: Mass Balance for Pull-down Period for 32°C Ambient Condition, 44g
Charge, for Testing without the Accumulator ................................................................ 145
Figure 108: Mass Balance for Cycling Period at 5°C Ambient Condition, 44g Charge, for
Testing without the Accumulator.................................................................................... 147
Figure 109: Mass Balance for Cycling Period at 32°C Ambient Condition, 44g Charge,
for Testing without the Accumulator.............................................................................. 147
Figure 110: Mass Balance for Defrost Period at 32°C Ambient Condition, 44g Charge,
for Testing without the Accumulator.............................................................................. 149
Figure 112: Mass Balance for Pull-down Period at 32°C Ambient Condition, 48g Charge,
for Testing without the Accumulator.............................................................................. 171
Figure 113: Mass Balance for Cycling Period at 5°C Ambient Condition, 48g Charge, for
Testing without the Accumulator.................................................................................... 173
Figure 114: Mass Balance for Cycling Period at 5°C Ambient Condition, 52g Charge, for
Testing without the Accumulator.................................................................................... 174
Figure 115: Mass Balance for Cycling Period at 32°C Ambient Condition, 50g Charge,
for Testing without the Accumulator.............................................................................. 176
Figure 116: Mass Balance for Defrost Period at 32°C Ambient Condition, 48g Charge,
for Testing without the Accumulator.............................................................................. 179
xxiii
Nomenclature
A Correction Factor
ACC Accumulator
ASHRAE American Society of Heating, Refrigeration, and Air-Conditioning
Engineers
DAS Data Acquisition System
h Enthalpy
HFC Hydrofluorocarbon
HVAC Heating, ventilation, and air-conditioning
L Length
LED Light-Emitting Diode
m Mass
P Pressure
POE Polyolester (oil)
PT Pressure Transducer
PVE Polyvinylether (oil)
q Capacity
RH Relative Humidity
SLHX Suction Line Heat Exchanger
T Temperature
TC Thermocouple
UV Ultraviolet
V Volume

xxiv
w Mass Fraction of Refrigerant in Solution
z Solubility
Greek Symbols
ρ Density
Subscripts
cond Condenser
dis Discharge
dis,i Discharge, instream
evap Evaporator
evap,s Evaporator, surface
id Ideal
m Mixture
o Oil
r Refrigerant
sat,Pi Saturated at pressure i
subcooling Subcooling
suc Suction
superheat Superheat
t Total
1
1 Introduction
In industry and business, it is always necessary to continue to search for
improvements in a product in order to maximize profit and customer satisfaction. In
refrigeration, most testing revolves around improving efficiency and reducing harmful
effects on the environment with the use of improved refrigerants. In addition to this work,
however, it is also very important to understand the basic relationship between each
component and how their interaction affects the overall performance of the entire system.
Because refrigerators include compressors, it is important to examine the type and
amount of lubricant and refrigerant used. Lubricant, typically a mineral or POE oil, is
necessary to keep the compressor operating properly so that components do not create
excessive friction that could cause damage to the mechanical components or motor.
Refrigerant in the system provides the means for cooling and flows freely throughout the
system changing from gas to liquid and liquid to gas, depending on the stage of the cycle.
When in the compressor, however, the refrigerant and lubricant must co-exist and
consequently have important effects on one another. It is often possible for the refrigerant
to dissolve in the oil, reducing the volume of pure refrigerant available to the system. It is
also possible for the oil to migrate throughout the system. This phenomenon is not well
understood as the likelihood for migration depends greatly on the lubricant, refrigerant,
and the system itself. It is unknown if oil is ever trapped in certain components and if so,
what effects it may have on overall performance.
In addition to the compressor, the accumulator is an important component for a
refrigeration system. While this component is not an active feature in the refrigeration
2
process, it provides a service to the compressor and aims to improve the safety of the
system. An accumulator is a small tank typically installed after the evaporator that
provides a small volume that can be filled with liquid refrigerant. As the compressor
operates, or more importantly, when the compressor is in an off-mode, it is possible that
some liquid refrigerant can escape from the evaporator. Liquid can cause significant
damage to the compressor and it is thus vital that only vapor enter the compressor. The
accumulator is therefore installed upstream of the compressor in order to act as a
collector for any liquid refrigerant that could potentially leave the evaporator and enter
the compressor. The effectiveness of the accumulator, however, is generally not well
understood as the available volume is fixed and refrigerant flow through the system is
variable as the compressor turns on and off. It is also unknown as to whether or not
compressor oil enters or remains in the accumulator during operation and whether or not
this action affects the available volume able to contain liquid refrigerant.
Understanding the oil and refrigerant distribution within the refrigeration system
is important in evaluating the effectiveness and overall performance of the system. In
particular, it is of interest to study the accumulator and how well it traps liquid refrigerant
from entering the compressor.
3
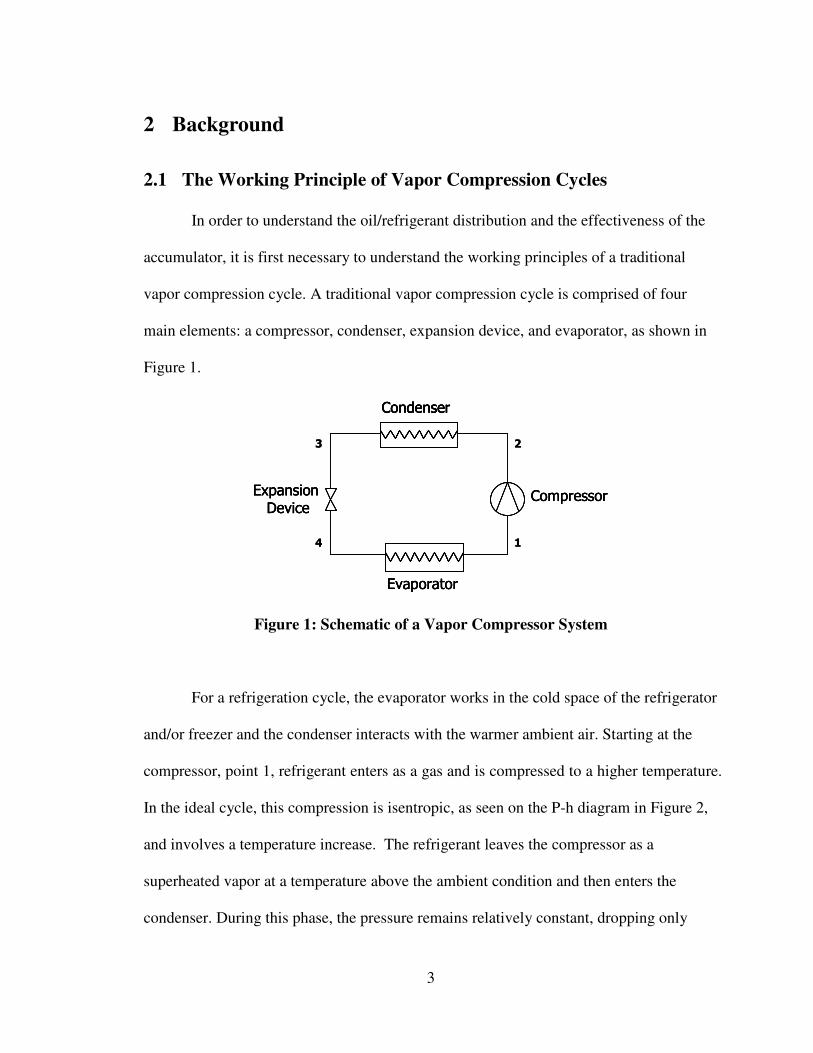
2 Background
2.1 The Working Principle of Vapor Compression Cycles
In order to understand the oil/refrigerant distribution and the effectiveness of the
accumulator, it is first necessary to understand the working principles of a traditional
vapor compression cycle. A traditional vapor compression cycle is comprised of four
main elements: a compressor, condenser, expansion device, and evaporator, as shown in
Figure 1.
4 1
Evaporator
Condenser
CompressorExpansion
Device
3 2
4 1
Evaporator
Condenser
CompressorExpansion
Device
Evaporator
CondenserCondenser
CompressorExpansion
Device
3 2
Figure 1: Schematic of a Vapor Compressor System
For a refrigeration cycle, the evaporator works in the cold space of the refrigerator
and/or freezer and the condenser interacts with the warmer ambient air. Starting at the
compressor, point 1, refrigerant enters as a gas and is compressed to a higher temperature.
In the ideal cycle, this compression is isentropic, as seen on the P-h diagram in Figure 2,
and involves a temperature increase. The refrigerant leaves the compressor as a
superheated vapor at a temperature above the ambient condition and then enters the
condenser. During this phase, the pressure remains relatively constant, dropping only
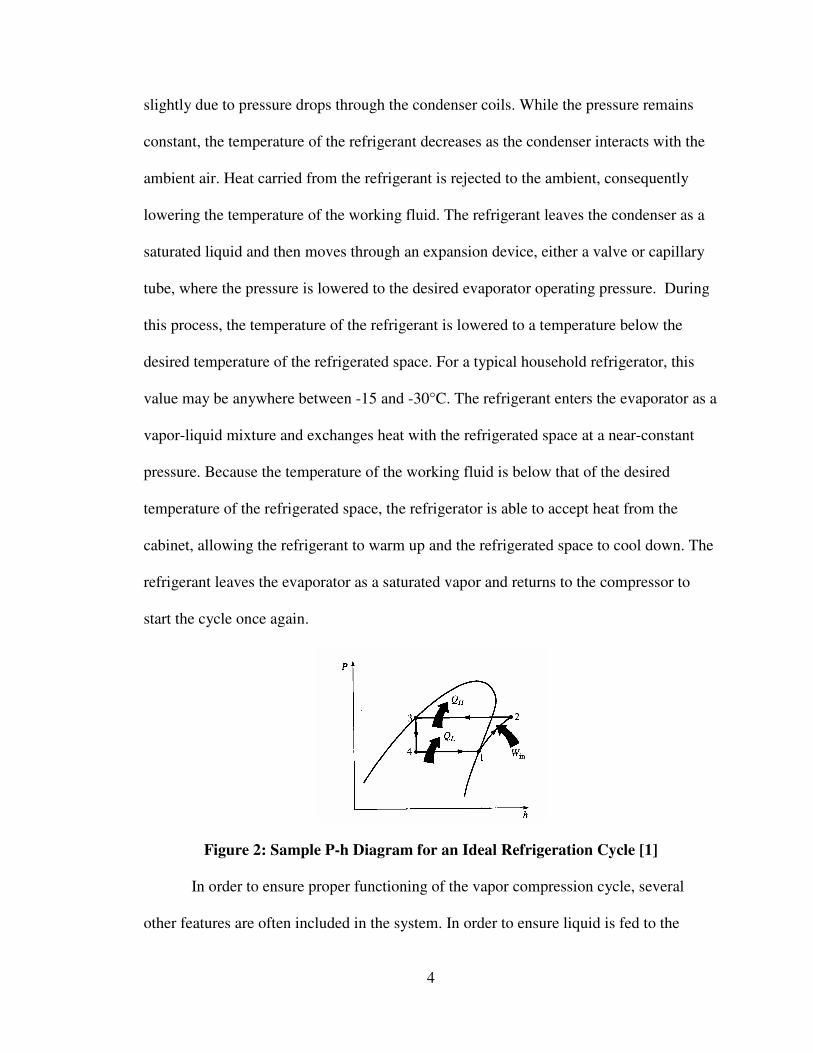
4
slightly due to pressure drops through the condenser coils. While the pressure remains
constant, the temperature of the refrigerant decreases as the condenser interacts with the
ambient air. Heat carried from the refrigerant is rejected to the ambient, consequently
lowering the temperature of the working fluid. The refrigerant leaves the condenser as a
saturated liquid and then moves through an expansion device, either a valve or capillary
tube, where the pressure is lowered to the desired evaporator operating pressure. During
this process, the temperature of the refrigerant is lowered to a temperature below the
desired temperature of the refrigerated space. For a typical household refrigerator, this
value may be anywhere between -15 and -30°C. The refrigerant enters the evaporator as a
vapor-liquid mixture and exchanges heat with the refrigerated space at a near-constant
pressure. Because the temperature of the working fluid is below that of the desired
temperature of the refrigerated space, the refrigerator is able to accept heat from the
cabinet, allowing the refrigerant to warm up and the refrigerated space to cool down. The
refrigerant leaves the evaporator as a saturated vapor and returns to the compressor to
start the cycle once again.
Figure 2: Sample P-h Diagram for an Ideal Refrigeration Cycle [1]
In order to ensure proper functioning of the vapor compression cycle, several
other features are often included in the system. In order to ensure liquid is fed to the
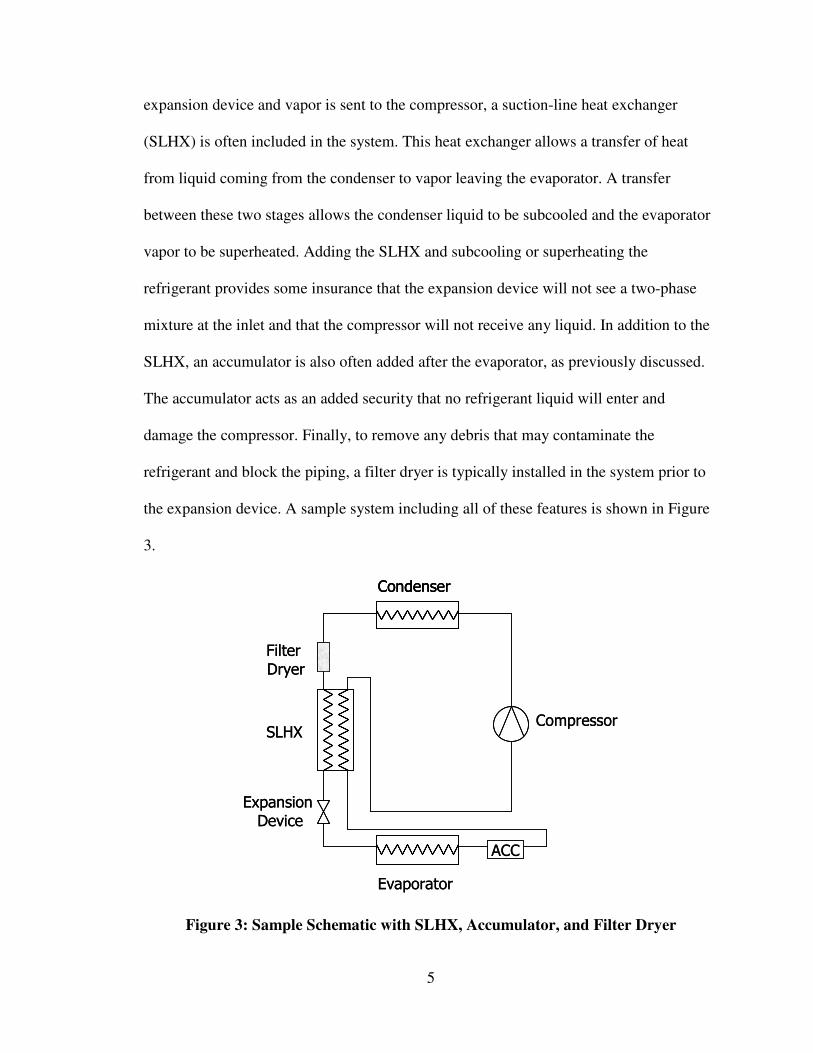
5
expansion device and vapor is sent to the compressor, a suction-line heat exchanger
(SLHX) is often included in the system. This heat exchanger allows a transfer of heat
from liquid coming from the condenser to vapor leaving the evaporator. A transfer
between these two stages allows the condenser liquid to be subcooled and the evaporator
vapor to be superheated. Adding the SLHX and subcooling or superheating the
refrigerant provides some insurance that the expansion device will not see a two-phase
mixture at the inlet and that the compressor will not receive any liquid. In addition to the
SLHX, an accumulator is also often added after the evaporator, as previously discussed.
The accumulator acts as an added security that no refrigerant liquid will enter and
damage the compressor. Finally, to remove any debris that may contaminate the
refrigerant and block the piping, a filter dryer is typically installed in the system prior to
the expansion device. A sample system including all of these features is shown in Figure
3.
SLHX
Evaporator
Condenser
Compressor
Filter
Dryer
ACC
Expansion
Device
SLHX
Evaporator
CondenserCondenser
Compressor
Filter
Dryer
ACC
Expansion
Device
Figure 3: Sample Schematic with SLHX, Accumulator, and Filter Dryer
6
2.2 Literature Review
Before beginning a new research project, it is important to understand prior work
related to the area of interest. The following section explores prior research relating to
refrigerant flow and migration, the relationship between oil and refrigerant and how to
measure their concentration, and the effectiveness of the accumulator and its role in the
refrigeration cycle.
2.2.1 Effects and Characteristics of Oil and Refrigerant Migration and
Distribution
While the household refrigerator has been in use for the last 80 to 90 years [2], it
has not always been well understood how the refrigerant and compressor oil move
throughout the system. A general understanding of the main components and their role in
the refrigeration cycle has been known for some time; however, the exact movement of
the refrigerant fluid through the system and how its movement changes during different
periods of the refrigeration cycle is a topic of study for many researchers. A particular
area of study within this field is refrigerant migration. When a refrigerator is first turned
on, it undergoes a pull-down period in which the compressor is constantly running,
working to bring the refrigerator and freezer cabinet temperatures to the desired levels.
Once these temperatures have been reached, the compressor then experiences a cycling
phase in which the compressor remains on for a given period of time and then turns off.
This is due to the fact that the compressor no longer needs to remain on in order to
maintain the desired cabinet temperatures. The compressor is able to turn off for a period
of time in order to save power. Once the temperatures reach a higher level deemed
7
unacceptable by the control system of the refrigerator, the compressor will then turn back
on and work with the rest of the system to restore the cabinet temperatures.
Refrigerant migration is a problem that occurs during the off-cycle of the
compressor. During this time, the refrigerant stops flowing as it normally would through
the system because it is no longer driven by the compressor. As has been found by
several researchers, the off-cycle causes refrigerant to migrate from the condenser to the
evaporator as the system equalizes it’s high and low pressures. Warmer refrigerant at a
high pressure stored in the condenser prefers to move to the cooler and lower pressure
evaporator, and thus migrates to this space. In doing so, both the temperature and
pressure of the evaporator rise, consequently reducing the performance of the refrigerator
when the compressor turns back on for the on-cycle.
As reported by Coulter and Bullard [3], researchers Rubas, Bullard, and Krause
first explored this topic by examining a variety of factors that reduce refrigerator
performance. Coulter and Bullard later in 1997 expanded upon their prior work in order
to determine the detrimental effects of refrigerant migration and what measures could be
taken in order to improve performance during the on-cycle. Coulter and Bullard found
that the refrigerant migration to the evaporator requires that the on-cycle “must first cool
the evaporator, so the thermal capacitance of the evaporator causes an on-cycle loss” [3].
Because the refrigerant migrates to the evaporator, extra work is required to redistribute
the refrigerant as necessary. Consequently, at the beginning of the on-cycle period, a
decrease in evaporator capacity and an increase in system power is observed. Coulter and
Bullard suggested that the accumulator may also have a negative impact in this situation
as it may trap needed liquid refrigerant from the evaporator. In total, in order to reduce
8
the negative effects of refrigerant migration, Coulter and Bullard have suggested the use
of a solenoid valve after the condenser to prevent refrigerant migration altogether and the
relocation, or even removal, of the accumulator.
Other studies have taken a more general approach to observing refrigerant, and in
some cases oil, distribution throughout a refrigeration cycle during operation. It is of
interest to know how much refrigerant is in a given component at a given time in order to
determine the effectiveness of each component and the overall system as a whole. A
number of methods have been used to observe refrigerant flow and some studies, such as
those conducted by Manwell and Bergles [4] in 1989, have been set up specifically to
examine flow patterns involving oil and refrigerant mixtures.
Asano et al. [5] examined refrigerant flows in a domestic refrigerator in a study
completed in 1996. The experiment utilized neutron radiography to observe the
refrigerant flow and allowed for real-time measurements and visualization using high
speed cameras. The experiment provided images of flow within the compressor,
evaporator, condenser, and capillary tube. Flow near the compressor and in the liquid
separator included in the experimental set-up showed frothy mixtures due to the presence
of oil in the refrigerant. For the condenser in particular, it was found that the orientation
and inclination of the condenser tubes are very important and change the flow behavior of
the refrigerant.
Inan et al. [6] examined refrigerant flows in a domestic refrigeration system in
2003, but they utilized an x-ray method as opposed to neutron radiography. Images were
focused on the filter dryer, capillary tube, evaporator, and accumulator. The condenser
and compressor were not examined. The x-ray system utilized for experimentation
9
provided real-time visualization of the dynamic behavior of the refrigeration system.
Video was recorded and reviewed to examine refrigerant trends throughout the system
and temperatures were also closely monitored and recorded to understand corresponding
trends. In total, Inan et al. were able to show that the x-ray method is an effective way to
monitor refrigerant distribution. General flow trends were discovered, more of which are
discussed in section 2.2.3.
A number of other studies explore refrigerant flow with direct impact on the
compressor. As mentioned above, liquid refrigerant entering the compressor can cause
significant damage, leading to ultimate failure of the component. In reciprocating
compressors in particular, which are the topic of study for Prasad [7], liquid in the
compressor volume leads to excessive pressure build up as the piston cannot expel the
liquid through the discharge valve. Excessive pressure within the compressor puts a great
amount of strain on the moving parts and can eventually cause them to fail. Liquid
capture is thus the most important job of the accumulator, as it can protect the compressor
from potential damage, but, as described by Coulter and Bullard [3], this exact capability
can also create disadvantages in terms of overall system performance and refrigerant
migration.
2.2.2 Measurement of Oil and Refrigerant Mixture Concentrations
In addition to knowing how refrigerant moves throughout the refrigeration cycle
and within specific components, it is also extremely important to know how the
compressor lubricant and system refrigerant interact and mix. The compressor lubricant is
vital for protecting the moving parts of the compressor and preventing long term wear
and tear that could threaten compressor efficiency and lifetime. Some oil will inevitably,
10
however, move with the refrigerant from the compressor to other components within the
system. It is important to understand how the oil and refrigerant will interact to ensure
that the presence of the oil will not significantly change the working properties of the
refrigerant throughout the system. Several studies have been conducted to examine the
relationship between oil and refrigerant in refrigeration cycles and researchers have
attempted to measure oil/refrigerant mixture concentration. Other researchers have
attempted to develop methods to predict oil/refrigerant mixtures and properties, though
this practice generally proves very difficult due to the transient nature of the refrigeration
cycle. In general, there are two approaches to examining oil and refrigerant mixtures.
Some researchers examine oil as a pollutant to the refrigerant that affects refrigerant
properties. Other scientists view the oil/refrigerant mixture like a zeotropic mixture,
enabling them to review all oil-related effects throughout the entire refrigeration cycle [9].
Real-time measurements of oil/refrigerant concentration were attempted by
Lebreton et al. [8] in 2000 using an ultrasonic device. POE oil and R410A were used for
the experiment, which was intended to not only determine the characteristics of the
oil/refrigerant mixture, but also to verify the method of utilizing the variations of the
speed of sound in the mixture to determine concentration. This real-time measurement,
along with other real-time methods, is preferred to a sampling technique since samples
will remove needed amounts of oil and refrigerant from the system. Most research
conducted recently on this topic has focused on the success and utilization of real-time
measurements.
Like many other authors, Lebreton et al. believe “that the quantity of oil present in
the vapor phase of an oil/refrigerant liquid mixture is negligible” [8]. In many cases, the
11
boiling point of the oil is much higher than that of the refrigerant, so it is unlikely that the
oil will be included in the vapor phase of the refrigerant. The most important mixture,
therefore, is that of liquid oil and liquid refrigerant.
In their study, Lebreton et al. were able to successfully use the ultrasonic method
to examine oil/refrigerant mixtures and the oil distribution throughout the refrigeration
cycle. Characteristics of oil/refrigerant mixtures, however, vary greatly depending on the
type of oil and refrigerant used. Therefore, the ultrasonic method is useful, but only with
careful and time-consuming calibration conducted specifically for the unique
combination of fluids.
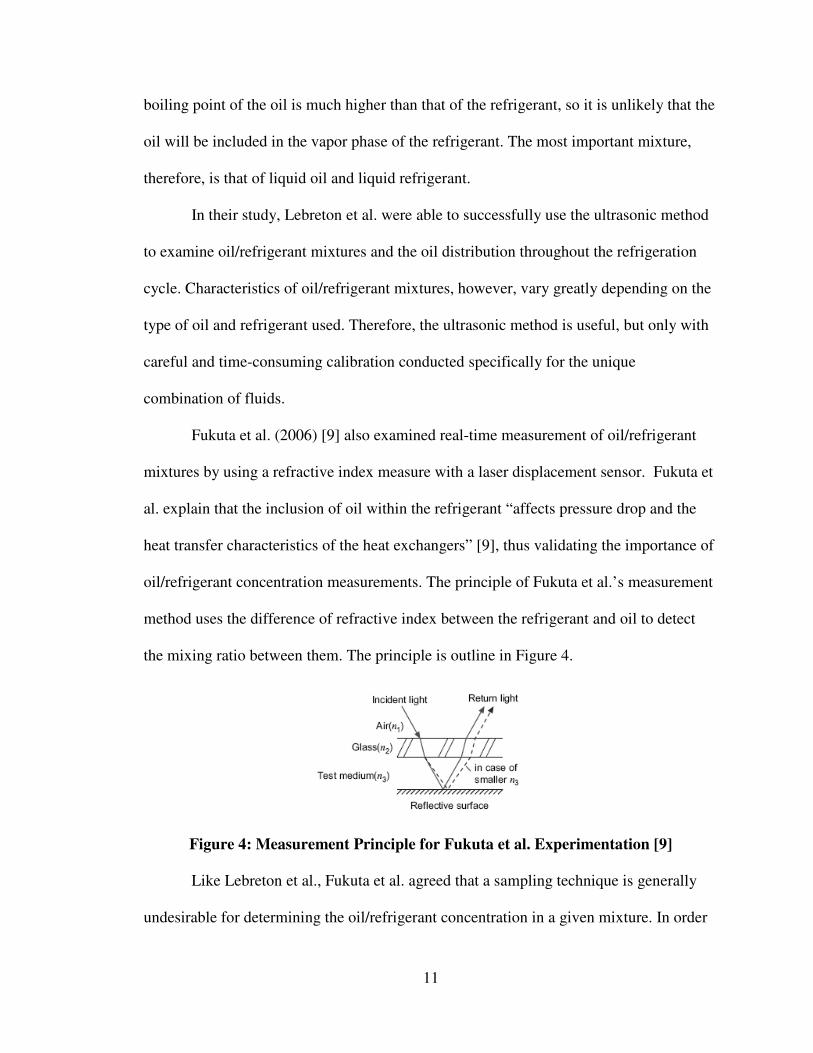
Fukuta et al. (2006) [9] also examined real-time measurement of oil/refrigerant
mixtures by using a refractive index measure with a laser displacement sensor. Fukuta et
al. explain that the inclusion of oil within the refrigerant “affects pressure drop and the
heat transfer characteristics of the heat exchangers” [9], thus validating the importance of
oil/refrigerant concentration measurements. The principle of Fukuta et al.’s measurement
method uses the difference of refractive index between the refrigerant and oil to detect
the mixing ratio between them. The principle is outline in Figure 4.
Figure 4: Measurement Principle for Fukuta et al. Experimentation [9]
Like Lebreton et al., Fukuta et al. agreed that a sampling technique is generally
undesirable for determining the oil/refrigerant concentration in a given mixture. In order
12
to verify results and the refractive index measurement method, however, samples were
also taken during experimentation. A range of concentrations and temperatures were
studied in order to obtain a comprehensive understanding of the mixing relationship
between oil and refrigerant, which were PVE and R410A, respectively. Equations
relating the refractive index, temperature, pressure, mixture density, and concentration
were found specific to the experiment. The method proved successful and real-time
measurements were taken. No specific results relating the concentrations of the mixtures
were provided.
Prior work by Fukuta et al. (2005) [10] explored the relationship between R600a
and mineral oils when mixing and separating, an oil/refrigerant combination of particular
interest to this project. Two experiments were designed and conducted to test first the
transient mixing of R600a with several mineral oils and second the separation of R600a
and mineral oil. Mixing was not conducted mechanically, but was rather induced using a
change in pressure simulating the off-period in the vapor-compression cycle. Unlike other
more traditional oil/refrigerant mixtures, R600a is less dense than the compressor oil and
different mixing trends consequently result. Where other mixtures experience mixing by
convection due to the differences in density, R600a and mineral oils do not experience
this phenomenon and instead mix by diffusion when subject to appropriate changes in
pressure. The mixing process, therefore, is very slow. Separation experimentation also
only considered decreases in pressure as the motivator for changes in the R600a/mineral
oil mixtures. A vessel containing R600a and mineral oil was depressurized and trends in
the fluid behavior were observed. The most important observation was bubble formation
shortly after the start of depressurization. Bubbles were unstable and unpredictable and
13
affected the rate at which the vessel completely depressurized. Convection was observed
in this condition, unlike the mixing case, because of the density difference between the
bottom (high density) and top of the vessel (low density) where the refrigerant escaped.
Fukuta et al. (2005) did not explore conditions of mixing or separation where mechanical
stimulation occurred, as when the compressor would turn-on during start-up or cycling
periods, but a better understanding of transient behavior for R600a/mineral oil solutions
during the off-periods was obtained.
While real-time measurements provide experimental data evaluating the
concentration of oil/refrigerant mixtures and their fluid behavior, it is ultimately desired
to have a basic known relationship for oil/refrigerant mixtures at given pressures and
temperatures. Using experimental results and simulation, several researchers have
attempted to further understand the relationship between oil and refrigerant and quantify
it by creating useful mixture equations. In 1999, Elvassore et al. [11] proposed a method
for calculating the vapor-liquid equilibrium for oil/refrigerant mixtures. The method
builds upon the classical cubic equation of state but requires the knowledge of all oil
properties and the chemical composition. The relationship developed is also specifically
for use between hydrofluorocarbons (HFCs) and POE oils, so use of the method with
other refrigerants and mineral oils may not hold.
Zhelezny et al. [12] went further in determining mathematical relationships for
oil/refrigerant mixtures by using experimental work to backup modeling simulations and
previous predictions in work conducted in 2007. Like Fukuta et al. (2005) [10], Zhelezny
et al. specifically explored R600a and compressor oil solutions, solutions that are of
particular interest to this project. Experiments were conducted to examine the solubility,
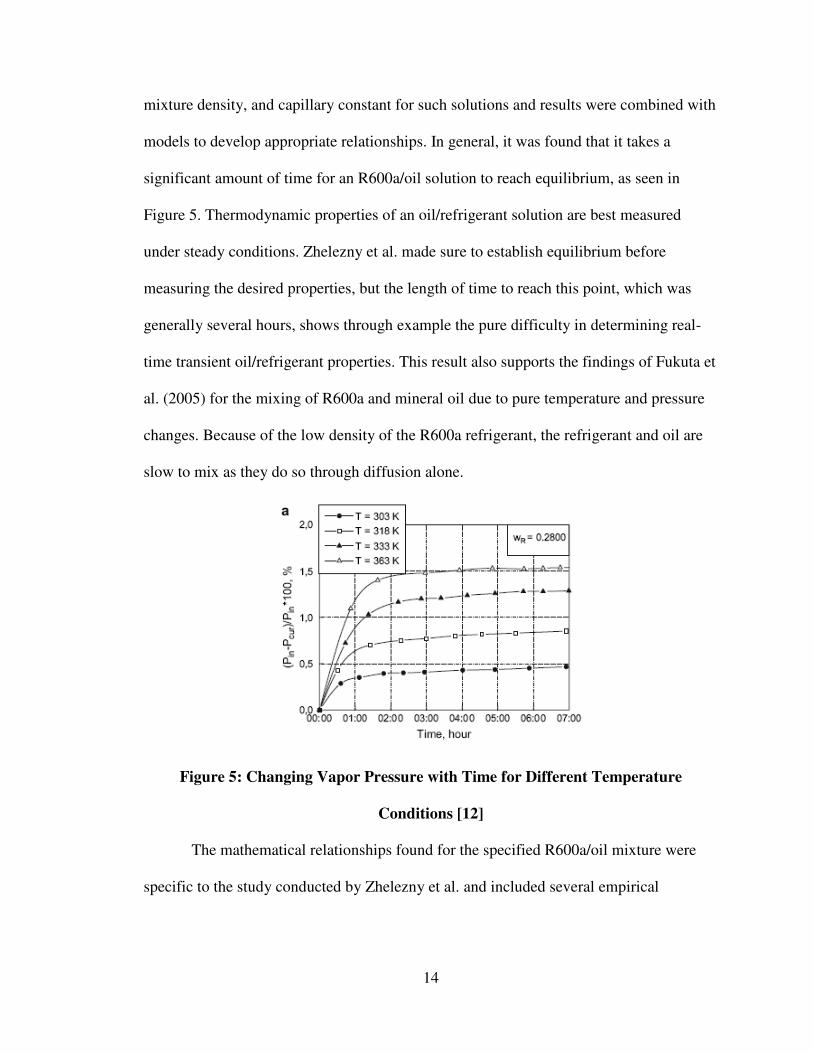
14
mixture density, and capillary constant for such solutions and results were combined with
models to develop appropriate relationships. In general, it was found that it takes a
significant amount of time for an R600a/oil solution to reach equilibrium, as seen in
Figure 5. Thermodynamic properties of an oil/refrigerant solution are best measured
under steady conditions. Zhelezny et al. made sure to establish equilibrium before
measuring the desired properties, but the length of time to reach this point, which was
generally several hours, shows through example the pure difficulty in determining real-
time transient oil/refrigerant properties. This result also supports the findings of Fukuta et
al. (2005) for the mixing of R600a and mineral oil due to pure temperature and pressure
changes. Because of the low density of the R600a refrigerant, the refrigerant and oil are
slow to mix as they do so through diffusion alone.
Figure 5: Changing Vapor Pressure with Time for Different Temperature
Conditions [12]
The mathematical relationships found for the specified R600a/oil mixture were
specific to the study conducted by Zhelezny et al. and included several empirical
15
constants that will vary for other solutions. While the equations established were specific
to the tests conducted, results agreed well with the experimental data.
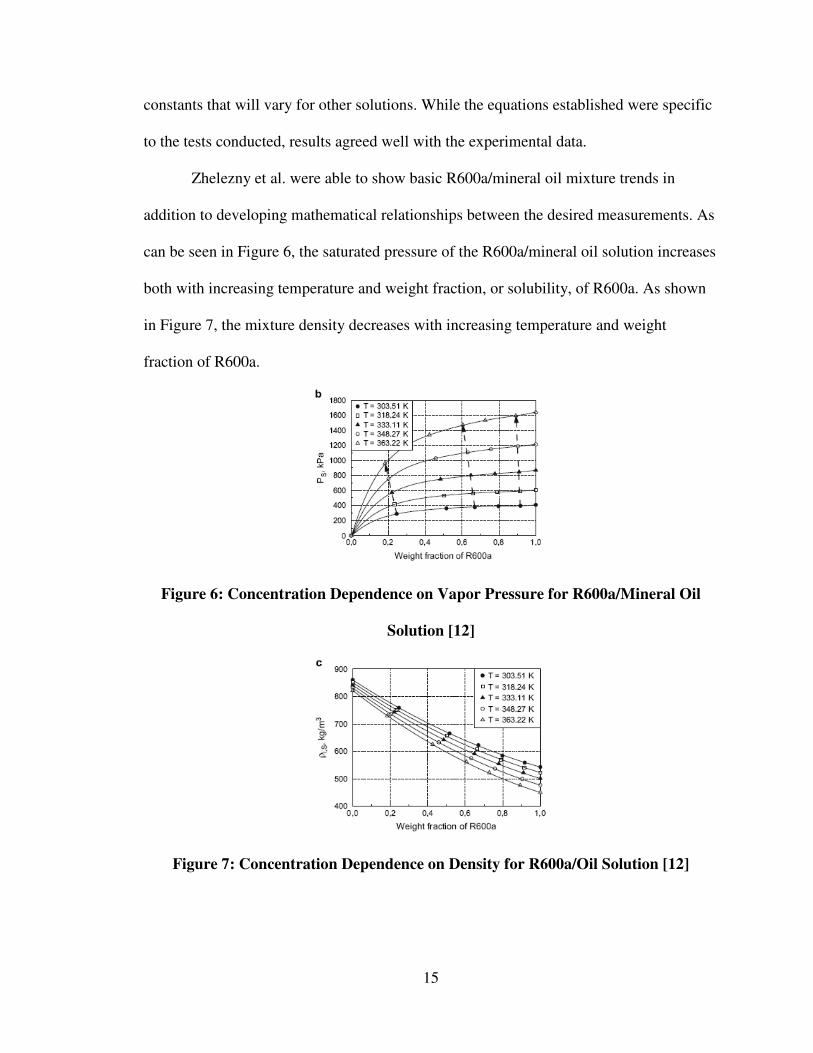
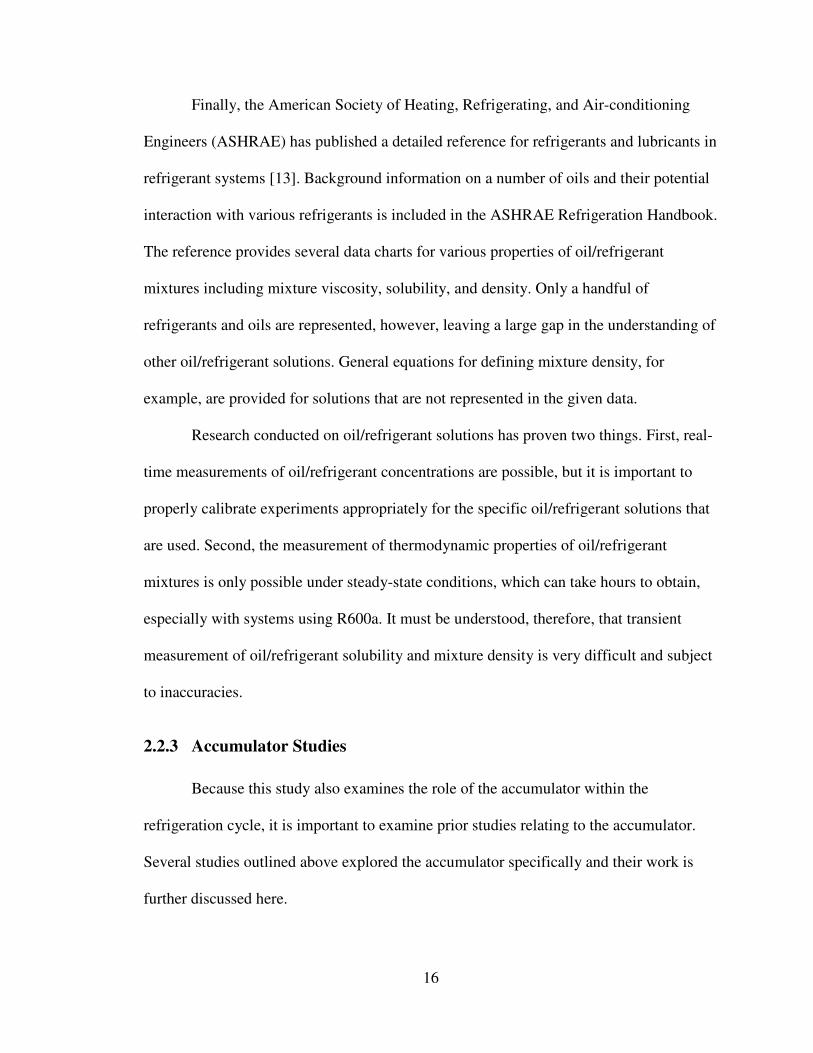
Zhelezny et al. were able to show basic R600a/mineral oil mixture trends in
addition to developing mathematical relationships between the desired measurements. As
can be seen in Figure 6, the saturated pressure of the R600a/mineral oil solution increases
both with increasing temperature and weight fraction, or solubility, of R600a. As shown
in Figure 7, the mixture density decreases with increasing temperature and weight
fraction of R600a.
Figure 6: Concentration Dependence on Vapor Pressure for R600a/Mineral Oil
Solution [12]
Figure 7: Concentration Dependence on Density for R600a/Oil Solution [12]
16
Finally, the American Society of Heating, Refrigerating, and Air-conditioning
Engineers (ASHRAE) has published a detailed reference for refrigerants and lubricants in
refrigerant systems [13]. Background information on a number of oils and their potential
interaction with various refrigerants is included in the ASHRAE Refrigeration Handbook.
The reference provides several data charts for various properties of oil/refrigerant
mixtures including mixture viscosity, solubility, and density. Only a handful of
refrigerants and oils are represented, however, leaving a large gap in the understanding of
other oil/refrigerant solutions. General equations for defining mixture density, for
example, are provided for solutions that are not represented in the given data.
Research conducted on oil/refrigerant solutions has proven two things. First, real-
time measurements of oil/refrigerant concentrations are possible, but it is important to
properly calibrate experiments appropriately for the specific oil/refrigerant solutions that
are used. Second, the measurement of thermodynamic properties of oil/refrigerant
mixtures is only possible under steady-state conditions, which can take hours to obtain,
especially with systems using R600a. It must be understood, therefore, that transient
measurement of oil/refrigerant solubility and mixture density is very difficult and subject
to inaccuracies.
2.2.3 Accumulator Studies
Because this study also examines the role of the accumulator within the
refrigeration cycle, it is important to examine prior studies relating to the accumulator.
Several studies outlined above explored the accumulator specifically and their work is
further discussed here.
17
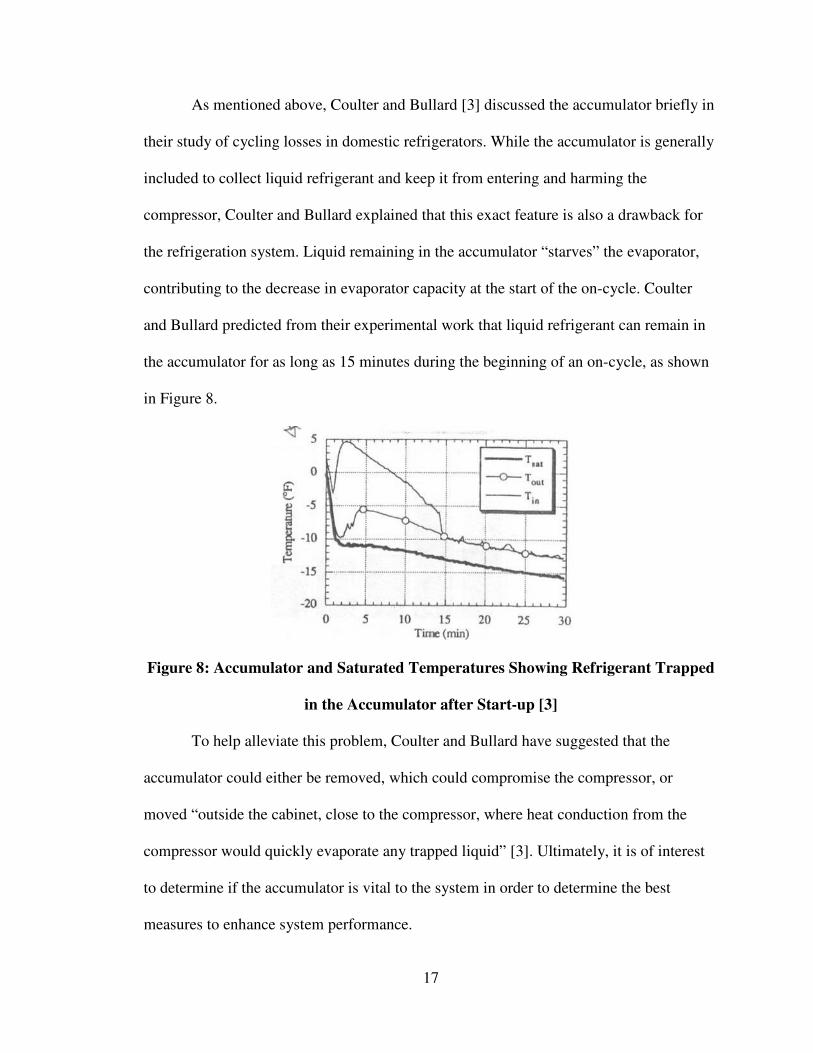
As mentioned above, Coulter and Bullard [3] discussed the accumulator briefly in
their study of cycling losses in domestic refrigerators. While the accumulator is generally
included to collect liquid refrigerant and keep it from entering and harming the
compressor, Coulter and Bullard explained that this exact feature is also a drawback for
the refrigeration system. Liquid remaining in the accumulator “starves” the evaporator,
contributing to the decrease in evaporator capacity at the start of the on-cycle. Coulter
and Bullard predicted from their experimental work that liquid refrigerant can remain in
the accumulator for as long as 15 minutes during the beginning of an on-cycle, as shown
in Figure 8.
Figure 8: Accumulator and Saturated Temperatures Showing Refrigerant Trapped
in the Accumulator after Start-up [3]
To help alleviate this problem, Coulter and Bullard have suggested that the
accumulator could either be removed, which could compromise the compressor, or
moved “outside the cabinet, close to the compressor, where heat conduction from the
compressor would quickly evaporate any trapped liquid” [3]. Ultimately, it is of interest
to determine if the accumulator is vital to the system in order to determine the best
measures to enhance system performance.
18
Bjork and Palm [14] did not explicitly study the accumulator, but did note another
important characteristic of the device. Because the accumulator is able to hold a variable
amount of liquid, it is often able to act as a buffer for refrigerant charge within a given
range of charges. With a charge that is too low, the system can become further starved
and result in a large superheat. With a charge that is too high, the evaporator can
overflow and create a cold suction line, which allows for cooling capacity outside of the
refrigerator cabinet. The accumulator, however, “explains the rather flat energy minimum
in between these two extremes” by providing a buffer volume that can trap a variable
amount of fluid.
Inan et al. [6] examined the accumulator more specifically and were able to
capture clear pictures of the accumulator and its associated liquid levels using their X-ray
technique. They found that the maximum liquid level in the accumulator is achieved
approximately one hour and twenty-five minutes after the system is started. Results also
indicated that the liquid level in the accumulator is directly associated with the amount of
subcooling and the liquid level rises as the amount of subcooling decreases. Flow
behavior during the on and off periods also show changes in the liquid level. The liquid
level is observed to decrease during the off-cycle as some liquid refrigerant drains back to
the evaporator. When the system is started again, refrigerant is quickly pushed through
the evaporator shortly after start-up and the accumulator fills with liquid, as shown in
Figure 9. The liquid level in the accumulator, indicated by the dark shadow in the
pictures of Figure 9, is shown to decrease during the off period in picture (a). As the
system is started, liquid levels are observed to increase, as seen by the increase in shadow
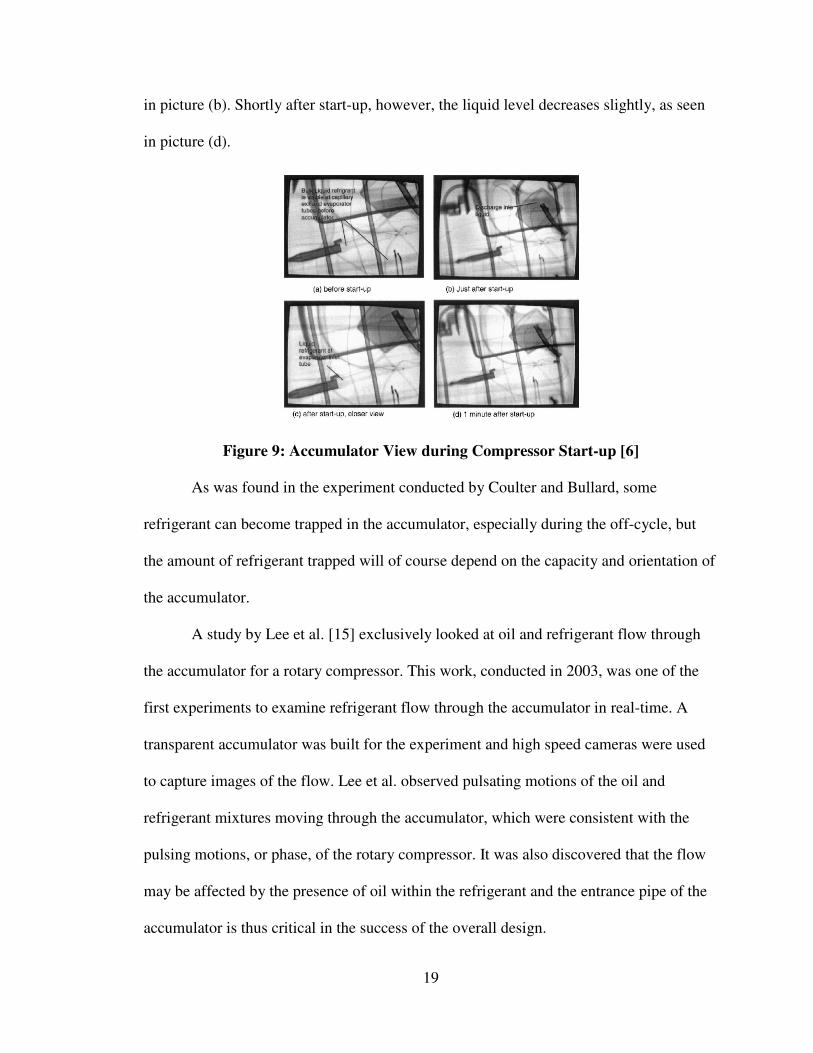
19
in picture (b). Shortly after start-up, however, the liquid level decreases slightly, as seen
in picture (d).
Figure 9: Accumulator View during Compressor Start-up [6]
As was found in the experiment conducted by Coulter and Bullard, some
refrigerant can become trapped in the accumulator, especially during the off-cycle, but
the amount of refrigerant trapped will of course depend on the capacity and orientation of
the accumulator.
A study by Lee et al. [15] exclusively looked at oil and refrigerant flow through
the accumulator for a rotary compressor. This work, conducted in 2003, was one of the
first experiments to examine refrigerant flow through the accumulator in real-time. A
transparent accumulator was built for the experiment and high speed cameras were used
to capture images of the flow. Lee et al. observed pulsating motions of the oil and
refrigerant mixtures moving through the accumulator, which were consistent with the
pulsing motions, or phase, of the rotary compressor. It was also discovered that the flow
may be affected by the presence of oil within the refrigerant and the entrance pipe of the
accumulator is thus critical in the success of the overall design.
20
3 Motivation and Objectives
The motivations and objectives of the study are outlined below.
3.1 Motivation
The purpose of studying oil and refrigerant migration within the refrigeration
system and focusing on the accumulator is:
1. To improve refrigerator performance and efficiency
2. To possibly eliminate the accumulator, simplifying the refrigerator’s design
Little research exists that explores the explicit role of the accumulator and how
oil/refrigerant migration is related to its effectiveness.
3.2 Objectives
The objectives of this study are:
1. To observe the distribution of refrigerant and oil in a household refrigerator
during the pull-down, cyclic, and defrost stages of operation
2. To determine the effectiveness and necessity of the accumulator
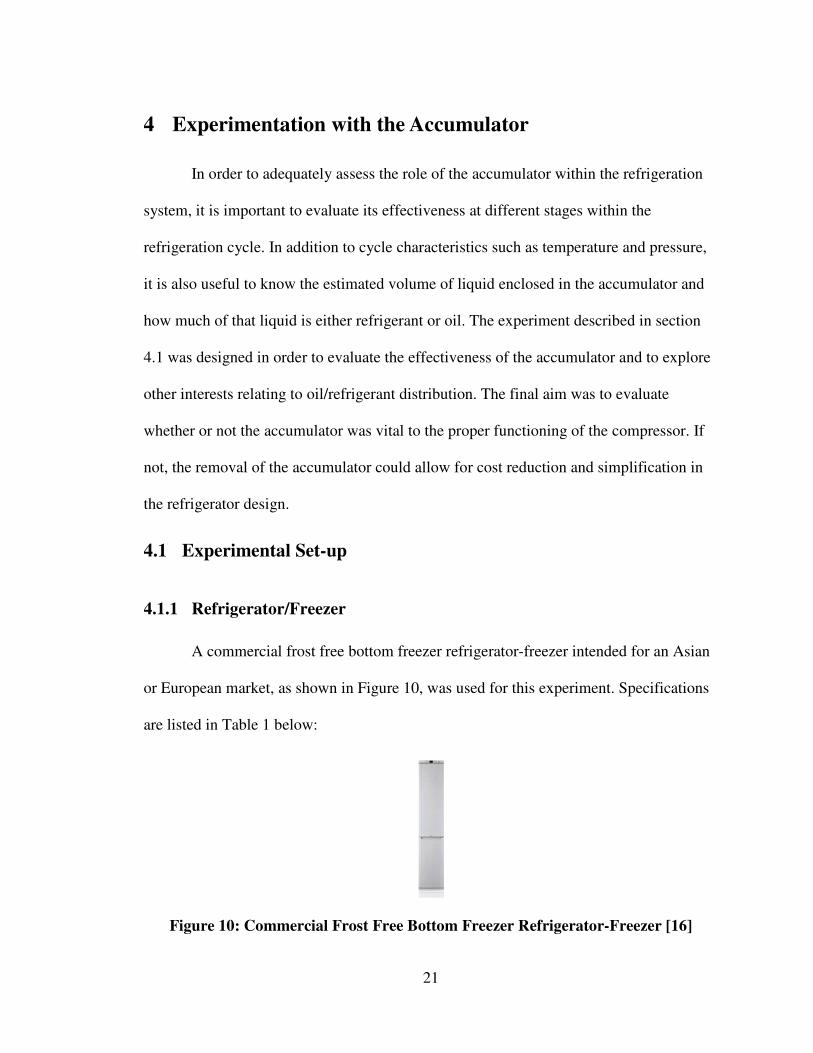
21
4 Experimentation with the Accumulator
In order to adequately assess the role of the accumulator within the refrigeration
system, it is important to evaluate its effectiveness at different stages within the
refrigeration cycle. In addition to cycle characteristics such as temperature and pressure,
it is also useful to know the estimated volume of liquid enclosed in the accumulator and
how much of that liquid is either refrigerant or oil. The experiment described in section
4.1 was designed in order to evaluate the effectiveness of the accumulator and to explore
other interests relating to oil/refrigerant distribution. The final aim was to evaluate
whether or not the accumulator was vital to the proper functioning of the compressor. If
not, the removal of the accumulator could allow for cost reduction and simplification in
the refrigerator design.
4.1 Experimental Set-up
4.1.1 Refrigerator/Freezer
A commercial frost free bottom freezer refrigerator-freezer intended for an Asian
or European market, as shown in Figure 10, was used for this experiment. Specifications
are listed in Table 1 below:
Figure 10: Commercial Frost Free Bottom Freezer Refrigerator-Freezer [16]
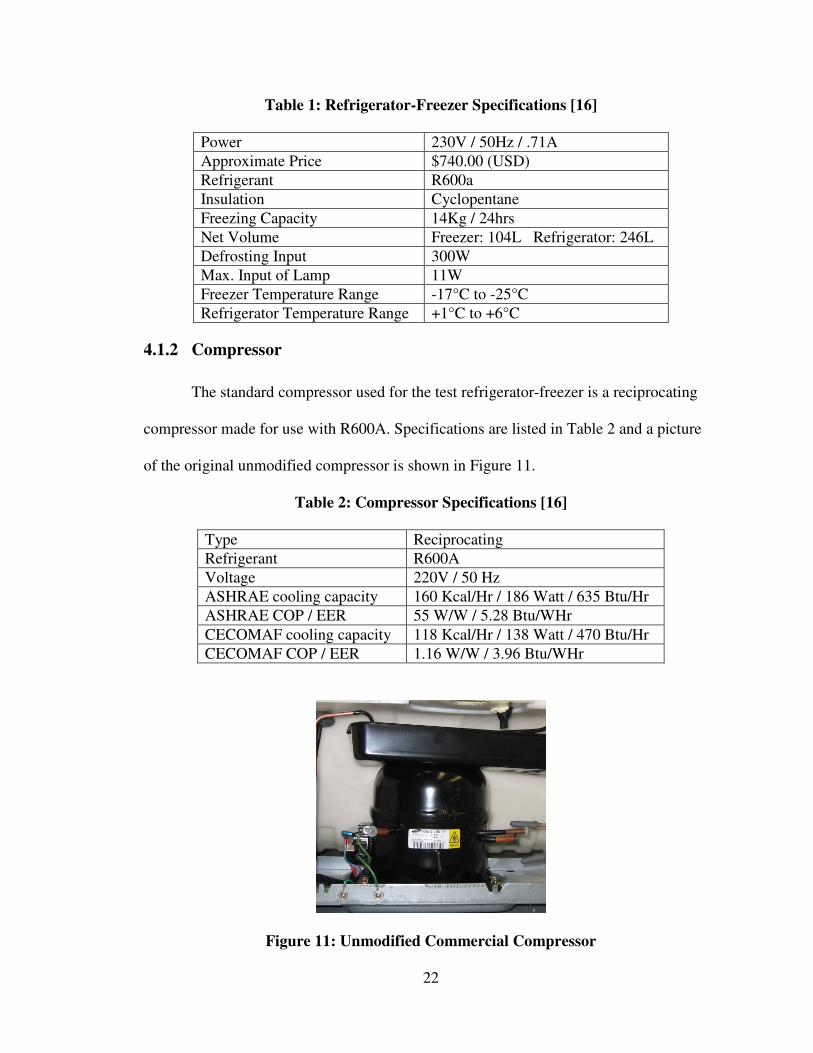
22
Table 1: Refrigerator-Freezer Specifications [16]
Power 230V / 50Hz / .71A
Approximate Price $740.00 (USD)
Refrigerant R600a
Insulation Cyclopentane
Freezing Capacity 14Kg / 24hrs
Net Volume Freezer: 104L Refrigerator: 246L
Defrosting Input 300W
Max. Input of Lamp 11W
Freezer Temperature Range -17°C to -25°C
Refrigerator Temperature Range +1°C to +6°C
4.1.2 Compressor
The standard compressor used for the test refrigerator-freezer is a reciprocating
compressor made for use with R600A. Specifications are listed in Table 2 and a picture
of the original unmodified compressor is shown in Figure 11.
Table 2: Compressor Specifications [16]
Type Reciprocating
Refrigerant R600A
Voltage 220V / 50 Hz
ASHRAE cooling capacity 160 Kcal/Hr / 186 Watt / 635 Btu/Hr
ASHRAE COP / EER 55 W/W / 5.28 Btu/WHr
CECOMAF cooling capacity 118 Kcal/Hr / 138 Watt / 470 Btu/Hr
CECOMAF COP / EER 1.16 W/W / 3.96 Btu/WHr
Figure 11: Unmodified Commercial Compressor
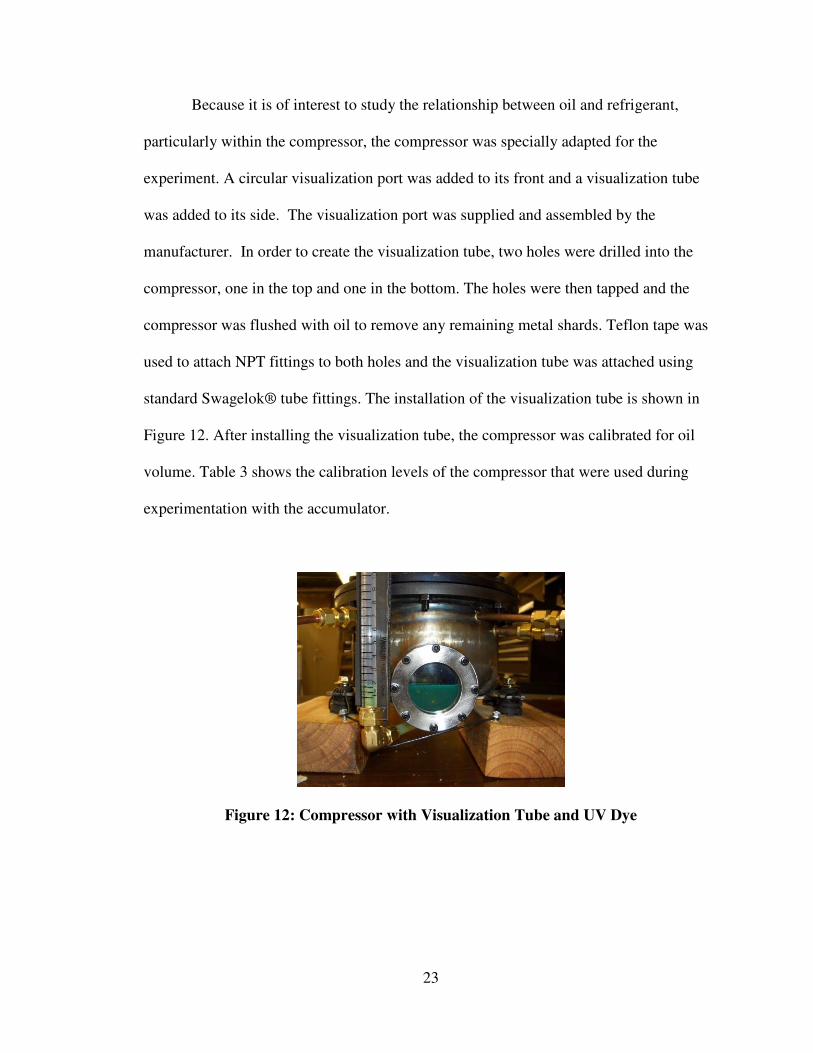
23
Because it is of interest to study the relationship between oil and refrigerant,
particularly within the compressor, the compressor was specially adapted for the
experiment. A circular visualization port was added to its front and a visualization tube
was added to its side. The visualization port was supplied and assembled by the
manufacturer. In order to create the visualization tube, two holes were drilled into the
compressor, one in the top and one in the bottom. The holes were then tapped and the
compressor was flushed with oil to remove any remaining metal shards. Teflon tape was
used to attach NPT fittings to both holes and the visualization tube was attached using
standard Swagelok® tube fittings. The installation of the visualization tube is shown in
Figure 12. After installing the visualization tube, the compressor was calibrated for oil
volume. Table 3 shows the calibration levels of the compressor that were used during
experimentation with the accumulator.
Figure 12: Compressor with Visualization Tube and UV Dye
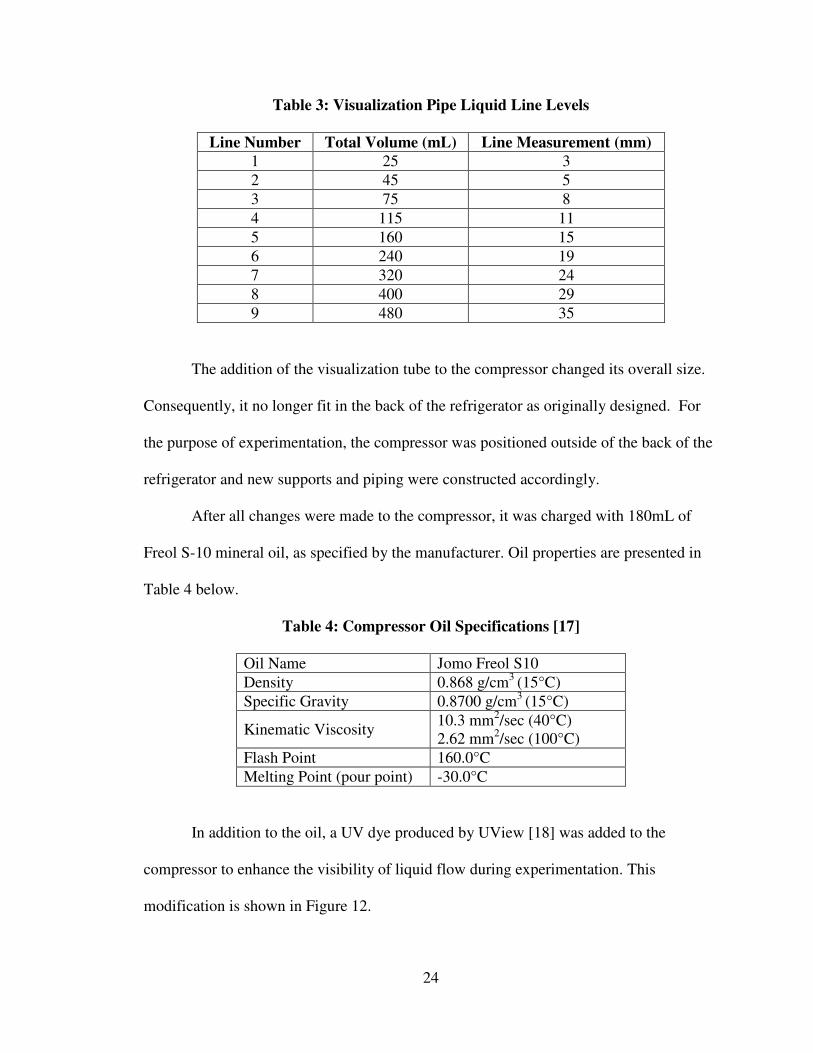
24
Table 3: Visualization Pipe Liquid Line Levels
Line Number Total Volume (mL) Line Measurement (mm)
1 25 3
2 45 5
3 75 8
4 115 11
5 160 15
6 240 19
7 320 24
8 400 29
9 480 35
The addition of the visualization tube to the compressor changed its overall size.
Consequently, it no longer fit in the back of the refrigerator as originally designed. For
the purpose of experimentation, the compressor was positioned outside of the back of the
refrigerator and new supports and piping were constructed accordingly.
After all changes were made to the compressor, it was charged with 180mL of
Freol S-10 mineral oil, as specified by the manufacturer. Oil properties are presented in
Table 4 below.
Table 4: Compressor Oil Specifications [17]
Oil Name Jomo Freol S10
Density 0.868 g/cm3 (15°C)
Specific Gravity 0.8700 g/cm3 (15°C)
Kinematic Viscosity 10.3 mm2/sec (40°C) 2.62 mm2/sec (100°C)
Flash Point 160.0°C
Melting Point (pour point) -30.0°C
In addition to the oil, a UV dye produced by UView [18] was added to the
compressor to enhance the visibility of liquid flow during experimentation. This
modification is shown in Figure 12.
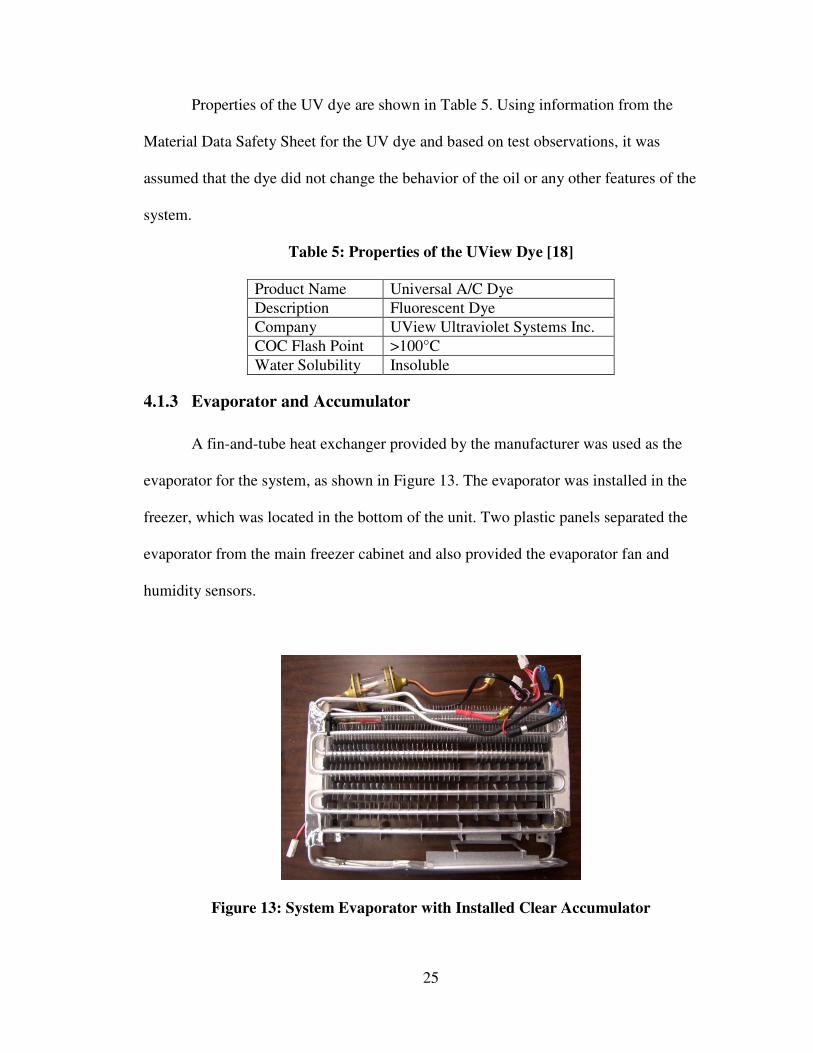
25
Properties of the UV dye are shown in Table 5. Using information from the
Material Data Safety Sheet for the UV dye and based on test observations, it was
assumed that the dye did not change the behavior of the oil or any other features of the
system.
Table 5: Properties of the UView Dye [18]
Product Name Universal A/C Dye
Description Fluorescent Dye
Company UView Ultraviolet Systems Inc.
COC Flash Point >100°C
Water Solubility Insoluble
4.1.3 Evaporator and Accumulator
A fin-and-tube heat exchanger provided by the manufacturer was used as the
evaporator for the system, as shown in Figure 13. The evaporator was installed in the
freezer, which was located in the bottom of the unit. Two plastic panels separated the
evaporator from the main freezer cabinet and also provided the evaporator fan and
humidity sensors.
Figure 13: System Evaporator with Installed Clear Accumulator
26
Like the compressor, the accumulator was specially designed for the test. As can
be seen in Figure 14, the accumulator was made out of clear plastic in order to allow for
liquid visualization during testing. Prior to installation in the system, the accumulator was
calibrated for volume level, as indicated by the lines in Figure 14. The calibration is
shown in Table 6 and has an error of approximately +/- 2mL. As can be seen in the table,
the accumulator is only capable of holding approximately 60mL before liquid will spill
over into the exiting pipe. The total volume of the accumulator based on pure
measurement and size is approximately 81mL.
Figure 14: Clear Accumulator Installed with Calibration Lines
Table 6: Liquid Level Lines with Corresponding Total Volume for the Accumulator
Line Number Total Volume (mL)
1 5
2 10
3 15
4 20
5 25
6 30
7 35
8 40
9 45
10 50
11 55
12 60
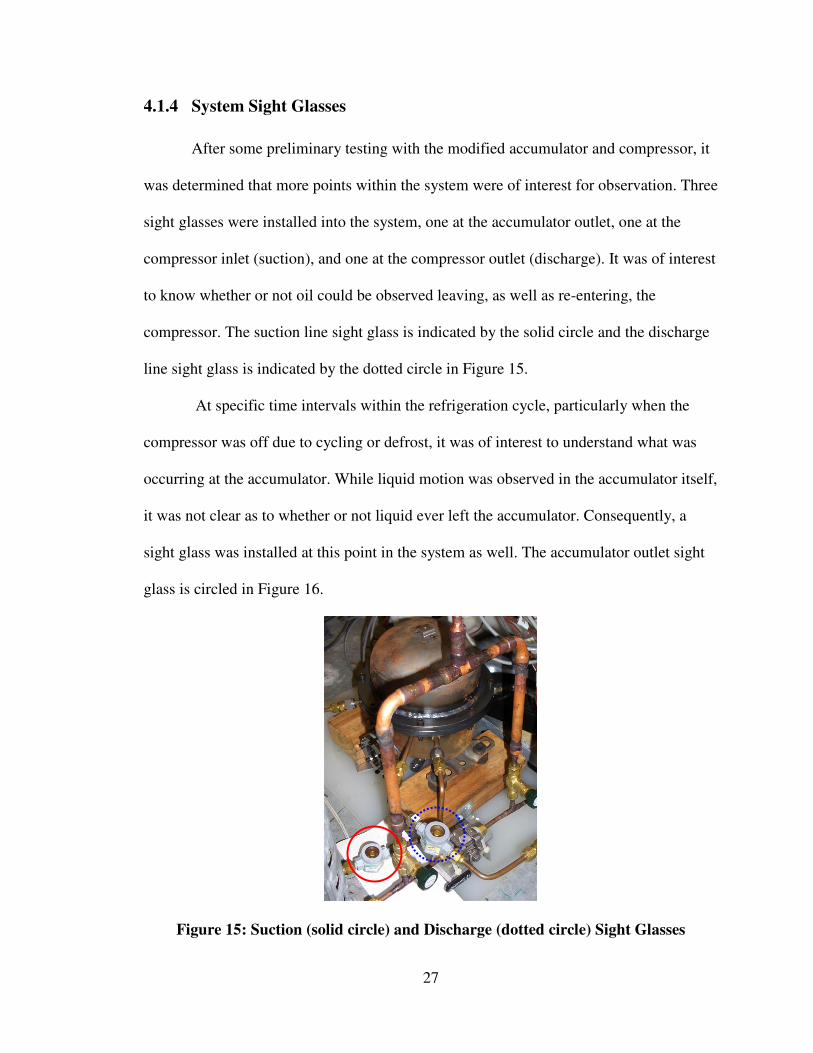
27
4.1.4 System Sight Glasses
After some preliminary testing with the modified accumulator and compressor, it
was determined that more points within the system were of interest for observation. Three
sight glasses were installed into the system, one at the accumulator outlet, one at the
compressor inlet (suction), and one at the compressor outlet (discharge). It was of interest
to know whether or not oil could be observed leaving, as well as re-entering, the
compressor. The suction line sight glass is indicated by the solid circle and the discharge
line sight glass is indicated by the dotted circle in Figure 15.
At specific time intervals within the refrigeration cycle, particularly when the
compressor was off due to cycling or defrost, it was of interest to understand what was
occurring at the accumulator. While liquid motion was observed in the accumulator itself,
it was not clear as to whether or not liquid ever left the accumulator. Consequently, a
sight glass was installed at this point in the system as well. The accumulator outlet sight
glass is circled in Figure 16.
Figure 15: Suction (solid circle) and Discharge (dotted circle) Sight Glasses
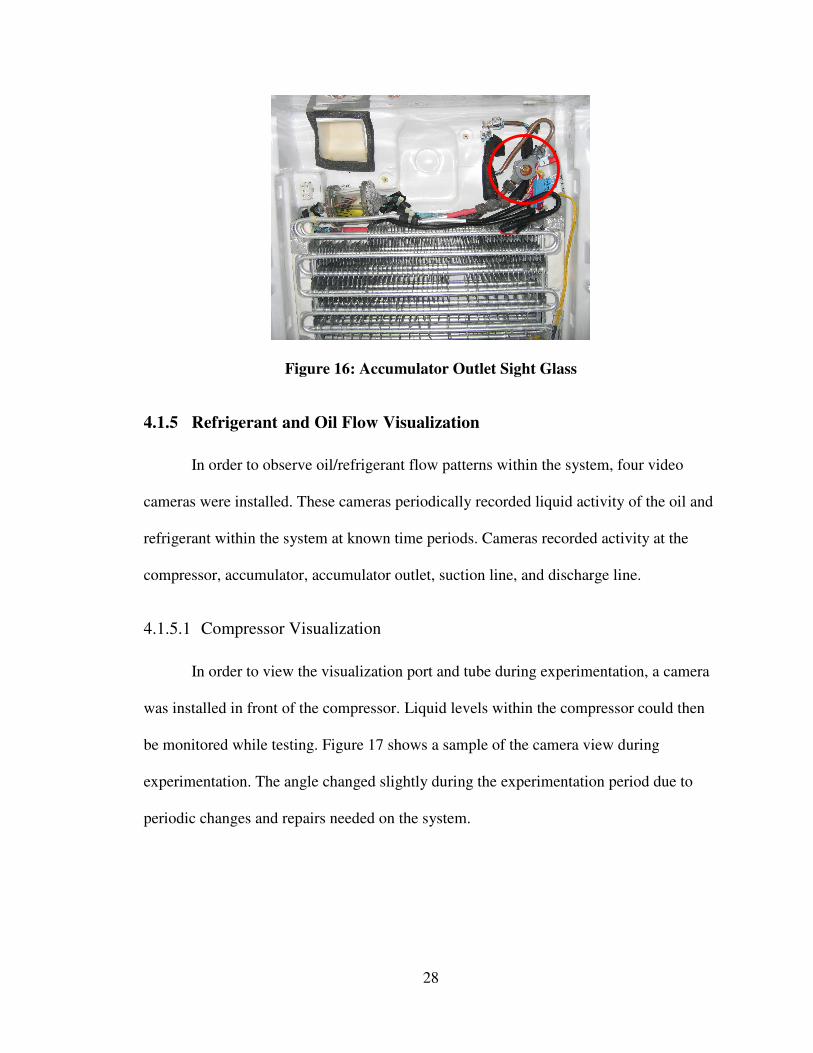
28
Figure 16: Accumulator Outlet Sight Glass
4.1.5 Refrigerant and Oil Flow Visualization
In order to observe oil/refrigerant flow patterns within the system, four video
cameras were installed. These cameras periodically recorded liquid activity of the oil and
refrigerant within the system at known time periods. Cameras recorded activity at the
compressor, accumulator, accumulator outlet, suction line, and discharge line.
4.1.5.1 Compressor Visualization
In order to view the visualization port and tube during experimentation, a camera
was installed in front of the compressor. Liquid levels within the compressor could then
be monitored while testing. Figure 17 shows a sample of the camera view during
experimentation. The angle changed slightly during the experimentation period due to
periodic changes and repairs needed on the system.
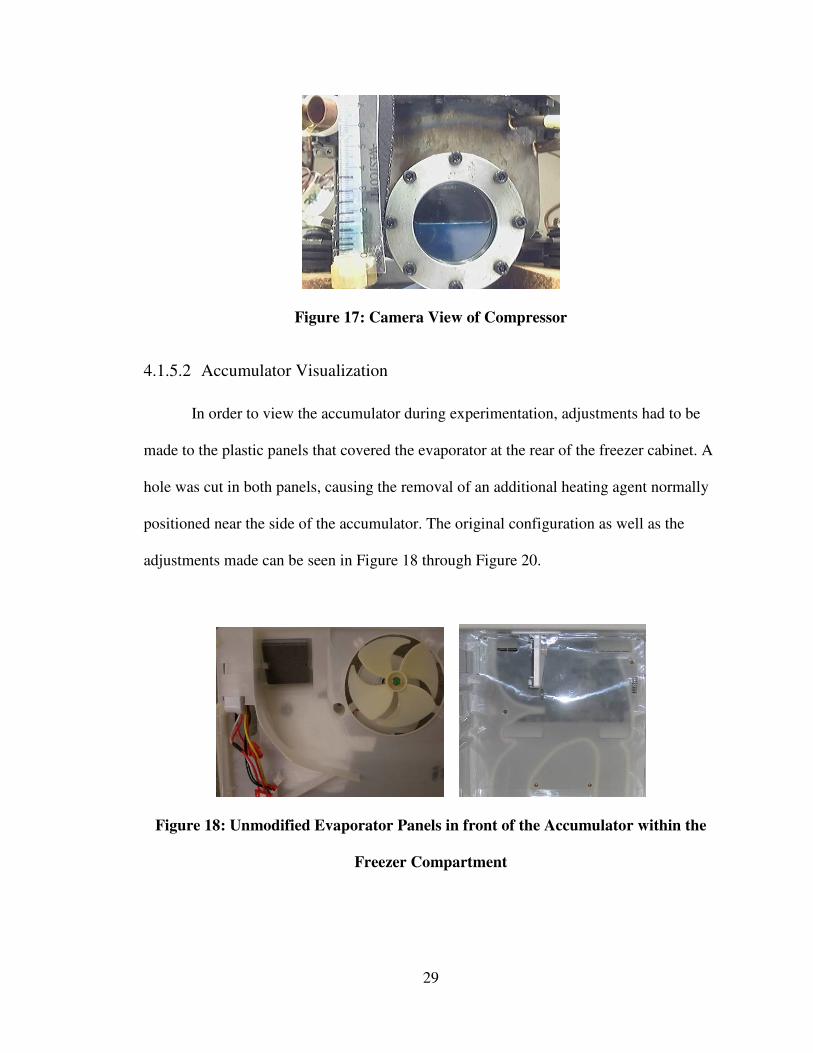
29
Figure 17: Camera View of Compressor
4.1.5.2 Accumulator Visualization
In order to view the accumulator during experimentation, adjustments had to be
made to the plastic panels that covered the evaporator at the rear of the freezer cabinet. A
hole was cut in both panels, causing the removal of an additional heating agent normally
positioned near the side of the accumulator. The original configuration as well as the
adjustments made can be seen in Figure 18 through Figure 20.
Figure 18: Unmodified Evaporator Panels in front of the Accumulator within the
Freezer Compartment
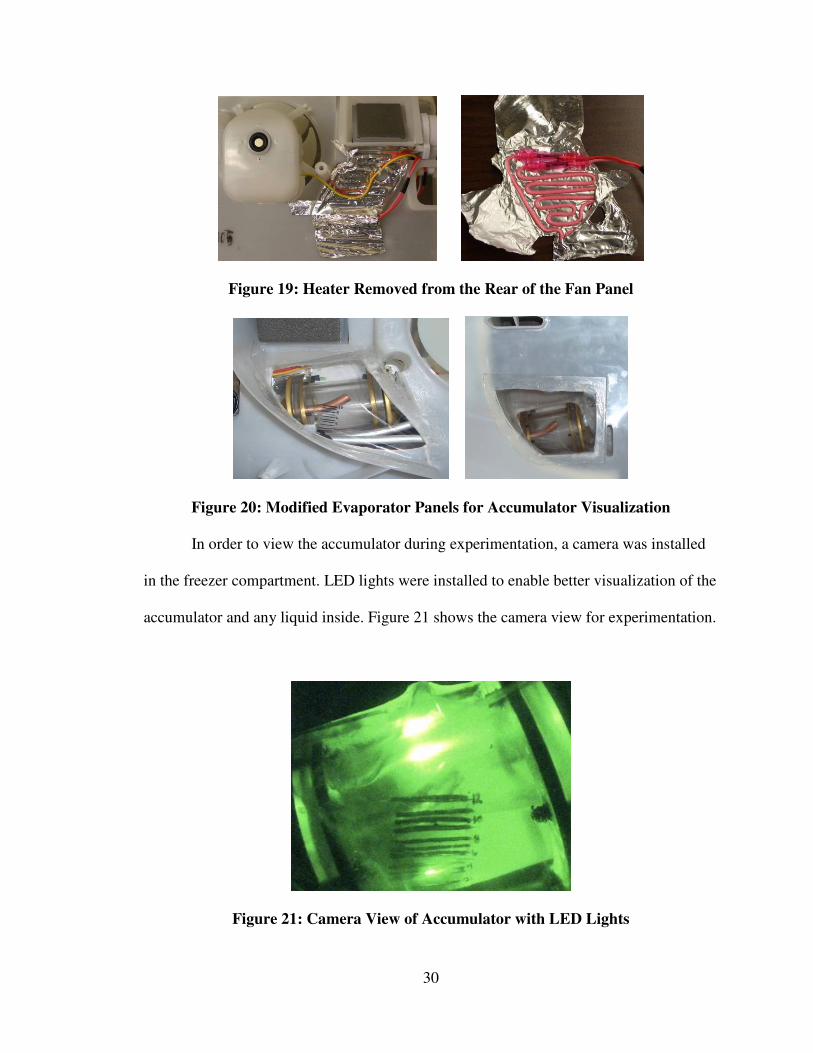
30
Figure 19: Heater Removed from the Rear of the Fan Panel
Figure 20: Modified Evaporator Panels for Accumulator Visualization
In order to view the accumulator during experimentation, a camera was installed
in the freezer compartment. LED lights were installed to enable better visualization of the
accumulator and any liquid inside. Figure 21 shows the camera view for experimentation.
Figure 21: Camera View of Accumulator with LED Lights
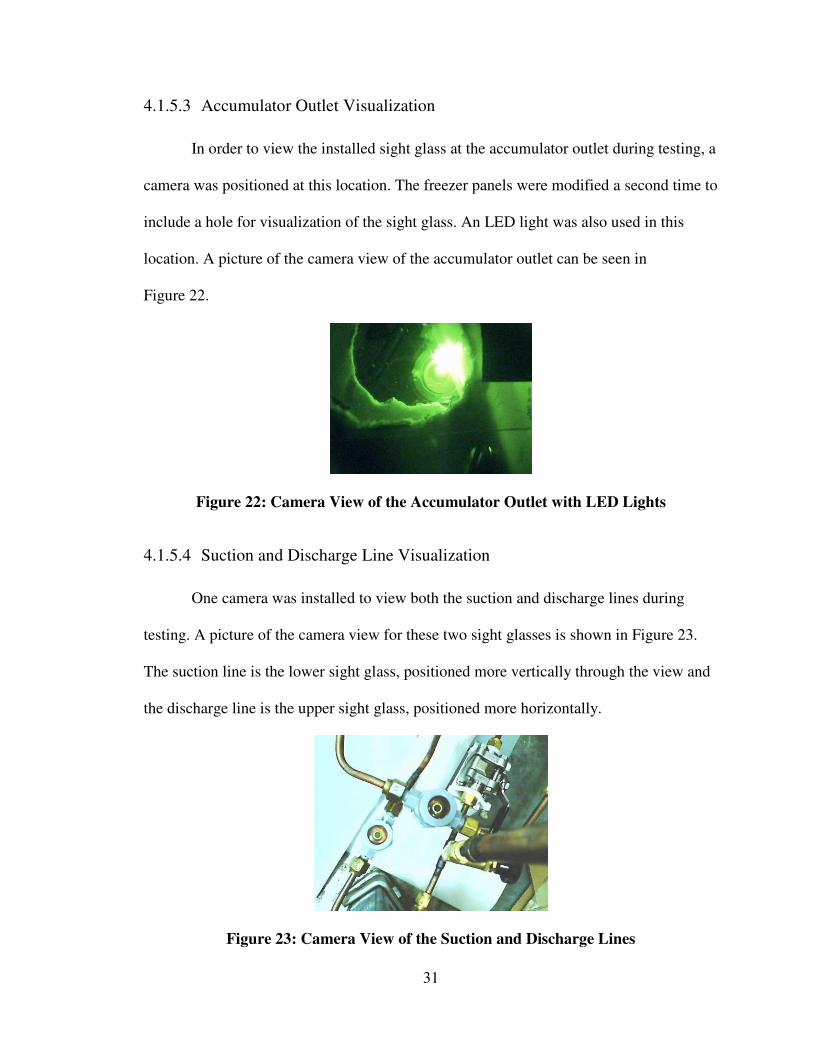
31
4.1.5.3 Accumulator Outlet Visualization
In order to view the installed sight glass at the accumulator outlet during testing, a
camera was positioned at this location. The freezer panels were modified a second time to
include a hole for visualization of the sight glass. An LED light was also used in this
location. A picture of the camera view of the accumulator outlet can be seen in
Figure 22.
Figure 22: Camera View of the Accumulator Outlet with LED Lights
4.1.5.4 Suction and Discharge Line Visualization
One camera was installed to view both the suction and discharge lines during
testing. A picture of the camera view for these two sight glasses is shown in Figure 23.
The suction line is the lower sight glass, positioned more vertically through the view and
the discharge line is the upper sight glass, positioned more horizontally.
Figure 23: Camera View of the Suction and Discharge Lines
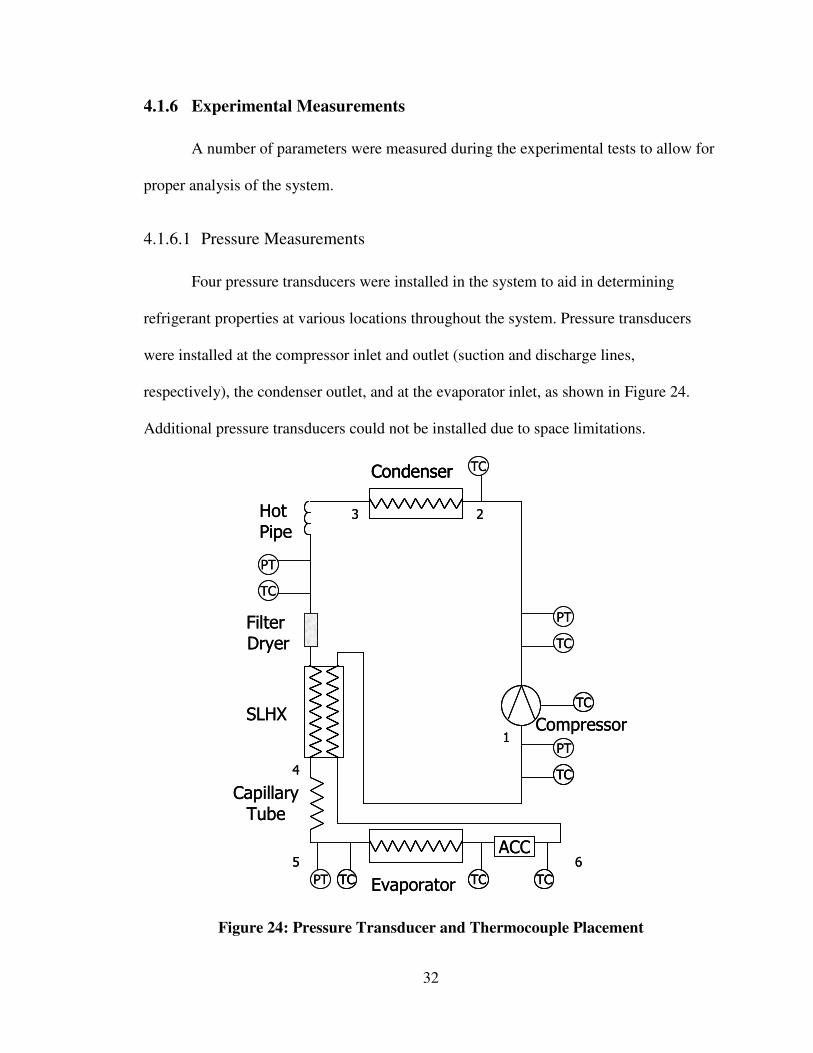
32
4.1.6 Experimental Measurements
A number of parameters were measured during the experimental tests to allow for
proper analysis of the system.
4.1.6.1 Pressure Measurements
Four pressure transducers were installed in the system to aid in determining
refrigerant properties at various locations throughout the system. Pressure transducers
were installed at the compressor inlet and outlet (suction and discharge lines,
respectively), the condenser outlet, and at the evaporator inlet, as shown in Figure 24.
Additional pressure transducers could not be installed due to space limitations.
SLHX
Evaporator
Condenser
Compressor
Filter Dryer
Hot Pipe
Capillary
Tube
PT
PT
PT
PT
TC
TC
TC
TC TC
TC
2
4
3
5
1
6ACC
TC
TCSLHX
Evaporator
CondenserCondenser
Compressor
Filter Dryer
Hot Pipe
Capillary
Tube
PT
PT
PT
PT
TC
TC
TCTC
TCTC TCTC
TC
2
4
3
5
1
6ACC
TCTC
TCTC
Figure 24: Pressure Transducer and Thermocouple Placement
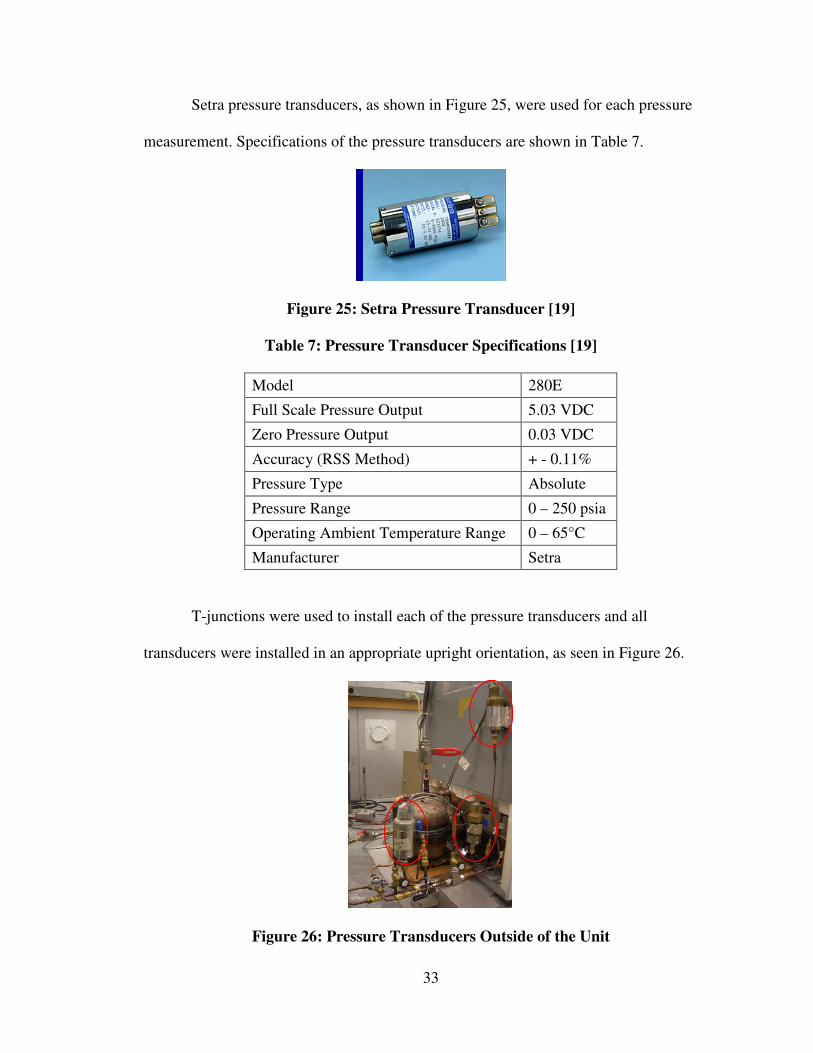
33
Setra pressure transducers, as shown in Figure 25, were used for each pressure
measurement. Specifications of the pressure transducers are shown in Table 7.
Figure 25: Setra Pressure Transducer [19]
Table 7: Pressure Transducer Specifications [19]
Model 280E
Full Scale Pressure Output 5.03 VDC
Zero Pressure Output 0.03 VDC
Accuracy (RSS Method) + - 0.11%
Pressure Type Absolute
Pressure Range 0 – 250 psia
Operating Ambient Temperature Range 0 – 65°C
Manufacturer Setra
T-junctions were used to install each of the pressure transducers and all
transducers were installed in an appropriate upright orientation, as seen in Figure 26.
Figure 26: Pressure Transducers Outside of the Unit
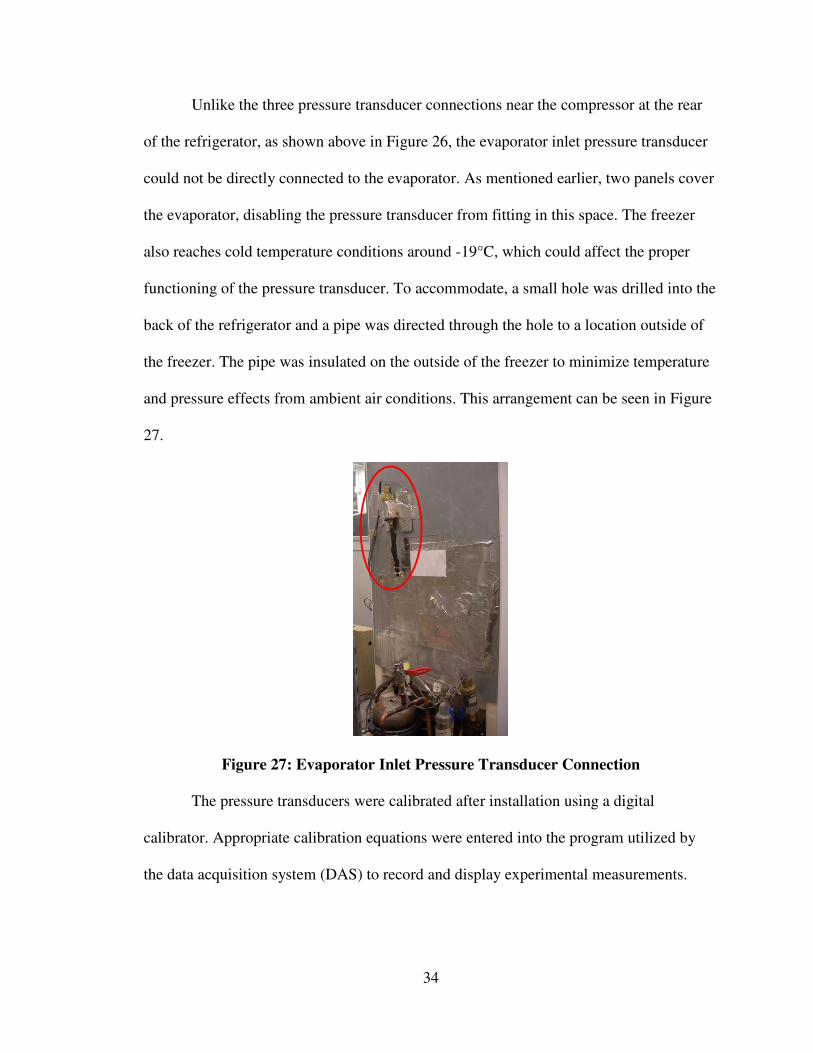
34
Unlike the three pressure transducer connections near the compressor at the rear
of the refrigerator, as shown above in Figure 26, the evaporator inlet pressure transducer
could not be directly connected to the evaporator. As mentioned earlier, two panels cover
the evaporator, disabling the pressure transducer from fitting in this space. The freezer
also reaches cold temperature conditions around -19°C, which could affect the proper
functioning of the pressure transducer. To accommodate, a small hole was drilled into the
back of the refrigerator and a pipe was directed through the hole to a location outside of
the freezer. The pipe was insulated on the outside of the freezer to minimize temperature
and pressure effects from ambient air conditions. This arrangement can be seen in Figure
27.
Figure 27: Evaporator Inlet Pressure Transducer Connection
The pressure transducers were calibrated after installation using a digital
calibrator. Appropriate calibration equations were entered into the program utilized by
the data acquisition system (DAS) to record and display experimental measurements.
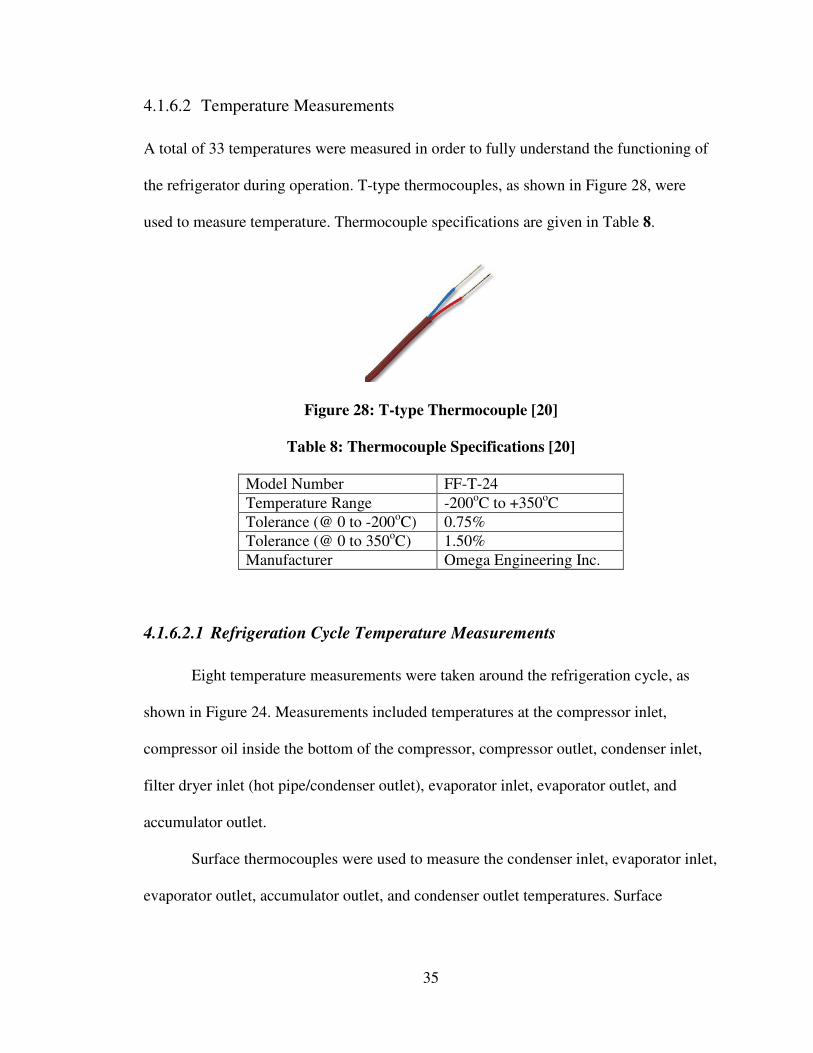
35
4.1.6.2 Temperature Measurements
A total of 33 temperatures were measured in order to fully understand the functioning of
the refrigerator during operation. T-type thermocouples, as shown in Figure 28, were
used to measure temperature. Thermocouple specifications are given in Table 8.
Figure 28: T-type Thermocouple [20]
Table 8: Thermocouple Specifications [20]
Model Number FF-T-24
Temperature Range -200oC to +350oC
Tolerance (@ 0 to -200oC) 0.75%
Tolerance (@ 0 to 350oC) 1.50%
Manufacturer Omega Engineering Inc.
4.1.6.2.1 Refrigeration Cycle Temperature Measurements
Eight temperature measurements were taken around the refrigeration cycle, as
shown in Figure 24. Measurements included temperatures at the compressor inlet,
compressor oil inside the bottom of the compressor, compressor outlet, condenser inlet,
filter dryer inlet (hot pipe/condenser outlet), evaporator inlet, evaporator outlet, and
accumulator outlet.
Surface thermocouples were used to measure the condenser inlet, evaporator inlet,
evaporator outlet, accumulator outlet, and condenser outlet temperatures. Surface
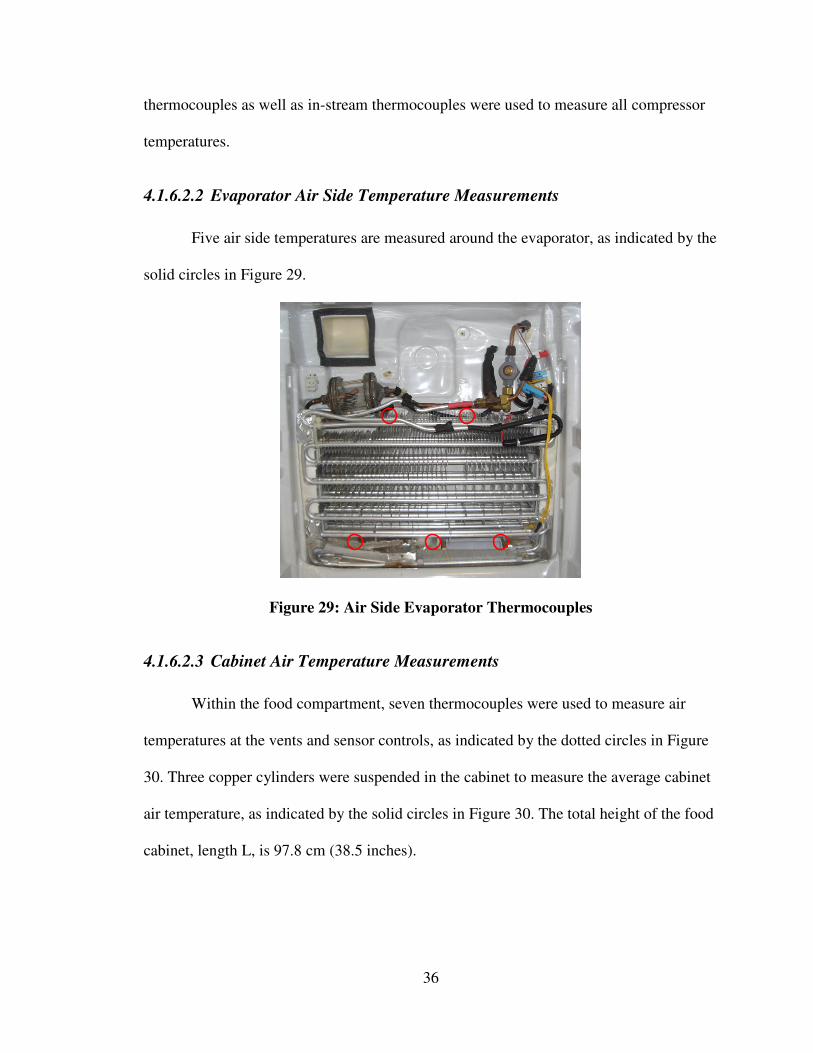
36
thermocouples as well as in-stream thermocouples were used to measure all compressor
temperatures.
4.1.6.2.2 Evaporator Air Side Temperature Measurements
Five air side temperatures are measured around the evaporator, as indicated by the
solid circles in Figure 29.
Figure 29: Air Side Evaporator Thermocouples
4.1.6.2.3 Cabinet Air Temperature Measurements
Within the food compartment, seven thermocouples were used to measure air
temperatures at the vents and sensor controls, as indicated by the dotted circles in Figure
30. Three copper cylinders were suspended in the cabinet to measure the average cabinet
air temperature, as indicated by the solid circles in Figure 30. The total height of the food
cabinet, length L, is 97.8 cm (38.5 inches).
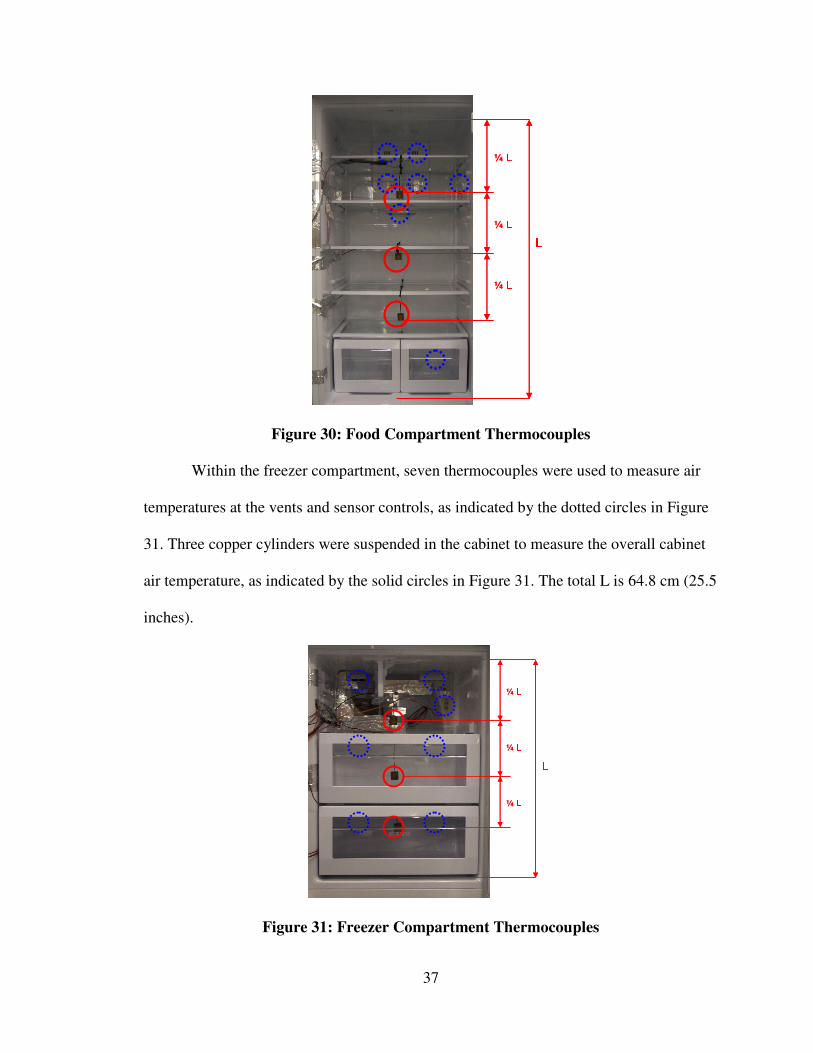
37
LLLL¼ LLLL¼ LLLL¼ LLLL LLLL¼ LLLL¼ LLLL¼ LLLL
Figure 30: Food Compartment Thermocouples
Within the freezer compartment, seven thermocouples were used to measure air
temperatures at the vents and sensor controls, as indicated by the dotted circles in Figure
31. Three copper cylinders were suspended in the cabinet to measure the overall cabinet
air temperature, as indicated by the solid circles in Figure 31. The total L is 64.8 cm (25.5
inches).
LLLL¼ LLLL¼ LLLL¼ LLLL LLLL¼ LLLL¼ LLLL¼ LLLL
Figure 31: Freezer Compartment Thermocouples
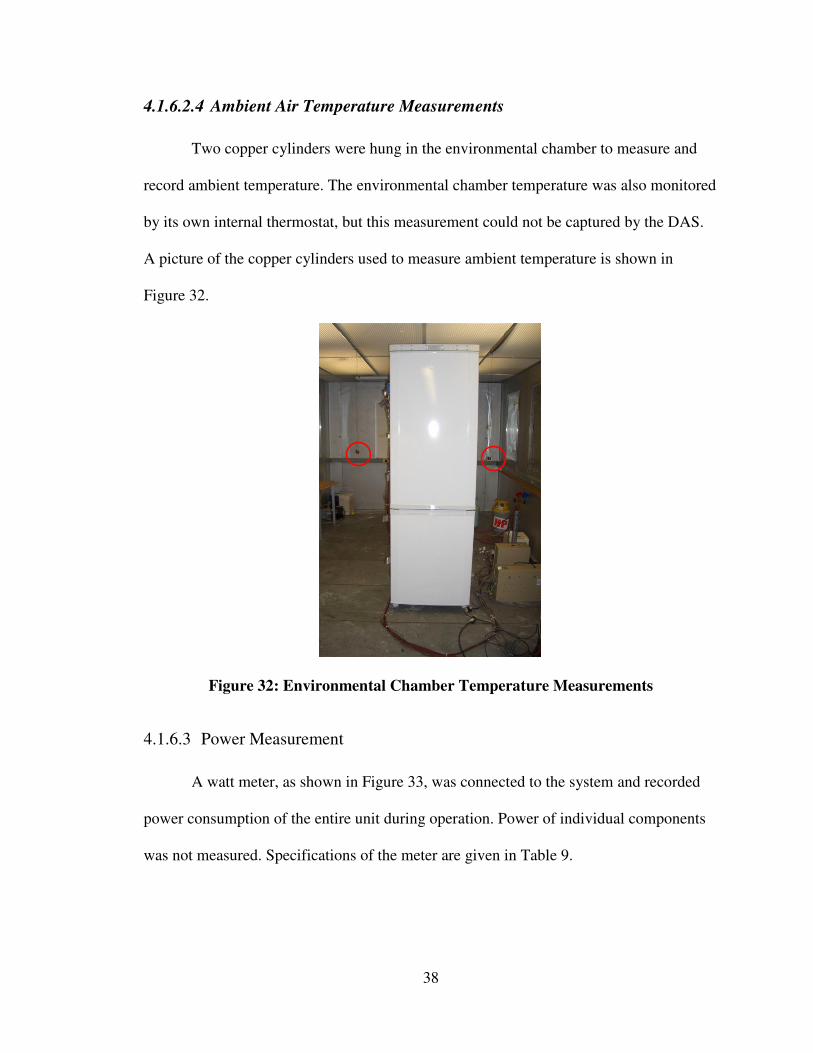
38
4.1.6.2.4 Ambient Air Temperature Measurements
Two copper cylinders were hung in the environmental chamber to measure and
record ambient temperature. The environmental chamber temperature was also monitored
by its own internal thermostat, but this measurement could not be captured by the DAS.
A picture of the copper cylinders used to measure ambient temperature is shown in
Figure 32.
Figure 32: Environmental Chamber Temperature Measurements
4.1.6.3 Power Measurement
A watt meter, as shown in Figure 33, was connected to the system and recorded
power consumption of the entire unit during operation. Power of individual components
was not measured. Specifications of the meter are given in Table 9.
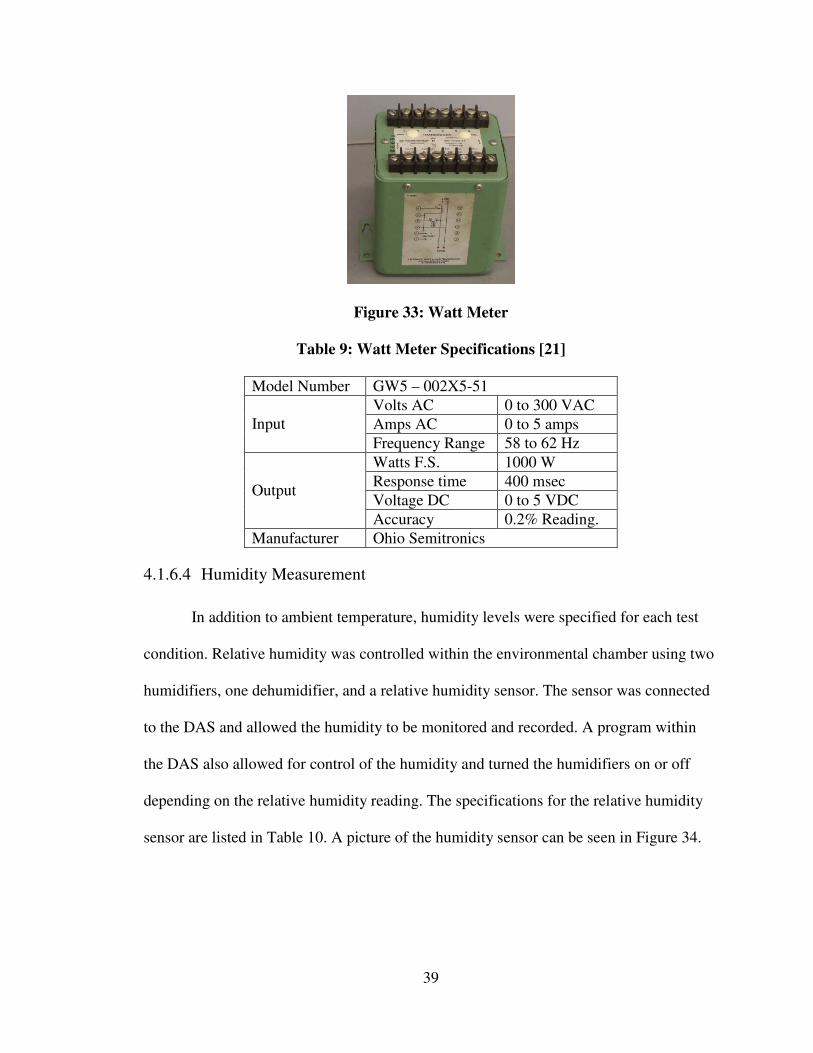
39
Figure 33: Watt Meter
Table 9: Watt Meter Specifications [21]
Model Number GW5 – 002X5-51
Volts AC 0 to 300 VAC
Amps AC 0 to 5 amps Input
Frequency Range 58 to 62 Hz
Watts F.S. 1000 W
Response time 400 msec
Voltage DC 0 to 5 VDC Output
Accuracy 0.2% Reading.
Manufacturer Ohio Semitronics
4.1.6.4 Humidity Measurement
In addition to ambient temperature, humidity levels were specified for each test
condition. Relative humidity was controlled within the environmental chamber using two
humidifiers, one dehumidifier, and a relative humidity sensor. The sensor was connected
to the DAS and allowed the humidity to be monitored and recorded. A program within
the DAS also allowed for control of the humidity and turned the humidifiers on or off
depending on the relative humidity reading. The specifications for the relative humidity
sensor are listed in Table 10. A picture of the humidity sensor can be seen in Figure 34.
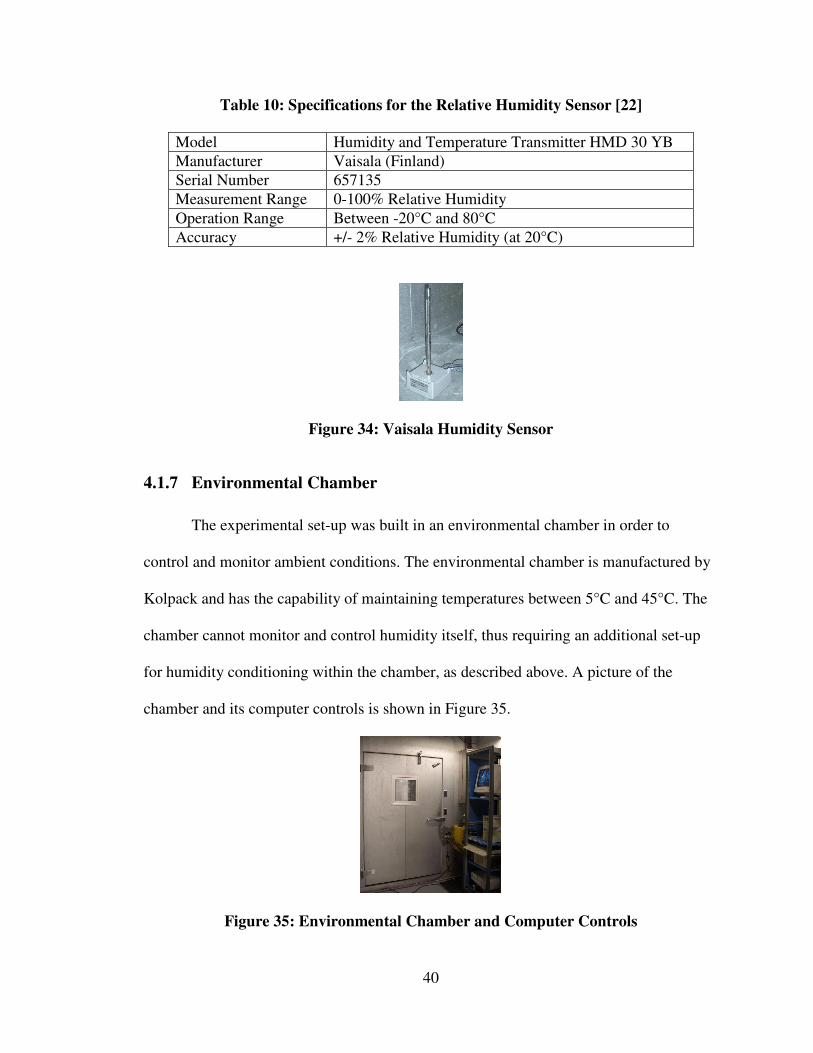
40
Table 10: Specifications for the Relative Humidity Sensor [22]
Model Humidity and Temperature Transmitter HMD 30 YB
Manufacturer Vaisala (Finland)
Serial Number 657135
Measurement Range 0-100% Relative Humidity
Operation Range Between -20°C and 80°C
Accuracy +/- 2% Relative Humidity (at 20°C)
Figure 34: Vaisala Humidity Sensor
4.1.7 Environmental Chamber
The experimental set-up was built in an environmental chamber in order to
control and monitor ambient conditions. The environmental chamber is manufactured by
Kolpack and has the capability of maintaining temperatures between 5°C and 45°C. The
chamber cannot monitor and control humidity itself, thus requiring an additional set-up
for humidity conditioning within the chamber, as described above. A picture of the
chamber and its computer controls is shown in Figure 35.
Figure 35: Environmental Chamber and Computer Controls
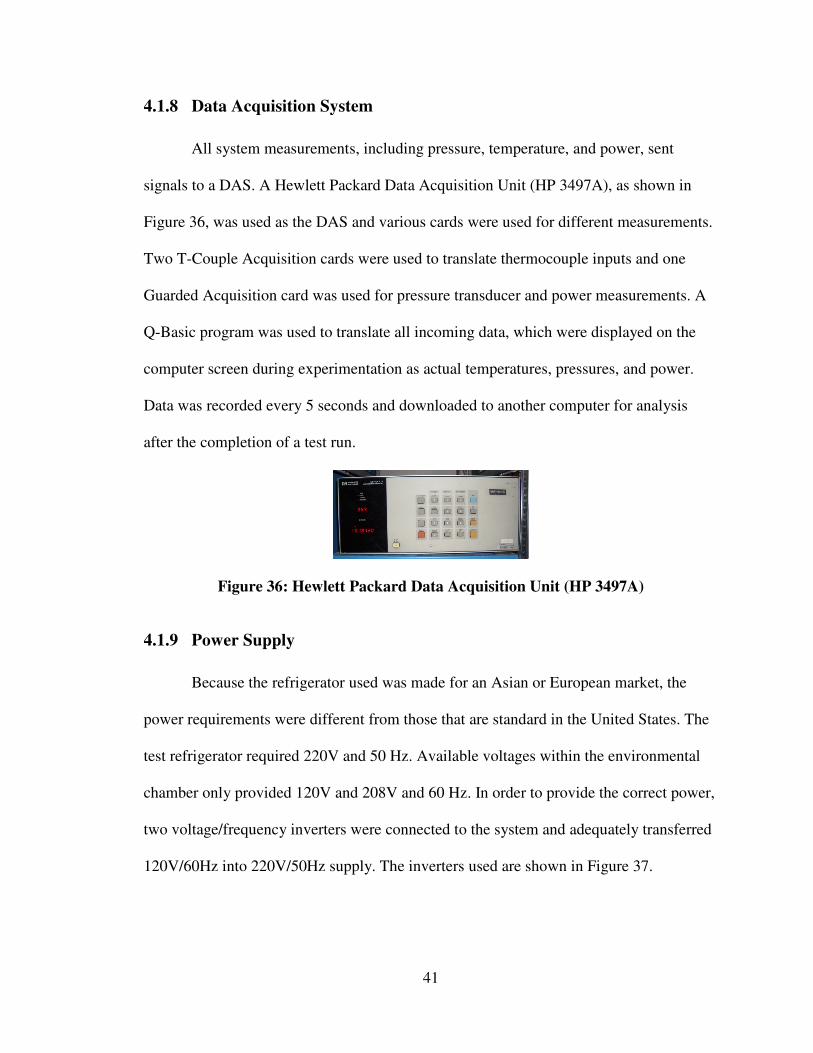
41
4.1.8 Data Acquisition System
All system measurements, including pressure, temperature, and power, sent
signals to a DAS. A Hewlett Packard Data Acquisition Unit (HP 3497A), as shown in
Figure 36, was used as the DAS and various cards were used for different measurements.
Two T-Couple Acquisition cards were used to translate thermocouple inputs and one
Guarded Acquisition card was used for pressure transducer and power measurements. A
Q-Basic program was used to translate all incoming data, which were displayed on the
computer screen during experimentation as actual temperatures, pressures, and power.
Data was recorded every 5 seconds and downloaded to another computer for analysis
after the completion of a test run.
Figure 36: Hewlett Packard Data Acquisition Unit (HP 3497A)
4.1.9 Power Supply
Because the refrigerator used was made for an Asian or European market, the
power requirements were different from those that are standard in the United States. The
test refrigerator required 220V and 50 Hz. Available voltages within the environmental
chamber only provided 120V and 208V and 60 Hz. In order to provide the correct power,
two voltage/frequency inverters were connected to the system and adequately transferred
120V/60Hz into 220V/50Hz supply. The inverters used are shown in Figure 37.
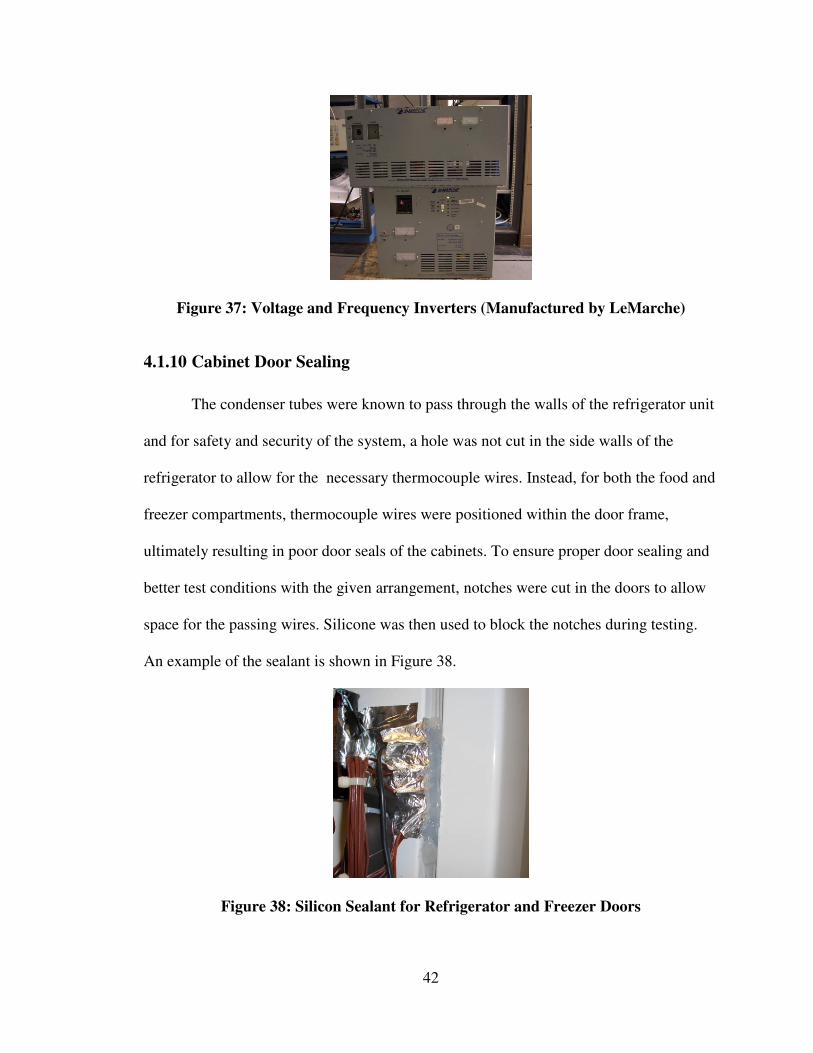
42
Figure 37: Voltage and Frequency Inverters (Manufactured by LeMarche)
4.1.10 Cabinet Door Sealing
The condenser tubes were known to pass through the walls of the refrigerator unit
and for safety and security of the system, a hole was not cut in the side walls of the
refrigerator to allow for the necessary thermocouple wires. Instead, for both the food and
freezer compartments, thermocouple wires were positioned within the door frame,
ultimately resulting in poor door seals of the cabinets. To ensure proper door sealing and
better test conditions with the given arrangement, notches were cut in the doors to allow
space for the passing wires. Silicone was then used to block the notches during testing.
An example of the sealant is shown in Figure 38.
Figure 38: Silicon Sealant for Refrigerator and Freezer Doors
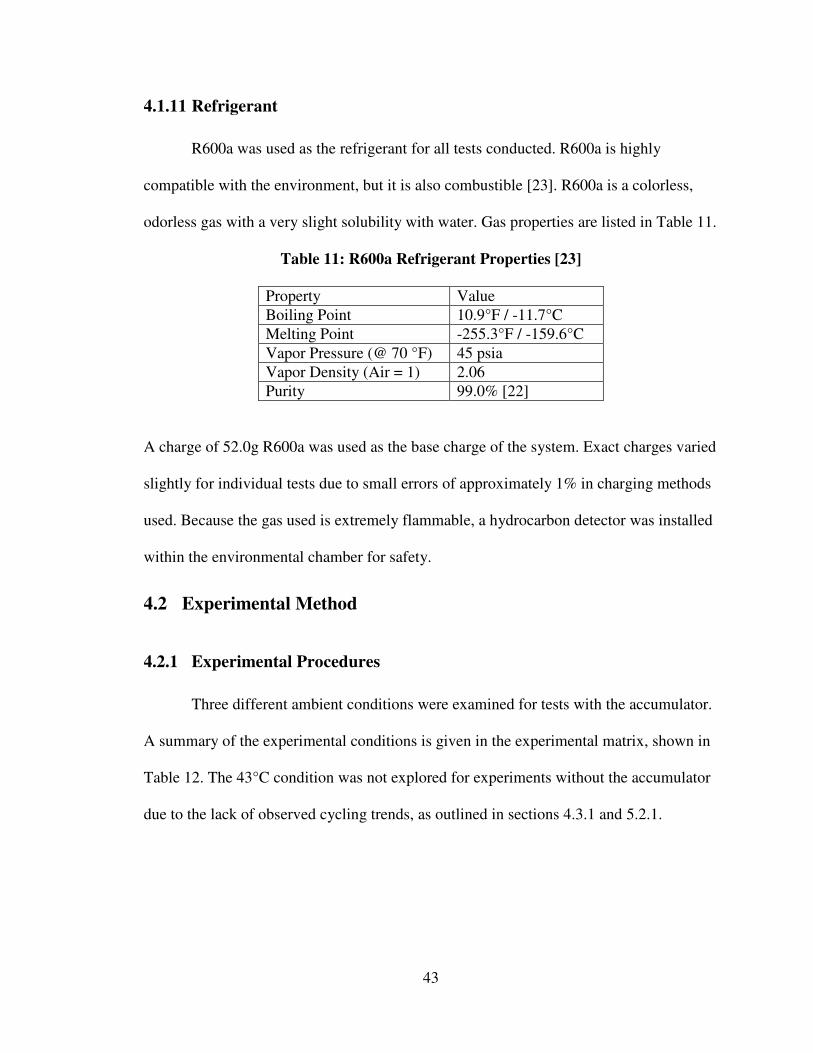
43
4.1.11 Refrigerant
R600a was used as the refrigerant for all tests conducted. R600a is highly
compatible with the environment, but it is also combustible [23]. R600a is a colorless,
odorless gas with a very slight solubility with water. Gas properties are listed in Table 11.
Table 11: R600a Refrigerant Properties [23]
Property Value
Boiling Point 10.9°F / -11.7°C
Melting Point -255.3°F / -159.6°C
Vapor Pressure (@ 70 °F) 45 psia
Vapor Density (Air = 1) 2.06
Purity 99.0% [22]
A charge of 52.0g R600a was used as the base charge of the system. Exact charges varied
slightly for individual tests due to small errors of approximately 1% in charging methods
used. Because the gas used is extremely flammable, a hydrocarbon detector was installed
within the environmental chamber for safety.
4.2 Experimental Method
4.2.1 Experimental Procedures
Three different ambient conditions were examined for tests with the accumulator.
A summary of the experimental conditions is given in the experimental matrix, shown in
Table 12. The 43°C condition was not explored for experiments without the accumulator
due to the lack of observed cycling trends, as outlined in sections 4.3.1 and 5.2.1.
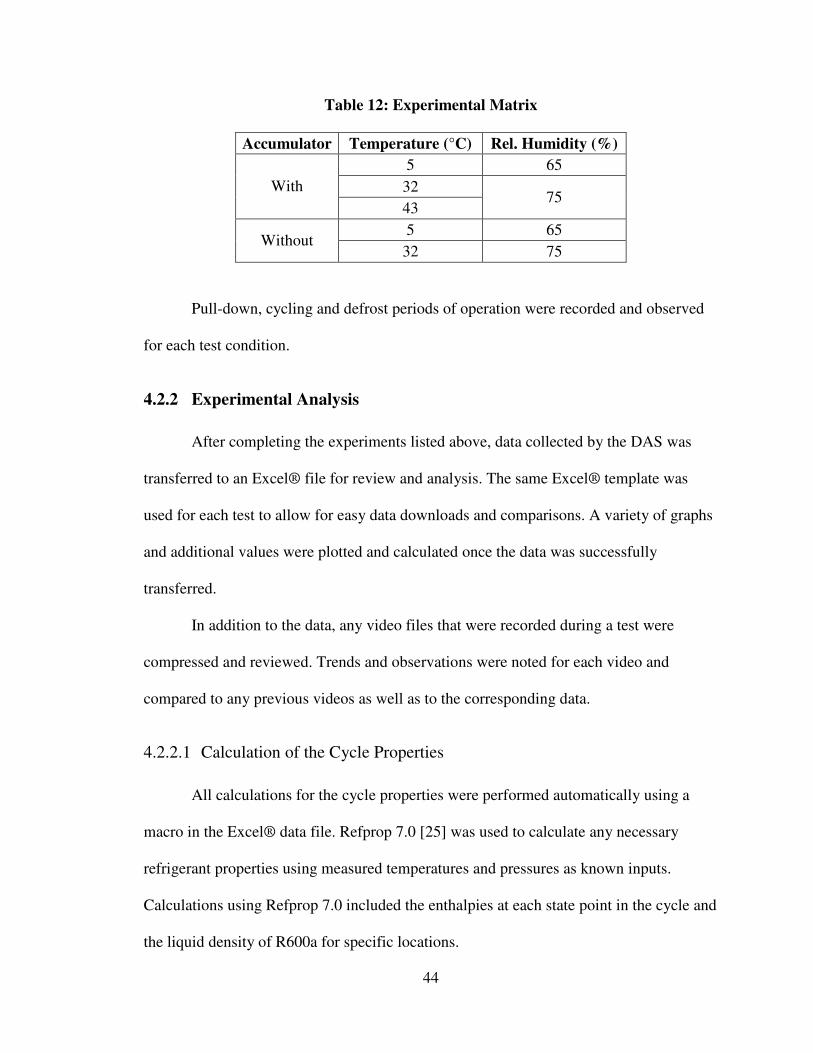
44
Table 12: Experimental Matrix
Accumulator Temperature (°C) Rel. Humidity (%)
5 65
32 With
43 75
5 65 Without
32 75
Pull-down, cycling and defrost periods of operation were recorded and observed
for each test condition.
4.2.2 Experimental Analysis
After completing the experiments listed above, data collected by the DAS was
transferred to an Excel® file for review and analysis. The same Excel® template was
used for each test to allow for easy data downloads and comparisons. A variety of graphs
and additional values were plotted and calculated once the data was successfully
transferred.
In addition to the data, any video files that were recorded during a test were
compressed and reviewed. Trends and observations were noted for each video and
compared to any previous videos as well as to the corresponding data.
4.2.2.1 Calculation of the Cycle Properties
All calculations for the cycle properties were performed automatically using a
macro in the Excel® data file. Refprop 7.0 [25] was used to calculate any necessary
refrigerant properties using measured temperatures and pressures as known inputs.
Calculations using Refprop 7.0 included the enthalpies at each state point in the cycle and
the liquid density of R600a for specific locations.
45
As shown in Figure 24, both pressure and temperature measurements were taken
at points 1, 2, 3, and 5 in the system, as labeled in Figure 39. Enthalpies for points 1, 2,
and 3 were directly calculated with Refprop 7.0 using the measured pressure and
temperature values. Enthalpy at state point 5, however, could not be directly calculated
with pressure and temperature as the point is always in a two-phase condition, as
indicated by the P-h diagram in Figure 40. Several assumptions were made to evaluate
the enthalpies for the remainder of the system.
First, assuming no pressure drop across the SLHX, the enthalpy for point 6 was
calculated using the direct temperature measurement at this point and the pressure
measurement for state point 1. Assuming the heat transferred across the SLHX is equal
on both sides, the following equation was then used to find the enthalpy for state point 4:
6143 hhhh −=− (1)
Assuming isenthalpic expansion, the enthalpy at state 5 was set equal to the enthalpy at
state 4.
The above analysis results in a P-h diagram similar to that shown in Figure 40.
Exact pressures and temperatures depend on specific operating conditions and ambient
temperature.
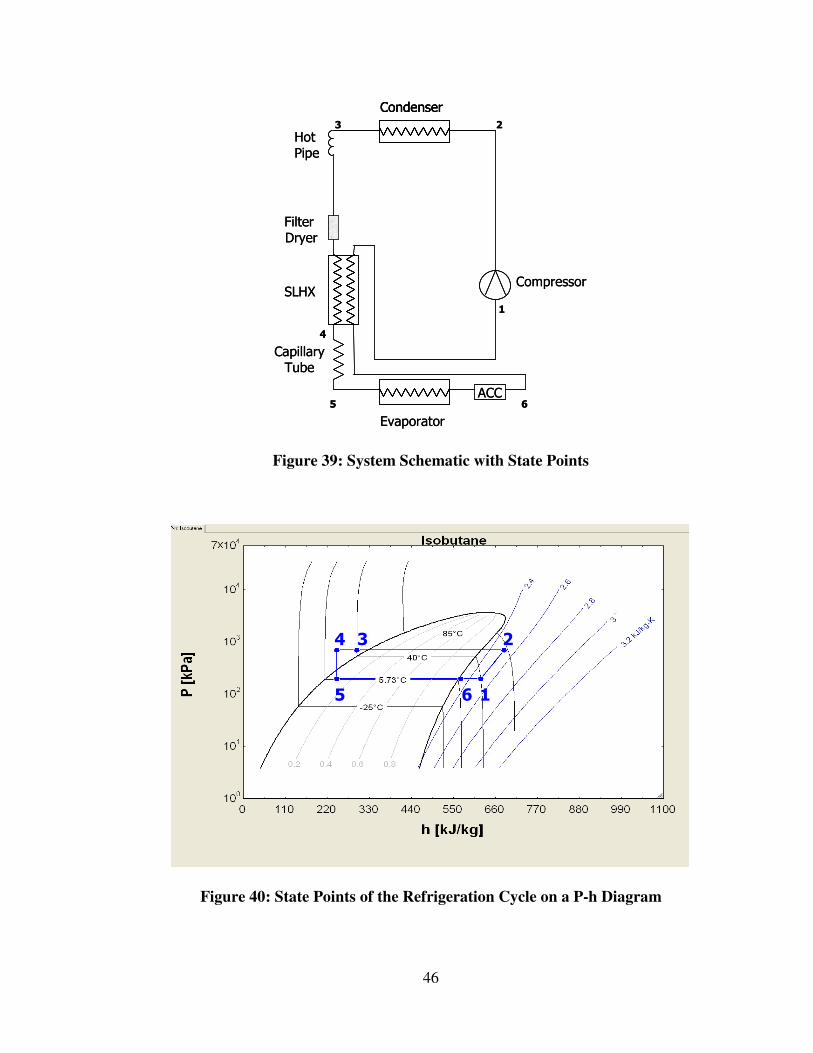
46
SLHX
Evaporator
Condenser
Compressor
Filter
Dryer
Hot
Pipe
Capillary
Tube
2
4
3
5
1
6
ACC
SLHX
Evaporator
CondenserCondenser
Compressor
Filter
Dryer
Hot
Pipe
Capillary
Tube
2
4
3
5
1
6
ACC
Figure 39: System Schematic with State Points
1
23
65
4
1
23
65
4
Figure 40: State Points of the Refrigeration Cycle on a P-h Diagram
47
4.2.2.1.1 Superheat and Subcooling Calculations
Total degrees of superheat were calculated using the following equation:
1,1sup Psaterheat TTT −= (2)
where T1 is the temperature at state point 1 and Tsat, P1, which was calculated using
Refprop 7.0, is the saturated temperature at the pressure for state point 1, P1.
Degrees of subcooling were calculated using equation 3:
4, 3TTT Psatsubcooling −= (3)
where Tsat, P3 is the saturated temperature using the pressure at state point 3, P3, and T4 is
the temperature at state 4 calculated by Refprop 7.0 using the known pressure at state
point 3, P3, and the calculated enthalpy, h4.
4.2.2.1.2 Specific Capacity Calculations
Because a compressor map was not provided by the manufacturer, the mass flow
was not calculated for the system. Consequently, the units for capacity remain as those
for specific capacity, kJ/kg, as opposed to kJ/s. In order to determine evaporator and
condenser specific capacity, the following equations were used:
56 hhqevap −= (4)
32 hhqcond −= (5)
where qevap is the evaporator specific capacity, qcond is the condenser specific capacity,
and the h values correspond to the state points as shown in Figure 39 and Figure 40.
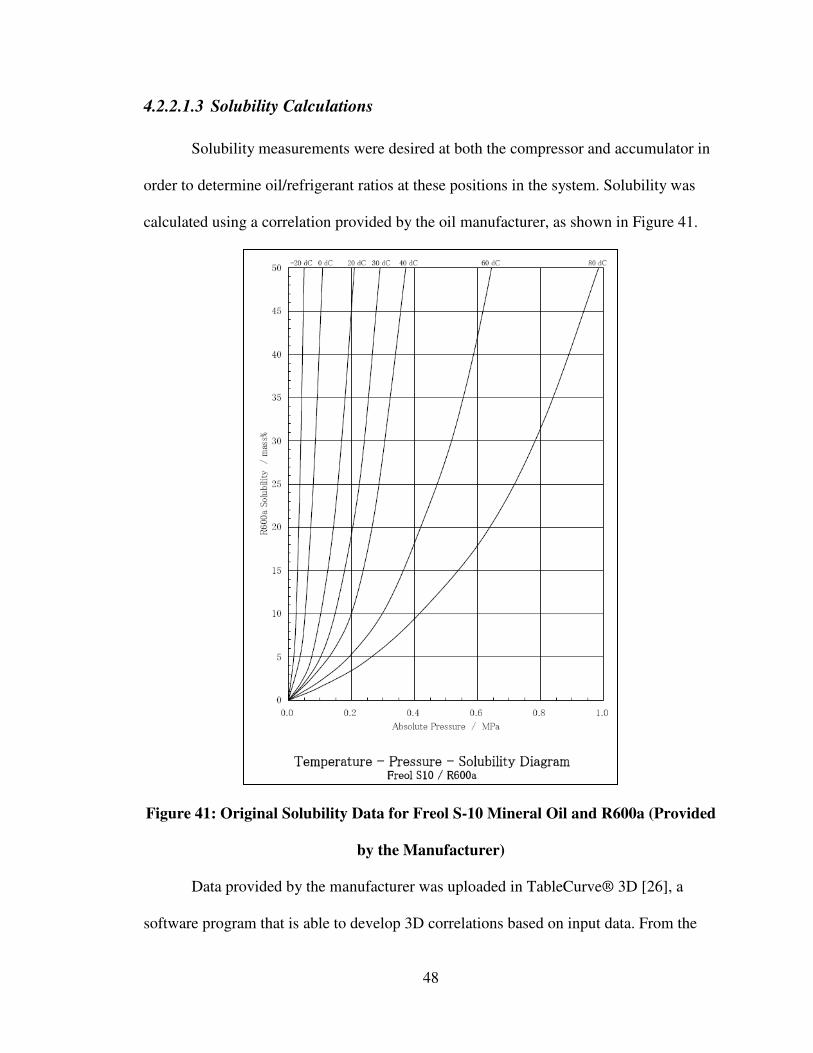
48
4.2.2.1.3 Solubility Calculations
Solubility measurements were desired at both the compressor and accumulator in
order to determine oil/refrigerant ratios at these positions in the system. Solubility was
calculated using a correlation provided by the oil manufacturer, as shown in Figure 41.
Figure 41: Original Solubility Data for Freol S-10 Mineral Oil and R600a (Provided
by the Manufacturer)
Data provided by the manufacturer was uploaded in TableCurve® 3D [26], a
software program that is able to develop 3D correlations based on input data. From the
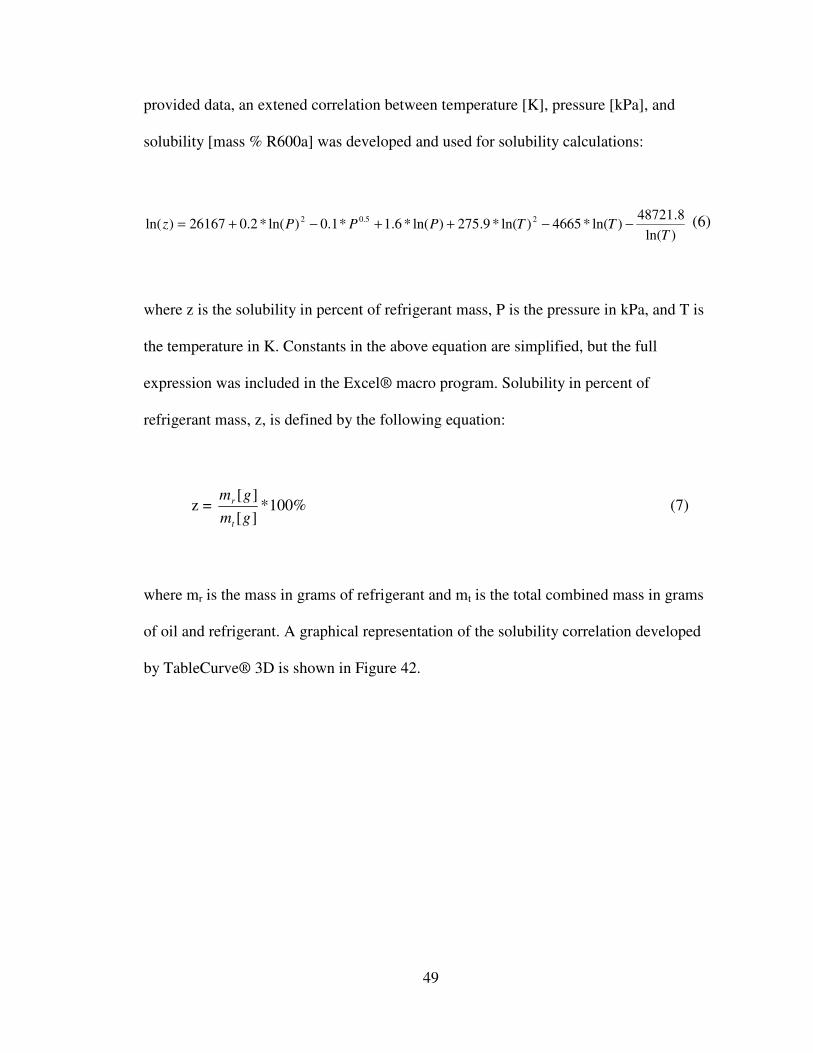
49
provided data, an extened correlation between temperature [K], pressure [kPa], and
solubility [mass % R600a] was developed and used for solubility calculations:
)ln(
8.48721)ln(*4665)ln(*9.275)ln(*6.1*1.0)ln(*2.026167)ln( 25.02
TTTPPPz −−++−+= (6)
where z is the solubility in percent of refrigerant mass, P is the pressure in kPa, and T is
the temperature in K. Constants in the above equation are simplified, but the full
expression was included in the Excel® macro program. Solubility in percent of
refrigerant mass, z, is defined by the following equation:
z = %100*][
][
gm
gm
t
r (7)
where mr is the mass in grams of refrigerant and mt is the total combined mass in grams
of oil and refrigerant. A graphical representation of the solubility correlation developed
by TableCurve® 3D is shown in Figure 42.
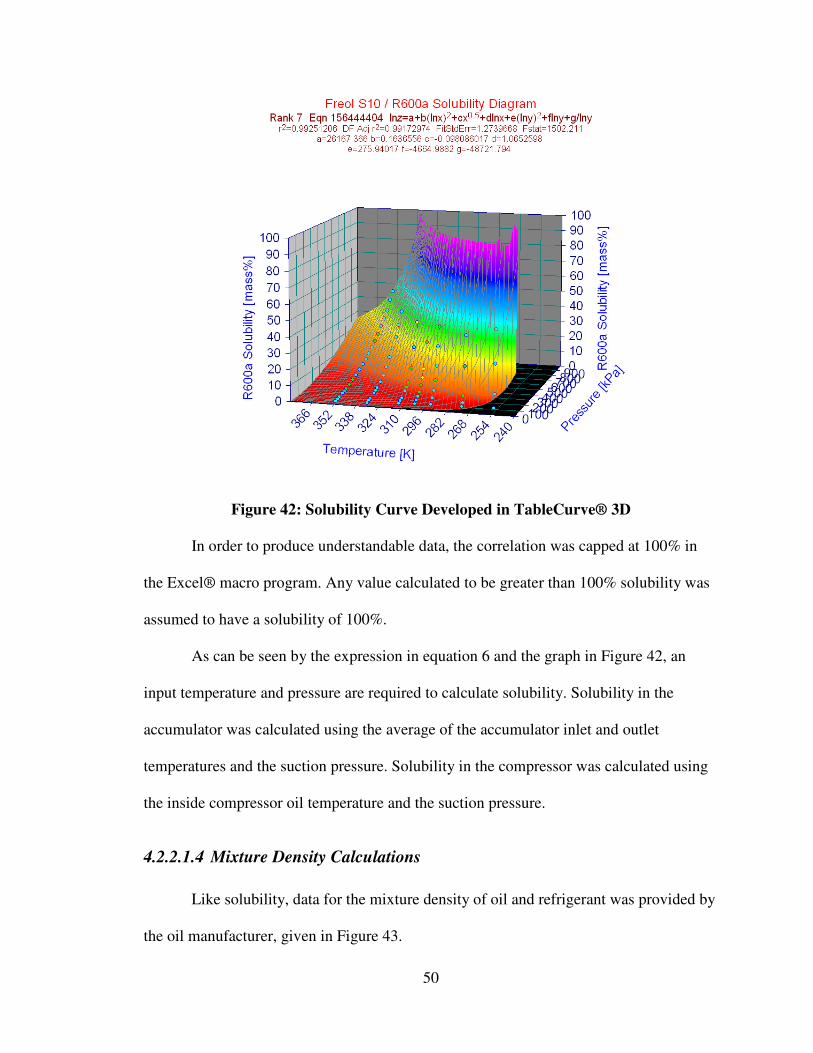
50
Figure 42: Solubility Curve Developed in TableCurve® 3D
In order to produce understandable data, the correlation was capped at 100% in
the Excel® macro program. Any value calculated to be greater than 100% solubility was
assumed to have a solubility of 100%.
As can be seen by the expression in equation 6 and the graph in Figure 42, an
input temperature and pressure are required to calculate solubility. Solubility in the
accumulator was calculated using the average of the accumulator inlet and outlet
temperatures and the suction pressure. Solubility in the compressor was calculated using
the inside compressor oil temperature and the suction pressure.
4.2.2.1.4 Mixture Density Calculations
Like solubility, data for the mixture density of oil and refrigerant was provided by
the oil manufacturer, given in Figure 43.
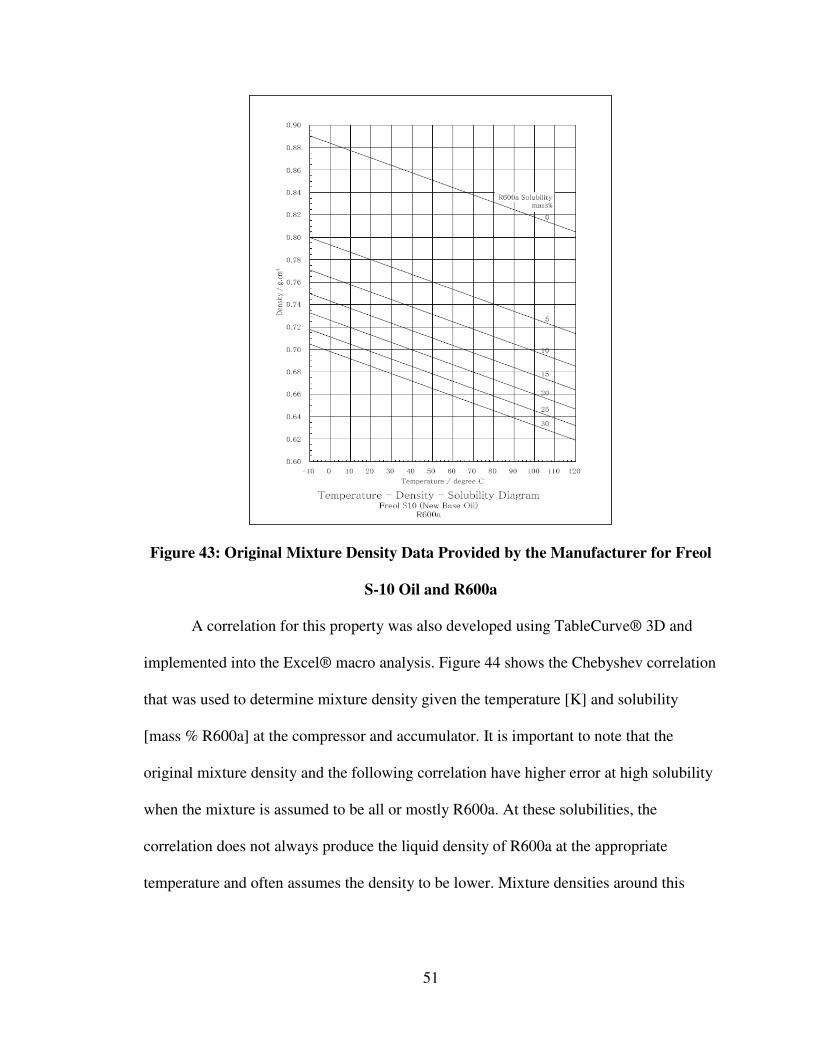
51
Figure 43: Original Mixture Density Data Provided by the Manufacturer for Freol
S-10 Oil and R600a
A correlation for this property was also developed using TableCurve® 3D and
implemented into the Excel® macro analysis. Figure 44 shows the Chebyshev correlation
that was used to determine mixture density given the temperature [K] and solubility
[mass % R600a] at the compressor and accumulator. It is important to note that the
original mixture density and the following correlation have higher error at high solubility
when the mixture is assumed to be all or mostly R600a. At these solubilities, the
correlation does not always produce the liquid density of R600a at the appropriate
temperature and often assumes the density to be lower. Mixture densities around this
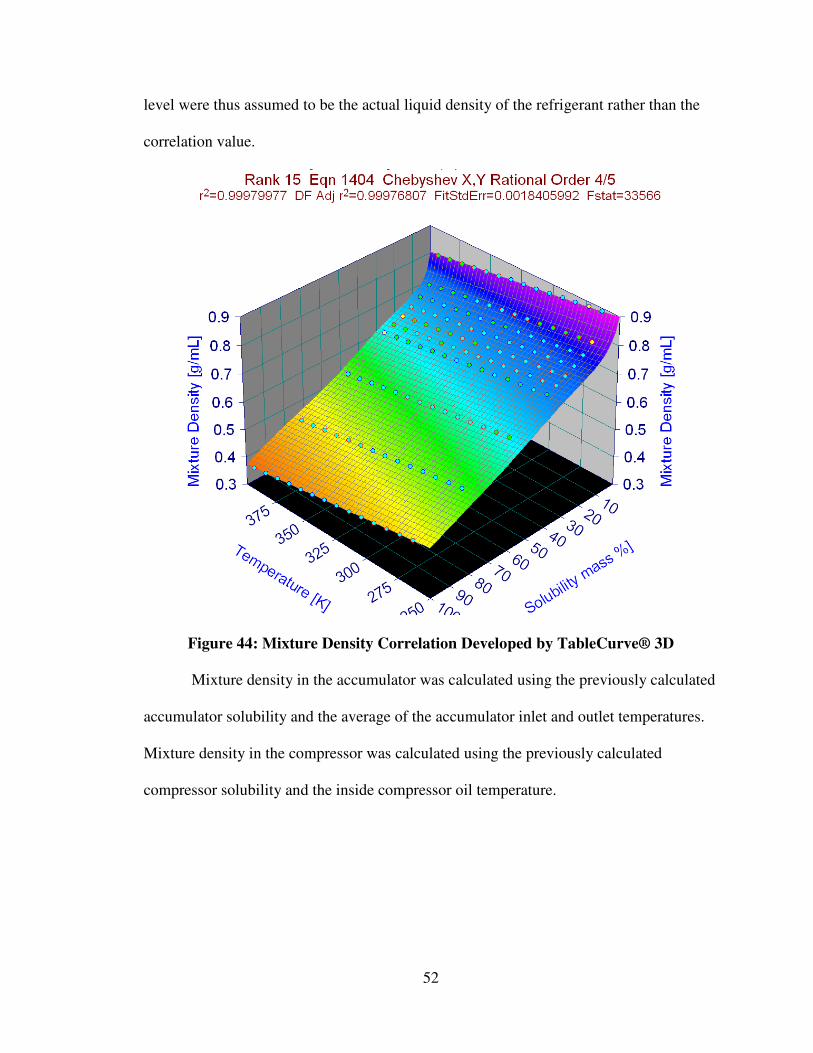
52
level were thus assumed to be the actual liquid density of the refrigerant rather than the
correlation value.
Figure 44: Mixture Density Correlation Developed by TableCurve® 3D
Mixture density in the accumulator was calculated using the previously calculated
accumulator solubility and the average of the accumulator inlet and outlet temperatures.
Mixture density in the compressor was calculated using the previously calculated
compressor solubility and the inside compressor oil temperature.
53
4.2.2.1.5 Ideal Density and Correction Factor Calculations
ASHRAE, which publishes and develops a number of standards for testing and
analyzing refrigeration and HVAC equipment, states that the ideal mixture density for an
oil and refrigerant mixture is as follows:
)1
(1−
+
=
r
o
o
id
wρ
ρ
ρρ (8)
where ρid is the ideal density, ρo is the density of the pure oil at the solution temperature,
ρr is the density of the pure liquid refrigerant at the solution temperature, and w is the
mass fraction of refrigerant in the solution [6]. Most actual mixture densities are found
from ASHRAE using this equation and dividing it by a correction factor. Because actual
mixture density data was available for these experiments, both the actual density based on
the correlation and the ideal density based on equation 8 were calculated. A correction
factor was then calculated using equation 9:
m
idAρ
ρ= (9)
where A is the correction factor and ρm is the actual mixture density found using the
correlation outlined above.
4.2.2.1.6 Refrigerant and Oil Mass Calculations
It was ultimately desired to know the approximate amount of oil and refrigerant in
the compressor and accumulator during each stage of the refrigeration cycle, including
the pull-down, cycling, and defrost periods. In order to calculate the mass of refrigerant
and oil in each localized volume, information corresponding to specified data points was
gathered from the video files. Using the video images, an approximate volume of total
54
liquid (Vt) was estimated for both the compressor and accumulator. Knowing the mixture
density from the above correlation, the total mass of oil and liquid refrigerant (mt) can be
determined from the following equation:
t
t
mV
m=ρ (10)
Because the solubility at a given temperature and pressure is also known using the given
correlation in equation 6, the refrigerant mass (mr) can be calculated from equation (7).
The oil mass (mo) is calculated by subtracting the refrigerant mass from the total mass
(mt). These calculations are represented below:
)%100
(**z
Vm tmr ρ= (11)
rto mmm −= (12)
4.2.2.2 Uncertainty Analysis
Uncertainty analysis was completed for a 5°C and 32°C ambient condition test
with the accumulator. The 5°C test used had an approximate charge of 52.0g and the
32°C test had an approximate charge of 52.8g. Random and systematic errors for
representative pressures, temperatures and power were calculated. Specifically, the
suction pressure (Psuc), discharge pressure (Pdis), instream discharge temperature (Tdis, i)
and surface evaporator inlet temperature (Tevap, s) were used for error analysis. For
random error calculations, average values were calculated during the compressor-on time
period for a series of 5 consecutive cycles, as shown in Figure 45 and Figure 46. Average
values for the compressor-on time period are shown in Table 13 and Table 14 and the
error analyses are given in Table 15 and Table 16.
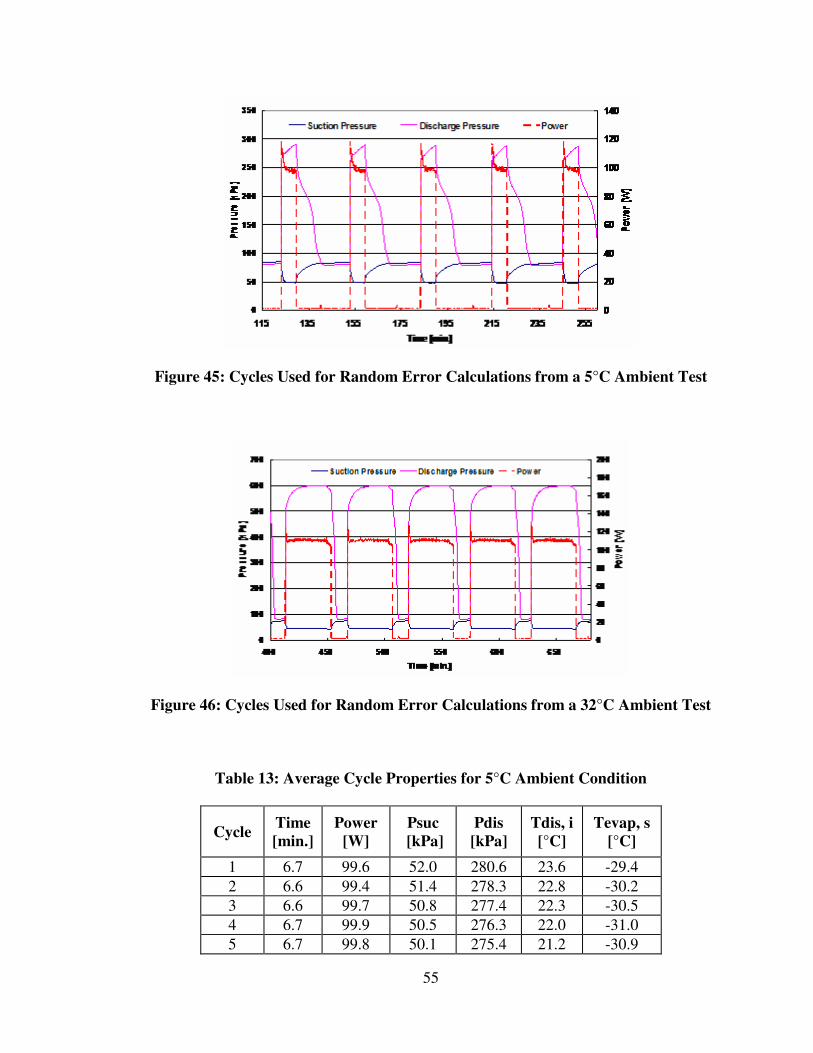
55
Figure 45: Cycles Used for Random Error Calculations from a 5°C Ambient Test
Figure 46: Cycles Used for Random Error Calculations from a 32°C Ambient Test
Table 13: Average Cycle Properties for 5°C Ambient Condition
Cycle Time
[min.]
Power
[W]
Psuc
[kPa]
Pdis
[kPa]
Tdis, i
[°C]
Tevap, s
[°C]
1 6.7 99.6 52.0 280.6 23.6 -29.4
2 6.6 99.4 51.4 278.3 22.8 -30.2
3 6.6 99.7 50.8 277.4 22.3 -30.5
4 6.7 99.9 50.5 276.3 22.0 -31.0
5 6.7 99.8 50.1 275.4 21.2 -30.9
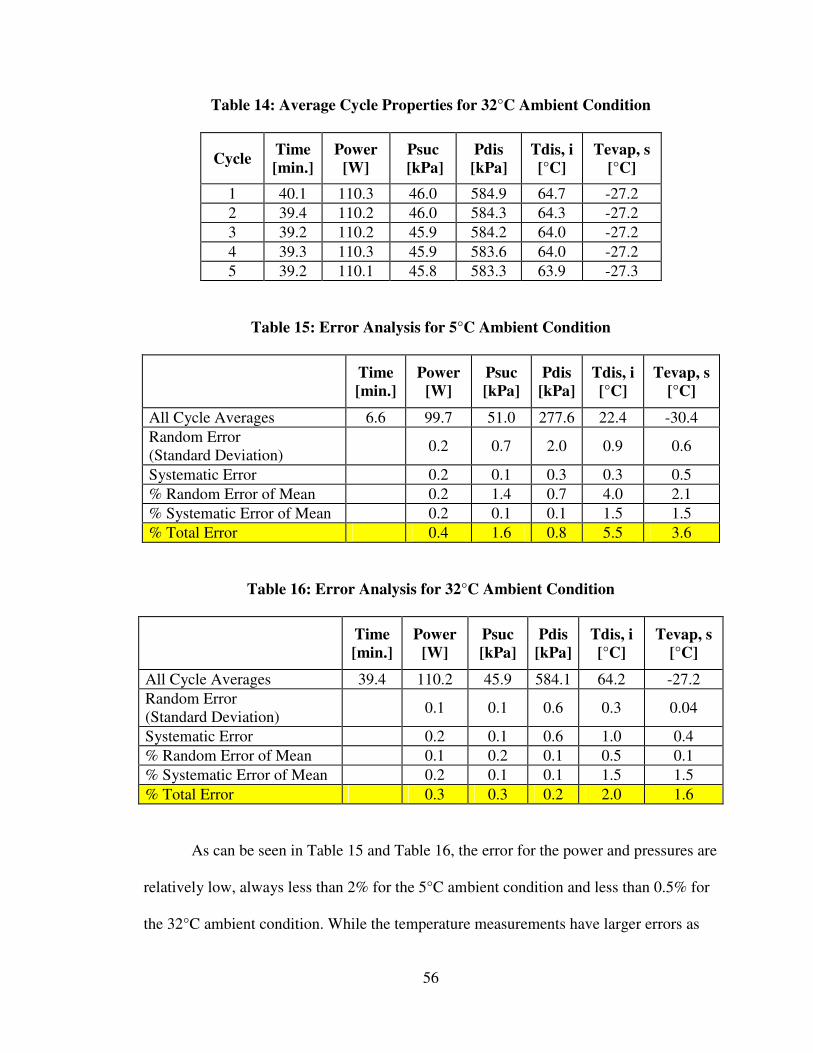
56
Table 14: Average Cycle Properties for 32°C Ambient Condition
Cycle Time
[min.]
Power
[W]
Psuc
[kPa]
Pdis
[kPa]
Tdis, i
[°C]
Tevap, s
[°C]
1 40.1 110.3 46.0 584.9 64.7 -27.2
2 39.4 110.2 46.0 584.3 64.3 -27.2
3 39.2 110.2 45.9 584.2 64.0 -27.2
4 39.3 110.3 45.9 583.6 64.0 -27.2
5 39.2 110.1 45.8 583.3 63.9 -27.3
Table 15: Error Analysis for 5°C Ambient Condition
Time
[min.]
Power
[W]
Psuc
[kPa]
Pdis
[kPa]
Tdis, i
[°C]
Tevap, s
[°C]
All Cycle Averages 6.6 99.7 51.0 277.6 22.4 -30.4
Random Error (Standard Deviation)
0.2 0.7 2.0 0.9 0.6
Systematic Error 0.2 0.1 0.3 0.3 0.5
% Random Error of Mean 0.2 1.4 0.7 4.0 2.1
% Systematic Error of Mean 0.2 0.1 0.1 1.5 1.5
% Total Error 0.4 1.6 0.8 5.5 3.6
Table 16: Error Analysis for 32°C Ambient Condition
Time
[min.]
Power
[W]
Psuc
[kPa] Pdis
[kPa]
Tdis, i
[°C]
Tevap, s
[°C]
All Cycle Averages 39.4 110.2 45.9 584.1 64.2 -27.2
Random Error (Standard Deviation)
0.1 0.1 0.6 0.3 0.04
Systematic Error 0.2 0.1 0.6 1.0 0.4
% Random Error of Mean 0.1 0.2 0.1 0.5 0.1
% Systematic Error of Mean 0.2 0.1 0.1 1.5 1.5
% Total Error 0.3 0.3 0.2 2.0 1.6
As can be seen in Table 15 and Table 16, the error for the power and pressures are
relatively low, always less than 2% for the 5°C ambient condition and less than 0.5% for
the 32°C ambient condition. While the temperature measurements have larger errors as
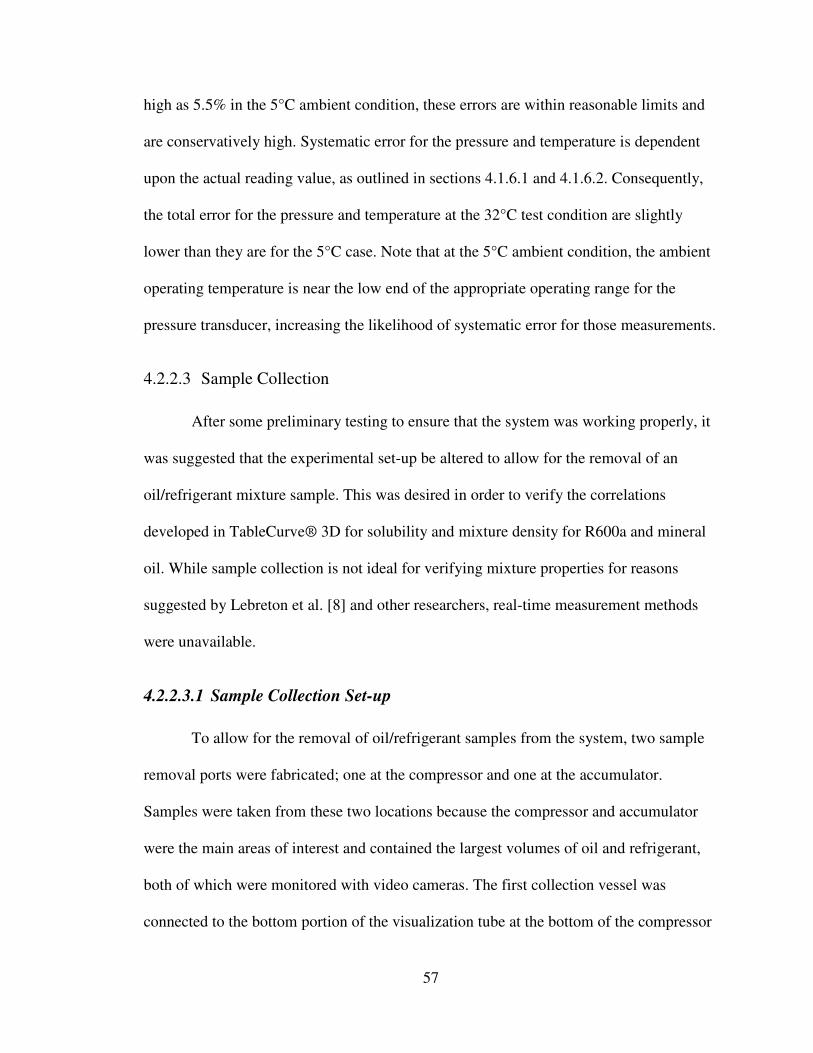
57
high as 5.5% in the 5°C ambient condition, these errors are within reasonable limits and
are conservatively high. Systematic error for the pressure and temperature is dependent
upon the actual reading value, as outlined in sections 4.1.6.1 and 4.1.6.2. Consequently,
the total error for the pressure and temperature at the 32°C test condition are slightly
lower than they are for the 5°C case. Note that at the 5°C ambient condition, the ambient
operating temperature is near the low end of the appropriate operating range for the
pressure transducer, increasing the likelihood of systematic error for those measurements.
4.2.2.3 Sample Collection
After some preliminary testing to ensure that the system was working properly, it
was suggested that the experimental set-up be altered to allow for the removal of an
oil/refrigerant mixture sample. This was desired in order to verify the correlations
developed in TableCurve® 3D for solubility and mixture density for R600a and mineral
oil. While sample collection is not ideal for verifying mixture properties for reasons
suggested by Lebreton et al. [8] and other researchers, real-time measurement methods
were unavailable.
4.2.2.3.1 Sample Collection Set-up
To allow for the removal of oil/refrigerant samples from the system, two sample
removal ports were fabricated; one at the compressor and one at the accumulator.
Samples were taken from these two locations because the compressor and accumulator
were the main areas of interest and contained the largest volumes of oil and refrigerant,
both of which were monitored with video cameras. The first collection vessel was
connected to the bottom portion of the visualization tube at the bottom of the compressor
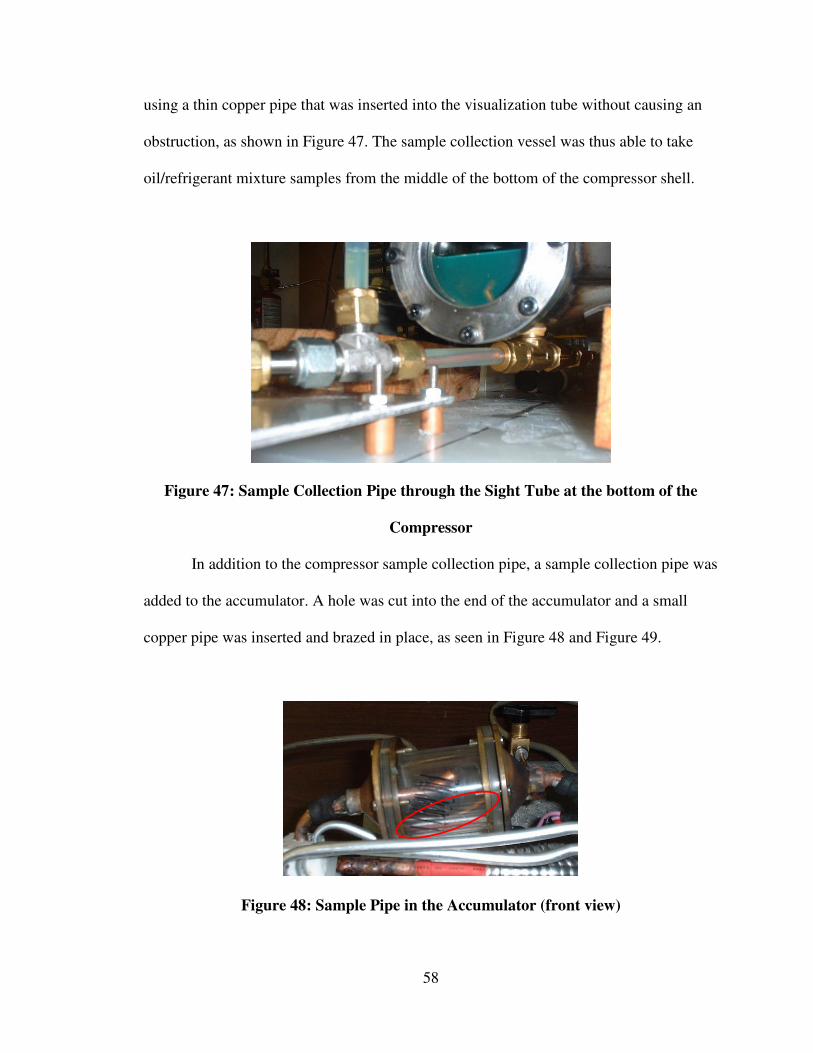
58
using a thin copper pipe that was inserted into the visualization tube without causing an
obstruction, as shown in Figure 47. The sample collection vessel was thus able to take
oil/refrigerant mixture samples from the middle of the bottom of the compressor shell.
Figure 47: Sample Collection Pipe through the Sight Tube at the bottom of the
Compressor
In addition to the compressor sample collection pipe, a sample collection pipe was
added to the accumulator. A hole was cut into the end of the accumulator and a small
copper pipe was inserted and brazed in place, as seen in Figure 48 and Figure 49.
Figure 48: Sample Pipe in the Accumulator (front view)
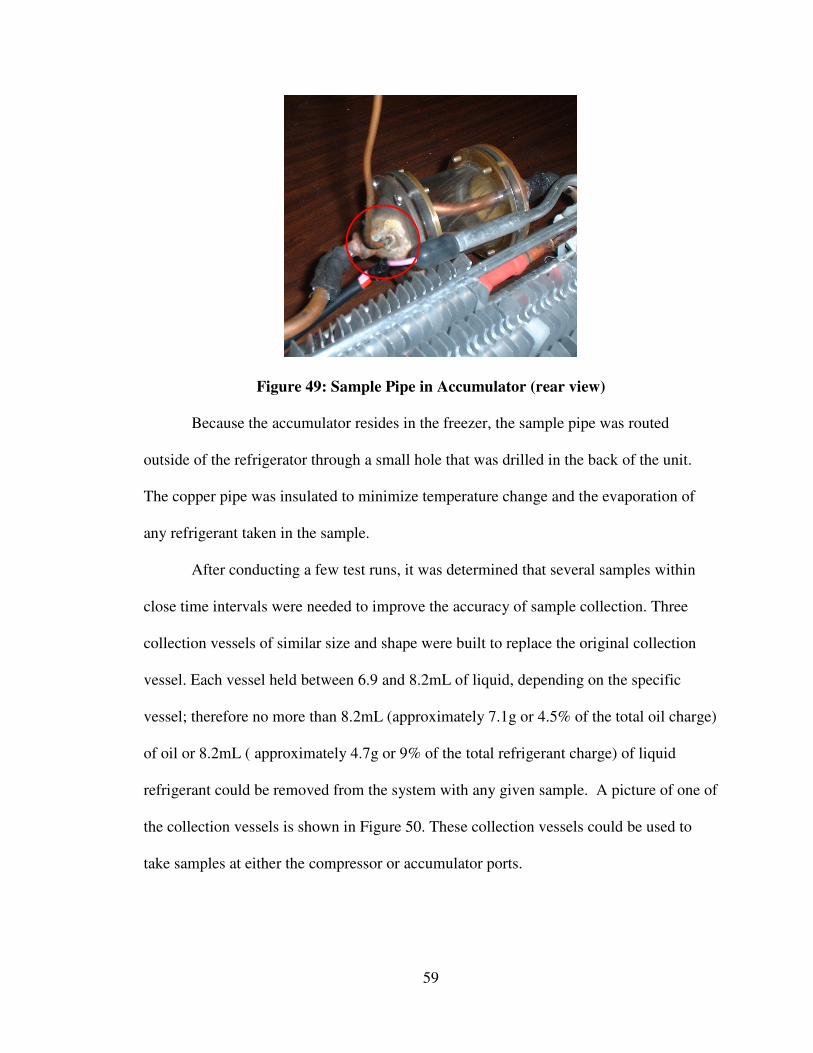
59
Figure 49: Sample Pipe in Accumulator (rear view)
Because the accumulator resides in the freezer, the sample pipe was routed
outside of the refrigerator through a small hole that was drilled in the back of the unit.
The copper pipe was insulated to minimize temperature change and the evaporation of
any refrigerant taken in the sample.
After conducting a few test runs, it was determined that several samples within
close time intervals were needed to improve the accuracy of sample collection. Three
collection vessels of similar size and shape were built to replace the original collection
vessel. Each vessel held between 6.9 and 8.2mL of liquid, depending on the specific
vessel; therefore no more than 8.2mL (approximately 7.1g or 4.5% of the total oil charge)
of oil or 8.2mL ( approximately 4.7g or 9% of the total refrigerant charge) of liquid
refrigerant could be removed from the system with any given sample. A picture of one of
the collection vessels is shown in Figure 50. These collection vessels could be used to
take samples at either the compressor or accumulator ports.
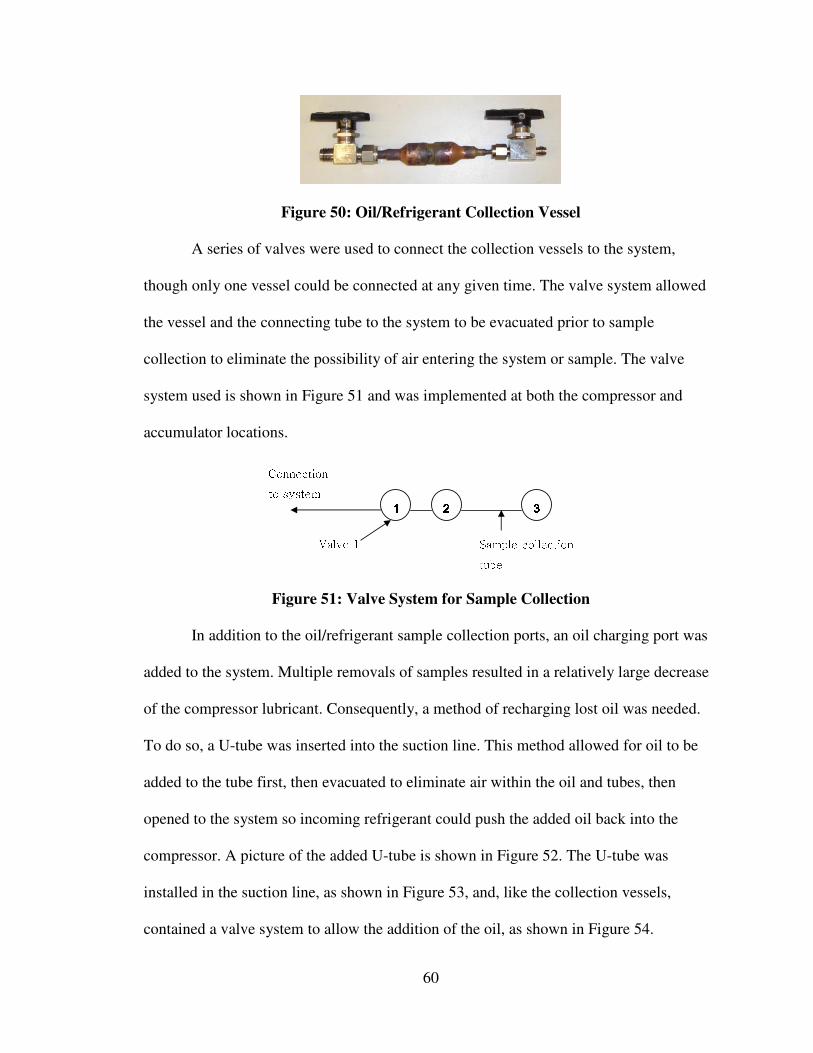
60
Figure 50: Oil/Refrigerant Collection Vessel
A series of valves were used to connect the collection vessels to the system,
though only one vessel could be connected at any given time. The valve system allowed
the vessel and the connecting tube to the system to be evacuated prior to sample
collection to eliminate the possibility of air entering the system or sample. The valve
system used is shown in Figure 51 and was implemented at both the compressor and
accumulator locations. 1111 2222 3333 Valve 1 Sample collection tube Connection to system
Figure 51: Valve System for Sample Collection
In addition to the oil/refrigerant sample collection ports, an oil charging port was
added to the system. Multiple removals of samples resulted in a relatively large decrease
of the compressor lubricant. Consequently, a method of recharging lost oil was needed.
To do so, a U-tube was inserted into the suction line. This method allowed for oil to be
added to the tube first, then evacuated to eliminate air within the oil and tubes, then
opened to the system so incoming refrigerant could push the added oil back into the
compressor. A picture of the added U-tube is shown in Figure 52. The U-tube was
installed in the suction line, as shown in Figure 53, and, like the collection vessels,
contained a valve system to allow the addition of the oil, as shown in Figure 54.
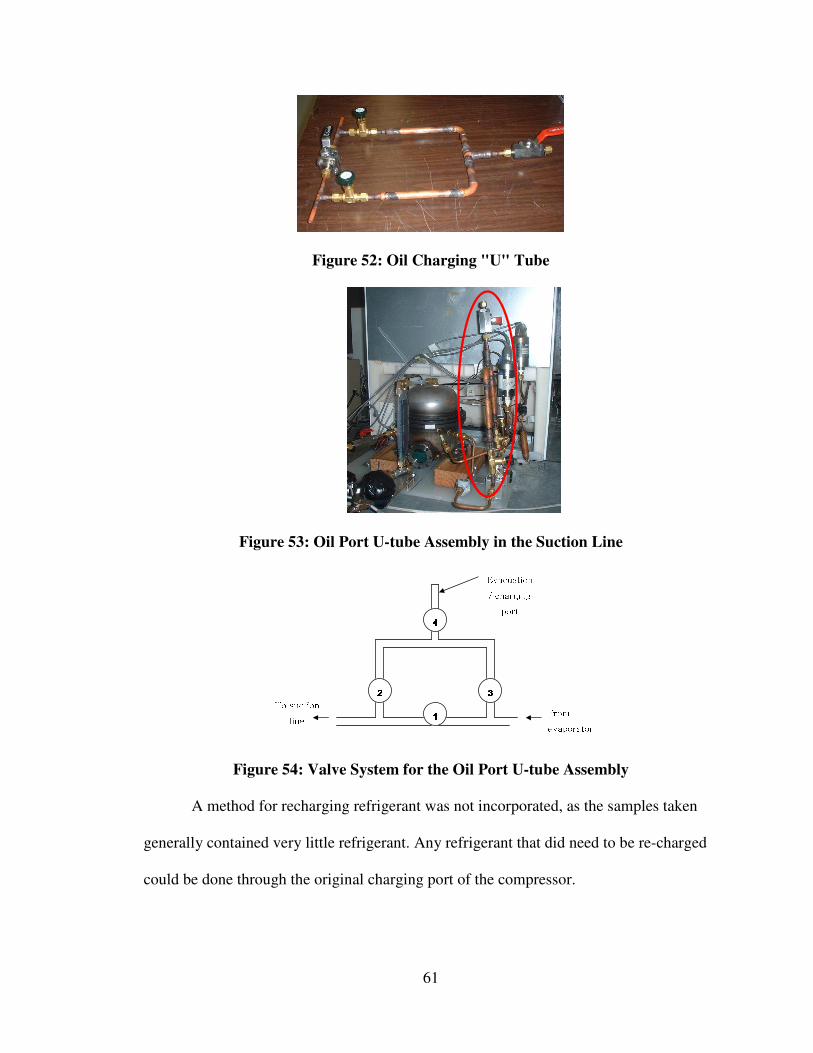
61
Figure 52: Oil Charging "U" Tube
Figure 53: Oil Port U-tube Assembly in the Suction Line 4444 2222 3333 1111 From evaporator To suction line Evacuation / charging port
Figure 54: Valve System for the Oil Port U-tube Assembly
A method for recharging refrigerant was not incorporated, as the samples taken
generally contained very little refrigerant. Any refrigerant that did need to be re-charged
could be done through the original charging port of the compressor.
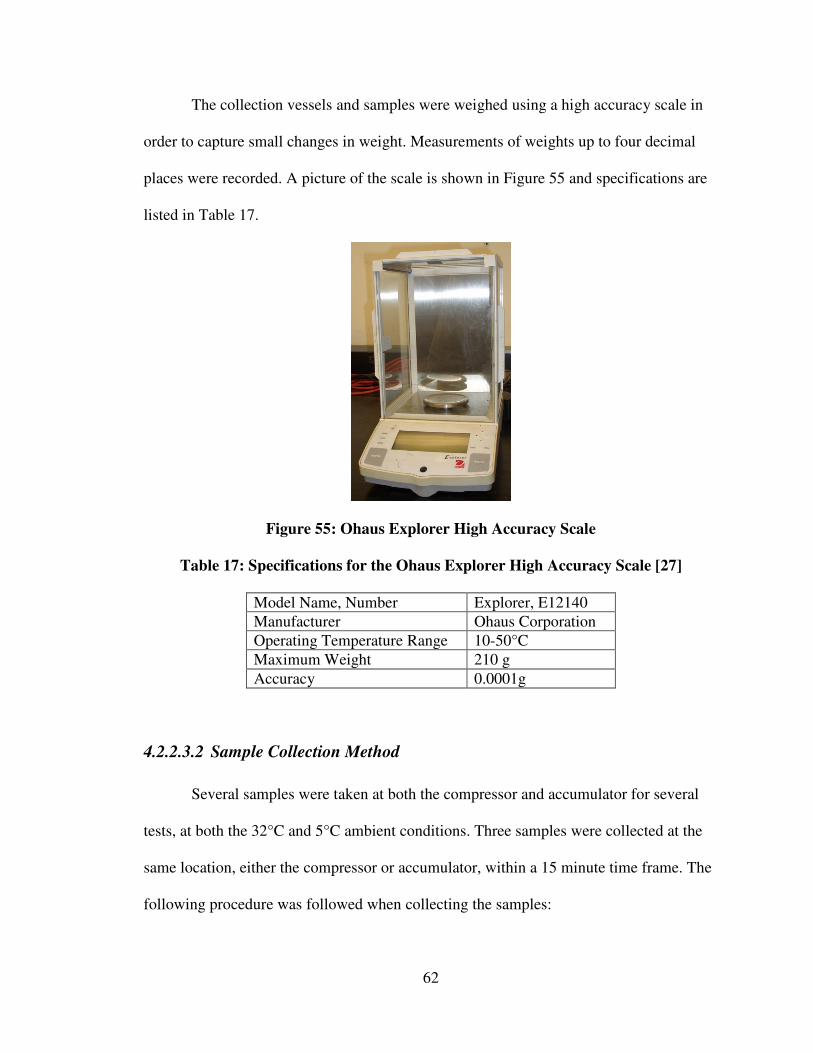
62
The collection vessels and samples were weighed using a high accuracy scale in
order to capture small changes in weight. Measurements of weights up to four decimal
places were recorded. A picture of the scale is shown in Figure 55 and specifications are
listed in Table 17.
Figure 55: Ohaus Explorer High Accuracy Scale
Table 17: Specifications for the Ohaus Explorer High Accuracy Scale [27]
Model Name, Number Explorer, E12140
Manufacturer Ohaus Corporation
Operating Temperature Range 10-50°C
Maximum Weight 210 g
Accuracy 0.0001g
4.2.2.3.2 Sample Collection Method
Several samples were taken at both the compressor and accumulator for several
tests, at both the 32°C and 5°C ambient conditions. Three samples were collected at the
same location, either the compressor or accumulator, within a 15 minute time frame. The
following procedure was followed when collecting the samples:
63
1. Clean the collection vessel with acetone to eliminate any trace amounts of oil or
refrigerant.
2. Evacuate the collection vessel.
3. Weigh the collection vessel and record the result. Attach the vessel to the system.
4. The collection vessel is initially closed from the system using valve 1 in Figure 51.
Valves 2 and 3 are also closed as the vessel should be under vacuum.
5. Evacuate the collection vessel again and open valve 2 to evacuate the connecting
pipe between the system and the collection vessel. Evacuate for approximately 1
minute.
6. Once evacuated, close valve 3 to maintain vacuum in the tube and connecting line.
7. Open valve 1 to allow the sample into the collection tube.
8. Close valves 1 and 2 after approximately 15 seconds. Close valve 1 first and then
valve 2.
9. Remove the collection vessel from the system. Less than 1mL of sample will be
lost in the connecting pipe.
10. Weigh the total oil/refrigerant mixture weight in the collection tube and record the
result.
11. Hold the collection vessel vertically and evacuate again, removing any refrigerant
from the vessel. The vessel can also be opened directly to atmosphere to allow the
refrigerant to escape and let oil run back down into the bulk of the collection
vessel. Evacuate again after opening the vessel to atmosphere to maintain vacuum
and consistent weighing methods.
12. Weigh the collection vessel with just oil and record the result.
64
13. Purge the oil sample into a graduated cylinder. Record the amount of oil retained.
If the amount of oil is small, clean the vessel and collect the waste. Heat the
mixture so that the waste solvent will evaporate and measure the pure oil
collected. Compare to previous weights and density calculations for liquid volume.
14. Repeat steps 1-13 for the remaining two collection vessels.
When significant amounts of oil were lost from sample collection, the following
procedure was followed to add oil back to the system:
1. The “U” is initially closed from the system. Valve 1, as in Figure 54, is open and
valves 2, 3 and 4 are closed.
2. Calculate how much oil should be added based on prior sample removal.
3. Charge oil through the top port, valve 4. Be sure to charge slowly to allow for air
bubbles to escape.
4. Add a vacuum connection to valve 4.
5. Evacuate the top portion of the “U” for at least 5 minutes to remove excess air
from the pipes and the oil.
6. Close valve 4.
7. Open first valve 2 and then valve 3.
8. Periodically close valve 1. Watch the suction line sight glass for oil addition.
Open and close valve 1 several times until you believe all of the oil has been
added.
65
9. After several minutes of opening and closing valve 1, keep valve 1 open and close
first valve 3 and then valve 2.
10. Check camera visualization for the compressor and the suction and discharge line
sight glasses to determine the success of oil addition.
4.2.2.3.3 Sample Collection Results
Unfortunately, the sample collection method did not prove to be as useful as
originally hoped. There was a large amount of error associated with the samples collected
and no conclusive results were gained from the sample collection method. Solubility data
could not be verified or refuted as sample collection measurements varied greatly
between one another despite the precautions taken to reduce or eliminate this problem. Of
21 samples taken at the compressor, only 2 measurements showed agreement within 10%
of the calculated solubility. While this may suggest that the solubility correlation needs
adjustment, the average standard deviation between compressor sample measurements
was 6.4%. Considering that the sample size was relatively small (at most a total of 8.2mL
of oil/refrigerant mixture), the error and standard deviations for these samples do not
provide enough conclusive evidence to make a statement on the validity of the solubility
data.
Results for the accumulator were worse than those for the compressor given that
the accumulator was often at temperatures near -20°C. Collecting samples while the
system was running proved to be quite difficult as refrigerant would evaporate as soon as
it would enter the warmer collection vessel. Methods of cooling the collection vessel
prior to collecting the sample were attempted but were ultimately unsuccessful. Of 16
samples collected at the accumulator, only 4 measurements showed agreement within
66
10% of the calculated solubility. 10 of the measurements had an error between 28 and
75% of the calculated value and 2 of the measurements showed very poor agreement with
an error greater than 75%. The average standard deviation for the accumulator sample
measurements was 28.8%, much higher than that for the compressor sample
measurements. This is partially due to the difficult nature of collecting accumulator
samples at low temperatures.
After collecting a number of samples and reviewing work done by Zhelezny et al.
[12], which shows that sample collection must be very precise and that solubility data is
only relevant for steady-state operations, the sampling method was abandoned. The given
solubility correlation was used for experimental analysis with the understanding that
results were not necessarily accurate and may not apply appropriately for when the
system is running and continuously changing temperature and pressure.
4.3 Experimental Results
A total of six tests at the 5°C ambient condition, three tests at the 32°C and two
tests at the 43°C were conducted with the accumulator. A summary of the tests conducted
and their key characteristics and results are shown in Table 18. As can be seen from the
table, the defrost period was not often captured in the 5°C case due to the length of time
required to reach this stage. Also, cycling did not occur during the length of the testing
periods for experiments at the 43°C ambient condition because of the high ambient
temperature.
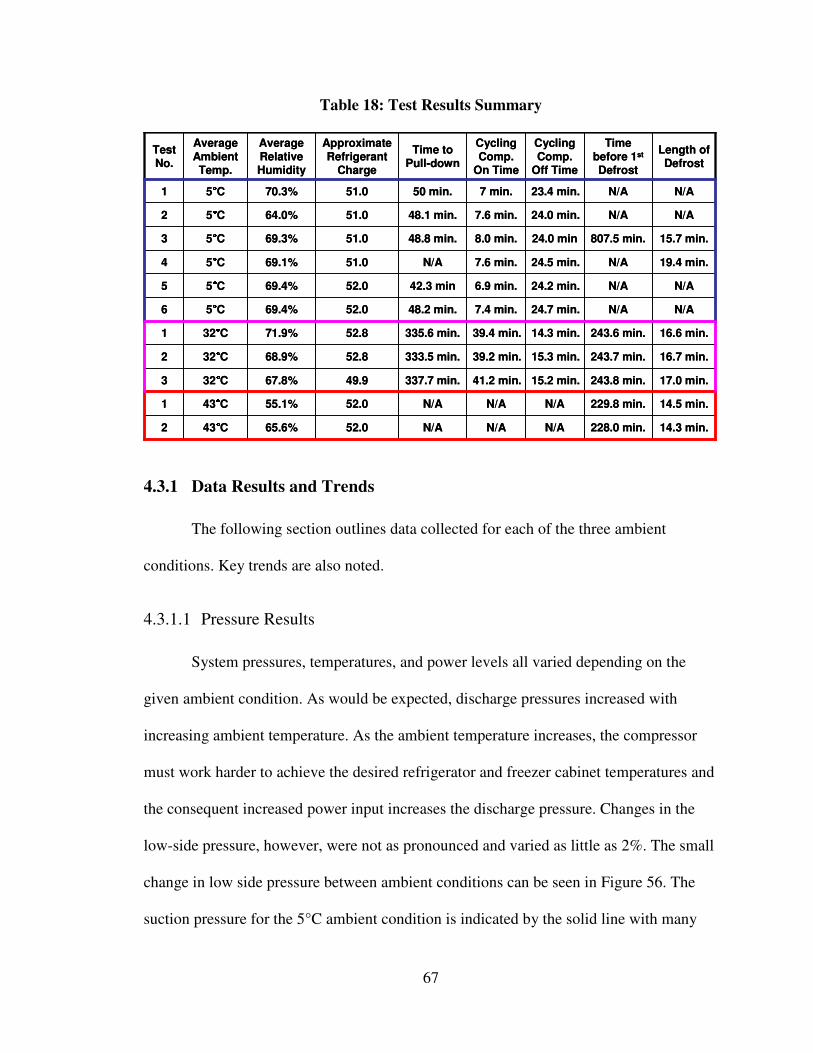
67
Table 18: Test Results Summary
N/A
N/A
15.2 min.
15.3 min.
14.3 min.
24.7 min.
24.2 min.
24.5 min.
24.0 min
24.0 min.
23.4 min.
Cycling Comp.
Off Time
N/A
N/A
41.2 min.
39.2 min.
39.4 min.
7.4 min.
6.9 min.
7.6 min.
8.0 min.
7.6 min.
7 min.
Cycling Comp.
On Time
228.0 min.
229.8 min.
243.8 min.
243.7 min.
243.6 min.
N/A
N/A
N/A
807.5 min.
N/A
N/A
Time before 1st
Defrost
14.5 min.N/A52.055.1%43°°°°C1
14.3 min.N/A52.065.6%43°°°°C2
17.0 min.337.7 min.49.967.8%32°°°°C3
16.7 min.333.5 min.52.868.9%32°°°°C2
16.6 min.335.6 min.52.871.9%32°°°°C1
N/A48.2 min.52.069.4%5°°°°C6
N/A42.3 min52.069.4%5°°°°C5
19.4 min.N/A51.069.1%5°°°°C4
15.7 min.48.8 min.51.069.3%5°°°°C3
N/A48.1 min.51.064.0%5°°°°C2
N/A50 min.51.070.3%5°°°°C1
Length of Defrost
Time to Pull-down
Approximate Refrigerant
Charge
Average Relative Humidity
Average Ambient Temp.
Test No.
N/A
N/A
15.2 min.
15.3 min.
14.3 min.
24.7 min.
24.2 min.
24.5 min.
24.0 min
24.0 min.
23.4 min.
Cycling Comp.
Off Time
N/A
N/A
41.2 min.
39.2 min.
39.4 min.
7.4 min.
6.9 min.
7.6 min.
8.0 min.
7.6 min.
7 min.
Cycling Comp.
On Time
228.0 min.
229.8 min.
243.8 min.
243.7 min.
243.6 min.
N/A
N/A
N/A
807.5 min.
N/A
N/A
Time before 1st
Defrost
14.5 min.N/A52.055.1%43°°°°C1
14.3 min.N/A52.065.6%43°°°°C2
17.0 min.337.7 min.49.967.8%32°°°°C3
16.7 min.333.5 min.52.868.9%32°°°°C2
16.6 min.335.6 min.52.871.9%32°°°°C1
N/A48.2 min.52.069.4%5°°°°C6
N/A42.3 min52.069.4%5°°°°C5
19.4 min.N/A51.069.1%5°°°°C4
15.7 min.48.8 min.51.069.3%5°°°°C3
N/A48.1 min.51.064.0%5°°°°C2
N/A50 min.51.070.3%5°°°°C1
Length of Defrost
Time to Pull-down
Approximate Refrigerant
Charge
Average Relative Humidity
Average Ambient Temp.
Test No.
4.3.1 Data Results and Trends
The following section outlines data collected for each of the three ambient
conditions. Key trends are also noted.
4.3.1.1 Pressure Results
System pressures, temperatures, and power levels all varied depending on the
given ambient condition. As would be expected, discharge pressures increased with
increasing ambient temperature. As the ambient temperature increases, the compressor
must work harder to achieve the desired refrigerator and freezer cabinet temperatures and
the consequent increased power input increases the discharge pressure. Changes in the
low-side pressure, however, were not as pronounced and varied as little as 2%. The small
change in low side pressure between ambient conditions can be seen in Figure 56. The
suction pressure for the 5°C ambient condition is indicated by the solid line with many
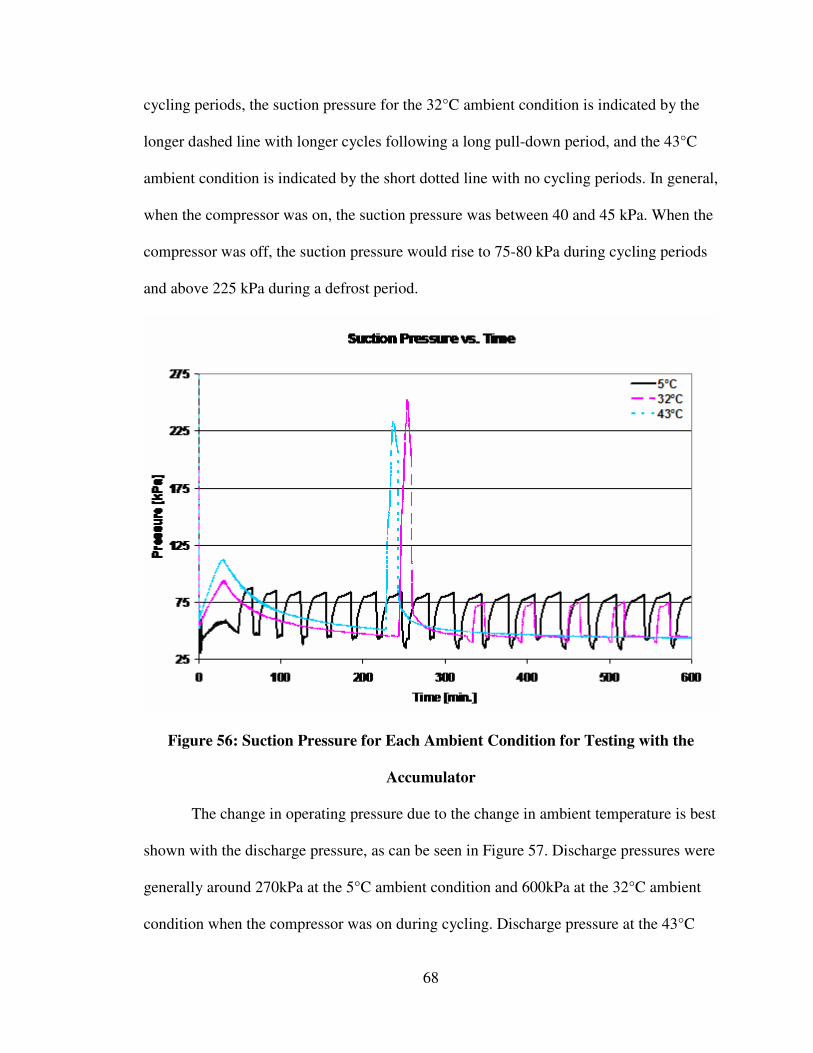
68
cycling periods, the suction pressure for the 32°C ambient condition is indicated by the
longer dashed line with longer cycles following a long pull-down period, and the 43°C
ambient condition is indicated by the short dotted line with no cycling periods. In general,
when the compressor was on, the suction pressure was between 40 and 45 kPa. When the
compressor was off, the suction pressure would rise to 75-80 kPa during cycling periods
and above 225 kPa during a defrost period.
Figure 56: Suction Pressure for Each Ambient Condition for Testing with the
Accumulator
The change in operating pressure due to the change in ambient temperature is best
shown with the discharge pressure, as can be seen in Figure 57. Discharge pressures were
generally around 270kPa at the 5°C ambient condition and 600kPa at the 32°C ambient
condition when the compressor was on during cycling. Discharge pressure at the 43°C
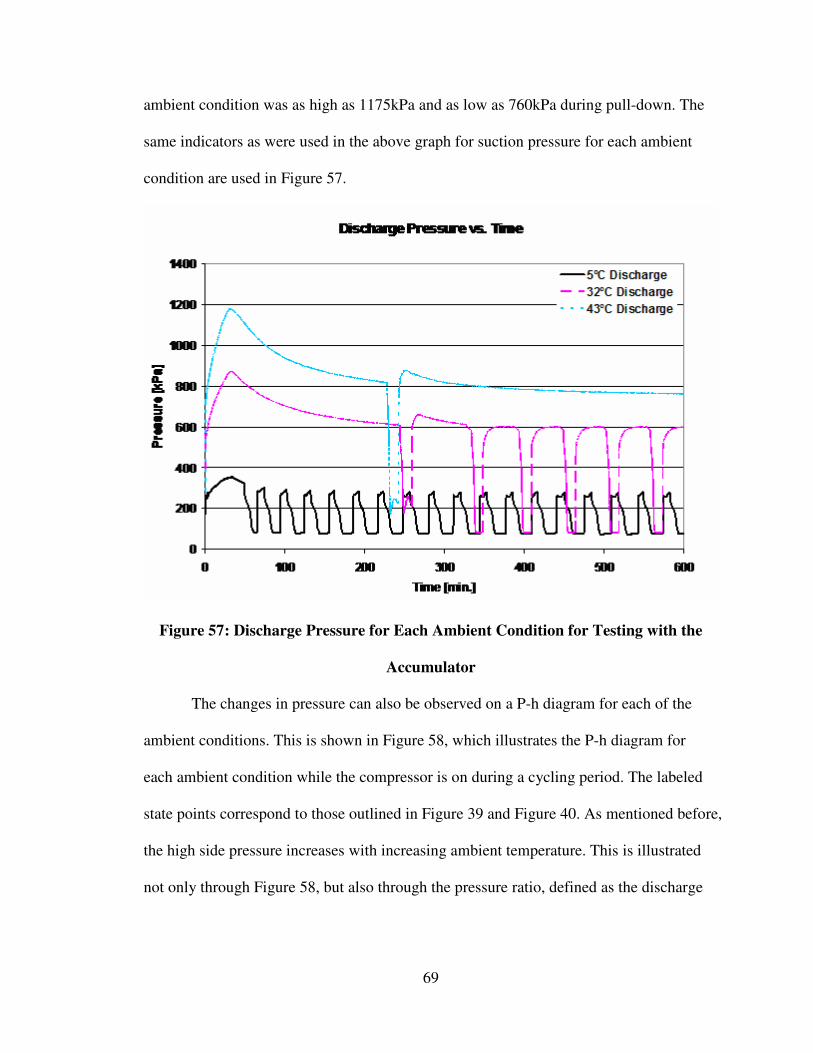
69
ambient condition was as high as 1175kPa and as low as 760kPa during pull-down. The
same indicators as were used in the above graph for suction pressure for each ambient
condition are used in Figure 57.
Figure 57: Discharge Pressure for Each Ambient Condition for Testing with the
Accumulator
The changes in pressure can also be observed on a P-h diagram for each of the
ambient conditions. This is shown in Figure 58, which illustrates the P-h diagram for
each ambient condition while the compressor is on during a cycling period. The labeled
state points correspond to those outlined in Figure 39 and Figure 40. As mentioned before,
the high side pressure increases with increasing ambient temperature. This is illustrated
not only through Figure 58, but also through the pressure ratio, defined as the discharge
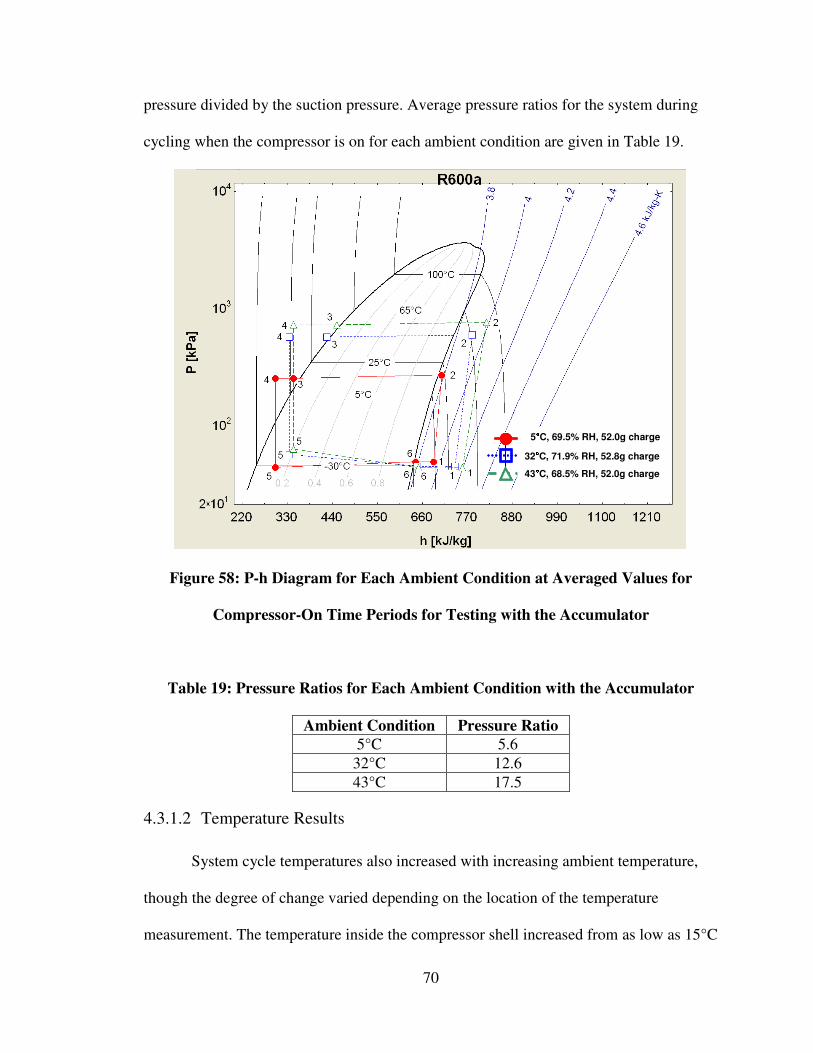
70
pressure divided by the suction pressure. Average pressure ratios for the system during
cycling when the compressor is on for each ambient condition are given in Table 19.
5°°°°C, 69.5% RH, 52.0g charge
32°°°°C, 71.9% RH, 52.8g charge
43°°°°C, 68.5% RH, 52.0g charge
5°°°°C, 69.5% RH, 52.0g charge
32°°°°C, 71.9% RH, 52.8g charge
43°°°°C, 68.5% RH, 52.0g charge
5°°°°C, 69.5% RH, 52.0g charge
32°°°°C, 71.9% RH, 52.8g charge
43°°°°C, 68.5% RH, 52.0g charge
Figure 58: P-h Diagram for Each Ambient Condition at Averaged Values for
Compressor-On Time Periods for Testing with the Accumulator
Table 19: Pressure Ratios for Each Ambient Condition with the Accumulator
Ambient Condition Pressure Ratio
5°C 5.6
32°C 12.6
43°C 17.5
4.3.1.2 Temperature Results
System cycle temperatures also increased with increasing ambient temperature,
though the degree of change varied depending on the location of the temperature
measurement. The temperature inside the compressor shell increased from as low as 15°C
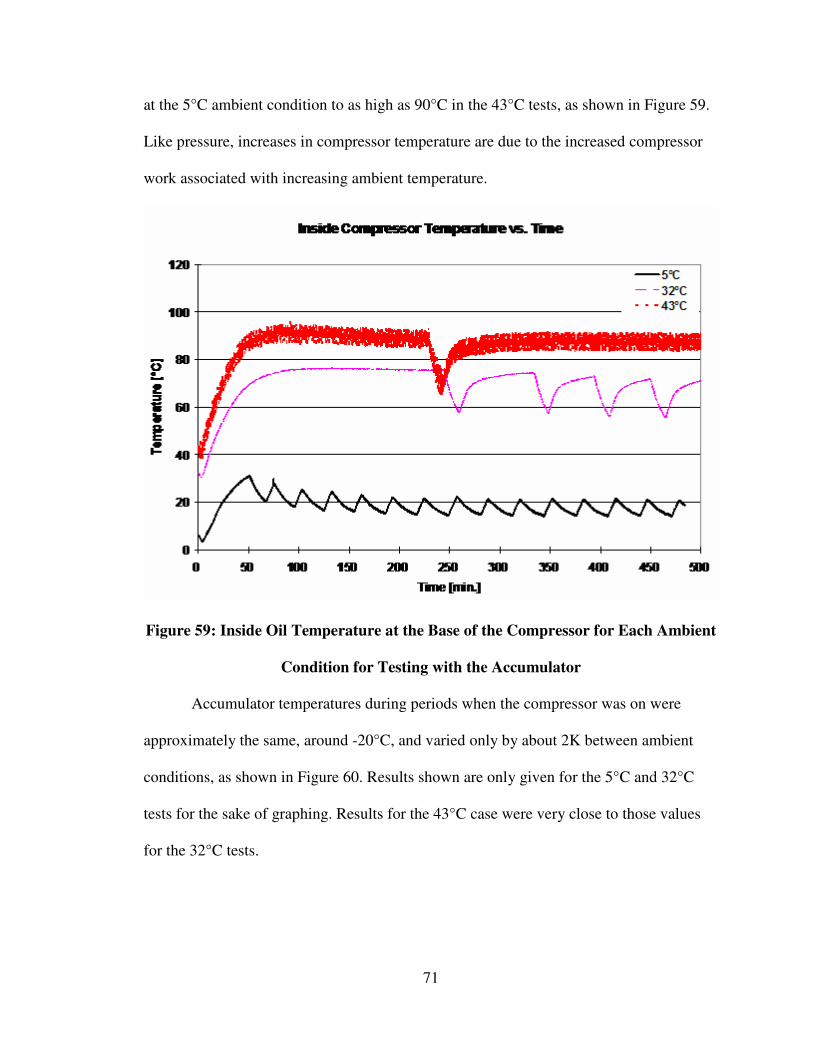
71
at the 5°C ambient condition to as high as 90°C in the 43°C tests, as shown in Figure 59.
Like pressure, increases in compressor temperature are due to the increased compressor
work associated with increasing ambient temperature.
Figure 59: Inside Oil Temperature at the Base of the Compressor for Each Ambient
Condition for Testing with the Accumulator
Accumulator temperatures during periods when the compressor was on were
approximately the same, around -20°C, and varied only by about 2K between ambient
conditions, as shown in Figure 60. Results shown are only given for the 5°C and 32°C
tests for the sake of graphing. Results for the 43°C case were very close to those values
for the 32°C tests.
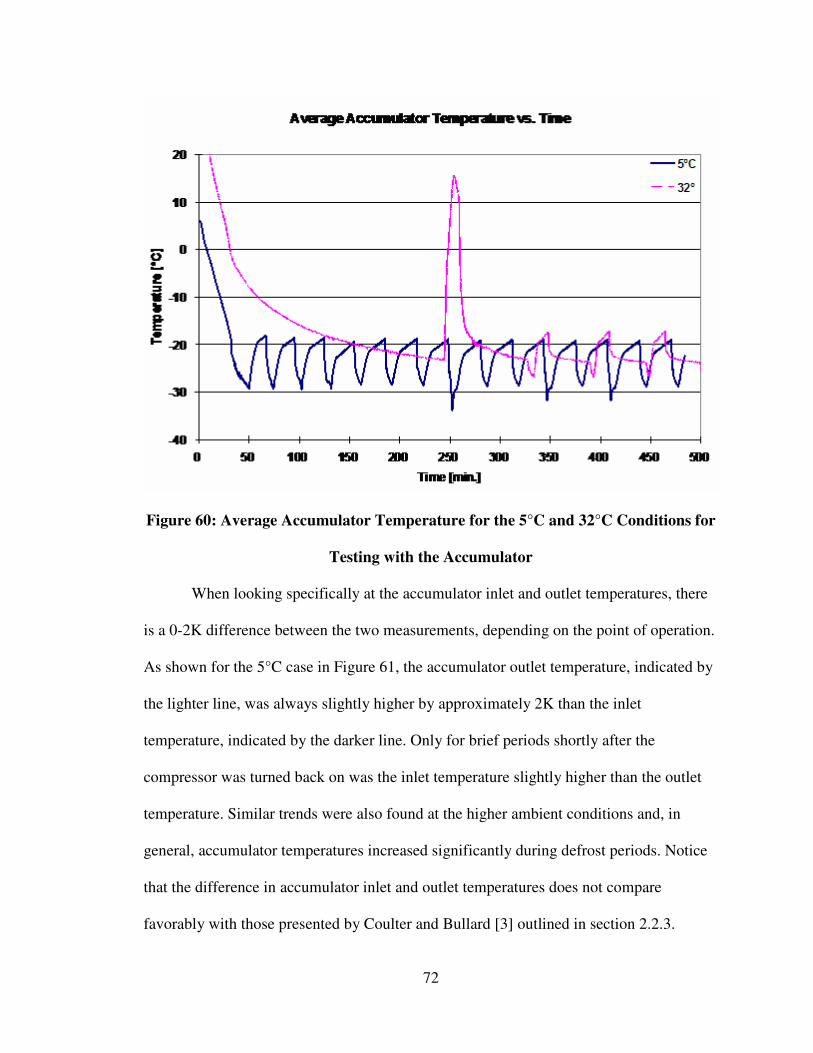
72
Figure 60: Average Accumulator Temperature for the 5°C and 32°C Conditions for
Testing with the Accumulator
When looking specifically at the accumulator inlet and outlet temperatures, there
is a 0-2K difference between the two measurements, depending on the point of operation.
As shown for the 5°C case in Figure 61, the accumulator outlet temperature, indicated by
the lighter line, was always slightly higher by approximately 2K than the inlet
temperature, indicated by the darker line. Only for brief periods shortly after the
compressor was turned back on was the inlet temperature slightly higher than the outlet
temperature. Similar trends were also found at the higher ambient conditions and, in
general, accumulator temperatures increased significantly during defrost periods. Notice
that the difference in accumulator inlet and outlet temperatures does not compare
favorably with those presented by Coulter and Bullard [3] outlined in section 2.2.3.
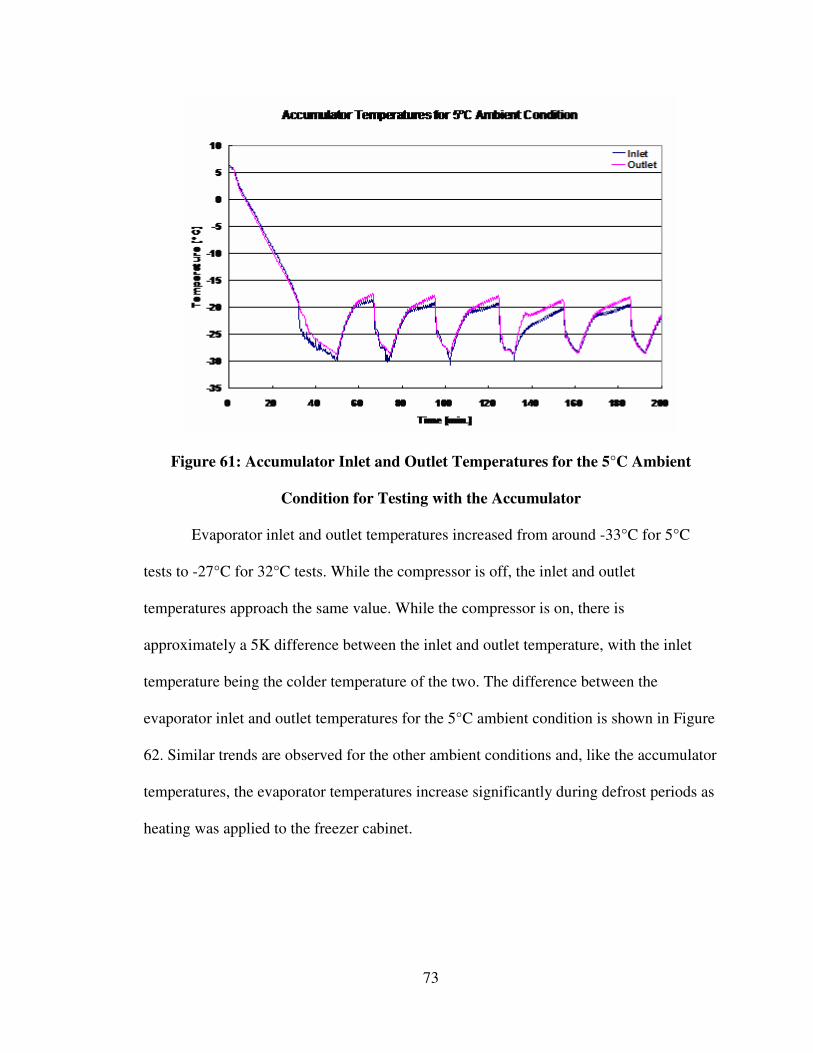
73
Figure 61: Accumulator Inlet and Outlet Temperatures for the 5°C Ambient
Condition for Testing with the Accumulator
Evaporator inlet and outlet temperatures increased from around -33°C for 5°C
tests to -27°C for 32°C tests. While the compressor is off, the inlet and outlet
temperatures approach the same value. While the compressor is on, there is
approximately a 5K difference between the inlet and outlet temperature, with the inlet
temperature being the colder temperature of the two. The difference between the
evaporator inlet and outlet temperatures for the 5°C ambient condition is shown in Figure
62. Similar trends are observed for the other ambient conditions and, like the accumulator
temperatures, the evaporator temperatures increase significantly during defrost periods as
heating was applied to the freezer cabinet.
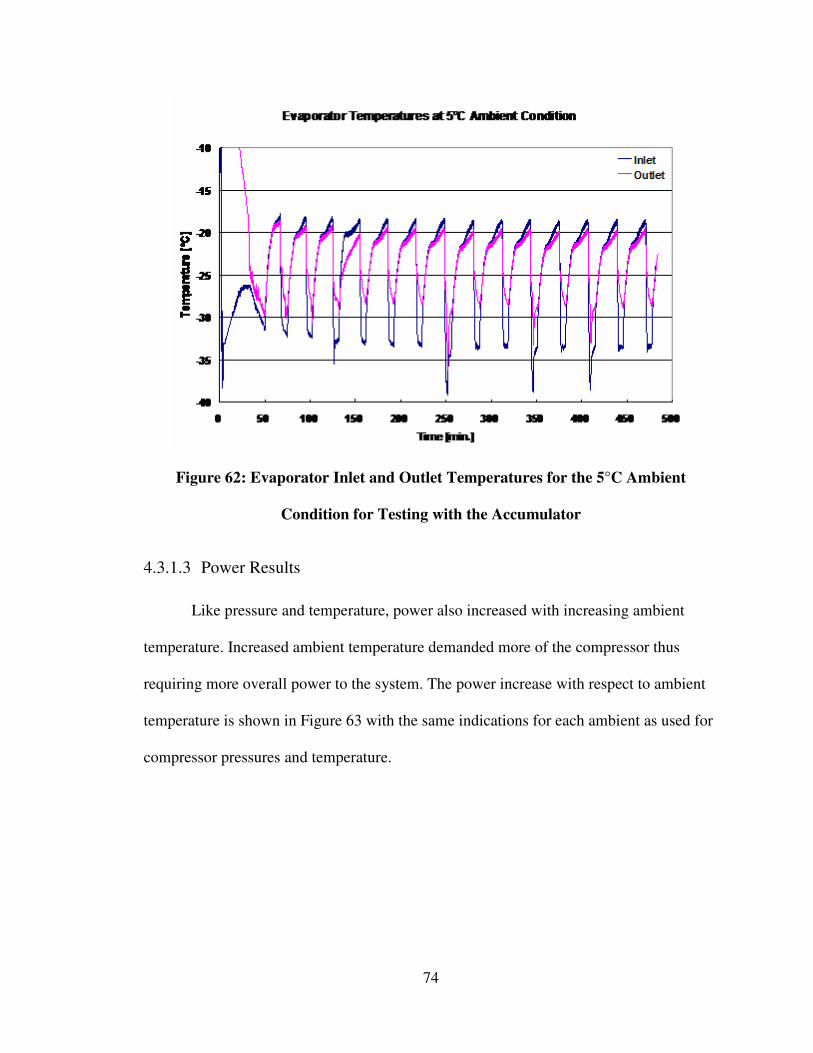
74
Figure 62: Evaporator Inlet and Outlet Temperatures for the 5°C Ambient
Condition for Testing with the Accumulator
4.3.1.3 Power Results
Like pressure and temperature, power also increased with increasing ambient
temperature. Increased ambient temperature demanded more of the compressor thus
requiring more overall power to the system. The power increase with respect to ambient
temperature is shown in Figure 63 with the same indications for each ambient as used for
compressor pressures and temperature.
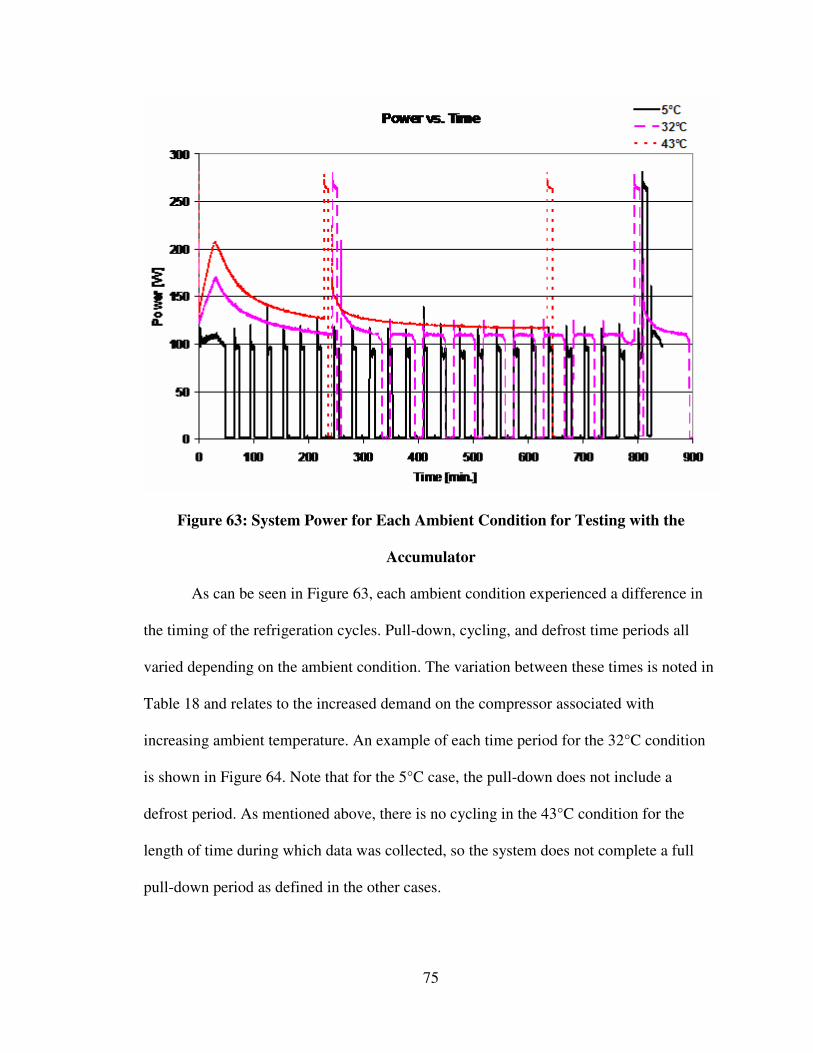
75
Figure 63: System Power for Each Ambient Condition for Testing with the
Accumulator
As can be seen in Figure 63, each ambient condition experienced a difference in
the timing of the refrigeration cycles. Pull-down, cycling, and defrost time periods all
varied depending on the ambient condition. The variation between these times is noted in
Table 18 and relates to the increased demand on the compressor associated with
increasing ambient temperature. An example of each time period for the 32°C condition
is shown in Figure 64. Note that for the 5°C case, the pull-down does not include a
defrost period. As mentioned above, there is no cycling in the 43°C condition for the
length of time during which data was collected, so the system does not complete a full
pull-down period as defined in the other cases.
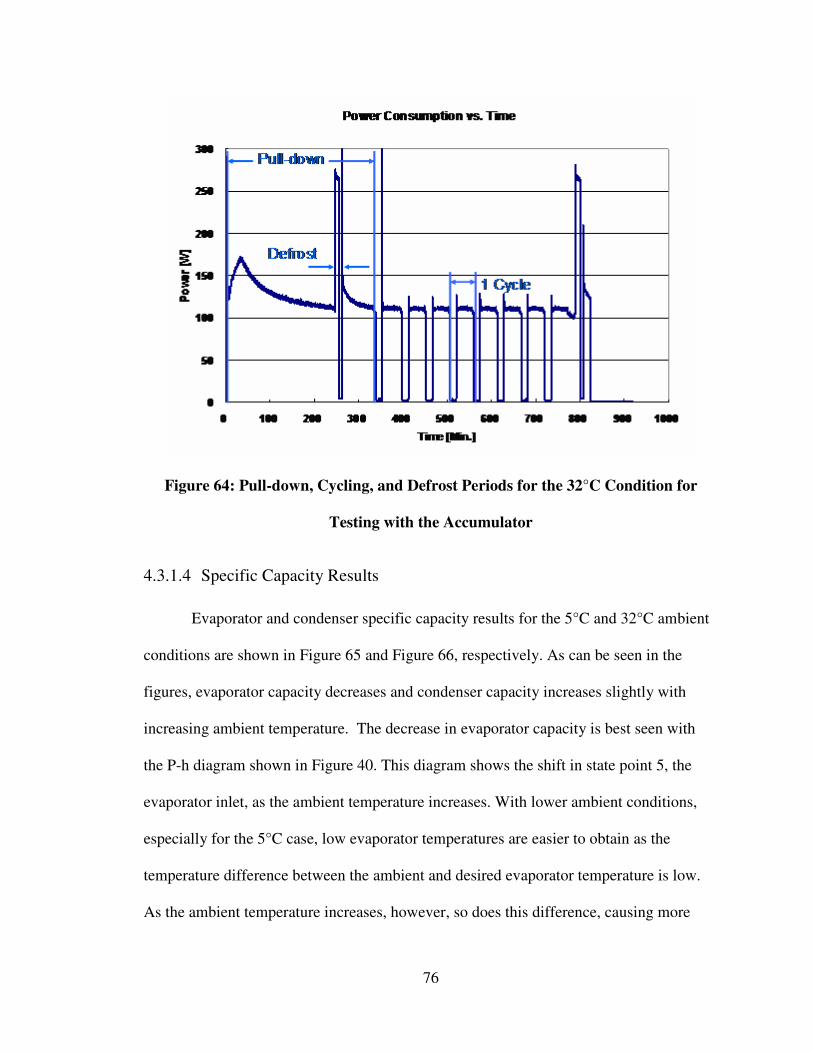
76
Figure 64: Pull-down, Cycling, and Defrost Periods for the 32°C Condition for
Testing with the Accumulator
4.3.1.4 Specific Capacity Results
Evaporator and condenser specific capacity results for the 5°C and 32°C ambient
conditions are shown in Figure 65 and Figure 66, respectively. As can be seen in the
figures, evaporator capacity decreases and condenser capacity increases slightly with
increasing ambient temperature. The decrease in evaporator capacity is best seen with
the P-h diagram shown in Figure 40. This diagram shows the shift in state point 5, the
evaporator inlet, as the ambient temperature increases. With lower ambient conditions,
especially for the 5°C case, low evaporator temperatures are easier to obtain as the
temperature difference between the ambient and desired evaporator temperature is low.
As the ambient temperature increases, however, so does this difference, causing more
77
work for the compressor and a decrease in the evaporator capacity. As mentioned in
section 2.2, a decrease in evaporator capacity is expected at the beginning of a cycle as
the compressor is turned back on. This decrease is due to the fact that the system has to
work harder to bring the evaporator back down to the appropriate temperature quickly as
the compressor is turned back on. Once the compressor has been running again for a few
minutes, the system no longer has to work as hard to establish the low temperature, and
the evaporator capacity increases. This trend can be seen by the small dips in capacity for
both the 5°C and 32°C ambient conditions shown in Figure 65.
Condenser capacity also varies with increasing ambient temperature though the
trend is somewhat reverse. As the ambient temperature increases and the compressor
works harder to operate the system, more heat is available to exchange with the
environment. Because the condenser temperature is generally close to the ambient
temperature, however, changes between condenser capacities for each ambient condition
are less than 1%, as shown in Figure 66. Results for the 43°C ambient condition are not
shown as there is too much noise in the data, but trends were observed to be the same.
Noise in the 43°C data was due to a grounding issue with the DAS that was resolved for
following tests.
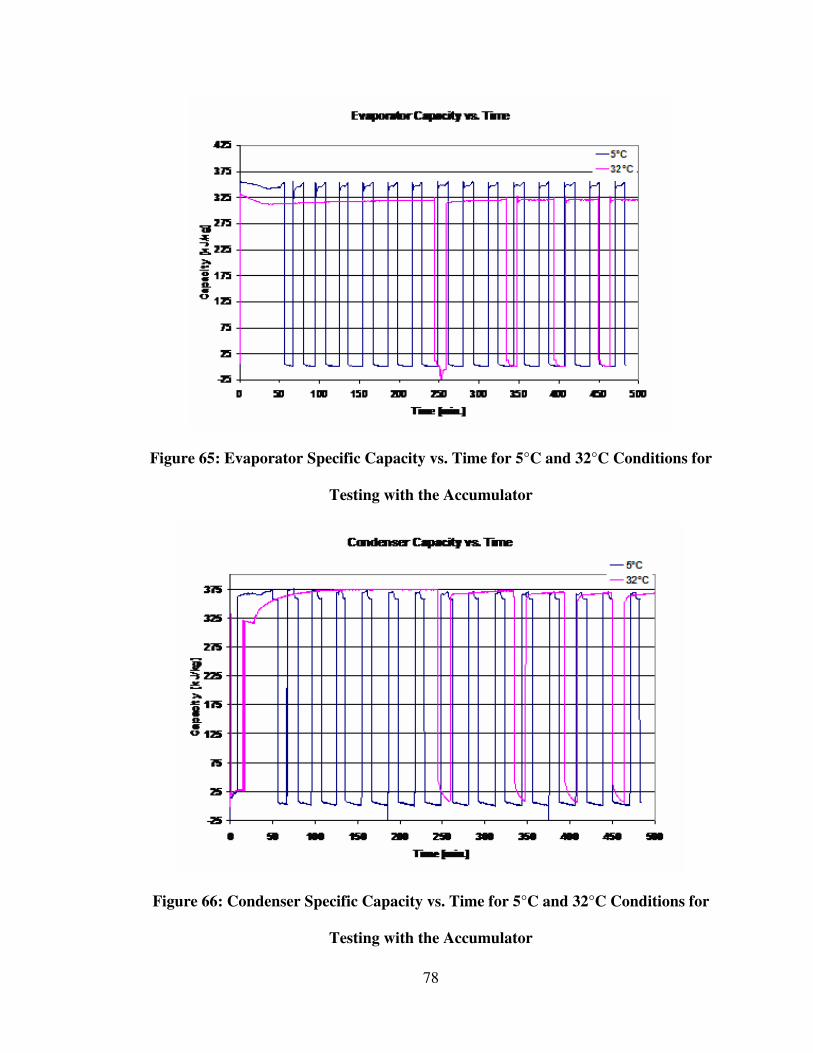
78
Figure 65: Evaporator Specific Capacity vs. Time for 5°C and 32°C Conditions for
Testing with the Accumulator
Figure 66: Condenser Specific Capacity vs. Time for 5°C and 32°C Conditions for
Testing with the Accumulator
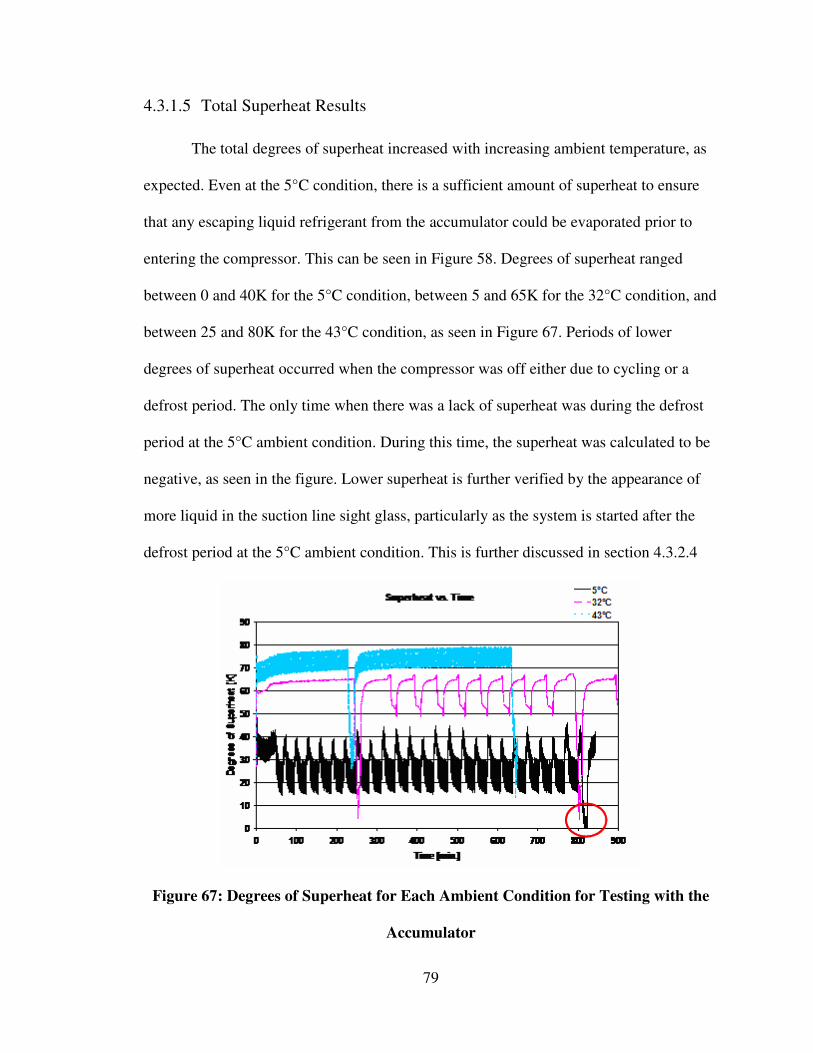
79
4.3.1.5 Total Superheat Results
The total degrees of superheat increased with increasing ambient temperature, as
expected. Even at the 5°C condition, there is a sufficient amount of superheat to ensure
that any escaping liquid refrigerant from the accumulator could be evaporated prior to
entering the compressor. This can be seen in Figure 58. Degrees of superheat ranged
between 0 and 40K for the 5°C condition, between 5 and 65K for the 32°C condition, and
between 25 and 80K for the 43°C condition, as seen in Figure 67. Periods of lower
degrees of superheat occurred when the compressor was off either due to cycling or a
defrost period. The only time when there was a lack of superheat was during the defrost
period at the 5°C ambient condition. During this time, the superheat was calculated to be
negative, as seen in the figure. Lower superheat is further verified by the appearance of
more liquid in the suction line sight glass, particularly as the system is started after the
defrost period at the 5°C ambient condition. This is further discussed in section 4.3.2.4
Figure 67: Degrees of Superheat for Each Ambient Condition for Testing with the
Accumulator
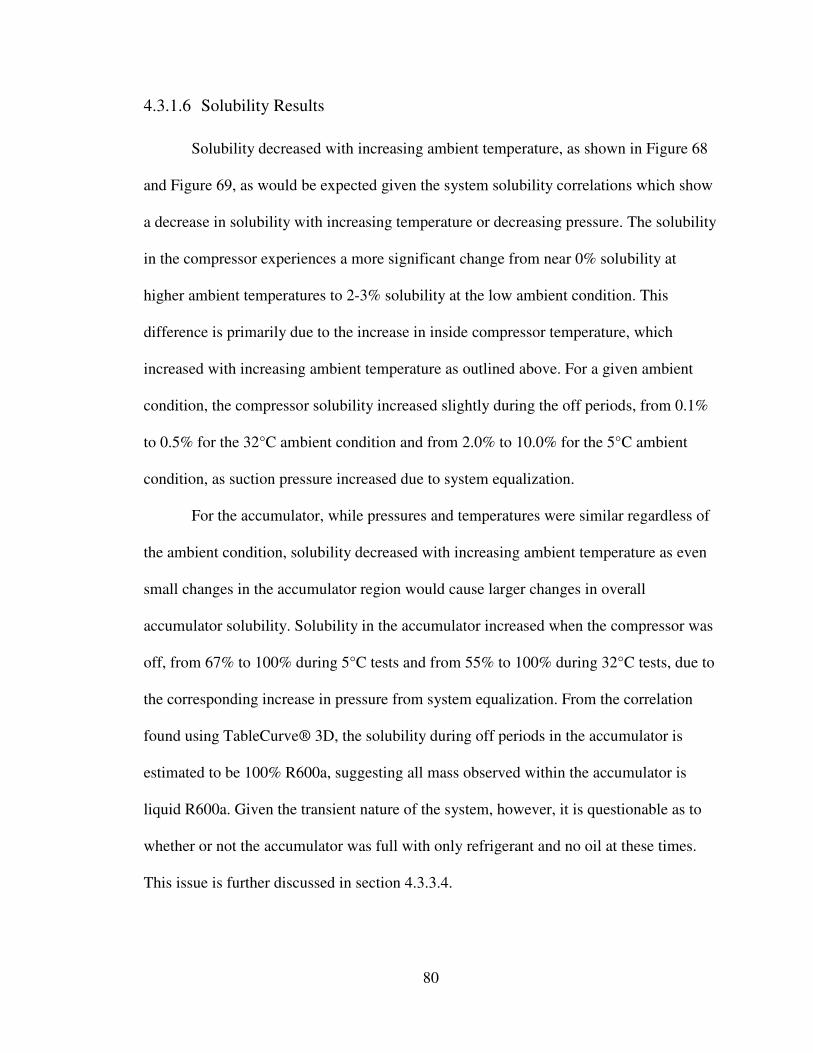
80
4.3.1.6 Solubility Results
Solubility decreased with increasing ambient temperature, as shown in Figure 68
and Figure 69, as would be expected given the system solubility correlations which show
a decrease in solubility with increasing temperature or decreasing pressure. The solubility
in the compressor experiences a more significant change from near 0% solubility at
higher ambient temperatures to 2-3% solubility at the low ambient condition. This
difference is primarily due to the increase in inside compressor temperature, which
increased with increasing ambient temperature as outlined above. For a given ambient
condition, the compressor solubility increased slightly during the off periods, from 0.1%
to 0.5% for the 32°C ambient condition and from 2.0% to 10.0% for the 5°C ambient
condition, as suction pressure increased due to system equalization.
For the accumulator, while pressures and temperatures were similar regardless of
the ambient condition, solubility decreased with increasing ambient temperature as even
small changes in the accumulator region would cause larger changes in overall
accumulator solubility. Solubility in the accumulator increased when the compressor was
off, from 67% to 100% during 5°C tests and from 55% to 100% during 32°C tests, due to
the corresponding increase in pressure from system equalization. From the correlation
found using TableCurve® 3D, the solubility during off periods in the accumulator is
estimated to be 100% R600a, suggesting all mass observed within the accumulator is
liquid R600a. Given the transient nature of the system, however, it is questionable as to
whether or not the accumulator was full with only refrigerant and no oil at these times.
This issue is further discussed in section 4.3.3.4.
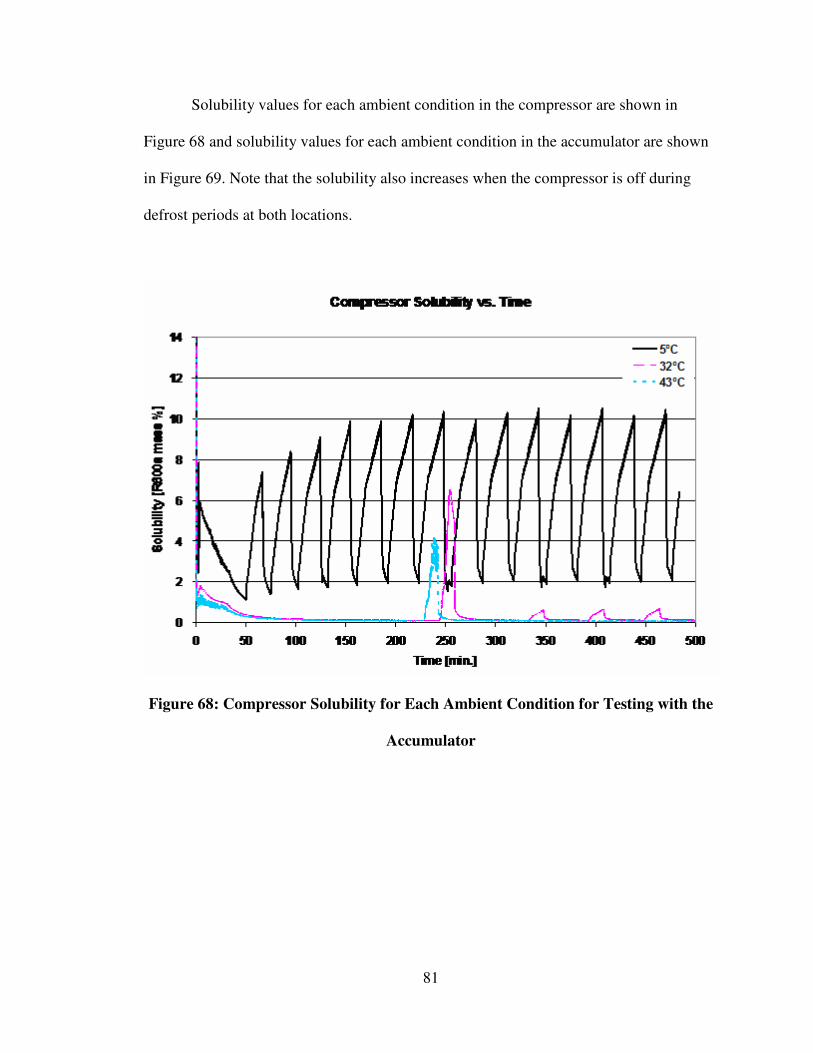
81
Solubility values for each ambient condition in the compressor are shown in
Figure 68 and solubility values for each ambient condition in the accumulator are shown
in Figure 69. Note that the solubility also increases when the compressor is off during
defrost periods at both locations.
Figure 68: Compressor Solubility for Each Ambient Condition for Testing with the
Accumulator
82
Figure 69: Accumulator Solubility for Each Ambient Condition for Testing with the
Accumulator
4.3.1.7 Mixture Density and Correction Factor Results
In the compressor, the mixture density does not experience much fluctuation. The
solubility is always less than 15% mass R600a in the compressor, less than 2% if the
compressor is on, regardless of the ambient temperature, and consequently, the mixture
density tends to remain around the oil density level. The 5°C ambient condition results
experience greater fluctuation in the mixture density than in either of the other two cases
due to the increased time in cycling, the increased length in off-cycle, and the larger
fluctuation in solubility. During the off-cycle, the solubility increases, causing a
consequent decrease in the mixture density. Similar decreases are observed in the 32°C
and 43°C conditions during the defrost periods when the compressor is turned off.
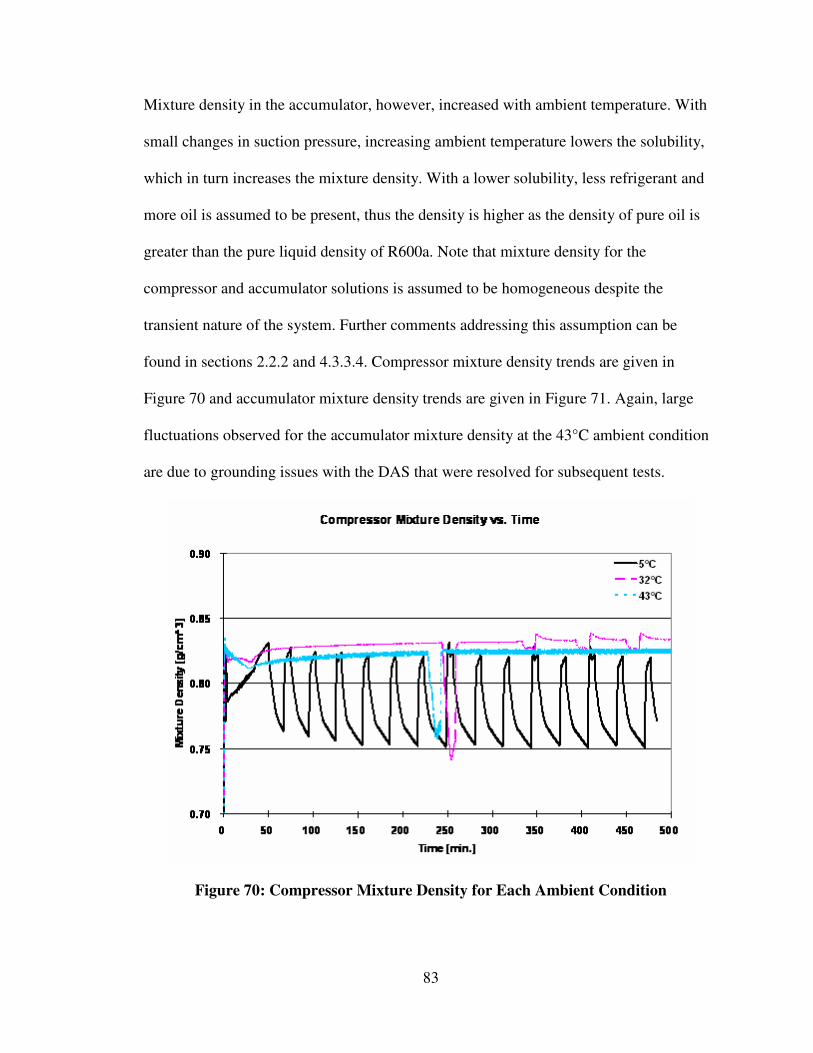
83
Mixture density in the accumulator, however, increased with ambient temperature. With
small changes in suction pressure, increasing ambient temperature lowers the solubility,
which in turn increases the mixture density. With a lower solubility, less refrigerant and
more oil is assumed to be present, thus the density is higher as the density of pure oil is
greater than the pure liquid density of R600a. Note that mixture density for the
compressor and accumulator solutions is assumed to be homogeneous despite the
transient nature of the system. Further comments addressing this assumption can be
found in sections 2.2.2 and 4.3.3.4. Compressor mixture density trends are given in
Figure 70 and accumulator mixture density trends are given in Figure 71. Again, large
fluctuations observed for the accumulator mixture density at the 43°C ambient condition
are due to grounding issues with the DAS that were resolved for subsequent tests.
Figure 70: Compressor Mixture Density for Each Ambient Condition
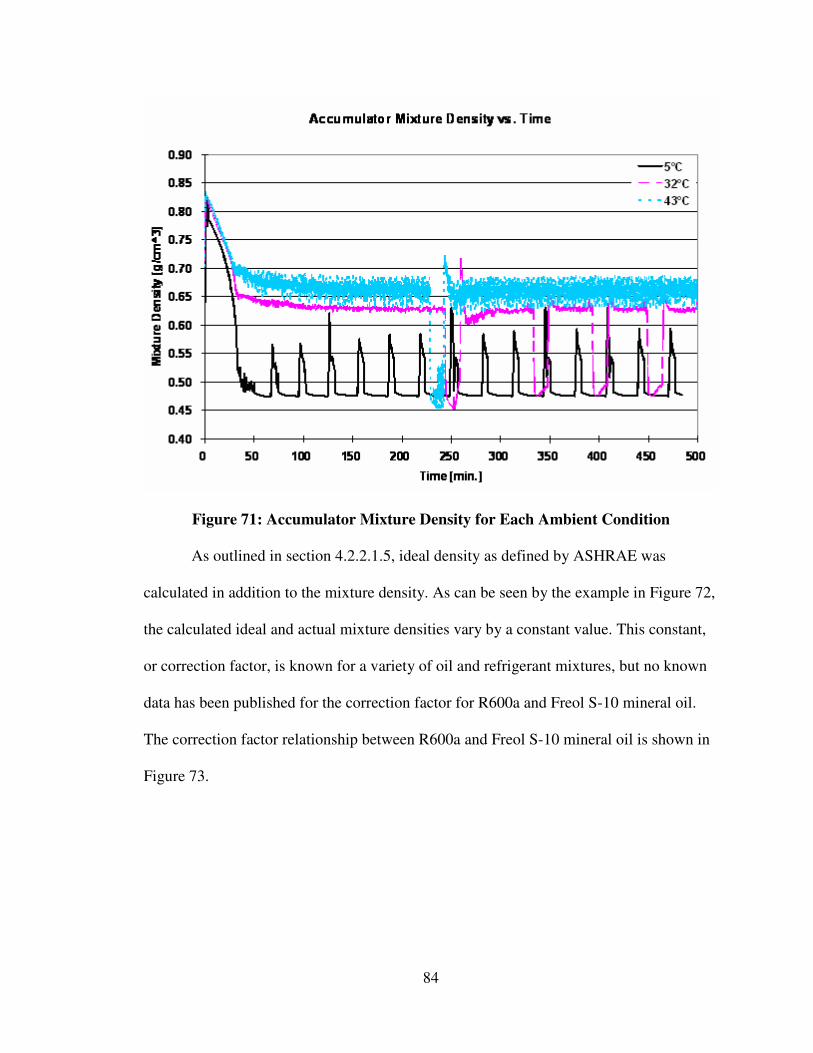
84
Figure 71: Accumulator Mixture Density for Each Ambient Condition
As outlined in section 4.2.2.1.5, ideal density as defined by ASHRAE was
calculated in addition to the mixture density. As can be seen by the example in Figure 72,
the calculated ideal and actual mixture densities vary by a constant value. This constant,
or correction factor, is known for a variety of oil and refrigerant mixtures, but no known
data has been published for the correction factor for R600a and Freol S-10 mineral oil.
The correction factor relationship between R600a and Freol S-10 mineral oil is shown in
Figure 73.
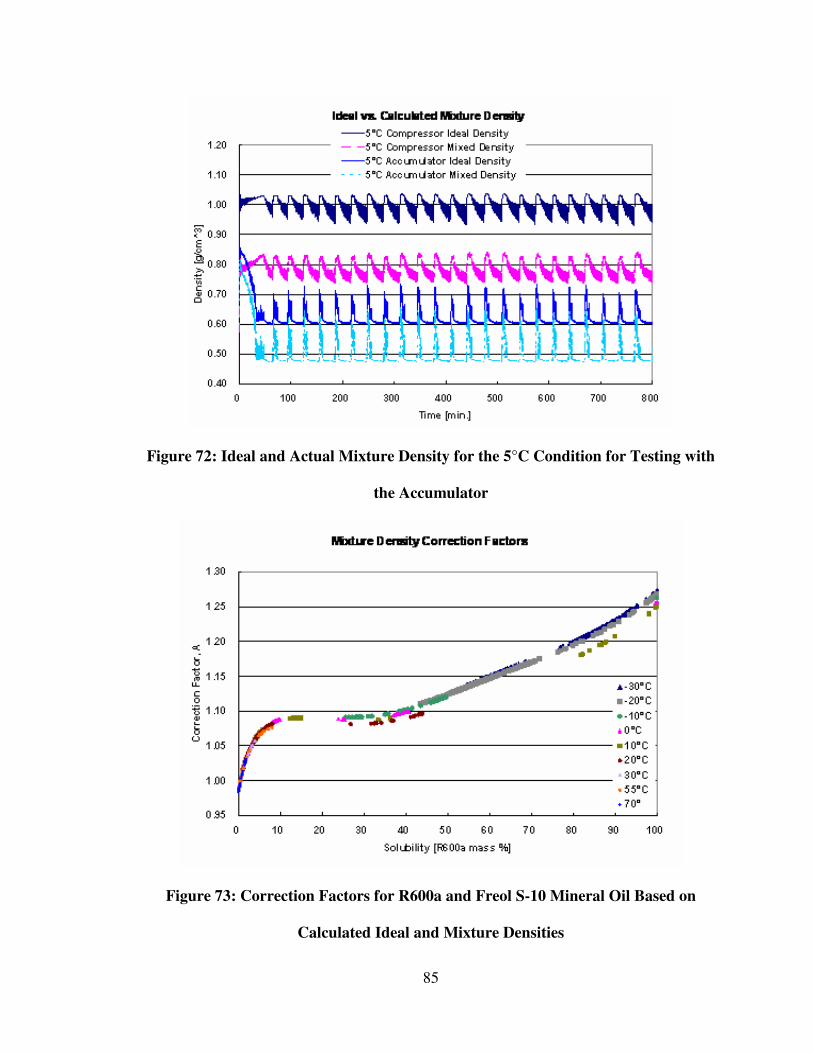
85
Figure 72: Ideal and Actual Mixture Density for the 5°C Condition for Testing with
the Accumulator
Figure 73: Correction Factors for R600a and Freol S-10 Mineral Oil Based on
Calculated Ideal and Mixture Densities
86
4.3.2 Visualization Results and Trends with the Accumulator
Visualization trends for each ambient condition, each video location, and each
time period, including pull-down, cycling, and defrost, are outlined below.
4.3.2.1 Compressor Visualization Results
4.3.2.1.1 Start-up and Pull-down
Liquid levels in the compressor are approximately the same during the start-up
and pull-down periods for each of the ambient conditions. The liquid level starts around
160mL and is sometimes as high as 180mL. In the 5°C ambient condition test, bubbles
are observed when the system is started and the compressor turns on. The bubbles form
and pop quickly, but there is no foaming of the bubbles as the refrigerant escapes from
the oil. A liquid film is observed on the top portion of the compressor visualization port,
which dispenses fluid into the liquid volume on the bottom portion of the sight glass. As
the bubbling in the liquid level subsides within 7-10 minutes after start-up, the liquid
level is observed to decrease. Fluctuations of the liquid surface level continue during the
pull-down period around 90-115mL. Start-up trends for the 32°C and 43°C conditions are
similar, but the warmer ambient conditions experience more foaming of the refrigerant
bubbles when the compressor is first turned on. The foaming action causes the liquid
level to drop significantly at first, but as the foaming and bubbling subsides, the liquid
level increases again, though not back to its original level of 160-180mL. Instead, the
liquid level stays primarily around 115mL while the compressor continues to operate.
The difference in start-up trends between the different ambient conditions is shown in
Figure 74.
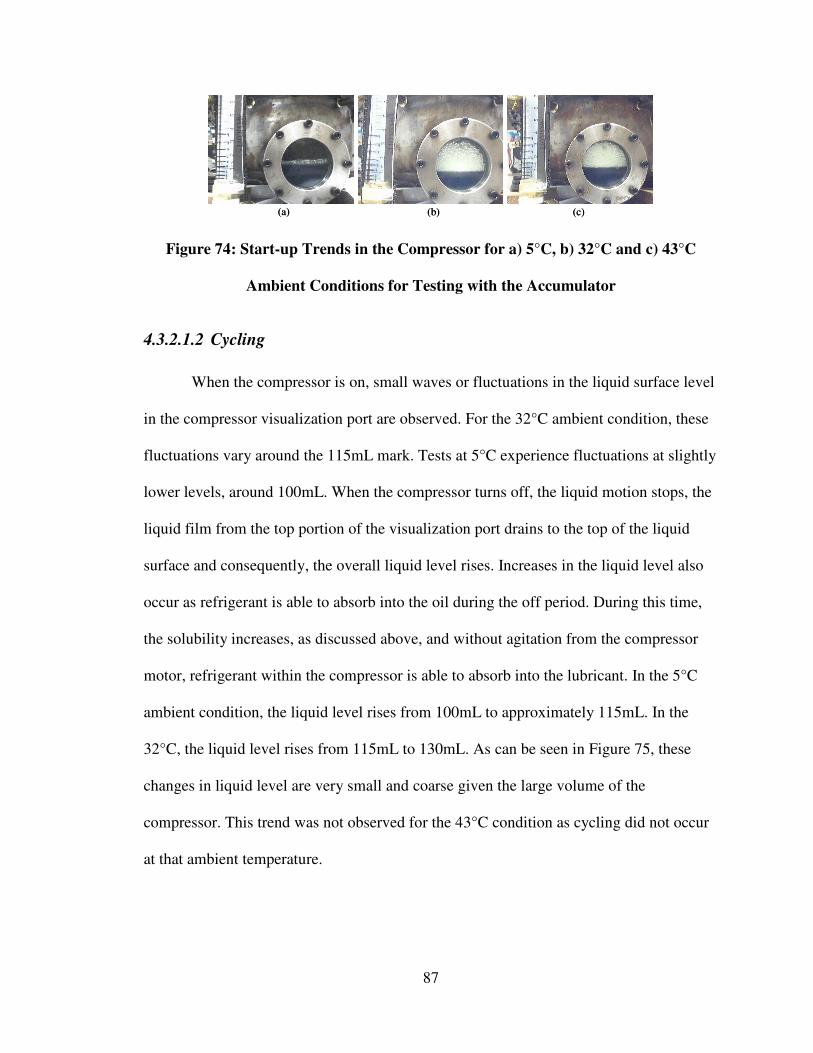
87
(a) (b) (c)(a) (b) (c)
Figure 74: Start-up Trends in the Compressor for a) 5°C, b) 32°C and c) 43°C
Ambient Conditions for Testing with the Accumulator
4.3.2.1.2 Cycling
When the compressor is on, small waves or fluctuations in the liquid surface level
in the compressor visualization port are observed. For the 32°C ambient condition, these
fluctuations vary around the 115mL mark. Tests at 5°C experience fluctuations at slightly
lower levels, around 100mL. When the compressor turns off, the liquid motion stops, the
liquid film from the top portion of the visualization port drains to the top of the liquid
surface and consequently, the overall liquid level rises. Increases in the liquid level also
occur as refrigerant is able to absorb into the oil during the off period. During this time,
the solubility increases, as discussed above, and without agitation from the compressor
motor, refrigerant within the compressor is able to absorb into the lubricant. In the 5°C
ambient condition, the liquid level rises from 100mL to approximately 115mL. In the
32°C, the liquid level rises from 115mL to 130mL. As can be seen in Figure 75, these
changes in liquid level are very small and coarse given the large volume of the
compressor. This trend was not observed for the 43°C condition as cycling did not occur
at that ambient temperature.
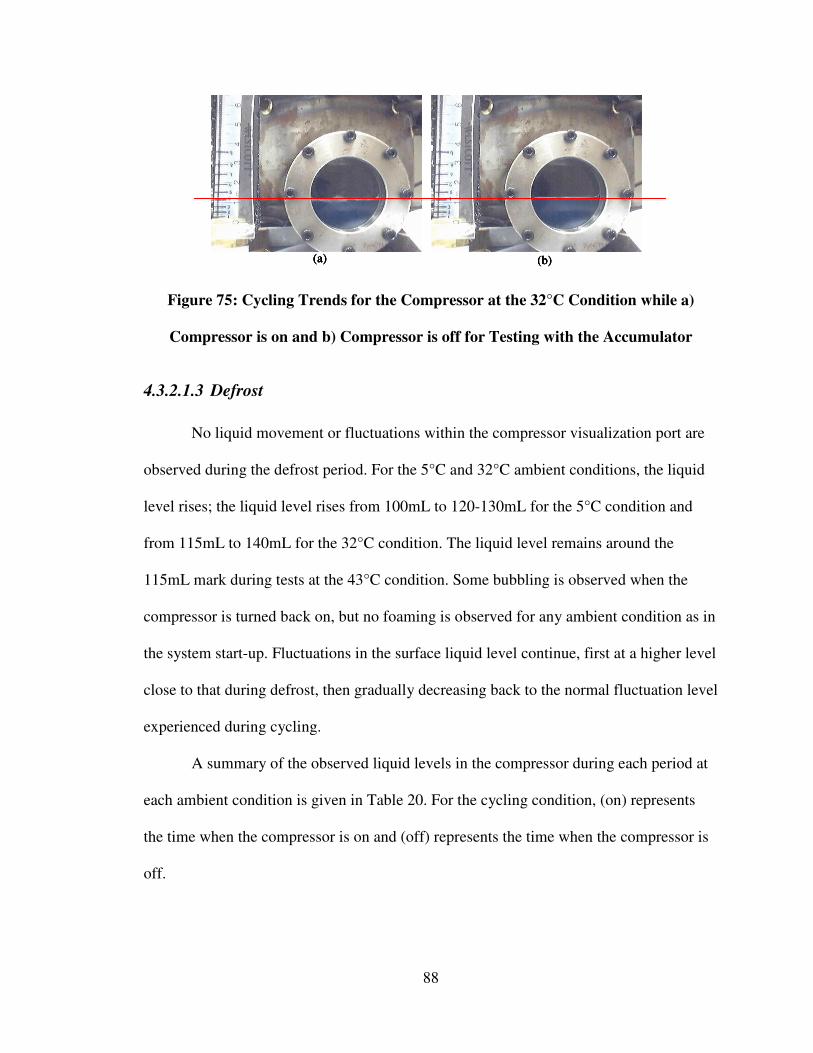
88
(a) (b)(a) (b)(a) (b)(a) (b)
Figure 75: Cycling Trends for the Compressor at the 32°C Condition while a)
Compressor is on and b) Compressor is off for Testing with the Accumulator
4.3.2.1.3 Defrost
No liquid movement or fluctuations within the compressor visualization port are
observed during the defrost period. For the 5°C and 32°C ambient conditions, the liquid
level rises; the liquid level rises from 100mL to 120-130mL for the 5°C condition and
from 115mL to 140mL for the 32°C condition. The liquid level remains around the
115mL mark during tests at the 43°C condition. Some bubbling is observed when the
compressor is turned back on, but no foaming is observed for any ambient condition as in
the system start-up. Fluctuations in the surface liquid level continue, first at a higher level
close to that during defrost, then gradually decreasing back to the normal fluctuation level
experienced during cycling.
A summary of the observed liquid levels in the compressor during each period at
each ambient condition is given in Table 20. For the cycling condition, (on) represents
the time when the compressor is on and (off) represents the time when the compressor is
off.
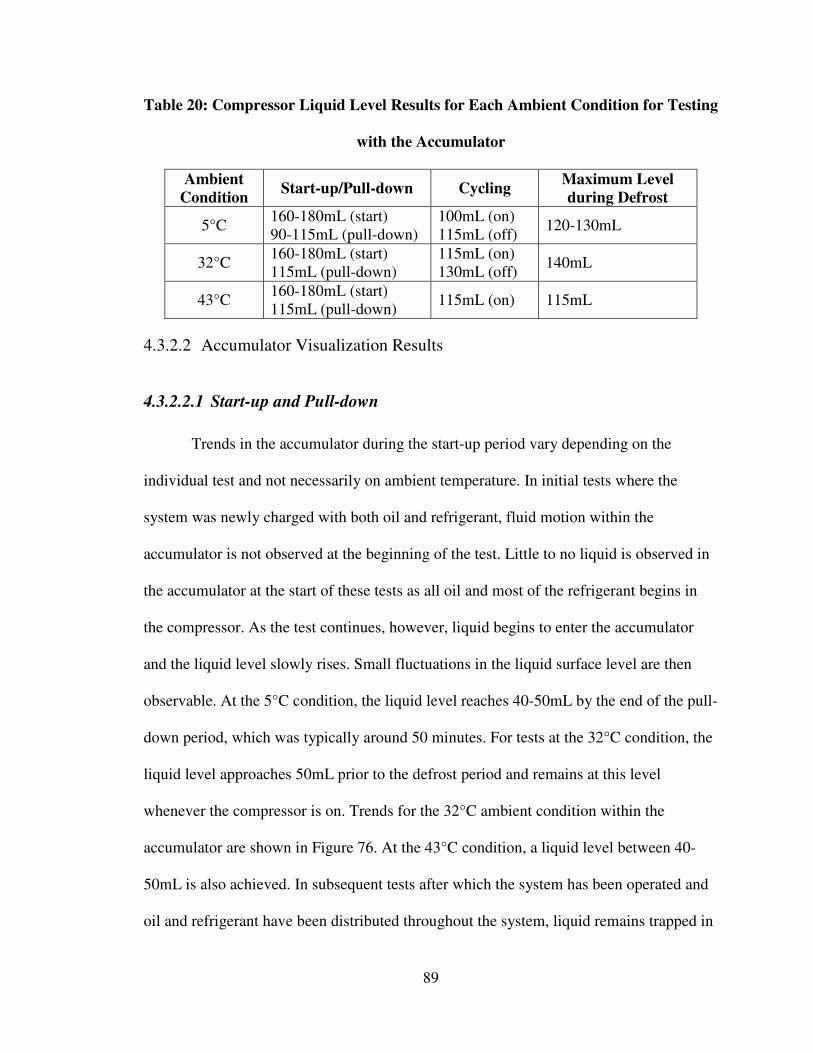
89
Table 20: Compressor Liquid Level Results for Each Ambient Condition for Testing
with the Accumulator
Ambient
Condition Start-up/Pull-down Cycling
Maximum Level
during Defrost
5°C 160-180mL (start) 90-115mL (pull-down)
100mL (on) 115mL (off)
120-130mL
32°C 160-180mL (start) 115mL (pull-down)
115mL (on) 130mL (off)
140mL
43°C 160-180mL (start) 115mL (pull-down)
115mL (on) 115mL
4.3.2.2 Accumulator Visualization Results
4.3.2.2.1 Start-up and Pull-down
Trends in the accumulator during the start-up period vary depending on the
individual test and not necessarily on ambient temperature. In initial tests where the
system was newly charged with both oil and refrigerant, fluid motion within the
accumulator is not observed at the beginning of the test. Little to no liquid is observed in
the accumulator at the start of these tests as all oil and most of the refrigerant begins in
the compressor. As the test continues, however, liquid begins to enter the accumulator
and the liquid level slowly rises. Small fluctuations in the liquid surface level are then
observable. At the 5°C condition, the liquid level reaches 40-50mL by the end of the pull-
down period, which was typically around 50 minutes. For tests at the 32°C condition, the
liquid level approaches 50mL prior to the defrost period and remains at this level
whenever the compressor is on. Trends for the 32°C ambient condition within the
accumulator are shown in Figure 76. At the 43°C condition, a liquid level between 40-
50mL is also achieved. In subsequent tests after which the system has been operated and
oil and refrigerant have been distributed throughout the system, liquid remains trapped in
90
the accumulator at the end of a test. With approximately 20-30mL of liquid initially
present in the accumulator, some bubbling within the liquid is observed when the system
is first started. As in the compressor, this initial bubbling observed is due to the boiling of
refrigerant from the oil as the solubility in the accumulator initially decreases. As in the
other tests, the liquid level slowly rises during the pull-down period as more fluid enters
the accumulator, ultimately reaching a level around 50mL.
(a) (b)(a) (b)
Figure 76: Accumulator Start-up Trends at the 32°C Condition at a) initial start-up
and b) just prior to defrost
4.3.2.2.2 Cycling
No motion is observed in the liquid in the accumulator while the compressor is off
during cycling periods for the 5°C and 32°C ambient conditions. Liquid droplets are
occasionally observed falling down the sides of the accumulator walls, particularly just
after the compressor turns off and the liquid begins to settle. For the 32°C condition,
there is no change in the liquid level, so it remains around 50mL. For the 5°C condition,
however, the liquid level initially drops to around 40mL as the compressor is turned off.
During the off period, there is a possible slow increase in liquid level back up to 50mL.
There are two possible causes for this increase in liquid volume. The first is similar to the
rise observed in the compressor. When the compressor is off, the solubility rises,
91
allowing refrigerant to absorb within the oil. Also during this time, liquid flow-back from
the accumulator outlet piping into the accumulator is possible, adding liquid volume to
the vessel. While this trend is expected based on prior the results of prior research, this
trend was not observed first-hand.
When the compressor is turned on, bubbling is observed in the liquid within the
accumulator for both ambient conditions. Observations at the 5°C condition show a more
violent motion with a sudden surge in liquid level up to 55mL as the compressor is turned
on. Liquid that was trapped within the bottom tubes of the evaporator may be suddenly
sucked into the accumulator as the compressor turns on and the suction pressure quickly
drops. This liquid motion gradually subsides and the liquid level drops back down to
around 50mL after several minutes. In both ambient conditions, the liquid motion is
observed to be around 50mL while the compressor is on. Liquid motion is also observed
around 50mL for the 43°C condition, though these tests did not experience a compressor-
off time period other than during defrost, as indicated previously.
4.3.2.2.3 Defrost
Similar to trends during the cycling off-period, the liquid level in the accumulator
initially drops to around 40mL for tests at the 5°C ambient condition during the defrost
period. Droplets are seen raining down the sides of the accumulator walls and shortly
thereafter sudden increases and decreases in the liquid level of the fluid occur as large
bubbles form and pop within the liquid and/or more liquid enters the accumulator. The
sudden changes in liquid level bring the total liquid level volume to 50 and 55mL, and
sometimes as high as 60mL, the maximum capacity of the accumulator for its installed
orientation. The surges in liquid level continue but the camera visualization grows poor
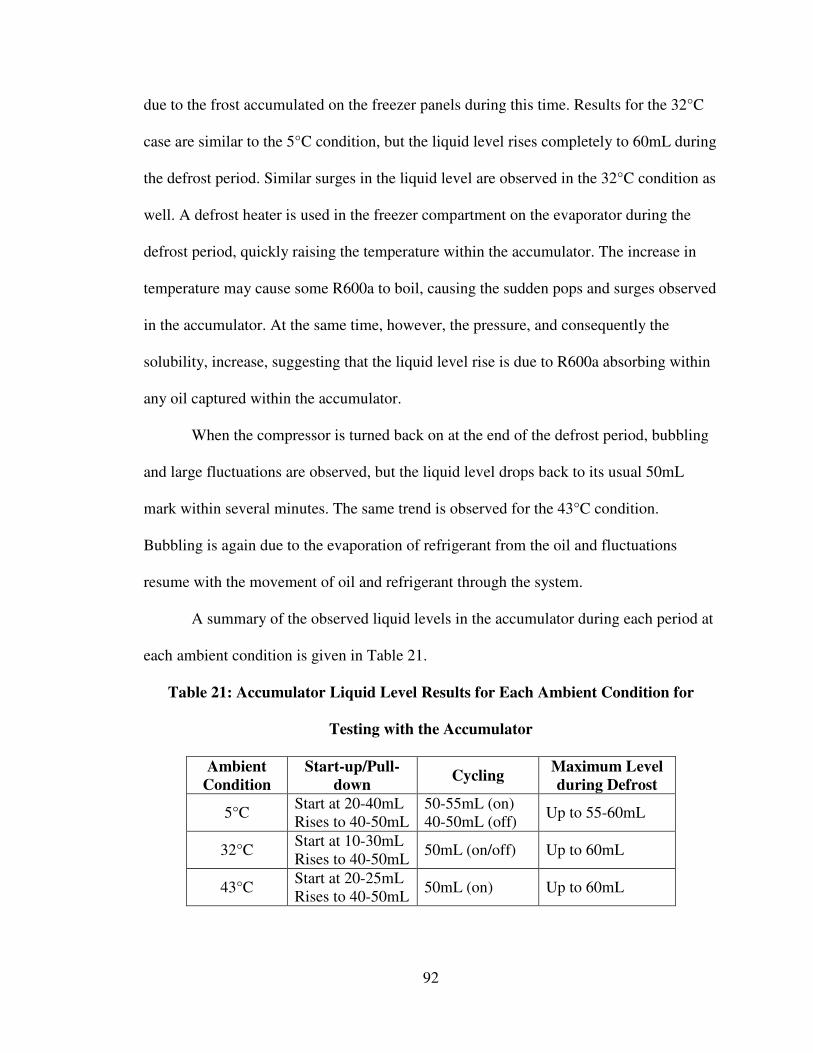
92
due to the frost accumulated on the freezer panels during this time. Results for the 32°C
case are similar to the 5°C condition, but the liquid level rises completely to 60mL during
the defrost period. Similar surges in the liquid level are observed in the 32°C condition as
well. A defrost heater is used in the freezer compartment on the evaporator during the
defrost period, quickly raising the temperature within the accumulator. The increase in
temperature may cause some R600a to boil, causing the sudden pops and surges observed
in the accumulator. At the same time, however, the pressure, and consequently the
solubility, increase, suggesting that the liquid level rise is due to R600a absorbing within
any oil captured within the accumulator.
When the compressor is turned back on at the end of the defrost period, bubbling
and large fluctuations are observed, but the liquid level drops back to its usual 50mL
mark within several minutes. The same trend is observed for the 43°C condition.
Bubbling is again due to the evaporation of refrigerant from the oil and fluctuations
resume with the movement of oil and refrigerant through the system.
A summary of the observed liquid levels in the accumulator during each period at
each ambient condition is given in Table 21.
Table 21: Accumulator Liquid Level Results for Each Ambient Condition for
Testing with the Accumulator
Ambient
Condition
Start-up/Pull-
down Cycling
Maximum Level
during Defrost
5°C Start at 20-40mL Rises to 40-50mL
50-55mL (on) 40-50mL (off)
Up to 55-60mL
32°C Start at 10-30mL Rises to 40-50mL
50mL (on/off) Up to 60mL
43°C Start at 20-25mL Rises to 40-50mL
50mL (on) Up to 60mL
93
4.3.2.3 Accumulator Outlet Visualization Results
4.3.2.3.1 Start-up and Pull-down
For each of the ambient conditions, there is a small pool of liquid observed in the
accumulator outlet sight glass prior to the start of the system. This liquid is assumed to be
trapped oil and/or liquid R600a due to the orientation of the sight glass. In general, little
motion is observed when the system is turned on though some liquid fluctuation and
bubbling is occasionally visible. For some of the 5°C condition tests, however, more
violent motion within the sight glass and lots of bubbling are observed at the system start-
up. This variation depends on when the system was stopped in previous tests. Depending
on the amount of oil and refrigerant available in the sight glass, more or less bubbling is
observed as refrigerant boils out of the oil. During the pull-down period, liquid motion
and fluctuation continues to be observed, but liquid generally only fills 1/4-1/3 of the
sight glass, which is positioned in a vertical orientation. As with other locations within
the system, bubbling observed at start-up is consistent with a decrease in solubility and
the boiling of refrigerant from the oil.
4.3.2.3.2 Cycling
As is observed towards the middle and end of the pull-down period, fluctuations
of liquid are observed in the accumulator outlet sight glass while the compressor is on.
Liquid fills approximately 1/4-1/3 of the sight glass and bounces as oil and/or refrigerant
passes through. In the 5°C condition, a lot of motion and bubbling are initially observed
when the compressor is first turned on after an off-period. For the 5°C and 32°C
conditions when the compressor is off, liquid motion initially stops. After a few minutes,
94
however, bubbling and “popping” of the liquid is observed in the accumulator outlet sight
glass. Bubble formation is slow at first and gradually increases in size and frequency as
the compressor off-period comes to an end. While solubility is suggested to increase with
increasing temperature and pressure within the accumulator, the increase in temperature
at the evaporator and accumulator outlet may also cause boiling of any liquid refrigerant
left in the accumulator outlet sight glass or piping. Because the accumulator has a large
mass of fluid of both oil and refrigerant, boiling of any refrigerant within the accumulator
is not observed as the temperature at this location does not change as rapidly. With little
liquid to retain temperature, however, refrigerant just outside of the accumulator may boil
out through the sight glass during off periods. Bubbling motion stops just briefly before
lots of liquid and bubbles are observed through the sight glass as the compressor is turned
back on.
4.3.2.3.3 Defrost
Visualization is generally poor during the defrost period as noted with the
accumulator. For the 32°C and 43°C conditions, liquid motion within the sight glass
initially stops when the defrost period begins. Several minutes later, lots of bubbling and
liquid popping begins and continues until liquid motion can no longer be observed due to
poor visualization. Similar behavior is observed in the 5°C test, though there is a lot of
motion at the start of the defrost and foamy bubbles fill the sight glass similar to when the
compressor is turned on after an off-period. Again, bubbles during the defrost period
when the compressor is off are assumed to be due to the boiling of refrigerant from a
large increase in temperature due to the defrost heater.
95
4.3.2.4 Suction and Discharge Line Visualization Results
4.3.2.4.1 Start-up and Pull-down
For all ambient conditions, liquid motion, assumed to be mostly compressor oil, is
observed in both the suction and discharge line at the beginning of a test. Liquid in the
discharge line is only observed for a brief period and then is assumed to subside along the
very bottom of the sight glass. Liquid motion is more easily observed in the suction line,
though it is assumed that some oil continues to leave the compressor through the
discharge line throughout the test.
4.3.2.4.2 Cycling
For the 5°C and 32°C conditions, no motion is observed in either the suction or
discharge line when the compressor is off during cycling. When the compressor turns
back on, liquid is observed in the suction line. It is assumed that some liquid oil flows
through the discharge line as well, but liquid motion is not as prominent in the discharge
line for either ambient condition. As the compressor remains on in the 43°C test, liquid
flow through the suction line is not as pronounced as it is during the start of the test.
Little to no motion is observed in the discharge line, as in the other ambient conditions.
4.3.2.4.3 Defrost
For all ambient conditions, liquid motion stops in both lines as the defrost period
begins. Occasional bubbles and surges of liquid are observed through the suction line for
all conditions. Lots of liquid motion is observed in the suction line when the compressor
is turned back on, especially for the 5°C ambient condition, and some of the liquid has a
green tint, suggesting that it may be the mineral oil with the UV dye. It is unknown,
96
however, whether or not refrigerant may also be included in this liquid returning to the
compressor. Superheat results suggest that liquid R600a flow back to the compressor
through the suction line is only a concern during and after defrost for the 5°C ambient
condition.
4.3.3 Refrigerant and Oil Mass Analysis Results
Using the method outlined in section 4.2.2.1.6, the approximate mass of oil and
refrigerant were calculated for the compressor and accumulator volumes during pull-
down, cycling, and defrost periods. Snapshots of data were taken at pre-determined time
intervals and matched with corresponding video results. Using the data for those points
and the liquid level in the compressor and accumulator at those times, the mass of the oil
and refrigerant were calculated. Different trends were noted for each ambient condition
during each period of interest. These results are outlined in the following section.
4.3.3.1 Mass Balance Trends during Pull-down
As mentioned above, data were noted at specific time intervals throughout the
pull-down period. Data was used in conjunction with solubility, mixture density, and
volume level information to determine the mass of oil and refrigerant in the compressor
and accumulator. A sample of data collected for the 5°C condition is provided in
Table 22 and Table 23 and corresponds to the graph in Figure 77.
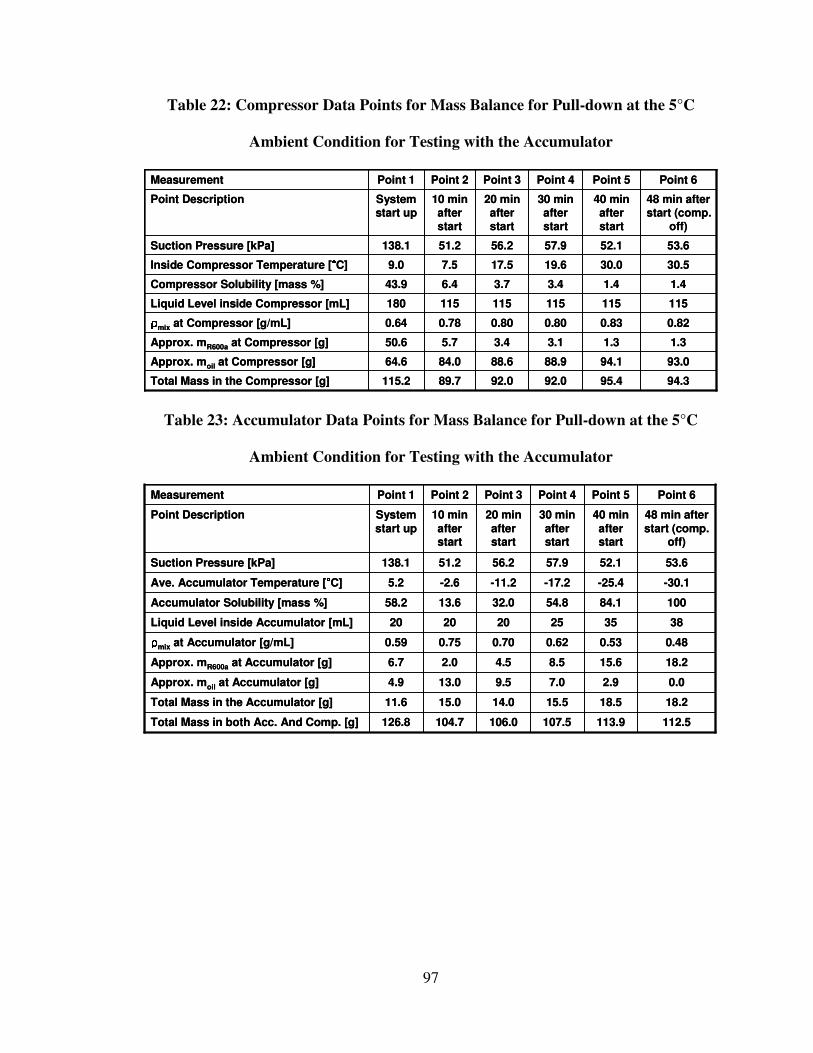
97
Table 22: Compressor Data Points for Mass Balance for Pull-down at the 5°C
Ambient Condition for Testing with the Accumulator
93.094.188.988.684.064.6Approx. moil at Compressor [g]
94.395.492.092.089.7115.2Total Mass in the Compressor [g]
0.820.830.800.800.780.64ρρρρmix at Compressor [g/mL]
1.41.43.43.76.443.9Compressor Solubility [mass %]
30.530.019.617.57.59.0Inside Compressor Temperature [°°°°C]
1.31.33.13.45.750.6Approx. mR600a at Compressor [g]
115115115115115180Liquid Level inside Compressor [mL]
53.652.157.956.251.2138.1Suction Pressure [kPa]
48 min after start (comp.
off)
40 min after start
30 min after start
20 min after start
10 min after start
System start up
Point Description
Point 6Point 5Point 4Point 3Point 2Point 1Measurement
Table 23: Accumulator Data Points for Mass Balance for Pull-down at the 5°C
Ambient Condition for Testing with the Accumulator
18.218.515.514.015.011.6Total Mass in the Accumulator [g]
112.5113.9107.5106.0104.7126.8Total Mass in both Acc. And Comp. [g]
0.02.97.09.513.04.9Approx. moil at Accumulator [g]
0.480.530.620.700.750.59ρρρρmix at Accumulator [g/mL]
-30.1-25.4-17.2-11.2-2.65.2Ave. Accumulator Temperature [°°°°C]
10084.154.832.013.658.2Accumulator Solubility [mass %]
18.215.68.54.52.06.7Approx. mR600a at Accumulator [g]
383525202020Liquid Level inside Accumulator [mL]
53.652.157.956.251.2138.1Suction Pressure [kPa]
48 min after
start (comp. off)
40 min
after start
30 min
after start
20 min
after start
10 min
after start
System
start up
Point Description
Point 6Point 5Point 4Point 3Point 2Point 1Measurement
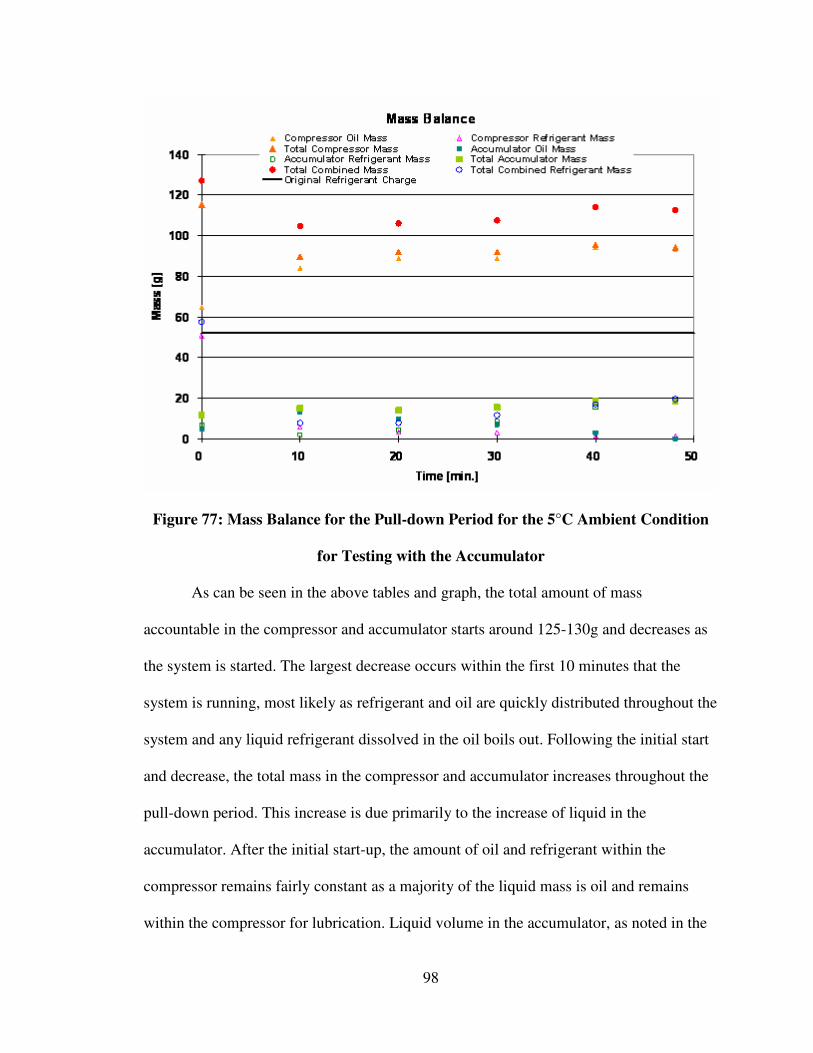
98
Figure 77: Mass Balance for the Pull-down Period for the 5°C Ambient Condition
for Testing with the Accumulator
As can be seen in the above tables and graph, the total amount of mass
accountable in the compressor and accumulator starts around 125-130g and decreases as
the system is started. The largest decrease occurs within the first 10 minutes that the
system is running, most likely as refrigerant and oil are quickly distributed throughout the
system and any liquid refrigerant dissolved in the oil boils out. Following the initial start
and decrease, the total mass in the compressor and accumulator increases throughout the
pull-down period. This increase is due primarily to the increase of liquid in the
accumulator. After the initial start-up, the amount of oil and refrigerant within the
compressor remains fairly constant as a majority of the liquid mass is oil and remains
within the compressor for lubrication. Liquid volume in the accumulator, as noted in the
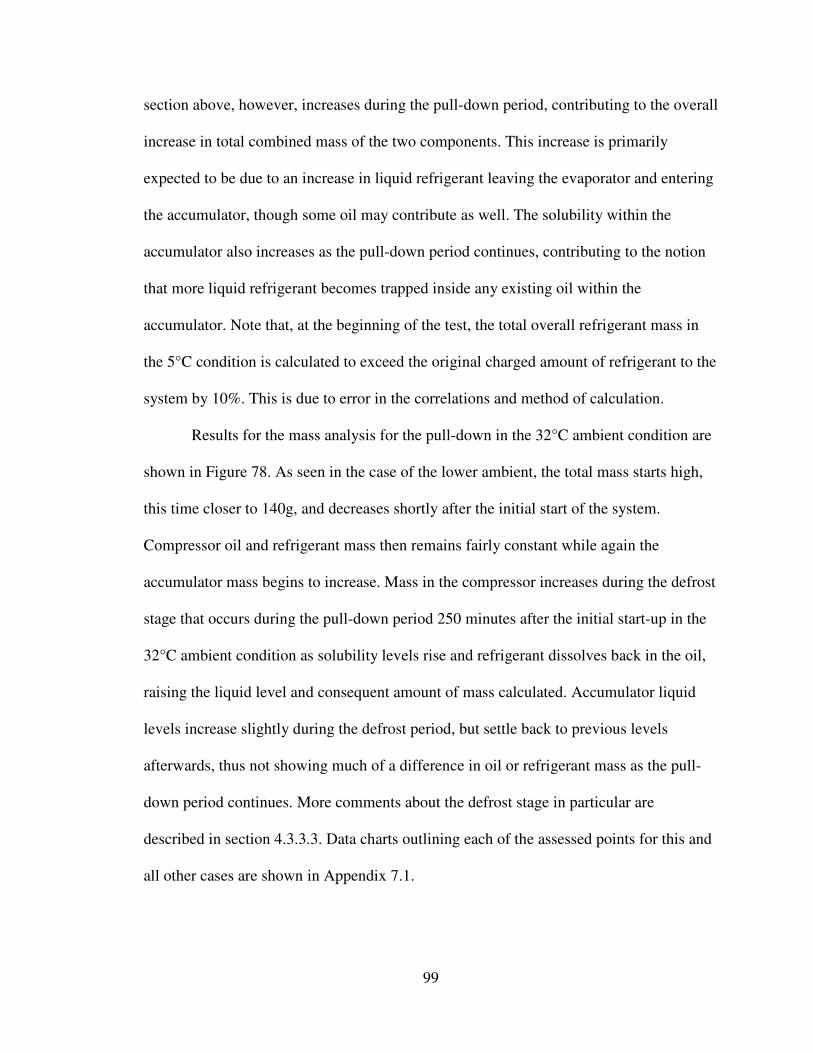
99
section above, however, increases during the pull-down period, contributing to the overall
increase in total combined mass of the two components. This increase is primarily
expected to be due to an increase in liquid refrigerant leaving the evaporator and entering
the accumulator, though some oil may contribute as well. The solubility within the
accumulator also increases as the pull-down period continues, contributing to the notion
that more liquid refrigerant becomes trapped inside any existing oil within the
accumulator. Note that, at the beginning of the test, the total overall refrigerant mass in
the 5°C condition is calculated to exceed the original charged amount of refrigerant to the
system by 10%. This is due to error in the correlations and method of calculation.
Results for the mass analysis for the pull-down in the 32°C ambient condition are
shown in Figure 78. As seen in the case of the lower ambient, the total mass starts high,
this time closer to 140g, and decreases shortly after the initial start of the system.
Compressor oil and refrigerant mass then remains fairly constant while again the
accumulator mass begins to increase. Mass in the compressor increases during the defrost
stage that occurs during the pull-down period 250 minutes after the initial start-up in the
32°C ambient condition as solubility levels rise and refrigerant dissolves back in the oil,
raising the liquid level and consequent amount of mass calculated. Accumulator liquid
levels increase slightly during the defrost period, but settle back to previous levels
afterwards, thus not showing much of a difference in oil or refrigerant mass as the pull-
down period continues. More comments about the defrost stage in particular are
described in section 4.3.3.3. Data charts outlining each of the assessed points for this and
all other cases are shown in Appendix 7.1.
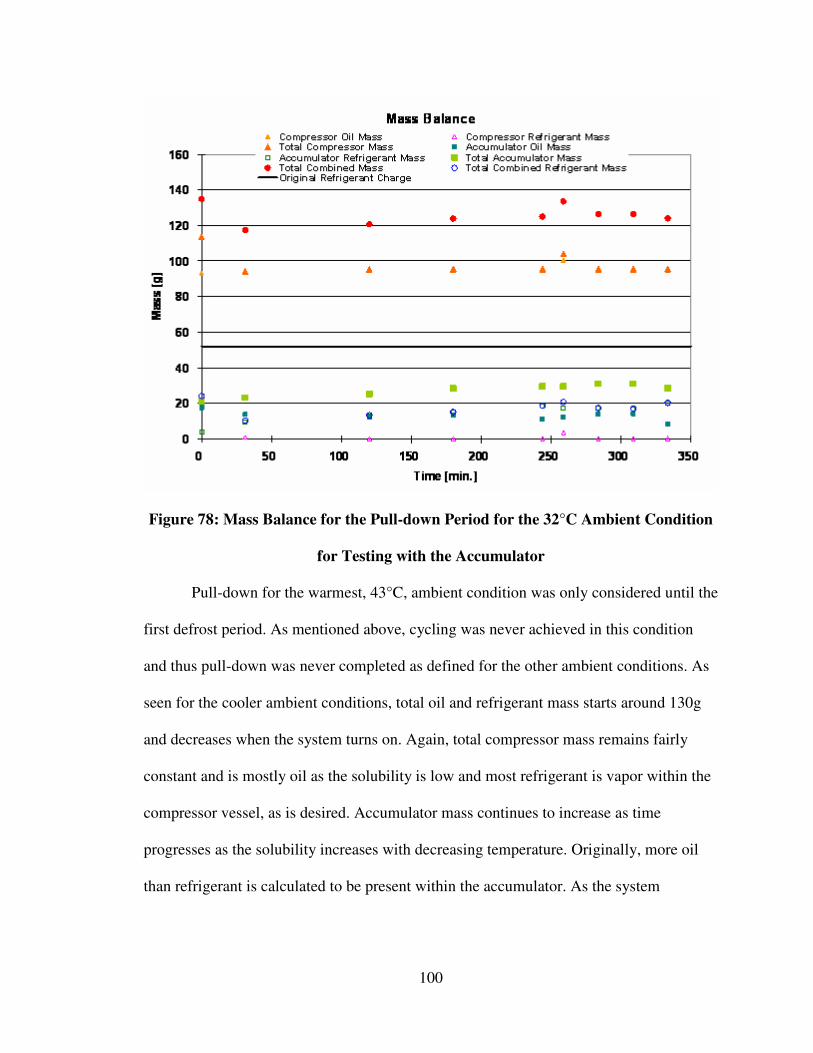
100
Figure 78: Mass Balance for the Pull-down Period for the 32°C Ambient Condition
for Testing with the Accumulator
Pull-down for the warmest, 43°C, ambient condition was only considered until the
first defrost period. As mentioned above, cycling was never achieved in this condition
and thus pull-down was never completed as defined for the other ambient conditions. As
seen for the cooler ambient conditions, total oil and refrigerant mass starts around 130g
and decreases when the system turns on. Again, total compressor mass remains fairly
constant and is mostly oil as the solubility is low and most refrigerant is vapor within the
compressor vessel, as is desired. Accumulator mass continues to increase as time
progresses as the solubility increases with decreasing temperature. Originally, more oil
than refrigerant is calculated to be present within the accumulator. As the system
101
approaches the first defrost, however, this trend reverses and more liquid refrigerant than
oil is expected to be present within the accumulator. These trends are shown in Figure 79.
Figure 79: Mass Balance for the Pull-down Period for the 43°C Ambient Condition
for Testing with the Accumulator
4.3.3.2 Mass Balance Trends during Cycling
In addition to pull-down, cycling mass balance trends were noted. Only the 5°C
and 32°C cases were examined as cycling did not occur at the 43°C ambient condition.
Cycling included time when the compressor was on, during which the amount of
refrigerant liquid decreased in the compressor and fluctuated slightly in the accumulator;
and time when the compressor was off, during which the amount of refrigerant increased
in comparison to the on period because of increases in solubility and possible liquid flow-
back through the system.
102
In the 5°C ambient condition for cycling, depicted in Figure 80, the compressor
and accumulator mass remained relatively constant during the off-period, which consists
of data points between 7 and 32 minutes. In the 32°C condition, however, shown in
Figure 81, the compressor and accumulator mass remained relatively constant during the
on-period, depicted by points between 0 and 45 minutes. This is most likely due to the
amount of time spent in each condition for each ambient case. Cycling on-time for the
5°C condition was considerably shorter than that for the 32°C condition and just the
opposite was true for the off-time. As the off-period was longer for the 5°C condition, the
system was able to stabilize during that time, showing little changes in mass trends. The
similar is true for the 32°C condition during on-time. For both conditions, mass within
the compressor was always mostly oil at all times, as expected, and mass within the
accumulator was calculated to be mostly refrigerant during the off-periods and a
combination of oil and refrigerant during the on-periods.
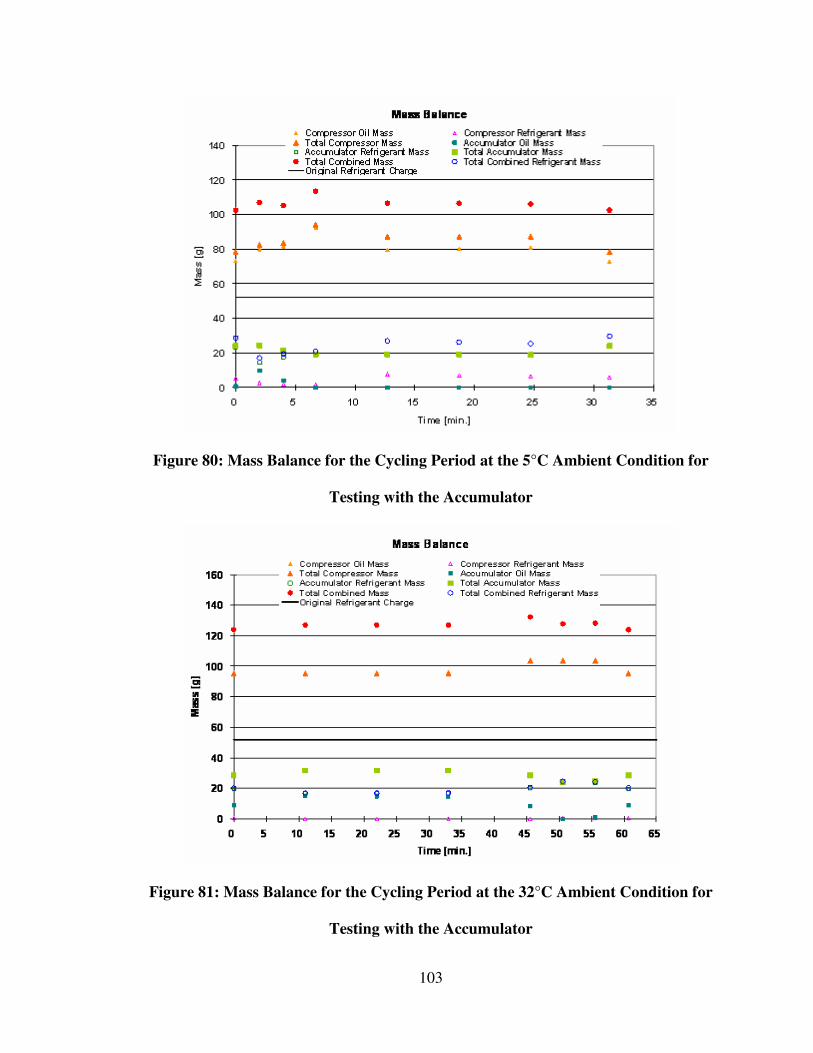
103
Figure 80: Mass Balance for the Cycling Period at the 5°C Ambient Condition for
Testing with the Accumulator
Figure 81: Mass Balance for the Cycling Period at the 32°C Ambient Condition for
Testing with the Accumulator
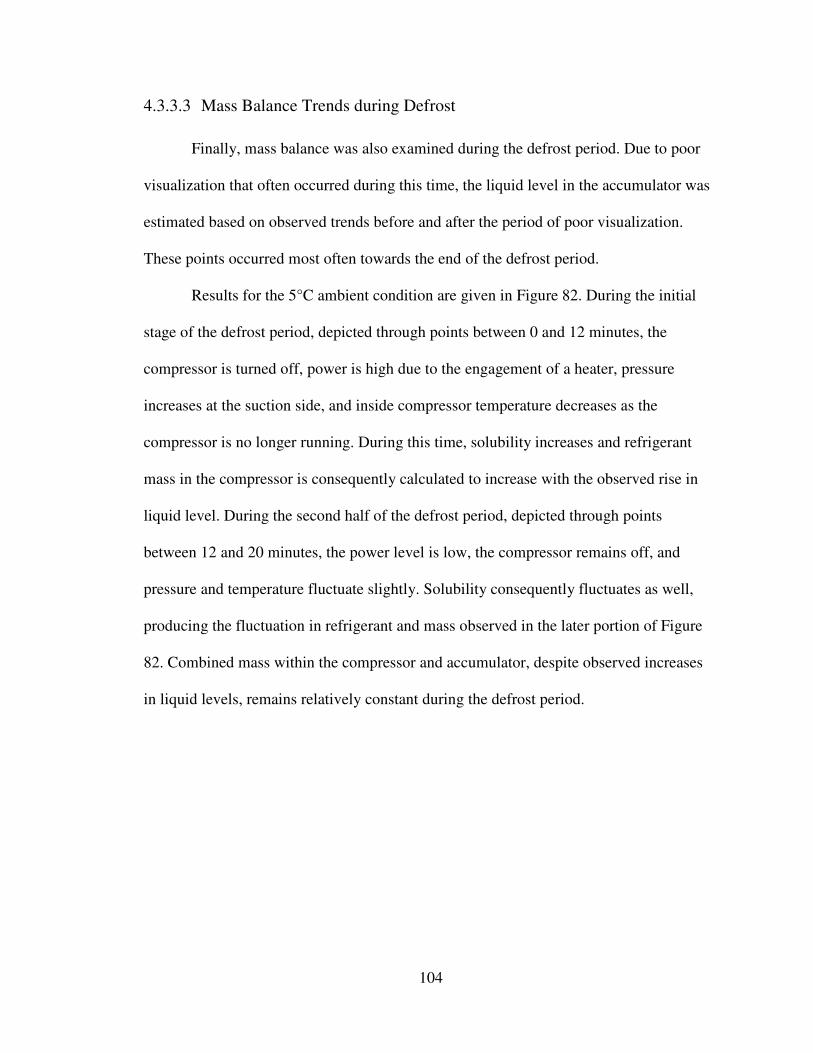
104
4.3.3.3 Mass Balance Trends during Defrost
Finally, mass balance was also examined during the defrost period. Due to poor
visualization that often occurred during this time, the liquid level in the accumulator was
estimated based on observed trends before and after the period of poor visualization.
These points occurred most often towards the end of the defrost period.
Results for the 5°C ambient condition are given in Figure 82. During the initial
stage of the defrost period, depicted through points between 0 and 12 minutes, the
compressor is turned off, power is high due to the engagement of a heater, pressure
increases at the suction side, and inside compressor temperature decreases as the
compressor is no longer running. During this time, solubility increases and refrigerant
mass in the compressor is consequently calculated to increase with the observed rise in
liquid level. During the second half of the defrost period, depicted through points
between 12 and 20 minutes, the power level is low, the compressor remains off, and
pressure and temperature fluctuate slightly. Solubility consequently fluctuates as well,
producing the fluctuation in refrigerant and mass observed in the later portion of Figure
82. Combined mass within the compressor and accumulator, despite observed increases
in liquid levels, remains relatively constant during the defrost period.
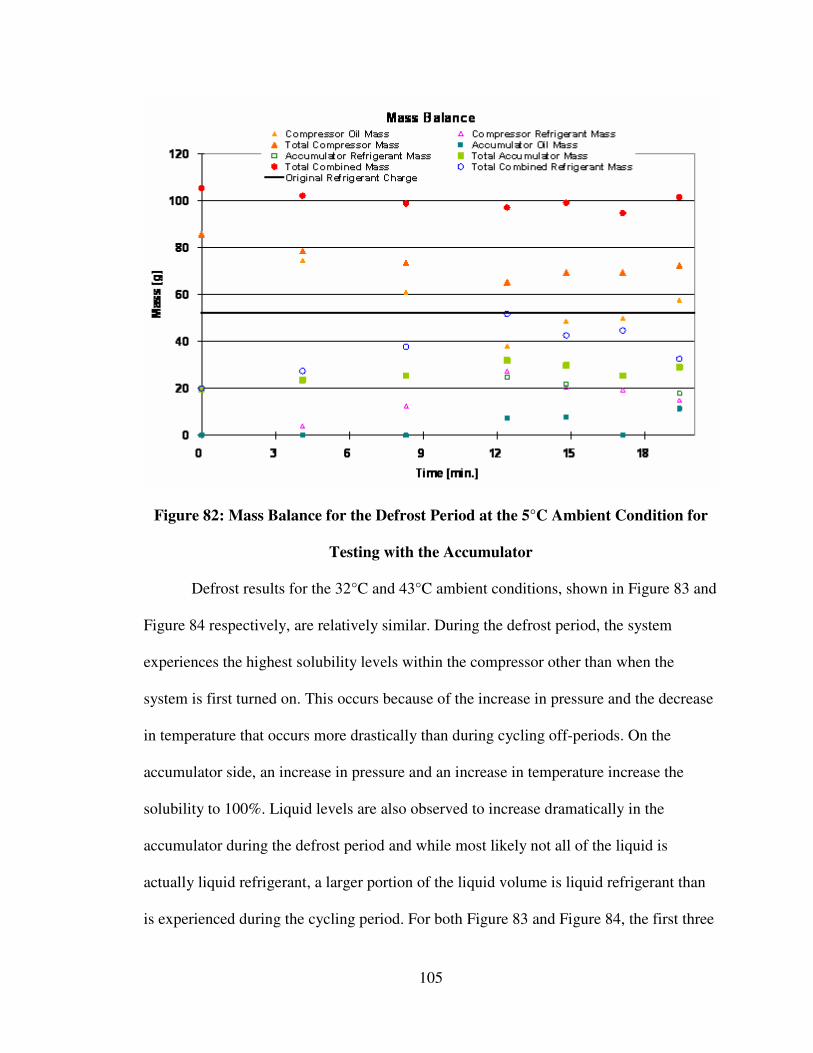
105
Figure 82: Mass Balance for the Defrost Period at the 5°C Ambient Condition for
Testing with the Accumulator
Defrost results for the 32°C and 43°C ambient conditions, shown in Figure 83 and
Figure 84 respectively, are relatively similar. During the defrost period, the system
experiences the highest solubility levels within the compressor other than when the
system is first turned on. This occurs because of the increase in pressure and the decrease
in temperature that occurs more drastically than during cycling off-periods. On the
accumulator side, an increase in pressure and an increase in temperature increase the
solubility to 100%. Liquid levels are also observed to increase dramatically in the
accumulator during the defrost period and while most likely not all of the liquid is
actually liquid refrigerant, a larger portion of the liquid volume is liquid refrigerant than
is experienced during the cycling period. For both Figure 83 and Figure 84, the first three
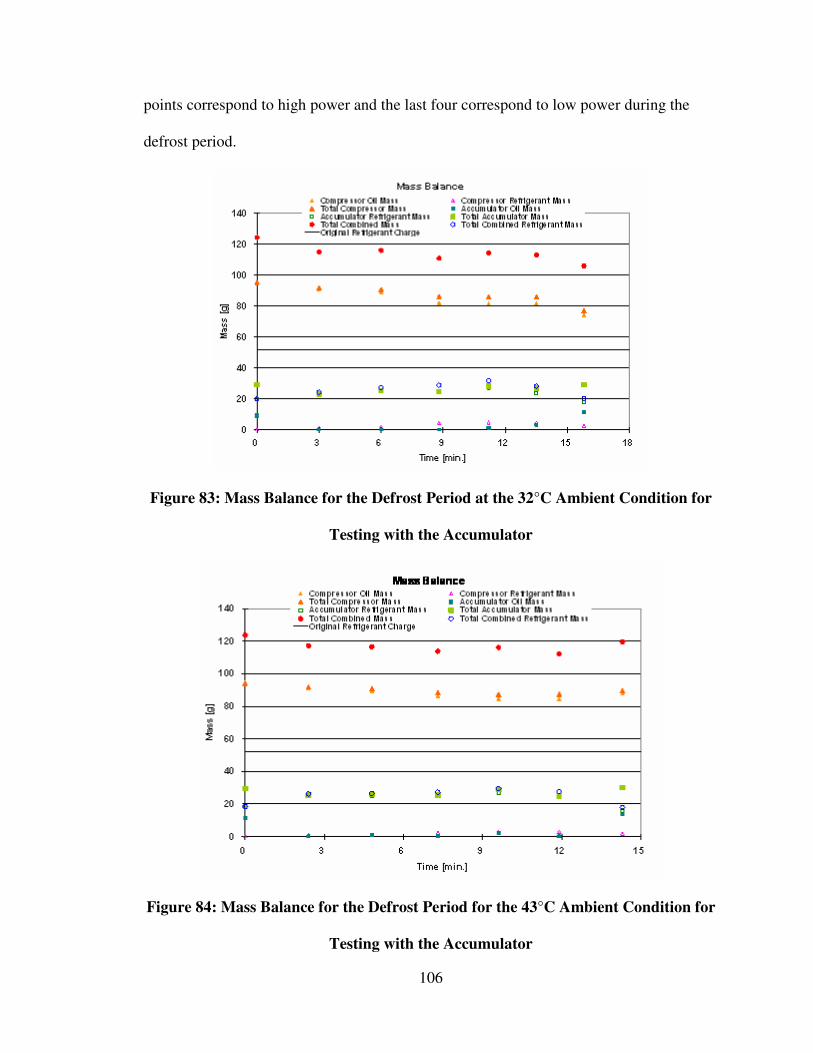
106
points correspond to high power and the last four correspond to low power during the
defrost period.
Figure 83: Mass Balance for the Defrost Period at the 32°C Ambient Condition for
Testing with the Accumulator
Figure 84: Mass Balance for the Defrost Period for the 43°C Ambient Condition for
Testing with the Accumulator
107
4.3.3.4 Issues with mass balance calculations
Because of the unknown errors associated with the solubility and mixture density,
as well as the errors in determining liquid level from video observation, the accuracy of
mass balance calculations is a large concern. While the correlation often suggested that
the solubility in the accumulator was 100%, it is not safe to assume that all liquid present
in the accumulator is consequently liquid refrigerant at these times. Between tests, when
the system was off, oil was observed to be trapped in the bottom of the accumulator.
Whether this oil remained trapped in the accumulator or was able to re-circulate
throughout the system when it was turned back on is unknown, though it is likely that
much of it remained within the accumulator. The horizontal orientation of the
accumulator most likely prohibited large amounts of oil from leaving the accumulator
during operation. Thus, a solubility of 100% should not assume a total volume of pure
liquid refrigerant. Unfortunately, the method of analysis does not allow for such
considerations and assumptions about the available amount of oil or liquid refrigerant in
the accumulator or compressor would only contribute to larger analysis error.
Consequently, the above calculations and analysis should be reviewed with caution and
absolute numbers should not be taken as exact measurements.
In addition to the correlation challenge, it is also important to note the variability
and sensitivity of the liquid level measurements. While certain levels may have been
observed in the compressor and accumulator during on-periods, more liquid could have
been present in these components on the walls of the vessels, particularly in the
compressor. Noted liquid level rise during the off-periods, particularly within the
compressor, may have just accounted for the liquid that had previously been coating the
108
walls of the vessel and not necessarily represent “new” liquid coming from other
components of the system. This is not true in the accumulator during the defrost period,
however, as liquid was observed actually entering the accumulator at that time. Also note
that oil and refrigerant mass calculated was only for liquid volume and did not consider
the amount of refrigerant vapor mass that could have also been residing in the compressor
or accumulator.
4.4 Summary of Oil and Refrigerant Flow with the Accumulator
Despite the challenges in the analysis method, the above results allow for basic
statements and conclusions about oil and refrigerant distribution throughout a household
refrigeration system. The following section summarizes the observations that were noted
during the pull-down, cyclic, and defrost periods for oil and refrigerant flow.
Prior to the very first start-up, all of the oil and liquid refrigerant are located in the
compressor, as both liquids are originally charged to this location. Some R600a dissolves
into the compressor oil and the system equalizes to a pressure lower than the saturation
pressure of R600a at the given ambient temperature. At the 5°C ambient condition, for
example, the starting pressure for the system is around 140kPa whereas the saturation
pressure for R600a at 5°C is 187kPa. Similarly, the starting pressure at the 32°C
condition is around 245kPa while the saturation pressure is 427kPa. Such a decrease in
starting pressure due to the dissolved refrigerant in oil greatly reduces the amount of
torque and power required for the start of the compressor.
As the system is started, bubbling occurs in the compressor as the solubility
decreases and refrigerant boils out of the oil. For the very first test, bubbling only occurs
at the compressor as this is the only location where both oil and refrigerant are present. In
109
subsequent start-up periods, after the system has circulated both oil and refrigerant,
bubbling occurs at other locations, including the accumulator. Warmer ambient
conditions experience more foaming action as more power is required at start-up,
resulting in increased agitation of the fluid. Solubility at higher ambient temperatures also
drops to lower levels than that at lower ambient temperatures, resulting in more
refrigerant boiling out of the oil.
During the pull-down period, a small amount of oil leaves the compressor and
circulates throughout the system. Some of the oil becomes trapped in the accumulator and
other locations where orientation and gravity may prevent it from returning to the
compressor. Total liquid volume in the compressor decreases as refrigerant boils out of
the oil and small amounts of oil leave to circulate through the system. In total, as
described by the above results, it is suggested that 15-20% of the original oil charge
leaves the compressor and circulates through the system once it is started. Some of this
oil continuously moves throughout the system, but at least 10% of the original oil charge
may become trapped within the accumulator. Fluctuations in liquid volumes occur when
the compressor is on as oil and refrigerant continue to move throughout the system.
As in pull-down, liquid fluctuations continue during the cycling period whenever
the compressor is on. When the compressor is off, liquid motion stops and any fluid that
previously traversed on pipe or vessel walls settles to the lowest point of the occupied
space. Solubility rise causes stationary liquid volumes to slowly increase as refrigerant is
able to absorb with any available oil. When the compressor turns back on, bubbling
occurs within the accumulator and compressor as refrigerant boils back out of the oil and
returns to movement throughout the system. Whenever the compressor is turned back on,
110
sudden surges of fluid move quickly through the accumulator and suction line during the
first few seconds after turning on as the change in low-side pressure draws this liquid
quickly to the compressor. For experiments with the accumulator, enough superheat is
available to ensure that any liquid drawn back to the compressor is purely oil and not
liquid refrigerant.
The defrost period causes the compressor to turn off, stopping active motion of
the oil and refrigerant throughout the system. Bubbling at the accumulator and
accumulator outlet occurs, however, as large temperature increases from the defrost
heater cause some liquid refrigerant to evaporate. As with the off-period during cycling,
liquid volumes in the compressor and accumulator increase due to an increase in
solubility and the opportunity for refrigerant to absorb within the oil. Solubility increases
during the defrost period are generally greater than during the cycling period, so bubbling
that follows when the compressor turns back on is more violent and pronounced than that
which occurs during cycling periods. Any bubbling that does occur in the compressor or
accumulator settles after several minutes as the system liquid distribution stabilizes.
4.5 Conclusions
Information about a household refrigerator compressor and accumulator was
gained through a series of tests at three different ambient conditions. Temperature,
pressure, and power data were collected together with visualization results to analyze
system solubility and oil and refrigerant mass within both the compressor and
accumulator. Liquid levels and liquid flow patterns were observed through clear
visualization ports with video camera imaging. Sampling methods were attempted to
verify mixture density and solubility data, but were ultimately unsuccessful due to the
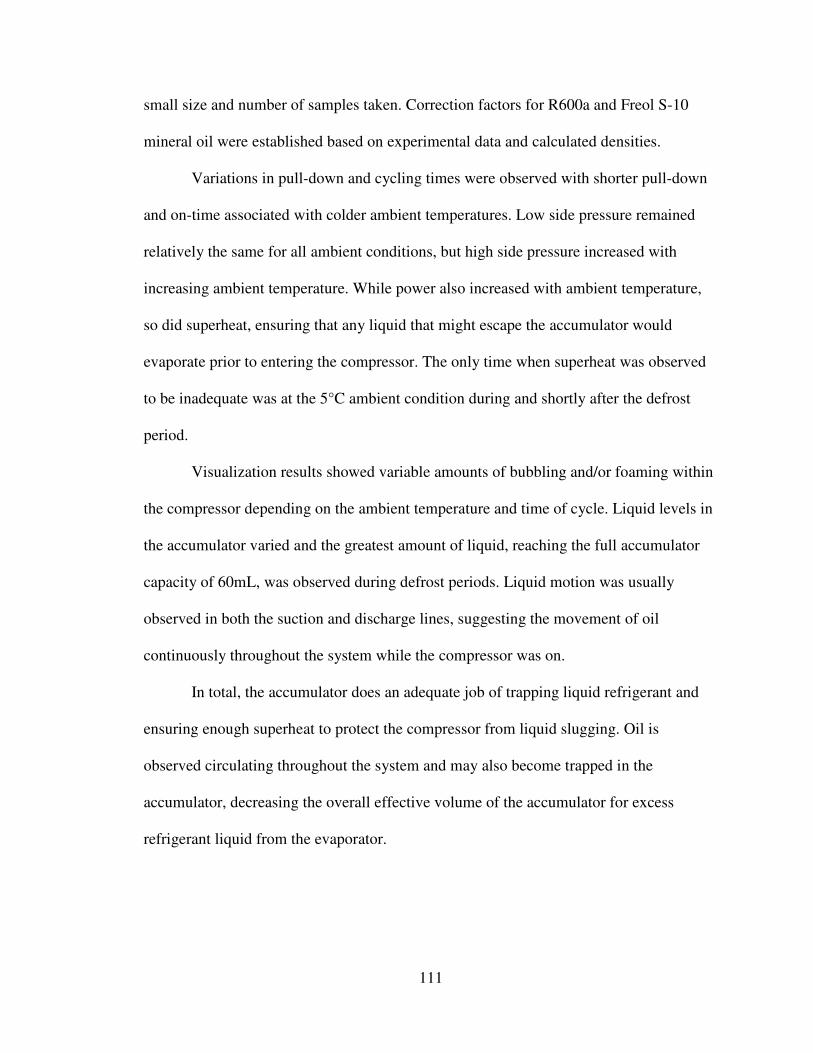
111
small size and number of samples taken. Correction factors for R600a and Freol S-10
mineral oil were established based on experimental data and calculated densities.
Variations in pull-down and cycling times were observed with shorter pull-down
and on-time associated with colder ambient temperatures. Low side pressure remained
relatively the same for all ambient conditions, but high side pressure increased with
increasing ambient temperature. While power also increased with ambient temperature,
so did superheat, ensuring that any liquid that might escape the accumulator would
evaporate prior to entering the compressor. The only time when superheat was observed
to be inadequate was at the 5°C ambient condition during and shortly after the defrost
period.
Visualization results showed variable amounts of bubbling and/or foaming within
the compressor depending on the ambient temperature and time of cycle. Liquid levels in
the accumulator varied and the greatest amount of liquid, reaching the full accumulator
capacity of 60mL, was observed during defrost periods. Liquid motion was usually
observed in both the suction and discharge lines, suggesting the movement of oil
continuously throughout the system while the compressor was on.
In total, the accumulator does an adequate job of trapping liquid refrigerant and
ensuring enough superheat to protect the compressor from liquid slugging. Oil is
observed circulating throughout the system and may also become trapped in the
accumulator, decreasing the overall effective volume of the accumulator for excess
refrigerant liquid from the evaporator.
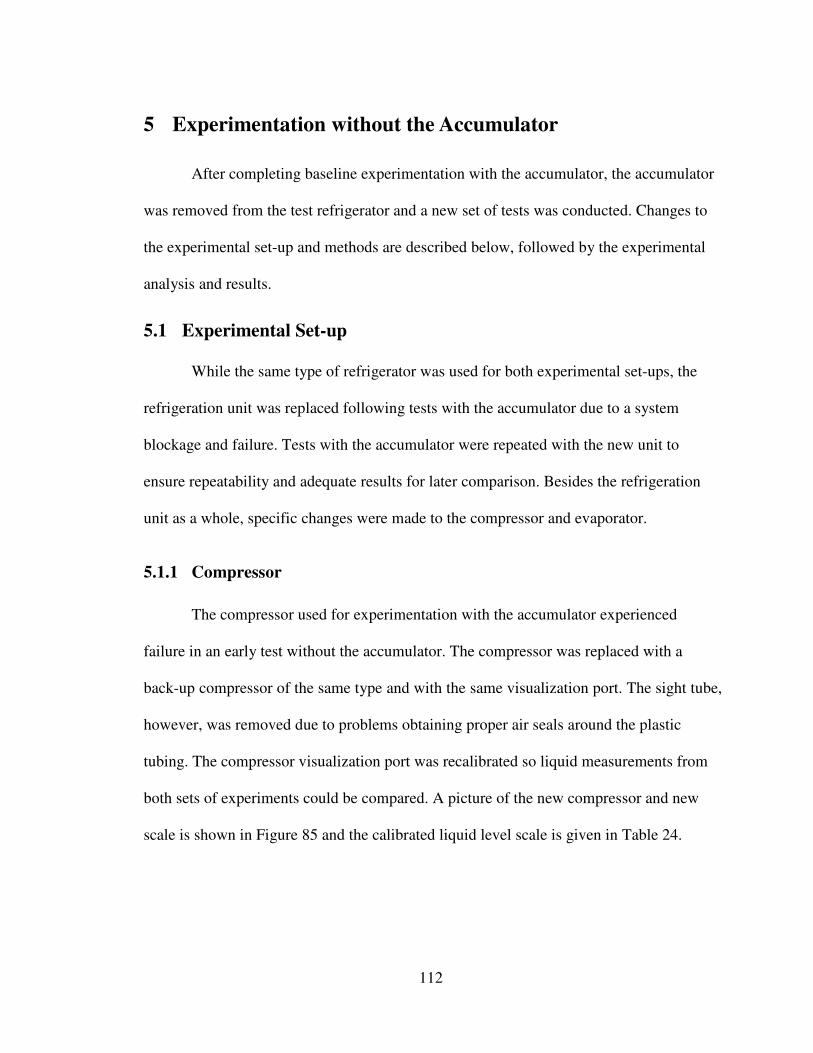
112
5 Experimentation without the Accumulator
After completing baseline experimentation with the accumulator, the accumulator
was removed from the test refrigerator and a new set of tests was conducted. Changes to
the experimental set-up and methods are described below, followed by the experimental
analysis and results.
5.1 Experimental Set-up
While the same type of refrigerator was used for both experimental set-ups, the
refrigeration unit was replaced following tests with the accumulator due to a system
blockage and failure. Tests with the accumulator were repeated with the new unit to
ensure repeatability and adequate results for later comparison. Besides the refrigeration
unit as a whole, specific changes were made to the compressor and evaporator.
5.1.1 Compressor
The compressor used for experimentation with the accumulator experienced
failure in an early test without the accumulator. The compressor was replaced with a
back-up compressor of the same type and with the same visualization port. The sight tube,
however, was removed due to problems obtaining proper air seals around the plastic
tubing. The compressor visualization port was recalibrated so liquid measurements from
both sets of experiments could be compared. A picture of the new compressor and new
scale is shown in Figure 85 and the calibrated liquid level scale is given in Table 24.
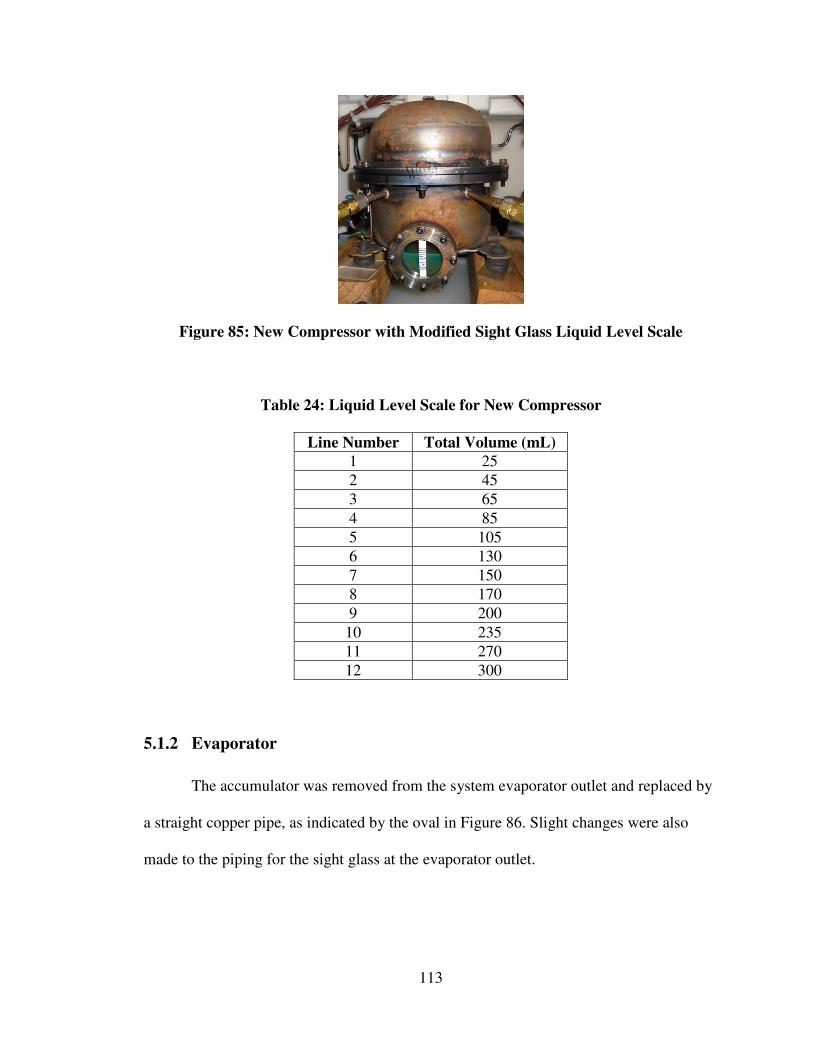
113
Figure 85: New Compressor with Modified Sight Glass Liquid Level Scale
Table 24: Liquid Level Scale for New Compressor
Line Number Total Volume (mL)
1 25
2 45
3 65
4 85
5 105
6 130
7 150
8 170
9 200
10 235
11 270
12 300
5.1.2 Evaporator
The accumulator was removed from the system evaporator outlet and replaced by
a straight copper pipe, as indicated by the oval in Figure 86. Slight changes were also
made to the piping for the sight glass at the evaporator outlet.
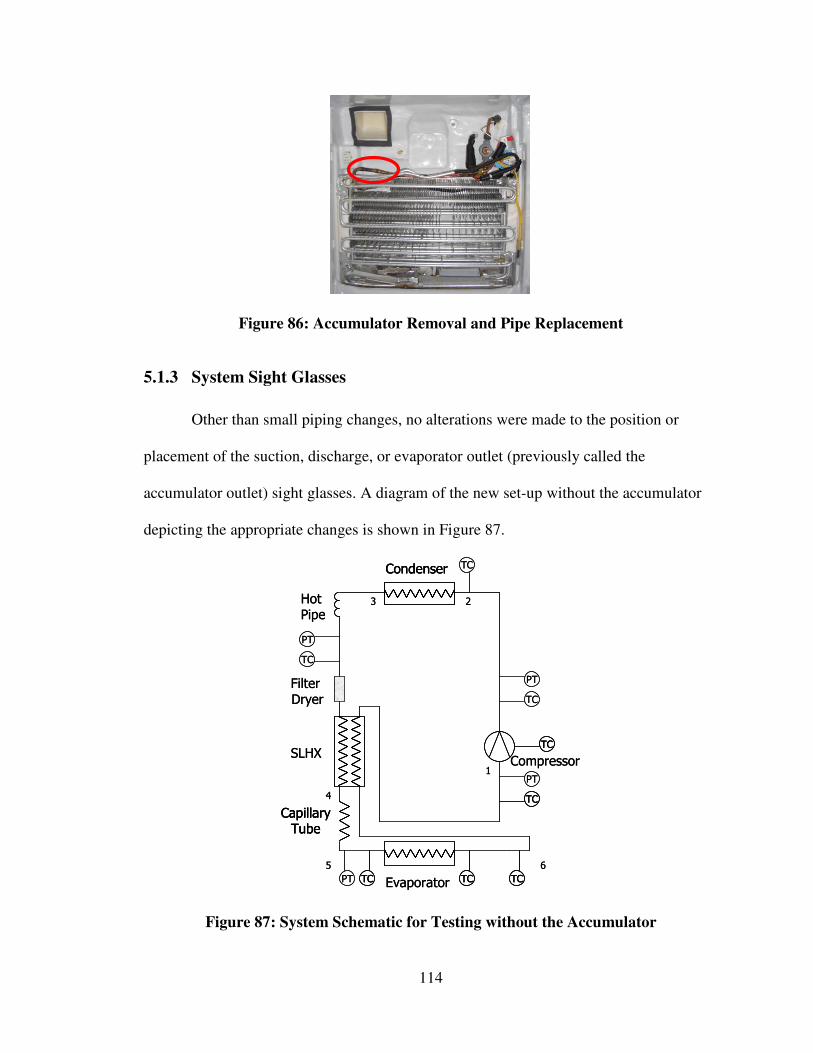
114
Figure 86: Accumulator Removal and Pipe Replacement
5.1.3 System Sight Glasses
Other than small piping changes, no alterations were made to the position or
placement of the suction, discharge, or evaporator outlet (previously called the
accumulator outlet) sight glasses. A diagram of the new set-up without the accumulator
depicting the appropriate changes is shown in Figure 87.
SLHX
Evaporator
Condenser
Compressor
Filter
Dryer
Hot Pipe
CapillaryTube
PT
PT
PT
PT
TC
TC
TC
TC TC
TC
2
4
3
5
1
6
TC
TCSLHX
Evaporator
CondenserCondenser
Compressor
Filter
Dryer
Hot Pipe
CapillaryTube
CapillaryTube
PT
PT
PT
PT
TC
TC
TCTC
TCTC TCTC
TC
2
4
3
5
1
6
TCTC
TCTC
Figure 87: System Schematic for Testing without the Accumulator
115
5.1.4 Refrigerant and Oil Flow Visualization
Video cameras were again used at the compressor visualization port, suction and
discharge sight glasses, and evaporator outlet sight glass for visualization during
experimentation. The fourth camera for accumulator visualization was removed as it was
no longer necessary.
5.1.5 Experimental Measurements
The same experimental measurements as described in section 4.1.6 were taken for
experiments without the accumulator. Temperature measurements that were previously
taken around the accumulator were replaced by temperature measurements on the copper
pipe that replaced the accumulator in the new set-up. The same DAS and environmental
chamber for ambient control were also used for experiments without the accumulator.
5.2 Experimental Methods
5.2.1 Experimental Procedures
Because the 43°C ambient condition did not allow for cycling of the compressor,
this condition was skipped for tests without the accumulator. Only the 5°C and 32°C
ambient conditions were explored, as indicated by the experimental matrix in Table 12.
Pull-down, cycling, and defrost periods were again recorded and observed for each test
condition. In addition, different refrigerant charges were explored at each ambient
condition in order to better understand the effects of the charge on the system without the
accumulator. The charges tested are outlined in Table 25. Note that the original charge to
the system with the accumulator was 52.0g of R600a.
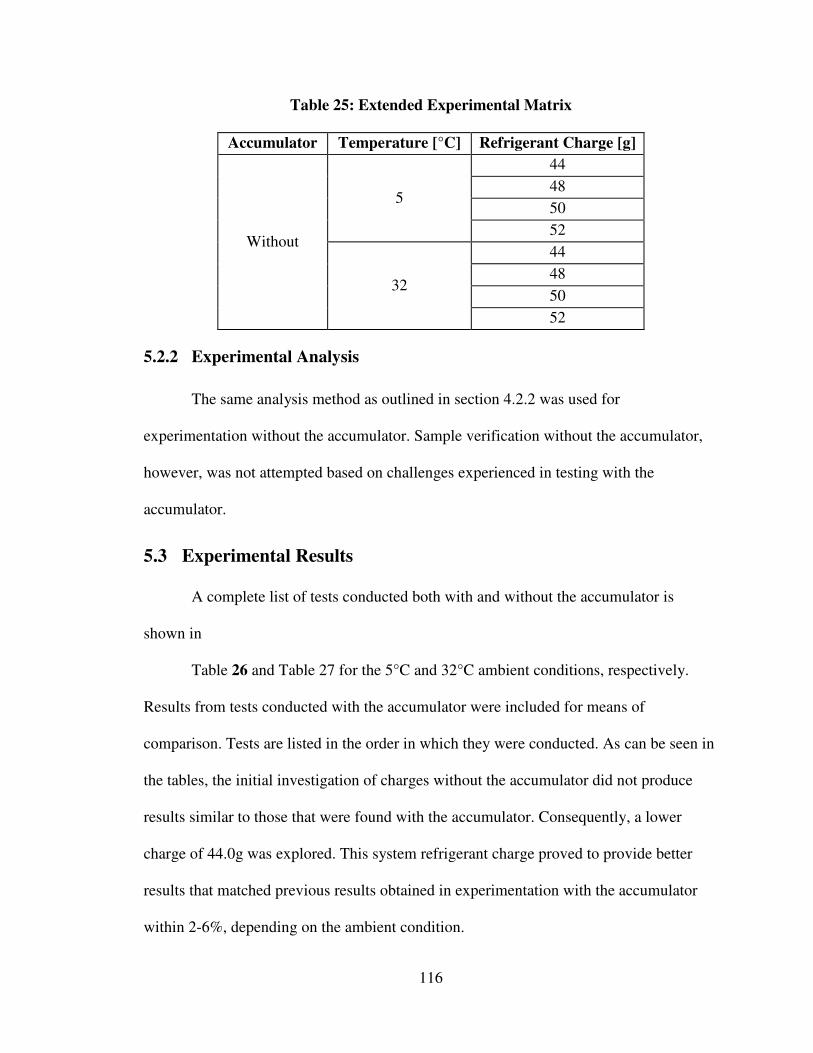
116
Table 25: Extended Experimental Matrix
Accumulator Temperature [°C] Refrigerant Charge [g]
44
48
50 5
52
44
48
50
Without
32
52
5.2.2 Experimental Analysis
The same analysis method as outlined in section 4.2.2 was used for
experimentation without the accumulator. Sample verification without the accumulator,
however, was not attempted based on challenges experienced in testing with the
accumulator.
5.3 Experimental Results
A complete list of tests conducted both with and without the accumulator is
shown in
Table 26 and Table 27 for the 5°C and 32°C ambient conditions, respectively.
Results from tests conducted with the accumulator were included for means of
comparison. Tests are listed in the order in which they were conducted. As can be seen in
the tables, the initial investigation of charges without the accumulator did not produce
results similar to those that were found with the accumulator. Consequently, a lower
charge of 44.0g was explored. This system refrigerant charge proved to provide better
results that matched previous results obtained in experimentation with the accumulator
within 2-6%, depending on the ambient condition.
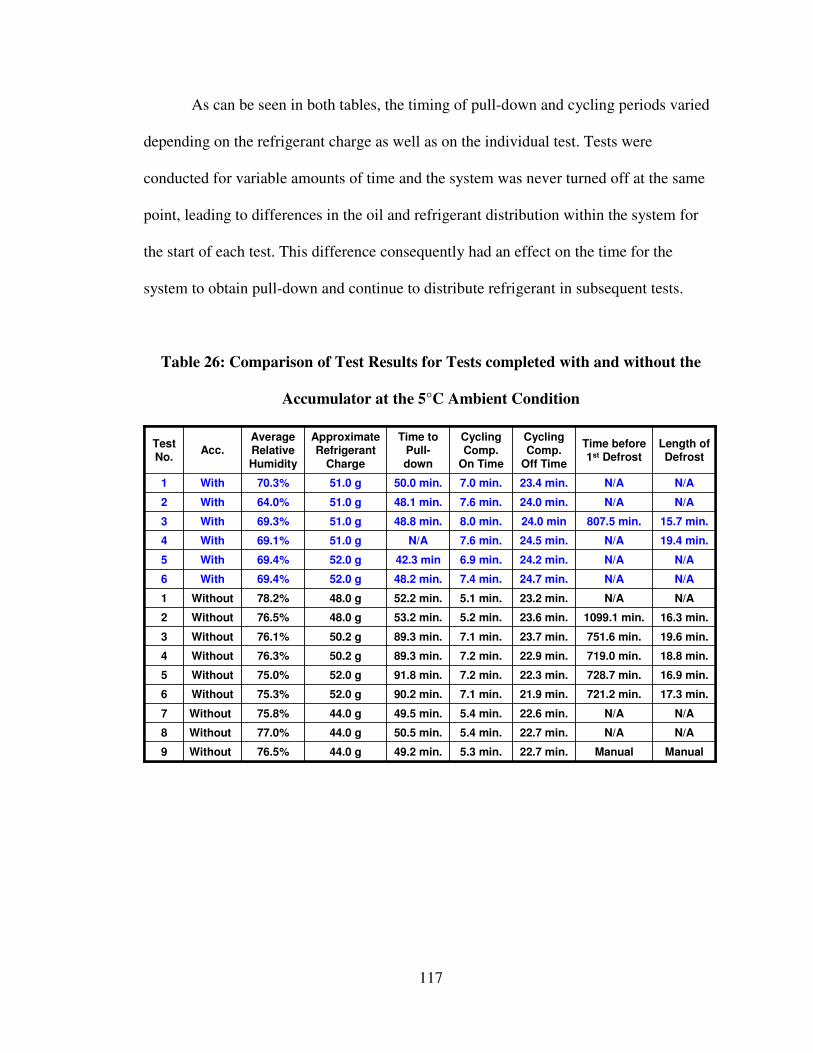
117
As can be seen in both tables, the timing of pull-down and cycling periods varied
depending on the refrigerant charge as well as on the individual test. Tests were
conducted for variable amounts of time and the system was never turned off at the same
point, leading to differences in the oil and refrigerant distribution within the system for
the start of each test. This difference consequently had an effect on the time for the
system to obtain pull-down and continue to distribute refrigerant in subsequent tests.
Table 26: Comparison of Test Results for Tests completed with and without the
Accumulator at the 5°C Ambient Condition
18.8 min.719.0 min.22.9 min.7.2 min.89.3 min.50.2 g76.3%Without4
16.9 min.728.7 min.22.3 min.7.2 min.91.8 min.52.0 g75.0%Without5
17.3 min.721.2 min.21.9 min.7.1 min.90.2 min.52.0 g75.3%Without6
ManualManual22.7 min.5.3 min.49.2 min.44.0 g76.5%Without9
N/AN/A22.7 min.5.4 min.50.5 min.44.0 g77.0%Without8
N/AN/A22.6 min.5.4 min.49.5 min.44.0 g75.8%Without7
N/AN/A23.4 min.7.0 min.50.0 min.51.0 g70.3%With1
N/AN/A24.0 min.7.6 min.48.1 min.51.0 g64.0%With2
15.7 min.807.5 min.24.0 min8.0 min.48.8 min.51.0 g69.3%With3
19.4 min.N/A24.5 min.7.6 min.N/A51.0 g69.1%With4
N/AN/A24.2 min.6.9 min.42.3 min52.0 g69.4%With5
N/AN/A24.7 min.7.4 min.48.2 min.52.0 g69.4%With6
23.7 min.
23.6 min.
23.2 min.
Cycling Comp.
Off Time
7.1 min.
5.2 min.
5.1 min.
Cycling Comp.
On Time
751.6 min.
1099.1 min.
N/A
Time before 1st Defrost
19.6 min.89.3 min.50.2 g76.1%Without 3
16.3 min.53.2 min.48.0 g76.5%Without 2
N/A52.2 min.48.0 g78.2%Without1
Length of Defrost
Time to Pull-
down
Approximate Refrigerant
Charge
Average Relative
Humidity
Acc.Test No.
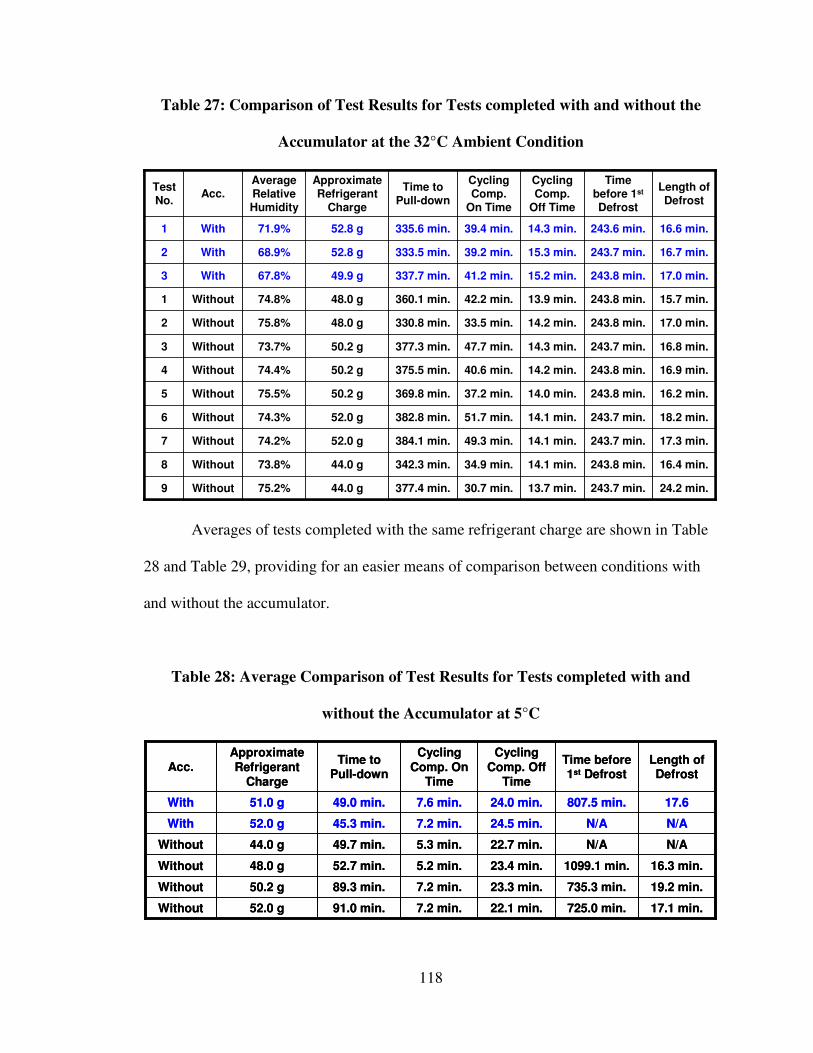
118
Table 27: Comparison of Test Results for Tests completed with and without the
Accumulator at the 32°C Ambient Condition
18.2 min.243.7 min.14.1 min.51.7 min.382.8 min.52.0 g74.3%Without6
17.3 min.243.7 min.14.1 min.49.3 min.384.1 min.52.0 g74.2%Without7
24.2 min.243.7 min.13.7 min.30.7 min.377.4 min.44.0 g75.2%Without9
16.4 min.243.8 min.14.1 min.34.9 min.342.3 min.44.0 g73.8%Without8
16.6 min.243.6 min.14.3 min.39.4 min.335.6 min.52.8 g71.9%With1
16.7 min.243.7 min.15.3 min.39.2 min.333.5 min.52.8 g68.9%With2
17.0 min.243.8 min.15.2 min.41.2 min.337.7 min.49.9 g67.8%With3
16.2 min.243.8 min.14.0 min.37.2 min.369.8 min.50.2 g75.5%Without5
14.2 min.
14.3 min.
14.2 min.
13.9 min.
Cycling Comp.
Off Time
40.6 min.
47.7 min.
33.5 min.
42.2 min.
Cycling Comp.
On Time
243.8 min.
243.7 min.
243.8 min.
243.8 min.
Time before 1st
Defrost
16.9 min.375.5 min.50.2 g74.4%Without4
16.8 min.377.3 min.50.2 g73.7%Without3
17.0 min.330.8 min.48.0 g75.8%Without2
15.7 min.360.1 min.48.0 g74.8%Without1
Length of Defrost
Time to Pull-down
Approximate Refrigerant
Charge
Average Relative Humidity
Acc.Test No.
Averages of tests completed with the same refrigerant charge are shown in Table
28 and Table 29, providing for an easier means of comparison between conditions with
and without the accumulator.
Table 28: Average Comparison of Test Results for Tests completed with and
without the Accumulator at 5°C
N/AN/A22.7 min.5.3 min.49.7 min.44.0 gWithout
17.1 min.725.0 min.22.1 min.7.2 min.91.0 min.52.0 gWithout
17.6807.5 min.24.0 min.7.6 min.49.0 min.51.0 gWith
N/AN/A24.5 min.7.2 min.45.3 min.52.0 gWith
23.3 min.
23.4 min.
Cycling
Comp. Off Time
7.2 min.
5.2 min.
Cycling
Comp. On Time
735.3 min.
1099.1 min.
Time before 1st Defrost
19.2 min.89.3 min.50.2 gWithout
16.3 min.52.7 min.48.0 gWithout
Length of Defrost
Time to Pull-down
Approximate
Refrigerant Charge
Acc.
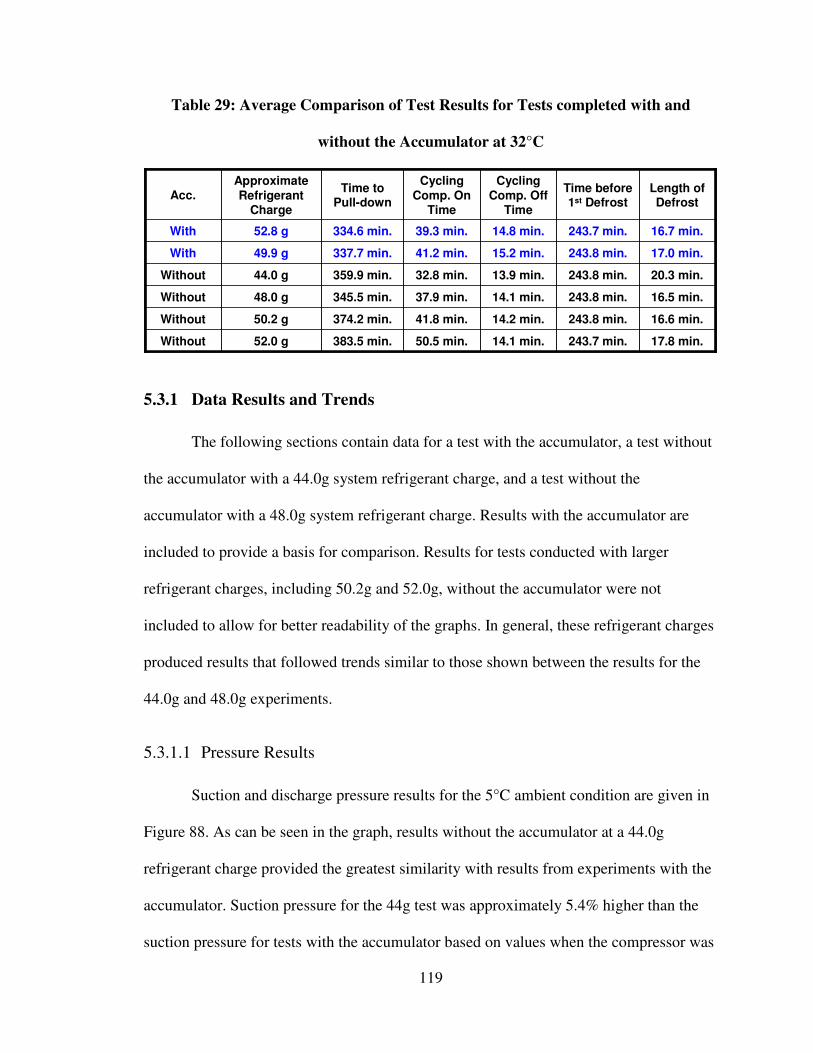
119
Table 29: Average Comparison of Test Results for Tests completed with and
without the Accumulator at 32°C
20.3 min.243.8 min.13.9 min.32.8 min.359.9 min.44.0 gWithout
17.8 min.243.7 min.14.1 min.50.5 min.383.5 min.52.0 gWithout
16.7 min.243.7 min.14.8 min.39.3 min.334.6 min.52.8 gWith
17.0 min.243.8 min.15.2 min.41.2 min.337.7 min.49.9 gWith
14.2 min.
14.1 min.
Cycling
Comp. Off Time
41.8 min.
37.9 min.
Cycling
Comp. On Time
243.8 min.
243.8 min.
Time before 1st Defrost
16.6 min.374.2 min.50.2 gWithout
16.5 min.345.5 min.48.0 gWithout
Length of Defrost
Time to Pull-down
Approximate
Refrigerant Charge
Acc.
5.3.1 Data Results and Trends
The following sections contain data for a test with the accumulator, a test without
the accumulator with a 44.0g system refrigerant charge, and a test without the
accumulator with a 48.0g system refrigerant charge. Results with the accumulator are
included to provide a basis for comparison. Results for tests conducted with larger
refrigerant charges, including 50.2g and 52.0g, without the accumulator were not
included to allow for better readability of the graphs. In general, these refrigerant charges
produced results that followed trends similar to those shown between the results for the
44.0g and 48.0g experiments.
5.3.1.1 Pressure Results
Suction and discharge pressure results for the 5°C ambient condition are given in
Figure 88. As can be seen in the graph, results without the accumulator at a 44.0g
refrigerant charge provided the greatest similarity with results from experiments with the
accumulator. Suction pressure for the 44g test was approximately 5.4% higher than the
suction pressure for tests with the accumulator based on values when the compressor was
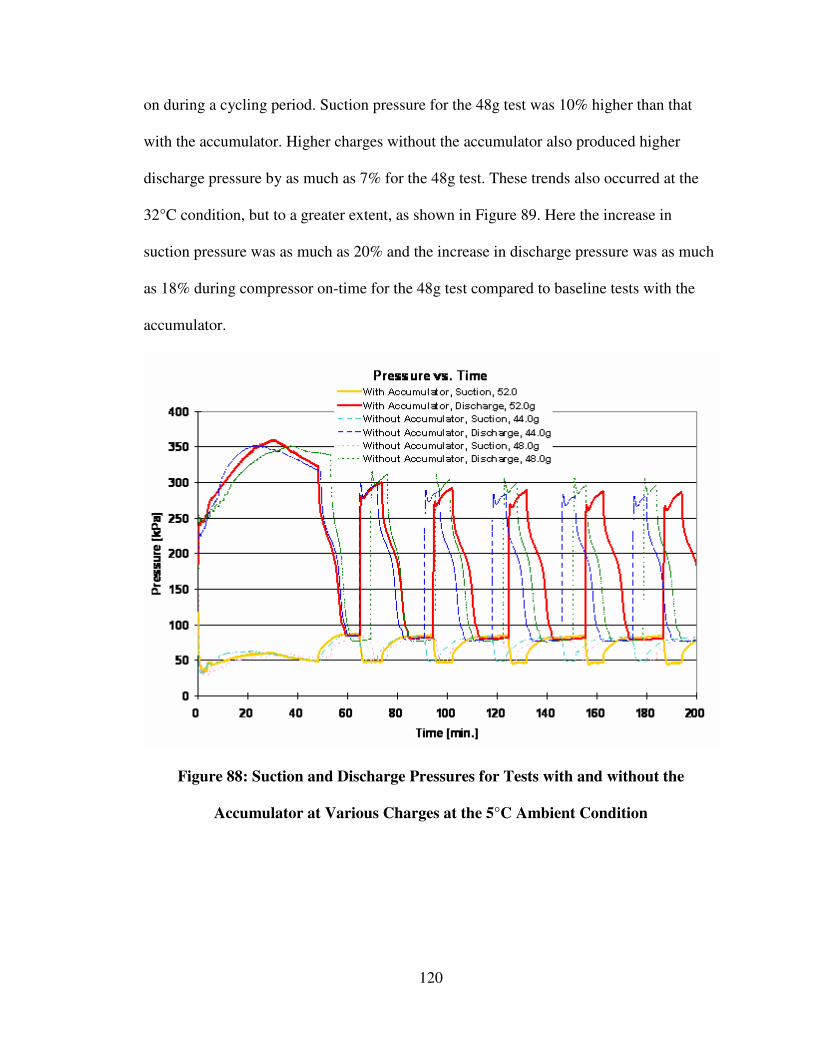
120
on during a cycling period. Suction pressure for the 48g test was 10% higher than that
with the accumulator. Higher charges without the accumulator also produced higher
discharge pressure by as much as 7% for the 48g test. These trends also occurred at the
32°C condition, but to a greater extent, as shown in Figure 89. Here the increase in
suction pressure was as much as 20% and the increase in discharge pressure was as much
as 18% during compressor on-time for the 48g test compared to baseline tests with the
accumulator.
Figure 88: Suction and Discharge Pressures for Tests with and without the
Accumulator at Various Charges at the 5°C Ambient Condition
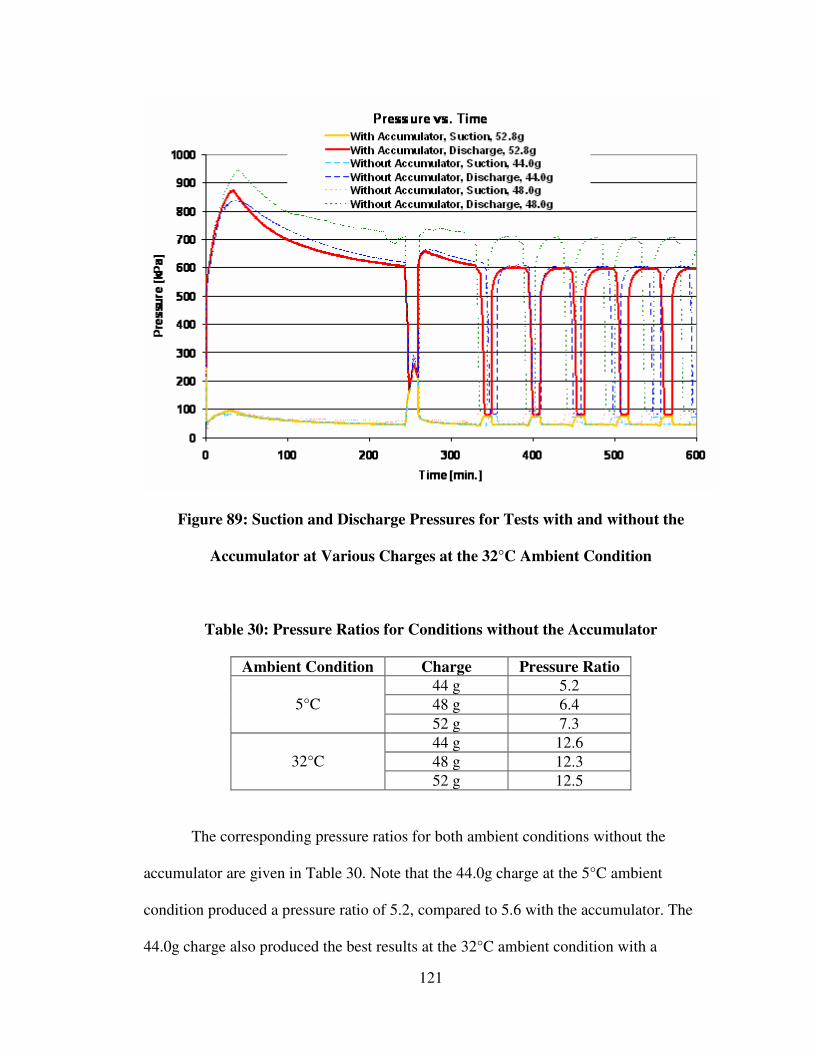
121
Figure 89: Suction and Discharge Pressures for Tests with and without the
Accumulator at Various Charges at the 32°C Ambient Condition
Table 30: Pressure Ratios for Conditions without the Accumulator
Ambient Condition Charge Pressure Ratio
44 g 5.2
48 g 6.4 5°C
52 g 7.3
44 g 12.6
48 g 12.3 32°C
52 g 12.5
The corresponding pressure ratios for both ambient conditions without the
accumulator are given in Table 30. Note that the 44.0g charge at the 5°C ambient
condition produced a pressure ratio of 5.2, compared to 5.6 with the accumulator. The
44.0g charge also produced the best results at the 32°C ambient condition with a
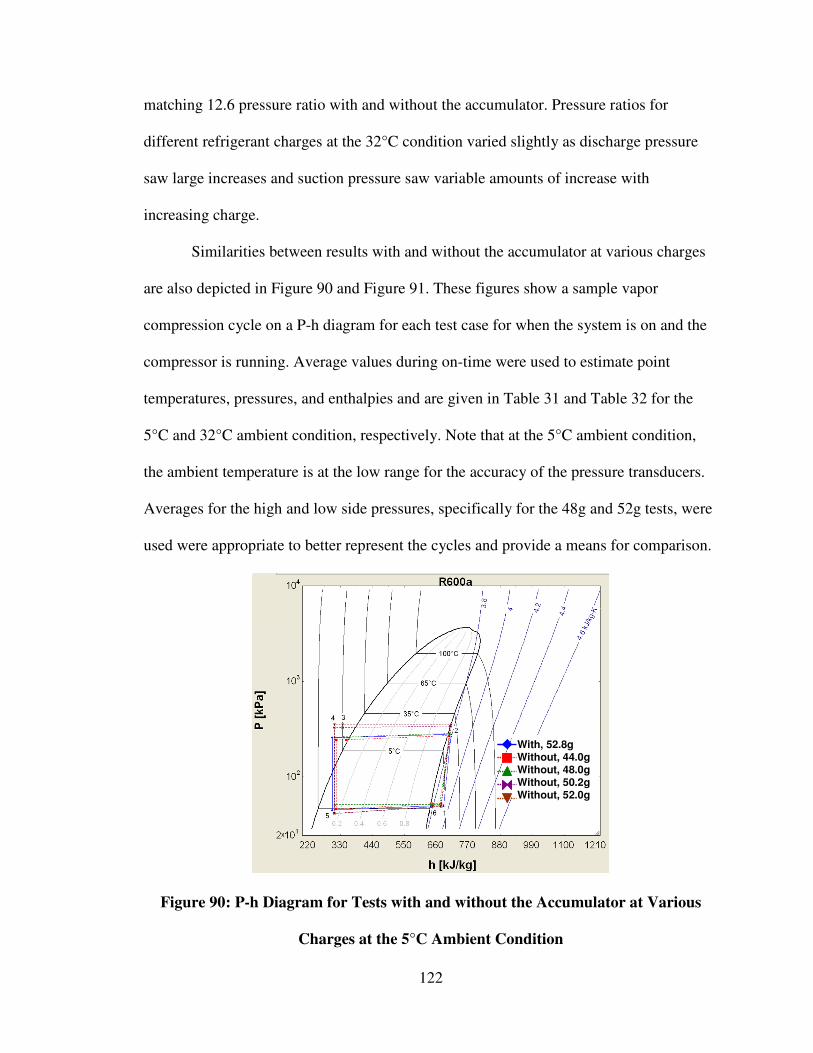
122
matching 12.6 pressure ratio with and without the accumulator. Pressure ratios for
different refrigerant charges at the 32°C condition varied slightly as discharge pressure
saw large increases and suction pressure saw variable amounts of increase with
increasing charge.
Similarities between results with and without the accumulator at various charges
are also depicted in Figure 90 and Figure 91. These figures show a sample vapor
compression cycle on a P-h diagram for each test case for when the system is on and the
compressor is running. Average values during on-time were used to estimate point
temperatures, pressures, and enthalpies and are given in Table 31 and Table 32 for the
5°C and 32°C ambient condition, respectively. Note that at the 5°C ambient condition,
the ambient temperature is at the low range for the accuracy of the pressure transducers.
Averages for the high and low side pressures, specifically for the 48g and 52g tests, were
used were appropriate to better represent the cycles and provide a means for comparison.
With, 52.8gWithout, 44.0gWithout, 48.0gWithout, 50.2gWithout, 52.0g
With, 52.8gWithout, 44.0gWithout, 48.0gWithout, 50.2gWithout, 52.0g
With, 52.8gWithout, 44.0gWithout, 48.0gWithout, 50.2gWithout, 52.0g
Figure 90: P-h Diagram for Tests with and without the Accumulator at Various
Charges at the 5°C Ambient Condition
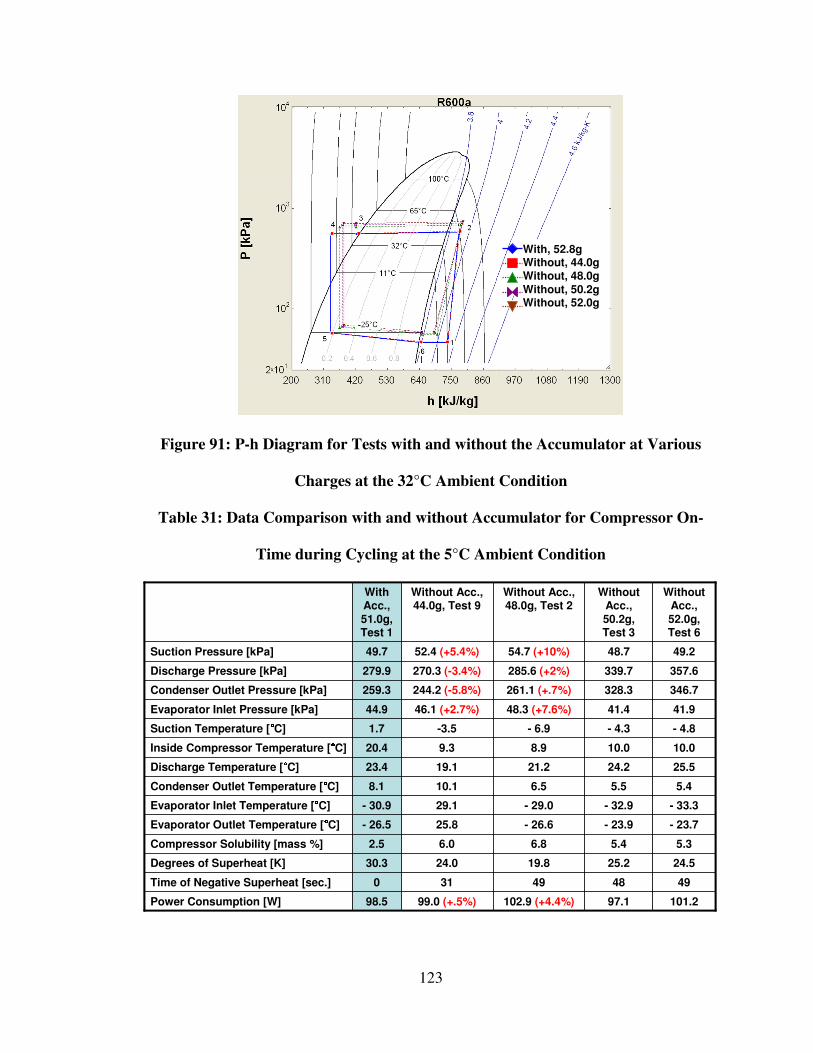
123
With, 52.8gWithout, 44.0gWithout, 48.0g
Without, 50.2gWithout, 52.0g
With, 52.8gWithout, 44.0gWithout, 48.0g
Without, 50.2gWithout, 52.0g
Figure 91: P-h Diagram for Tests with and without the Accumulator at Various
Charges at the 32°C Ambient Condition
Table 31: Data Comparison with and without Accumulator for Compressor On-
Time during Cycling at the 5°C Ambient Condition
99.0 (+.5%)
31
24.0
6.0
25.8
29.1
10.1
19.1
9.3
-3.5
46.1 (+2.7%)
244.2 (-5.8%)
270.3 (-3.4%)
52.4 (+5.4%)
Without Acc., 44.0g, Test 9
101.2
49
24.5
5.3
- 23.7
- 33.3
5.4
25.5
10.0
- 4.8
41.9
346.7
357.6
49.2
Without Acc.,
52.0g, Test 6
98.5
0
30.3
2.5
- 26.5
- 30.9
8.1
23.4
20.4
1.7
44.9
259.3
279.9
49.7
With Acc.,
51.0g, Test 1
4849Time of Negative Superheat [sec.]
25.219.8Degrees of Superheat [K]
97.1102.9 (+4.4%)Power Consumption [W]
5.46.8Compressor Solubility [mass %]
- 23.9- 26.6Evaporator Outlet Temperature [°°°°C]
- 32.9- 29.0Evaporator Inlet Temperature [°°°°C]
5.56.5Condenser Outlet Temperature [°°°°C]
24.221.2Discharge Temperature [°°°°C]
10.08.9Inside Compressor Temperature [°°°°C]
- 4.3- 6.9 Suction Temperature [°°°°C]
41.448.3 (+7.6%)Evaporator Inlet Pressure [kPa]
328.3261.1 (+.7%)Condenser Outlet Pressure [kPa]
339.7285.6 (+2%)Discharge Pressure [kPa]
48.754.7 (+10%)Suction Pressure [kPa]
Without Acc.,
50.2g, Test 3
Without Acc., 48.0g, Test 2
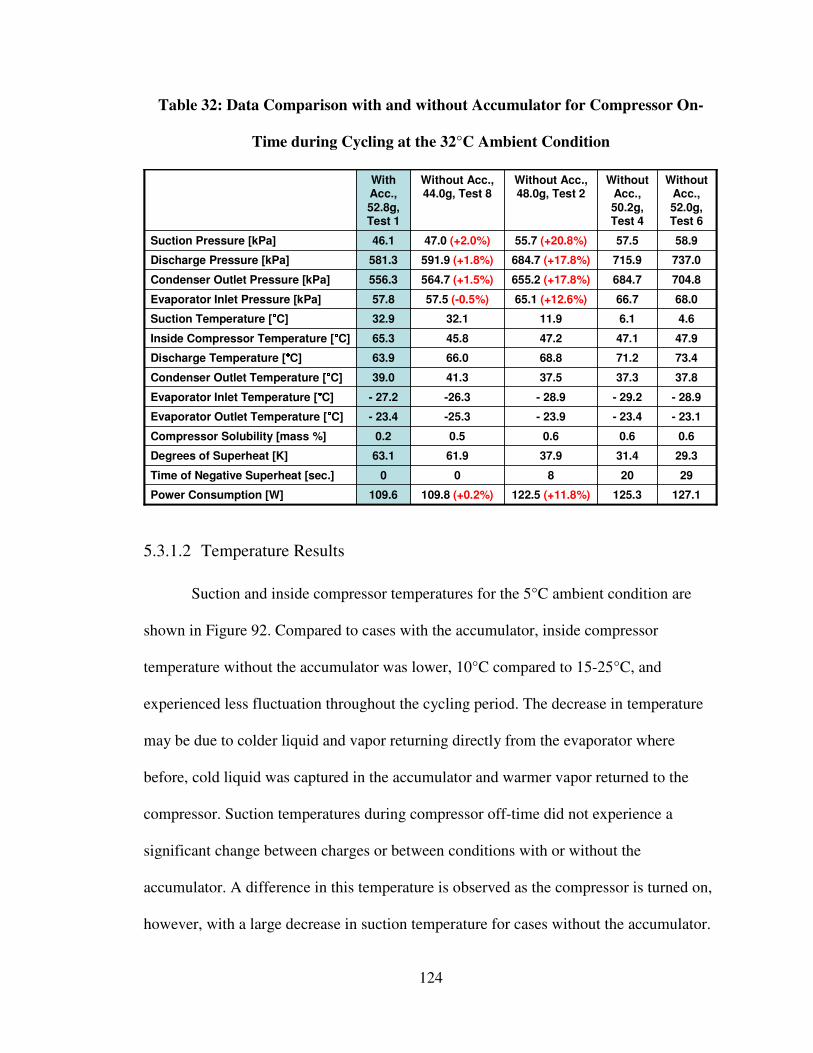
124
Table 32: Data Comparison with and without Accumulator for Compressor On-
Time during Cycling at the 32°C Ambient Condition
109.8 (+0.2%)
0
61.9
0.5
-25.3
-26.3
41.3
66.0
45.8
32.1
57.5 (-0.5%)
564.7 (+1.5%)
591.9 (+1.8%)
47.0 (+2.0%)
Without Acc., 44.0g, Test 8
127.1
29
29.3
0.6
- 23.1
- 28.9
37.8
73.4
47.9
4.6
68.0
704.8
737.0
58.9
Without Acc.,
52.0g, Test 6
109.6
0
63.1
0.2
- 23.4
- 27.2
39.0
63.9
65.3
32.9
57.8
556.3
581.3
46.1
With Acc.,
52.8g, Test 1
208Time of Negative Superheat [sec.]
31.437.9Degrees of Superheat [K]
125.3122.5 (+11.8%)Power Consumption [W]
0.60.6Compressor Solubility [mass %]
- 23.4- 23.9Evaporator Outlet Temperature [°°°°C]
- 29.2- 28.9Evaporator Inlet Temperature [°°°°C]
37.337.5Condenser Outlet Temperature [°°°°C]
71.268.8Discharge Temperature [°°°°C]
47.147.2Inside Compressor Temperature [°°°°C]
6.111.9Suction Temperature [°°°°C]
66.765.1 (+12.6%)Evaporator Inlet Pressure [kPa]
684.7655.2 (+17.8%)Condenser Outlet Pressure [kPa]
715.9684.7 (+17.8%)Discharge Pressure [kPa]
57.555.7 (+20.8%)Suction Pressure [kPa]
Without Acc.,
50.2g, Test 4
Without Acc., 48.0g, Test 2
5.3.1.2 Temperature Results
Suction and inside compressor temperatures for the 5°C ambient condition are
shown in Figure 92. Compared to cases with the accumulator, inside compressor
temperature without the accumulator was lower, 10°C compared to 15-25°C, and
experienced less fluctuation throughout the cycling period. The decrease in temperature
may be due to colder liquid and vapor returning directly from the evaporator where
before, cold liquid was captured in the accumulator and warmer vapor returned to the
compressor. Suction temperatures during compressor off-time did not experience a
significant change between charges or between conditions with or without the
accumulator. A difference in this temperature is observed as the compressor is turned on,
however, with a large decrease in suction temperature for cases without the accumulator.
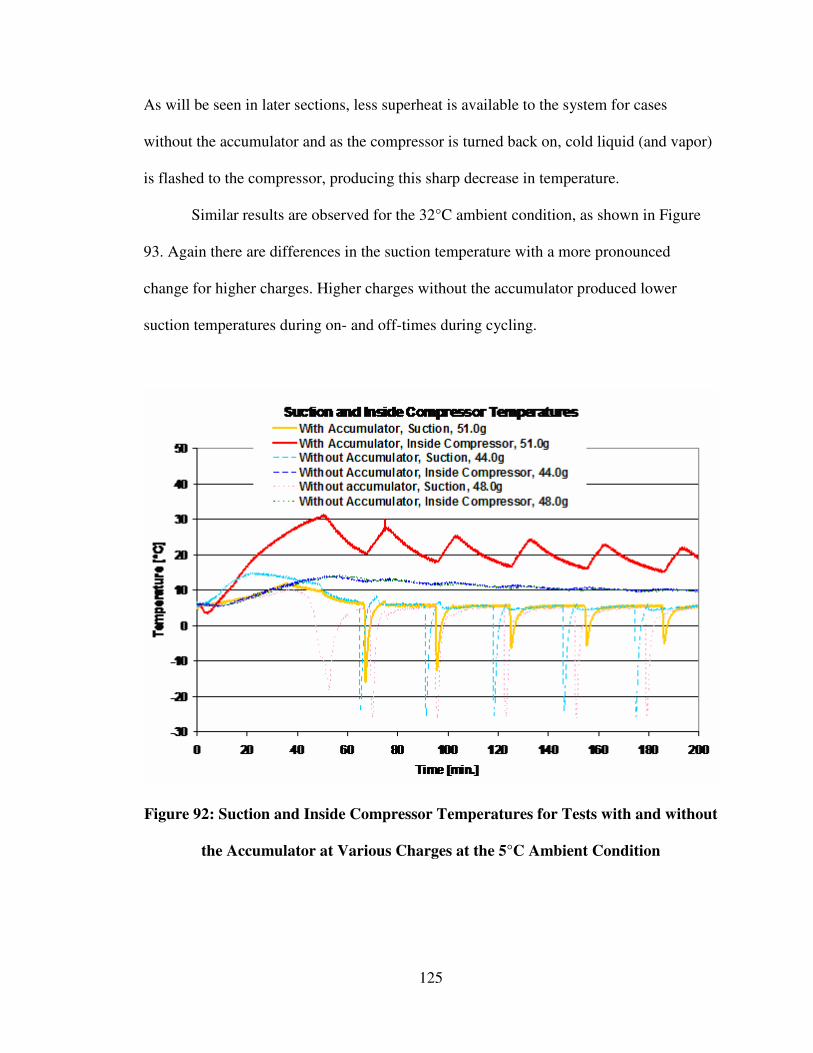
125
As will be seen in later sections, less superheat is available to the system for cases
without the accumulator and as the compressor is turned back on, cold liquid (and vapor)
is flashed to the compressor, producing this sharp decrease in temperature.
Similar results are observed for the 32°C ambient condition, as shown in Figure
93. Again there are differences in the suction temperature with a more pronounced
change for higher charges. Higher charges without the accumulator produced lower
suction temperatures during on- and off-times during cycling.
Figure 92: Suction and Inside Compressor Temperatures for Tests with and without
the Accumulator at Various Charges at the 5°C Ambient Condition
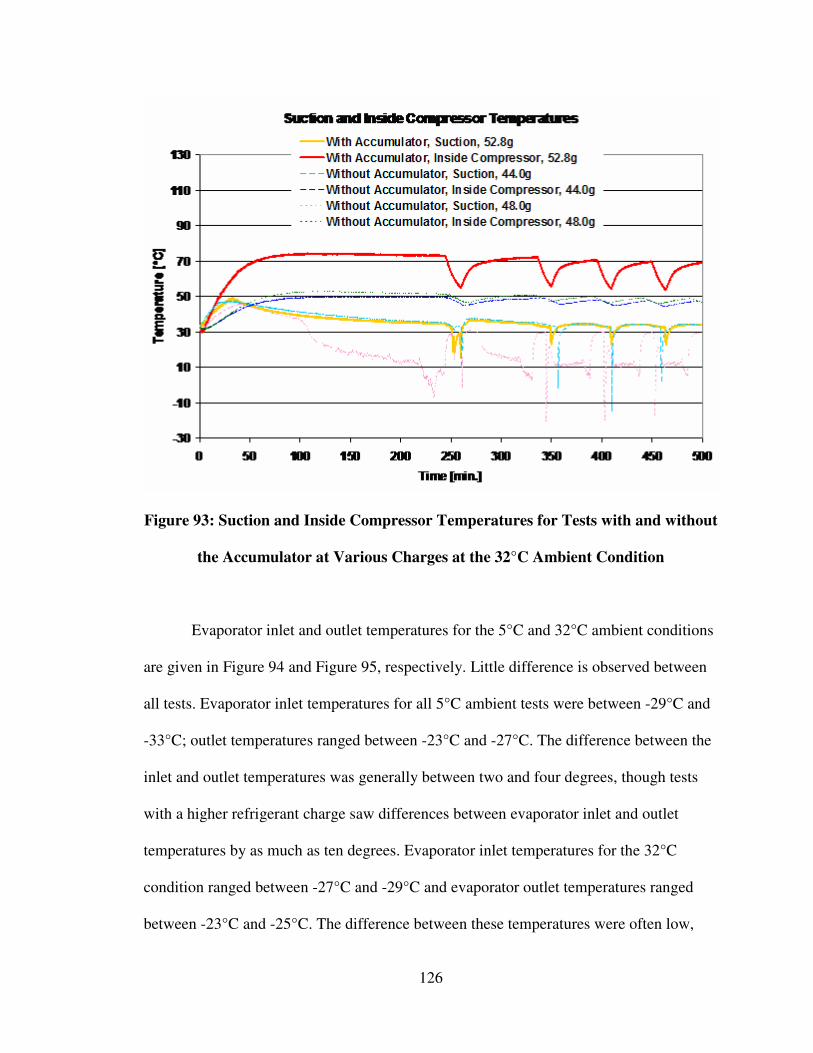
126
Figure 93: Suction and Inside Compressor Temperatures for Tests with and without
the Accumulator at Various Charges at the 32°C Ambient Condition
Evaporator inlet and outlet temperatures for the 5°C and 32°C ambient conditions
are given in Figure 94 and Figure 95, respectively. Little difference is observed between
all tests. Evaporator inlet temperatures for all 5°C ambient tests were between -29°C and
-33°C; outlet temperatures ranged between -23°C and -27°C. The difference between the
inlet and outlet temperatures was generally between two and four degrees, though tests
with a higher refrigerant charge saw differences between evaporator inlet and outlet
temperatures by as much as ten degrees. Evaporator inlet temperatures for the 32°C
condition ranged between -27°C and -29°C and evaporator outlet temperatures ranged
between -23°C and -25°C. The difference between these temperatures were often low,
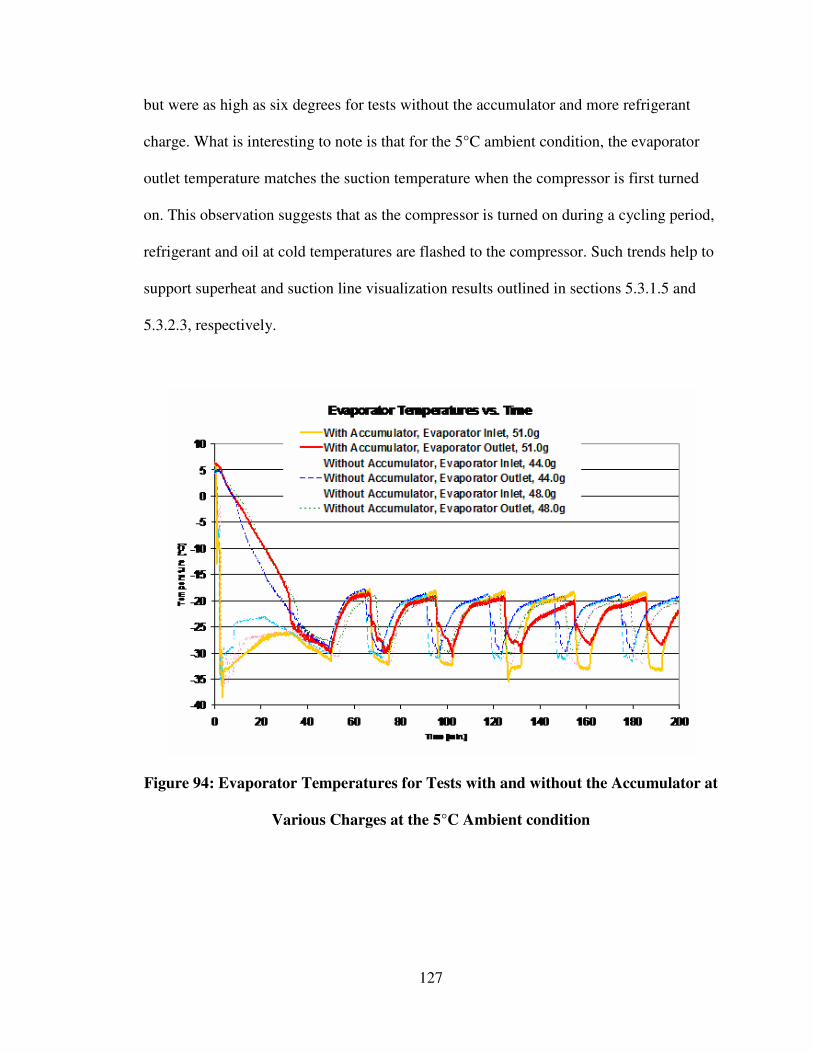
127
but were as high as six degrees for tests without the accumulator and more refrigerant
charge. What is interesting to note is that for the 5°C ambient condition, the evaporator
outlet temperature matches the suction temperature when the compressor is first turned
on. This observation suggests that as the compressor is turned on during a cycling period,
refrigerant and oil at cold temperatures are flashed to the compressor. Such trends help to
support superheat and suction line visualization results outlined in sections 5.3.1.5 and
5.3.2.3, respectively.
Figure 94: Evaporator Temperatures for Tests with and without the Accumulator at
Various Charges at the 5°C Ambient condition
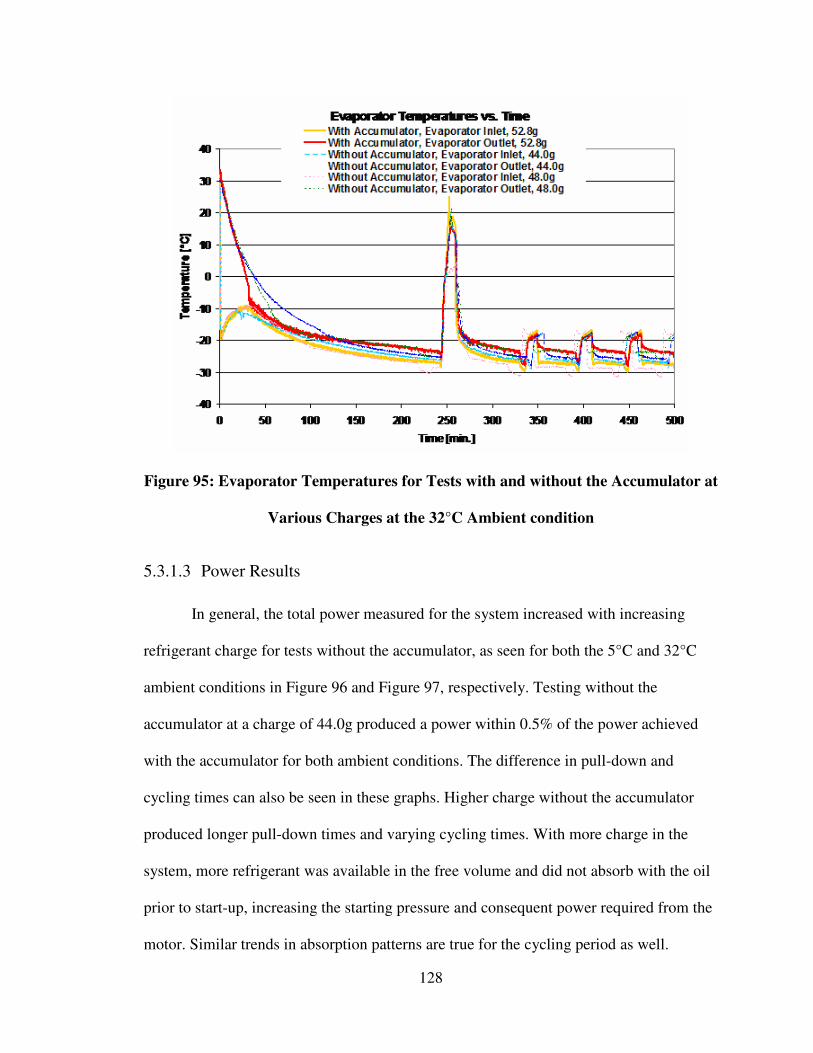
128
Figure 95: Evaporator Temperatures for Tests with and without the Accumulator at
Various Charges at the 32°C Ambient condition
5.3.1.3 Power Results
In general, the total power measured for the system increased with increasing
refrigerant charge for tests without the accumulator, as seen for both the 5°C and 32°C
ambient conditions in Figure 96 and Figure 97, respectively. Testing without the
accumulator at a charge of 44.0g produced a power within 0.5% of the power achieved
with the accumulator for both ambient conditions. The difference in pull-down and
cycling times can also be seen in these graphs. Higher charge without the accumulator
produced longer pull-down times and varying cycling times. With more charge in the
system, more refrigerant was available in the free volume and did not absorb with the oil
prior to start-up, increasing the starting pressure and consequent power required from the
motor. Similar trends in absorption patterns are true for the cycling period as well.
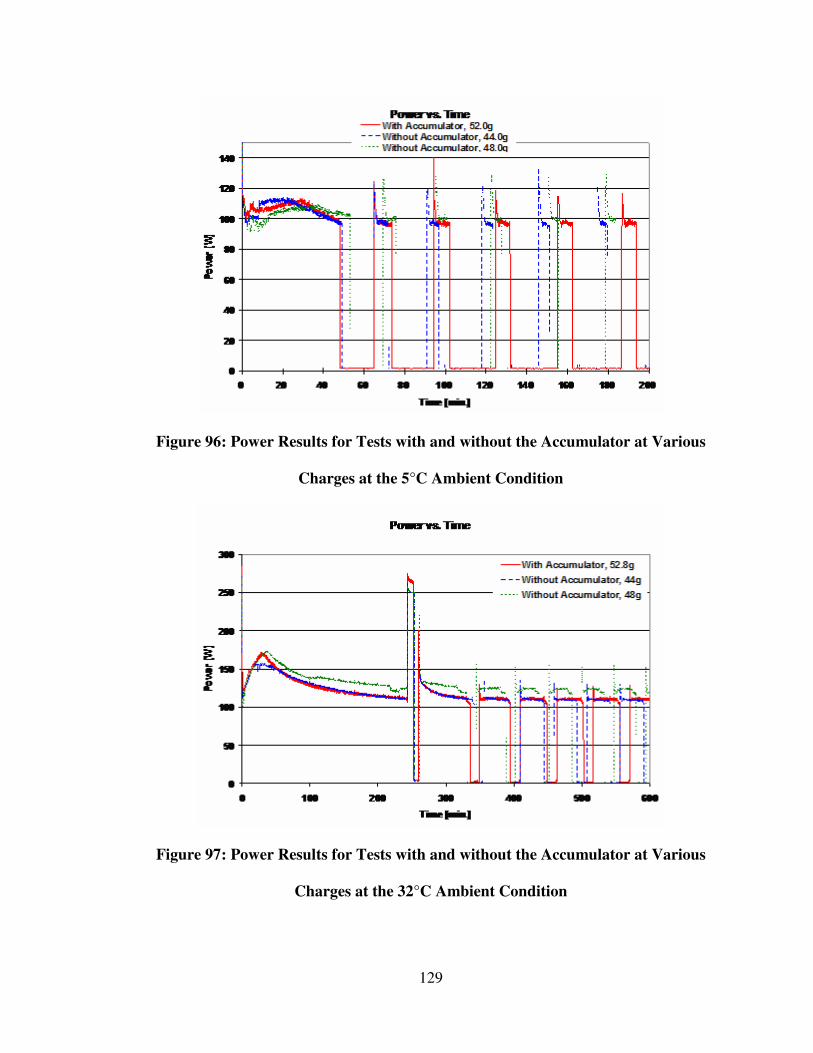
129
Figure 96: Power Results for Tests with and without the Accumulator at Various
Charges at the 5°C Ambient Condition
Figure 97: Power Results for Tests with and without the Accumulator at Various
Charges at the 32°C Ambient Condition
130
5.3.1.4 Specific Capacity Results
Evaporator specific capacity for the 5°C ambient condition, shown in Figure 98,
did not show a considerable difference between refrigerant charges or between cases with
and without the accumulator. This is due to little changes in high and low side pressures
for this ambient condition. Evaporator capacity for the 32°C ambient condition, however,
shown in Figure 99, shows a decrease in capacity for higher refrigerant charges without
the accumulator. As shown above, higher refrigerant charges increase the high and low
side pressure by as much as 20% for the 48g test, impacting the capacity available at that
condition.
Like the evaporator results, condenser specific capacity at the 5°C ambient
condition did not show much difference between cases with or without the accumulator,
as seen in Figure 100. Slight increases in condenser capacity are noticeable for higher
refrigerant charges without the accumulator. Again, these differences are due to the small
changes in discharge pressure at the lower ambient condition.
Condenser capacity results for the 32°C ambient condition are shown in Figure
101. Again, little difference is observed between cases, though there is a slight increase
for higher charges without the accumulator due to the increase in high side pressure.
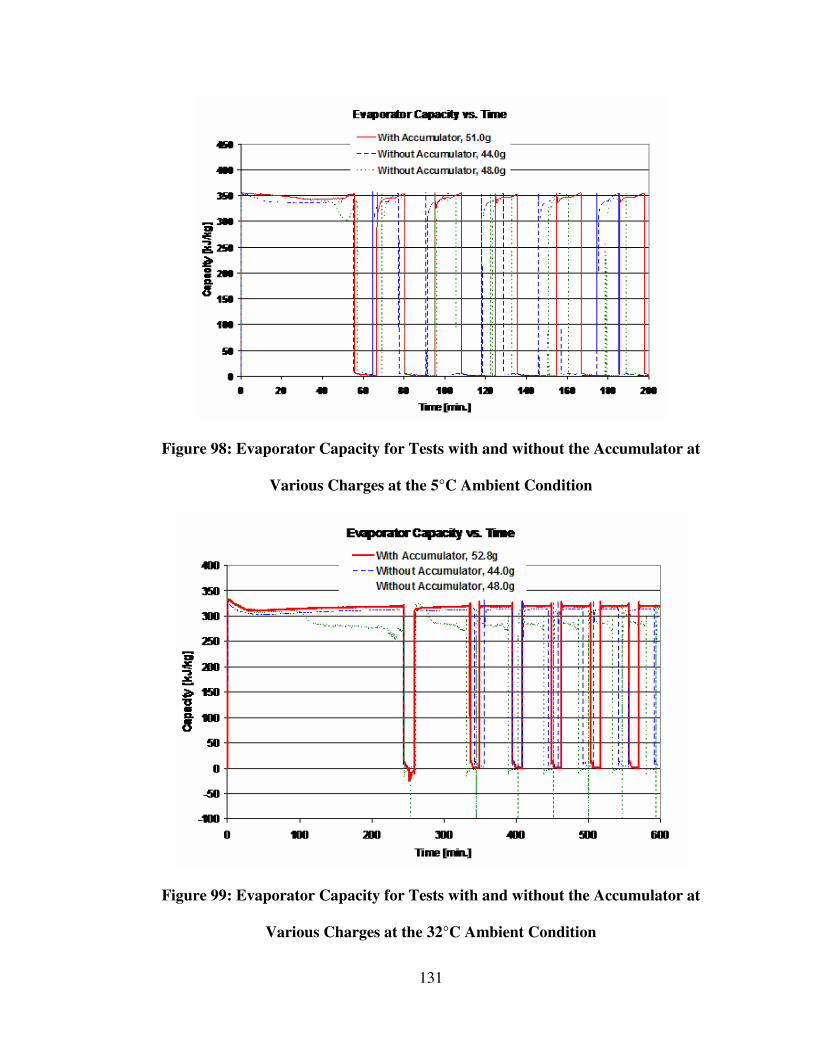
131
Figure 98: Evaporator Capacity for Tests with and without the Accumulator at
Various Charges at the 5°C Ambient Condition
Figure 99: Evaporator Capacity for Tests with and without the Accumulator at
Various Charges at the 32°C Ambient Condition
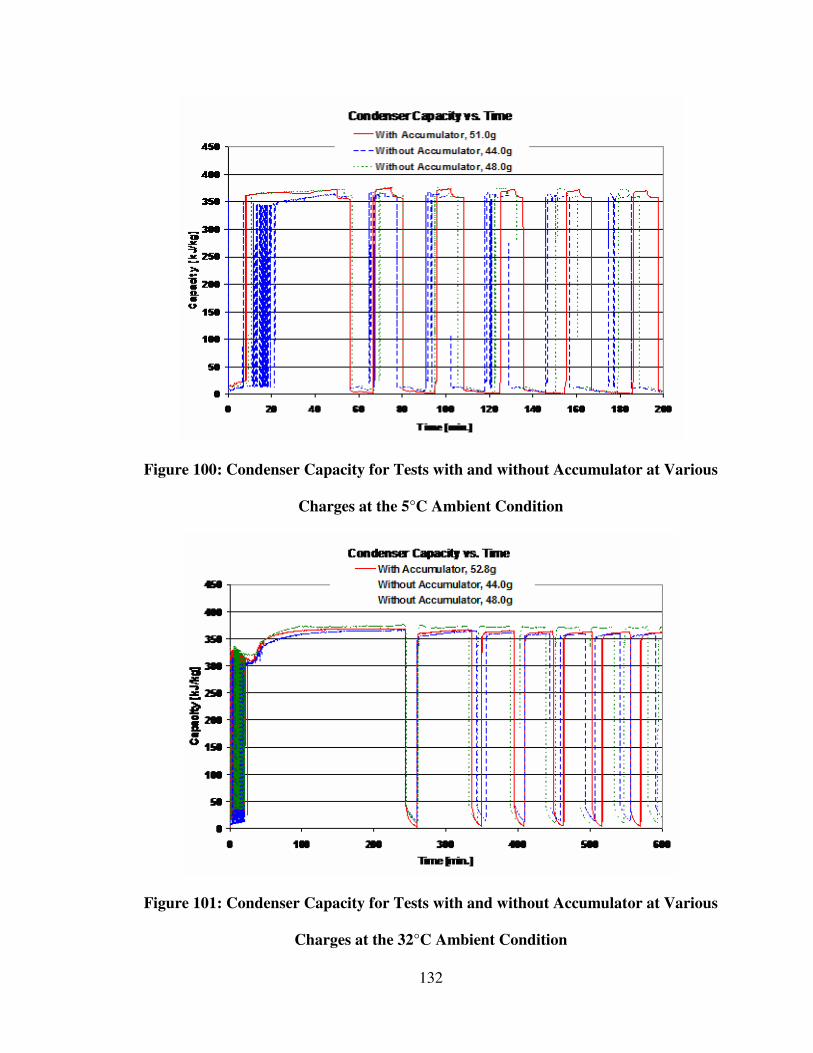
132
Figure 100: Condenser Capacity for Tests with and without Accumulator at Various
Charges at the 5°C Ambient Condition
Figure 101: Condenser Capacity for Tests with and without Accumulator at Various
Charges at the 32°C Ambient Condition
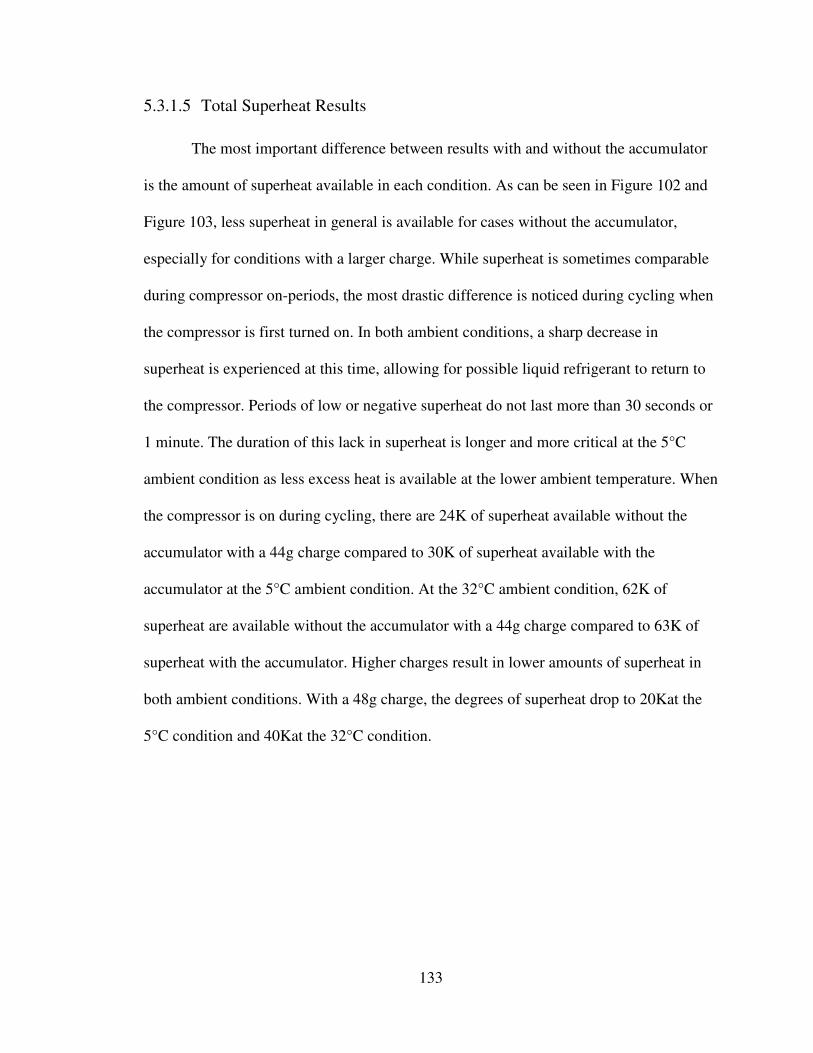
133
5.3.1.5 Total Superheat Results
The most important difference between results with and without the accumulator
is the amount of superheat available in each condition. As can be seen in Figure 102 and
Figure 103, less superheat in general is available for cases without the accumulator,
especially for conditions with a larger charge. While superheat is sometimes comparable
during compressor on-periods, the most drastic difference is noticed during cycling when
the compressor is first turned on. In both ambient conditions, a sharp decrease in
superheat is experienced at this time, allowing for possible liquid refrigerant to return to
the compressor. Periods of low or negative superheat do not last more than 30 seconds or
1 minute. The duration of this lack in superheat is longer and more critical at the 5°C
ambient condition as less excess heat is available at the lower ambient temperature. When
the compressor is on during cycling, there are 24K of superheat available without the
accumulator with a 44g charge compared to 30K of superheat available with the
accumulator at the 5°C ambient condition. At the 32°C ambient condition, 62K of
superheat are available without the accumulator with a 44g charge compared to 63K of
superheat with the accumulator. Higher charges result in lower amounts of superheat in
both ambient conditions. With a 48g charge, the degrees of superheat drop to 20Kat the
5°C condition and 40Kat the 32°C condition.
134
Figure 102: Superheat Results for Tests with and without the Accumulator for
Various Charges at the 5°C Ambient Condition
Figure 103: Superheat Results for Tests with and without the Accumulator for
Various Charges at the 32°C Ambient Condition
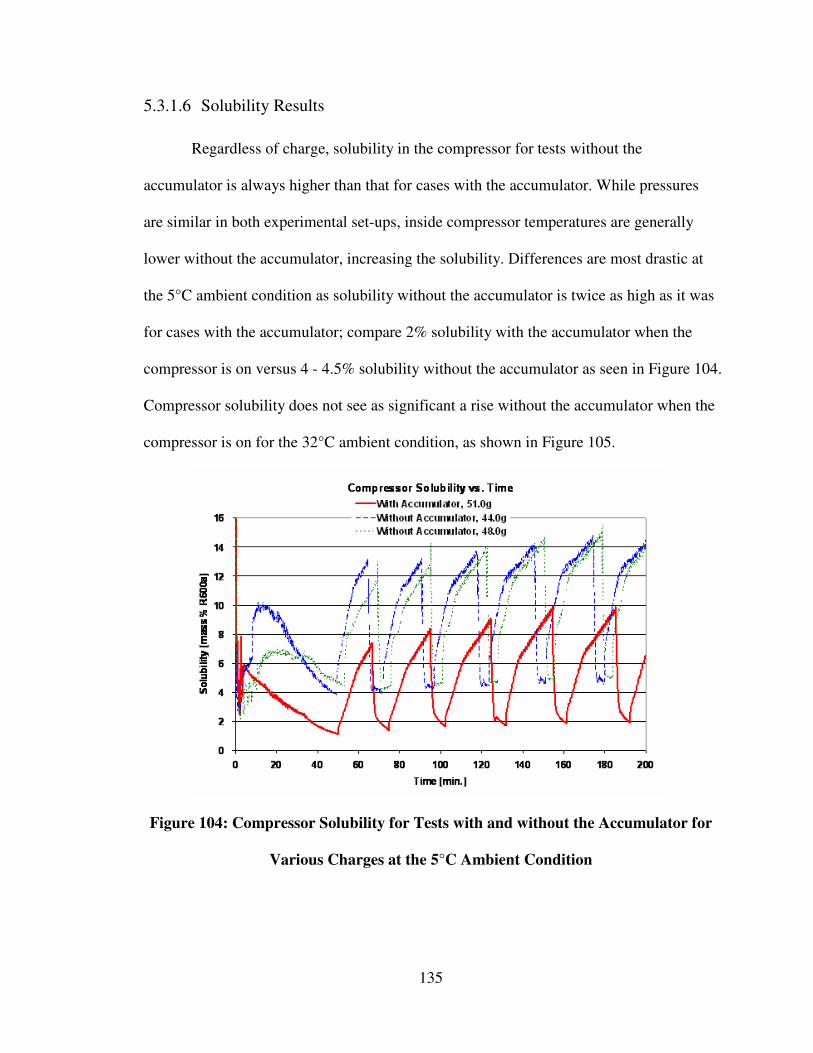
135
5.3.1.6 Solubility Results
Regardless of charge, solubility in the compressor for tests without the
accumulator is always higher than that for cases with the accumulator. While pressures
are similar in both experimental set-ups, inside compressor temperatures are generally
lower without the accumulator, increasing the solubility. Differences are most drastic at
the 5°C ambient condition as solubility without the accumulator is twice as high as it was
for cases with the accumulator; compare 2% solubility with the accumulator when the
compressor is on versus 4 - 4.5% solubility without the accumulator as seen in Figure 104.
Compressor solubility does not see as significant a rise without the accumulator when the
compressor is on for the 32°C ambient condition, as shown in Figure 105.
Figure 104: Compressor Solubility for Tests with and without the Accumulator for
Various Charges at the 5°C Ambient Condition
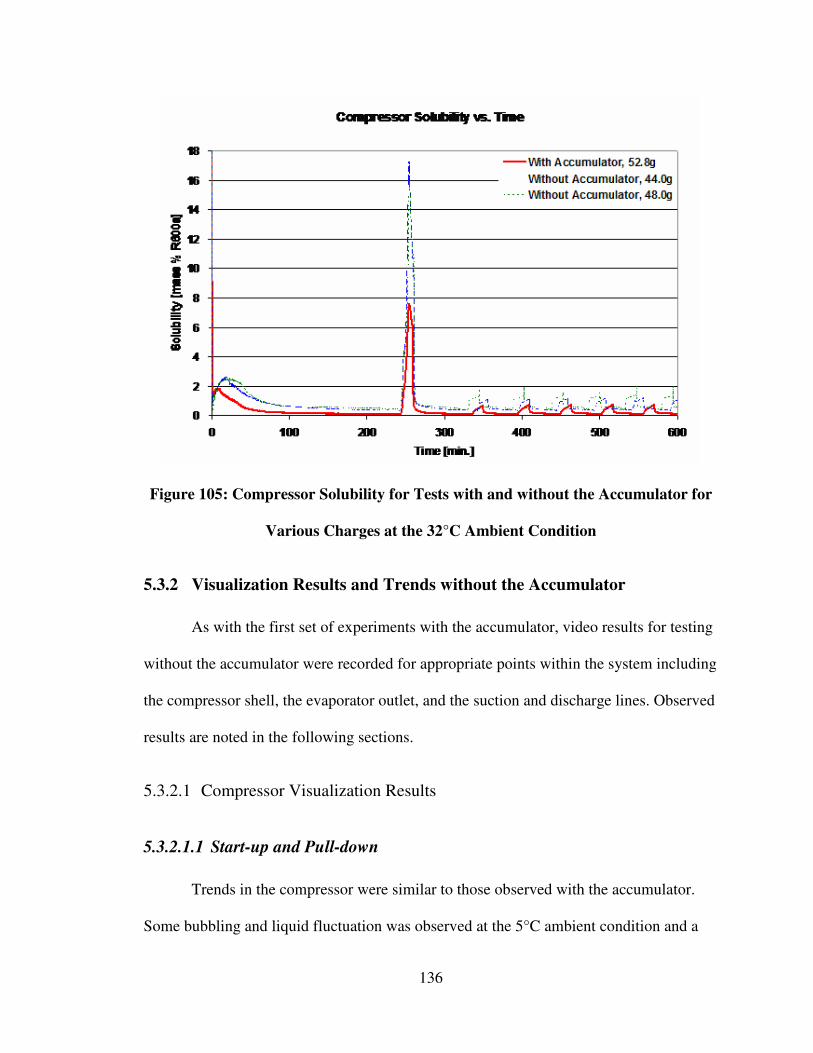
136
Figure 105: Compressor Solubility for Tests with and without the Accumulator for
Various Charges at the 32°C Ambient Condition
5.3.2 Visualization Results and Trends without the Accumulator
As with the first set of experiments with the accumulator, video results for testing
without the accumulator were recorded for appropriate points within the system including
the compressor shell, the evaporator outlet, and the suction and discharge lines. Observed
results are noted in the following sections.
5.3.2.1 Compressor Visualization Results
5.3.2.1.1 Start-up and Pull-down
Trends in the compressor were similar to those observed with the accumulator.
Some bubbling and liquid fluctuation was observed at the 5°C ambient condition and a
137
larger amount of bubbling and foaming was observed at the 32°C ambient condition
when the system was started. Starting liquid levels for both ambient conditions without
the accumulator were higher (6-11% for 5°C and 6-25% for 32°C) than starting levels for
tests with the accumulator. This increase in liquid volume is expected as oil and liquid
refrigerant can no longer be trapped in the accumulator during off-times. More liquid thus
remains within the compressor.
5.3.2.1.2 Cycling
As observed during the start-up and pull-down periods, liquid levels in the
compressor for tests without the accumulator were higher than previous tests with the
accumulator during the cycling periods. When the compressor was on, liquid levels
fluctuated between 105-120mL at the 5°C condition compared to the previous 100mL
observed before, a 5 - 15% increase from cases with the accumulator. When the
compressor was off, liquid levels remained calm between 120-130mL, depending on the
test, for the 5°C ambient condition. In tests with the accumulator, this rest level was
generally around 115mL, making the total increase in liquid volume in the compressor
without the accumulator 4 – 13% higher than the volume previously observed with the
accumulator.
The 32°C condition showed slightly different trends. The liquid surface level
during on-time was observed to be lower than seen in cases with the accumulator; 95-
105mL as compared to previous 115-120mL. More bubbles, however, were observed on
top of the liquid surface level, bringing the total level up to the 120-130mL calibration
mark. This increase in bubbling may be accounted for by the increase in solubility
observed in the compressor without the accumulator. With a higher solubility, more
138
refrigerant would be able to dissolve in the oil during off periods. When the compressor
is turned back on, more bubbles are observed as more refrigerant is released from the
lubricant oil. Similar bubbling, though not as severe, is observed during the initial start-
up for the same reason. Liquid levels in the compressor with and without the accumulator
for the 32°C ambient condition during off periods were comparable around 130mL.
5.3.2.1.3 Defrost
Again, liquid levels in the compressor for tests without the accumulator at the 5°C
ambient condition were higher than those cases with the accumulator. During defrost
stages, liquid levels rose from 120-130mL to 130-145mL, depending on the specific test
and/or refrigerant charge. Previous cases with the accumulator only experienced level rise
to 120-130mL. At the end of the defrost period, bubbling was observed similar to the
bubbling that occurs during the initial start of the system.
For the 32°C condition, liquid level for tests without the accumulator is
comparable to results with the accumulator and is even a little lower during the defrost
period. Again, lots of bubbling and foaming are observed when the compressor is started
after defrost.
A summary of the observed liquid levels in the compressor during each period at
the 5°C and 32°C ambient condition for tests without the accumulator is given in Table
33.
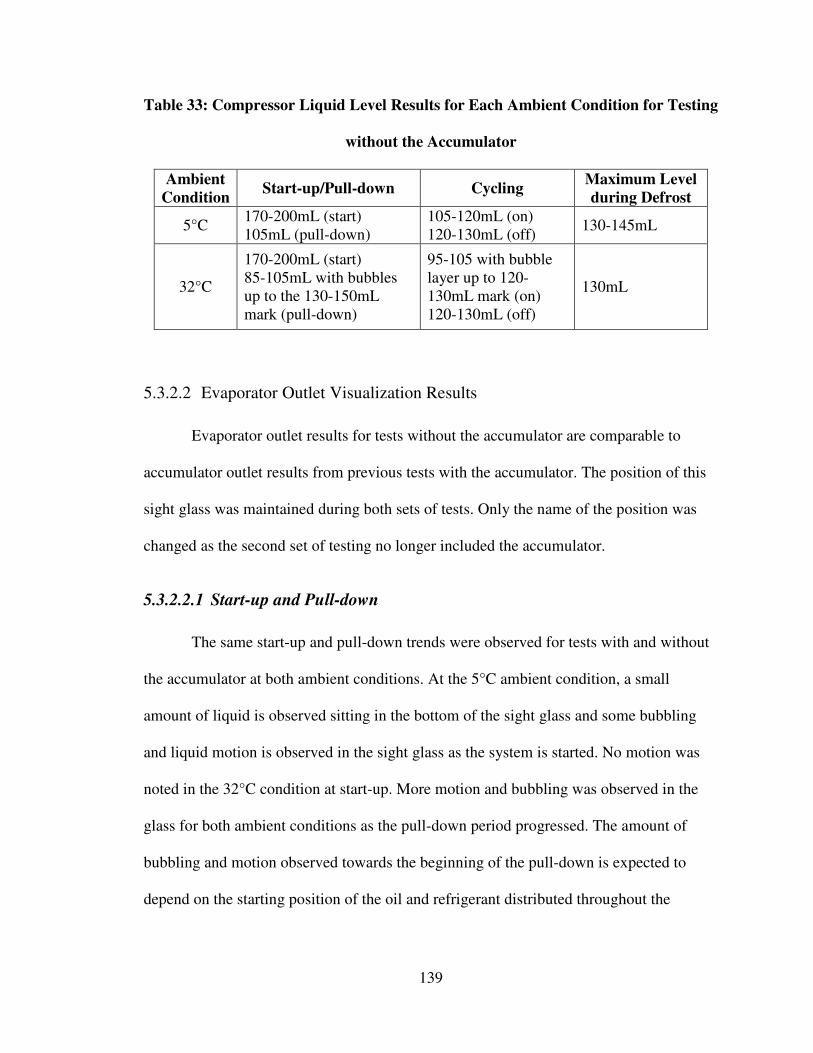
139
Table 33: Compressor Liquid Level Results for Each Ambient Condition for Testing
without the Accumulator
Ambient
Condition Start-up/Pull-down Cycling
Maximum Level
during Defrost
5°C 170-200mL (start) 105mL (pull-down)
105-120mL (on) 120-130mL (off)
130-145mL
32°C
170-200mL (start) 85-105mL with bubbles up to the 130-150mL mark (pull-down)
95-105 with bubble layer up to 120-130mL mark (on) 120-130mL (off)
130mL
5.3.2.2 Evaporator Outlet Visualization Results
Evaporator outlet results for tests without the accumulator are comparable to
accumulator outlet results from previous tests with the accumulator. The position of this
sight glass was maintained during both sets of tests. Only the name of the position was
changed as the second set of testing no longer included the accumulator.
5.3.2.2.1 Start-up and Pull-down
The same start-up and pull-down trends were observed for tests with and without
the accumulator at both ambient conditions. At the 5°C ambient condition, a small
amount of liquid is observed sitting in the bottom of the sight glass and some bubbling
and liquid motion is observed in the sight glass as the system is started. No motion was
noted in the 32°C condition at start-up. More motion and bubbling was observed in the
glass for both ambient conditions as the pull-down period progressed. The amount of
bubbling and motion observed towards the beginning of the pull-down is expected to
depend on the starting position of the oil and refrigerant distributed throughout the
140
system. As tests were not always stopped at equivalent times, oil and refrigerant
distribution at start-up varied among tests, affecting initial video observations.
5.3.2.2.2 Cycling
Again, cycling trends were very similar for tests with and without the accumulator
for both ambient conditions. When the compressor is on, fluctuations and fluid movement
are observable in the evaporator outlet sight glass. Lots of liquid and bubbles are
observed when the compressor is first turned on after an off-period as refrigerant boils
out of any available oil, and following, the liquid motion settles into the usual
fluctuations. Liquid bubbling and popping is periodically observed during the off-period
for both ambient conditions with and without the accumulator as refrigerant evaporates
with warming temperatures in the evaporator.
5.3.2.2.3 Defrost
Poor visualization generally plagued the defrost period, though some trends were
able to be observed. At the 5°C ambient condition, lots of liquid motion and violent
liquid surging were observed through the evaporator outlet as the defrost period began.
Visualization then prevented observation of any further trends until cycling had resumed.
Similar liquid motion and surging was observed for the 32°C condition and lots of liquid
was also observed after the defrost as the compressor was turned back on. These results
are consistent with observations from tests with the accumulator.
141
5.3.2.3 Suction and Discharge Line Visualization Results
5.3.2.3.1 Start-up and Pull-down
For cases with and without the accumulator at both ambient conditions, liquid is
observed through both the suction and discharge sight glasses as the system is turned on.
In some cases, such as tests without the accumulator at 32°C, a surge of liquid is
observed in both lines which then settles into a lower level of liquid motion along the
bottom of the sight glass. In all cases, liquid motion within both the suction and discharge
lines is minimal and appears to be mostly oil as evidenced by the observation of the dye
color in the compressor oil.
5.3.2.3.2 Cycling
Observations at the suction and discharge sight glasses during cycling show one
of the most noticeable changes from prior testing with the accumulator. Without the
accumulator, surges of liquid are observed for several seconds through both lines as the
compressor is started after an off-period. Some amount of liquid through both lines
continues afterwards, as also observed in cases with the accumulator. No motion in either
line is observed in the off-period, but condensation forms on the suction line sight glass at
the 5°C ambient condition. Condensation on the suction line occurs because without the
accumulator to trap cold oil and refrigerant, colder fluid and vapor enters the suction line.
Results show that temperatures are colder than the ambient air, allowing for the
condensation of water vapor. The suction and discharge lines are also the only locations
that show a difference in trends between different refrigerant charges for cases without
the accumulator. Larger charges, including 48.0g, 50.2g, and 52.0g, show more liquid
142
through the suction line as the compressor is turned on during cycling and for a longer
period of time than is observed for the 44.0g test. This trend is most prominent at the 5°C
condition and relates directly to the lack of superheat available when the compressor is
first turned on.
Not as much liquid is observed through either line at the 32°C condition when the
compressor starts during cycling as more superheat is available with the higher ambient
temperature. As seen with the above mentioned temperature, pressure, and superheat
results without the accumulator, the warmer ambient condition does not present as much
of a risk for liquid flow back to the compressor.
5.3.2.3.3 Defrost
Like the case for cycling, the liquid motion through the suction and discharge
lines is also different in tests without the accumulator than was observed in tests with the
accumulator. Changes are primarily notable for the 5°C ambient condition and not as
much for the 32°C case for above mentioned reasons relating to superheat. For the 5°C
condition, previous observations showed no motion through the discharge line during
defrost and only some occasional surging of liquid through the suction line. For tests
without the accumulator, surging of liquid is observed through both the suction and
discharge lines, but more so in the suction line. As with cycling, motion is more
pronounced with larger refrigerant charges, but the case with only 44.0g of R600a sees
less motion through both glasses initially and no motion through much of the defrost
period. For the 32°C, trends are very similar to those observed for tests with the
accumulator. Motion initially stops in both lines and some bubbling of liquid is observed
in the sight glasses throughout the defrost period. There are not as many noticeable
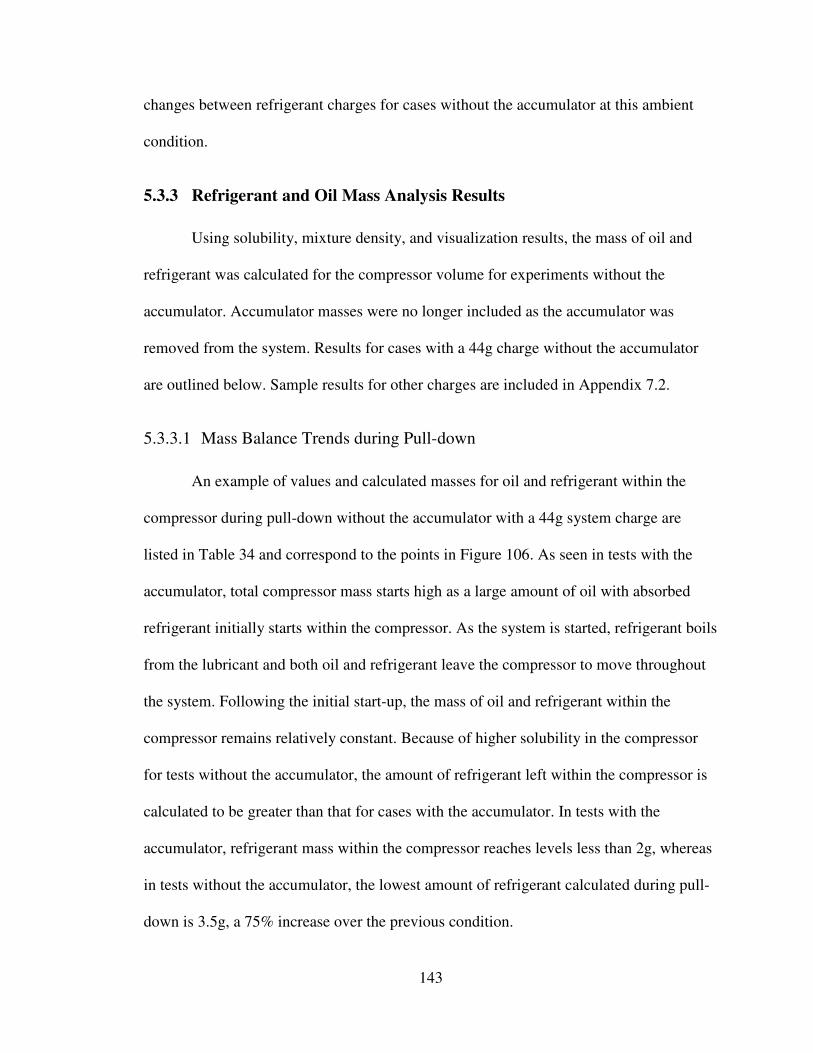
143
changes between refrigerant charges for cases without the accumulator at this ambient
condition.
5.3.3 Refrigerant and Oil Mass Analysis Results
Using solubility, mixture density, and visualization results, the mass of oil and
refrigerant was calculated for the compressor volume for experiments without the
accumulator. Accumulator masses were no longer included as the accumulator was
removed from the system. Results for cases with a 44g charge without the accumulator
are outlined below. Sample results for other charges are included in Appendix 7.2.
5.3.3.1 Mass Balance Trends during Pull-down
An example of values and calculated masses for oil and refrigerant within the
compressor during pull-down without the accumulator with a 44g system charge are
listed in Table 34 and correspond to the points in Figure 106. As seen in tests with the
accumulator, total compressor mass starts high as a large amount of oil with absorbed
refrigerant initially starts within the compressor. As the system is started, refrigerant boils
from the lubricant and both oil and refrigerant leave the compressor to move throughout
the system. Following the initial start-up, the mass of oil and refrigerant within the
compressor remains relatively constant. Because of higher solubility in the compressor
for tests without the accumulator, the amount of refrigerant left within the compressor is
calculated to be greater than that for cases with the accumulator. In tests with the
accumulator, refrigerant mass within the compressor reaches levels less than 2g, whereas
in tests without the accumulator, the lowest amount of refrigerant calculated during pull-
down is 3.5g, a 75% increase over the previous condition.
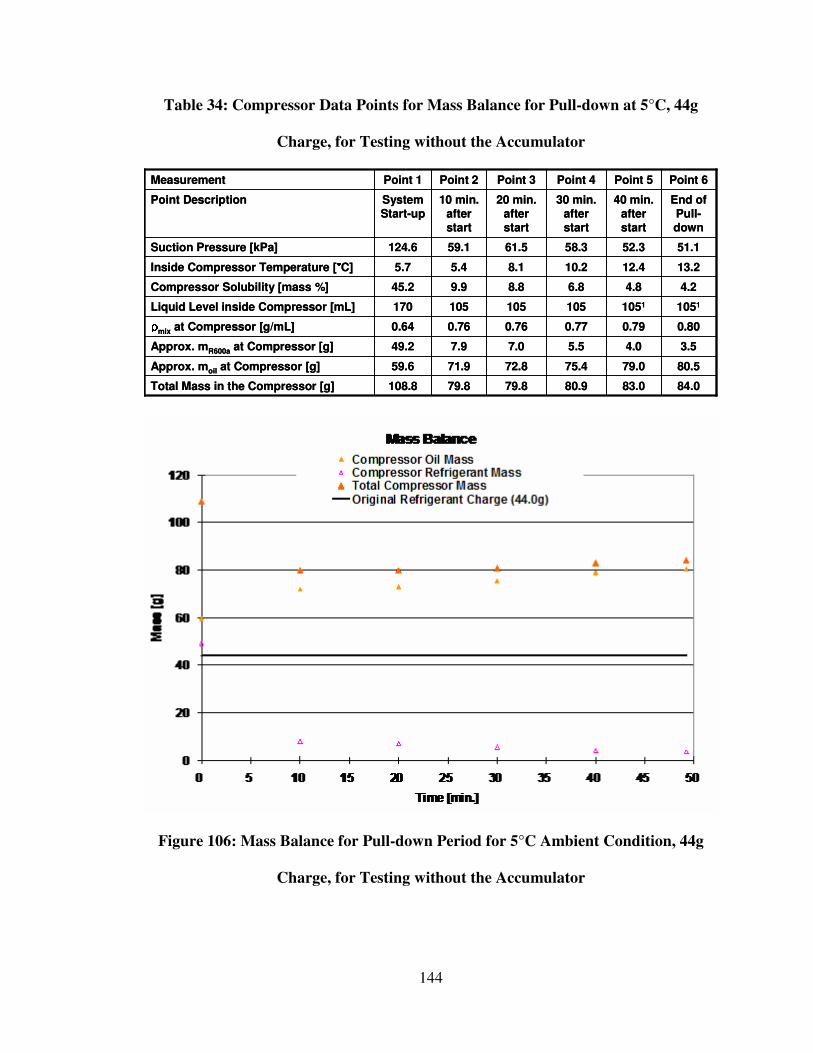
144
Table 34: Compressor Data Points for Mass Balance for Pull-down at 5°C, 44g
Charge, for Testing without the Accumulator
80.9
75.4
5.5
0.77
105
6.8
10.2
58.3
30 min. after start
Point 4
83.0
79.0
4.0
0.79
1051
4.8
12.4
52.3
40 min. after start
Point 5
80.5 72.8 71.9 59.6 Approx. moil at Compressor [g]
84.0 79.8 79.8 108.8 Total Mass in the Compressor [g]
0.800.760.760.64ρρρρmix at Compressor [g/mL]
4.28.89.945.2Compressor Solubility [mass %]
13.28.15.45.7Inside Compressor Temperature [°°°°C]
3.5 7.0 7.9 49.2 Approx. mR600a at Compressor [g]
1051105105170Liquid Level inside Compressor [mL]
51.161.559.1124.6Suction Pressure [kPa]
End of Pull-down
20 min. after start
10 min. after start
System Start-up
Point Description
Point 6Point 3Point 2Point 1Measurement
Figure 106: Mass Balance for Pull-down Period for 5°C Ambient Condition, 44g
Charge, for Testing without the Accumulator
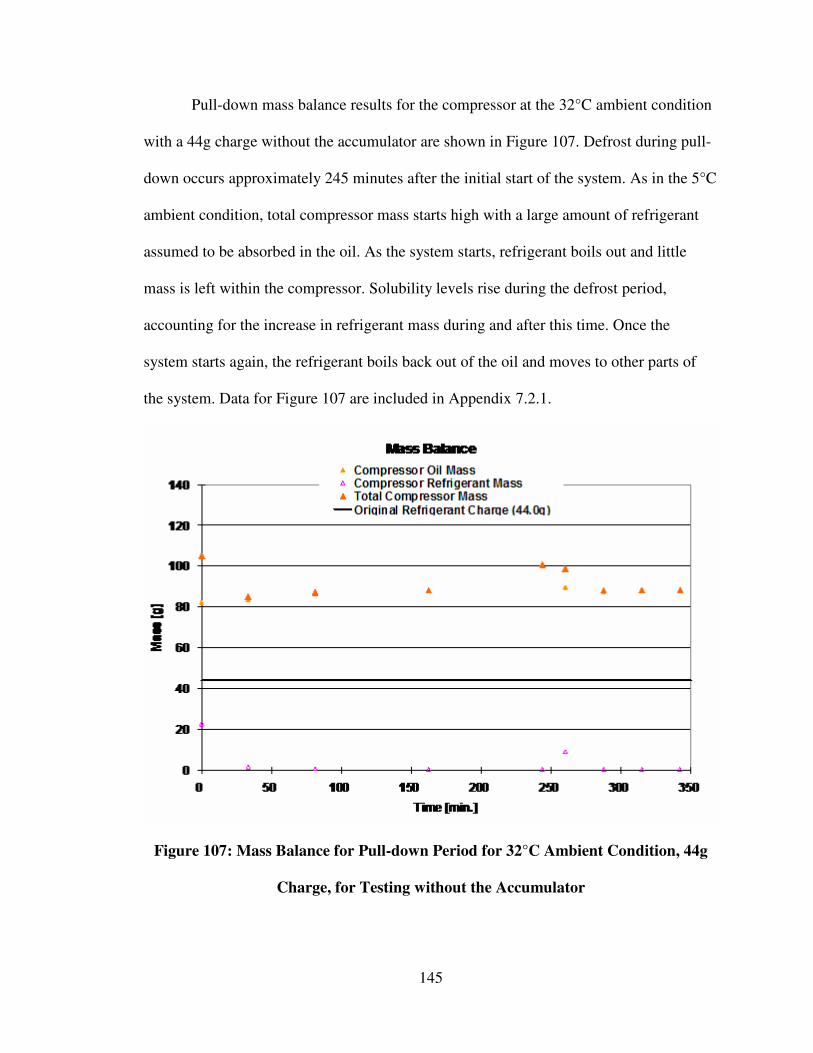
145
Pull-down mass balance results for the compressor at the 32°C ambient condition
with a 44g charge without the accumulator are shown in Figure 107. Defrost during pull-
down occurs approximately 245 minutes after the initial start of the system. As in the 5°C
ambient condition, total compressor mass starts high with a large amount of refrigerant
assumed to be absorbed in the oil. As the system starts, refrigerant boils out and little
mass is left within the compressor. Solubility levels rise during the defrost period,
accounting for the increase in refrigerant mass during and after this time. Once the
system starts again, the refrigerant boils back out of the oil and moves to other parts of
the system. Data for Figure 107 are included in Appendix 7.2.1.
Figure 107: Mass Balance for Pull-down Period for 32°C Ambient Condition, 44g
Charge, for Testing without the Accumulator
146
5.3.3.2 Mass Balance Trends during Cycling
As mentioned above with the visualization results, cycling trends were similar for
cases with and without the accumulator, though there were increases in the total liquid
volume level and changes in flow patterns shortly after the compressor was turned on. To
capture what was happening during the first minute of compressor operation, data was
observed just 30 seconds after the compressor was turned on. As can be seen for the 5°C
ambient condition with a 44g charge without the accumulator in Figure 108, shortly after
the compressor turns on at time zero, liquid volume is flashed from the compressor,
possibly accounting for the surge of liquid observed through the discharge line. In
addition, more liquid refrigerant mass is calculated at this point, suggesting liquid flow
from the suction line brings more liquid refrigerant into the compressor. Following the
initial start of cycling, the liquid level and amount of oil and refrigerant mass in the
compressor gradually decrease as the system distribution slowly equalizes. Little change
is observed during the off period, indicated by points between 5 and 30 minutes in Figure
108, though more refrigerant mass is calculated at this time as it is able to absorb within
the compressor oil.
Mass balance results for the compressor at the 32°C ambient condition with a 44g
charge without the accumulator are shown in Figure 109. At this condition, cycling off
time was shorter and is indicated by points between 0 – 14 minutes. Again, data was
examined just 30 seconds following the beginning of the on-period, but as can be seen by
the sharp overlay of points in the figure, little change is noted at this condition. As
mentioned above, the warmer ambient was still able to provide sufficient superheat
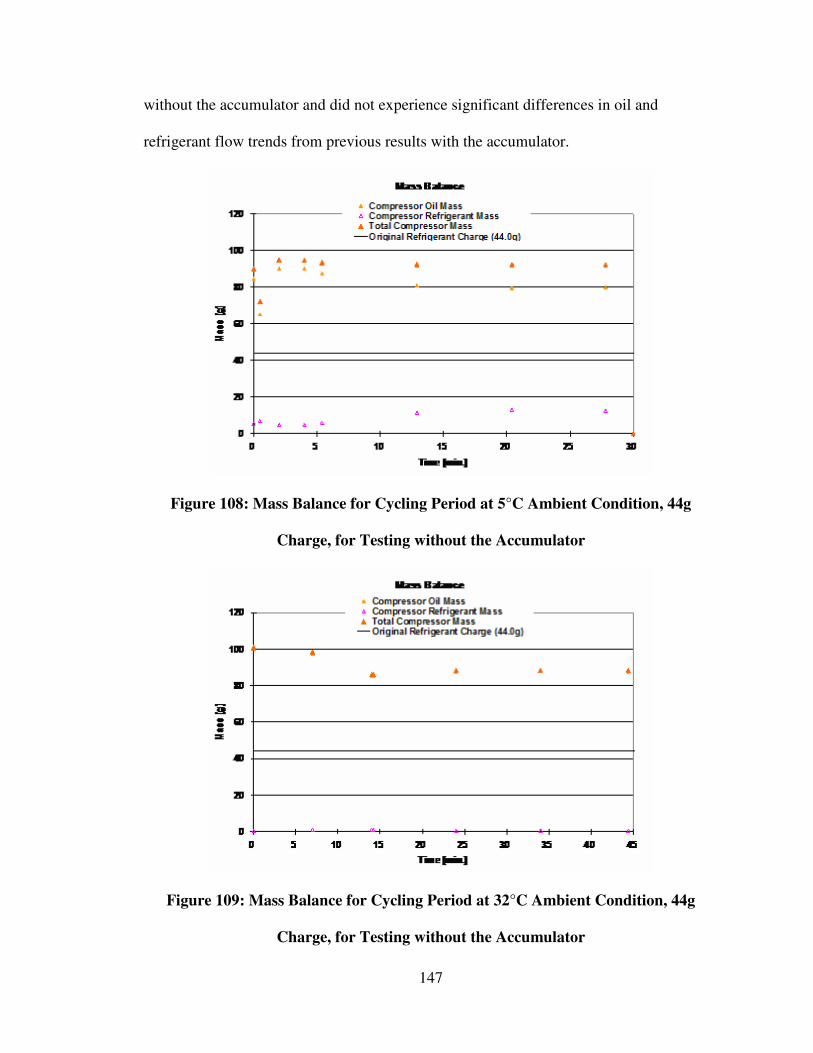
147
without the accumulator and did not experience significant differences in oil and
refrigerant flow trends from previous results with the accumulator.
Figure 108: Mass Balance for Cycling Period at 5°C Ambient Condition, 44g
Charge, for Testing without the Accumulator
Figure 109: Mass Balance for Cycling Period at 32°C Ambient Condition, 44g
Charge, for Testing without the Accumulator
148
5.3.3.3 Mass Balance Trends during Defrost
Results for the 5°C ambient condition during the defrost period suggested that
solubility within the compressor reached levels as high as 100%, as seen in tables
presented in Appendix 7.2.3. Using the given method of analysis, this would suggest that
all oil leaves the compressor and any observed liquid is purely liquid refrigerant, which is
virtually impossible. This analysis problem was also experienced in the accumulator in
prior tests during the defrost stage; low temperatures and moderate pressures produced
high solubility levels, suggesting only pure liquid refrigerant in the accumulator.
Individual observations at other points of operation, including times when the system was
not operating, suggested that a small amount of oil was trapped in the accumulator at all
times. Such observations and measurements of solubility clearly illustrate the challenges
in the current method of analysis.
The problem of high solubility in the compressor during defrost did not, however,
occur during the higher 32°C ambient condition. This case allowed for a more
appropriate assessment of the mass balance within the compressor during the defrost
stage. Results are shown for a 44g charge without the accumulator in Figure 110. Periods
of high power are represented by points between 0-10 minutes and periods of low power
are represented by points between 10-17 minutes. As with the off-period in cycling,
solubility increases while the compressor is off during defrost and refrigerant is able to
absorb within the compressor oil. Whether the amount of oil and total mass actually
decrease during the defrost period, however, is questionable.
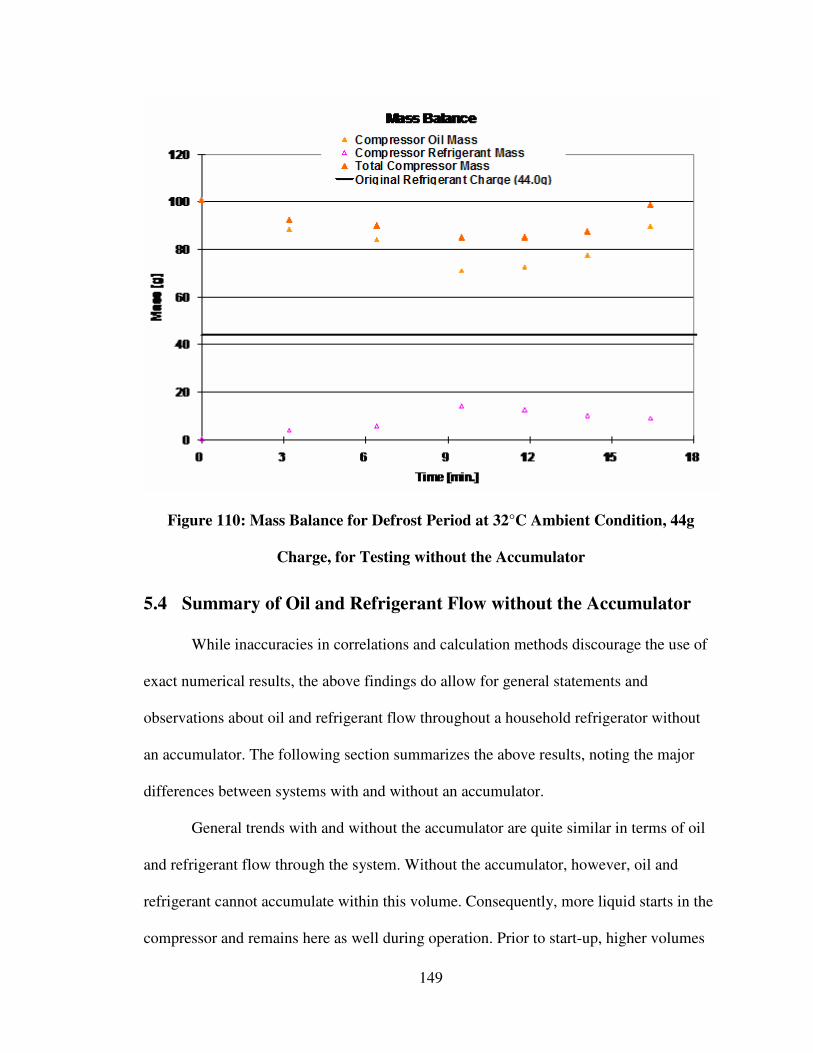
149
Figure 110: Mass Balance for Defrost Period at 32°C Ambient Condition, 44g
Charge, for Testing without the Accumulator
5.4 Summary of Oil and Refrigerant Flow without the Accumulator
While inaccuracies in correlations and calculation methods discourage the use of
exact numerical results, the above findings do allow for general statements and
observations about oil and refrigerant flow throughout a household refrigerator without
an accumulator. The following section summarizes the above results, noting the major
differences between systems with and without an accumulator.
General trends with and without the accumulator are quite similar in terms of oil
and refrigerant flow through the system. Without the accumulator, however, oil and
refrigerant cannot accumulate within this volume. Consequently, more liquid starts in the
compressor and remains here as well during operation. Prior to start-up, higher volumes
150
of liquid rest within the compressor compared to the system with the accumulator. As the
system is started, bubbling occurs within the compressor as refrigerant boils from the
lubricant, as observed in cases with the accumulator. As the liquid volume decreases and
fluctuates in the compressor during pull-down the overall volume continues to remain
higher that what is observed for conditions with the accumulator. This is due both to the
lack of accumulator volume for oil and refrigerant accumulation as well as to an
increased solubility from a decrease in compressor temperature. Without the accumulator,
colder liquid and vapor traverses the suction line and enters the compressor, increasing
the solubility within the volume.
During cycling, again higher liquid volume levels occur in the compressor than do
in cases with the accumulator. A more important difference, however, occurs during this
period of operation. In cold ambient conditions, liquid enters the compressor just after the
compressor is turned on after an off-period. Without the accumulator at low ambient
temperatures, sufficient superheat is not available during the initial start of the
compressor during cycling. For periods of 30 seconds to 1 minute, liquid flows through
the suction line and enters the compressor, most likely containing liquid refrigerant as
well as oil. Following this time, the suction line is able to warm as the system re-
approaches operating conditions, and superheat is available to ensure that only vapor
returns to the compressor. This phenomenon is more prevalent with larger refrigerant
charges to the system and is not observed at all at the higher ambient conditions.
Liquid levels during the defrost period rise in the compressor as solubility
increases and refrigerant is able to absorb within the compressor oil. At low ambient
temperatures, as in during cycling periods, an insufficient amount of superheat is
151
available to ensure that only refrigerant vapor returns to the compressor. Liquid
periodically surges and bubbles in the suction line at this time and larger amounts of
liquid flow through both the suction and discharge line when the compressor is re-started
following the defrost stage. This problem was also observed for cases with the
accumulator, but not to the degree it was seen for tests without the accumulator. Again,
the warmer ambient temperatures provide sufficient superheat and the threat of
refrigerant liquid flow to the compressor is less of a concern.
5.5 Advantages and Disadvantages of Removing the Accumulator
As indicated by the above results, the removal of the accumulator, while there are
periods of insufficient superheat, does not appear to cause significant damage to the
compressor for short time periods. The following section outlines some of the advantages
and disadvantages of removing the accumulator in existing and future household
refrigerator models.
Advantages of removing the accumulator come in many forms. For one, removing
any portion of a system safely helps to eliminate material cost, manufacturing challenges,
and labor time. Removing the accumulator also allows for more space within the freezer
cabinet for evaporator piping and installation. As suggested by several researchers,
removing the accumulator also allows for any liquid refrigerant in or near the evaporator
to flow back to the evaporator during off-periods, making it easier and quicker to bring
the evaporator back to appropriate temperatures when the compressor is re-started.
Accumulator removal also ensures that the maximum amount of oil will remain within
the compressor as a separate volume is no longer available to trap needed lubricant for
the compressor. Finally, as seen through the charge tests conducted without the
152
accumulator, less refrigerant for a system without an accumulator is needed to obtain
similar results for a system with an accumulator. Less refrigerant allows for lower system
cost as well as the conservation of refrigerant liquids.
While removing the accumulator may provide several benefits, there are also
several disadvantages, some with potentially hazardous consequences. To begin, while
removing the accumulator allows for a lower refrigerant charge, it also makes the entire
system much more sensitive to any change in refrigerant charge. More extensive testing
would be necessary to determine the appropriate refrigerant charge and the system would
also become much more sensitive and reactive to system leaks. Removing the
accumulator also causes major concern for the amount of superheat available to the
system. Especially at lower temperatures, liquid is observed to flow back to the
compressor as it turns on during cycling. While this liquid flow may not always contain
significant amounts of liquid refrigerant and while it only lasts for a matter of seconds,
the long term effects of continued periodic liquid flow back to the compressor are
unknown and potentially damaging.
5.6 Conclusions
Experimentation without the accumulator was successfully conducted at the 5°C
and 32°C ambient conditions. Testing at the 43°C ambient condition without the
accumulator was not conducted as cycling was not observed at this ambient temperature
in prior tests with the accumulator. Data and visualization results were collected and
compared to results obtained in evperiments with the accumulator. In order to find results
that were similar to those for tests with the accumulator, various refrigerant charges were
explored in the system without the accumulator. A charge of 44g in the system without
153
the accumulator was found to have the best agreement with results from tests with the
accumulator for both the 5°C and 32°C condition. Original charge to the system with the
accumulator was 52g R600a.
Variations in data temperatures and pressures were noted, primarily lower
temperatures in the suction line and compressor shell as colder liquid and vapor was
returned to the compressor in tests without the accumulator. Major differences included
the lack of superheat available at the lower ambient condition during the cycling period
when the compressor was turned back on. During this period of operation, liquid was
observed flowing back to the compressor and data suggested a lack of superheat for
several seconds. This trend was not observed at the warmer ambient condition and it is
believed that the removal of the accumulator at higher ambient temperatures has little
negative effect on the system. Variations in pull-down and cycling times were again
observed and depended on ambient temperature as well as on the individual test.
In total, the accumulator was successfully removed from the system and did not
cause compressor damage or system failure. Liquid was observed to flow back to the
compressor during cycling at the lower ambient condition, but this liquid flow only lasted
a short time and did not appear to cause stress to the compressor. Effects of this liquid
flow over a longer life of the system, however, are unknown.
154
6 Recommendations and Future Work
In order to better understand the role of the accumulator and the effect of its
removal on the compressor and other components of a household refrigeration system
and the relationship between Freol S-10 mineral oil and R600a, more research and
experimentation are recommended. Due to the limitations in this study, accurate real-time
measurements of oil and refrigerant solubility and mixture density were not achieved and
instead, analysis methods depended on set correlations based on equilibrium
measurements, ultimately leading to inaccuracies in transient mass balance calculations.
To provide more accurate results and a better representation of the amount of oil and
refrigerant in the compressor and accumulator during operation, future work should
include the real-time measurement of oil and refrigerant liquid volume, solubility, and
mixture density.
While results show that the removal of the accumulator does not pose a threat to
the life of the compressor at higher ambient temperatures, there is a lack of superheat
available to the system and liquid flow back to the compressor is observed during cycling
and defrost periods at cold ambient conditions. Future experimentation should evaluate
the long term effects this periodic flow back to the compressor may cause. If damage to
the compressor is minimal and does not cause premature failure of the system, the
removal of the accumulator may be a viable option without much consequence. If,
however, periodic pulses of liquid refrigerant to the compressor cause the system to fail
sooner than experienced in normal operation, it will be necessary to keep the accumulator
or some other storage device in the system.
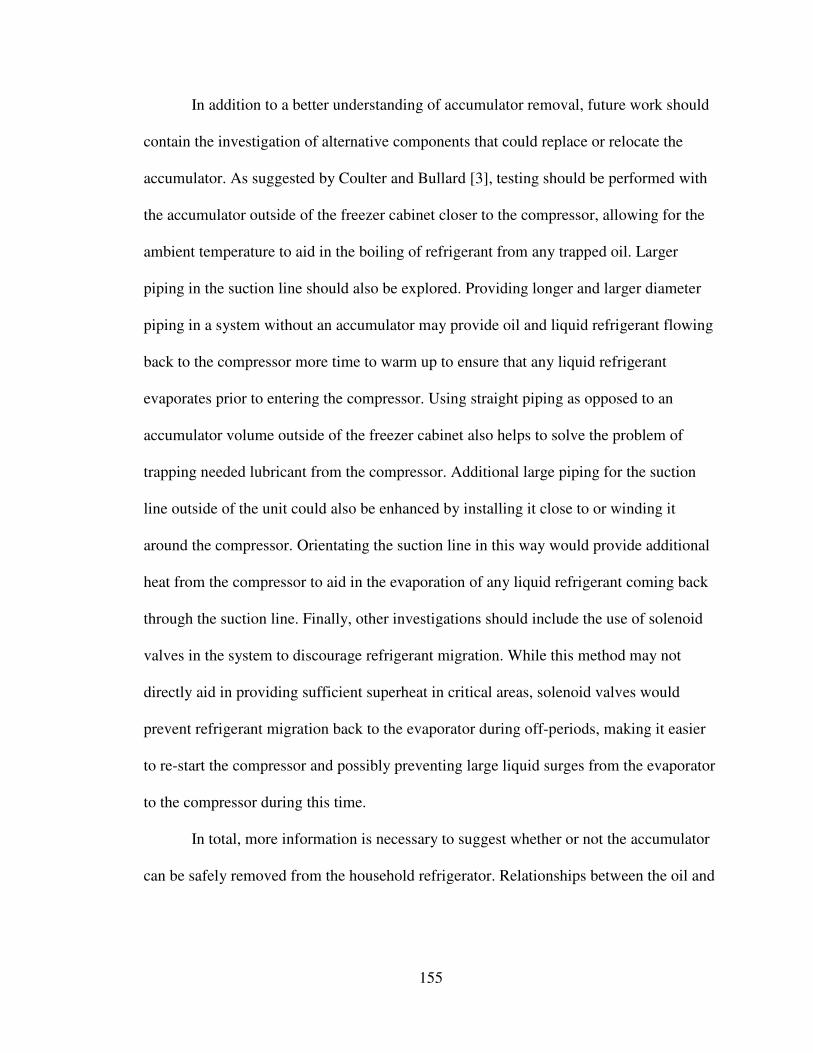
155
In addition to a better understanding of accumulator removal, future work should
contain the investigation of alternative components that could replace or relocate the
accumulator. As suggested by Coulter and Bullard [3], testing should be performed with
the accumulator outside of the freezer cabinet closer to the compressor, allowing for the
ambient temperature to aid in the boiling of refrigerant from any trapped oil. Larger
piping in the suction line should also be explored. Providing longer and larger diameter
piping in a system without an accumulator may provide oil and liquid refrigerant flowing
back to the compressor more time to warm up to ensure that any liquid refrigerant
evaporates prior to entering the compressor. Using straight piping as opposed to an
accumulator volume outside of the freezer cabinet also helps to solve the problem of
trapping needed lubricant from the compressor. Additional large piping for the suction
line outside of the unit could also be enhanced by installing it close to or winding it
around the compressor. Orientating the suction line in this way would provide additional
heat from the compressor to aid in the evaporation of any liquid refrigerant coming back
through the suction line. Finally, other investigations should include the use of solenoid
valves in the system to discourage refrigerant migration. While this method may not
directly aid in providing sufficient superheat in critical areas, solenoid valves would
prevent refrigerant migration back to the evaporator during off-periods, making it easier
to re-start the compressor and possibly preventing large liquid surges from the evaporator
to the compressor during this time.
In total, more information is necessary to suggest whether or not the accumulator
can be safely removed from the household refrigerator. Relationships between the oil and

156
refrigerant are still not perfectly understood and long-term effects of accumulator
removal are unknown. These issues should be explored in future work.
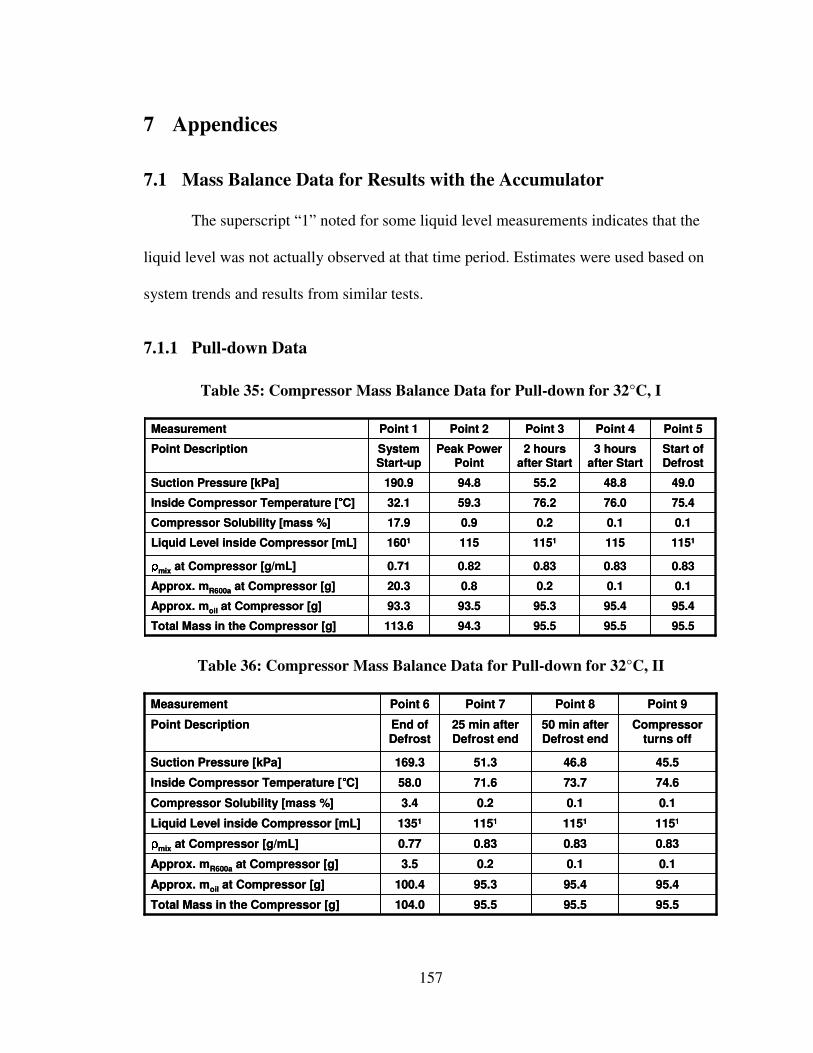
157
7 Appendices
7.1 Mass Balance Data for Results with the Accumulator
The superscript “1” noted for some liquid level measurements indicates that the
liquid level was not actually observed at that time period. Estimates were used based on
system trends and results from similar tests.
7.1.1 Pull-down Data
Table 35: Compressor Mass Balance Data for Pull-down for 32°C, I
95.495.495.393.593.3Approx. moil at Compressor [g]
95.595.595.594.3113.6Total Mass in the Compressor [g]
0.830.830.830.820.71ρρρρmix at Compressor [g/mL]
0.10.10.20.917.9Compressor Solubility [mass %]
75.476.076.259.332.1Inside Compressor Temperature [°°°°C]
0.10.10.20.820.3Approx. mR600a at Compressor [g]
115111511511151601Liquid Level inside Compressor [mL]
49.048.855.294.8190.9Suction Pressure [kPa]
Start of Defrost
3 hours after Start
2 hours after Start
Peak Power Point
System Start-up
Point Description
Point 5Point 4Point 3Point 2Point 1Measurement
Table 36: Compressor Mass Balance Data for Pull-down for 32°C, II
95.495.495.3100.4Approx. moil at Compressor [g]
95.595.595.5104.0Total Mass in the Compressor [g]
0.830.830.830.77ρρρρmix at Compressor [g/mL]
0.10.10.23.4Compressor Solubility [mass %]
74.673.771.658.0Inside Compressor Temperature [°°°°C]
0.10.10.23.5Approx. mR600a at Compressor [g]
1151115111511351Liquid Level inside Compressor [mL]
45.546.851.3169.3Suction Pressure [kPa]
Compressor
turns off
50 min after
Defrost end
25 min after
Defrost end
End of
Defrost
Point Description
Point 9Point 8Point 7Point 6Measurement
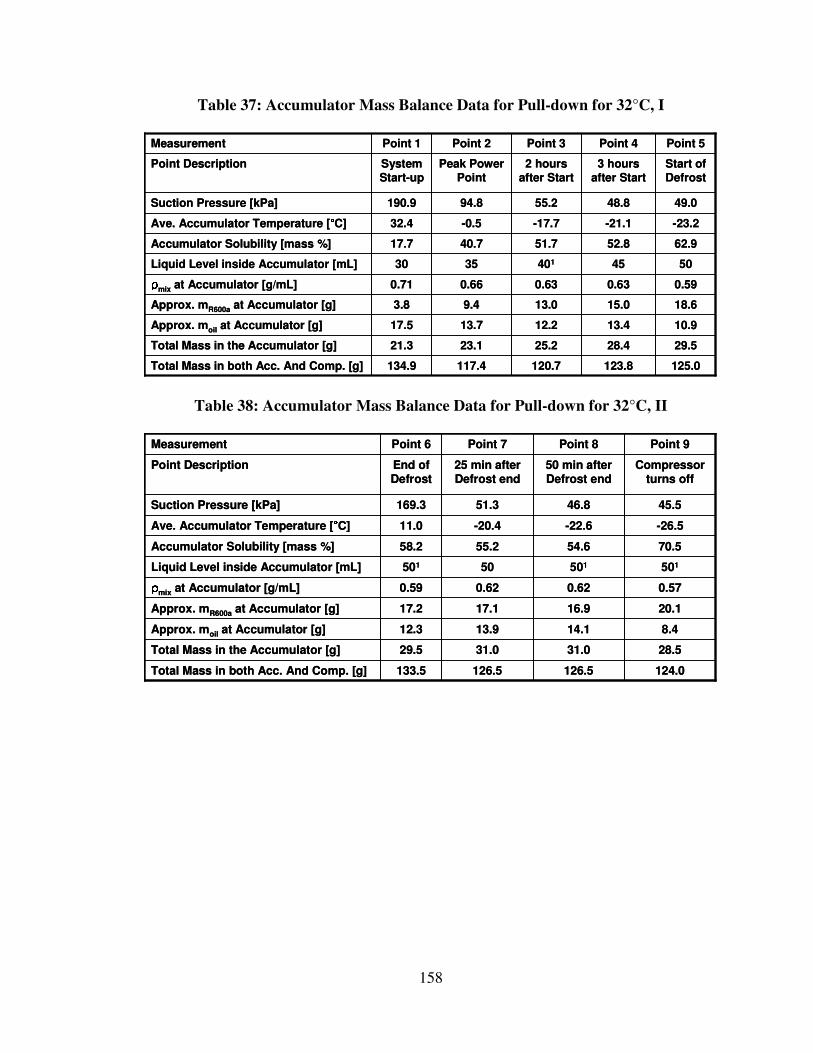
158
Table 37: Accumulator Mass Balance Data for Pull-down for 32°C, I
29.528.425.223.121.3Total Mass in the Accumulator [g]
125.0123.8120.7117.4134.9Total Mass in both Acc. And Comp. [g]
10.913.412.213.717.5Approx. moil at Accumulator [g]
0.590.630.630.660.71ρρρρmix at Accumulator [g/mL]
-23.2-21.1-17.7-0.532.4Ave. Accumulator Temperature [°°°°C]
62.952.851.740.717.7Accumulator Solubility [mass %]
18.615.013.09.43.8Approx. mR600a at Accumulator [g]
50454013530Liquid Level inside Accumulator [mL]
49.048.855.294.8190.9Suction Pressure [kPa]
Start of Defrost
3 hours after Start
2 hours after Start
Peak Power Point
System Start-up
Point Description
Point 5Point 4Point 3Point 2Point 1Measurement
Table 38: Accumulator Mass Balance Data for Pull-down for 32°C, II
28.531.031.029.5Total Mass in the Accumulator [g]
124.0126.5126.5133.5Total Mass in both Acc. And Comp. [g]
8.414.113.912.3Approx. moil at Accumulator [g]
0.570.620.620.59ρρρρmix at Accumulator [g/mL]
-26.5-22.6-20.411.0Ave. Accumulator Temperature [°°°°C]
70.554.655.258.2Accumulator Solubility [mass %]
20.116.917.117.2Approx. mR600a at Accumulator [g]
50150150501Liquid Level inside Accumulator [mL]
45.546.851.3169.3Suction Pressure [kPa]
Compressor turns off
50 min after Defrost end
25 min after Defrost end
End of Defrost
Point Description
Point 9Point 8Point 7Point 6Measurement
159
Table 39: Compressor Mass Balance Data for Pull-down for 43°C, I
94.192.593.589.5Approx. moil at Compressor [g]
94.393.294.3112.0Total Mass in the Compressor [g]
0.820.810.820.70ρρρρmix at Compressor [g/mL]
0.20.70.820.1Compressor Solubility [mass %]
91.177.261.443.0Inside Compressor Temperature [°°°°C]
0.20.70.822.5Approx. mR600a at Compressor [g]
1151115115160Liquid Level inside Compressor [mL]
76.9112.590.9273.6Suction Pressure [kPa]
69 min after system on
Peak Power Point
15 min after system on
System turned on
Point Description
Point 4Point 3Point 2Point 1Measurement
Table 40: Compressor Mass Balance Data for Pull-down for 43°C, II
94.294.294.294.2Approx. moil at Compressor [g]
94.394.394.394.3Total Mass in the Compressor [g]
0.820.820.820.82ρρρρmix at Compressor [g/mL]
0.10.10.10.1Compressor Solubility [mass %]
90.789.693.192.0Inside Compressor Temperature [°°°°C]
0.10.10.10.1Approx. mR600a at Compressor [g]
115111511511151Liquid Level inside Compressor [mL]
59.554.057.664.5Suction Pressure [kPa]
Defrost period starts
189 min after system on
149 min after system on
109 min after system on
Point Description
Point 8Point 7Point 6Point 5Measurement
Table 41: Accumulator Mass Balance Data for Pull-down for 43°C, I
27.224.523.114.0Total Mass in the Accumulator [g]
121.5117.7117.4126.0Total Mass in both Acc. And Comp. [g]
17.517.721.711.4Approx. moil at Accumulator [g]
0.680.700.770.70ρρρρmix at Accumulator [g/mL]
-4.39.525.044.4Ave. Accumulator Temperature [°°°°C]
35.527.66.018.5Accumulator Solubility [mass %]
9.76.81.42.6Approx. mR600a at Accumulator [g]
401353020Liquid Level inside Accumulator [mL]
76.9112.590.9273.6Suction Pressure [kPa]
69 min after system on
Peak Power Point
15 min after system on
System turned on
Point Description
Point 4Point 3Point 2Point 1Measurement
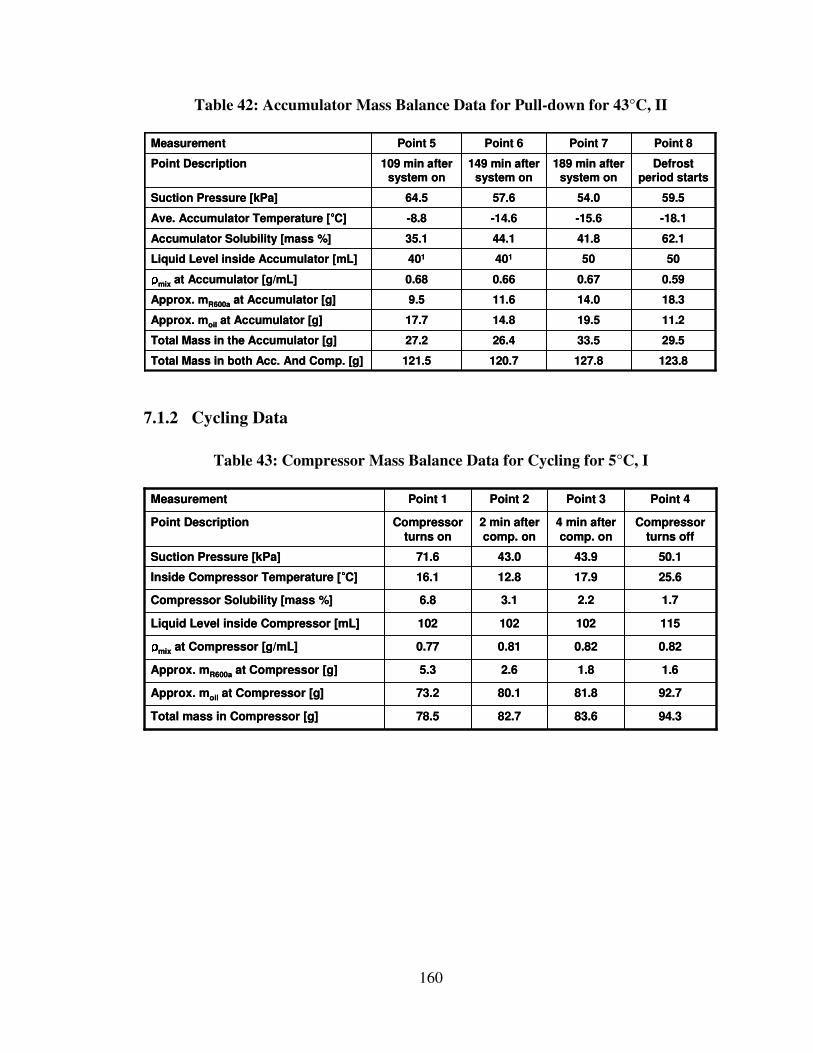
160
Table 42: Accumulator Mass Balance Data for Pull-down for 43°C, II
29.533.526.427.2Total Mass in the Accumulator [g]
123.8127.8120.7121.5Total Mass in both Acc. And Comp. [g]
11.219.514.817.7Approx. moil at Accumulator [g]
0.590.670.660.68ρρρρmix at Accumulator [g/mL]
-18.1-15.6-14.6-8.8Ave. Accumulator Temperature [°°°°C]
62.141.844.135.1Accumulator Solubility [mass %]
18.314.011.69.5Approx. mR600a at Accumulator [g]
5050401401Liquid Level inside Accumulator [mL]
59.554.057.664.5Suction Pressure [kPa]
Defrost period starts
189 min after system on
149 min after system on
109 min after system on
Point Description
Point 8Point 7Point 6Point 5Measurement
7.1.2 Cycling Data
Table 43: Compressor Mass Balance Data for Cycling for 5°C, I
92.781.880.173.2Approx. moil at Compressor [g]
94.383.682.778.5Total mass in Compressor [g]
0.820.820.810.77ρρρρmix at Compressor [g/mL]
1.72.23.16.8Compressor Solubility [mass %]
25.617.912.816.1Inside Compressor Temperature [°°°°C]
1.61.82.65.3Approx. mR600a at Compressor [g]
115102102102Liquid Level inside Compressor [mL]
50.143.943.071.6Suction Pressure [kPa]
Compressor
turns off
4 min after
comp. on
2 min after
comp. on
Compressor
turns on
Point Description
Point 4Point 3Point 2Point 1Measurement
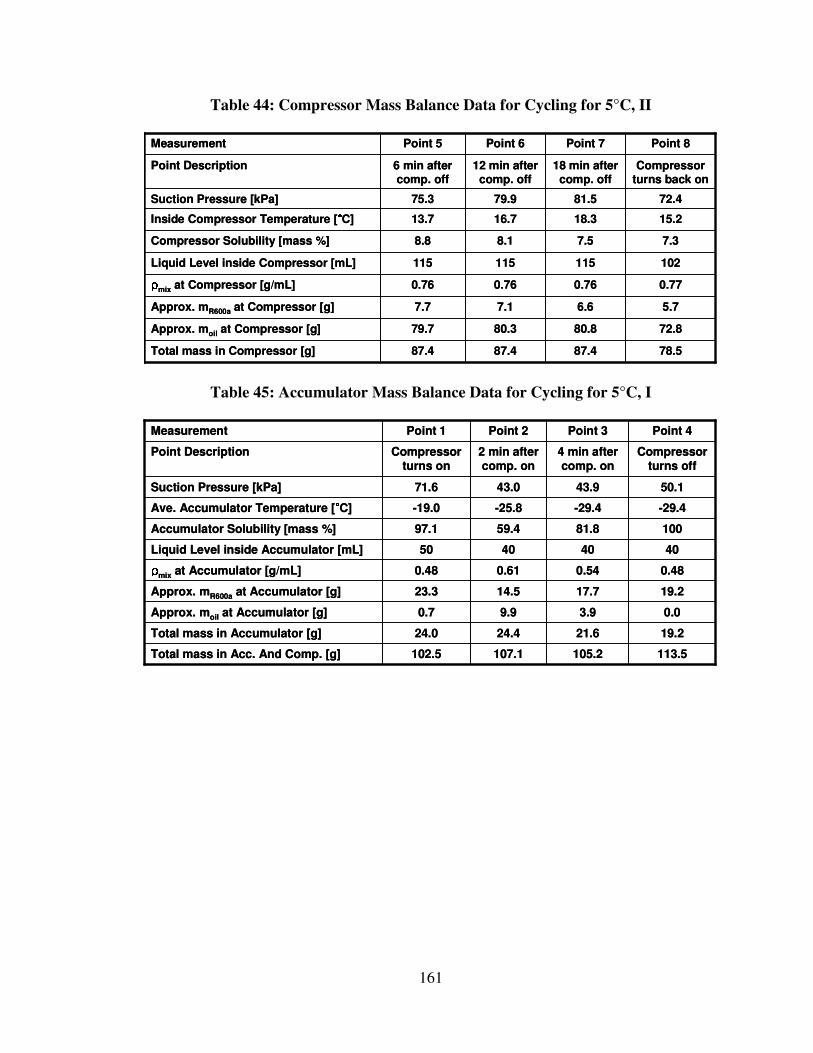
161
Table 44: Compressor Mass Balance Data for Cycling for 5°C, II
72.880.880.379.7Approx. moil at Compressor [g]
78.587.487.487.4Total mass in Compressor [g]
0.770.760.760.76ρρρρmix at Compressor [g/mL]
7.37.58.18.8Compressor Solubility [mass %]
15.218.316.713.7Inside Compressor Temperature [°°°°C]
5.76.67.17.7Approx. mR600a at Compressor [g]
102115115115Liquid Level inside Compressor [mL]
72.481.579.975.3Suction Pressure [kPa]
Compressor turns back on
18 min after comp. off
12 min after comp. off
6 min after comp. off
Point Description
Point 8Point 7Point 6Point 5Measurement
Table 45: Accumulator Mass Balance Data for Cycling for 5°C, I
0.03.99.90.7Approx. moil at Accumulator [g]
19.221.624.424.0Total mass in Accumulator [g]
0.480.540.610.48ρρρρmix at Accumulator [g/mL]
113.5105.2107.1102.5Total mass in Acc. And Comp. [g]
-29.4-29.4-25.8-19.0Ave. Accumulator Temperature [°°°°C]
10081.859.497.1Accumulator Solubility [mass %]
19.217.714.523.3Approx. mR600a at Accumulator [g]
40404050Liquid Level inside Accumulator [mL]
50.143.943.071.6Suction Pressure [kPa]
Compressor turns off
4 min after comp. on
2 min after comp. on
Compressor turns on
Point Description
Point 4Point 3Point 2Point 1Measurement
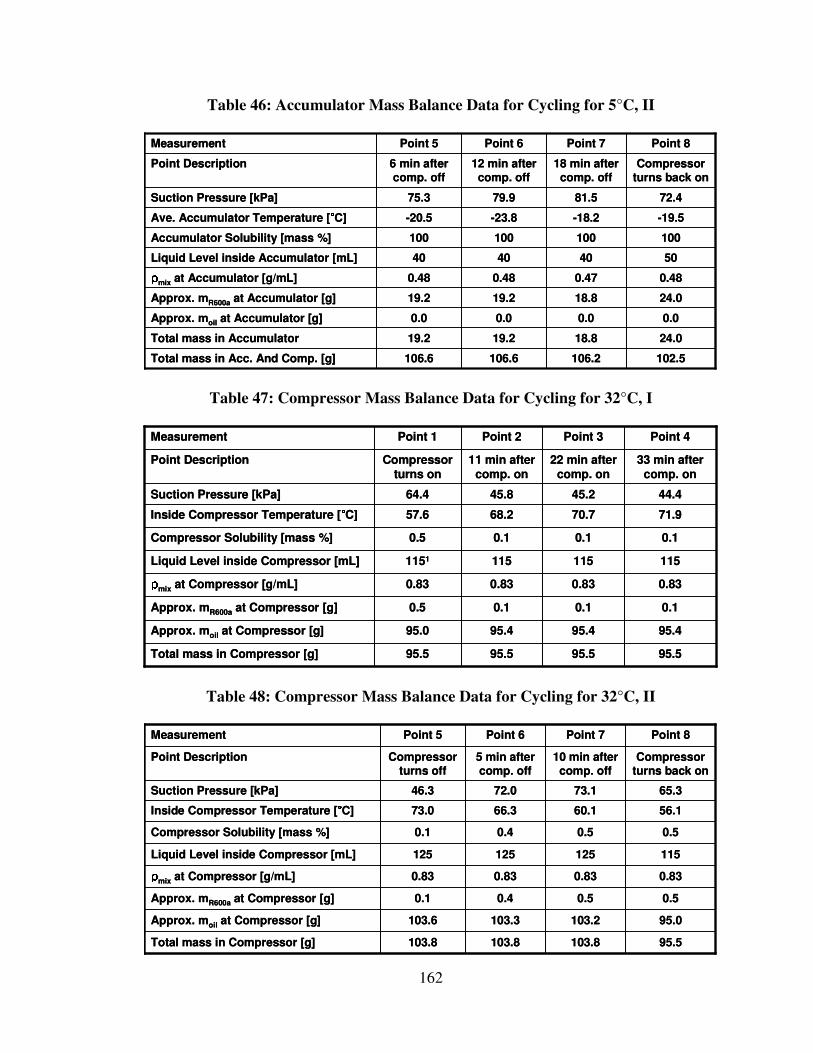
162
Table 46: Accumulator Mass Balance Data for Cycling for 5°C, II
0.00.00.00.0Approx. moil at Accumulator [g]
24.018.819.219.2Total mass in Accumulator
0.480.470.480.48ρρρρmix at Accumulator [g/mL]
102.5106.2106.6106.6Total mass in Acc. And Comp. [g]
-19.5-18.2-23.8-20.5Ave. Accumulator Temperature [°°°°C]
100100100100Accumulator Solubility [mass %]
24.018.819.219.2Approx. mR600a at Accumulator [g]
50404040Liquid Level inside Accumulator [mL]
72.481.579.975.3Suction Pressure [kPa]
Compressor turns back on
18 min after comp. off
12 min after comp. off
6 min after comp. off
Point Description
Point 8Point 7Point 6Point 5Measurement
Table 47: Compressor Mass Balance Data for Cycling for 32°C, I
95.495.495.495.0Approx. moil at Compressor [g]
95.595.595.595.5Total mass in Compressor [g]
0.830.830.830.83ρρρρmix at Compressor [g/mL]
0.10.10.10.5Compressor Solubility [mass %]
71.970.768.257.6Inside Compressor Temperature [°°°°C]
0.10.10.10.5Approx. mR600a at Compressor [g]
1151151151151Liquid Level inside Compressor [mL]
44.445.245.864.4Suction Pressure [kPa]
33 min after
comp. on
22 min after
comp. on
11 min after
comp. on
Compressor
turns on
Point Description
Point 4Point 3Point 2Point 1Measurement
Table 48: Compressor Mass Balance Data for Cycling for 32°C, II
95.0103.2103.3103.6Approx. moil at Compressor [g]
95.5103.8103.8103.8Total mass in Compressor [g]
0.830.830.830.83ρρρρmix at Compressor [g/mL]
0.50.50.40.1Compressor Solubility [mass %]
56.160.166.373.0Inside Compressor Temperature [°°°°C]
0.50.50.40.1Approx. mR600a at Compressor [g]
115125125125Liquid Level inside Compressor [mL]
65.373.172.046.3Suction Pressure [kPa]
Compressor turns back on
10 min after comp. off
5 min after comp. off
Compressor turns off
Point Description
Point 8Point 7Point 6Point 5Measurement
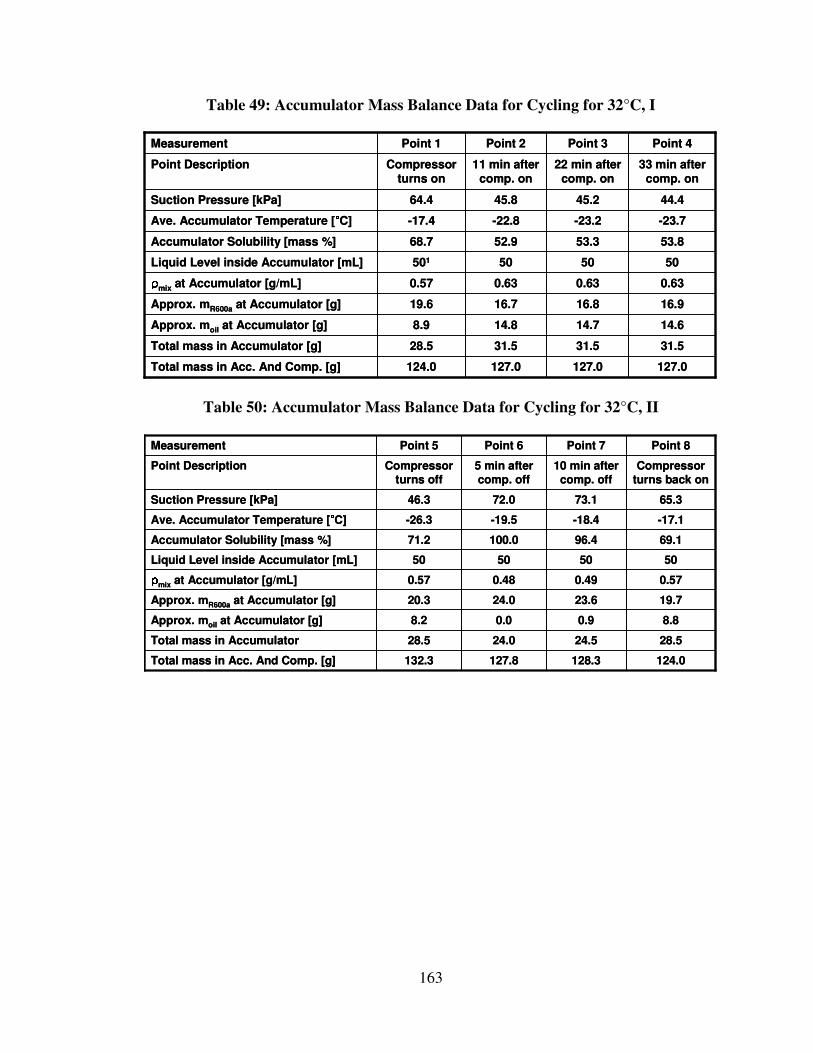
163
Table 49: Accumulator Mass Balance Data for Cycling for 32°C, I
14.614.714.88.9Approx. moil at Accumulator [g]
31.531.531.528.5Total mass in Accumulator [g]
0.630.630.630.57ρρρρmix at Accumulator [g/mL]
127.0127.0127.0124.0Total mass in Acc. And Comp. [g]
-23.7-23.2-22.8-17.4Ave. Accumulator Temperature [°°°°C]
53.853.352.968.7Accumulator Solubility [mass %]
16.916.816.719.6Approx. mR600a at Accumulator [g]
505050501Liquid Level inside Accumulator [mL]
44.445.245.864.4Suction Pressure [kPa]
33 min after comp. on
22 min after comp. on
11 min after comp. on
Compressor turns on
Point Description
Point 4Point 3Point 2Point 1Measurement
Table 50: Accumulator Mass Balance Data for Cycling for 32°C, II
8.80.90.08.2Approx. moil at Accumulator [g]
28.524.524.028.5Total mass in Accumulator
0.570.490.480.57ρρρρmix at Accumulator [g/mL]
124.0128.3127.8132.3Total mass in Acc. And Comp. [g]
-17.1-18.4-19.5-26.3Ave. Accumulator Temperature [°°°°C]
69.196.4100.071.2Accumulator Solubility [mass %]
19.723.624.020.3Approx. mR600a at Accumulator [g]
50505050Liquid Level inside Accumulator [mL]
65.373.172.046.3Suction Pressure [kPa]
Compressor turns back on
10 min after comp. off
5 min after comp. off
Compressor turns off
Point Description
Point 8Point 7Point 6Point 5Measurement
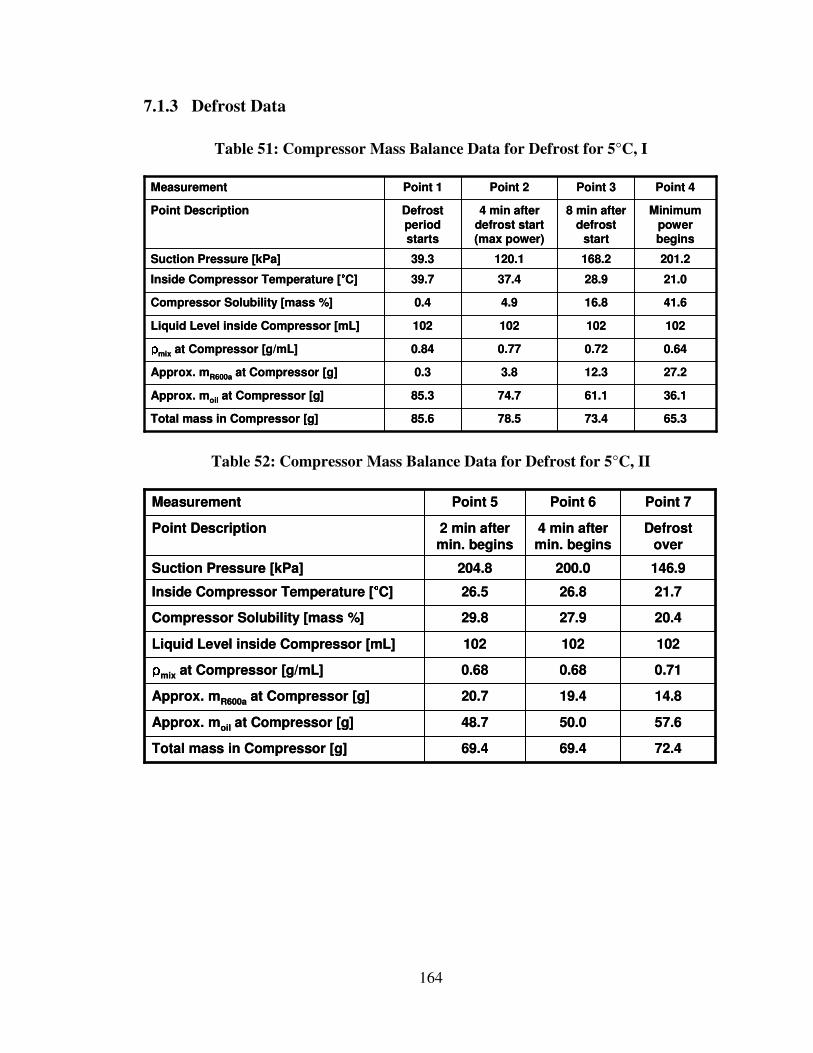
164
7.1.3 Defrost Data
Table 51: Compressor Mass Balance Data for Defrost for 5°C, I
36.161.174.785.3Approx. moil at Compressor [g]
65.373.478.585.6Total mass in Compressor [g]
0.640.720.770.84ρρρρmix at Compressor [g/mL]
41.616.84.90.4Compressor Solubility [mass %]
21.028.937.439.7Inside Compressor Temperature [°°°°C]
27.212.33.80.3Approx. mR600a at Compressor [g]
102102102102Liquid Level inside Compressor [mL]
201.2168.2120.139.3Suction Pressure [kPa]
Minimum
power begins
8 min after
defrost start
4 min after
defrost start (max power)
Defrost
period starts
Point Description
Point 4Point 3Point 2Point 1Measurement
Table 52: Compressor Mass Balance Data for Defrost for 5°C, II
57.650.048.7Approx. moil at Compressor [g]
72.469.469.4Total mass in Compressor [g]
0.710.680.68ρρρρmix at Compressor [g/mL]
20.427.929.8Compressor Solubility [mass %]
21.726.826.5Inside Compressor Temperature [°°°°C]
14.819.420.7Approx. mR600a at Compressor [g]
102102102Liquid Level inside Compressor [mL]
146.9200.0204.8Suction Pressure [kPa]
Defrost over
4 min after min. begins
2 min after min. begins
Point Description
Point 7Point 6Point 5Measurement
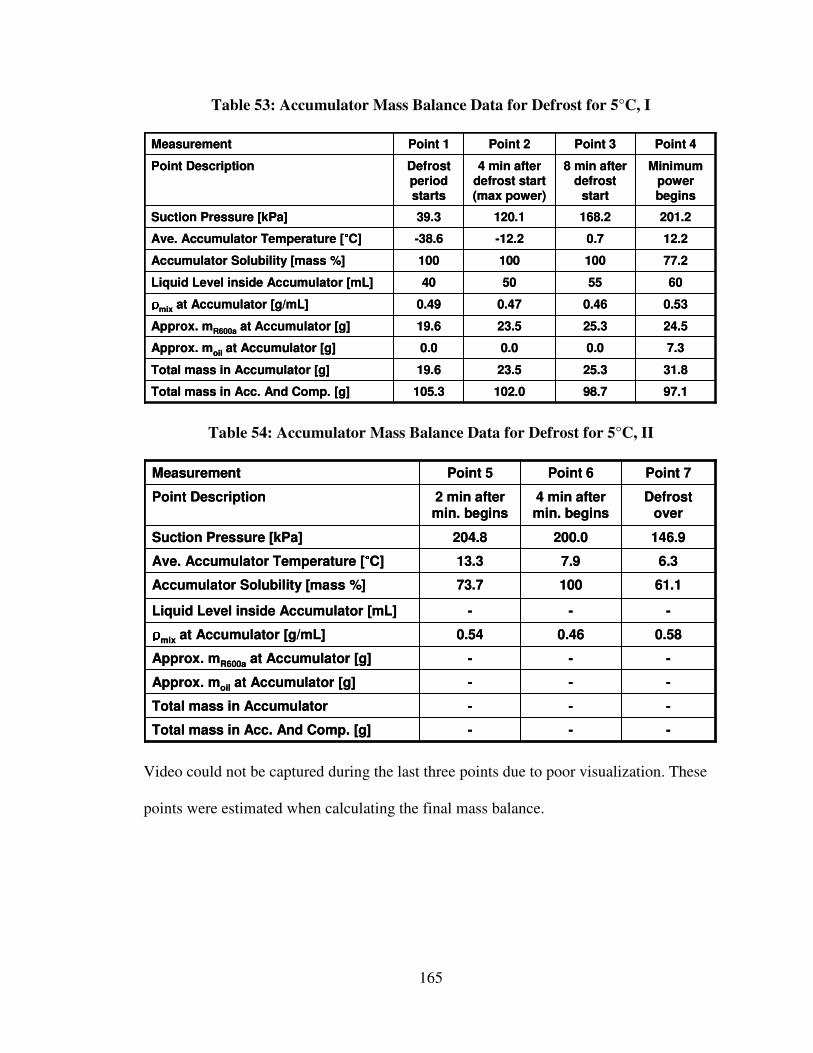
165
Table 53: Accumulator Mass Balance Data for Defrost for 5°C, I
7.30.00.00.0Approx. moil at Accumulator [g]
31.825.323.519.6Total mass in Accumulator [g]
0.530.460.470.49ρρρρmix at Accumulator [g/mL]
97.198.7102.0105.3Total mass in Acc. And Comp. [g]
12.20.7-12.2-38.6Ave. Accumulator Temperature [°°°°C]
77.2100100100Accumulator Solubility [mass %]
24.525.323.519.6Approx. mR600a at Accumulator [g]
60555040Liquid Level inside Accumulator [mL]
201.2168.2120.139.3Suction Pressure [kPa]
Minimum power begins
8 min after defrost
start
4 min after defrost start (max power)
Defrost period starts
Point Description
Point 4Point 3Point 2Point 1Measurement
Table 54: Accumulator Mass Balance Data for Defrost for 5°C, II
---Approx. moil at Accumulator [g]
---Total mass in Accumulator
0.580.460.54ρρρρmix at Accumulator [g/mL]
---Total mass in Acc. And Comp. [g]
6.37.913.3Ave. Accumulator Temperature [°°°°C]
61.110073.7Accumulator Solubility [mass %]
---Approx. mR600a at Accumulator [g]
---Liquid Level inside Accumulator [mL]
146.9200.0204.8Suction Pressure [kPa]
Defrost over
4 min after min. begins
2 min after min. begins
Point Description
Point 7Point 6Point 5Measurement
Video could not be captured during the last three points due to poor visualization. These
points were estimated when calculating the final mass balance.
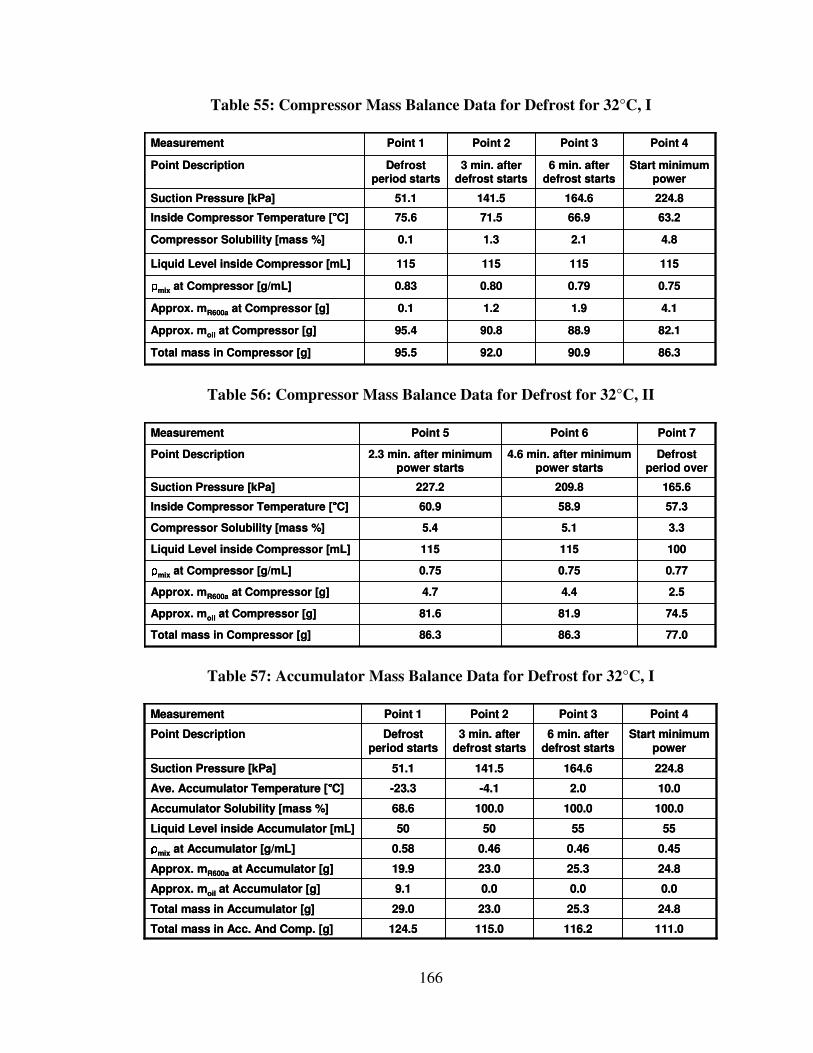
166
Table 55: Compressor Mass Balance Data for Defrost for 32°C, I
82.188.990.895.4Approx. moil at Compressor [g]
86.390.992.095.5Total mass in Compressor [g]
0.750.790.800.83ρρρρmix at Compressor [g/mL]
4.82.11.30.1Compressor Solubility [mass %]
63.266.971.575.6Inside Compressor Temperature [°°°°C]
4.11.91.20.1Approx. mR600a at Compressor [g]
115115115115Liquid Level inside Compressor [mL]
224.8164.6141.551.1Suction Pressure [kPa]
Start minimum power
6 min. after defrost starts
3 min. after defrost starts
Defrost period starts
Point Description
Point 4Point 3Point 2Point 1Measurement
Table 56: Compressor Mass Balance Data for Defrost for 32°C, II
74.581.981.6Approx. moil at Compressor [g]
77.086.386.3Total mass in Compressor [g]
0.770.750.75ρρρρmix at Compressor [g/mL]
3.35.15.4Compressor Solubility [mass %]
57.358.960.9Inside Compressor Temperature [°°°°C]
2.54.44.7Approx. mR600a at Compressor [g]
100115115Liquid Level inside Compressor [mL]
165.6209.8227.2Suction Pressure [kPa]
Defrost period over
4.6 min. after minimum power starts
2.3 min. after minimum power starts
Point Description
Point 7Point 6Point 5Measurement
Table 57: Accumulator Mass Balance Data for Defrost for 32°C, I
0.00.00.09.1Approx. moil at Accumulator [g]
24.825.323.029.0Total mass in Accumulator [g]
0.450.460.460.58ρρρρmix at Accumulator [g/mL]
111.0116.2115.0124.5Total mass in Acc. And Comp. [g]
10.02.0-4.1-23.3Ave. Accumulator Temperature [°°°°C]
100.0100.0100.068.6Accumulator Solubility [mass %]
24.825.323.019.9Approx. mR600a at Accumulator [g]
55555050Liquid Level inside Accumulator [mL]
224.8164.6141.551.1Suction Pressure [kPa]
Start minimum power
6 min. after defrost starts
3 min. after defrost starts
Defrost period starts
Point Description
Point 4Point 3Point 2Point 1Measurement
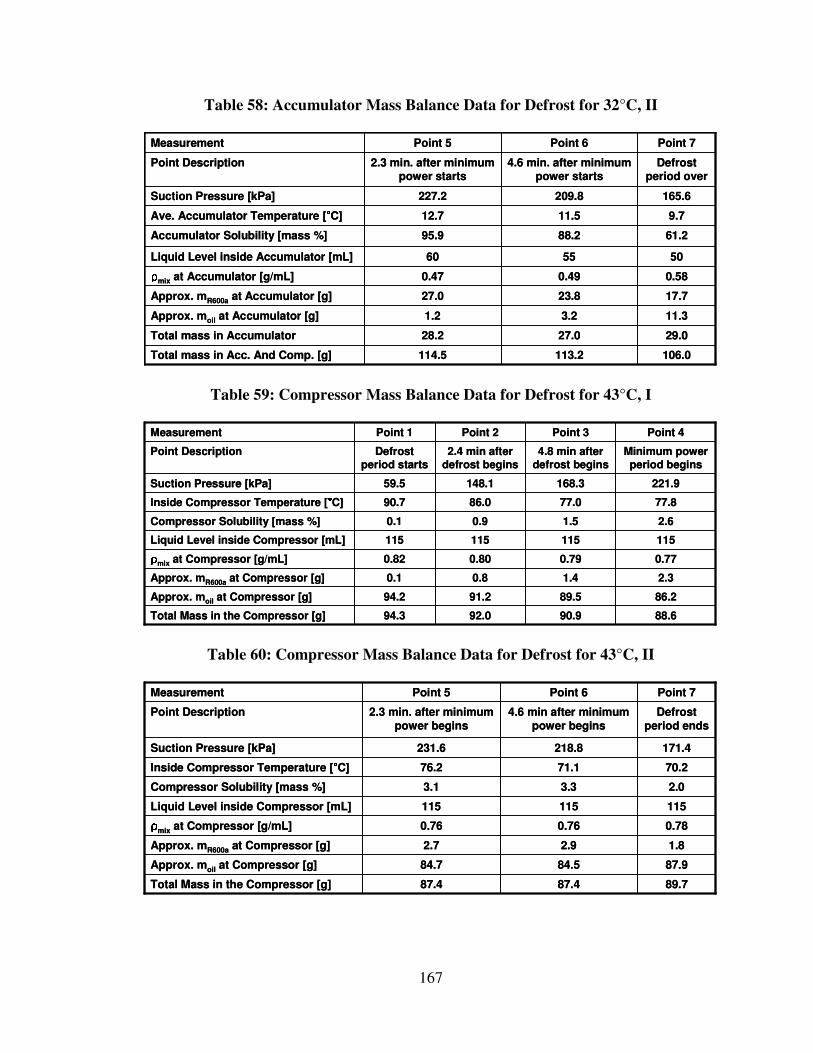
167
Table 58: Accumulator Mass Balance Data for Defrost for 32°C, II
11.33.21.2Approx. moil at Accumulator [g]
29.027.028.2Total mass in Accumulator
0.580.490.47ρρρρmix at Accumulator [g/mL]
106.0113.2114.5Total mass in Acc. And Comp. [g]
9.711.512.7Ave. Accumulator Temperature [°°°°C]
61.288.295.9Accumulator Solubility [mass %]
17.723.827.0Approx. mR600a at Accumulator [g]
505560Liquid Level inside Accumulator [mL]
165.6209.8227.2Suction Pressure [kPa]
Defrost period over
4.6 min. after minimum power starts
2.3 min. after minimum power starts
Point Description
Point 7Point 6Point 5Measurement
Table 59: Compressor Mass Balance Data for Defrost for 43°C, I
86.289.591.294.2Approx. moil at Compressor [g]
88.690.992.094.3Total Mass in the Compressor [g]
0.770.790.800.82ρρρρmix at Compressor [g/mL]
2.61.50.90.1Compressor Solubility [mass %]
77.877.086.090.7Inside Compressor Temperature [°°°°C]
2.31.40.80.1Approx. mR600a at Compressor [g]
115115115115Liquid Level inside Compressor [mL]
221.9168.3148.159.5Suction Pressure [kPa]
Minimum power period begins
4.8 min after defrost begins
2.4 min after defrost begins
Defrost period starts
Point Description
Point 4Point 3Point 2Point 1Measurement
Table 60: Compressor Mass Balance Data for Defrost for 43°C, II
87.984.584.7Approx. moil at Compressor [g]
89.787.487.4Total Mass in the Compressor [g]
0.780.760.76ρρρρmix at Compressor [g/mL]
2.03.33.1Compressor Solubility [mass %]
70.271.176.2Inside Compressor Temperature [°°°°C]
1.82.92.7Approx. mR600a at Compressor [g]
115115115Liquid Level inside Compressor [mL]
171.4218.8231.6Suction Pressure [kPa]
Defrost period ends
4.6 min after minimum power begins
2.3 min. after minimum power begins
Point Description
Point 7Point 6Point 5Measurement
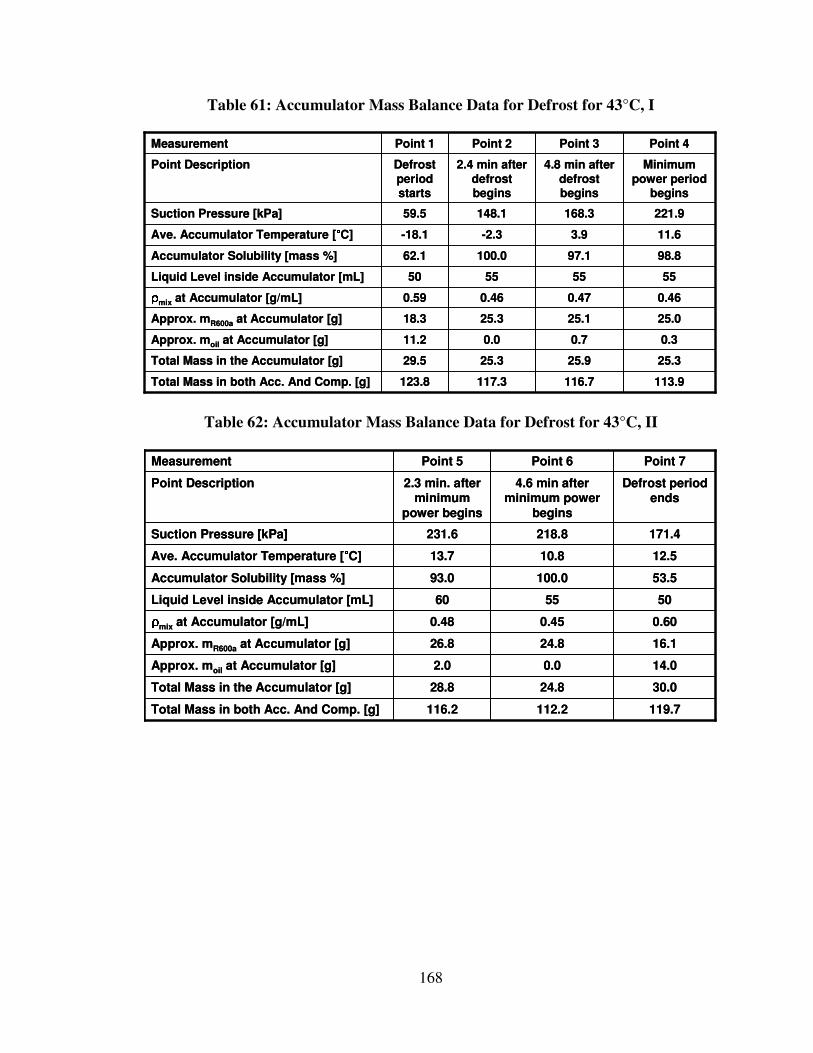
168
Table 61: Accumulator Mass Balance Data for Defrost for 43°C, I
25.325.925.329.5Total Mass in the Accumulator [g]
113.9116.7117.3123.8Total Mass in both Acc. And Comp. [g]
0.30.70.011.2Approx. moil at Accumulator [g]
0.460.470.460.59ρρρρmix at Accumulator [g/mL]
11.63.9-2.3-18.1Ave. Accumulator Temperature [°°°°C]
98.897.1100.062.1Accumulator Solubility [mass %]
25.025.125.318.3Approx. mR600a at Accumulator [g]
55555550Liquid Level inside Accumulator [mL]
221.9168.3148.159.5Suction Pressure [kPa]
Minimum power period
begins
4.8 min after defrost begins
2.4 min after defrost begins
Defrost period starts
Point Description
Point 4Point 3Point 2Point 1Measurement
Table 62: Accumulator Mass Balance Data for Defrost for 43°C, II
30.024.828.8Total Mass in the Accumulator [g]
119.7112.2116.2Total Mass in both Acc. And Comp. [g]
14.00.02.0Approx. moil at Accumulator [g]
0.600.450.48ρρρρmix at Accumulator [g/mL]
12.510.813.7Ave. Accumulator Temperature [°°°°C]
53.5100.093.0Accumulator Solubility [mass %]
16.124.826.8Approx. mR600a at Accumulator [g]
505560Liquid Level inside Accumulator [mL]
171.4218.8231.6Suction Pressure [kPa]
Defrost period ends
4.6 min after minimum power
begins
2.3 min. after minimum
power begins
Point Description
Point 7Point 6Point 5Measurement
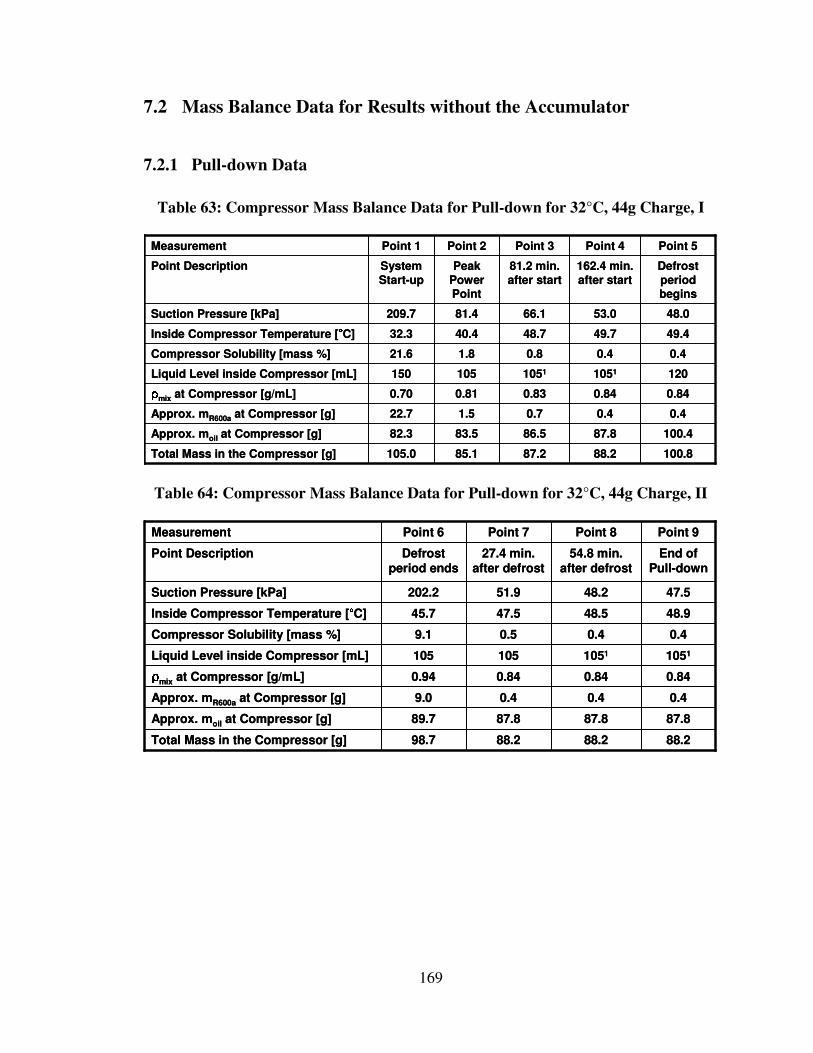
169
7.2 Mass Balance Data for Results without the Accumulator
7.2.1 Pull-down Data
Table 63: Compressor Mass Balance Data for Pull-down for 32°C, 44g Charge, I
100.4 87.8 86.5 83.5 82.3 Approx. moil at Compressor [g]
100.8 88.2 87.2 85.1 105.0 Total Mass in the Compressor [g]
0.840.840.830.810.70ρρρρmix at Compressor [g/mL]
0.40.40.81.821.6Compressor Solubility [mass %]
49.449.748.740.432.3Inside Compressor Temperature [°°°°C]
0.4 0.4 0.7 1.5 22.7 Approx. mR600a at Compressor [g]
12010511051105150Liquid Level inside Compressor [mL]
48.053.066.181.4209.7Suction Pressure [kPa]
Defrost
period begins
162.4 min.
after start
81.2 min.
after start
Peak
Power Point
System
Start-up
Point Description
Point 5Point 4Point 3Point 2Point 1Measurement
Table 64: Compressor Mass Balance Data for Pull-down for 32°C, 44g Charge, II
87.8 87.8 87.8 89.7 Approx. moil at Compressor [g]
88.2 88.2 88.2 98.7 Total Mass in the Compressor [g]
0.840.840.840.94ρρρρmix at Compressor [g/mL]
0.40.40.59.1Compressor Solubility [mass %]
48.948.547.545.7Inside Compressor Temperature [°°°°C]
0.4 0.4 0.4 9.0 Approx. mR600a at Compressor [g]
10511051105105Liquid Level inside Compressor [mL]
47.548.251.9202.2Suction Pressure [kPa]
End of Pull-down
54.8 min. after defrost
27.4 min. after defrost
Defrost period ends
Point Description
Point 9Point 8Point 7Point 6Measurement
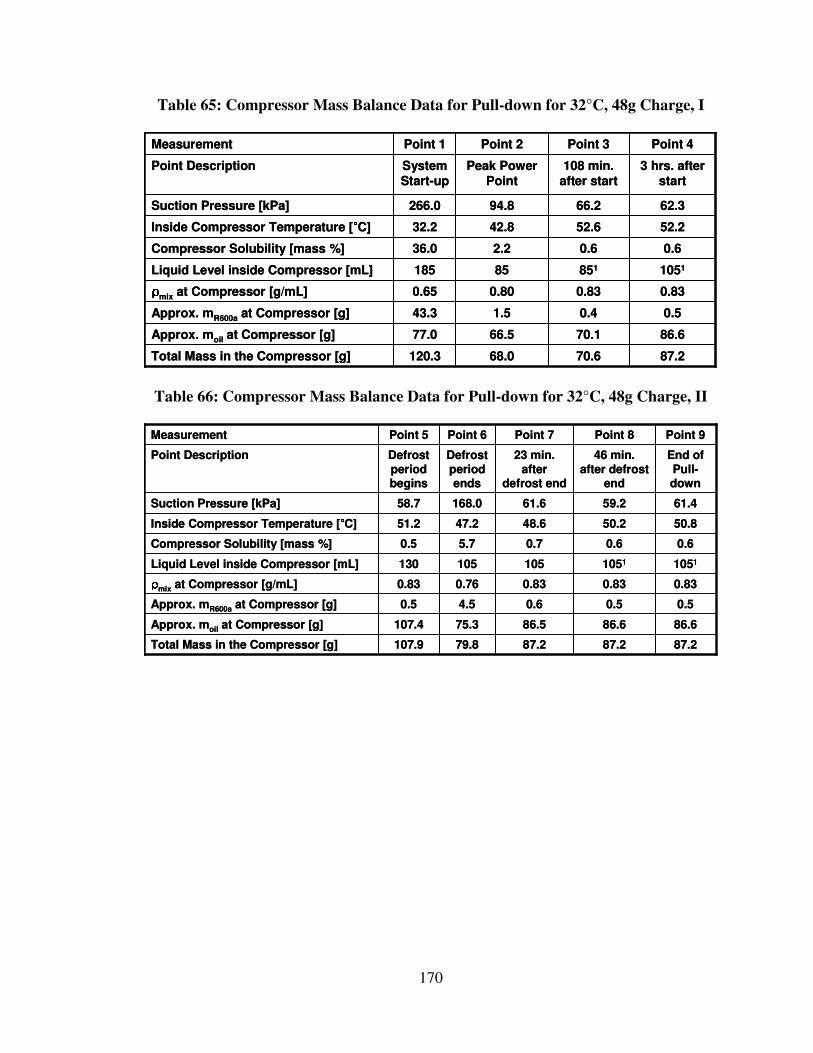
170
Table 65: Compressor Mass Balance Data for Pull-down for 32°C, 48g Charge, I
86.6 70.1 66.5 77.0 Approx. moil at Compressor [g]
87.2 70.6 68.0 120.3 Total Mass in the Compressor [g]
0.830.830.800.65ρρρρmix at Compressor [g/mL]
0.60.62.236.0Compressor Solubility [mass %]
52.252.642.832.2Inside Compressor Temperature [°°°°C]
0.5 0.4 1.5 43.3 Approx. mR600a at Compressor [g]
105185185185Liquid Level inside Compressor [mL]
62.366.294.8266.0Suction Pressure [kPa]
3 hrs. after start
108 min. after start
Peak Power Point
System Start-up
Point Description
Point 4Point 3Point 2Point 1Measurement
Table 66: Compressor Mass Balance Data for Pull-down for 32°C, 48g Charge, II
87.2
86.5
0.6
0.83
105
0.7
48.6
61.6
23 min. after
defrost end
Point 7
79.8
75.3
4.5
0.76
105
5.7
47.2
168.0
Defrost period ends
Point 6
87.2
86.6
0.5
0.83
1051
0.6
50.2
59.2
46 min. after defrost
end
Point 8
86.6 107.4 Approx. moil at Compressor [g]
87.2 107.9 Total Mass in the Compressor [g]
0.830.83ρρρρmix at Compressor [g/mL]
0.60.5Compressor Solubility [mass %]
50.851.2Inside Compressor Temperature [°°°°C]
0.5 0.5 Approx. mR600a at Compressor [g]
1051130Liquid Level inside Compressor [mL]
61.458.7Suction Pressure [kPa]
End of Pull-down
Defrost period begins
Point Description
Point 9Point 5Measurement
87.2
86.5
0.6
0.83
105
0.7
48.6
61.6
23 min. after
defrost end
Point 7
79.8
75.3
4.5
0.76
105
5.7
47.2
168.0
Defrost period ends
Point 6
87.2
86.6
0.5
0.83
1051
0.6
50.2
59.2
46 min. after defrost
end
Point 8
86.6 107.4 Approx. moil at Compressor [g]
87.2 107.9 Total Mass in the Compressor [g]
0.830.83ρρρρmix at Compressor [g/mL]
0.60.5Compressor Solubility [mass %]
50.851.2Inside Compressor Temperature [°°°°C]
0.5 0.5 Approx. mR600a at Compressor [g]
1051130Liquid Level inside Compressor [mL]
61.458.7Suction Pressure [kPa]
End of Pull-down
Defrost period begins
Point Description
Point 9Point 5Measurement
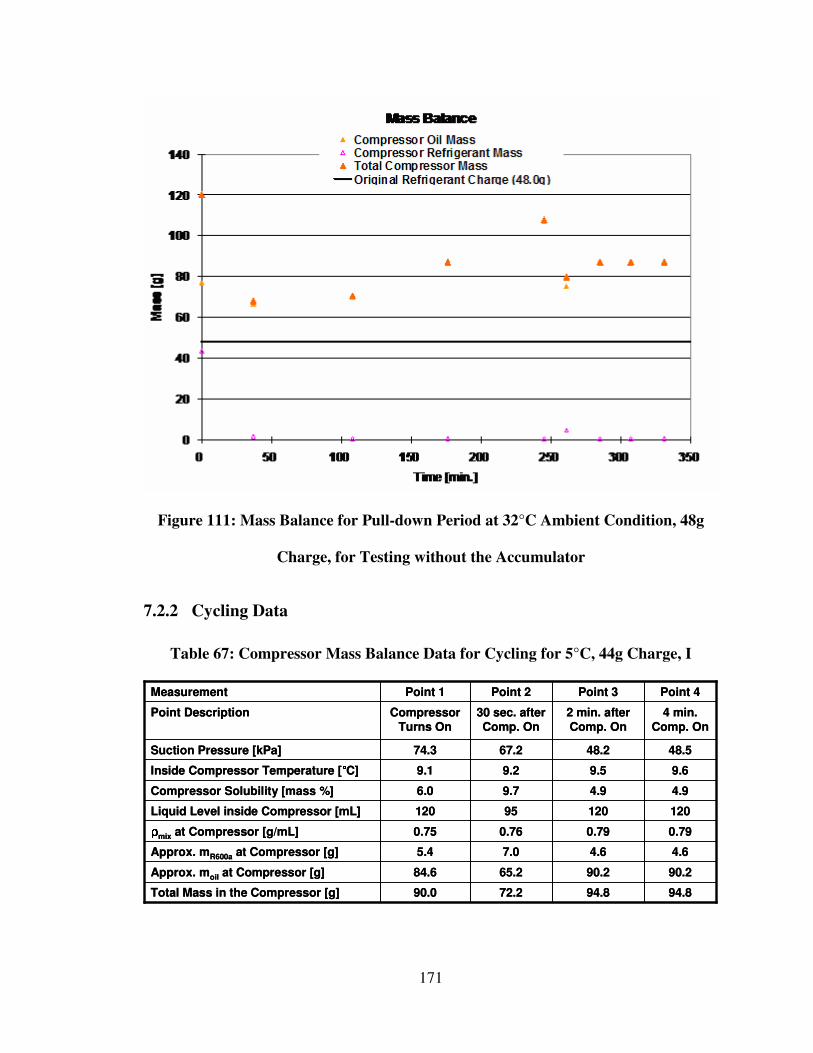
171
Figure 111: Mass Balance for Pull-down Period at 32°C Ambient Condition, 48g
Charge, for Testing without the Accumulator
7.2.2 Cycling Data
Table 67: Compressor Mass Balance Data for Cycling for 5°C, 44g Charge, I
90.2 90.2 65.2 84.6 Approx. moil at Compressor [g]
94.8 94.8 72.2 90.0 Total Mass in the Compressor [g]
0.790.790.760.75ρρρρmix at Compressor [g/mL]
4.94.99.76.0Compressor Solubility [mass %]
9.69.59.29.1Inside Compressor Temperature [°°°°C]
4.6 4.6 7.0 5.4 Approx. mR600a at Compressor [g]
12012095120Liquid Level inside Compressor [mL]
48.548.267.274.3Suction Pressure [kPa]
4 min.
Comp. On
2 min. after
Comp. On
30 sec. after
Comp. On
Compressor
Turns On
Point Description
Point 4Point 3Point 2Point 1Measurement
172
Table 68: Compressor Mass Balance Data for Cycling for 5°C, 44g Charge, II
92.5
79.5
13.0
0.74
1251
14.1
9.4
81.0
15 min. after Comp. Off
Point 7
92.5
80.9
11.6
0.74
125
12.5
10.1
78.4
7.5 min. after Comp. Off
Point 6
80.0 87.6 Approx. moil at Compressor [g]
92.5 93.6 Total Mass in the Compressor [g]
0.740.78ρρρρmix at Compressor [g/mL]
13.56.4Compressor Solubility [mass %]
9.49.6Inside Compressor Temperature [°°°°C]
12.5 6.0 Approx. mR600a at Compressor [g]
1251120Liquid Level inside Compressor [mL]
79.555.5Suction Pressure [kPa]
Compressor Turns Back On
Compressor Turns Off
Point Description
Point 8Point 5Measurement
92.5
79.5
13.0
0.74
1251
14.1
9.4
81.0
15 min. after Comp. Off
Point 7
92.5
80.9
11.6
0.74
125
12.5
10.1
78.4
7.5 min. after Comp. Off
Point 6
80.0 87.6 Approx. moil at Compressor [g]
92.5 93.6 Total Mass in the Compressor [g]
0.740.78ρρρρmix at Compressor [g/mL]
13.56.4Compressor Solubility [mass %]
9.49.6Inside Compressor Temperature [°°°°C]
12.5 6.0 Approx. mR600a at Compressor [g]
1251120Liquid Level inside Compressor [mL]
79.555.5Suction Pressure [kPa]
Compressor Turns Back On
Compressor Turns Off
Point Description
Point 8Point 5Measurement
Table 69: Compressor Mass Balance Data for Cycling for 5°C, 48g Charge, I
78.577.369.779.1Approx. moil at Compressor [g]
83.081.978.890.0Total Mass in the Compressor [g]
0.790.780.750.75ρρρρmix at Compressor [g/mL]
5.45.611.612.1Compressor Solubility [mass %]
8.98.68.98.7Inside Compressor Temperature [°°°°C]
4.54.69.110.9prox. mR600a at Compressor [g]
105105105120Liquid Level inside Compressor [mL]
49.850.972.573.5Suction Pressure [kPa]
3.5 min. Comp. On
1.5 min. after Comp. On
30 sec. after Comp. On
Compressor Turns On
Point Description
Point 4Point 3Point 2Point 1Measurement
Table 70: Compressor Mass Balance Data for Cycling for 5°C, 48g Charge, II
96.2
82.1
14.1
0.74
1301
14.7
8.9
81.4
16 min. after Comp. Off
Point 7
96.2
83.5
12.7
0.74
130
13.2
9.3
78.5
8 min. after Comp. Off
Point 6
85.575.2Approx. moil at Compressor [g]
97.580.9Total Mass in the Compressor [g]
0.750.77ρρρρmix at Compressor [g/mL]
12.37.1Compressor Solubility [mass %]
8.68.9Inside Compressor Temperature [°°°°C]
12.05.7Approx. mR600a at Compressor [g]
1301105Liquid Level inside Compressor [mL]
73.956.9Suction Pressure [kPa]
Compressor Turns Back On
Compressor Turns Off
Point Description
Point 8Point 5Measurement
96.2
82.1
14.1
0.74
1301
14.7
8.9
81.4
16 min. after Comp. Off
Point 7
96.2
83.5
12.7
0.74
130
13.2
9.3
78.5
8 min. after Comp. Off
Point 6
85.575.2Approx. moil at Compressor [g]
97.580.9Total Mass in the Compressor [g]
0.750.77ρρρρmix at Compressor [g/mL]
12.37.1Compressor Solubility [mass %]
8.68.9Inside Compressor Temperature [°°°°C]
12.05.7Approx. mR600a at Compressor [g]
1301105Liquid Level inside Compressor [mL]
73.956.9Suction Pressure [kPa]
Compressor Turns Back On
Compressor Turns Off
Point Description
Point 8Point 5Measurement
173
Figure 112: Mass Balance for Cycling Period at 5°C Ambient Condition, 48g
Charge, for Testing without the Accumulator
Table 71: Compressor Mass Balance Data for Cycling for 5°C, 52g Charge, I
92.4 92.3 66.7 79.9 Approx. moil at Compressor [g]
96.0 96.0 77.7 94.9 Total Mass in the Compressor [g]
0.800.800.740.73ρρρρmix at Compressor [g/mL]
3.73.914.215.8Compressor Solubility [mass %]
10.09.910.010.4Inside Compressor Temperature [°°°°C]
3.6 3.7 11.0 15.0 Approx. mR600a at Compressor [g]
120120105130Liquid Level inside Compressor [mL]
42.643.883.088.9Suction Pressure [kPa]
4.6 min. after Comp. On
2.3 min. after Comp. On
30 sec. after Comp. On
Compressor Turns On
Point Description
Point 4Point 3Point 2Point 1Measurement
174
Table 72: Compressor Mass Balance Data for Cycling for 5°C, 52g Charge, II
82.7 78.3 73.7 92.4 Approx. moil at Compressor [g]
96.2 94.9 87.6 96.0 Total Mass in the Compressor [g]
0.740.730.730.80ρρρρmix at Compressor [g/mL]
14.017.515.93.7Compressor Solubility [mass %]
9.810.010.79.9Inside Compressor Temperature [°°°°C]
13.5 16.6 13.9 3.6 Approx. mR600a at Compressor [g]
130130120120Liquid Level inside Compressor [mL]
82.292.090.142.5Suction Pressure [kPa]
Compressor Turns On
14.6 min. after Comp. Off
7.3 min. after Comp. Off
Compressor Turns Off
Point Description
Point 8Point 7Point 6Point 5Measurement
Figure 113: Mass Balance for Cycling Period at 5°C Ambient Condition, 52g
Charge, for Testing without the Accumulator
175
Table 73: Compressor Mass Balance Data for Cycling for 32°C, 44g Charge, I
85.2 85.2 97.4 100.4 Approx. moil at Compressor [g]
86.1 86.1 98.4 100.8 Total Mass in the Compressor [g]
0.820.820.820.84ρρρρmix at Compressor [g/mL]
1.11.11.00.4Compressor Solubility [mass %]
45.145.246.747.2Inside Compressor Temperature [°°°°C]
0.9 0.9 1.0 0.4 Approx. mR600a at Compressor [g]
105105120120Liquid Level inside Compressor [mL]
70.972.370.847.7Suction Pressure [kPa]
10 sec. after Comp. On
Compressor Turns On
7 min. after Comp. Off
Compressor Turns Off
Point Description
Point 4Point 3Point 2Point 1Measurement
Table 74: Compressor Mass Balance Data for Cycling for 32°C, 44g Charge, II
87.8 87.8 87.8 Approx. moil at Compressor [g]
88.2 88.2 88.2 Total Mass in the Compressor [g]
0.840.840.84ρρρρmix at Compressor [g/mL]
0.50.40.5Compressor Solubility [mass %]
47.246.345.0Inside Compressor Temperature [°°°°C]
0.4 0.4 0.4 Approx. mR600a at Compressor [g]
105105105Liquid Level inside Compressor [mL]
52.845.547.0Suction Pressure [kPa]
System
Turns Off
20 min. after
Comp. On
10 min. after
Comp. On
Point Description
Point 7Point 6Point 5Measurement
Table 75: Compressor Mass Balance Data for Cycling for 32°C, 50g Charge, I
82.0 85.1 103.7 99.1 Approx. moil at Compressor [g]
84.0 86.1 105.3 99.6 Total Mass in the Compressor [g]
0.800.820.810.83ρρρρmix at Compressor [g/mL]
2.41.21.50.5Compressor Solubility [mass %]
46.046.147.848.5Inside Compressor Temperature [°°°°C]
2.0 1.0 1.6 0.5 Approx. mR600a at Compressor [g]
1051051301201Liquid Level inside Compressor [mL]
107.378.488.855.9Suction Pressure [kPa]
10 sec. after Comp. On
Compressor Turns
On
7 min. after Comp. Off
Compressor Turns Off
Point Description
Point 4Point 3Point 2Point 1Measurement
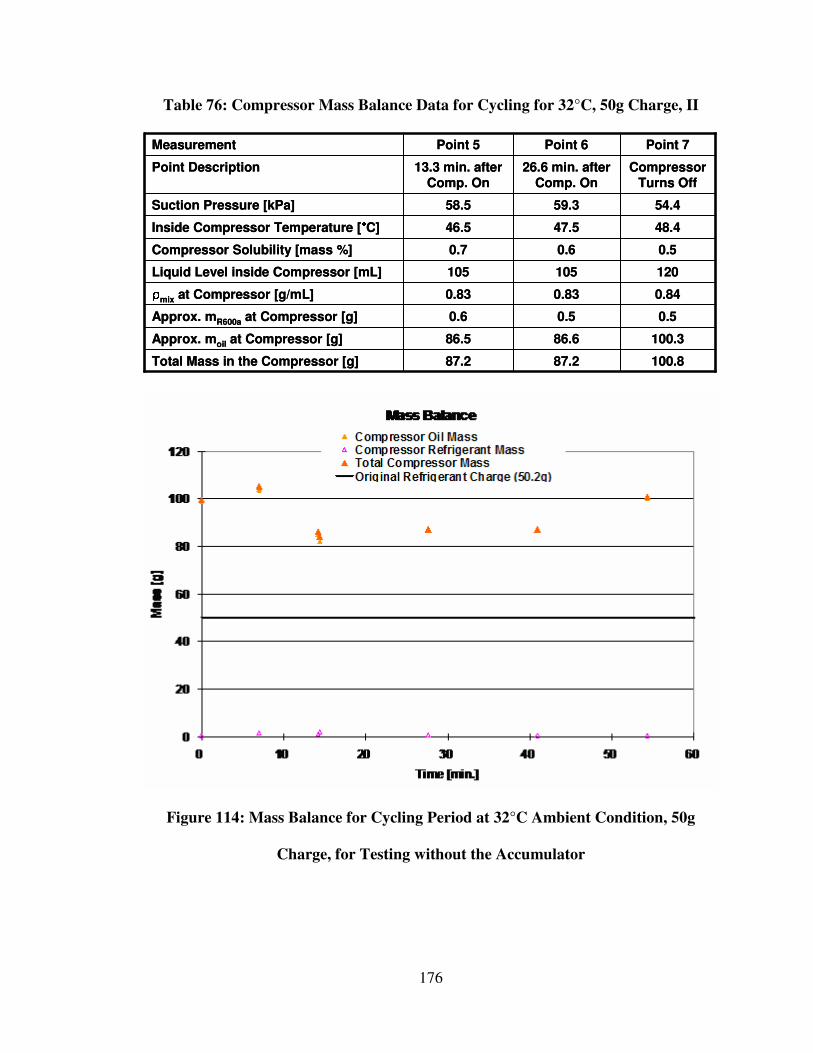
176
Table 76: Compressor Mass Balance Data for Cycling for 32°C, 50g Charge, II
100.3 86.6 86.5 Approx. moil at Compressor [g]
100.8 87.2 87.2 Total Mass in the Compressor [g]
0.840.830.83ρρρρmix at Compressor [g/mL]
0.50.60.7Compressor Solubility [mass %]
48.447.546.5Inside Compressor Temperature [°°°°C]
0.5 0.5 0.6 Approx. mR600a at Compressor [g]
120105105Liquid Level inside Compressor [mL]
54.459.358.5Suction Pressure [kPa]
Compressor Turns Off
26.6 min. after Comp. On
13.3 min. after Comp. On
Point Description
Point 7Point 6Point 5Measurement
Figure 114: Mass Balance for Cycling Period at 32°C Ambient Condition, 50g
Charge, for Testing without the Accumulator
177
7.2.3 Defrost Data
Table 77: Compressor Mass Balance Data for Defrost for 5°C, 44g Charge, I
0.4 8.1 28.6 79.7 Approx. moil at Compressor [g]
59.8 60.0 69.6 90.0 Total Mass in the Compressor [g]
0.460.500.580.75ρρρρmix at Compressor [g/mL]
99.486.558.911.5Compressor Solubility [mass %]
9.29.710.29.4Inside Compressor Temperature [°°°°C]
59.4 51.9 41.0 10.4 prox. mR600a at Compressor [g]
130120120120Liquid Level inside Compressor [mL]
205.1195.4165.773.4Suction Pressure [kPa]
Minimum Power Period
Begins
10 min. after defrost start
5 min. after defrost start
Defrost Period Begins
Point Description
Point 4Point 3Point 2Point 1Measurement
Table 78: Compressor Mass Balance Data for Defrost for 5°C, 44g Charge, II
61.1
2.7
58.4
0.47
130
95.6
8.8
198.2
4.6 min. after min. power period begins
Point 6
19.8 1.6 Approx. moil at Compressor [g]
70.2 59.8 Total Mass in the Compressor [g]
0.540.46ρρρρmix at Compressor [g/mL]
71.897.3Compressor Solubility [mass %]
8.89.3Inside Compressor Temperature [°°°°C]
50.4 58.2 Approx. mR600a at Compressor [g]
130130Liquid Level inside Compressor [mL]
173.0203.4Suction Pressure [kPa]
Defrost Period Ends
2.3 min. after Min. power period begins
Point Description
Point 7Point 5Measurement
178
Table 79: Compressor Mass Balance Data for Defrost for 32°C, 44g Charge, I
71.1 84.2 88.4 100.4 Approx. moil at Compressor [g]
85.2 90.0 92.4 100.8 Total Mass in the Compressor [g]
0.710.750.770.84ρρρρmix at Compressor [g/mL]
16.66.44.30.4Compressor Solubility [mass %]
47.648.649.049.4Inside Compressor Temperature [°°°°C]
14.1 5.8 4.0 0.4 Approx. mR600a at Compressor [g]
120120120120Liquid Level inside Compressor [mL]
282.6184.3153.648.0Suction Pressure [kPa]
Minimum Power Period Begins
6.4 min. after defrost start
3.2 min. after defrost start
Defrost period begins
Point Description
Point 4Point 3Point 2Point 1Measurement
Table 80: Compressor Mass Balance Data for Defrost for 32°C, 44g Charge, II
89.7 77.5 72.7 Approx. moil at Compressor [g]
98.7 87.6 85.2 Total Mass in the Compressor [g]
0.940.730.71ρρρρmix at Compressor [g/mL]
9.111.514.7Compressor Solubility [mass %]
45.746.447.0Inside Compressor Temperature [°°°°C]
9.0 10.1 12.5 Approx. mR600a at Compressor [g]
105120120Liquid Level inside Compressor [mL]
202.2229.5262.5Suction Pressure [kPa]
Defrost period
ends
4.6 min. after min.
power begins
2.3 min. after min.
power begins
Point Description
Point 7Point 6Point 5Measurement
Table 81: Compressor Mass Balance Data for Defrost for 32°C, 48g Charge, I
78.5 93.9 96.2 107.4 Approx. moil at Compressor [g]
92.3 98.8 100.1 107.9 Total Mass in the Compressor [g]
0.710.760.770.83ρρρρmix at Compressor [g/mL]
15.05.03.90.5Compressor Solubility [mass %]
49.250.751.351.2Inside Compressor Temperature [°°°°C]
13.8 4.9 3.9 0.5 Approx. mR600a at Compressor [g]
130130130130Liquid Level inside Compressor [mL]
279.6172.3154.858.7Suction Pressure [kPa]
Minimum Power Period
Begins
6 min. after defrost
start
3 min. after defrost
start
Defrost Period begins
Point Description
Point 4Point 3Point 2Point 1Measurement
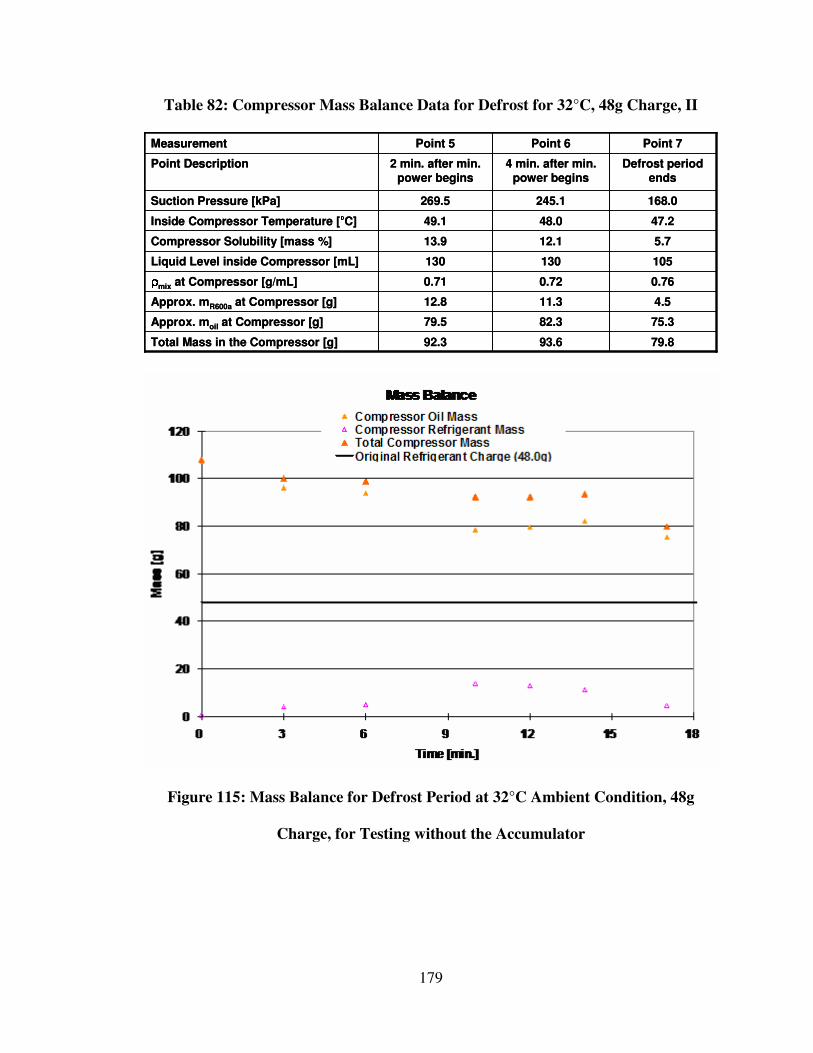
179
Table 82: Compressor Mass Balance Data for Defrost for 32°C, 48g Charge, II
79.8
75.3
4.5
0.76
105
5.7
47.2
168.0
Defrost period ends
Point 7
93.6
82.3
11.3
0.72
130
12.1
48.0
245.1
4 min. after min. power begins
Point 6
79.5 Approx. moil at Compressor [g]
92.3 Total Mass in the Compressor [g]
0.71ρρρρmix at Compressor [g/mL]
13.9Compressor Solubility [mass %]
49.1Inside Compressor Temperature [°°°°C]
12.8 Approx. mR600a at Compressor [g]
130Liquid Level inside Compressor [mL]
269.5Suction Pressure [kPa]
2 min. after min. power begins
Point Description
Point 5Measurement
Figure 115: Mass Balance for Defrost Period at 32°C Ambient Condition, 48g
Charge, for Testing without the Accumulator
180
8 References
[1] Cengel, Y.A. and Boles, M.A. Thermodynamics: An Engineering Approach. 4th ed.
2002. New York: McGraw Hill.
[2] Wikipedia, “Refrigerator”, available at http://en.wikipedia.org/wiki/Refrigerator.
[3] Coulter, W. and Bullard, C., An Experimental Analysis of Cycling Losses in
Domestic Refrigerator-Freezers, ASHRAE Trans: Symposia (PH-97-6-1) (1997) 587-596.
[4] Manwell, S. and Bergles, A., Gas-liquid Flow Patterns in Refrigerant-Oil Mixtures,
ASHRAE Trans: SL-90-1-4 (1989) 456-464.
[5] Asano, H., et al., Application of neutron radiography to a diagnosis of refrigerator,
Nuclear Instruments and Methods in Physics Research A (1996) 170-173.
[6] Inan, C., Gonul, T. and Tanes, M., X-ray Investigation of a domestic refrigerator.
Observations at 25°C ambient temperature, Int J Refrigeration 26 (2003) 205-213.
[7] Prasad, B.G. S., Effect of liquid on a reciprocating compressor, J Energy Res
Technology 124 (2002) 187- 190.
[8] Lebreton, J. et al., Real-time measurement of the oil concentration in liquid
refrigerant flowing inside a refrigeration machine, Fifteenth International Compressor
Engineering Conference at Purdue University, July 2000, pg. 319-326.
[9] Fukuta, M. et al., Real-time measurement of mixing ratio of refrigerant/refrigeration
oil mixture, Int J Refrigeration 29 (2006) 1058-1065.
[10] Fukuta, M., Yanagisawa, T., Omura, M., Ogi, Y., Mixing and separation
characteristics of isobutane with refrigeration oil, Int J Refrigeration 28 (2005) 997-1005.
181
[11] Elvassore, N., Bertucco, A. and Wahlstrom, A., A cubic equation of state with group
contributions for the calculation of vapor-liquid equilibria of mixtures of
hydrofluorocarbons and lubricant oils, Ind. Eng. Chem. Res. 38 (1999) 2110-2118.
[12] Zhelezny, P. et al., An experimental investigation and modeling of the
thermodynamic properties of isobutane-compressor oil solutions: some aspects of
experimental methodology, Int J Refrigeration 30 (2007) 433-445.
[13] ASHRAE, 2002 Refrigeration Handbook: Chapter 7: Lubricants in Refrigerant
Systems.
[14] Bjork, E. and Palm, B., Performance of a domestic refrigerator under influence of
varied expansion device capacity, refrigerant charge and ambient temperature, Int J
Refrigeration 29 (2006) 789-798.
[15] Lee, S. et al., Quantitative analysis of flow inside the accumulator of a rotary
compressor, Int J Refrigeration 26 (2003) 321-327.
[16] Samsung. “Owners Manual.” Model DA68-01281L. More information available at
http://www.samsung.com.
[18] Japan Energy Corporation. Freol S Series: Refrigeration Oil for Hydrocarbon
Refrigerant. More information available at: http://www.j-energy.co.jp/english/.
[18] UView Ultraviolet Systems. “Material Data Safety Sheet: Universal A/C Dye”
[19] Setra. Pressure Measurement Division. Model 280E/C280E. Available at
http://www.setra.com/tra/pro/p_hv_280.htm
[20] Omega Engineering, Inc. GG-T, TG-T, TT-T FF-T, PR-T Series. Available at
http://www.omega.com/pptst/GG_T_TC_WIRE.html
182
[21] Ohio Semitronics. More information available at:
https://www.ohiosemitronics.com/default.asp
[22] Vaisala. Humidity Transmitters for Fixed Installations. More information available
at: http://www.vaisala.com/instruments/products/humidity/fixed.
[23] Advanced Gas Technologies Inc., “Material Safety Data Sheet: Refrigerant R600a –
Isobutane,” 09/04, Available at
http://www.advgas.com/images/products/R600a%20_Isobutane_%20MSDS.pdf
[24] Airgas, Isobutane: Chemically Pure Product Information. Available at:
http://www.airgas.com/browse/product.aspx?Msg=RecID&recIds=257770
[25] National Institute of Standards and Technology, Reference Fluid Thermodynamic
and Transport Properties Database (REFPROP) Version 7.0, more information available
at: www.nist.gov.
[26] Systat, TableCurve® 3D, Version 4.0 for Windows, more information available at:
www.systat.com.
[27] Ohaus® Balances and Scales. Ohaus® Explorer® Pro Precision Top Loading
Balances. More information available at :
http://www.ohaus.com/products/view/overview.asp?HKEY=001001001002002&Source
=.