Embed Size (px)
Citation preview
Car park usage at
London
Undergound
09053
April 2010
Confidentiality
Please note that the copyright in the attached report is owned by TfL and the provision of information under Freedom of Information Act does not give the recipient a right to re-use the information in a way that would infringe copyright (for example, by publishing and issuing copies to the public).
Brief extracts of the material may be reproduced under the fair dealing provisions of the Copyright, Designs and Patents Act 1988 for the purposes of research for non-commercial purposes, private study, criticism, review and news reporting.
Details of the arrangements for reusing the material owned by TfL for any other purpose can be obtained by contacting us at [email protected].
Research conducted by Synovate
Contents
1 Executive Summary ...................................................................... 4
1.1 Background ........................................................................................................ 4
1.2 Importance of LU car parks to current users ...................................................... 4
1.3 Impact of removing LU car parks ....................................................................... 5
1.4 Willingness to cycle ............................................................................................ 6
1.5 Car park users with disability / impairment, and Blue Badge holders ................ 6
1.6 Car park observation .......................................................................................... 6
1.7 Conclusion .......................................................................................................... 7
2 Introduction ................................................................................... 8
2.1 Research objectives ......................................................................................... 10
2.2 Notes on reporting ............................................................................................ 11
2.2.1 Report scope ............................................................................................. 11
2.2.2 Percentages .............................................................................................. 11
2.2.3 Statistically significant differences ............................................................. 11
3 Customer Findings ...................................................................... 12
3.1 Car park use ..................................................................................................... 12
3.2 Extent of car sharing ........................................................................................ 17
3.3 Benefits to London Underground ..................................................................... 18
3.4 Journey origin and destination ......................................................................... 21
3.5 Impact of removing LU car parks ..................................................................... 24
3.6 Willingness to cycle .......................................................................................... 31
3.7 Car park users with a disability / impairment and Blue Badge holders ............ 33
4. Observations of car park usage ................................................... 34
4.1 Overview .......................................................................................................... 34
4.2 Weekday occupancy ........................................................................................ 35
4.2.1 Overall ....................................................................................................... 35
4.2.2 Mornings ................................................................................................... 36
4.2.3 Afternoons / evenings ............................................................................... 37
4.3 Weekend occupancy ........................................................................................ 37
4.3.1 Overall ....................................................................................................... 37
4.3.2 Mornings ................................................................................................... 39
4.3.3 Afternoons ................................................................................................. 39
4 Appendices ................................................................................. 40
Appendix 1 - Analysis of car park users with a disability / impairment
and Blue Badge holders ................................................................... 41
A1.1 Car park use and travel profiles .................................................................... 41
A1.2 Alternative travel / parking arrangements if car park full ............................... 43
A1.3 Alternative travel / parking arrangements if car park temporarily closed ...... 44
Appendix 2 - Research details .......................................................... 46
A2.1 Methodology ................................................................................................. 46
A2.2 Observations of car park usage .................................................................... 47
A2.3 Questionnaire design .................................................................................... 47
A2.4 Sample .......................................................................................................... 48
A2.5 Timing ........................................................................................................... 50
A2.6 Future fieldwork considerations .................................................................... 51
Appendix 3 - Car park profiling ......................................................... 52
A3.1 Profile of car parks and usage pattern .......................................................... 52
A3.2 Car park usage patterns ............................................................................... 54
A3.3 Car park user profiles ................................................................................... 56
A3.4 Borough demographics ................................................................................. 58
Appendix 4 – Survey documents ...................................................... 59
A4.1 Interviewer instructions ................................................................................. 59
A4.2 Questionnaire ............................................................................................... 61
1 Executive Summary 1.1 Background London Underground has 62 car parks with approximately 10,000 spaces. The
Underground Users’ Survey shows that 2% of LU’s customers drive to the station and
thus may use LU’s car parks as a part of their travel arrangements.1 Nearly three
quarters of customers walk to the station, reflecting the nature of LU’s system as a
‘local’ as opposed to centre to centre transport system.
TfL wants to better understand the views and use of LU’s car parks so that it can
consider their long term future in the context of London’s continuing growth as
anticipated within the Mayor’s London Plan. Clearly, current users will champion
current use patterns as this is what they pay for and enjoy so any re evaluation of use
will tend to be seen as withdrawal of a facility. New facilities will attract new users who
currently, by their nature as prospective users, are disenfranchised.
1.2 Importance of LU car parks to current users Current users feel that LU car parks are very important for their access to the London
Underground. The findings show a strong preference for the status quo, and
reluctance to use alternative modes to travel to the station, such as walking, cycling or
local buses. While there may be other options to travel to the Underground, most
users choose to drive.
The vast majority (91%) of those interviewed indicate that after parking in the LU car
parks they continue the rest of their journey by Tube, with half of them doing so at least
three days per week. As expected, there is a clear usage pattern which differs
between weekday and weekend users. The weekday users are mostly commuters
1 This figure varies from station to station. Stations with large car parks sometimes have much higher proportions of car park users among their customers.
who arrive at the car parks at morning peak times (before 10am). The weekend users
tend to park between 7am and 4pm for leisure and shopping activities. Overall,
however, commuting is the main purpose for using the LU car parks. Therefore,
parking spaces are likely to be used once, rather than several times a day.
1.3 Impact of removing LU car parks Car park users are reluctant to use alternatives such as public transport when travelling
to LU stations. People’s claimed likely actions if car parks were closed suggest that
car use would be pushed to other parts of the road network, e.g. by parking their cars
on nearby streets, or making longer car journeys to alternative parking locations.
Further separate analysis by TfL will assess how these preferences could be mitigated
by policy and other initiatives.
Most people say they find alternative parking when their LU car park is full. Car park
users claim to use LU and national rail car parks, and there is also claimed use of
parking in nearby roads. Compared with weekdays, if the car park is found to be full at
weekends, customers reported that they would seek parking on nearby roads, rather
than looking for parking at other locations. It is hard to establish what is the extent of
potential demand for car parking and its elasticity and so potential charging rates (for
example: If all car parks could be quadrupled in size and reduced their costs to £1/day
would they attract new users OR conversely if they reduced in size and double charges
would they still be full – this report does not seek to answer or address these options).
This study indicates that closing LU car parks for a prolonged period would be unlikely
to trigger much greater use of public transport if no improvements to bus services are
made. Most people surveyed, as current ‘car’ customers are determined to find
alternative car parking in such circumstances. Overall, only 6% of car park users say
they would use a bus to make their journey to the station, just 7% say they would walk,
and 4% claim they would not make the journey at all. This said, 17% of users would be
willing to consider alternatives to using the car.2 Women are more likely than men to
say they would consider alternatives.
1.4 Willingness to cycle Recent TfL research shows that 17% of Londoners cycle3. Among car park users,
11% would be willing to cycle to the station if the bicycle parking facilities were
improved. Typically, people tend to over-report their willingness to cycle so it is likely
that fewer than 11% would actually take up cycling. The main reported barrier to taking
up cycling is the distance. While the research did not explore the extent to which
people are aware of cycle routes, the origin data collated from this survey could be
used to map the cycling distances.
1.5 Car park users with disability / impairment, and Blue Badge holders
4% of car park users had a disability / impairment4. 2% were Blue Badge holders. In
most cases, the profile of car park use, and the likely travel / parking arrangements that
would be made if the car park were full or closed, are broadly comparable with that
seen for all car park users. Car park users with a disability and / or Blue Badge holders
are not significantly more likely than all car park users to say they would continue to
use a car.
1.6 Car park observation Generally, larger car parks (300+ spaces) have the highest average occupancy rate
across all measured times of day. This is higher than that of medium sized car parks
(100-299 spaces) for all times of day, and higher than smaller car parks (less than 100
spaces) for all times of day except 8am. 2 Would walk, take a bus, get a lift or cycle to the station if the car park was closed temporarily for a period of time 3 November 2009 TfL Regular Research Slot (n=1000 London residents) 4 Any long term physical or mental disability which limits the daily activities or the work they can do.

1.7 Conclusion There seems to be a general reluctance to use alternative modes of transport to
Underground stations among current car park users. In terms of communication or
marketing, removing car parking facilities is therefore not likely to be well received by
the current users. However, this survey did not seek to evaluate the benefits if parks
were converted to provide a different blend of facilities which might appeal to a wider
audience than currently.
2 Introduction
TfL’s car parking assets cover 62 sites, comprising approximately 10,000 parking
spaces and covering approximately 25 hectares. The Underground Users’ Survey
shows that only 2% of LU’s customers drive to the station and thus may use LU’s car
parks as a part of their travel arrangements. However, this figure varies from station to
station. Stations with large car parks sometimes have much higher proportions of car
park users among their customers.
The Mayor of London has made a commitment to providing new transport
infrastructure in London, including upgrades to the existing Underground infrastructure,
the introduction of Crossrail and infrastructure required for the delivery of the 2012
Olympics. As well as commitments to infrastructure, London’s population is expected
to continue growing, requiring more housing. Each borough in London has housing
targets that they must meet present economic conditions notwithstanding.
TfL is a public body with a public service remit. As such, it is important that the
transport role played by LU car parks is considered in determining their future use (as
either a car park or another land use). Car parking facilities at Underground stations,
particularly in areas poorly served by public transport, provide access to the
Underground network and central London.
Options, beyond the status quo, might include reviewing the nature of LU’s stations as
urban nodes and so opportunities to create land uses close to excellent public
transport which support a lower carbon economy. Other ideas might entail a review of
the nature of transport within a station hinterland and so giving greater importance to
cycling, local bus, taxi services and electric car parking provision.

As part of the overall assessment process, feedback from customers of these car parks
is required, most critically on:
• the importance of the car park for people’s access to London Underground (and for
movement around London more generally); and
• the potential impact that closing the car park would have on the London road
network (e.g. higher traffic volumes, parking on local residential streets etc).
2.1 Research objectives Specific research objectives and information requirements within this piece of work are
as follows:
• Where are users of the LU car parks coming from, and where are they travelling to
(i.e. origin and destination)?
• Why are they using the LU car parks?
• Specifically, are they using LU services from the station?
• When are people arriving at the car parks, and how long are they staying?
• Generally, how often and when do people use the car parks?
• What are people’s alternatives to using the car parks?
• What do people do if the car park is full?
• What would people do if the car park was temporarily closed?
2.2 Notes on reporting 2.2.1 Report scope This report covers collated findings across 39 car parks. It seeks to identify general
trends in car park use across the sample. It is not intended to provide detailed findings
at an individual car park level, but significant differences across different car parks are
noted where relevant. Car parks with a base size below 50 are only reported in the
overall total commentary and not in isolation. These car parks are:
• Colindale;
• Eastcote;
• Harrow and Wealdstone;
• Hounslow East; and
• South Harrow.
Detailed analysis of the individual car park data – including analysis of origin and
destination information – is being conducted separately by TfL.
2.2.2 Percentages Due to rounding to whole numbers, some percentages do not sum to 100%.
2.2.3 Statistically significant differences Statistically robust differences (at the 95% confidence level) are reported using the
term “significant” or “significantly different”. All other differences may be due to random
variation in the data.
3 Customer Findings
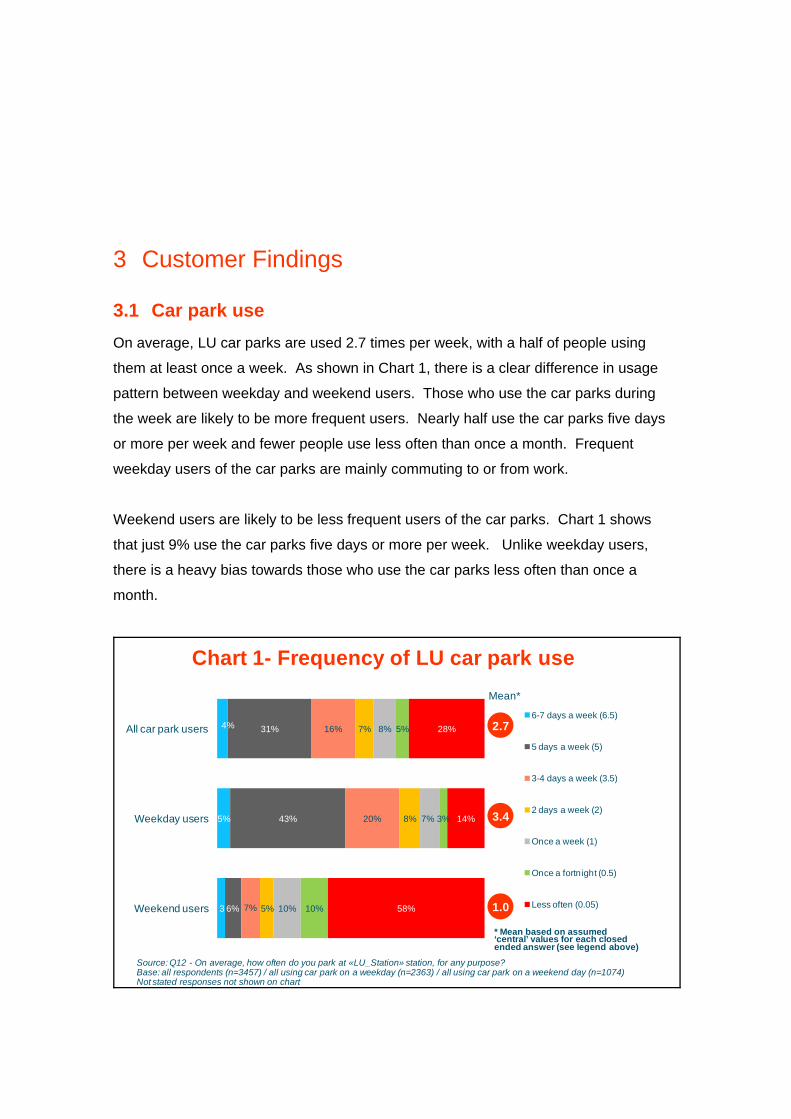
3.1 Car park use On average, LU car parks are used 2.7 times per week, with a half of people using
them at least once a week. As shown in Chart 1, there is a clear difference in usage
pattern between weekday and weekend users. Those who use the car parks during
the week are likely to be more frequent users. Nearly half use the car parks five days
or more per week and fewer people use less often than once a month. Frequent
weekday users of the car parks are mainly commuting to or from work.
Weekend users are likely to be less frequent users of the car parks. Chart 1 shows
that just 9% use the car parks five days or more per week. Unlike weekday users,
there is a heavy bias towards those who use the car parks less often than once a
month.
Chart 1- Frequency of LU car park use
Source: Q12 - On average, how often do you park at «LU_Station» station, for any purpose?Base: all respondents (n=3457) / all using car park on a weekday (n=2363) / all using car park on a weekend day (n=1074)Not stated responses not shown on chart
4%
5%
3
31%
43%
6%
16%
20%
7%
7%
8%
5%
8%
7%
10%
5%
3%
10%
28%
14%
58%
All car park users
Weekday users
Weekend users
6-7 days a week (6.5)
5 days a week (5)
3-4 days a week (3.5)
2 days a week (2)
Once a week (1)
Once a fortnight (0.5)
Less often (0.05)
2.7
3.4
1.0
Mean*
* Mean based on assumed‘central’ values for each closed ended answer (see legend above)
Car parks in Zone 6 (43%) have more people who park five days a week or more than
those in Zone 3 (36%), Zone 4 (33%) and Zone 5 (32%). Although there are variations
by car park, the Zone 6 car parks tend to be also widely used by people who are
commuting from destinations outside London.
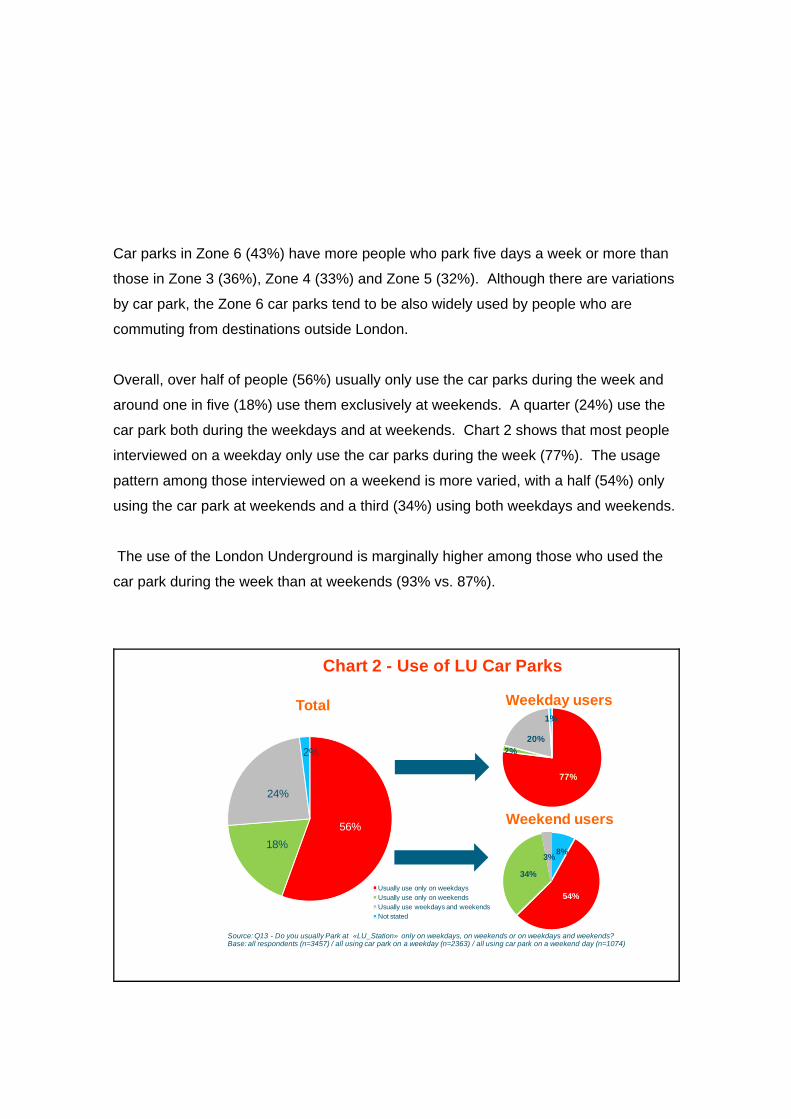
Overall, over half of people (56%) usually only use the car parks during the week and
around one in five (18%) use them exclusively at weekends. A quarter (24%) use the
car park both during the weekdays and at weekends. Chart 2 shows that most people
interviewed on a weekday only use the car parks during the week (77%). The usage
pattern among those interviewed on a weekend is more varied, with a half (54%) only
using the car park at weekends and a third (34%) using both weekdays and weekends.
The use of the London Underground is marginally higher among those who used the
car park during the week than at weekends (93% vs. 87%).
Chart 2 - Use of LU Car Parks
56%18%
24%
2%
Usually use only on weekdaysUsually use only on weekendsUsually use weekdays and weekendsNot stated
77%
2%20%
1%
Weekday users
8%
54%
34%
3%
Weekend users
Source: Q13 - Do you usually Park at «LU_Station» only on weekdays, on weekends or on weekdays and weekends? Base: all respondents (n=3457) / all using car park on a weekday (n=2363) / all using car park on a weekend day (n=1074)
Total
Car parks with significantly higher weekday usage are:
• Ickenham (78% use this car park only on a weekday)
• Barkingside (78%)
• Debden (77%)
• Cannons Park (75%)
• Hounslow West (74%)
• Northwood (72%)
• Chorleywood (71%)
• Croxley (70%)
• Woodside Park (69%)
• Stanmore (68%)
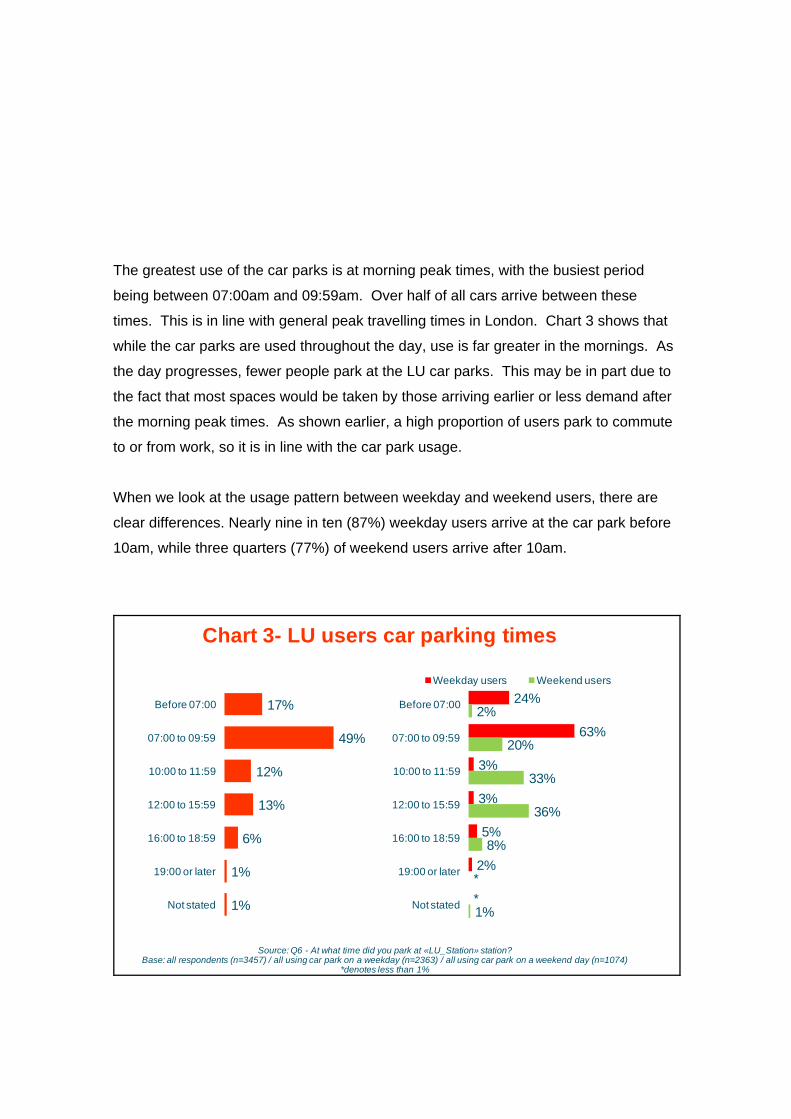
The greatest use of the car parks is at morning peak times, with the busiest period
being between 07:00am and 09:59am. Over half of all cars arrive between these
times. This is in line with general peak travelling times in London. Chart 3 shows that
while the car parks are used throughout the day, use is far greater in the mornings. As
the day progresses, fewer people park at the LU car parks. This may be in part due to
the fact that most spaces would be taken by those arriving earlier or less demand after
the morning peak times. As shown earlier, a high proportion of users park to commute
to or from work, so it is in line with the car park usage.
When we look at the usage pattern between weekday and weekend users, there are
clear differences. Nearly nine in ten (87%) weekday users arrive at the car park before
10am, while three quarters (77%) of weekend users arrive after 10am.
Chart 3- LU users car parking times
17%
49%
12%
13%
6%
1%
1%
Before 07:00
07:00 to 09:59
10:00 to 11:59
12:00 to 15:59
16:00 to 18:59
19:00 or later
Not stated
Source: Q6 - At what time did you park at «LU_Station» station?Base: all respondents (n=3457) / all using car park on a weekday (n=2363) / all using car park on a weekend day (n=1074)
*denotes less than 1%
24%
63%
3%
3%
5%
2%
*
2%
20%
33%
36%
8%
*
1%
Before 07:00
07:00 to 09:59
10:00 to 11:59
12:00 to 15:59
16:00 to 18:59
19:00 or later
Not stated
Weekday users Weekend users
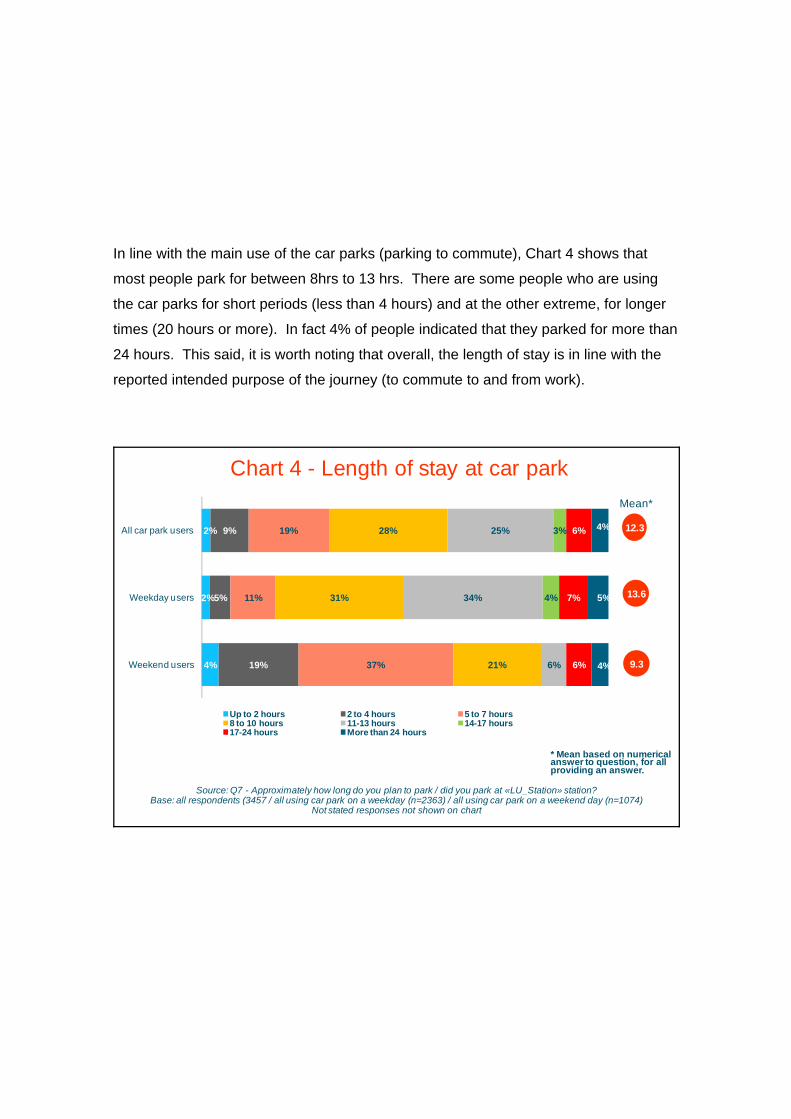
In line with the main use of the car parks (parking to commute), Chart 4 shows that
most people park for between 8hrs to 13 hrs. There are some people who are using
the car parks for short periods (less than 4 hours) and at the other extreme, for longer
times (20 hours or more). In fact 4% of people indicated that they parked for more than
24 hours. This said, it is worth noting that overall, the length of stay is in line with the
reported intended purpose of the journey (to commute to and from work).
Chart 4 - Length of stay at car park
Source: Q7 - Approximately how long do you plan to park / did you park at «LU_Station» station?Base: all respondents (3457 / all using car park on a weekday (n=2363) / all using car park on a weekend day (n=1074)
Not stated responses not shown on chart
2%
2%
4%
9%
5%
19%
19%
11%
37%
28%
31%
21%
25%
34%
6%
3%
4%
6%
7%
6%
4%
5%
4%
All car park users
Weekday users
Weekend users
Up to 2 hours 2 to 4 hours 5 to 7 hours8 to 10 hours 11-13 hours 14-17 hours17-24 hours More than 24 hours
13.6
12.3
9.3
Mean*
* Mean based on numericalanswer to question, for allproviding an answer.
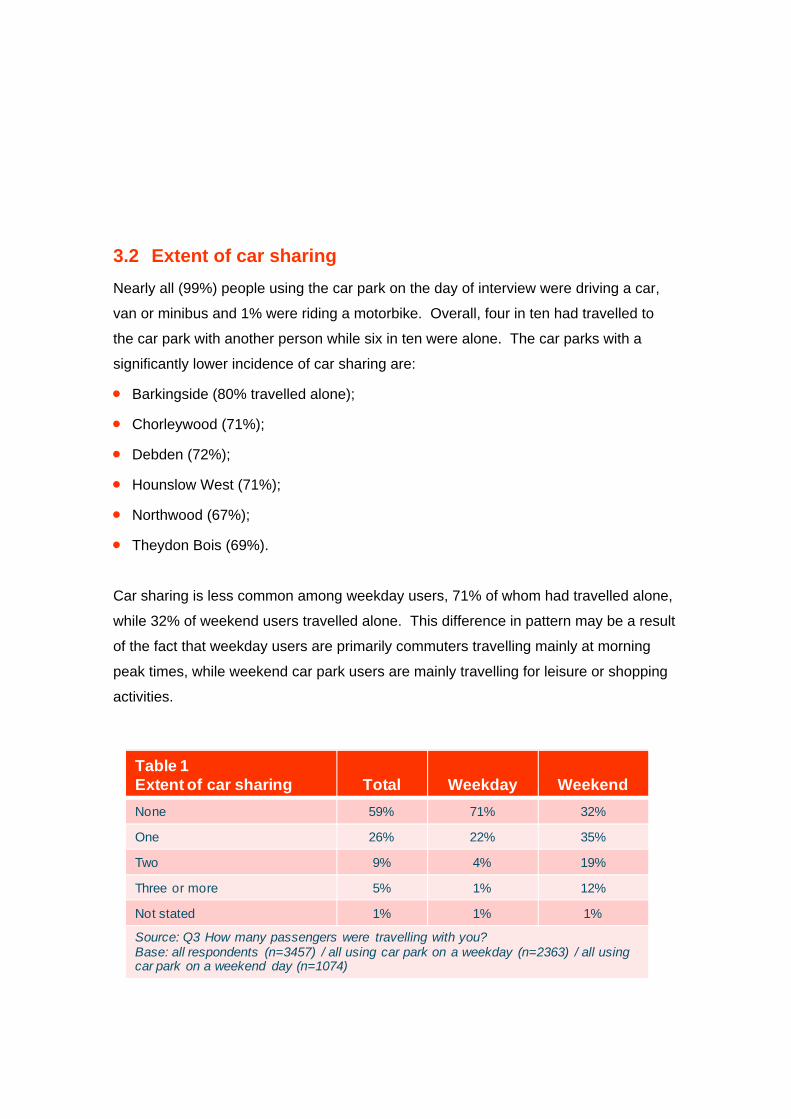
3.2 Extent of car sharing Nearly all (99%) people using the car park on the day of interview were driving a car,
van or minibus and 1% were riding a motorbike. Overall, four in ten had travelled to
the car park with another person while six in ten were alone. The car parks with a
significantly lower incidence of car sharing are:
• Barkingside (80% travelled alone);
• Chorleywood (71%);
• Debden (72%);
• Hounslow West (71%);
• Northwood (67%);
• Theydon Bois (69%).
Car sharing is less common among weekday users, 71% of whom had travelled alone,
while 32% of weekend users travelled alone. This difference in pattern may be a result
of the fact that weekday users are primarily commuters travelling mainly at morning
peak times, while weekend car park users are mainly travelling for leisure or shopping
activities.
Table 1Extent of car sharing Total Weekday WeekendNone 59% 71% 32%
One 26% 22% 35%
Two 9% 4% 19%
Three or more 5% 1% 12%
Not stated 1% 1% 1%
Source: Q3 How many passengers were travelling with you?Base: all respondents (n=3457) / all using car park on a weekday (n=2363) / all using car park on a weekend day (n=1074)
3.3 Benefits to London Underground At one level, LU’s car parks are benefiting London Underground as on the whole they
are being used for their intended purpose. However, it must be remembered that only
2% of LU’s customers use this ancillary facility. If TfL is to promote modal shift in
getting to its stations, there will need to be a trade off between convenience for current
users and opportunities to deliver wider gains and carbon reduction. The majority of
people (91%) indicated an intention to continue their journey on the Underground.
Those who parked on a weekday are even more likely to continue their journey on the
Underground than those who used the car park on a weekend (93% vs. 87%).
Responses indicate that demand from users is very inelastic. Therefore, we can infer
that charging regimes are perceived as acceptable for the convenience.
Car parks with an almost universal use (98% or above) of people intending to continue
their journey on the London Underground are:
• Buckhurst Hill (99%);
• Ickenham (98%);
• Loughton (98%);
• Cannons Park (98%);
• Epping (98%);
• Hornchurch (98%).
Car parks with a higher than average proportion of people saying they would not be
continuing their journey on the London Underground are:
• Rayners Lane (26%);
• Barkingside (22%);
• North Greenwich (18%);
• Oakwood (16%).
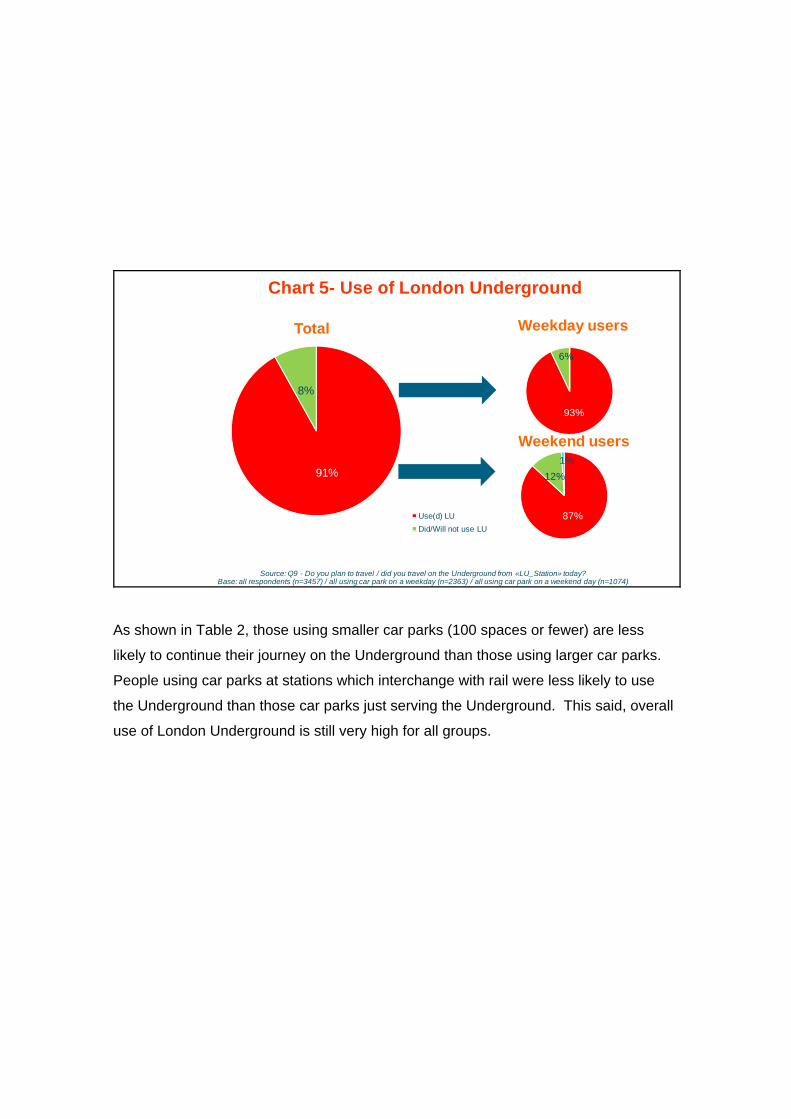
Chart 5- Use of London Underground
91%
8%
Use(d) LUDid/Will not use LU
93%
6%
Weekday users
87%
12%1%
Weekend users
Source: Q9 - Do you plan to travel / did you travel on the Underground from «LU_Station» today? Base: all respondents (n=3457) / all using car park on a weekday (n=2363) / all using car park on a weekend day (n=1074)
Total
As shown in Table 2, those using smaller car parks (100 spaces or fewer) are less
likely to continue their journey on the Underground than those using larger car parks.
People using car parks at stations which interchange with rail were less likely to use
the Underground than those car parks just serving the Underground. This said, overall
use of London Underground is still very high for all groups.
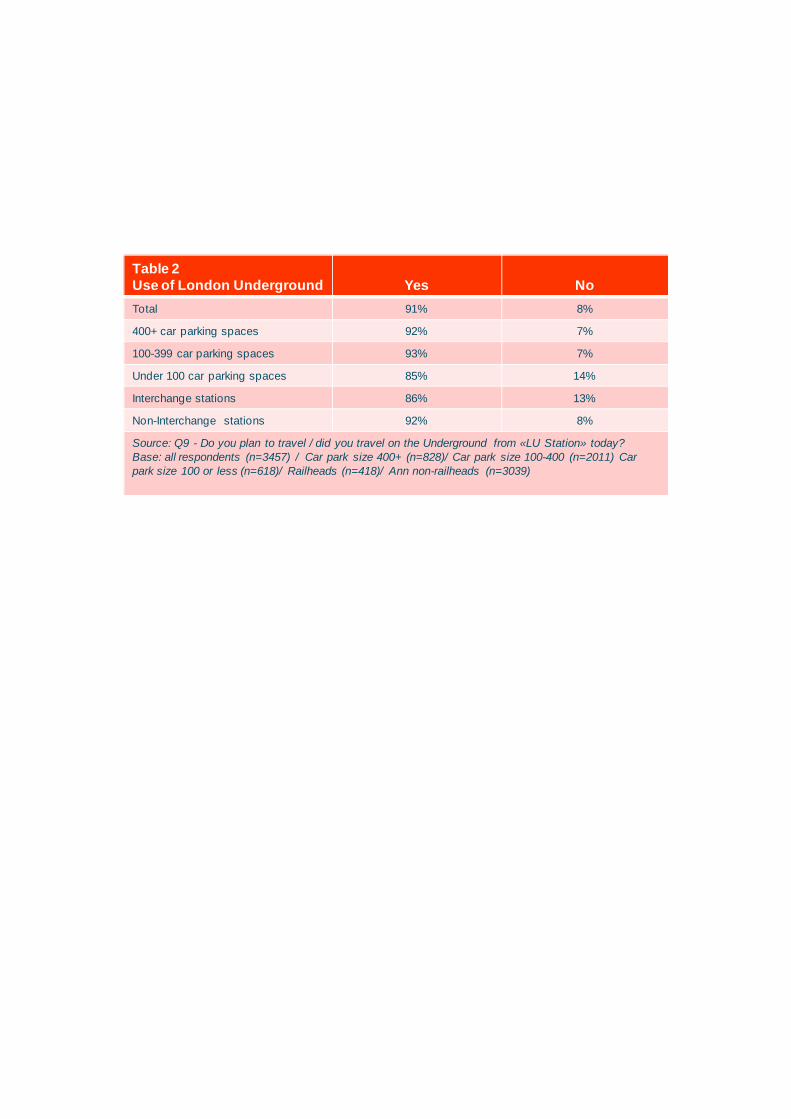
Table 2Use of London Underground Yes NoTotal 91% 8%
400+ car parking spaces 92% 7%
100-399 car parking spaces 93% 7%
Under 100 car parking spaces 85% 14%
Interchange stations 86% 13%
Non-Interchange stations 92% 8%
Source: Q9 - Do you plan to travel / did you travel on the Underground from «LU Station» today? Base: all respondents (n=3457) / Car park size 400+ (n=828)/ Car park size 100-400 (n=2011) Car park size 100 or less (n=618)/ Railheads (n=418)/ Ann non-railheads (n=3039)
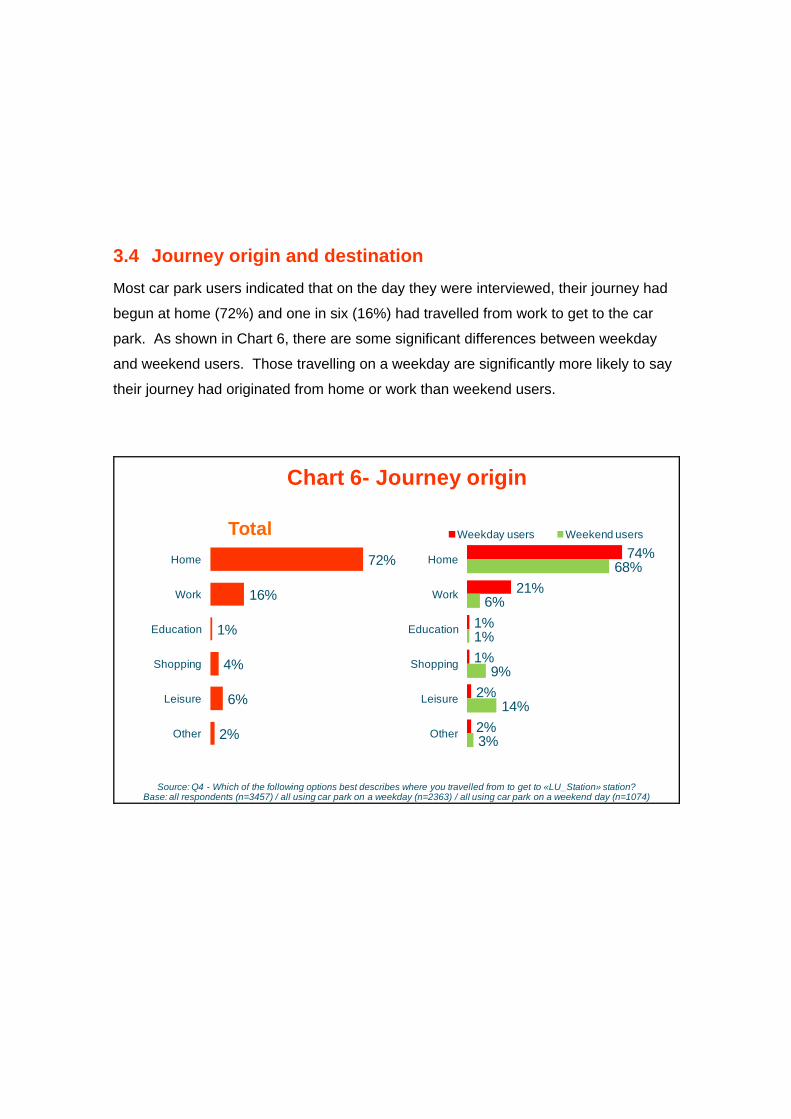
3.4 Journey origin and destination Most car park users indicated that on the day they were interviewed, their journey had
begun at home (72%) and one in six (16%) had travelled from work to get to the car
park. As shown in Chart 6, there are some significant differences between weekday
and weekend users. Those travelling on a weekday are significantly more likely to say
their journey had originated from home or work than weekend users.
Chart 6- Journey origin
72%
16%
1%
4%
6%
2%
Home
Work
Education
Shopping
Leisure
Other
Source: Q4 - Which of the following options best describes where you travelled from to get to «LU_Station» station? Base: all respondents (n=3457) / all using car park on a weekday (n=2363) / all using car park on a weekend day (n=1074)
74%
21%
1%
1%
2%
2%
68%
6%
1%
9%
14%
3%
Home
Work
Education
Shopping
Leisure
Other
Weekday users Weekend usersTotal
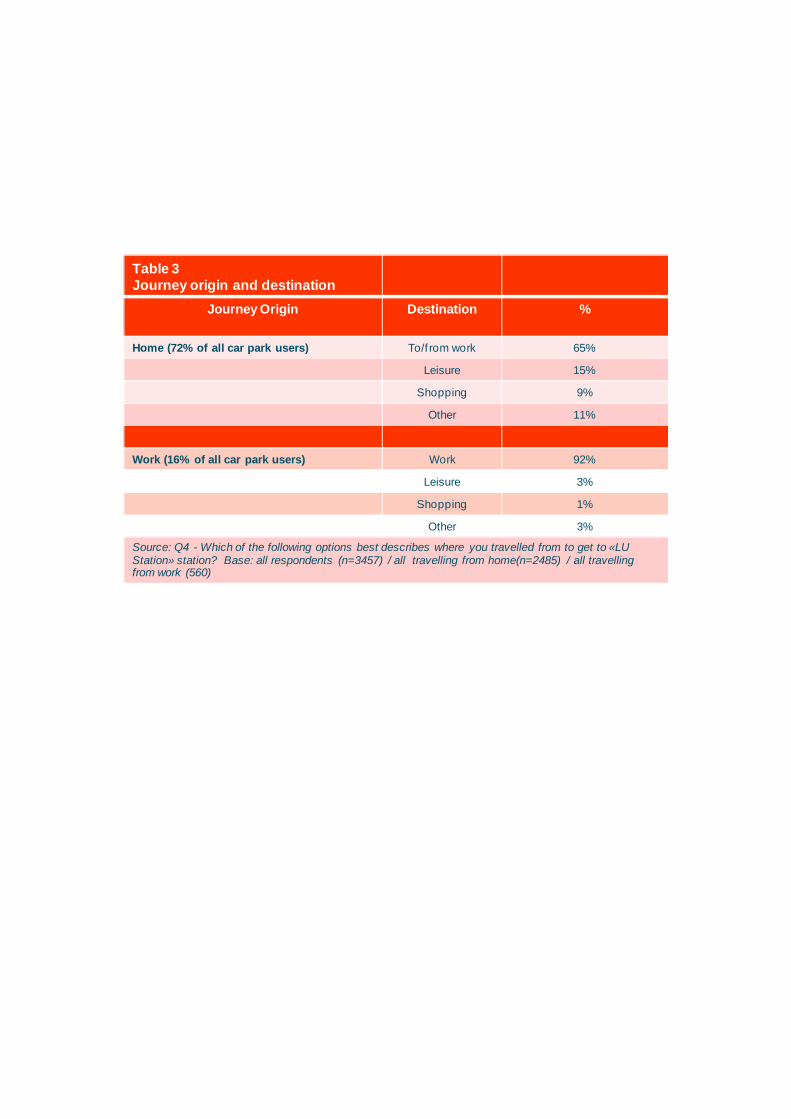
Table 3Journey origin and destination
Journey Origin Destination %
Home (72% of all car park users) To/f rom work 65%
Leisure 15%
Shopping 9%
Other 11%
Work (16% of all car park users) Work 92%
Leisure 3%
Shopping 1%
Other 3%
Source: Q4 - Which of the following options best describes where you travelled from to get to «LUStation» station? Base: all respondents (n=3457) / all travelling from home(n=2485) / all travelling from work (560)
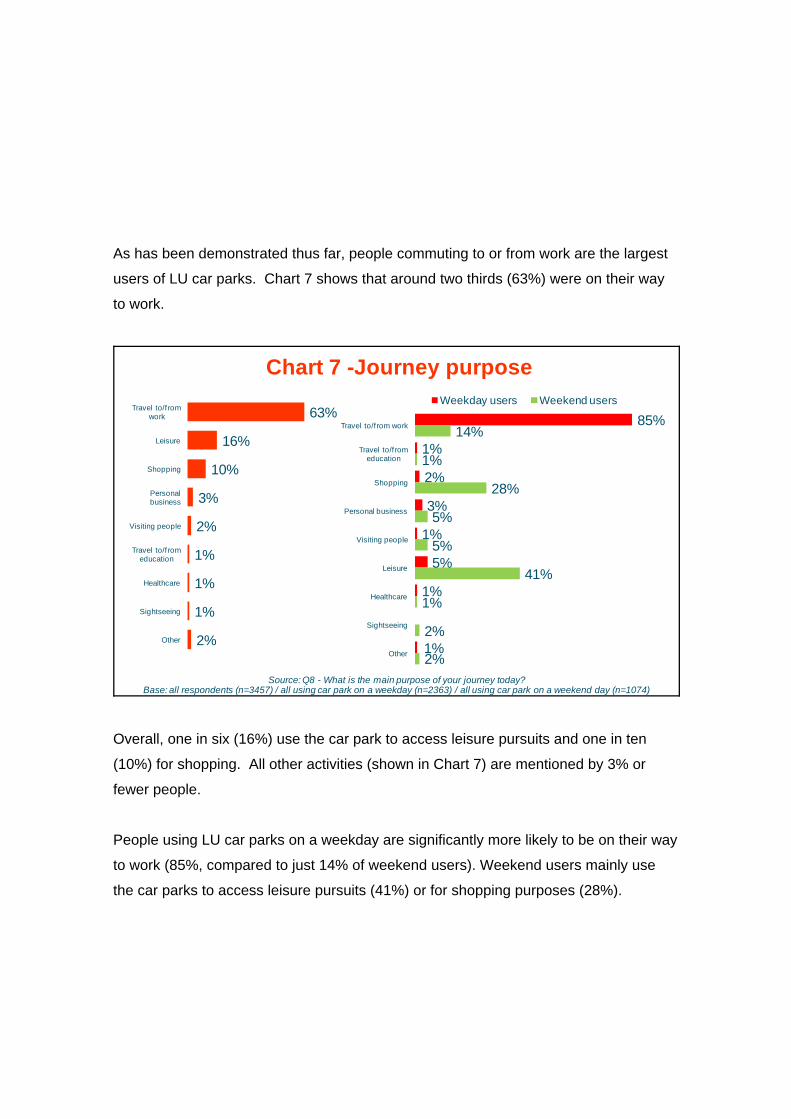
As has been demonstrated thus far, people commuting to or from work are the largest
users of LU car parks. Chart 7 shows that around two thirds (63%) were on their way
to work.
Chart 7 -Journey purpose
63%
16%
10%
3%
2%
1%
1%
1%
2%
Travel to/f rom work
Leisure
Shopping
Personal business
Visiting people
Travel to/f rom education
Healthcare
Sightseeing
Other
Source: Q8 - What is the main purpose of your journey today? Base: all respondents (n=3457) / all using car park on a weekday (n=2363) / all using car park on a weekend day (n=1074)
85%
1%
2%
3%
1%
5%
1%
1%
14%
1%
28%
5%
5%
41%
1%
2%
2%
Travel to/f rom work
Travel to/f rom education
Shopping
Personal business
Visiting people
Leisure
Healthcare
Sightseeing
Other
Weekday users Weekend users
Overall, one in six (16%) use the car park to access leisure pursuits and one in ten
(10%) for shopping. All other activities (shown in Chart 7) are mentioned by 3% or
fewer people.
People using LU car parks on a weekday are significantly more likely to be on their way
to work (85%, compared to just 14% of weekend users). Weekend users mainly use
the car parks to access leisure pursuits (41%) or for shopping purposes (28%).
3.5 Impact of removing LU car parks To assess the impact of removing car parks, customers were asked both how a closure
would affect them and what they would do currently if the car park were full.
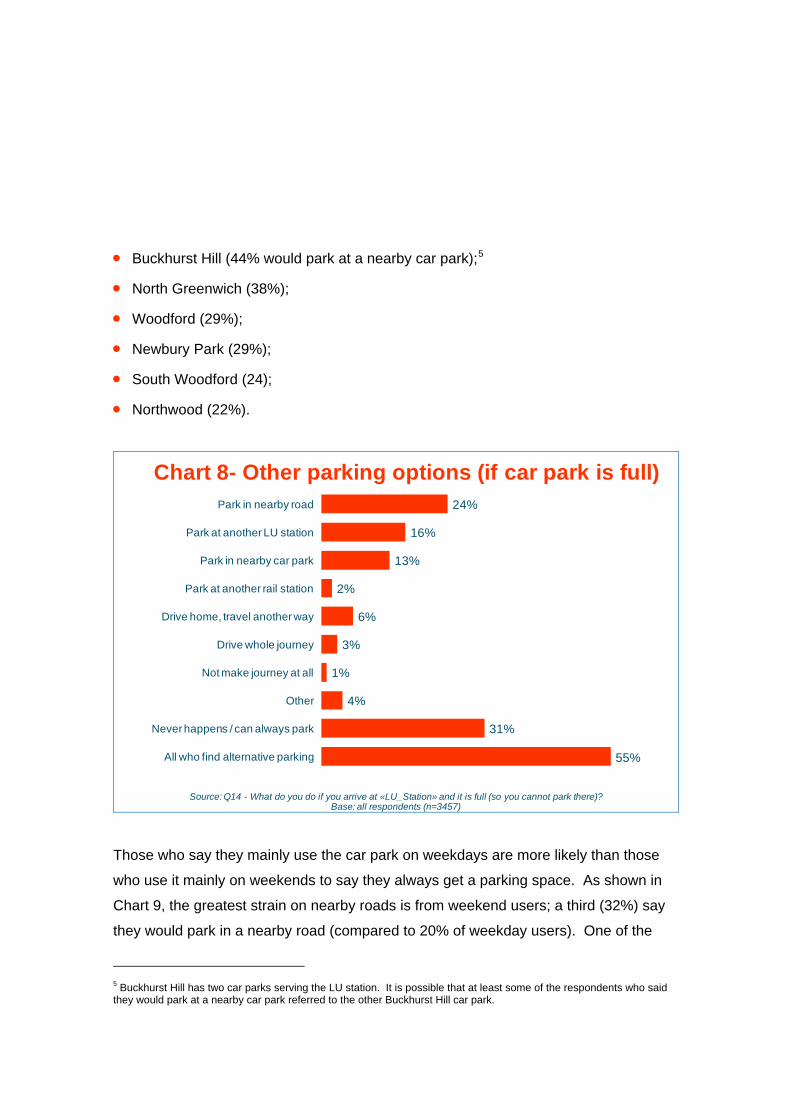
Looking at responses about full car parks first, a third (31%) of car park users say they
can always get a space to park at that LU car park.
Generally, there is a heavy reliance on cars. Just 6% of people would return home and
find an alternative way of making their journey if they find the LU car park full. Overall,
over half of LU car park users would find alternative parking if the car park is full (Chart
8 shows alternative parking that would be used). Just 3% would drive for their whole
journey. So although there is a reluctance to drive back home and find alternative
ways to travel to the station, few people would drive for their whole journey. We can
infer that deterrents like the congestion charge, the higher volume of traffic at peak
times and parking availability and fees could be stopping people from driving for their
entire journey.
As shown in Chart 8, those who would find alternative parking spaces say they are
likely to park in a nearby street (24%). While it was not within the remit of this research
to explore the impact on the wider area, we can assume that there would be fewer
spaces for residents due to the increased use. Car parks which have the greatest
impact on nearby roads when they are full (which are generally smaller car park) are:
• Oakwood (113 spaces and 46% would park in a nearby street);
• Hornchurch (55 spaces and 42%);
• East Finchley (96 spaces and 41%);
• Woodside Park (77 spaces and 35%);
• Osterley (89 spaces and 34%);
• Snaresbrook (99 spaces and 33%).
One in six (16%) users say they would park at another LU station when they find their
LU car park full. Again, although not within the scope of this research, we can assume
that the use of another LU car park can result in people who are local to that car park
being forced to find alternative parking, including on nearby roads. Therefore, the
problem of increased use of parking in nearby roads is likely to be moved to other
areas as a result of people using other LU stations. Car parks with a significantly
higher than average proportion of users saying they would park at another LU car park
are:
• Oakwood (46% would park at another LU car park) – the LU car park most likely to
be used as a substitute is Cockfosters
• Woodside Park (35%) – the most likely substitute is High Barnet*
• High Barnet (34%)– the most likely substitute is Woodside Park*
• Osterley (34%) – the most likely substitute is Hounslow East
• Snaresbrook (33%) – the most likely substitute is South Woodford
• Cannons Park (30%) – the most likely substitute is Stanmore
• Barkingside (27%) – the most likely substitute is Newbury Park
*=these are the reverse of each other.
Overall, around one in eight (13%) say they would park at nearby car parks (non LU).
The research did not map the car parking facilities available in the areas local to the LU
station used by car park users. Therefore the car parks with a higher than average
proportion of people saying they would park at a nearby car park may be ones with
other parking facilities that are local and allow people easy access to the Underground.
Those with a high proportion of people who say they would park at a nearby car park
when the LU car park is full are:
• Buckhurst Hill (44% would park at a nearby car park);5
• North Greenwich (38%);
• Woodford (29%);
• Newbury Park (29%);
• South Woodford (24);
• Northwood (22%).
24%
16%
13%
2%
6%
3%
1%
4%
31%
55%
Park in nearby road
Park at another LU station
Park in nearby car park
Park at another rail station
Drive home, travel another way
Drive whole journey
Not make journey at all
Other
Never happens / can always park
All who find alternative parking
Source: Q14 - What do you do if you arrive at «LU_Station» and it is full (so you cannot park there)? Base: all respondents (n=3457)
Chart 8- Other parking options (if car park is full)
Those who say they mainly use the car park on weekdays are more likely than those
who use it mainly on weekends to say they always get a parking space. As shown in
Chart 9, the greatest strain on nearby roads is from weekend users; a third (32%) say
they would park in a nearby road (compared to 20% of weekday users). One of the
5 Buckhurst Hill has two car parks serving the LU station. It is possible that at least some of the respondents who said they would park at a nearby car park referred to the other Buckhurst Hill car park.
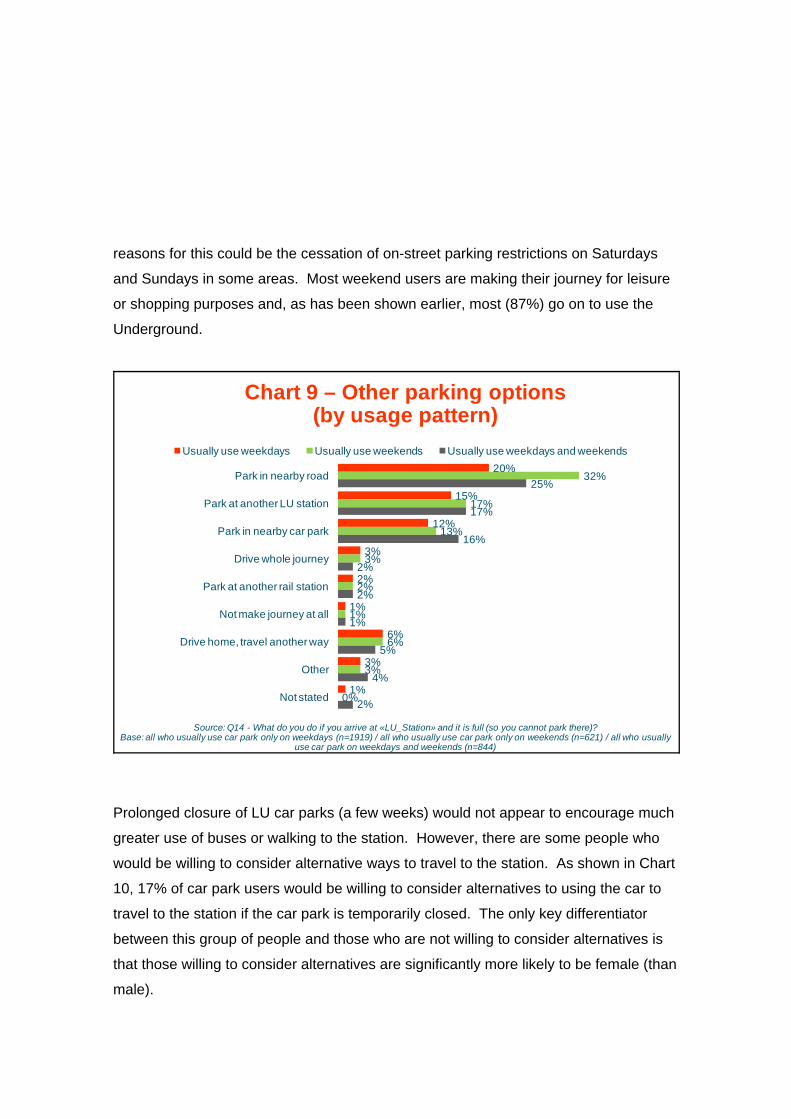
reasons for this could be the cessation of on-street parking restrictions on Saturdays
and Sundays in some areas. Most weekend users are making their journey for leisure
or shopping purposes and, as has been shown earlier, most (87%) go on to use the
Underground.
Chart 9 – Other parking options (by usage pattern)
20%
15%
12%
3%
2%
1%
6%
3%
1%
32%
17%
13%
3%
2%
1%
6%
3%
0%
25%
17%
16%
2%
2%
1%
5%
4%
2%
Park in nearby road
Park at another LU station
Park in nearby car park
Drive whole journey
Park at another rail station
Not make journey at all
Drive home, travel another way
Other
Not stated
Usually use weekdays Usually use weekends Usually use weekdays and weekends
Source: Q14 - What do you do if you arrive at «LU_Station» and it is full (so you cannot park there)? Base: all who usually use car park only on weekdays (n=1919) / all who usually use car park only on weekends (n=621) / all who usually
use car park on weekdays and weekends (n=844)
Prolonged closure of LU car parks (a few weeks) would not appear to encourage much
greater use of buses or walking to the station. However, there are some people who
would be willing to consider alternative ways to travel to the station. As shown in Chart
10, 17% of car park users would be willing to consider alternatives to using the car to
travel to the station if the car park is temporarily closed. The only key differentiator
between this group of people and those who are not willing to consider alternatives is
that those willing to consider alternatives are significantly more likely to be female (than
male).
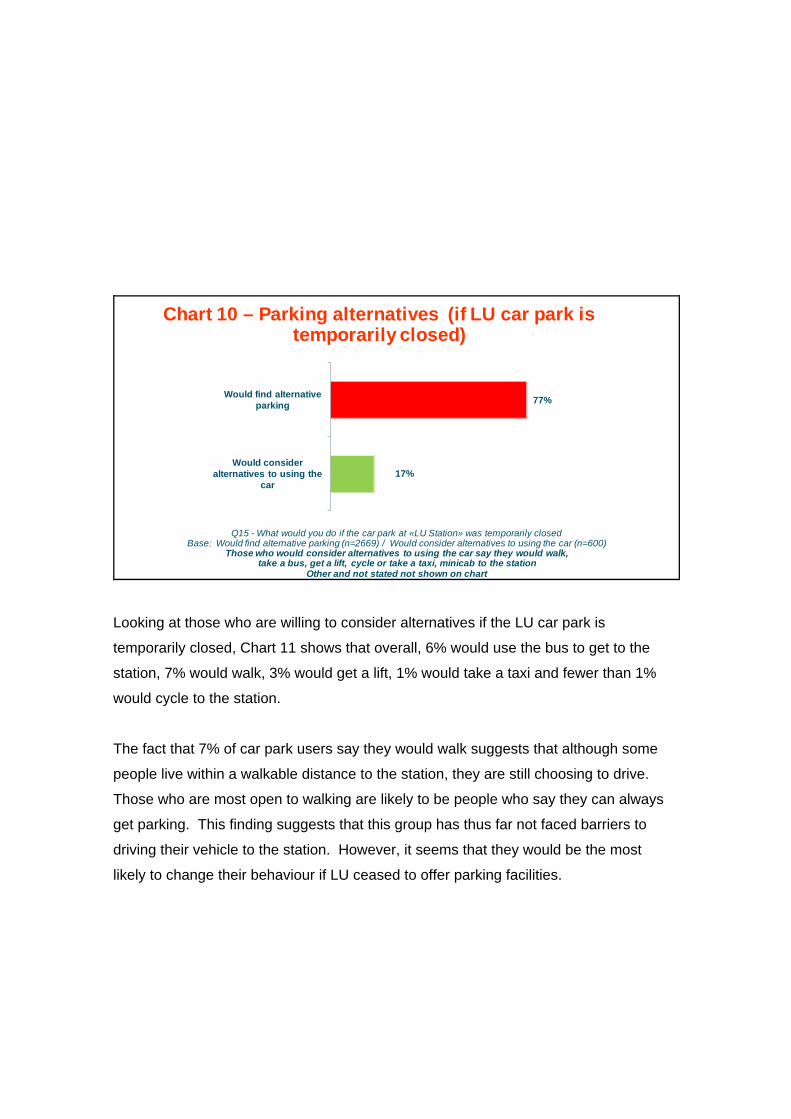
Chart 10 – Parking alternatives (if LU car park is temporarily closed)
17%
77%
Would consider alternatives to using the
car
Would find alternative parking
Q15 - What would you do if the car park at «LU Station» was temporarily closed Base: Would find alternative parking (n=2669) / Would consider alternatives to using the car (n=600)
Those who would consider alternatives to using the car say they would walk,take a bus, get a lift, cycle or take a taxi, minicab to the station
Other and not stated not shown on chart
Looking at those who are willing to consider alternatives if the LU car park is
temporarily closed, Chart 11 shows that overall, 6% would use the bus to get to the
station, 7% would walk, 3% would get a lift, 1% would take a taxi and fewer than 1%
would cycle to the station.
The fact that 7% of car park users say they would walk suggests that although some
people live within a walkable distance to the station, they are still choosing to drive.
Those who are most open to walking are likely to be people who say they can always
get parking. This finding suggests that this group has thus far not faced barriers to
driving their vehicle to the station. However, it seems that they would be the most
likely to change their behaviour if LU ceased to offer parking facilities.
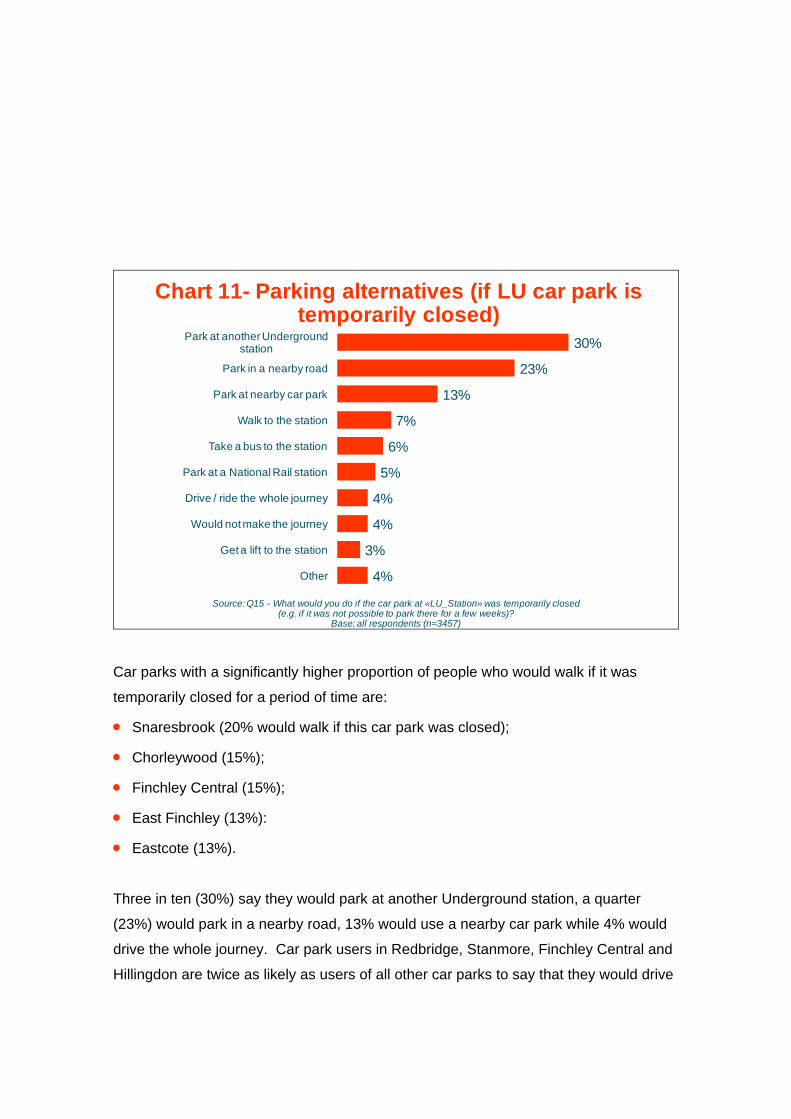
Chart 11- Parking alternatives (if LU car park is temporarily closed)
30%
23%
13%
7%
6%
5%
4%
4%
3%
4%
Park at another Underground station
Park in a nearby road
Park at nearby car park
Walk to the station
Take a bus to the station
Park at a National Rail station
Drive / ride the whole journey
Would not make the journey
Get a lift to the station
Other
Source: Q15 - What would you do if the car park at «LU_Station» was temporarily closed(e.g. if it was not possible to park there for a few weeks)?
Base: all respondents (n=3457)
Car parks with a significantly higher proportion of people who would walk if it was
temporarily closed for a period of time are:
• Snaresbrook (20% would walk if this car park was closed);
• Chorleywood (15%);
• Finchley Central (15%);
• East Finchley (13%):
• Eastcote (13%).
Three in ten (30%) say they would park at another Underground station, a quarter
(23%) would park in a nearby road, 13% would use a nearby car park while 4% would
drive the whole journey. Car park users in Redbridge, Stanmore, Finchley Central and
Hillingdon are twice as likely as users of all other car parks to say that they would drive
for the whole journey (8% vs. 4% overall total). This is likely to have an impact on the
congestion of the roads, particularly at morning peak times when most car park users
begin their journey.
Four in ten of those who say they would drive for their whole journey if they find the LU
car park full, also say they would drive for the whole journey should the car park ever
be temporarily closed for a period of time. These people are more likely (than other car
park users) to be travelling for work purposes. They are also more likely to be users of
the larger car parks included in the survey. It would seem that this group is heavily
dependent on their cars and changing their behaviour may be difficult.
Although 30% of users say they would park at another LU car park if the car park is
temporarily closed for a period of time, as has been shown earlier in this section, just
16% actually park at another LU car park when they find the car park full. Nearby roads
are the most used parking alternative when people find the car park full (24%). A
similar proportion of users (23%) say if the car park is closed for a period of time they
would park on nearby roads. 13% currently park in nearby non-LU car parks when the
car park is full and the same proportion say they would use this alternative if the car
park was closed for a period of time. Currently, just 6% of car park users go home and
find alternative ways to travel when they find the car park full. However, if the car park
were to be temporarily closed for a period of time, 17% say they would find alternative
ways to travel to the station. This finding suggests that a prolonged closure of the car
parks would force a small, but significant proportion of people to give up driving to the
station.
The greater than normal unsolicited emails and comments sent to Synovate (greater
than normal compared to the amount usually received for any average survey on any
topic) expressing concern about the possible closure of LU car parks by users show
that there is potentially great strength of feeling on the subject (despite care taken in
the survey to position closure as temporary).
3.6 Willingness to cycle As has been shown thus far, there is a reluctance by current car drivers to use other
modes of transport to the Underground. When asked if they would consider cycling to
the station if there were improved facilities to park a bicycle, one in ten (11%) car park
users said they would consider it. Other TfL data shows that 17% of Londoners cycle
at least once a year and 24% of Londoners would be willing to consider cycling in the
future.6 The seemingly low willingness to consider cycling demonstrated in this survey
may be in part due to the fact that the research targeted active car users. Willingness
to cycle among car park users - at least for this journey (travelling to the station) - is
significantly lower than the London average.
It is also worth noting that people tend to over report their willingness to cycle. It is
likely that the proportion of LU car park users who would actually take up cycling would
be lower.
The most salient barrier to taking up cycling to the station is distance. A quarter (25%)
felt the distance would be too far for them, this was the most mentioned reason why
people would not consider cycling. Within the confines of the current survey, we have
not been able to drill into more specific origin data to establish whether the availability
of car parking facilities encourages more distant users to drive to a LU car park rather
than get on the public transport system closer to their originating destination (there is
some evidence that car parks can attract customers from considerable distances or in
locations (Epping) where the alternative may be at a higher car parking and transport
cost (Harlow)).
5% would not be encouraged to cycle as they do not have a bicycle and 4% would be
encouraged if it was safer. While the question was phrased about what would
6 March TfL Regular Research Slot (n=1007 London residents) & November 2009 TfL Regular Research Slot (n=1000)
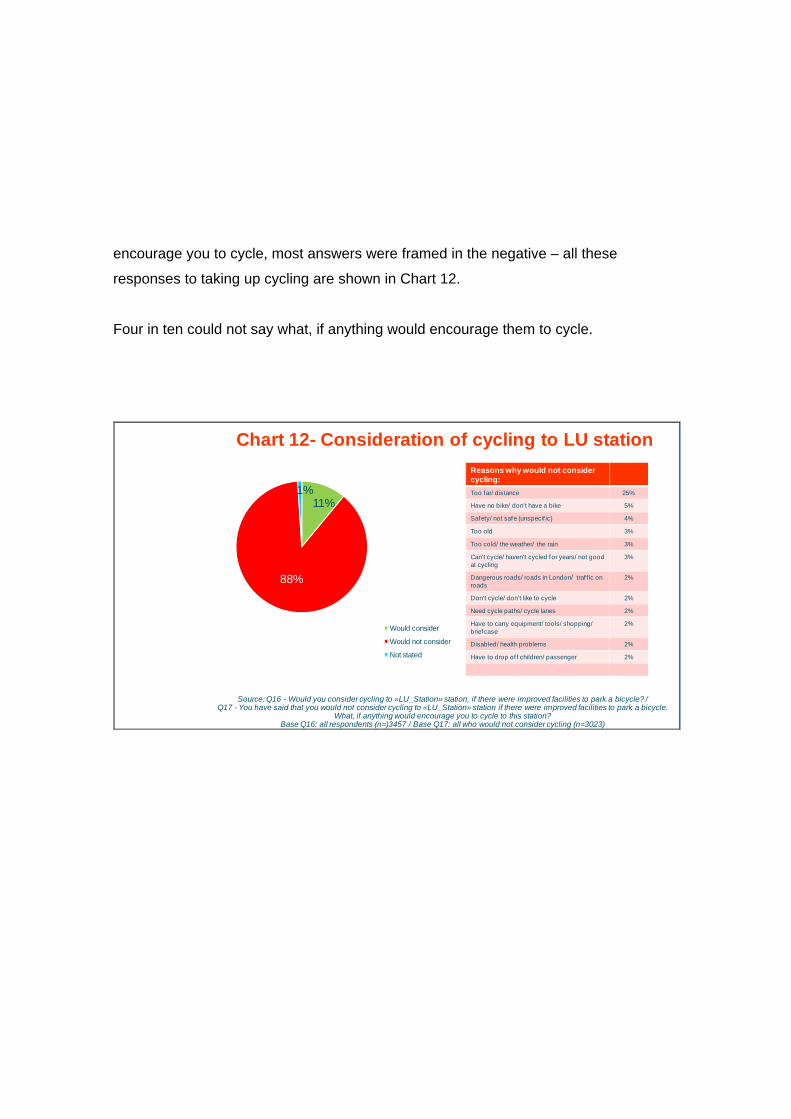
encourage you to cycle, most answers were framed in the negative – all these
responses to taking up cycling are shown in Chart 12.
Four in ten could not say what, if anything would encourage them to cycle.
Chart 12- Consideration of cycling to LU station
11%
88%
1%
Would consider
Would not consider
Not stated
Source: Q16 - Would you consider cycling to «LU_Station» station, if there were improved facilities to park a bicycle? /Q17 - You have said that you would not consider cycling to «LU_Station» station if there were improved facilities to park a bicycle.
What, if anything would encourage you to cycle to this station? Base Q16: all respondents (n=)3457 / Base Q17: all who would not consider cycling (n=3023)
Reasons why would not consider cycling:Too far/ distance 25%
Have no bike/ don't have a bike 5%
Safety/ not safe (unspecif ic) 4%
Too old 3%
Too cold/ the weather/ the rain 3%
Can't cycle/ haven't cycled for years/ not good at cycling
3%
Dangerous roads/ roads in London/ traf f ic on roads
2%
Don't cycle/ don't like to cycle 2%
Need cycle paths/ cycle lanes 2%
Have to carry equipment/ tools/ shopping/ briefcase
2%
Disabled/ health problems 2%
Have to drop of f children/ passenger 2%
3.7 Car park users with a disability / impairment and Blue
Badge holders 4% of car park users had a disability / impairment.7 2% were Blue Badge holders.
In most cases, the profile of car park use, and the likely travel / parking arrangements
that would be made if the car park were full or closed, are broadly comparable with that
seen for all car park users. In particular, most use London Underground after parking,
and most would continue to drive / find alternative parking if the car park was full or
unavailable. Moreover, car park users with a disability and / or Blue Badge holders are
not significantly more likely than all car park users to say they would continue to use a
car.
A detailed analysis of these variations is attached as Appendix 1.
7 Any long term physical or mental disability which limits the daily activities or the work they can do.
4. Observations of car park usage
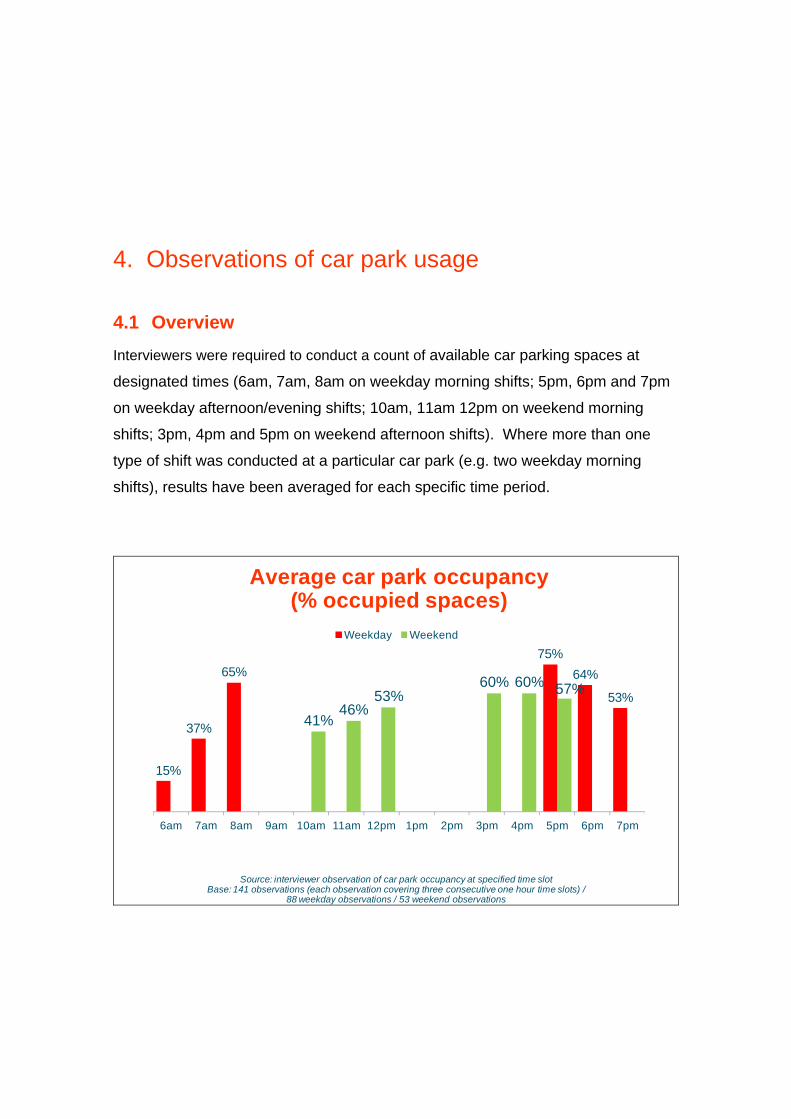
4.1 Overview Interviewers were required to conduct a count of available car parking spaces at
designated times (6am, 7am, 8am on weekday morning shifts; 5pm, 6pm and 7pm
on weekday afternoon/evening shifts; 10am, 11am 12pm on weekend morning
shifts; 3pm, 4pm and 5pm on weekend afternoon shifts). Where more than one
type of shift was conducted at a particular car park (e.g. two weekday morning
shifts), results have been averaged for each specific time period.
Average car park occupancy(% occupied spaces)
15%
37%
65%75%
64%
53%
41%46%
53%60% 60% 57%
6am 7am 8am 9am 10am 11am 12pm 1pm 2pm 3pm 4pm 5pm 6pm 7pm
Weekday Weekend
Source: interviewer observation of car park occupancy at specified time slotBase: 141 observations (each observation covering three consecutive one hour time slots) /
88 weekday observations / 53 weekend observations
4.2 Weekday occupancy 4.2.1 Overall Occupancy increases during the morning, and significantly between 7am and 8am.
Occupancy is largely maintained until 5pm, and reduces significantly after 6pm.
Overall, only 11 car parks were observed to be effectively full at some point on a
weekday when interviewing was conducted:
• Redbridge (peak 99% occupancy at 8am and has 147 car parking spaces);
• Newbury Park (98% at 8am – 459 spaces);
• Theydon Bois (98% at 8am – 65 spaces);
• Cockfosters (98% at 5pm – 430 spaces);
• Buckhurst Hill (97% at 8am – 120 spaces);
• Eastcote (96% at 8am – 50 spaces);
• Hounslow West (94% at 5pm - 425 spaces);
• Loughton (93% at 5pm – 288 spaces);
• Debden (92% at 8am – 190 spaces);
• Arnos Grove (91% at 5pm – 306 spaces);
• Colindale (90% at 5pm – 21 spaces).
It is notable that many of these car parks are serving Central Line stations to the east
of Greater London. The average size of these eleven car parks is significantly higher
than the overall average car park size of all those measured.
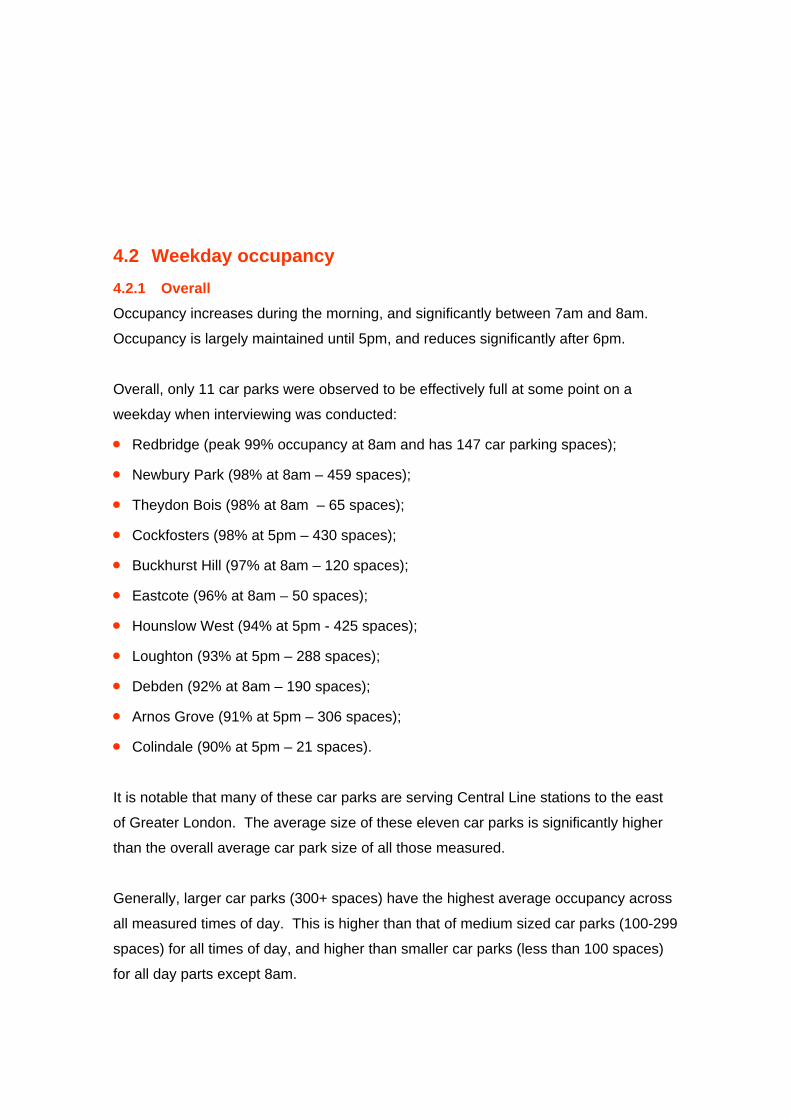
Generally, larger car parks (300+ spaces) have the highest average occupancy across
all measured times of day. This is higher than that of medium sized car parks (100-299
spaces) for all times of day, and higher than smaller car parks (less than 100 spaces)
for all day parts except 8am.
Only four car parks were never observed to be more than half full during weekdays:
• Chorleywood (maximum 49% occupied, peak at 5pm and has 238 car parking
spaces);
• Hillingdon (43% at 8am – 283 spaces);
• South Harrow (42% at 8am – 73 spaces);
• East Finchley (37% at 8am – 267 spaces).
Average car park occupancy - weekday(% occupied spaces)
32%
51%
70%
89%
80%
72%
9%
27%
56%
68%
58%
46%
14%
43%
79% 76%
62%
47%
0%
20%
40%
60%
80%
100%
6am 7am 8am 9am 4pm 5pm 6pm 7pm
Largest car parks (300+ spaces) Medium car parks (100‐299) Smallest car parks (<100)
Source: interviewer observation of car park occupancy at specified time slotBase: 88 weekday observations (each observation covering three consecutive one hour time slots)
4.2.2 Mornings No car parks were full at 6am. Only one (Cockfosters, a large car park) was more than
half full at 6am.
One car park (Buckhurst Hill) was effectively full (<10% free spaces) by 7am. In total,
eight car parks were more than half full by 7am. These included three of the largest
car parks: Epping, Cockfosters, Arnos Grove).
Occupancy increases significantly between 7am and 8am. Six car parks were
effectively full by 8am. A further four had between 10% and 20% free spaces. In total,
21 car parks were more than half full by 8am.
4.2.3 Afternoons / evenings Six car parks were effectively full at 5pm. Only one of these (Buckhurst Hill) was also
effectively full in the morning, but all but one of these were at least half full in the
morning. A further seven car parks had between 10% and 20% free spaces available
at 5pm. In total, 21 car parks were more than half full at 5pm.
Occupancy reduces somewhat by 6pm, with only one car park effectively full
(Cockfosters), four others with between 10% and 20% free spaces, and a total of 18
more than half full.
Occupancy reduces significantly between 6pm and 7pm. Only one car park (Arnos
Grove) is effectively full between 6pm and 7pm, three more have between 10% and
20% free spaces, and a total of 13 car parks are more than half full.
4.3 Weekend occupancy 4.3.1 Overall On average, the car parks are less occupied on weekends compared with weekdays.
Car park occupancy increases steadily from 10am through to 12pm. Occupancy is
slightly higher during the afternoon hours (3pm to 5pm), and reduces slightly during
this time period.
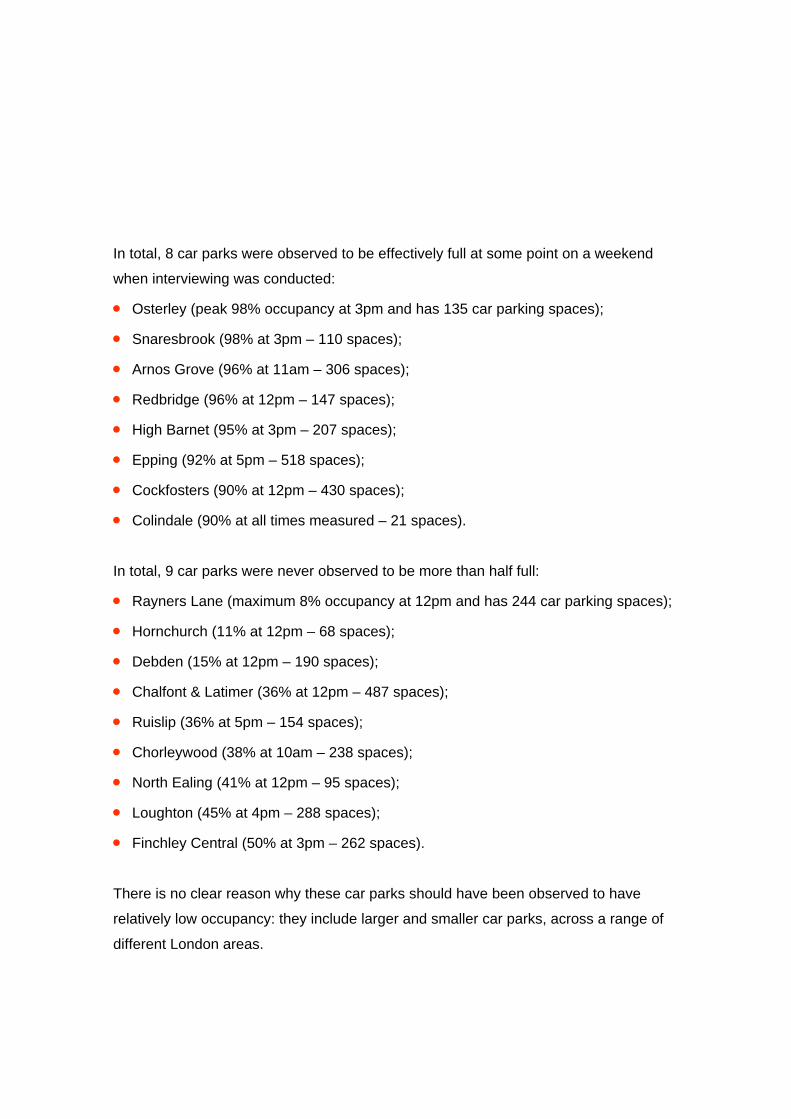
In total, 8 car parks were observed to be effectively full at some point on a weekend
when interviewing was conducted:
• Osterley (peak 98% occupancy at 3pm and has 135 car parking spaces);
• Snaresbrook (98% at 3pm – 110 spaces);
• Arnos Grove (96% at 11am – 306 spaces);
• Redbridge (96% at 12pm – 147 spaces);
• High Barnet (95% at 3pm – 207 spaces);
• Epping (92% at 5pm – 518 spaces);
• Cockfosters (90% at 12pm – 430 spaces);
• Colindale (90% at all times measured – 21 spaces).
In total, 9 car parks were never observed to be more than half full:
• Rayners Lane (maximum 8% occupancy at 12pm and has 244 car parking spaces);
• Hornchurch (11% at 12pm – 68 spaces);
• Debden (15% at 12pm – 190 spaces);
• Chalfont & Latimer (36% at 12pm – 487 spaces);
• Ruislip (36% at 5pm – 154 spaces);
• Chorleywood (38% at 10am – 238 spaces);
• North Ealing (41% at 12pm – 95 spaces);
• Loughton (45% at 4pm – 288 spaces);
• Finchley Central (50% at 3pm – 262 spaces).
There is no clear reason why these car parks should have been observed to have
relatively low occupancy: they include larger and smaller car parks, across a range of
different London areas.
4.3.2 Mornings Two car parks (Arnos Grove, Colindale) were effectively full (<10% free spaces) at
10am. In total, 10 car parks were at least 50% occupied by 10am.
Three car parks (Arnos Grove, Colindale, Osterley) were effectively full at 11am. In
total, 13 car parks were at least 50% occupied by 11am.
Five car parks (those mentioned above, plus Redbridge and Cockfosters) were
effectively full at 12pm. In total, 16 car parks were at least 50% occupied by 12pm.
4.3.3 Afternoons Five car parks (Snaresbrook, Arnos Grove, High Barnet, Epping, Osterley) were
effectively full at 3pm. In total, 10 car parks were at least 50% occupied by 3pm.
Four car parks (Snaresbrook, Arnos Grove, High Barnet, Colindale) were effectively full
at 4pm. In total, 9 car parks were at least 50% occupied by 4pm.
Three car parks (Arnos Grove, Epping, Colindale) were effectively full at 5pm. In total,
9 car parks were at least 50% occupied by 5pm.

4 Appendices
Appendix 1 - Analysis of car park users with a disability / impairment and Blue Badge holders
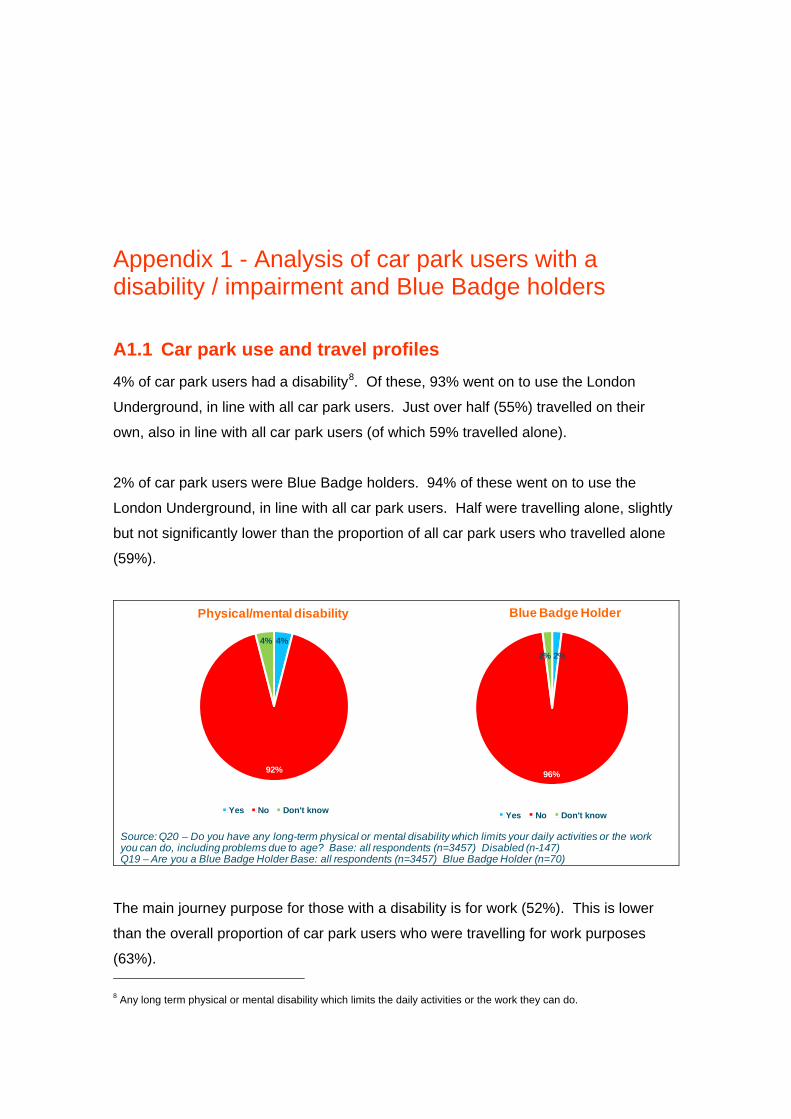
A1.1 Car park use and travel profiles 4% of car park users had a disability8. Of these, 93% went on to use the London
Underground, in line with all car park users. Just over half (55%) travelled on their
own, also in line with all car park users (of which 59% travelled alone).
2% of car park users were Blue Badge holders. 94% of these went on to use the
London Underground, in line with all car park users. Half were travelling alone, slightly
but not significantly lower than the proportion of all car park users who travelled alone
(59%).
2%
96%
2%
Yes No Don't know
Blue Badge Holder
4%
92%
4%
Yes No Don't know
Physical/mental disability
Source: Q20 – Do you have any long-term physical or mental disability which limits your daily activities or the work you can do, including problems due to age? Base: all respondents (n=3457) Disabled (n-147)Q19 – Are you a Blue Badge Holder Base: all respondents (n=3457) Blue Badge Holder (n=70)
The main journey purpose for those with a disability is for work (52%). This is lower
than the overall proportion of car park users who were travelling for work purposes
(63%). 8 Any long term physical or mental disability which limits the daily activities or the work they can do.
The main journey purpose for Blue Badge holders is work (36%). This is lower than
the overall proportion of car park users who were travelling for work purposes (63%).
A quarter (27%) of Blue Badge holders travelled for leisure purposes. This is higher
than the proportion of all car park users travelling for leisure purposes (16%).
On average, car park users who have a disability use the car park 2.6 times per week,
in line with the overall use of car parks (average 2.7 times per week). On average,
Blue Badge holders use car parks less frequently, with an average of 2.1 times per
week. Usage for both groups is fairly evenly spread across both weekends and
weekdays.
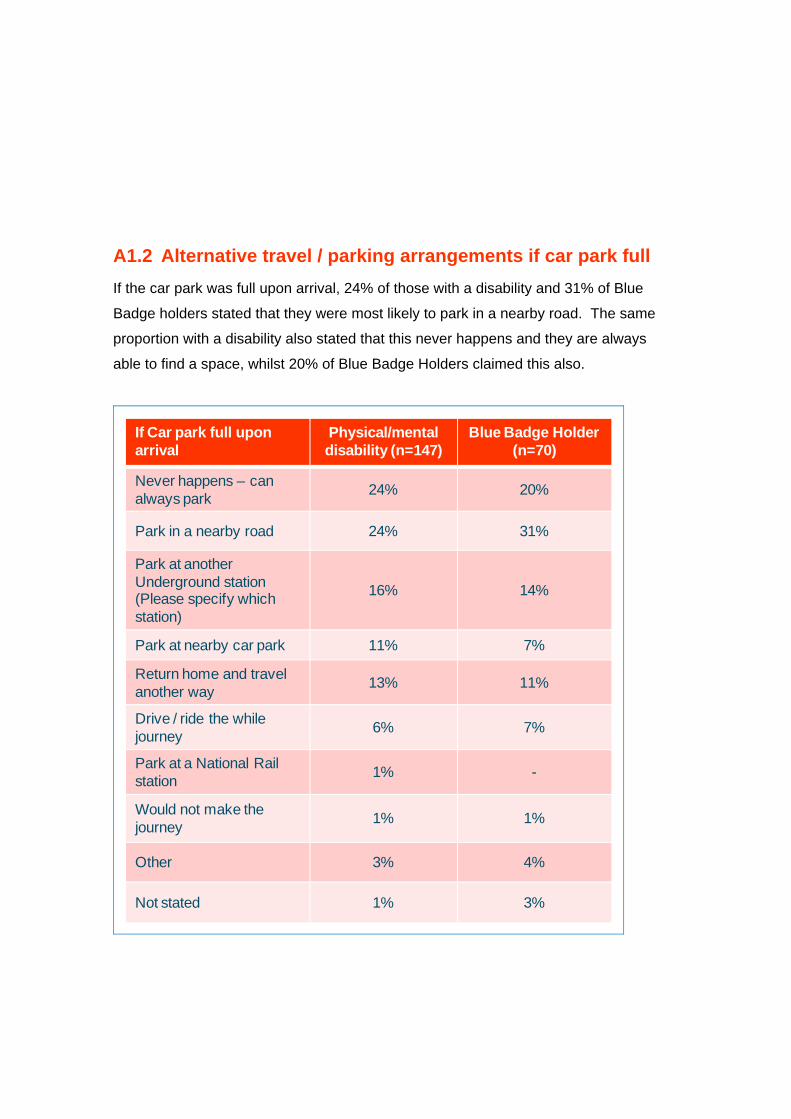
A1.2 Alternative travel / parking arrangements if car park full If the car park was full upon arrival, 24% of those with a disability and 31% of Blue
Badge holders stated that they were most likely to park in a nearby road. The same
proportion with a disability also stated that this never happens and they are always
able to find a space, whilst 20% of Blue Badge Holders claimed this also.
If Car park full upon arrival
Physical/mentaldisability (n=147)
Blue Badge Holder (n=70)
Never happens – can always park 24% 20%
Park in a nearby road 24% 31%
Park at another Underground station (Please specify which station)
16% 14%
Park at nearby car park 11% 7%
Return home and travel another way 13% 11%
Drive / ride the whilejourney 6% 7%
Park at a National Rail station 1% -
Would not make the journey 1% 1%
Other 3% 4%
Not stated 1% 3%
These proportions are broadly comparable to the alternative travel / parking
arrangements mentioned across all car park users.
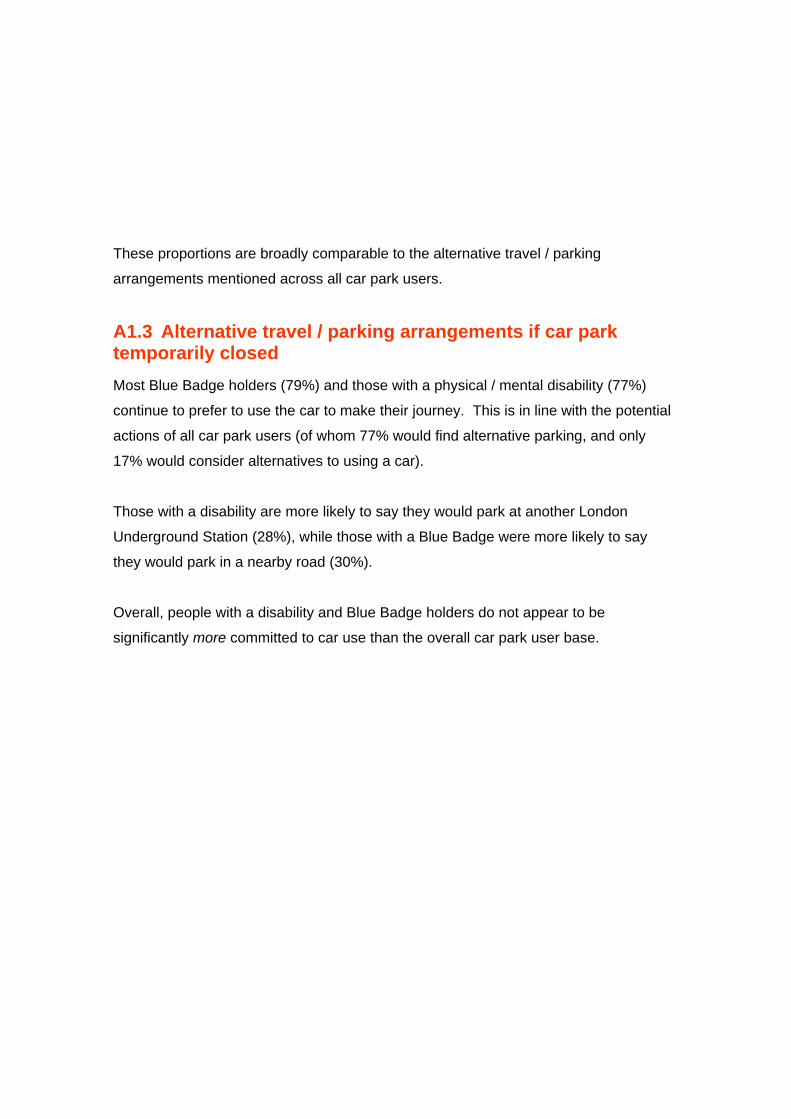
A1.3 Alternative travel / parking arrangements if car park temporarily closed Most Blue Badge holders (79%) and those with a physical / mental disability (77%)
continue to prefer to use the car to make their journey. This is in line with the potential
actions of all car park users (of whom 77% would find alternative parking, and only
17% would consider alternatives to using a car).
Those with a disability are more likely to say they would park at another London
Underground Station (28%), while those with a Blue Badge were more likely to say
they would park in a nearby road (30%).
Overall, people with a disability and Blue Badge holders do not appear to be
significantly more committed to car use than the overall car park user base.
If Car park temporarily close
Physical/mentaldisability (n=147)
Blue Badge Holder (n=70)
Park in a nearby road 24% 30%
Park at nearby car park 7% 9%
Drive / ride the whole journey 10% 11%
Get a lift to the station 3% 4%
Walk to the station 4% 3%
Cycle to the station 1% 1%
Take a bus to the station 9% 6%
Take a taxi/mini cab to the station 4% 3%
Park at another Underground station (Please specify which station)
28% 23%
Park at a National Rail station (Please specify which station)
5% 4%
Would not make the journey 5% 4%
Other (please specify) 1% -
Appendix 2 - Research details
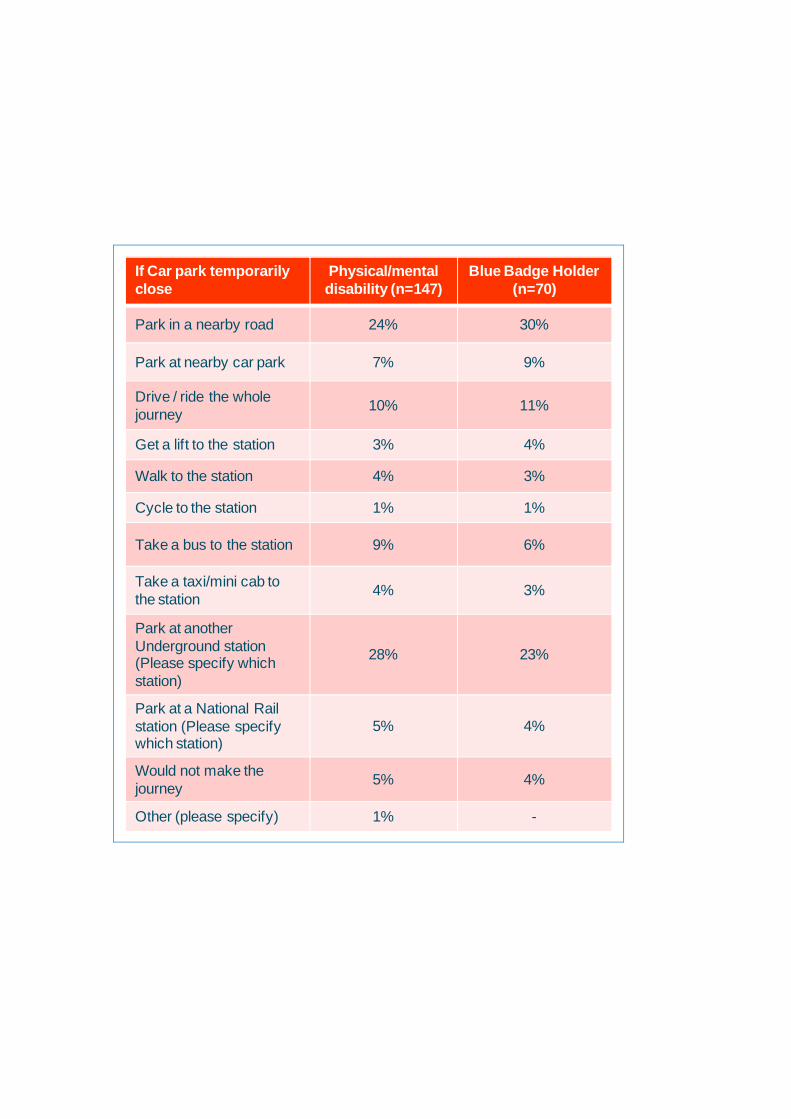
A2.1 Methodology Quantitative research was conducted at 39 selected LU car parks. This involved a
combination of three different data collection methods employed at each car park:
• face to face interviewing of car park users;
• distribution of paper questionnaires to car park users on car windscreens, for car
park users to complete in their own time and return via the post; and
• provision of an online questionnaire link (on the paper self-completion
questionnaires) for respondents to complete in their own time.
As shown in the Table below, the online method had a yield of less than 1%. The low
take up is likely to be due to people finding it more efficient to complete the
questionnaire as they carried out their journey on the Tube. The face-to-face and self-
completion method had a similar yield.
Data collection methods Total completes %
Face-to-face 1669 48%
Self -completion 1768 51%
Online 20 <1%
3457
A minimum of four shifts of face to face interviewing and two shifts of paper
questionnaire distribution were conducted at each car park. Shifts were conducted on
weekday mornings (5am to 11am), weekday afternoons / evenings (2pm to 8pm),
Saturday mornings (9am to 2pm) and Saturday afternoons / evenings (2pm to 8pm).
The sampling frame consisted of LU car park users. All car park users who parked or
picked up their vehicle during interviewing times qualified to participate in the survey.
There were no set quotas. A key advantage of providing three data collection methods
was that those who did not have time to complete the survey face-to-face could do so
in their own time. This helps to ensure that those who are more likely to be in a hurry
had their views represented in the survey.
Prior to starting fieldwork, interviewers were sent full written briefing instructions
about all aspects of the survey (see Appendix 4). At the start of each shift,
interviewers reported to the Underground station and car park security.
Interviewers were required to show a copy of the letter of authorisation from LU to
respondents who requested more information about the survey (see Appendix 4).
A2.2 Observations of car park usage Interviewers were required to conduct a count of available car parking spaces at
designated times (6am, 7am, 8am on weekday morning shifts; 5pm, 6pm and 7pm
on weekday afternoon/evening shifts; 10am, 11am 12pm on weekend morning
shifts; 3pm, 4pm and 5pm on weekend afternoon shifts). Collated data is shown in
section 5. Where more than one type of shift was conducted at a particular car
park (e.g. two weekday morning shifts), results have been averaged for each
specific time period.
A2.3 Questionnaire design The questionnaire was developed by Synovate in consultation with TfL. The
questionnaire comprised questions around journey origin, destination, purpose of
journey, alternatives used when the car park is full, perceived future behaviour if
the car park is temporarily closed, willingness to cycle and barriers to cycling. After
analysing phase 1 data the length of stay question was changed to ensure that
respondents gave more accurate information..Interviews were around five minutes in
duration. The questionnaire was consistent across the three data collection
methodologies. (See Appendix 4 for the master questionnaire).
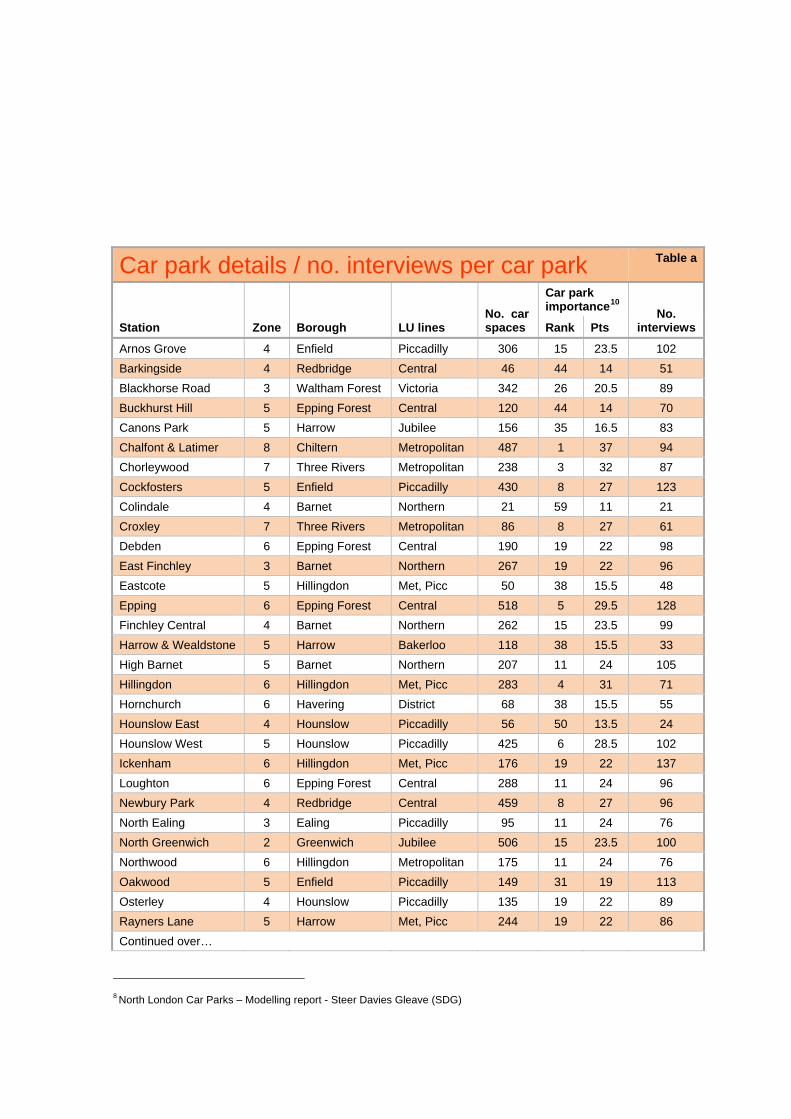
A2.4 Sample The aim was to sample as many different car park users as possible, across a range of
days and times. A total of 3,457 questionnaires were completed. The total number of
completed questionnaires for each car park is shown overleaf (see Table A). At five
stations, results were very low, preventing individual station analysis, although results
for these station car parks are included in aggregated data across groups of car parks
(also see section A3.1). Appendix 3 gives a detailed breakdown of response rates and
user profile for each car park. Buckhurst Hill has two separate car parks both of which
were covered by the interviewers. Zones 2 and 8 were not analysed separately as the
base sizes are too small.
No weighting was applied to the data; results are aimed to represent the car park users
based on the sampling.
Compared to London residents9 and to London Underground customers, the profile of
car park users is more skewed towards men, middle to older ages (35-54 in particular)
and to people of white ethnicity.
9 Based on TfL ‘Regular Research Slot’ January, April, July, October 2009: results from 4,000 interviews with a representative sample of Greater London residents (proportional across the London boroughs) aged 16+.
Car park details / no. interviews per car park Table a
Station Zone Borough LU lines No. car spaces
Car park importance10 No.
interviews Rank Pts
Arnos Grove 4 Enfield Piccadilly 306 15 23.5 102 Barkingside 4 Redbridge Central 46 44 14 51 Blackhorse Road 3 Waltham Forest Victoria 342 26 20.5 89 Buckhurst Hill 5 Epping Forest Central 120 44 14 70 Canons Park 5 Harrow Jubilee 156 35 16.5 83 Chalfont & Latimer 8 Chiltern Metropolitan 487 1 37 94 Chorleywood 7 Three Rivers Metropolitan 238 3 32 87 Cockfosters 5 Enfield Piccadilly 430 8 27 123 Colindale 4 Barnet Northern 21 59 11 21 Croxley 7 Three Rivers Metropolitan 86 8 27 61 Debden 6 Epping Forest Central 190 19 22 98 East Finchley 3 Barnet Northern 267 19 22 96 Eastcote 5 Hillingdon Met, Picc 50 38 15.5 48 Epping 6 Epping Forest Central 518 5 29.5 128 Finchley Central 4 Barnet Northern 262 15 23.5 99 Harrow & Wealdstone 5 Harrow Bakerloo 118 38 15.5 33 High Barnet 5 Barnet Northern 207 11 24 105 Hillingdon 6 Hillingdon Met, Picc 283 4 31 71 Hornchurch 6 Havering District 68 38 15.5 55 Hounslow East 4 Hounslow Piccadilly 56 50 13.5 24 Hounslow West 5 Hounslow Piccadilly 425 6 28.5 102 Ickenham 6 Hillingdon Met, Picc 176 19 22 137 Loughton 6 Epping Forest Central 288 11 24 96 Newbury Park 4 Redbridge Central 459 8 27 96 North Ealing 3 Ealing Piccadilly 95 11 24 76 North Greenwich 2 Greenwich Jubilee 506 15 23.5 100 Northwood 6 Hillingdon Metropolitan 175 11 24 76 Oakwood 5 Enfield Piccadilly 149 31 19 113 Osterley 4 Hounslow Piccadilly 135 19 22 89 Rayners Lane 5 Harrow Met, Picc 244 19 22 86 Continued over…
8 North London Car Parks – Modelling report - Steer Davies Gleave (SDG)
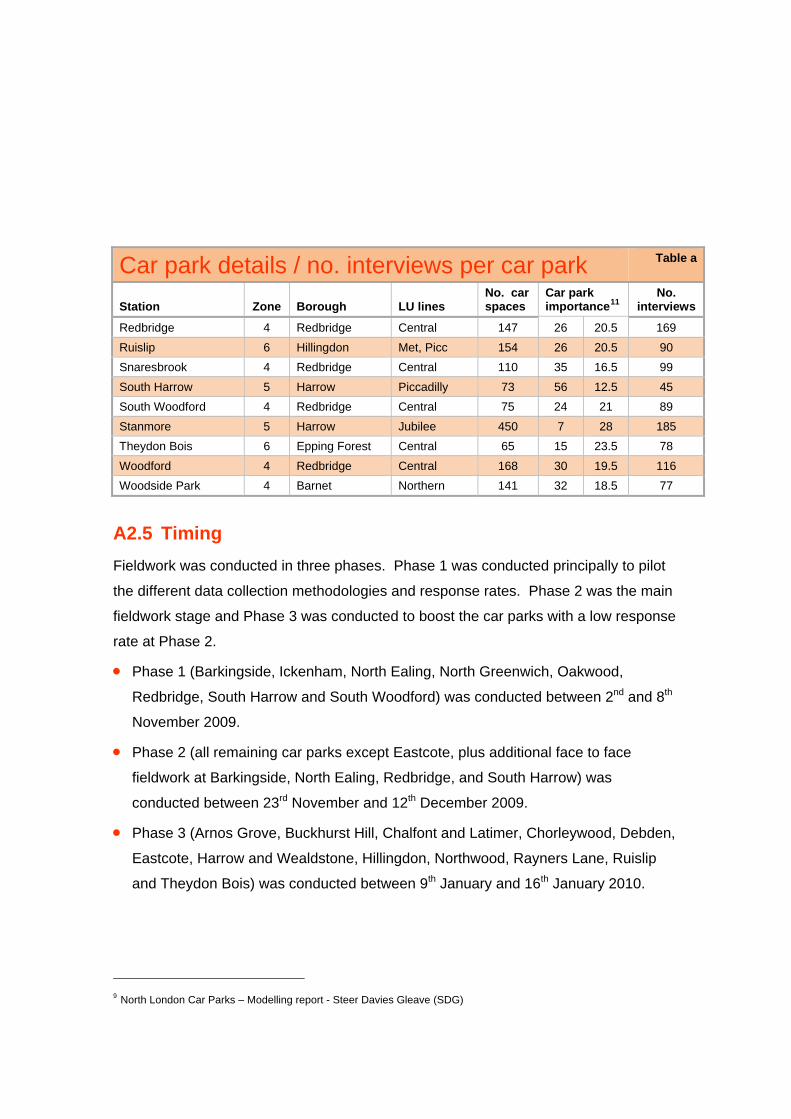
Car park details / no. interviews per car park Table a
Station Zone Borough LU lines No. car spaces
Car park importance11
No. interviews
Redbridge 4 Redbridge Central 147 26 20.5 169 Ruislip 6 Hillingdon Met, Picc 154 26 20.5 90 Snaresbrook 4 Redbridge Central 110 35 16.5 99 South Harrow 5 Harrow Piccadilly 73 56 12.5 45 South Woodford 4 Redbridge Central 75 24 21 89 Stanmore 5 Harrow Jubilee 450 7 28 185 Theydon Bois 6 Epping Forest Central 65 15 23.5 78 Woodford 4 Redbridge Central 168 30 19.5 116 Woodside Park 4 Barnet Northern 141 32 18.5 77
A2.5 Timing Fieldwork was conducted in three phases. Phase 1 was conducted principally to pilot
the different data collection methodologies and response rates. Phase 2 was the main
fieldwork stage and Phase 3 was conducted to boost the car parks with a low response
rate at Phase 2.
• Phase 1 (Barkingside, Ickenham, North Ealing, North Greenwich, Oakwood,
Redbridge, South Harrow and South Woodford) was conducted between 2nd and 8th
November 2009.
• Phase 2 (all remaining car parks except Eastcote, plus additional face to face
fieldwork at Barkingside, North Ealing, Redbridge, and South Harrow) was
conducted between 23rd November and 12th December 2009.
• Phase 3 (Arnos Grove, Buckhurst Hill, Chalfont and Latimer, Chorleywood, Debden,
Eastcote, Harrow and Wealdstone, Hillingdon, Northwood, Rayners Lane, Ruislip
and Theydon Bois) was conducted between 9th January and 16th January 2010.
9 North London Car Parks – Modelling report - Steer Davies Gleave (SDG)
A2.6 Future fieldwork considerations The following affected fieldwork procedure and strike rates.
• Weather. Fieldwork was carried out during the winter months of November,
December and January. On some days, the weather conditions were quite extreme
and this is one of the reasons why some car parks had low response rates.
• Time of year. Fieldwork was carried out in the weeks leading up to Christmas and a
few weeks after in January. The fieldwork window (specifically for weekend shifts
before Christmas) was quite narrow and did not allow for any unforeseen
eventualities.
• Royal Mail strikes (impacts of strikes in October 2009, further action in early
December 2009) and the Christmas post. These caused delays in the returns of the
self completion surveys.
• Smaller car parks. Interviewers reported that they were exhausting their sample
base as they would often encounter the same commuters, especially during the
weekdays.
• The online method yielded less than 1% of completed interviews.
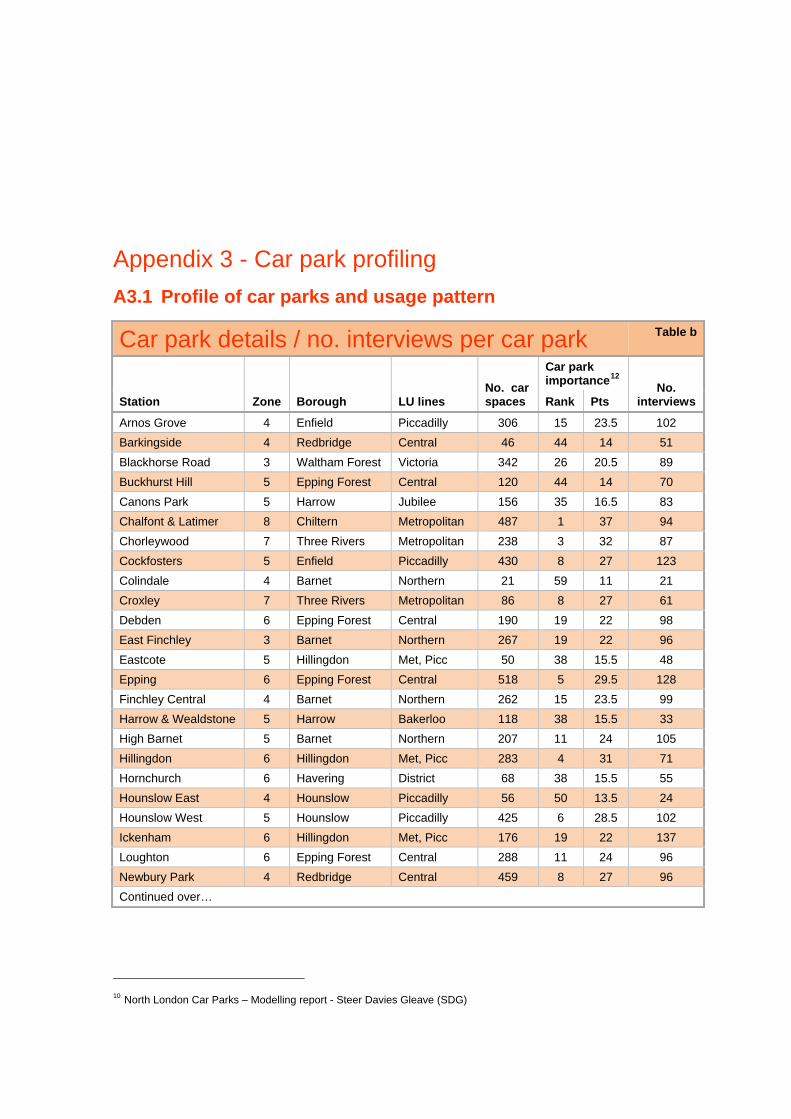
Appendix 3 - Car park profiling A3.1 Profile of car parks and usage pattern
Car park details / no. interviews per car park Table b
Station Zone Borough LU lines No. car spaces
Car park importance12 No.
interviews Rank Pts
Arnos Grove 4 Enfield Piccadilly 306 15 23.5 102 Barkingside 4 Redbridge Central 46 44 14 51 Blackhorse Road 3 Waltham Forest Victoria 342 26 20.5 89 Buckhurst Hill 5 Epping Forest Central 120 44 14 70 Canons Park 5 Harrow Jubilee 156 35 16.5 83 Chalfont & Latimer 8 Chiltern Metropolitan 487 1 37 94 Chorleywood 7 Three Rivers Metropolitan 238 3 32 87 Cockfosters 5 Enfield Piccadilly 430 8 27 123 Colindale 4 Barnet Northern 21 59 11 21 Croxley 7 Three Rivers Metropolitan 86 8 27 61 Debden 6 Epping Forest Central 190 19 22 98 East Finchley 3 Barnet Northern 267 19 22 96 Eastcote 5 Hillingdon Met, Picc 50 38 15.5 48 Epping 6 Epping Forest Central 518 5 29.5 128 Finchley Central 4 Barnet Northern 262 15 23.5 99 Harrow & Wealdstone 5 Harrow Bakerloo 118 38 15.5 33 High Barnet 5 Barnet Northern 207 11 24 105 Hillingdon 6 Hillingdon Met, Picc 283 4 31 71 Hornchurch 6 Havering District 68 38 15.5 55 Hounslow East 4 Hounslow Piccadilly 56 50 13.5 24 Hounslow West 5 Hounslow Piccadilly 425 6 28.5 102 Ickenham 6 Hillingdon Met, Picc 176 19 22 137 Loughton 6 Epping Forest Central 288 11 24 96 Newbury Park 4 Redbridge Central 459 8 27 96 Continued over…
10 North London Car Parks – Modelling report - Steer Davies Gleave (SDG)
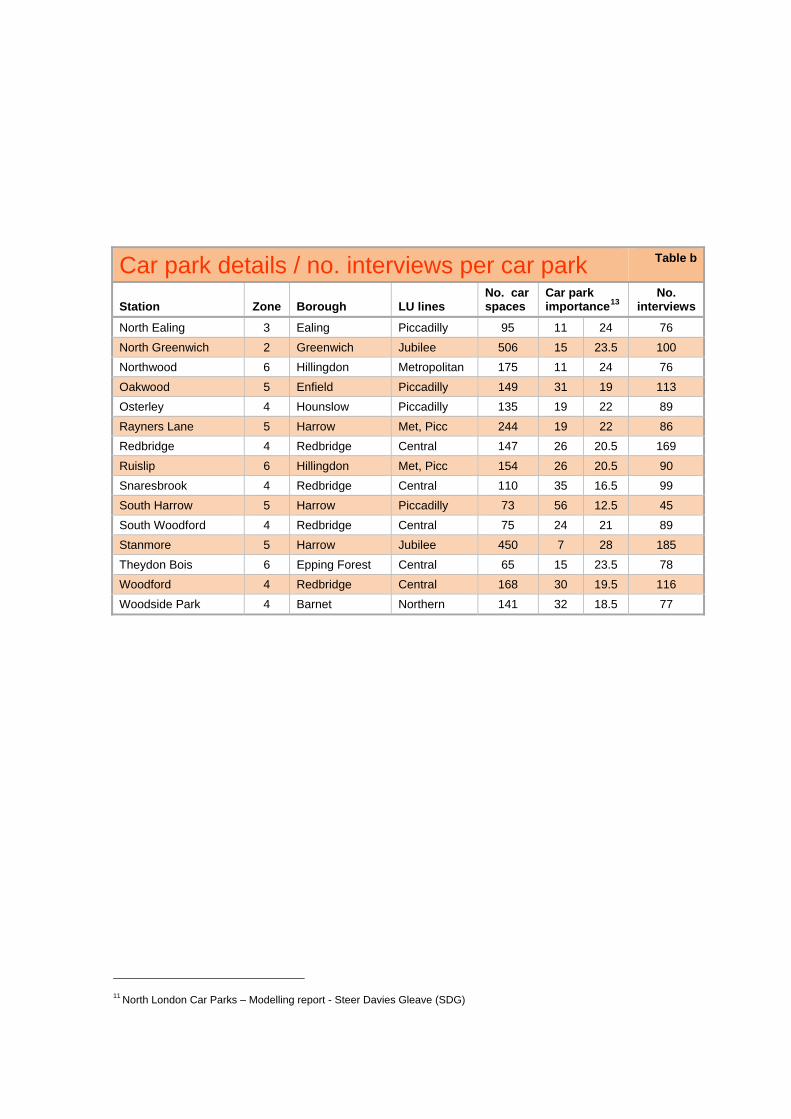
Car park details / no. interviews per car park Table b
Station Zone Borough LU lines No. car spaces
Car park importance13
No. interviews
North Ealing 3 Ealing Piccadilly 95 11 24 76 North Greenwich 2 Greenwich Jubilee 506 15 23.5 100 Northwood 6 Hillingdon Metropolitan 175 11 24 76 Oakwood 5 Enfield Piccadilly 149 31 19 113 Osterley 4 Hounslow Piccadilly 135 19 22 89 Rayners Lane 5 Harrow Met, Picc 244 19 22 86 Redbridge 4 Redbridge Central 147 26 20.5 169 Ruislip 6 Hillingdon Met, Picc 154 26 20.5 90 Snaresbrook 4 Redbridge Central 110 35 16.5 99 South Harrow 5 Harrow Piccadilly 73 56 12.5 45 South Woodford 4 Redbridge Central 75 24 21 89 Stanmore 5 Harrow Jubilee 450 7 28 185 Theydon Bois 6 Epping Forest Central 65 15 23.5 78 Woodford 4 Redbridge Central 168 30 19.5 116 Woodside Park 4 Barnet Northern 141 32 18.5 77
11 North London Car Parks – Modelling report - Steer Davies Gleave (SDG)
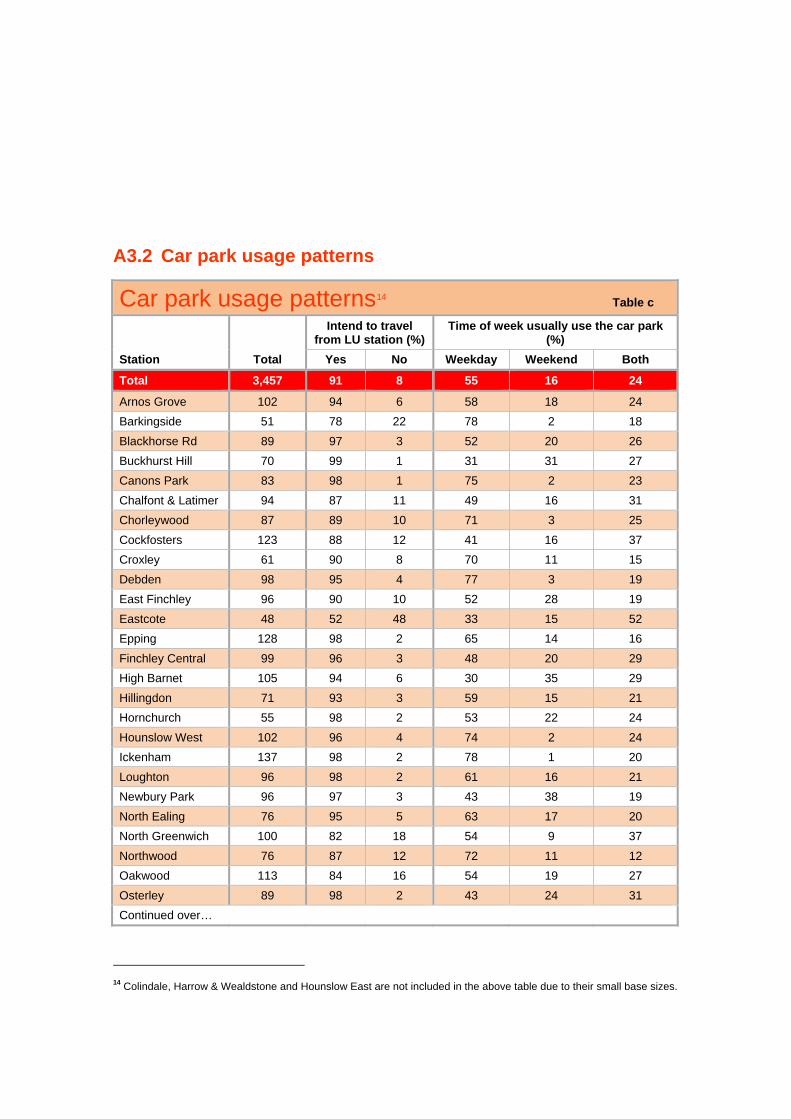
A3.2 Car park usage patterns
Car park usage patterns14 Table c
Station Total
Intend to travel from LU station (%)
Time of week usually use the car park (%)
Yes No Weekday Weekend Both
Total 3,457 91 8 55 16 24
Arnos Grove 102 94 6 58 18 24 Barkingside 51 78 22 78 2 18 Blackhorse Rd 89 97 3 52 20 26 Buckhurst Hill 70 99 1 31 31 27 Canons Park 83 98 1 75 2 23 Chalfont & Latimer 94 87 11 49 16 31 Chorleywood 87 89 10 71 3 25 Cockfosters 123 88 12 41 16 37 Croxley 61 90 8 70 11 15 Debden 98 95 4 77 3 19 East Finchley 96 90 10 52 28 19 Eastcote 48 52 48 33 15 52 Epping 128 98 2 65 14 16 Finchley Central 99 96 3 48 20 29 High Barnet 105 94 6 30 35 29 Hillingdon 71 93 3 59 15 21 Hornchurch 55 98 2 53 22 24 Hounslow West 102 96 4 74 2 24 Ickenham 137 98 2 78 1 20 Loughton 96 98 2 61 16 21 Newbury Park 96 97 3 43 38 19 North Ealing 76 95 5 63 17 20 North Greenwich 100 82 18 54 9 37 Northwood 76 87 12 72 11 12 Oakwood 113 84 16 54 19 27 Osterley 89 98 2 43 24 31 Continued over…
14 Colindale, Harrow & Wealdstone and Hounslow East are not included in the above table due to their small base sizes.
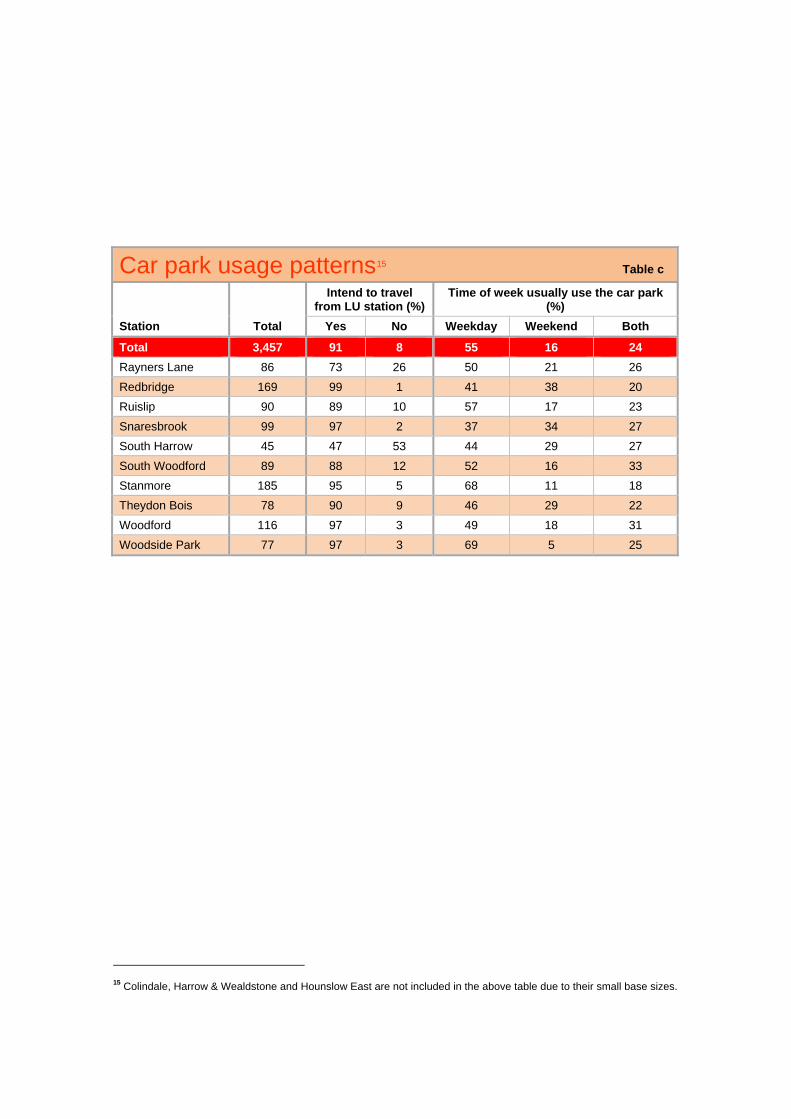
Car park usage patterns15 Table c
Station Total
Intend to travel from LU station (%)
Time of week usually use the car park (%)
Yes No Weekday Weekend Both
Total 3,457 91 8 55 16 24 Rayners Lane 86 73 26 50 21 26 Redbridge 169 99 1 41 38 20 Ruislip 90 89 10 57 17 23 Snaresbrook 99 97 2 37 34 27 South Harrow 45 47 53 44 29 27 South Woodford 89 88 12 52 16 33 Stanmore 185 95 5 68 11 18 Theydon Bois 78 90 9 46 29 22 Woodford 116 97 3 49 18 31 Woodside Park 77 97 3 69 5 25
15 Colindale, Harrow & Wealdstone and Hounslow East are not included in the above table due to their small base sizes.
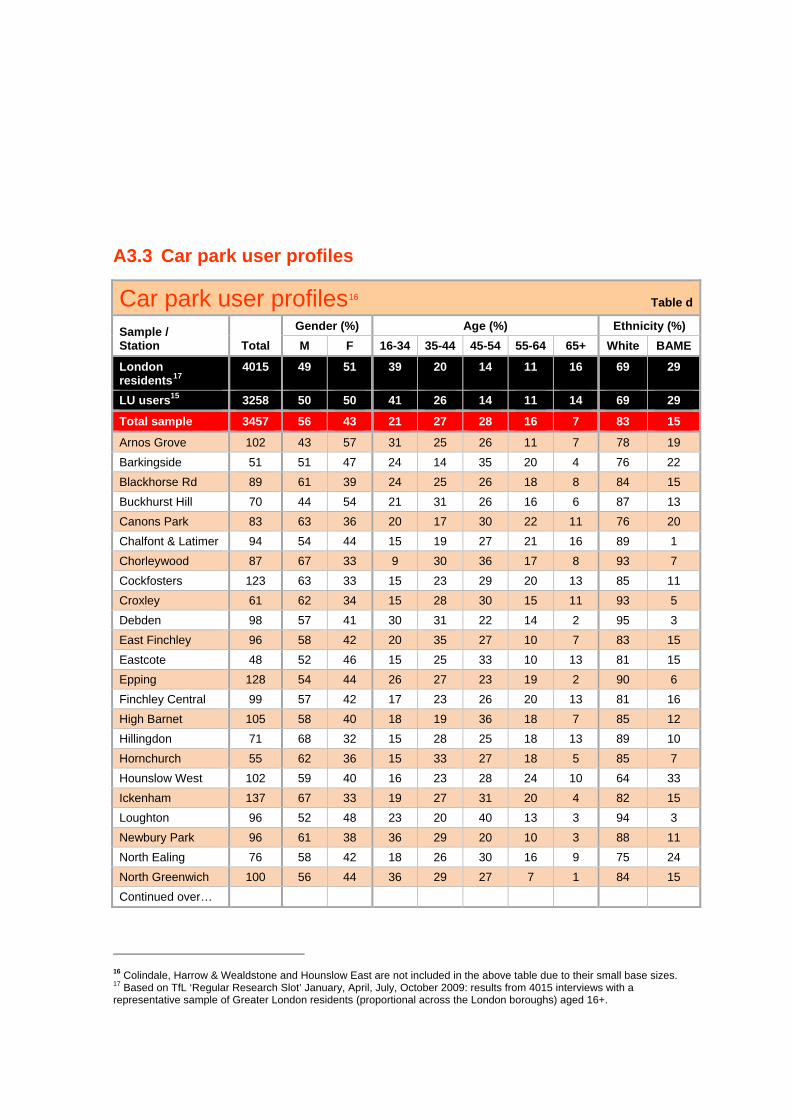
A3.3 Car park user profiles
Car park user profiles16 Table d
Sample / Station
Total
Gender (%) Age (%) Ethnicity (%) M F 16-34 35-44 45-54 55-64 65+ White BAME
London residents17
4015 49 51 39 20 14 11 16 69 29
LU users15 3258 50 50 41 26 14 11 14 69 29
Total sample 3457 56 43 21 27 28 16 7 83 15
Arnos Grove 102 43 57 31 25 26 11 7 78 19 Barkingside 51 51 47 24 14 35 20 4 76 22 Blackhorse Rd 89 61 39 24 25 26 18 8 84 15 Buckhurst Hill 70 44 54 21 31 26 16 6 87 13 Canons Park 83 63 36 20 17 30 22 11 76 20 Chalfont & Latimer 94 54 44 15 19 27 21 16 89 1 Chorleywood 87 67 33 9 30 36 17 8 93 7 Cockfosters 123 63 33 15 23 29 20 13 85 11 Croxley 61 62 34 15 28 30 15 11 93 5 Debden 98 57 41 30 31 22 14 2 95 3 East Finchley 96 58 42 20 35 27 10 7 83 15 Eastcote 48 52 46 15 25 33 10 13 81 15 Epping 128 54 44 26 27 23 19 2 90 6 Finchley Central 99 57 42 17 23 26 20 13 81 16 High Barnet 105 58 40 18 19 36 18 7 85 12 Hillingdon 71 68 32 15 28 25 18 13 89 10 Hornchurch 55 62 36 15 33 27 18 5 85 7 Hounslow West 102 59 40 16 23 28 24 10 64 33 Ickenham 137 67 33 19 27 31 20 4 82 15 Loughton 96 52 48 23 20 40 13 3 94 3 Newbury Park 96 61 38 36 29 20 10 3 88 11 North Ealing 76 58 42 18 26 30 16 9 75 24 North Greenwich 100 56 44 36 29 27 7 1 84 15 Continued over…
16 Colindale, Harrow & Wealdstone and Hounslow East are not included in the above table due to their small base sizes. 17 Based on TfL ‘Regular Research Slot’ January, April, July, October 2009: results from 4015 interviews with a representative sample of Greater London residents (proportional across the London boroughs) aged 16+.
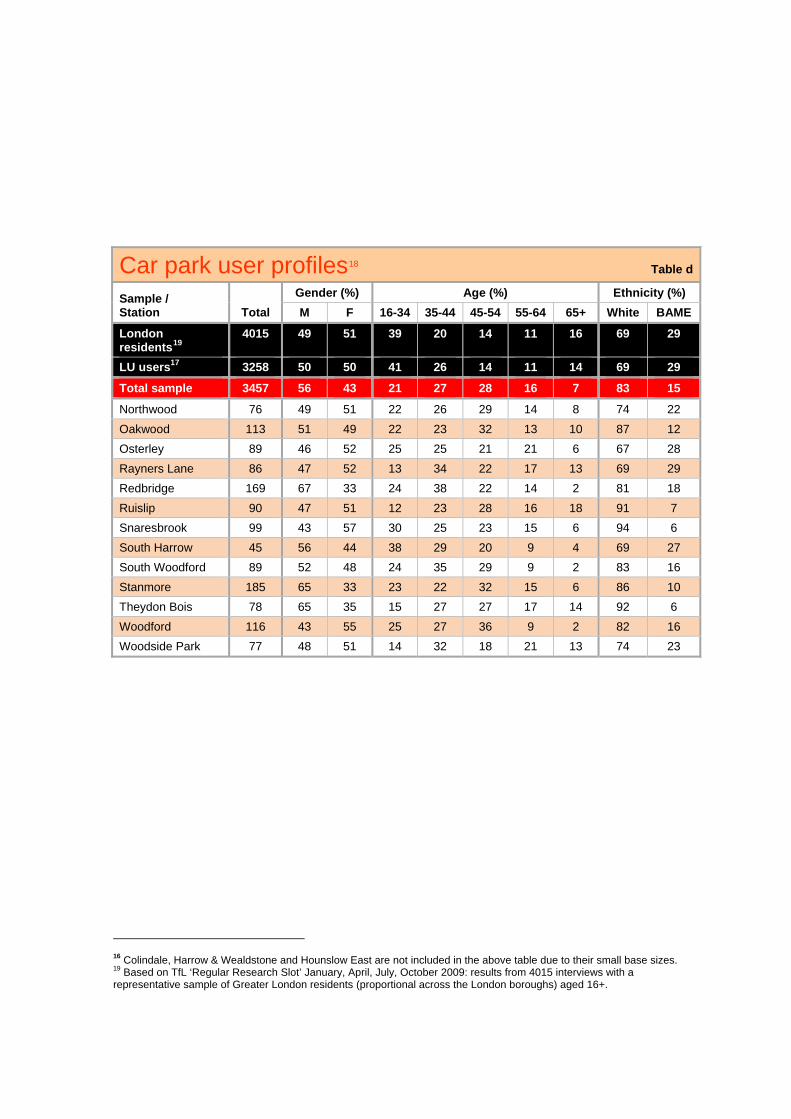
Car park user profiles18 Table d
Sample / Station
Total
Gender (%) Age (%) Ethnicity (%) M F 16-34 35-44 45-54 55-64 65+ White BAME
London residents19
4015 49 51 39 20 14 11 16 69 29
LU users17 3258 50 50 41 26 14 11 14 69 29
Total sample 3457 56 43 21 27 28 16 7 83 15
Northwood 76 49 51 22 26 29 14 8 74 22 Oakwood 113 51 49 22 23 32 13 10 87 12 Osterley 89 46 52 25 25 21 21 6 67 28 Rayners Lane 86 47 52 13 34 22 17 13 69 29 Redbridge 169 67 33 24 38 22 14 2 81 18 Ruislip 90 47 51 12 23 28 16 18 91 7 Snaresbrook 99 43 57 30 25 23 15 6 94 6 South Harrow 45 56 44 38 29 20 9 4 69 27 South Woodford 89 52 48 24 35 29 9 2 83 16 Stanmore 185 65 33 23 22 32 15 6 86 10 Theydon Bois 78 65 35 15 27 27 17 14 92 6 Woodford 116 43 55 25 27 36 9 2 82 16 Woodside Park 77 48 51 14 32 18 21 13 74 23
16 Colindale, Harrow & Wealdstone and Hounslow East are not included in the above table due to their small base sizes.
19 Based on TfL ‘Regular Research Slot’ January, April, July, October 2009: results from 4015 interviews with a representative sample of Greater London residents (proportional across the London boroughs) aged 16+.
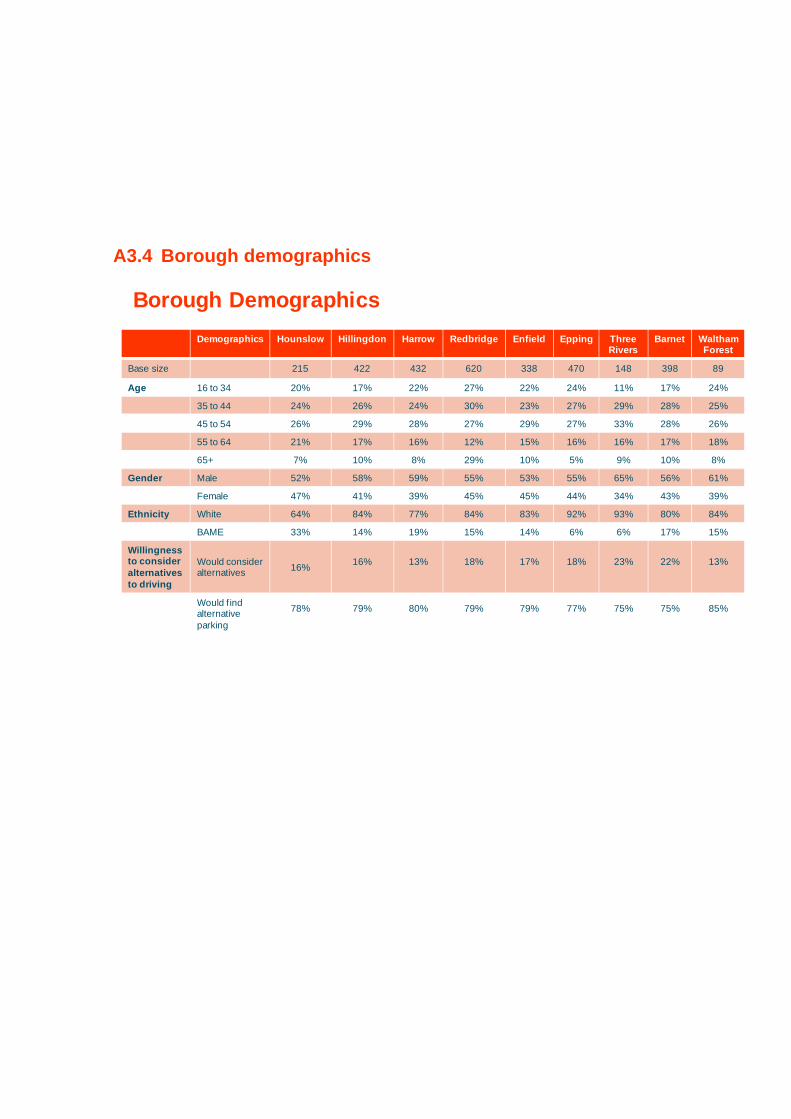
A3.4 Borough demographics
Demographics Hounslow Hillingdon Harrow Redbridge Enfield Epping Three Rivers
Barnet WalthamForest
Base size 215 422 432 620 338 470 148 398 89
Age 16 to 34 20% 17% 22% 27% 22% 24% 11% 17% 24%
35 to 44 24% 26% 24% 30% 23% 27% 29% 28% 25%
45 to 54 26% 29% 28% 27% 29% 27% 33% 28% 26%
55 to 64 21% 17% 16% 12% 15% 16% 16% 17% 18%
65+ 7% 10% 8% 29% 10% 5% 9% 10% 8%
Gender Male 52% 58% 59% 55% 53% 55% 65% 56% 61%
Female 47% 41% 39% 45% 45% 44% 34% 43% 39%
Ethnicity White 64% 84% 77% 84% 83% 92% 93% 80% 84%
BAME 33% 14% 19% 15% 14% 6% 6% 17% 15%
Willingnessto consider alternatives to driving
Would consider alternatives 16% 16% 13% 18% 17% 18% 23% 22% 13%
Would find alternative parking
78% 79% 80% 79% 79% 77% 75% 75% 85%
Borough Demographics
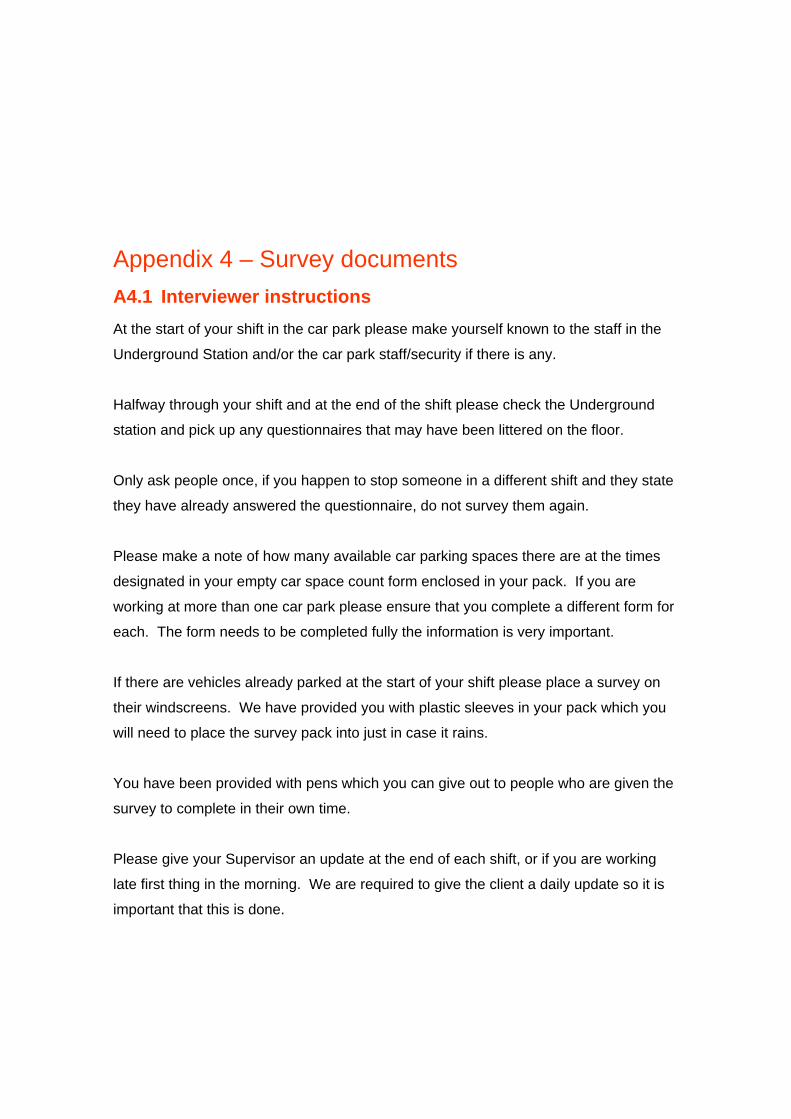
Appendix 4 – Survey documents A4.1 Interviewer instructions At the start of your shift in the car park please make yourself known to the staff in the
Underground Station and/or the car park staff/security if there is any.
Halfway through your shift and at the end of the shift please check the Underground
station and pick up any questionnaires that may have been littered on the floor.
Only ask people once, if you happen to stop someone in a different shift and they state
they have already answered the questionnaire, do not survey them again.
Please make a note of how many available car parking spaces there are at the times
designated in your empty car space count form enclosed in your pack. If you are
working at more than one car park please ensure that you complete a different form for
each. The form needs to be completed fully the information is very important.
If there are vehicles already parked at the start of your shift please place a survey on
their windscreens. We have provided you with plastic sleeves in your pack which you
will need to place the survey pack into just in case it rains.
You have been provided with pens which you can give out to people who are given the
survey to complete in their own time.
Please give your Supervisor an update at the end of each shift, or if you are working
late first thing in the morning. We are required to give the client a daily update so it is
important that this is done.

Please post your completed surveys back to the office after each shift or the next day.
Due to the Christmas season postal delays and postal strike we do not want all your
completed surveys posted back at the same time in case there are huge delays.
Please deliver the questionnaires for face-to-face shifts that are conducted between
the 9th – 12th December by hand to the Minerva House Office.
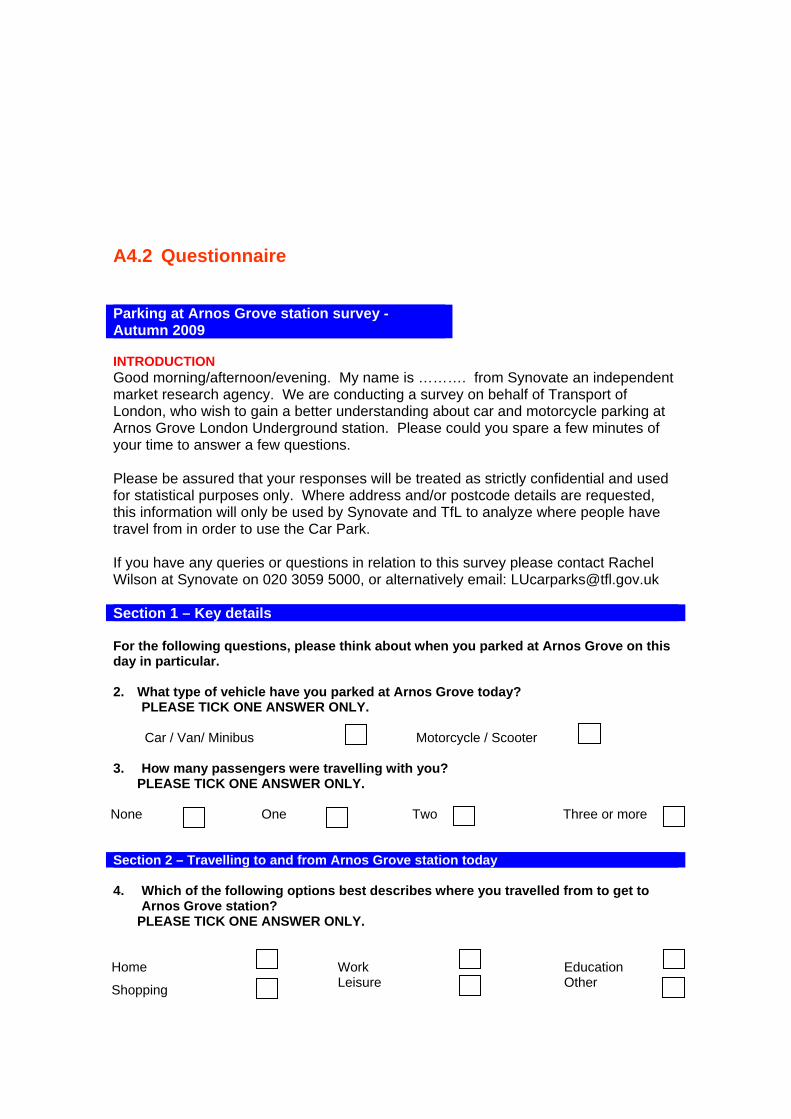
A4.2 Questionnaire Parking at Arnos Grove station survey - Autumn 2009 INTRODUCTION Good morning/afternoon/evening. My name is ………. from Synovate an independent market research agency. We are conducting a survey on behalf of Transport of London, who wish to gain a better understanding about car and motorcycle parking at Arnos Grove London Underground station. Please could you spare a few minutes of your time to answer a few questions. Please be assured that your responses will be treated as strictly confidential and used for statistical purposes only. Where address and/or postcode details are requested, this information will only be used by Synovate and TfL to analyze where people have travel from in order to use the Car Park. If you have any queries or questions in relation to this survey please contact Rachel Wilson at Synovate on 020 3059 5000, or alternatively email: [email protected] Section 1 – Key details For the following questions, please think about when you parked at Arnos Grove on this day in particular. 2. What type of vehicle have you parked at Arnos Grove today?
PLEASE TICK ONE ANSWER ONLY. Car / Van/ Minibus Motorcycle / Scooter 3. How many passengers were travelling with you?
PLEASE TICK ONE ANSWER ONLY.
None One Two Three or more Section 2 – Travelling to and from Arnos Grove station today 4. Which of the following options best describes where you travelled from to get to
Arnos Grove station? PLEASE TICK ONE ANSWER ONLY.
Home Work Education
Shopping Leisure Other
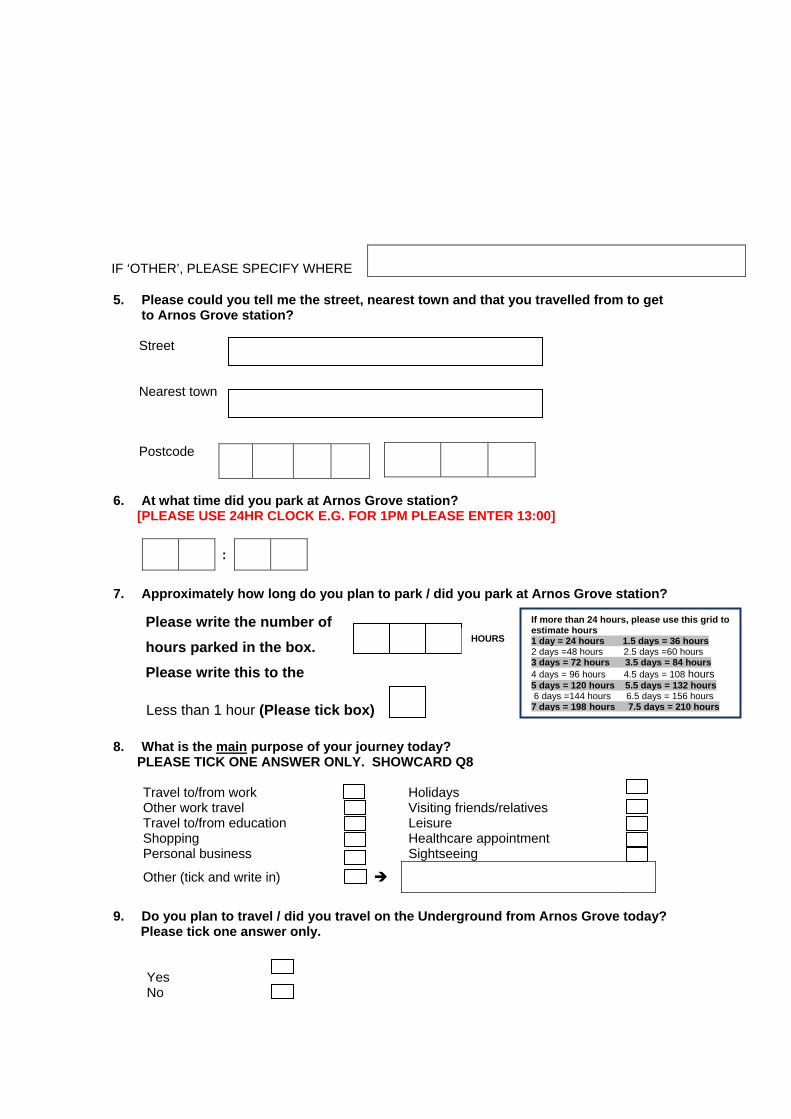
IF ‘OTHER’, PLEASE SPECIFY WHERE
5. Please could you tell me the street, nearest town and that you travelled from to get
to Arnos Grove station? Street Nearest town
Postcode
6. At what time did you park at Arnos Grove station? [PLEASE USE 24HR CLOCK E.G. FOR 1PM PLEASE ENTER 13:00]
:
7. Approximately how long do you plan to park / did you park at Arnos Grove station?
8. What is the main purpose of your journey today? PLEASE TICK ONE ANSWER ONLY. SHOWCARD Q8
Travel to/from work Holidays Other work travel Visiting friends/relatives Travel to/from education Leisure Shopping Healthcare appointment Personal business Sightseeing
Other (tick and write in)
9. Do you plan to travel / did you travel on the Underground from Arnos Grove today?
Please tick one answer only. Yes No
If more than 24 hours, please use this grid to estimate hours 1 day = 24 hours 1.5 days = 36 hours 2 days =48 hours 2.5 days =60 hours 3 days = 72 hours 3.5 days = 84 hours 4 days = 96 hours 4.5 days = 108 hours 5 days = 120 hours 5.5 days = 132 hours 6 days =144 hours 6.5 days = 156 hours 7 days = 198 hours 7.5 days = 210 hours
Please write the number of hours parked in the box. Please write this to the
Less than 1 hour (Please tick box)
HOURS
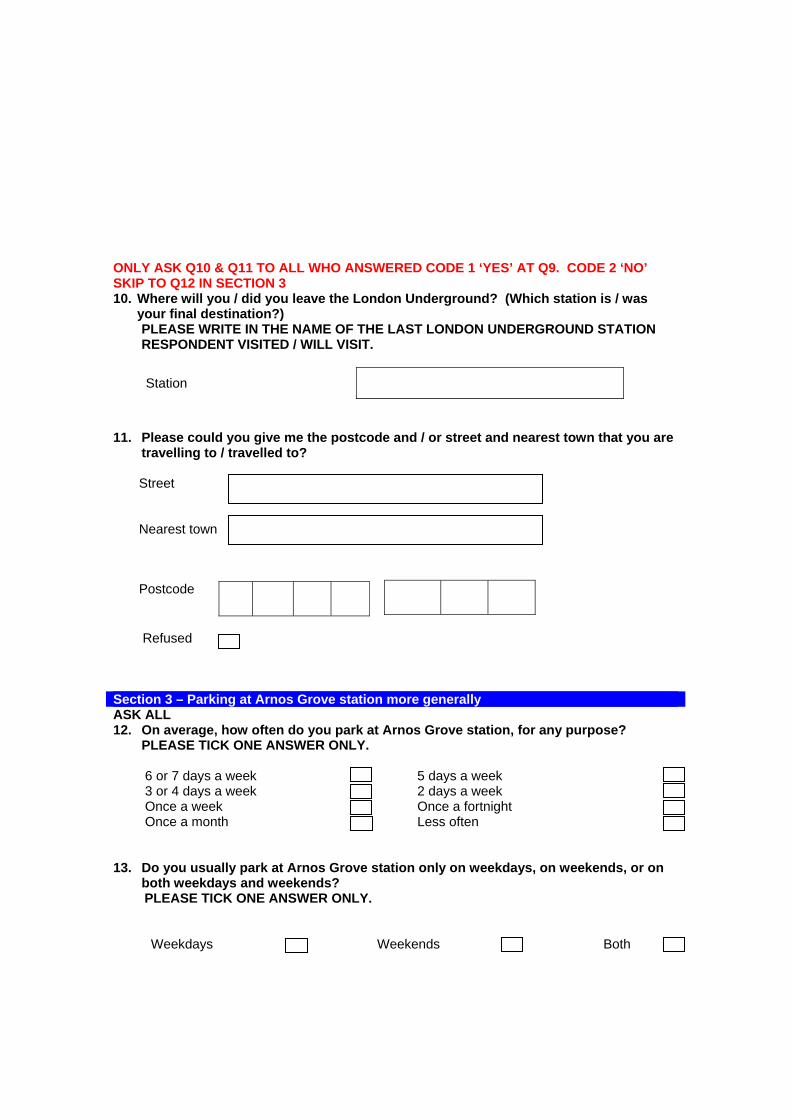
ONLY ASK Q10 & Q11 TO ALL WHO ANSWERED CODE 1 ‘YES’ AT Q9. CODE 2 ‘NO’ SKIP TO Q12 IN SECTION 3 10. Where will you / did you leave the London Underground? (Which station is / was
your final destination?) PLEASE WRITE IN THE NAME OF THE LAST LONDON UNDERGROUND STATION RESPONDENT VISITED / WILL VISIT.
Station
11. Please could you give me the postcode and / or street and nearest town that you are
travelling to / travelled to? Street Nearest town
Postcode
Refused Section 3 – Parking at Arnos Grove station more generally ASK ALL 12. On average, how often do you park at Arnos Grove station, for any purpose?
PLEASE TICK ONE ANSWER ONLY.
6 or 7 days a week 5 days a week 3 or 4 days a week 2 days a week Once a week Once a fortnight Once a month Less often 13. Do you usually park at Arnos Grove station only on weekdays, on weekends, or on
both weekdays and weekends? PLEASE TICK ONE ANSWER ONLY.
Weekdays Weekends Both
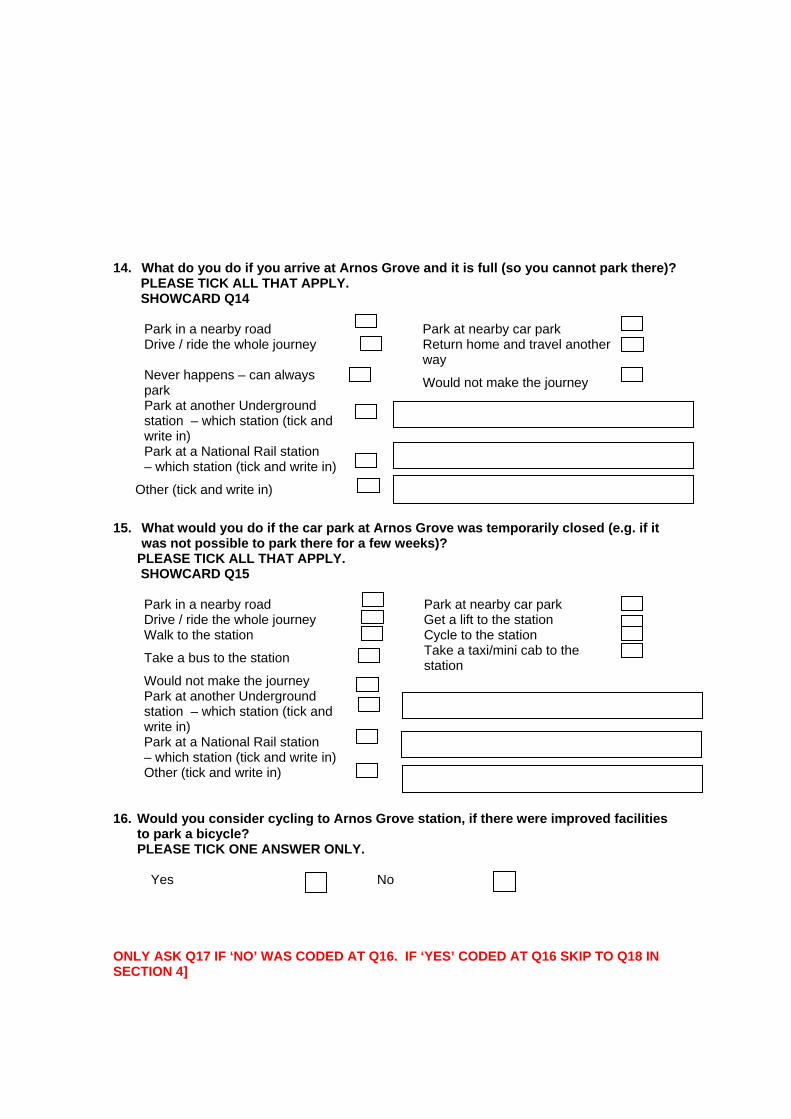
14. What do you do if you arrive at Arnos Grove and it is full (so you cannot park there)?
PLEASE TICK ALL THAT APPLY. SHOWCARD Q14
Park in a nearby road Park at nearby car park
Drive / ride the whole journey Return home and travel another way
Never happens – can always park Would not make the journey
Park at another Underground station – which station (tick and write in)
Park at a National Rail station – which station (tick and write in)
Other (tick and write in)
15. What would you do if the car park at Arnos Grove was temporarily closed (e.g. if it
was not possible to park there for a few weeks)? PLEASE TICK ALL THAT APPLY. SHOWCARD Q15
Park in a nearby road Park at nearby car park Drive / ride the whole journey Get a lift to the station Walk to the station Cycle to the station
Take a bus to the station Take a taxi/mini cab to the station
Would not make the journey
Park at another Underground station – which station (tick and write in)
Park at a National Rail station – which station (tick and write in)
Other (tick and write in) 16. Would you consider cycling to Arnos Grove station, if there were improved facilities
to park a bicycle? PLEASE TICK ONE ANSWER ONLY.
Yes No ONLY ASK Q17 IF ‘NO’ WAS CODED AT Q16. IF ‘YES’ CODED AT Q16 SKIP TO Q18 IN SECTION 4]
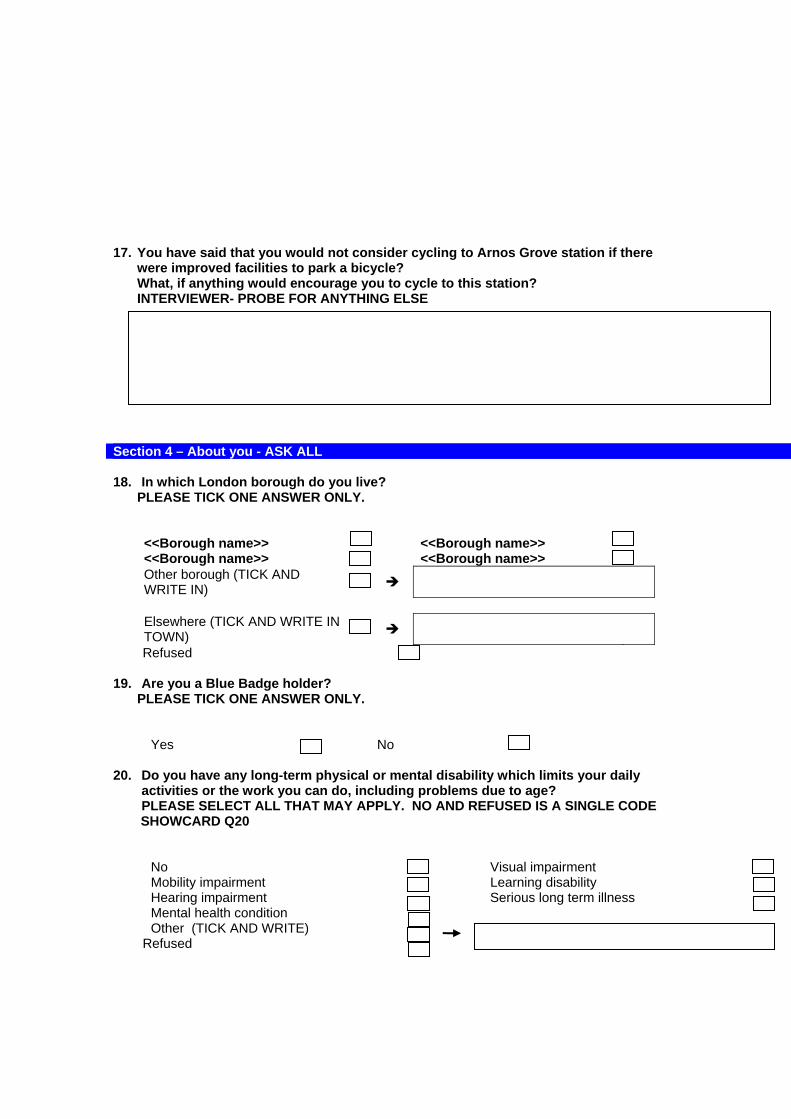
17. You have said that you would not consider cycling to Arnos Grove station if there were improved facilities to park a bicycle? What, if anything would encourage you to cycle to this station? INTERVIEWER- PROBE FOR ANYTHING ELSE
Section 4 – About you - ASK ALL
18. In which London borough do you live?
PLEASE TICK ONE ANSWER ONLY. <<Borough name>> <<Borough name>> <<Borough name>> <<Borough name>>
Other borough (TICK AND WRITE IN)
Elsewhere (TICK AND WRITE IN TOWN)
Refused
19. Are you a Blue Badge holder? PLEASE TICK ONE ANSWER ONLY.
Yes No
20. Do you have any long-term physical or mental disability which limits your daily activities or the work you can do, including problems due to age? PLEASE SELECT ALL THAT MAY APPLY. NO AND REFUSED IS A SINGLE CODE
SHOWCARD Q20 No Visual impairment Mobility impairment Learning disability Hearing impairment Serious long term illness Mental health condition Other (TICK AND WRITE) Refused
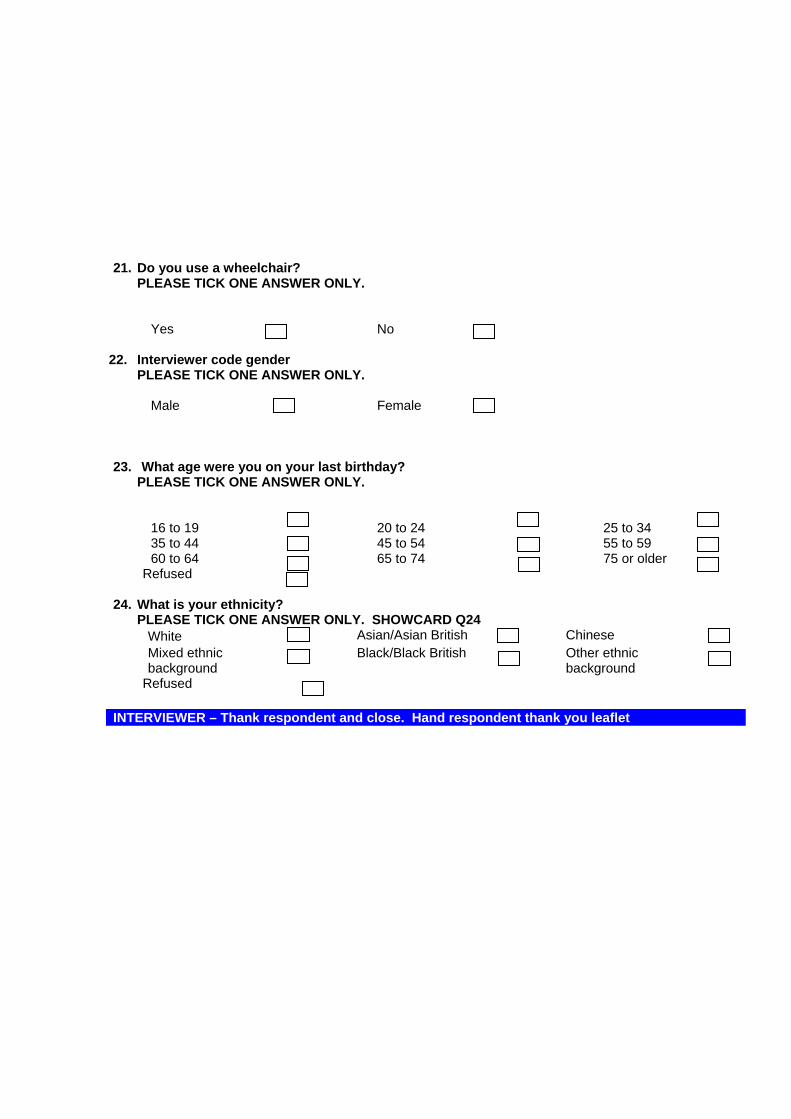
21. Do you use a wheelchair?
PLEASE TICK ONE ANSWER ONLY. Yes No
22. Interviewer code gender PLEASE TICK ONE ANSWER ONLY.
Male Female
23. What age were you on your last birthday? PLEASE TICK ONE ANSWER ONLY.
16 to 19 20 to 24 25 to 34 35 to 44 45 to 54 55 to 59 60 to 64 65 to 74 75 or older Refused 24. What is your ethnicity?
PLEASE TICK ONE ANSWER ONLY. SHOWCARD Q24 White Asian/Asian British Chinese
Mixed ethnic background
Black/Black British Other ethnic background
Refused INTERVIEWER – Thank respondent and close. Hand respondent thank you leaflet