Embed Size (px)
Citation preview

This is a repository copy of Car Fuel Consumption in Urban Traffic. The Results of a Survey in Leeds using Instrumented Vehicles..
White Rose Research Online URL for this paper:http://eprints.whiterose.ac.uk/2376/
Monograph:Ferreira, L.J.A. (1982) Car Fuel Consumption in Urban Traffic. The Results of a Survey in Leeds using Instrumented Vehicles. Working Paper. Institute of Transport Studies, University of Leeds , Leeds, UK.
Working Paper 162
[email protected]://eprints.whiterose.ac.uk/
Reuse Unless indicated otherwise, fulltext items are protected by copyright with all rights reserved. The copyright exception in section 29 of the Copyright, Designs and Patents Act 1988 allows the making of a single copy solely for the purpose of non-commercial research or private study within the limits of fair dealing. The publisher or other rights-holder may allow further reproduction and re-use of this version - refer to the White Rose Research Online record for this item. Where records identify the publisher as the copyright holder, users can verify any specific terms of use on the publisher’s website.
Takedown If you consider content in White Rose Research Online to be in breach of UK law, please notify us by emailing [email protected] including the URL of the record and the reason for the withdrawal request.

White Rose Research Online
http://eprints.whiterose.ac.uk/
Institute of Transport StudiesUniversity of Leeds
This is an ITS Working Paper produced and published by the University of Leeds. ITS Working Papers are intended to provide information and encourage discussion on a topic in advance of formal publication. They represent only the views of the authors, and do not necessarily reflect the views or approval of the sponsors. White Rose Repository URL for this paper: http://eprints.whiterose.ac.uk/2376/
Published paper Ferreira, L.J.A. (1982) Car Fuel Consumption in Urban Traffic. The Results of a Survey in Leeds using Instrumented Vehicles. Institute of Transport Studies, University of Leeds, Working Paper 162
White Rose Consortium ePrints Repository [email protected]

Working Paper 162
December 1982
CAR FUEL CONSUMPTION IN URBAN TRAFFIC.
THE RESULTS OF A.SURVEY I N LEEDS USING
INSTRUMENTED VEHICLES.
L.J.A. FERREIRA
Working Papers are intended to provide information and encourage discussion on a topic in advmce of formal publication. They represent on2y the views of the author and do not necessarizy reflect the view or approvaZ of the sponsors.
This work was sponsored by the Science and Engineering Research Counci 2.

L.J.A. FERREIRA Car f u e l consumption i n urban t r a f f i c . The r e s u l t s of a survey i n Leeds us ing instrumented veh ic les . Working Paper 162. I n s t i t u t e f o r Transport Studies, U n i v e r s i t y of Leeds, Leeds LS2 9JT
A B S T R A C T
The work repor ted here was p a r t of a research p r o j e c t sponsored
by the Science and Engineering Research Counci l t o i n v e s t i g a t e t h e
impact of t r a f f i c management schemes on f u e l consumption.
The r e p o r t can be d i v ided convenient ly i n t o two par ts . I n
p a r t I, the f u e l consumed by a veh ic le du r ing each stage o f an urban
t r i p i s analysed by drawing on t h e r e s u l t s of past s tud ies as w e l l as
t h e r e s u l t s obtained by t h e author f o r a recent survey i n Leeds us ing
two instrumented cars suppl ied by t h e Transport and Road Research
Laboratory. An equat ion i s der ived which r e l a t e s t h e f u e l consumed
dur ing a s top /s ta r t manoeuvre t o t h e c h a r a c t e r i s t i c s o f t h a t manoeuvre.
Par t I1 deals w i t h t h e development of two types o f urban f u e l
consumption models, namely a simple fuel/speed r e l a t i o n s h i p , and a more
d e t a i l e d expression f o r use w i t h the t r a f f i c simulation/assignment
model SATURN, which i nc ludes t h e number of stops and d i s t i ngu i shes
between f i r s t t ime stops and those made as veh ic les move up queues.

CONTENTS
1. INTRODUCTION
Page - 1
PART I - URBAN TRIP FUEL CONSUMPTION
2. INTRODUCTION
3. IDLE FUEL FLOW RATE
4. FUEL CONSUMPTION AT CONSTANT SPEED 5
5. FUEL CONSUMPTION OF STOP/START MANOEUVRES - THE LEEDS SURVEY 6
5.1 C h a r a c t e r i s t i c s o f s t o p s 6
5.2 F u e l consumed d e c e l e r a t i n g €3
5.3 F u e l consumed a c c e l e r a t i n g 1 6
5.4 Excess f u e l due t o c o m p l e t e s t o p / s t a r t manoeuvre 20
5.5 Excess f u e l due t o two t y p e s of s t o p / s t a r t manoeuvres 22
6. THE EFFECT OF COLD STARTS 24
7. SUMMARY AND DISCUSSION
7.1 I d l i n g f u e l consumpt ion
7.2 Constant -speed f u e l consumpt ion
7.3 F u e l consumpt ion o f s t o p / s t a r t manoeuvres
PART I1 - URBAN FUEL CONSUMPTION SUB-MODELS
8. INTROOUCTION
9. THE 'AVERAGE SPEED' SUB-MODEL
9.1 R e s u l t s f r o m U.K. S t u d i e s
9.2 Overseas f i n d i n g s
9.3 R e s u l t s f r o m t h e Leeds Survey
9.4 A f u e l consumption-'sub-model f o r t h e U.K.

10. A MORE DETAILED FUEL CONSUMPTION SUB-MODEL
10 .1 G e n e r a l
10.2 The SATURN f u e l c o n s u m p t i o n sub-mode l
Page - 4 2
4 2
50
11. A COMPARISON OF SUB-MODELS USING SATURN OUTPUT DATA 5 1
12. SUMMARY AND OISCUSSION 53
REFERENCES
APPENDIX A THE LEEOS FUEL CONSUMPTION SURVEY USING INSTRUMENTEO VEHICLES

ACKNOWLEDGEMENTS
The au thor would l i k e t o thank the fo l low ing :
The Science and Engineer ing Research Counci l f o r f i n a n c i a l support ;.
Professor A.D. May and Dr. D. van V l i e t f o r t h e i r he lp and advice throughout t h e p ro jec t :
Dr. Dennis Robertson and h i s s taf f a t t h e Urban Networks D i v i s i o n o f t h e Transpor t and Road Research Laboratory f o r t h e i r he lp w i t h t h e Leeds Survey us ing instrumented vehic les:
Mrs. P a t r i c i a H o l l i c k f o r her exper t he lp w i t h t h e typ ing :
Mrs. J u d i t h E l l i s o n f o r her very ab le t e c h n i c a l ass is tance.

CAR FUEL CONSUMPTION I N URBAN TRAFFIC.
THE RESULTS OF A SURVEY I N LEEDS
USING INSTRUMENTED VEHICLES.
1. INTRODUCTION
Th is r e p o r t deals w i t h t h e development o f urban f u e l consumption
es t imat ion procedures t o be used i n con junc t ion w i t h convent ional
t r a f f i c assignment models o r more d e t a i l e d models f o r t r a f f i c
management eva lua t ion . The work repor ted here was undertaken as p a r t
of a S.E.R.C. sponsored p r o j e c t dea l ing w i t h t h e q u a n t i f i c a t i o n of t h e
f u e l consumption impacts o f urban t ranspor t management measures. The
repo r t can be conven ien t ly d i v ided i n t o two pa r t s .
Par t I deals w i t h t h e f u e l consumed by cars f o r each element o f
an urban t r i p , and draws on t h e r e s u l t s of a recent survey conducted
i n Leeds w i t h two instrumented veh ic les suppl ied by t h e T.R.R.L. A
desc r ip t i on o f t h e vehic les* , t h e tes t - runs undertaken, and t h e raw
output data obtained, i s g iven i n Appendix A.
Par t I1 deals w i t h t h e d e r i v a t i o n o f two types o f f u e l consumption
sub-model, namely, s imple 'average speed' r e l a t i o n s h i p and a more
d e t a i l e d f u n c t i o n which takes i n t o account the t o t a l delay and number
o f stops. A t t h i s stage, t h e f u e l consumption sub-model incorporated
i n t o the SATURN t r a f f i c s imu la t i on and assignment model i s a l s o
described.
PART I - URBAN TRIP FUEL CONSUMPTION
2. INTRODUCTION
The average engine capac i ty o f the U.K. passenger car f l e e t i s i n
the reg ion o f 1500 cc and i n t h e f u e l consumption ana lys i s t h a t fo l lows
such an engine s i z e w i l l be used, whenever possib le, t o est imate f u e l
consumption c h a r a c t e r i s t i c s o f the ' t y p i c a l ' vehic le.
. . . ... ... . . . ... ... ... . . . ... . . . .. . ... * The veh ic les a r e bo th Ford Cort ina, 2.0 GL, 1982 models w i t h
automatic transmission-.and 1993 c.c. engine.

S e c t i o n 3 d e a l s w i t h t h e f u e l consumed when t h e v e h i c l e i s
s t a t i o n a r y and t h e e n g i n e i s i d l i n g . I n S e c t i o n 4, t h e f u e l consumpt ion
o f a v e h i c l e t r a v e l l i n g a t a c o n s t a n t speed i s a n a l y s e d , and S e c t i o n 5
d e a l s w i t h t h e f u e l consumed d u r i n g a s t o p / s t a r t manoeuvre. i .e. when
a v e h i c l e d e c e l e r a t e s f r om an i n i t i a l s t e a d y speed t o z e r o speed and t h e n
a c c e l e r a t e s up t o a f i n a l s t e a d y speed . When a t r i p s t a r t s w i t h t h e
e n g i n e c o l d , a f u e l consumpt ion p e n a l t y i s i n c u r r e d and t h e q u a n t i f i c a t i o n
o f t h a t e x c e s s f u e l d u e t o c o l d s t a r t s i s t h e s u b j e c t of S e c t i o n 6 and a
summary o f t h e main results i s g i v e n i n S e c t i o n 7.
3 . IDLE FUEL FLOW RATE
S i n c e t h e f u e l consumed when t h e v e h i c l e i s i d l i n g i s i n d e p e n d e n t
o f r oad c o n d i t i o n s and d r i v i n g behav iou r , t h e t a s k of f i n d i n g a
r e p r e s e n t a t i v e v a l u e s h o u l d be s t r a i g h t f o r w a r d . However, even f o r t h e
same v e h i c l e t h e r e i s c o n s i d e r a b l e v a r i a t i o n i n i d l i n g f u e l consumpt ion
depend ing on a number o f v e h i c l e r e l a t e d v a r i a b l e s s u c h as i d l i n g speed ,
combus t ion e f f i c i e n c y , i g n i t i o n t i m i n g and e n g i n e t e m p e r a t u r e . The
v e h i c l e a g e w i l l t h e r e f o r e a f f e c t i ts i d l i n g f u e l f l o w r a t e and a l t h o u g h
no e v i d e n c e h a s been o b t a i n e d on t h i s e f f e c t , it i s r e a s o n a b l e t o assume
t h a t such r a t e s w i l l i n c r e a s e w i t h v e h i c l e age .
The i d l i n g f ue l consumed by t h e v e h i c a e s i n t h e Leeds e x p e r i m e n t
was r e c o r d e d f o r a t o t a l o f 1 5 8 s t o p s . A s can be s e e n f r om F i g u r e 1
t h i s i d l i n g fue l f l o w ra te was obse rved t o v a r y c o n s i d e r a b l y f o r s t o p s
o f s h o r t d u r a t i o n . Such v a r i a t i o n can be a t t r i b u t a b l e t o two main
c a u s e s :
1 1 Measurement e r r o r a s s o c i a t e d w i t h v e r y s h o r t s t o p s ( i .e . t h e
fue l consumed d u r i n g a s t o p of o n l y a few s e c o n d s may n o t be
r e c o r d e d a c c u r a t e l y d u r i n g t h a t time p e r i o d ; some may b e
r e c o r d e d j u s t b e f o r e a n d / o r j u s t a f t e r t h e s t o p d u r a t i o n l ; and
21 The fue l consumed by a n e n g i n e i d l i n g f o r a s h o r t p e r i o d w i l l
f l u c t u a t e u n t i l s t e a d y c o n d i t i o n s a r e o b t a i n e d .
T a b l e 1 shows t h e mean and s t a n d a r d d e r i v a t i o n o f f u e l f l o w r a t e
f o r two sets o f d a t a , namely , a l l s t o p s and s t o p s of 20 s e c o n d s d u r a t i o n
o r more. I n t h e l a t t e r c a s e a mean f u e l f l o w r a t e o f 1.3 l / h r . was
found .

FIGUm 1 INS- CARS - LEHlS RUNS
IDLE FUEL RATE
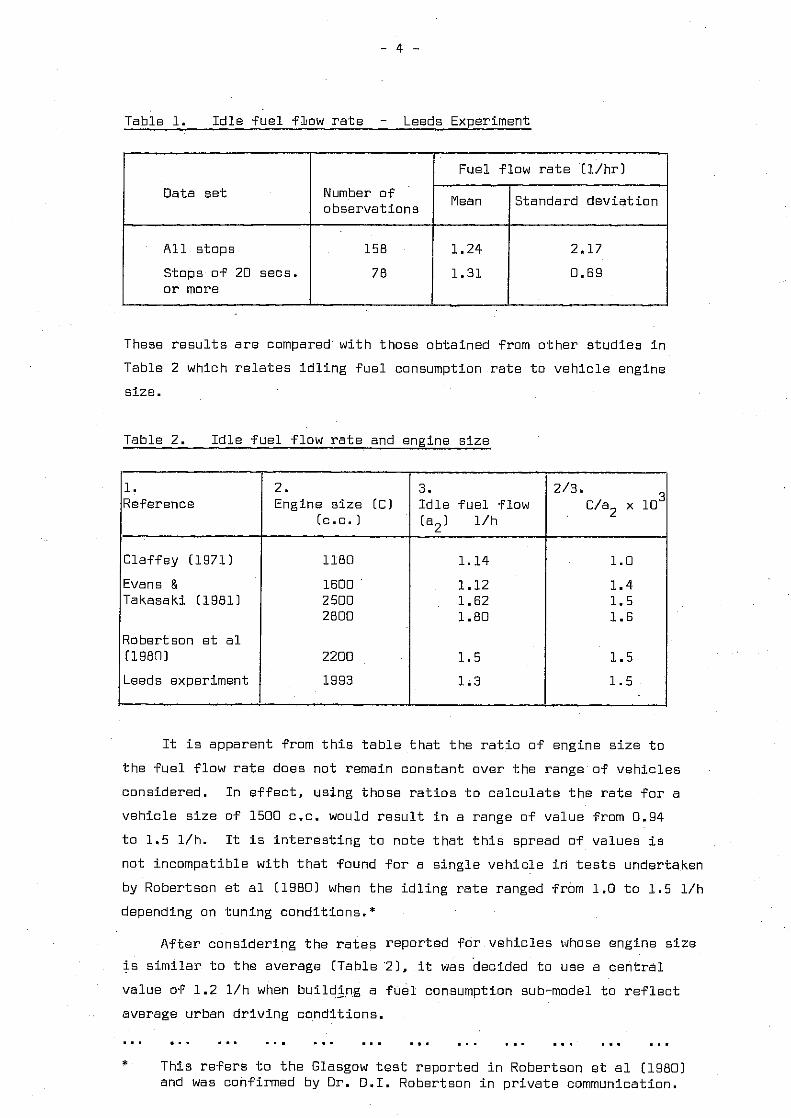
Table 1. I d l e f u e l f low r a t e - Leeds Experiment
These r e s u l t s a r e compared w i t h those obtained from o the r s tud ies i n
Table 2 which r e l a t e s i d l i n g f u e l consumption r a t e t o veh ic le engine
s ize .
Oata s e t
A l l s tops
Stops of 20 secs. o r more
Table 2. I d l e f u e l f low r a t e and engine s i z e
Number of observat ions
158
7 8
It is apparent from t h i s t a b l e t h a t t he r a t i o of engine s i z e t o
the f u e l f low r a t e does not remain constant over the range of veh ic les
considered. I n e f f e c t , using those r a t i o s t o c a l c u l a t e t h e r a t e f o r a
vehic le s i z e of 1500 c.c. would r e s u l t i n a range of value from 0.94
t o 1.5 l / h . It i s i n t e r e s t i n g t o note t h a t t h i s spread of va lues i s
not incompatible with t h a t found f o r a s i n g l e veh ic le i n t e s t s undertaken
by Robertson e t a 1 [19801 when the i d l i n g r a t e ranged from 1.0 t o 1 . 5 l / h
depending on tuning condi t ions.*
1. Reference
Claffey (19711
Evans E Takasaki [19811
Robertson e t a1 (19801
Leeds experiment
Af ter consider ing t h e r a t e s repor ted f o r veh ic les whose engine s i z e
i s s im i la r t o t h e average [Table 21, it was decided t o use a c e n t r a l
value of 1.2 l / h when bui ld jng a f u e l consumption sub-model t o r e f l e c t
average urban d r i v ing condi t ions.
Fuel flow r a t e ( l / h r l
. . . ... ... ... ... ... . . . ... ... ... ... . . . * T h i s r e f e r s t o t h e Glasgow t e s t reported i n Robertson e t a 1 (19801
and was confirmed by O r . 0.1. Robertson i n pr i va te communication.
Mean
1.24
1.31
2. Engine s i z e [Cl
[c.c. 1
1180
1600 2500 2800
2200
1993
Standard deviat ion
2.17
0.69
3. I d l e f u e l flow [a2] l / h
1.14
1.12 1.62 1.80
1.5
1.3
2/3. C/a2 x 10
3
1.0
1.4 1.5 1.6
1.5
1 .5

4. FUEL CONSUMPTION AT CONSTANT SPEED
The f u e l consumed by a veh ic le a t steady speeds w i l l depend on t h a t
v e h i c l e ' s c h a r a c t e r i s t i c s and tun ing condi t ions, on t h e c r u i s i n g speed
i t s e l f and on t h e manner i n which i t i s being d r i v e n (e.g. t h e gear ing
being used]. Several workers have put forward expressions f o r f u e l
consumption a t constant speed obtained from experimental resu l t s ,
Watson [19801; E v e r a l l (19681; Akce l ik (19821. Using regress ion
ana lys is and several data se ts o f past studies, Akce l i k (19621 found
the fo l l ow ing expression t o be t h e most s a t i s f a c t o r y :
where Fc i s the f u e l consumption;
Vc the steady speed .
and a. t o a are constants. 2
I n t h e present sec t i on we are i n t e r e s t e d i n t h e f u e l consumption
of the average v e h i c l e a t a t y p i c a l steady speed f o r urban d r i v i n g
condi t ions, and the re fo re a considerable amount of aggregat ion has t o
be present.
Fo l lowing on from the arguments of t h e prev ious sact ion, the average
veh ic le considered here has an engine s i ze of 1500 c.c.. For a t y p i c a l
urban steady speed i t i s necessary t o se lec t t h a t speed a t which a veh ic le
would be ab le t o t r a v e l i f no delays took place. The most common speed
l i m i t i n urban areas of 48 km/h i s therefore used t o est imate constant
speed f u e l consumption f o r urban t r i p s . Table 3 shows some repor ted
r e s u l t s of exper imwn~al t e s t s c a r r i e d out w i t h a number of d i f f e r e n t
veh i c les a t var ious c r u i s i n g speeds. For t h e more recent v e h i c l e models
and c r u i s i n g speeds c lose t o 48 km/h, the f u e l consumption r a t e v a r i e s
from 9.4 t o 5.2 1/100 km f o r veh i c les of 2200 and 1100 c.c. engine
s izes respec t i ve l y .
Given t h e r e s u l t s o f Table 3, i t seems reasonable t o assume a
range o f values o f 6.0 t o 7.0 1/100 km f o r t h i s c r u i s i n g speed. I t was
decided t o use a value of 7.0 1/100 km as t h e more appropr ia te average
f o r a 1500 C.C. vehic le, s ince i t i s i n c lose agreement w i t h t h e value
obtained us ing t h e r e s u l t s o f a very s i m i l a r v e h i c l e [ i . e . t h e 1600 c.c.
veh i c le of Evans and Takasaki (19811). - .

Table 3. Fuel consumption a t var ious c ru i s ing speeds
Reference
I Evans and Takasaki C19811 I
Vehicle c h a r a c t e r i s t i c s Engine Size (cc l
Everal l (19681 1
Weeks (19811
I Everal l ( 1 9 6 8 1 ~ 1
1050
1100
Pienaar (19811 I Robertson e t I 2200 a 1 (19801
(1/100 kml [km/hl
Note: Estimated from t h e graphs of motorway fue l consumption.
5. FUEL CONSUMPTION OF STOP/START MANOEUVRES - THE LEEOS SURVEY
This sec t ion dea ls w i t h t he c h a r a c t e r i s t i c s of veh ic le s tops i n
urban t r a f f i c and with t h e f u e l consumed dur ing a s t o p / s t a r t manoeuvre.
The excess f u e l consumed dur ing a s t o p / s t a r t manoeuvre i s def ined here
a s the d i f fe rence between the t o t a l consumption dur ing t h a t manoeuvre
and t h a t f u e l which would have been consumed i f t h e same d is tance was
t rave l l ed a t a s teady c ru i s ing speed. Since t h e speed l i m i t i n most
urban a r e a s i s 48 km/h. t h i s w i l l be t h e c ru i s ing speed used t o es t imate
t h e excess f u e l due t o s tops.
The main ob jec t i ve i s t o obta in re la t i onsh ips which express t h a t
excess f u e l i n terms of t h e c h a r a c t e r i s t i c s of t he manoeuvre, t o be used
i n f u e l consumption sub-models which inc lude t h e number and type of stop.
The sec t ion i s organised a s fol lows: I n sec t ion 5.1 t h e notat ion
used and t h e main c h a r a c t e r i s t i c s of s tops found in t h e Leeds experiment
a r e given. Sect ions 5.2 and 5.3 dea l w i t h t he f u e l consumed dur ing t h e
dece lera t ion and acce le ra t i ons tages of each manoeuvre respec t ive ly . I n
sec t ion 5.4 the r e s u l t s of t h e two previous sec t ions a r e used t o der ive
expressions f o r t h e t o t a l and t h e excess f u e l consumed. F ina l l y , sec t ion
5.5 g ives va lues f o r t h e excess f u e l consumed f o r severa l c ru i s ing
speeds and types of s tops.
5.1 Charac te r i s t i cs of s tops
One of t he ob jec t i ves of t he experiment was t o i nves t i ga te t h e
c h a r a c t e r i s t i c s of veh ic le s tops i n urban t r a f f i c . Before d iscuss ing the

r e s u l t s obtained i n t h i s regard, it i s usefu l t o dea l b r i e f l y with t h e
var ious components of veh ic le motion through a complete s top /s ta r t
manoeuvre.
Referr ing t o Figure 2, which shows a vehic le t r a j e c t o r y dur ing
such a manoeuvre, t he fol lowing notat ion w i l l be used:
'i - I n i t i a l speed, i . e . t h a t speed a t which t h e dece lera t ion
s tage s t a r t s .
Vf - Final speed, i .e . speed reached once t h e acce le ra t i on
s tage stops.
td - Time taken t o dece le ra te from speed Vi t o zero.
d - Decelerat ion r a t e
ta - Time taken t o acce le ra te from zero t o speed V f a - Accelerat ion r a t e
ts - Stopped t ime
Fd - Fuel consumed dur ing t h e dece lera t ion s tage
Fa - Fuel consumed dur ing t h e acce lera t ion s tage
Ft - Total f u e l consumed dur ing t h e complete s t o p / s t a r t
manoeuvre t h a t would have been
Fc - Fuel consumed i f t h e same d is tance was t r a v e l l e d a t a
c ru i s ing speed V,.
Fe - Excess f u e l consumed due t o s top /s ta r t manoeuvre, and
given by: F = Ft - e Fc+
The speeds [V. and Vfl and t h e time elements [td, ts and t a l shown 1
i n Figure 2 were recorded from t h e output data a s descr ibed i n Appendix
A . The fue l consumed a t each of t he th ree s tages was a l s o recorded f o r
each complete s top. Data f o r a t o t a l of 428 s tops i s ava i l ab le although
some f u e l consumption components a r e missing due t o f u e l meter problems
re fer red t o i n Appendix A. Missing va lues f o r Vi, td, V and t were a
a l s o recorded whenever the dece lera t ion o r acce le ra t ion was not roughly
constant . Clear ly t h e choice of i n i t i a l and f i n a l speeds is somewhat
a r b i t r a r y given t h e speed f l uc tua t i ons i n urban t r a f f i c , p a r t i c u l a r l y
under congested peak condi t ions. I n our case Vi was chosen a t t h e point
a f t e r which the re was a s teady dec l ine i n speed u n t i l t h e veh ic le came
t o a s t a n d s t i l l . S imi la r ly V was taken t o be t h a t speed immediately f
a f t e r which the re was no acce lera t ion . Therefore ne i the r V nor V i s i f
necessar i l y t he highest speed reached over any one l i n k . - .

F i g u r e s 3 , 4 and 5 show t h e d i s t r i b u t i o n o f i n i t i a l a n d f i n a l s p e e d s
obse rved i n t h e c a s e of r u n s on r a d i a l r o u t e s , C e n t r a l A rea r u n s , O f f
Peak and Even ing Peak r e s p e c t i v e l y . The c o r r e s p o n d i n g means a n d s t a n d a r d
d e v i a t i o n s are g i v e n i n T a b l e 4. I n t h e case o f C e n t r a l Area r u n s t h e
d i s t r i b u t i o n o f i n i t i a l and f i n a l s p e e d s a r e of v e r y similar s h a p e s f o r .
bo th peak a n d o f f - p e a k c o n d i t i o n s . From T a b l e 4 t h e mean v a l u e s which
can be used t o r e p r e s e n t b o t h i n i t i a l and f i n a l s p e e d s would be :
R a d i a l r o u t e s (morn ing p e a k ) - 30 km/h
C e n t r a l a r e a r o u t e [ o f f peak1 - 34 km/h
C e n t r a l a r e a r o u t e ( e v e n i n g peak l - 27 km/h
T a b l e 4. Mean i n i t i a l and f i n a l s p e e d s
5.2 F u e l consumed d e c e l e r a t i n g
A s ment ioned i n t h e p r e v i o u s s e c t i o n , t h e i n i t i a l s p e e d a n d t h e
time t a k e n f o r t h e v e h i c l e t o come t o a c o m p l e t e s t o p we re used o n l y
when t h e ra te o f d e c e l e r a t i o n was r o u g h l y c o n s t a n t . I n t h i s way we c a n
c a l c u l a t e t h e d e c e l e r a t i o n , d , a s :
o b s e r v a t i o n s
A l l r o u t e s
where V . and td are d e f i n e d a s b e f o r e . 1
( o f f peak1
C e n t r a l a r e a [eve . peak1
F i n a l
I n i t i a l F i n a l
5 4
211 211
33.9
26 .9 25 .9
8.1
11.5 11 .2

speed,
I
, __ - - - I I
Figure 2 Vehicle tra, jectory during a complete stop

FIGURE 3 INS- CARS - LEEDS RUNS
SPEED F'FEQUENCY DISPRIBUTION
RADIAL FOUIES (M.PEAK)
FINAL SPEED (-1
45 r
40 . 35 . 30 - - 25 - 20 - 15 . - 10 - -
INITIAL SPEED (KM/m) ..
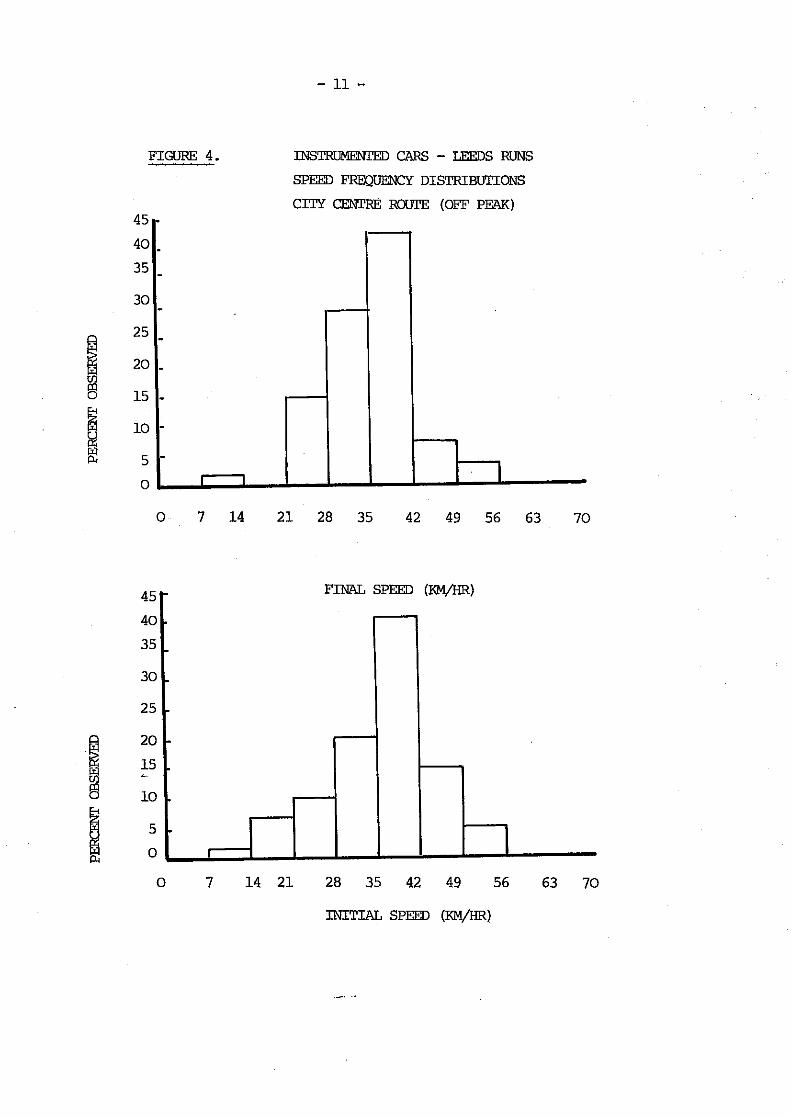
FIGURE 4. INSTRUMENTED CARS - LEEDS RUNS
SPEED FREQ- DISTRIBUTIONS
CITY CEwrRE ROVPE (OFF PEAK) 45 I-
45 t FINAL SPEED (+)
0 7 14 21 28 35 42 49 56 63 70
INITIAL SPEED (-1
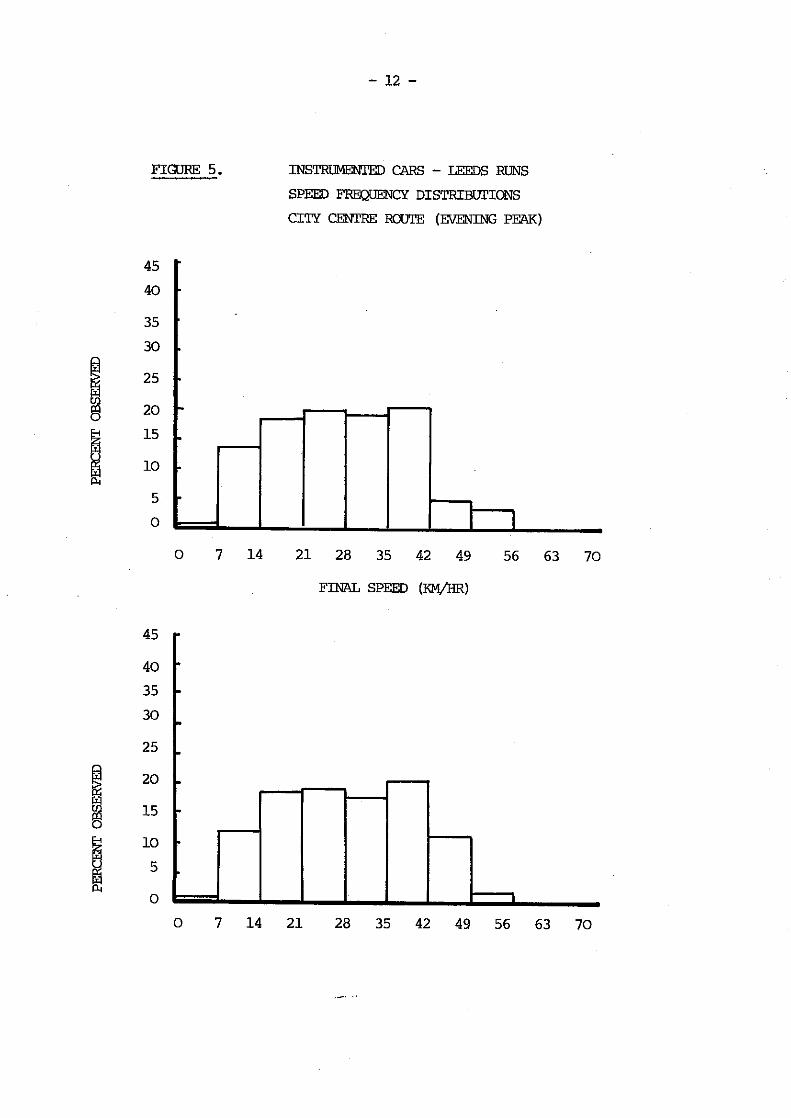
FIGURE 5. INS- CARS - LEEDS RUNS
SPEED FRQWNCY DISTRIBUTIONS
CITY r n R E ROIPPE (EXENING PEAK)
FINAL SPEED (-1

- 13 -
Table 5 shows t h e mean d e c e l e r a t i o n r a t e s observed by r o u t e t ype .
Tab le 5. Mean d e c e l e r a t i o n r a t e s
Route
A l l r o u t e s
R a d i a l s
C e n t r a l a r e a (Off peak)
C e n t r a l a r e a (eve. peak1
Number of D e c e l e r a t i o n o b s e r v a t i o n s
Standard d e v i a t i o n
As can be seen from F i g u r e 6 t h e r e i s a wide range of d e c e l e r a t i o n
r a t e s (and t h e r e f o r e d e c e l e r a t i o n t imes1 a s s o c i a t e d w i t h each i n d i v i d u a l
i n i t i a l speed. The f u e l consumed d u r i n g t h e d e c e l e r a t i n g manoeuvre i s
p l o t t e d a g a i n s t i n i t i a l speed i n F igure 7.
Severa l r e g r e s s i o n e q u a t i o n s were ob ta ined us ing a t o t a l of 136
o b s e r v a t i o n s and e x p r e s s i n g t h e f u e l consumed d u r i n g d e c e l e r a t i o n , Fd. a s
a f u n c t i o n of t h e i n i t i a l speed, Vi, and d e c e l e r a t i o n r a t e , d. The
most s a t i s f a c t o r y e q u a t i o n s i n terms of exp lana to ry power has t h e form:
where t h e v a l u e i n b r a c k e t s r e f e r s t o t h e s tandard e r r o r o f t h e 2
c o - e f f i c i e n t and F is i n m l ; Vi i s i n m / s and d i n m / s . d
Equat ion 6.4 has an R' o f 0.96. Tab le 6 shows t h e v a l u e s of Fd
f o r a range of i n i t i a l speeds, Via and d e c e l e r a t i o n r a t e s , d , ob ta ined
us ing equa t ion 131. These r e s u l t s w i l l be d i s c u s s e d f u r t h e r when t h e
excess f u e l due t o a s t o p i s cons ide red ( S e c t i o n 6.5.41.

FIGURE 6 INSTRUMEWED CARS - LEEDS RUNS
DECELERATION VS. INITIAL SPEED
INITAL SPEED (M/S)
. Wi' (km/h)

FIGURE 7 l3T-w LEEDSRUNS FUEL CONSUMED VS. m ~ I A L SPEED
0.0 2.5 5.0 7.5 10.0 12.5 15.0 17.5 20.0
(18.0) (36 .O) (54 .O) (72 .O)
IN IT IAL SPEED (M/S)
vi)-' '

Table 6. Fue l consumption du r i ng dece le ra t i on - us ing equat ion (3)
5.3 F u e l consumed a c c e l e r a t i n g
The a c c e l e r a t i o n r a t e s were obta ined i n t he same way as t h e
i
i I n i t i a l
i speed Vi
(Km/hl
I
dece le ra t i on by assuming constant a c c e l e r a t i o n throughout t h e p e r i o d
from zero speed t o t he f i n a l speed, Vf. Table 7 g ives t h e mean
a c c e l e r a t i o n r a t e s obta ined by r o u t e t ype and F igu re 8 shows t h e spread
of those acce le ra t ions . F igu re 9 shows t h e r e l a t i o n s h i p between fue l
consumption and f i n a l speed.
Fue l consumption du r i ng dece le ra t i on ( m l l
2 Dece le ra t ion ra te , d h / s I
As shown i n F igu re 9 t h e f u e l consumed f o r each p e r i o d o f
d = 0.6
a c c e l e r a t i o n and the corresponding f i n a l speed a r e much more c o r r e l a t e d
than was t h e case w i t h t h e dece le ra t i on per iod . Fo l l ow ing t h e n o t a t i o n
I I d = 0.8
used before, t h e f o l l o w i n g r e l a t i o n s h i p s were es tab l i shed f o l l o w i n g t h e
work o f A k c e l i k [19821:
d = 1.0
2 3 Fa = 0.239 Vf - 0.0046 Vf
(0.0171 ~0.00151 2
where Fa i s i n m l , V i n m/s and a i n m/s . f

FIGURE 8 CARS - LEEDS RUNS
ACCELERATION VS. FIN?& SPEED
FINAL SPEED (M/S)
6;)' (W)

FIGURE 9 INSTRUMENTED CARS - LEE!3S HJNS
FUEL CONSUNTI VS. FINAL SPEED
0.0 2.5 5.0 7.5 10.0 12.5 15.0 17.5 20.0
(18.0) (36.0) (54.0) (72.0)
FINAL SPEED (M/S)
(Vf' -. .
(rn)

Table 7. Nean acce le ra t i on ' r a t e s
Equation 5, which has t h e h igher R' value, was used t o c a l c u l a t e
t h e f u e l consumed du r ing t h e acce le ra t i on stage o f a s t o p / s t a r t
manoeuvre f o r a range o f acce le ra t i on r a t e s and f i n a l speeds. The
r e s u l t s which are shown i n Table 8, i l l u s t r a t e the low s e n s i t i v i t y o f
f u e l consumed w i t h v a r i a t i o n s i n t h e acce le ra t i on r a t e , a f a c t which
was a l s o noted by Richardson (19821, Akce l i k (1982) and Evans and
Takasaki (19811.
Route
A l l r ou tes
Rad ia ls [morn. peakl
Cent ra l area (of f peakl
Cent ra l area [eve. peakl
Table 8. Fue l consumption due t o acce le ra t i on - us ing equat ion (51
Number o f observat ions
403
138
54
24
F i n a l speed
Vf [km/hl
10
20
30
40
50
60
Acce lera t ing r a t e s (m/s21
Mean
0.65
0.66
0.72
0.63
Fue l consumed (ml)
2 Acce le ra t i on r a t e . a (m/s l
Standard d e v i a t i o n
0.21
0.18
0.16
0.23
a = 0.6
2.9
7.9
14.9
23.8
34.8
47.8
a = 0.8
2.5
6.9
13.4
21.9
32.4
44.9
a = 1.0
2.2
6.3
12.5
20.7
30.9
43.1

5.4 Excess f u e l due t o complete s top /s ta r t manoeuvre
The equat ions der ived i n t h e prev ious sec t ions f rom t h e Leeds
experiment f o r t h e f u e l consumed dur ing t h e dece le ra t i on and acce le ra t i on
stages of a complete manoeuvre are now used t o ob ta in an expression f o r
the t o t a l f u e l consumption. Ft, dur ing such manoeuvres. From equations
(31 and (51 we have:
Fo l lowing the d e f i n i t i o n g iven i n Sect ion 5.1, the excess f u e l consumed
Fe. i s g iven by:
where Fc, the f u e l consumed a t constant c r u i s i n g speed, Vc, can be
expressed as:
where f i s t h e c r u i s i n g speed f u e l consumption per u n i t d is tance a t C
the constant speed Vc;
and d and a are assumed constant.
It i s now poss ib le t o est imate the excess f u e l per stop f o r t h e
Leeds experiment da ta us ing Tables 6 and 8, together w i t h equat ion (91.
Since i t was n o t poss ib le t o o b t a i n experimental values f o r fc, t h e
c r u i s i n g speed f u e l consumption ra te , a value o f 7 . 5 1/100 km i s assumed
f o r a value o f Vc o f 48 km/h. Th is assumption was based on t h e r e s u l t s
shown i n Table 3, a f t e r Evans and Takasaki (19811 and Pienaar [19811.
The excess f u e l due t o a s top /s ta r t manoeuvre was est imated f o r a
range of f i n a l and i n i t i a l speeds, and dece lera t ion and acce le ra t i on
ra tes . A summary o f t h e r e s u l t s i s shown i n Table 9. I n the case of
t h e Leeds experiment when t h e f i n a l and i n i t i a l speeds are bo th equal
t o the assumed c r u i s i n g speed of 48 km/h, the excess f u e l due t o t h e
complete s top /s ta r t manoeuvre i s 22 m l . *
* Assuming constant decs le ra t i on and acce le ra t i on r a t e s o f 0.8 and 0.7 m/s2 respec t i ve l y , f o l l o w i n g t h e r e s u l t s of t h e Leeds experiment

Experimental t e s t s have been c a r r i e d out by severa l researchers t o
determine t h e excess f u e l due t o a s top /s ta r t manoeuvre (e.g. C l a f f e y
(19711, (19761; Robertson e t a1 (19801; Pienaar (19811; Evans and
Takasaki [198111. Although most of t h e veh ic les used a r e no t t y p i c a l
o f t h e U.K. v e h i c l e f l e e t , some o f t h e r e s u l t s a r e r e l e v a n t t o t h i s work
and w i l l now be compared w i t h those observed from t h e Leeds experiment.
Table 9. Excess f u e l due t o s top /s ta r t manoeuvre
(11 Assumed equal
(21 Assuming equal dece le ra t i on and acce le ra t i on r a t e s
I n i t i a l / f i n a l speed (11
[ km/hl
10
20
30
40
50
60
From t h e r e s u l t s g iven by Evans and Takasaki 113811 us ing a veh ic le
w i t h a 1600 c.c. engine, t h e excess f u e l requ i red t o acce lera te t h e
veh ic le t o steady speeds o f 48 and 64 km/h, was est imated t o be 20 and
35 m l respec t i ve l y . Th is does no t inc lude t h e dece le ra t i on stage o f the
manoeuvre and i s t h e r e f o r e not d i r e c t l y comparable t o t h e r e s u l t s of
Table 9, whose corresponding values f o r t h e t o t a l excess f u e l a r e i n the
reg ion o f 23 and 30 m l .
Vincent e t a1 (19801 have p u t forward a r e l a t i o n s h i p between Fe and
the c r u i s i n g speed, Vc of t h e form o f :
Excess f u e l consumed ( m l l
Oeceleration/acceleration
ra te , kl" (m/s21
where Vc i s i n km/h and Fe i n l i t r e s of fue l .
k = 0.6
4.4
9.1
13.7
18.3
23.1
28.0
k = 0.8
3.7
7.7
12.5
17.8
23.6
30.1
k = 1.0
3.1
7.0
11.8
17.4
23.9
31.2

Equation (101 was found t o apply t o data from exper imenta l t e s t s
ca r r i ed out by t h e TRRL w i t h a veh ic le w i t h a 2200 c.c. engine.* For
a c r u i s i n g speed o f 50 km/h, equat ion 1101 g i ves a va lue o f Fe o f 20.5
m l . The corresponding value from Table 9 i s i n t h e r e g i o n o f 23 t o 24
m l . Pienaar [19811. us ing veh ic les i n t h e range o f 1500 t o 2000 c.c.
engines and c r u i s i n g speeds o f 40 km/h, found a value o f Fe o f approximately
25 m l , whereas t h e corresponding value from Table 6.9 i s approximately
1 8 m l .
It should be st ressed t h a t t h e values f o r excess f u e l shown i n
Table 9 are a l l based on a c r u i s i n g speed fo 48 km/h u n l i k e those o f
past s tud ies quoted above.
5.5 5 I t i s u s e f u l a t t h i s stage t o d i s t i n g u i s h between t h e s top /s ta r t
manoeuvre described i n Sect ion 5.1 where a v e h i c l e comes t o r e s t from
and accelerates t o a steady speed, and a manoeuvre which can be
described as 'queue c raw l i ng ' where a veh ic le acce lera tes from r e s t t o
a speed V and then decelerates back t o r e s t . This l a t t e r manoeuvre 4
i s shown diagrammatfcal ly i n F igure 10, f o r the case when t h e
acce le ra t i on and dece le ra t i on r a t e s are assumed constant and equal t o k.
The excess f u e l consumed dur ing such a manoeuvre, which i s a
f u n c t i o n o f the c r u i s i n g speed, Vc, and t h e f i n a l speed reached, V 4 '
can be obtained from equations (71 and (91 w i t h Vi = Vf = V . 9
Table 10 shows t h e s e n s i t i v i t y of t h e excess f u e l , Fe, t o
v a r i a t i o n s i n t h e assumptions made about f t h e c r u i s i n g speed f u e l c'
consumption per u n i t of distance. I t i s c l e a r from t h i s Table t h a t t h e
excess f u e l due t o a 'queue c rawl ing ' manoeuvre i s f a i r l y i n s e n s i t i v e
t o t h e assumption made about t h e c r u i s i n g speed ( i . e . t h e c r u i s i n g speed
f u e l ra te , fc l f o r va lues o f V t h e maximum speed reached, lower than q'
25 km/h.
The r e s u l t s shown here f o r bo th the complete s t o p / s t a r t and t h e
'queue c rawl ing ' manoeuvres w i l l be used i n Pa r t I1 t o d e r i v e
c o e f f i c i e n t s f o r f u e l consumption sub-models appropr ia te t o urban t r a v e l
i n t h e U.K.
* A value o f 7.7 x -l/p.c.u. stop i s g iven by Vincent e t a1 L19801. Th is was converted t o l/veh. Stop us ing a f a c t o r o f 1.07 as recommended by those authors.

speed, V
\I-0 \I= 0
time, t P.
'4 rt 2 V 4 : . + - K
Figure '10

Table 10. Excess f u e l consumption du r ing 'queue c raw l i ng ' manoeuvres
Maximum speed
(11 These r e s u l t s were ca l cu la ted us ing t h e f o l l o w i n g :
- Equation ( 7 1 w i t h V . = Vf 2
1 = Vq; and a = 0.7 m/s and
d = 0.8 m/s2 f o l l o w i n g the r e s u l t s o f t h e Leeds experiment.
- Equation 191 w i t h a and d as above and t h e f o l l o w i n g Vc
values: 40 km/h f o r fc = 7.0 1/100 km; 48 km/h f o r fc
= 7.5 1/100 km and 30 km/h f o r f c = 8.0 1/100 km. These
values are based on t h e work by Akce l i c (19821 showing t h e
concave shape o f t h e fc vs. V curve (equat ion 1 ) and C
assumes t h a t fc increases a t t h e lower c r u i s i n g speed o f
30 km/h.
6. THE EFFECT OF COLD STARTS
The a d d i t i o n a l f u e l consumed dur ing a t r i p where t h e v e h i c l e has
s ta r ted w i t h a c o l d engine, r e l a t i v e t o t h e f u e l consumed w i t h t h e
engine f u l l y warm, has been i nves t i ga ted by several researchers le.g.
E v e r a l l and Northrop C19701: Waters and Laker (19801; Chang e t a1
(19761; Pienaar and Jurgens (1980); and Frybourg i197911. Th is
sec t ion rev iews some of t h e a v a i l a b l e evidence i n t h i s area.
Recent experimental t e s t s undertaken by Pienaar and Jurgens (19801
w i t h th ree passenger ca rs o f 1600 c.c. engine capac i ty under urban
d r i v i n g cond i t i ons a t average speeds of 42 km/h, a r e shown below.

Distance t r a v e l l e d Ex t ra consumption due t o [kml c o l d s t a r t . As percentage
of warmed-up consumption.
Th is compares w i t h experiments i n France which showed t h a t t h e
ex t ra consumption due t o c o l d s t a r t s over the f i r s t 2 km of a journey
can be of t h e order o f 30 percent of t h e warmed-up consumption i n
summer and 60 percent i n w in ter .
I n the U.K., E v e r a l l and Northrop 11970) c a r r i e d ou t t e s t s us ing
a 1967 v e h i c l e of 2000 c.c. engine on the TRRL t e s t t r ack . The
r e l a t i o n s h i p between t h e excess f u e l consumed due t o ' c o l d s t a r t s ' and
veh ic le speeds, d r i v i n g manner [ i .e . gear changes], and t h e ou ts ide a i r
temperature was invest igated. Those authors found t h a t when urban
d r i v i n g cond i t i ons were simulated, the d is tance necessary f o r t h e
v e h i c l e ' s engine t o become f u l l y warm was i n t h e r e g i o n o f 9 km. A t
the n a t i o n a l l eve l , i t was a l s o est imated t h a t i f no account i s taken
o f t h e ef fect of ' c o l d s t a r t s ' t h e under-estimate o f t h e f u e l consumed
when veh ic les s t a r t f rom co ld i s i n t h e reg ion of 15 per cent o f the
a c t u a l f u e l consumed.
Waters and Laker [19801, us ing a 1300 c.c. veh ic le , a t an ambient
temperature of ~ O C , found t h a t f o r a t r i p o f approximately 3 km, t h e
excess f u e l consumed due t o ' co ld s t a r t s ' was over 60 percent o f t h e
f u l l y warmed-up amount.
I t i s d i f f i c u l t t o compare t h e r e s u l t s of d i f f e r e n t t e s t s due t o
the in f luence o f d r i v i n g techniques, average speeds and ambient
temperature. However, t he re i s a l a r g e measure o f agreement t h a t
exc luding the excess f u e l due t o ' c o l d s t a r t s ' w i l l l ead t o s i g n i f i c a n t
underestimates o f f u e l consumption f o r shor t journeys of l e s s than
around 6 kms. For a 3 km journey t h i s e x t r a f u e l may range from 30 t o
60 percent o f t h e waned-up consumption.
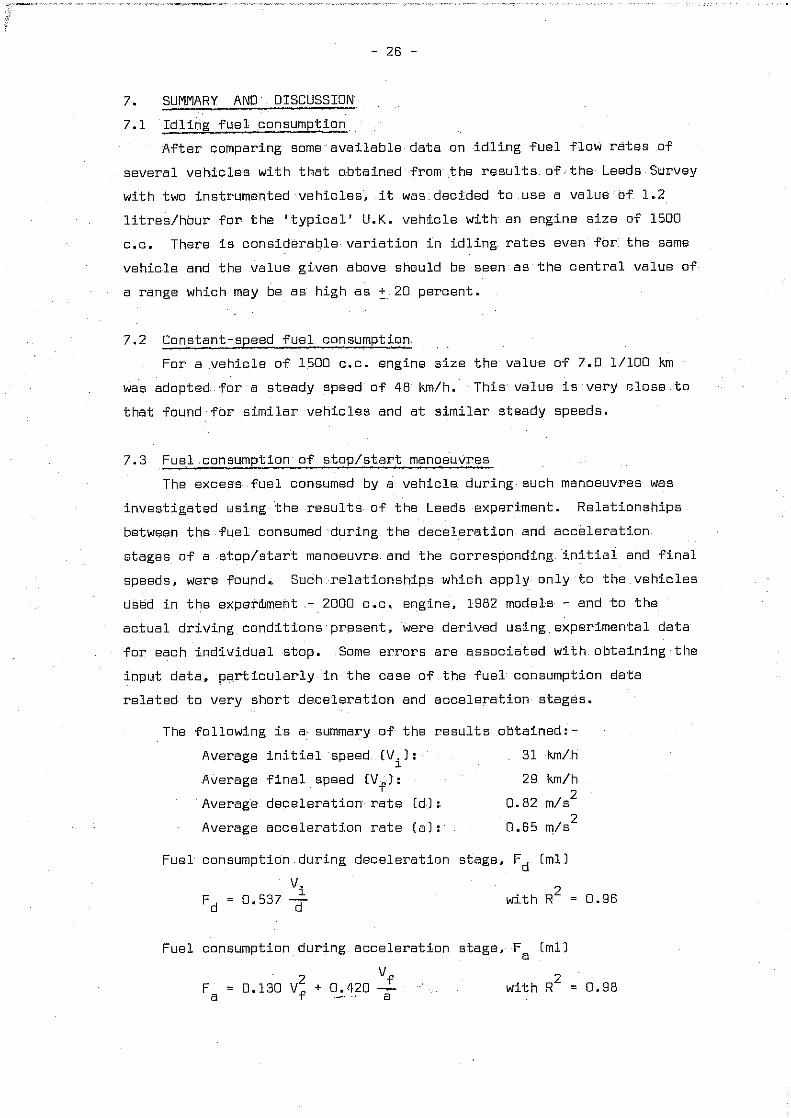
7. SUMMARY AND DISCUSSION
7.1 Id l ing f u e l consumption
Af ter comparing some ava i l ab le data on i d l i n g f u e l flow r a t e s of
severa l veh ic les w i t h t h a t obtained from the r e s u l t s of t h e Leeds Survey
with two instrumented veh ic les , it was decided t o use a value of 1 .2
l i t r es /hou r f o r t h e ' t y p i c a l ' U.K . vehic le with an engine s i z e of 1500
c.c. There i s considerable va r ia t i on i n i d l i n g r a t e s even f o r t he same
vehic le and t h e value given above should be seen a s t h e c e n t r a l value of
a range which may be a s high a s + 20 percent.
7.2 Constant-speed f u e l consumption
For a veh ic le of 1500 c.c. engine s i z e t h e value of 7.0 1/100 km
was adopted f o r a steady speed of 48 km/h. This value i s very c lose t o
t h a t found f o r s im i l a r veh ic les and a t s im i l a r s teady speeds.
7.3 Fuel consumption of s t o p / s t a r t manoeuvres
The excess f u e l consumed by a vehic le dur ing such manoeuvres was
invest igated using t h e results of t he Leeds experiment. Relat ionships
between t h e f u e l consumed dur ing t h e dece lera t ion and acce lera t ion
s tages of a s t o p / s t a r t manoeuvre and t h e corresponding i n i t i a l and f i n a l
speeds, were found, Such r e l a t i o n s h i p s which apply only t o t h e veh ic les
tlsed i n t h e experhment - 2000 c.c. engine, 1982 models - and t o t h e
ac tua l d r iv ing cond i t ions present , were der ived using experimental data
f o r each ind iv idua l s top. Some e r r o r s a r e assoc ia ted with obta in ing t h e
input data. p a r t i c u l a r l y i n t h e case of t h e f u e l consumption da ta
re la ted t o very shor t dece lera t ion and acce lera t ion s tages .
The fol lowing is a summary of t he r e s u l t s obtained:-
Average i n i t i a l speed [V. I : 1
31 km/h
Average f i n a l speed ( V 1: f
29 km/h
Average dece lera t ion r a t e [d l : 0.82 m / s 2
Average acce lera t ion r a t e [ a ] : 0.65 m / s 2
Fuel consumption dur ing decelerat ion s tage, Fd [ m l )
'i Fd = 0.537 7 w i t h R' = 0.96
Fuel consumption dur ing acce lera t ion s tage, Fa [mll
2 vf Fa = 0.130 Vf + 0.420 - a
with 9' = 0.98

The excess consumption due t o a s top /s ta r t manoeuvre where Vi =
V = 46 km/h. i s of t h e order of 22 m l of f u e l assuming average f
acce le ra t i on and dece le ra t i on r a t e s as g iven above. Table 9 shows t h e
excess f u e l consumed f o r t h e s top /s ta r t manoeuvre f o r a range of
acce le ra t i on and dece le ra t i on r a t e s as w e l l as f i n a l and i n i t i a l
speeds. Table 10 shows the excess f u e l consumed du r ing a 'queue
c rawl ing ' manoeuvre f o r a range of maximum speeds reached under several
c r u i s i n g speed f u e l r a t e assumptions. The excess f u e l f o r 'queue
c rawl ing ' manoeuvres where t h e maximum speeds reached a r e 30, 25 and
20 km/h, a r e est imated t o be 13, 10 and B m l of f u e l respec t i ve l y .
F i n a l l y i n Sect ion 6 t h e e f fec ts of ' c o l d s t a r t s ' on f u e l
consumption were discussed by rev iewing t h e r e s u l t s of severa l
experiments. I t was concluded t h a t f o r t r i p s o f l e s s than 6 krns,
s i g n i f i c a n t under-est imat ion may occur i f the f u e l consumption
es t imat ion procedure ignores t h e e f fec t of ' c o l d s t a r t s ' . The degree
o f under-est imation depends on several f ac to rs i n c l u d i n g t h e ambient
temperature, t h e d r i v i n g behaviour and t h e t r a f f i c f low cond i t ions .

PART I1 - URBAN FUEL CONSUMPTION SUB-MODELS - 8. INTRODUCTION
P a r t I1 d e a l s w i t h t h e development of f u e l consumption sub-models
t o be used i n e v a l u a t i n g t h e impact of urban t r a n s p o r t management CUTMI
s t r a t e g i e s on energy consumption. Such sub-models, which can be seen
a s a d d i t i o n s t o t h e a n a l y t i c a l t o o l s a v a i l a b l e t o model urban t r a n s p o r t
demand, m u s t s a t i s f y two c r i t e r i a :
11 They must be a b l e t o r e p r e s e n t v e h i c l e f u e l consumption
c h a r a c t e r i s t i c s i n urban d r i v i n g c o n d i t i o n s t o a r e a s o n a b l e
degree of accuracy, and
21 They should make u s e of t h e r e a d i l y a v a i l a b l e o u t p u t s from t h e
t r a n s p o r t mode l l i ng p rocess .
Fuel consumption sub-models a p p r o p r i a t e t o two s p e c i f i c l e v e l s
of d e t a i l i n measur ing t h e responses t o a range of UTM s t r a t e g i e s a r e
put forward:
11 A r e l a t i o n s h i p between urban f u e l consumption p e r v e h i c l e km. and
t h e i n v e r s e o f a v e r a g e journey speed ( t o t a l j ou rney d i s t a n c e
d i v i d e d by t o t a l journey t i m e ) , t o be used w i t h t h e results of t h e
conven t iona l f o u r - s t e p urban t r a n s p o r t demand mode l l i ng p r o c e s s - t r i p g e n e r a t i o n . d i s t r i b u t i o n , moda l -sp l i t and ass ignment . Such
a sub-model i s b e s t s u i t e d t o q u a n t i f y t h e f u e l consumption impacts
of UTM measures a t an a g g r e g a t e l e v e l of d e t a i l , and i s t h e r e f o r e
d i r e c t e d a t t h e area-wide e v a l u a t i o n of t h o s e measures which
i n f l u e n c e t o t a l d i s t a n c e t r a v e l l e d and t o t a l t ime s p e n t t r a v e l l i n g
by each mode. Fo r example, changes i n t h e r e l a t i v e t r a v e l c o s t s
of p r i v a t e and p u b l i c t r a n s p o r t [e.g. f u e l p r i c i n g , pa rk ing
charges , a r e a l i c e n s i n g schemes and p u b l i c t r a n s p o r t f a r e s u b s i d i e s 1
may r e s u l t i n moda l -sp l i t changes which i n t u r n may a f f e c t t h e
l e v e l of c o n g e s t i o n and t h e r e f o r e average journey speeds. By
r e l a t i n g t h e l i k e l y impact of t h o s e t r a v e l c o s t changes on modal
market s h a r e s one can e s t i m a t e t h e cor respond ing e f f e c t on average
speeds by load ing t h e changed p a t t e r n o f demand o n t o t h e road
system u s i n g a conven t iona l assignment model and u s e t h e above
r e l a t i o n s h i p t o e s t i m q t e t h e f u e l i m p l i c a t i o n s . The u s e of a s imp le
r e l a t i o n s h i p between average journey speed and f u e l consumption t o
e s t i m a t e t h e e f f e c t s 03 UTN p o l i c i e s on t o t a l urban f u e l consumption

i s d e a l t w i t h i n t h e n e x t s e c t i o n . The a c c u r a c y o f such e s t i m a t e s
w i l l o n l y e n a b l e b road c o n c l u s i o n s t n be drawn f r o m t h e results.
However t h e s p e c i f i c a t i o n e r r o r s i n h e r e n t i n t h e o v e r - s i m p l i f i c a t i o n
of such f u e l consumpt ion sub-models m u s t be s e e n i n t h e c o n t e x t o f
t h e p r e d i c t i v e a c c u r a c y a t t a c h e d t o t h e t r a v e l demand f o r e c a s t i n g
mode ls . The l a t t e r . wh ich w i l l be used t o p r e d i c t a v e r a g e j o u r n e y
speed c h a n g e s t h a t r e s u l t f r om t h e i n t r o d u c t i o n o f UTN measu res ,
i n c o r p o r a t e a number o f s i m p l i f y i n g a s s u m p t i o n s a b o u t t r a v e l
b e h a v i o u r wh ich l e a d t o a l a r g e d e g r e e of u n c e r t a i n t y b e i n g a t t a c h e d
t o t h e o u t p u t s of s u c h mode ls .
21 A f u e l consumpt ion sub-model which has been i n c o r p o r a t e d i n t h e
SATURN t r a f f i c s i m u l a t i o n and ass ignmen t model. T h a t sub-model
i s a b l e t o u s e t h e r e s u l t s o f more d e t a i l e d a n a l y s i s of t r a f f i c
f l o w speed a n d d e l a y i n u rban c o n d i t i o n s and i s t h e r e f o r e
p a r t i c u l a r l y s u i t a b l e t o q u a n t i f y t h e ef fects o f t r a f f i c management
schemes which a l t e r t h e s u p p l y of r o a d s p a c e i n medium s i z e d towns
o r i n t h e c e n t r a l a r e a s o f l a r g e r c i t i es . A s d i s c u s s e d i n d e t a i l
i n S e c t i o n 10 , t h e sub-model e x p r e s s e s f u e l consumpt ion a s a l i n e a r
f u n c t i o n of t o t a l d i s t a n c e t r a v e l l e d , t o t a l d e l a y e d time and t h e
t o t a l number o f v e h i c l e s t o p s . A d i s t i n c t i o n i s made i n SATURN
between t h e f i r s t time a v e h i c l e s t o p s a t an a p p r o a c h t o a j u n c t i o n
and a n y s u b s e q u e n t s t o p s t h a t v e h i c l e may make a t t h e same app roach .
The fue l consumpt ion e x p r e s s i o n d i s c u s s e d above i s t h e r e f o r e a b l e
t o make use o f t h a t d i s t i n c t i o n when c a l c u l a t i n g t h e e x c e s s f u e l
consumed d u e t o v e h i c l e s t o p s .
Even t h i s second t y p e o f sub-model which re l i es s o l e l y on t r a f f i c
f l o w e f f e c t s t o e x p l a i n f u e l consumpt ion , d o e s n o t t a k e a c c o u n t o f o t h e r
f a c t o r s which i n f l u e n c e t h e f u e l consumed by a v e h i c l e . T h e r e are two
o t h e r d i m e n s i o n s t o b e c o n s i d e r e d when e s t i m a t i n g f u e l consumpt ion ,
namely t h e c h a r a c t e r i s t i c s of t h e d r i v e r and of t h e v e h i c l e i t se l f . I n
a d d i t i o n , f a c t o r s s u c h a s a l t i t u d e and c l i m a t i c c o n d i t i o n s w i l l a l s o
affect f u e l consumpt ion r e s u l t s and t h e r e f o r e d a t a t r a n s f e r a b i l i t y i n
s p a c e mus t be c o n d i t i o n e d by s u c h f a c t o r s .
The fuel consumpt ion sub-models deve loped h e r e a r e i n t e n d e d f o r u s e
by t r a f f i c e n g i n e e r s a n d t r a n s p o r t p l a n n e r s i n U . K . u r b a n area
e n v i r o n m e n t s and mus t t h e r e f o r e i n c o r p r o a t e a l a r g e d e g r e e o f a g g r e g a t i o n
o v e r v e h i c l e and d r i v e r c h a r a c t e r i s t i c s . T h a t is , t h e f u e l e s t i m a t i o n - .

p r o c e d u r e s a p p l y t o t h e ' t y p i c a l ' v e h i c l e and d r i v e r and t h e r e s u l t s
a r e t h e r e f o r e s u b j e c t t o errors when t h e y a r e compared w i t h consumpt ion
l e v e l s of i n d i v i d u a l v e h i c l e s . However, t h e e r r o r s become less i m p o r t a n t
when t h e f u e l consumpt ion sub-models a r e used a s p a r t o f t h e l o c a l
e v a l u a t i o n of a number o f UTN measu res . I n t h i s l a t t e r case t h e t r a f f i c
e n g i n e e r o r t r a n s p o r t p l a n n e r is i n t e r e s t e d i n t h e r e l a t i v e pe r fo rmance
e a c h measure o r comb ina t i on o f measures .
9. THE 'AVERAGE SPEED' SUB-MOOEL
9 . 1 R e s u l t s f rom U.K . S t u d i e s
A number o f r e s e a r c h wo rke rs b o t h i n t h e U . K . and o v e r s e a s have p u t
fo rward a s i m p l e l i n e a r r e l a t i o n s h i p between u rban f u e l consumpt i on p e r
u n i t d i s t a n c e (F1 and t h e i n v e r s e of t r i p speed [U), t h e l a t t e r b e i n g
c a l c u l a t e d u s i n g t o t a l j o u r n e y t ime t a k e n t o c o m p l e t e t h e t r i p . Such
r e l a t i o n s h i p s have t h e fo rm:
where t h e c o n s t a n t s kl a n d k2 have been d e t e r m i n e d u s i n g s i m p l e l i n e a r
r e g r e s s i o n a n a l y s i s w i t h obse rved d a t a o b t a i n e d by d r i v i n g s p e c i a l l y
f i t t e d tes t v e h i c l e s i n u rban areas.
E a r l y work i n C e n t r a l London unde r taken by E v e r a l l 119681 w i t h two
test cars - a Vauxha l l V iva 11053 c.c.1 and a Ford Zephy r 11703 c . c . )
i n d i c a t e d a l i n e a r r e l a t i o n s h i p between fuel consumpt ion and t h e i n v e r s e
o f a v e r a g e speed 1 i . e . a v e r a g e j o u r n e y time p e r u n i t d i s t a n c e ) . The
r e l a t i o n s o b t a i n e d f o r C e n t r a l London were:
a 1 1053 c.c. car
and
b ) 1 0 7 3 C.C. car
where F = f u e l consumpt ion i n 1/100 krn
and V = a v e r a g e speed i n km/h.

These r e l a t i o n s h i p s apply f o r average speeds i n t h e range o f 10
t o 58 km/h.
Some more recen t experiments have been c a r r i e d ou t by Weeks [19811
i n London us ing a d i e s e l and a p e t r o l car. The p e t r o l c a r used was a
1978 model VW Golf o f 1100 c.c. engine capac i ty and t h e t e s t s were
ca r r i ed out i n two types o f rou tes : one exc lus i ve l y i n Cent ra l London
and another on a r a d i a l commuter r o u t e from Crowthorne t o Cen t ra l London.
Although t h e experiments were designed t o compare t h e f u e l consumption o f
p e t r o l and d i e s e l veh i c les o f s i m i l a r performance under urban congested
condi t ions, t h e r e s u l t s obtained prov ide a bas i s t o r e l a t e urban f u e l
consumption and observed speed.
Using the f u l l da ta set, i .e . the r e s u l t s f o r a l l speeds and t h e
two t e s t routes, f o r t h e same v e h i c l e and t h e same number of occupants.
Weeks produced t h e fo l l ow ing equat ion:
where F and V are defined as before and t h e c o r r e l a t i o n c o e f f i c i e n t , R 2
i s 0.675.
By r e s t r i c t i n g t h e value of average speed t o l e s s than 60 km/h, t h e
f o l l o w i n g equat ion i s obtained:
F = 17.92 + - - 54m42 0.454 V + 0.0045 V 2 v
w i t h R' = 0.622.
By assuming a s imp ler r e l a t i o n s h i p of the form o f equat ion (111,
the fo l l ow ing equat ions were obtained:
a1 V<60 km/h 130.0 F = 6.61 + - 2
V (R = 0.601
and
b l 10<V<60 km/h
F = 5.80 + - 2 146m6 (R = 0.581 v
This l a s t equat ion was obta ined us ing average speeds between 10
and 60 km/h, t o enable a d i r e c t comparison t o be made w i t h t h e
expressions developed by E v e r a l l f o r t h e same speed range. F igu re 11
compares g r a p h i c a l l y equat ions (121. [131, (141 and [171. -

Figure 11. Urban f u e l consumption and speed (TRRL studies)
A (1965) - 1700 cc
B (1965) - 1000 cc
c (1978) - 1100 cc (Week's equation)
D (1978) - 1100 cc (Linear equation)
Speed (V) km/h
..

A number of p o i n t s may be made from t h e s e r e s u l t s :
i ) Whether a q u a d r a t i c e x p r e s s i o n o r t h e s i m p l e l i n e a r form i s used
t h e c o r r e l a t i o n c o e f f i c i e n t i s i n t h e r a n g e 0 .6 t o 0 . 7 and
t h e r e f o r e a c o n s i d e r a b l e amount of v a r i a t i o n i n t h e d a t a i s n o t
e x p l a i n e d by a n y o f t h e r e l a t i o n s h i p s deve loped . T h i s is a
problem which w i l l be d i s c u s s e d f u r t h e r i n S e c t i o n 10 .
i i l By c h o o s i n g a s i m p l e l i n e a r r e l a t i o n s h i p between f u e l consumpt ion
and t h e i n v e r s e o f a v e r a g e j o u r n e y speed, i n p r e f e r e n c e t o
e x p r e s s i o n s of t h e form of e q u a t i o n s (141 and [151, n o t a g r e a t
d e a l of e x p l a n a t o r y power seems t o be l o s t . F o r example , e q u a t i o n s
(151 and (161 which use t h e same a v e r a g e speed r a n g e and a q u a d r a t i c
and a l i n e a r r e l a t i o n s h i p r e s p e c t i v e l y , have c o r r e s p o n d i n g
c o r r e l a t i o n c o e f f i c i e n t s o f 0.62 and 0.60.
Expe r imen ta l work of t h i s n a t u r e l e a d i n g t o t h e e s t a b l i s h m e n t o f
s i m i l a r r e l a t i o n s h i p s between f u e l consumpt ion and j o u r n e y speed h a s
a l s o been c a r r i e d o u t i n o t h e r c o u n t r i e s . The n e x t s e c t i o n d e a l s w i t h
t h e r e s u l t s o f work r e p o r t e d i n t h e U.S.. A u s t r a l i a and Sou th A f r i c a .
9 .2 Ove rseas f i n d i n g s
The N a t i o n a l I n s t i t u t e f o r T r a n s p o r t and Road R e s e a r c h (N.1.T.R.R.l
i n P r e t o r i a u n d e r t o o k some e x p e r i m e n t a l f u e l consumpt ion tes ts a s p a r t
of a s t u d y t o q u a n t i f y t h e c o s t s of t r a v e l i n urban a r e a s t h r o u g h o u t
South A f r i c a , P i e n a a r [19811. Those tests, which cove red r o u t e s i n a l l
t h e ma jo r u rban areas of t h a t c o u n t r y y i e l d e d t h e f o l l o w i n g e q u a t i o n :
where F and V a r e e x p r e s s e d a s b e f o r e . The c o e f f i c i e n t o f d e t e r m i n a t i o n
i s g i v e n a s 0.94 and t h e e x p r e s s i o n i s v a l i d f o r s p e e d s o f less t h a n
6 3 km/h.
Chang e t a1 [19761, a t G e n e r a l Motors i n t h e U.S., have p u t fo rward
a number o f e x p r e s s i o n s r e l a t i n g f u e l consumpt ion t o a v e r a g e j o u r n e y speed
u s i n g m a i n l y American v e h i c l e s . The v a l u e s found f o r kl and k2 i n
e u q a t i o n [ I l l a r e g i v e n i n T a b l e 11. The r e s u l t s of a n e a r l i e r
A u s t r a l i a n s t u d y are a l s o g i v e n i n t h e same t a b l e .
It was n o t p o s s i b l e t o e s t a b l i s h t h e ' g o o d n e s s - o f - f i t ' o f s u c h
e q u a t i o n s f rom t h e i n f o r m a t i o n a v a i l a b l e i n t h e r e f e r e n c e c i t e d above.

Table 11 Fuel consumption sub-models - c o e f f i c i e n t s kl and k2 f rom U.S. and A u s t r a l i a n s t u d i e s
kl k2 Reference Veh ic le Year [1/100 kml [ l / l O O h r s l - Chang e t a 1 (19761 Large- luxury American 1974 12.2 390.2
'S tandard ' American 1974 11.2 376.2 3. 'S tandard ' American 1975 9.5 347.0
'Subcompact' s t a t i o n
wagon - American 1975 7.2 212.4
Pe lensky et
a1 (19751 Stat ion-wagon
American 1965 6.2 214.2
When making compar isons w i t h t h e cor respond ing v a l u e s f o r t h e c o e f f i c i e n t s
kl and k ob ta ined i n t h e U.K. , it must be remembered t h a t a l l t h e U.S. v a l u e s 2
g i ven i n Tab le 7.1 were ob ta ined w i t h v e h i c l e s which have au tomat i c t r a n s -
miss ions. The eng ine s i z e s a r e a l s o c o n s i d e r a b l y l a r g e r t h a n i n t h e U.K.,
a l though no d e t a i l e d d a t a on v e h i c l e c h a r a c t e r i s t i c s is a v a i l a b l e from t h e
r e f e r e n c e i n q u e s t i o n . Fo r example, t h e ' s t a n d a r d ' American v e h i c l e of 1974
shown i n t h e Tab le had an e i g h t c y l i n d e r eng ine o f 6600 cc c a p a c i t y .
Although t h e American work i s no t d i r e c t l y t r a n s f e r a b l e t o European
v e h i c l e c h a r a c t e r i s t i c s , t h e results a r e s t i l l v e r y u s e f u l inasmuch a s t h e y
p rov ide f u r t h e r ev idence t h a t t h e i n v e r s e o f average journey speed i s t h e
t r a f f i c f l ow v a r i a b l e which b e s t h e l p s t o e x p l a i n urban fue l consumtpion
v a r i a t i o n s .
Chang e t a 1 (19761 have a l s o advanced a p h y s i c a l i n t e r p r e t a t i o n f o r t h e
c o e f f i c i e n t s k and k by a n a l y s i n g d a t a from s e v e r a l sou rces . The a u t h o r s 1 2
found k t o be approx imate ly p r o p o r t i o n a l t o t h e mass o f t h e v e h i c l e and 1
hence t o r o l l i n g r e s i s t a n c e . kl can t h e r e f o r e be s a i d t o r e p r e s e n t t h e
f u e l consumed p e r u n i t d i s t a n c e t o overcome r o l l i n g r e s i s t a n c e . k2 was found
t o be approx imate ly p r o p o r t i o n a l t o t h e i d l e f u e l f l o w r a t e and can be s a i d
t o r e p r e s e n t t h e f u e l consumed p e r u n i t d i s t a n c e t o overcome mechanical l o s s e s .
The r e l a t i o n s h i p between k l , ' ny and v e h i c l e c h a r a c t e r i s t i c s w i l l be f u r t h e r
d i s c u s s e d i n S e c t i o n 9.4.

9.3 Resu l ts f rom t h e Leeds Survey
The survey conducted i n Leeds us ing two instrumented veh ic les and
described i n Appendix A, prov ided l i n k and r o u t e data which enabled t h e
establ ishment o f r e l a t i o n s h i p s o f t h e type described i n t h e prev ious
sect ions - i .e . equat ion 11. The r e s u l t s obta ined us ing l i n k and r o u t e
data w i l l now be discussed i n tu rn .
a1 L i n k data
Data con ta in ing a complete se t o f l i n k v a r i a b l e s (described i n
Appendix A1 was a v a i l a b l e f o r a t o t a l o f 579 observat ions and a l l bu t 57
o f these are associated w i t h t h e same d r i v e r and veh ic le . F igu re 12 shows
a p l o t o f f u e l consumption p e r u n i t d is tance aga ins t t r a v e l speed f o r each
l i n k . Table 12 g i ves t h e values of k k and t h e i r respec t i ve standard 1' 2
e r r o r s and t h e c o r r e l a t i o n coe f f i c i en t f o r a number o f equat ions which were
obtained us ing d i f f e r e n t sub-sets o f t h e data. The l a t t e r were used t o
determine t h e s e n s i t i v i t y o f k and k t o changes i n : 1 2
a1 l i n k type (i.e. Radia l /Centra l Area)
b ) speed range
c l minimum l i n k length.
The f o l l o w i n g comments a r e now made i n r e l a t i o n t o Table 12.
i ) For a range o f t r a v e l speeds no t exceeding 60 km/h and excluding
those l i n k s whose lengths a r e sho r te r than 50 m ( t o avo id a t y p i c a l
t r a f f i c cond i t i ons i n very shor t sec t ions o f road), then equat ion
3 gives:
160.8 F = 5.41 + - V (191
2 where F i s i n 1/100 km and V i n km/h, and t h e R value i s 0.7.
There i s r e l a t i v e l y l i t t l e change i n t h e c o e f f i c i e n t s k and 1
k where t h e minimum l i n k lengths i s 100 m when a l l l i n k s are included. 2
ii I By cons ider ing t h e Rad ia l and Cen t ra l Area l i n k types separate ly
two q u i t e d i f f e ren t r e s u l t s a r e obtained. The explanatory power
o f t h e equat ions obta ined us ing Cent ra l Area data [R' = 0.46) i s
considerably lower t h a n t h a t of t h e corresponding equat ion f o r r a d i a l
l i n k s (R' = 0.771. Th is can be p a r t l y expla ined by t h e fac t t h a t a l l
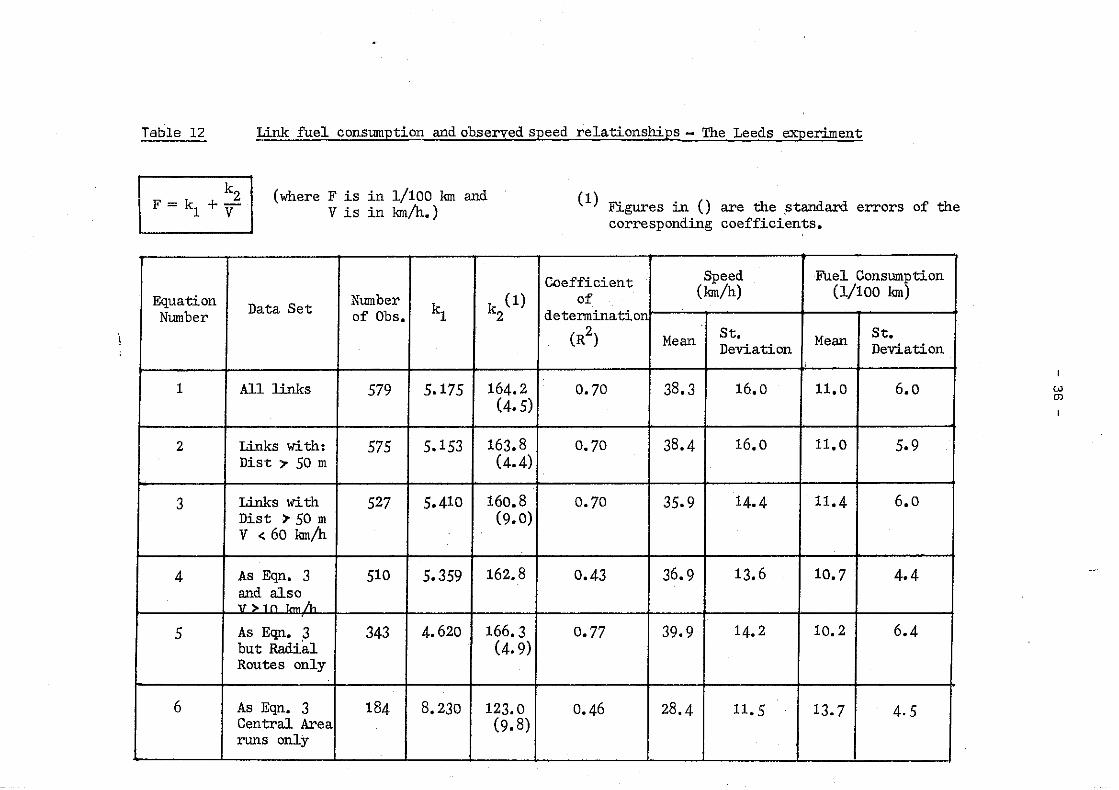
Table 12 Link f u e l consumption andobselved speed relat ionships - The Leeds experiment
(where F i s i n 1/100 km and V i s i n h/h.) Figures i n () are the standard er rors of the
corresponding coeff icients.
kl
5.175
5.153
5.410
5.359
4.620
8.230
Number of Obs.
579
575
527
510
343
184
-
164.2 (4.5)
163.8 (4.4)
160.8 (9.0)
162.8
166.3 (4.9)
123.0 (9.8)
Equation Number
- 1
2
3
4
5
- 6
Data Set
A l l l inks
&ks w i t h : Dist r 50 m
Links w i t h D i s t ? 50 m V < 60 h/h
A s Eqn. 3 and also v > l n h / h
A s Eqn. 3 but Radial Routes only
A s Eqn. 3 Central Area runs only
Coefficient of
determination'
( 2 )
0.70
0.70
0.70
0.43
0.77
0.46
Speed ( h / h )
Mean
38.3
38.4
35.9
36.9
39.9
28.4
7
Fuel Consumption (1/100 h)
St. Deviation
16.0
16.0
14.4
13.6
14.2
11.5
Mean
11.0
11.0
11.4
10.7
10.2
13.7
- St. Deviation
6.0
5.9
6.0
4.4
6.4
4.5

Centra l Area l i n k s used here a r e pa r t of t h e same route, whereas
t h e 343 r a d i a l observat ions cover f i v e d i f f e r e n t rou tes and there fore
have a l a r g e r degree of va r ia t i on i n t r a f f i c condi t ions. An
equat ion using only one t r a f f i c parameter, i . e . average speed, w i l l
perform b e t t e r with t h i s l a r g e r spread of va lues.
i i i l When t h e speed range i s r e s t r i c t e d t o speeds between 10 and 60
km/h t h e co r re la t i on c o e f f i c i e n t is again considerably lower (R' =
0.43) .
Other forms of f u e l consumption equat ions have been prOp0S~d (e.g.
Watson e t a1 (198211 and some of these were inves t iga ted here. Two
d i f f e r e n t formulat ions were used, namely:
al and F = a + -
0 v + a V + a q K E 2 (211
where a l l va r i ab les a r e a s before and KE is t h e l o s s of k i n e t i c energy a s
ca lcu la ted by t h e TRRL da ta ana lys i s program. If t h e number of d is tance
pu lses recorded i n t h r e e successive seconds a r e X t; Xt-l and Xt-2 such
t h a t X < Xt-l<Xt-2, then KE i s given by*: t
The s u m of t h e s e l osses of KE f o r each l i n k i s used i n t h e regress ion
a n a l y s i s descr ibed here.
The va lues found f o r t h e c o e f f i c i e n t s of equat ions (20) and (21)
a r e shown i n Table 13. Unless s t a t e d otherwise i n t h i s t a b l e a l l
c o e f f i c i e n t s were found t o be s t a t i s t i c a l l y s ign i f i can t a t t h e 99% l eve l
of confidence, al though t h e explanatory power of t h e equat ions has not
s i g n i f i c a n t l y improved with t h e add i t ion of t h e ex t ra terms of t h e two
equat ions.
. . . . . . . . . ... . . . . . . . . . ... ... . . . . . . ... . . . *
Obtained from an i n t e r n a l repo r t prepared by t h e Urban Networks -. . Divis ion of t h e TRRL.

Table 13 Fuel consumption average speed and k inet ic energy - Leeds experiment
!
* Not s ign i f icant a t 95% Confidence level .
1
Equation Number
1
2
3 *
Data Set
A l l l i nks
Links with Dist > 50 m V L 60 km/h
As i n Equation 2.
Number of Obs.
579
527
527
kl
3.692
0.1413e
8.470
R~
0.71
0.72
0.71
k2
163.8 (9.3)
178.6 (10.2)
143.1 (7.0)
k4
-0.0021 (0.0007)
-0.0046 (0.0019)
-
k3
0.135 (0.061)
0.318 (0.080)
-0.061 (0.015)
k5
-
-
-0.0035 (0.001)

bl Route da ta
The da ta was aggregated f o r each run of each rou te so t h a t t h e f u e l
consumption f o r each complete journey could be expressed i n terms of journey
speed. The mean speed of a l l runs was 37.6 km/h [standard deviat ion of
7.7 km/hl and t h e corresponding value f o r the:!Central Area rou te was 20.6
km/h [standard dev ia t ion of 4.7 km/hl. The fol lowing re la t i onsh ip was
obtained using da ta f o r 32 r u n s on t h e r a d i a l rou te and 6 runs on t h e
Central Area route:
where F and V a r e def ined a s before and a co r re la t i on coe f f i c i en t , R ~ .
of 0.99 app l ies . The standard e r r o r f o r k2 i s 15.2.
The da ta used t o der ive equat ion /231 i s shown graph ica l l y i n Figure
13. It i s seen from t h i s Figure t h a t t h e average r u n speeds a r e a l l i n t h e
range 20 t o 55 km/h. Since a g rea t dea l of t h e l i n k da ta va r ia t i on i s no
longer present here, t h e c o e f f i c i e n t s of equat ion (231 a r e considerably
d i f f e r e n t from those obtained using data f o r t h e same r u n s disaggregated
by l i n k - equation (191. The two curves obtained from using these two
equat ions a r e shown i n Figure 13 from which it i s seen t h a t very s i m i l a r
r e s u l t s a r e obtained i n t h e speed range of 20 t o 30 km/h.
9.4 A f u e l consumption sub-model f o r t h e U . K .
Using t h e r e s u l t s of t h e work reviewed so f a r i n t h i s Sect ion an attempt
is made now t o develop a sub-model i n which urbanfuelconsumption i s
expressed a s a l i n e a r funct ion of t h e inverse of average journey speed.
Such an expression is t o be used a t t h e area-wide aggregate l e v e l of d e t a i l
t o quant i fy t h e impacts of severa l UTN measures on f u e l consumption. The
inputs requi red a r e t o t a l d is tance t rave l l ed and t o t a l t ime spent t r a v e l l i n g
i .e . ove ra l l journey speed.
It was decided t o est imate t yp i ca l va lues f o r t h e c o e f f i c i e n t s kl and
k on t h e bas is of an average veh ic le of 1500 cc engine s i z e and a weight 2
of 940 kg. The re la t i onsh ips put forward by Chang st a 1 (19761 between kl
and veh ic le weight were inves t iga ted using ava i l ab le da ta from U.K.
experience. The same authors a l s o suggest t h a t k2 is approximately
propor t ional t o t h e i d l i n g f u e l r a t e of t h e vehic le . This f u e l r a t e may

I ~ i w e . ~ INf;TK!il;lENTE3 EARS -- LEEDS RLJNS I I FUEL CONSUME3 VS. RUN SPEED
RUN SPEED (KN/HR.
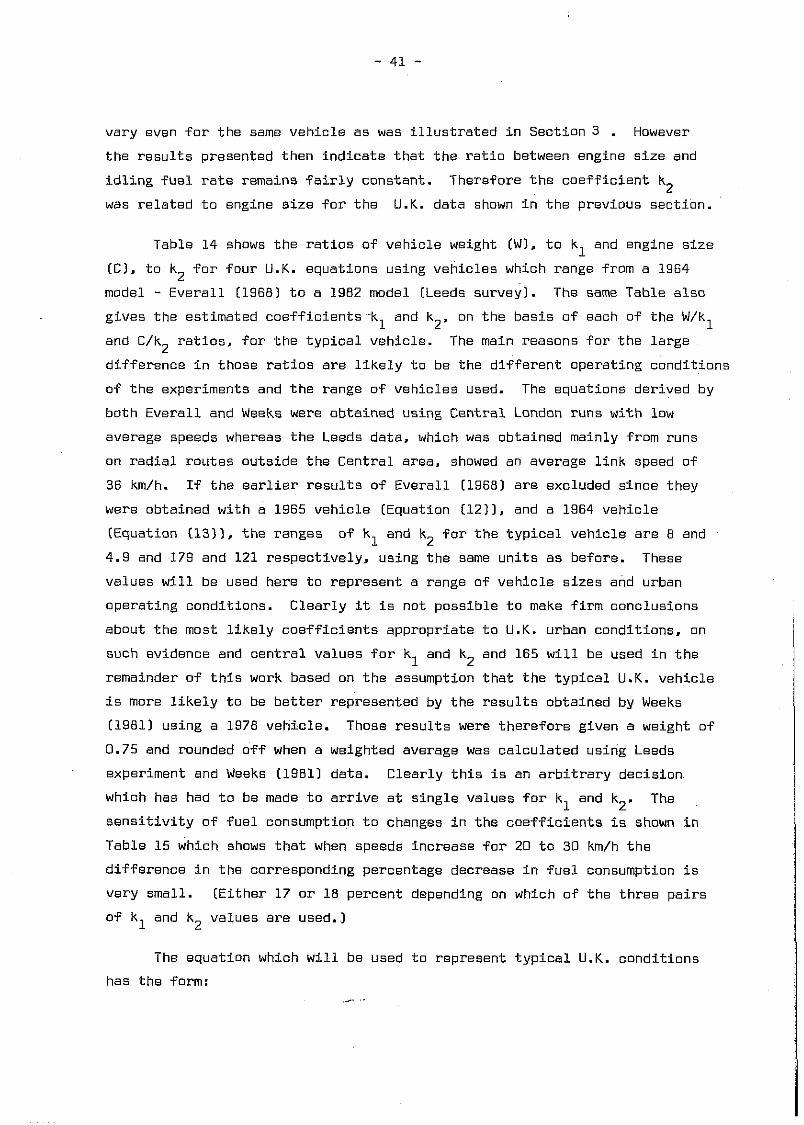
v a r y even f o r t h e same v e h i c l e as was i l l u s t r a t e d i n S e c t i o n 3 . However
t h e r e s u l t s p r e s e n t e d t h e n i n d i c a t e t h a t t h e r a t i o between e n g i n e s ize and
i d l i n g f u e l r a t e r e m a i n s f a i r l y c o n s t a n t . T h e r e f o r e t h e c o e f f i c i e n t k 2
was r e l a t e d t o e n g i n e size f o r t h e U.K. d a t a shown i n t h e p r e v i o u s s e c t i o n .
T a b l e 1 4 shows t h e r a t i o s of v e h i c l e we igh t [Wl, t o kl and e n g i n e size
[CI. t o k2 f o r f o u r U.K. e q u a t i o n s u s i n g v e h i c l e s wh ich r a n g e from a 1964
model - E v e r a l l (19681 t o a 1982 model [Leeds s u r v e y ) . The same T a b l e a l s o
g i v e s t h e e s t i m a t e d c o e f f i c i e n t s k and k2, on t h e b a s i s of each of t h e W/kl 1
and C/k r a t i o s , f o r t h e t y p i c a l v e h i c l e . The main r e a s o n s f o r t h e l a r g e 2
d i f f e r e n c e i n t h o s e r a t i o s are l i k e l y t o b e t h e d i f f e r e n t o p e r a t i n g c o n d i t i o n s
o f t h e e x p e r i m e n t s and t h e r a n g e of v e h i c l e s used. The e q u a t i o n s d e r i v e d by
b o t h E v e r a l l and Weeks were o b t a i n e d u s i n g C e n t r a l London r u n s w i t h low
a v e r a g e s p e e d s whereas t h e Leeds d a t a , which was o b t a i n e d ma in l y f rom r u n s
on r a d i a l r o u t e s o u t s i d e t h e C e n t r a l area, showed a n a v e r a g e l i n k speed o f
36 km/h. If t h e e a r l i e r r e s u l t s o f E v e r a l l [ I9681 are exc luded s i n c e t h e y
were o b t a i n e d w i t h a 1965 v e h i c l e [Equa t i on (1211, and a 1964 v e h i c l e
(Equa t i on (1311, t h e r a n g e s of kl and k f o r t h e t y p i c a l v e h i c l e a r e 8 and 2 4 .9 and 179 and 1 2 1 r e s p e c t i v e l y , u s i n g t h e same u n i t s as b e f o r e . These
v a l u e s w i l l be used h e r e t o r e p r e s e n t a r a n g e o f v e h i c l e sizes and u rban
o p e r a t i n g c o n d i t i o n s . C l e a r l y it i s n o t p o s s i b l e t o make f i r m c o n c l u s i o n s
a b o u t t h e most l i k e l y c o e f f i c i e n t s a p p r o p r i a t e t o U.K. u rban c o n d i t i o n s , on
s u c h e v i d e n c e and c e n t r a l v a l u e s f o r k and k2 and 1 6 5 w i l l be used i n t h e 1 r e m a i n d e r o f t h i s work based on t h e assumpt i on t h a t t h e t y p i c a l U.K. v e h i c l e
i s more l i k e l y t o be b e t t e r r e p r e s e n t e d by t h e r e s u l t s o b t a i n e d by Weeks
(19811 u s i n g a 1978 v e h i c l e . Those results were t h e r e f o r e g i v e n a w e i g h t of
0 .75 and rounded o f f when a w e i g h t e d a v e r a g e was c a l c u l a t e d u s i n g Leeds
e x p e r i m e n t and Weeks [19811 d a t a . C l e a r l y t h i s i s a n a r b i t r a r y d e c i s i o n
wh ich h a s had t o be made t o a r r i v e a t s i n g l e v a l u e s f o r kl and k2. The
s e n s i t i v i t y o f f u e l consumpt ion t o changes i n t h e c o e f f i c i e n t s is shown i n
T a b l e 1 5 wh ich shows t h a t when s p e e d s i n c r e a s e f o r 20 t o 3 0 km/h t h e
d i f f e r e n c e i n t h e c o r r e s p o n d i n g p e r c e n t a g e d e c r e a s e i n f u e l consumpt ion is
v e r y small. [ E i t h e r 1 7 o r 1 8 p e r c e n t depend ing on which of t h e t h r e e p a i r s
of kl and k v a l u e s are u s e d . ] 2
The e q u a t i o n which w i l l b e used t o r e p r e s e n t t y p i c a l U.K. c o n d i t i o n s
h a s t h e form: a. .

165 F = 7 + - v
where F is in l/lOO km and V in km/h.
This equation can be rewritten in the form:
FC = 0.070 + 1.65T (251
where FC is the total fuel consumed in a road network (in litresl
O is the total distance travelled (veh. km.1
and T is the total time taken iveh. hoursl.
Wagner (1980) in a recent study evaluating the impact of urban transport
improvements on energy consumption in the U.S. used the following equation:
where FC, D and T are defined as in equation (251.
These coefficients which are said to apply to the 1976 U.S. vehicle
fleet are 1.7 times the values for k and k given by the U.K. equation (251. 1 2
10. A MORE DETAILED FUEL CONSUMPTION SUB-MODEL
10.1 General
The type of fuel consumption sub-model described in the previous section
is deficient, in the context of urban traffic management evaluation, since
it does not take explicit account of the effect of acceleration/deceleration
cycles under congested driving conditions. We can have the situation where
the same total travel time is taken to travel a given distance on two different
runs although the number of stops made may be different. As far as fuel
consumption is concerned it clearly matters whether one's time is spent idling
in a queue or decelerating to and accelerating from a stopped position.
A number of researchers have highlighted this problem, and models which
take direct account of the number of stops have been proposed, Messenger et
a1 (19801, and Akcelik t19801. Such models usually take into account three
separate elements of an urban trip, namely:

Table 14 - Likely range of kl and k2 f o r a typ ica l vehicle
Assumed t o have a weight of 940 kg and an engine capacity of 1500 CC.
(from the resu l ts of Chapter 4).
c/k2
(cc/l/lOO hr)
r
Reference (Equation Nwnber
i n text)
Estimated Coefficie t f o r typical vehicle ?I?
kl ('/100 laan)
Everal l (1968) (73)'
Everal l (1968) (7.3)
Weeks (1981) (7.6),
Leeds experiment (7.10')
' \
m i n e Size (CC) k2
('/100 hr) - w/kl
(kg/l/lOO lan)
--- 3 5 1
1057
1703
1093
1993
9.1
8.9
8.4
12.4
2
125.9
138.7
116.8
193.0
7.5
6.8
8.0
4.9
165
169
179
121

Table "15. Fuel consumption sensitivity to changes in kl and k2
Average speed (V)

1 1 D i s t a n c e t r a v e l l e d a t c r u i s i n g speed [ D l
21 The amount of s t o p p e d time [Tsl
31 The number of s t o p s made (S l
F u e l consumpt ion , FC i s t h u s e x p r e s s e d as : -
where a = f u e l consumed a t a s t e a d y c r u i s i n g s p e e d 1
a = i d l e f u e l f l o w rate 2
a = e x c e s s f u e l p e r c o m p l e t e s t o p . 3
U n l i k e t h e s t a t i s t i c a l l y d e t e r m i n e d c o e f f i c i e n t s o f e q u a t i o n (111
v a l u e s f o r al, a and a3 c a n be e x p e r i m e n t a l y o b t a i n e d f o r any tes t v e h i c l e . 2 The c o e f f i c i e n t a r e p r e s e n t s t h e d i f f e r e n c e between t h e f u e l consumed 3 d u r i n g a comp le te s t o p / s t a r t c y c l e and t h a t f u e l wh ich would be consumed i f
t h e same d i s t a n c e was t r a v e l l e d a t a n assumed c r u i s i n g s p e e d as d i s c u s s e d
i n P a r t I. The t ime s p e n t s t o p p e d is n o t i n c l u d e d h e r e s i n c e it is a l r e a d y
a l l owed f o r unde r t h e second term o f t h e e q u a t i o n . The most commonly used
t ra f f i c s i m u l a t i o n mode ls s u c h as TRANSYT estimate t o t a l d e l a y e x p e r i e n c e d ,
Robe r t son (19691. T h i s i n c l u d e s n o t o n l y t h e s t o p p e d time b u t a l s o t h e d e l a y s
a s s o c i a t e d w i t h e a c h s t o p . T h e r e f o r e . i f t h e r e s u l t s of s u c h mode ls are t o
be used t o estimate f u e l consumpt ion i t i s n e c e s s a r y t o a d j u s t e q u a t i o n (271.
F i g u r e 7.10 shows a s a n example t h e t i m e - d i s t a n c e d i a g r a m f o r a v e h i c l e
which s t o p s once a t a s i g n a l i s e d j u n c t i o n . The t o t a l s t o p p e d time, Ts, i n
t h i s case i s g i v e n by:
[Note: C a p i t a l T i s used t h r o u g h o u t t o d e n o t e t h e summation, f o r t h e
c o r r e s p o n d i n g v a l u e s o f s m a l l t, o v e r a l l v e h i c l e s . )
where S = t h e t o t a l number of s t o p s made i n t h e manner i l l u s t r a t e d by
F i g u r e 14 , i .e. f r om a c r u i s i n g speed V t o 0 a n d back t o V.
and d and a are t h e d e c e l e r a t i o n and a c c e l e r a t i o n rates which are b o t h
assumed c o n s t a n t and p o s i t i v e .
If w e make t h e f u r t h e r s i m p l i f y i n g assumpt i on t h a t d = a = k
t h e n e q u a t i o n (281 becomes: '

Figure 14. -. Time vs. distance diagram: s ingle s top

From equations (271 and (231 we have:
v FC = a l D + a (T - - S ) + a s 2 De l k 3
(301
A k c e l i k (19801 has der ived such an expression and used i t i n con junc t ion
w i t h f u e l consum~t ion est imates from TRANSYT r e s u l t s .
Before us ing t h e r e s u l t s o f Pa r t I t o a r r i v e a t t y p i c a l va lues f o r t h e
c o e f f i c i e n t s a a and a i t i s important t o s t ress t h e d i f f e r e n c e 1' 2 3'
between a t h e excess f u e l determined exper imenta l ly . and a ' c o r r e l a t e d ' 3'
c o e f f i c i e n t , a ' shown i n equat ion (311 and g iven by 3'
where a l l symbols a r e as above.
Although a; does n o t represent any phys i ca l v e h i c l e f u e l consumption
c h a r a c t e r i s t i c i t enables t h e ou tputs o f t r a f f i c f l o w models t o be used
d i r e c t l y i n t h e es t ima t ion o f f u e l consumption. The adjustment f a c t o r v
- a2 - t o be app l i ed t o t h e c o e f f i c i e n t a i s shown i n Table 16 f o r a
3 range o f a c c e l e r a t i o n and dece le ra t i on r a t e s and f i n a l and i n i t i a l speeds.
Those f a c t o r s were c a l c u l a t e d us ing t h e va lue of a of 1.2 l / h r ob ta ined i n 2 Sect ion 3. Using equat ion (321 and t h e r e s u l t s shown i n P a r t I, Table 9,
f o r t h e excess f u e l consumed a t d i f f e ren t speeds, a i t i s poss ib le t o 3'
c a l c u l a t e t h e adjusted c o e f f i c i e n t , a ' As an example, F igu re 15 shows t h e 3'
way i n which bo th a3 and a ' vary w i t h i n i t i a l and f i n a l speeds f o r t h e case 3
o f a c c e l e r a t i o n and dece le ra t i on r a t e s remaining constant and equal t o 0.8 2
m/s . It i s important t o note t h a t a l l excess f u e l c a l c u l a t i o n s r e f e r t o t h a t
f u e l which i s consumed over and above t h a t which would have been used t o
t r a v e l t h e same d is tance a t a c r u i s i n g speed o f 48 km/h, i r r e s p e c t i v e . o f
t h e a c t u a l i n i t i a l and f i n a l speed been considered. The f o l l o w i n g values
a r e obta ined f o r a3 and a ' where t h e r e s u l t s described i n P a r t I r e l a t i n g 3'
t o t h e Leeds survey are used - i .e. us ing average a c c e l e r a t i o n and 2
dece le ra t i on r a t e s of 0.75 m/s . and assuming a c r u i s i n g speed of 48 km/h.:

a Initial and final speed 3 a;
(km/hl (mll (ml I
The following coefficients of equation (311 can now be put forward:
where FC is in litres; D in veh-kms: Toel in veh-hours and S is the number
of complete stops.
Table 16 Adjustment factors for the coefficient a3-
Adjustment factor (mll [ll
I v I initial and [ = a -1
2 k I
(I1 Assumes a = 1.2 l/hr. 2
final speed, V [ km/hl
a = 0.07 l/km following the constant speed fuel consumption 1
analysis of Section 4, this vehicle assumes a cruising
speed of 48 km/h and a vehicle of 1500 cc engine.
acceleration and deceleration rate.
a = 1.2 l/hr follwing the idling fuel consumption analysis of 2
Section 3. assuming a vehicle of 1500 cc engine.

a ' = 0.009 l / s t o p is t h e ' a d j u s t e d ' e x c e s s f u e l o b t a i n e d above 3
f o r a n a v e r a g e i n i t i a l and f i n a l s p e e d of 3 0 km/h. T h i s is
a p p r o x i m a t e l y t h e a v e r a g e speed found f rom t h e Leeds e x p e r i m e n t
f o r i n i t i a l and f i n a l s p e e d s and i s used h e r e as t y p i c a l of
u rban a r e a d r i v i n g c o n d i t i o n s . It r e p r e s e n t s t h a t a v e r a g e
speed f rom wh ich v e h i c l e s are l i k e l y t o d e c e l e r a t e t o a s t o p
u n d e r a c o n s t a n t d e c e l e r a t i o n r a t e , and l i k e w i s e d u r i n g t h e
a c c e l e r a t i o n f rom t h a t s t o p . The e x c e s s f u e l r e p r e s e n t s t h e
d i f f e r e n c e between t h e f u e l consumed d u r i n g a s t o p / s t a r t
manoeuvre f r o m and t o a speed of 3 0 km/h, and t h a t f u e l which
would have been consumed i f t h e same d i s t a n c e was t r a v e l l e d
a t t h e nomina l c r u i s i n g speed o f 48 km/h. I n a model which
d o e s n o t d i f f e r e n t i a t e between t y p e s of s t o p / s t a r t manoeuvres
t h e d i f f e r e n c e i n assumed c r u i s i n g and s t o p / s t a r t s p e e d s
r e p r e s e n t t h e f a c t t h a t a t a n i n t e r s e c t i o n a p p r o a c h , s u b s e q u e n t
s t o p s a f t e r t h e f i rst a r e made f rom and t o v e r y low s p e e d s
and it would be u n r e a l i s t i c t o estimate t h e e x c e s s f u e l assuming
s t o p / s t a r t i n i t i a l and f i n a l s p e e d s e q u a l t o t h e assumed
c r u i s i n g speed . The a l t e r n a t i v e a p p r o a c h would be assume a
c r u i s i n g s p e e d o f 30 km/h when e s t i m a t i n g b o t h e x c e s s f u e l
and t h e t r a v e l d i s t a n c e c o e f f i c i e n t (0 .07 l / kml . However s u c h
a n assumpt i on would i m p l y a n u n r e a l i s t i c a l l y l ow c r u i s i n g
speed . A l though t h e a v e r a g e i n i t i a l and f i n a l s p e e d f o r a
s t o p was f o u n d t o be i n t h e r e g i o n o f 3 0 km/h f o r t h e Leeds
e x p e r i m e n t , t h i s d o e s n o t mean t h a t t h e v e h i c l e s were c r u i s i n g
a t t h o s e s p e e d s b u t r a t h e r t h a t t h e y s t a r t e d d e c e l e r a t i n g
(and s t o p p e d a c c e l e r a t i n g ) a t a more o r less c o n s t a n t r a t e .
The f o l l o w i n g r e g r e s s i o n e q u a t i o n was o b t a i n e d u s i n g d a t a f rom t h e
Leeds s u r v e y f o r e a c h c o m p l e t e r u n :
where t h e n o t a t i o n is as b e f o r e a n d O e l was d e f i n e d as t h e d i f f e r e n c e
between t h e a c t u a l r u n t ime and t h e time it would t a k e t o t r a v e l t h e same
d i s t a n c e a t a c o n s t a n t c r u i s i n g s p e e d o f 48 km/h. -. .
The c o e f f i c i e n t s a and a2 of e q u a t i o n (331 are r e p r e s e n t a t i v e of t h e 1

a v e r a g e v e h i c l e . The e x c e s s f u e l c o e f f i c i e n t i s o n l y g i v e n a s a n example
o f t h e s p e c i f i c c o n d i t i o n s f ound d u r i n g t h e Leeds s u r v e y s i n c e it a p p l i e s
t o a v e h i c l e which i s b o t h l a r g e r [ i n e n g i n e c a p a c i t y t e r m s 1 and much
younger t h a n t h e t y p i c a l v e h i c l e . Fu r the rmore t h a t c o e f f i c i e n t was
d e r i v e d assuming t h a t t h e a v e r a g e s t o p is made f r o m a s p e e d of 3 0 km/h.
It t h e r e f o r e r e p r e s e n t s t h e d i f f e r e n c e between t h e a c t u a l f ue l consumed
by s u c h a s t o p and t h a t which would have been consumed i f t h e same d i s t a n c e
was t r a v e l l e d a t t h e c r u i s i n g speed of 4 8 km/h. By v a r y i n g t h e assumpt i on
of a v e r a g e i n i t i a l and f i n a l s p e e d s f o r t h e a v e r a g e s t o p it i s n e c e s s a r y
t o change a ' a c c o r d i n g l y . However, s i n c e t h e same c r u i s i n g s p e e d is assumed 3
t h r o u g h o u t , t h e d i s t a n c e c o e f f i c i e n t , a w i l l remain u n a l t e r e d . 1 '
The l a t e s t v e r s i o n o f t h e TRANSYT program - TRANSYT 8 - u s e s a f u e l
consumpt ion sub-model o f t h e fo rm o f e q u a t i o n (331 w i t h t h e f o l l o w i n g
c o e f f i c i e n t s : a = 0.07: a2 = 1.5 and a = 0.008 where t h e u n i t s are 1 3
as g i v e n f o r t h a t e q u a t i o n , V i n c e n t et a1 (19801. The main d i f f e r e n c e
i s i n t h e i d l e f u e l rate, a which i n t h e case of TRANSYT was d e r i v e d 2'
f rom e x p e r i m e n t a l tests u s i n g a l a r g e r e n g i n e s i z e v e h i c l e (2200 c c l .
10 .2 The SATURN f u e l consumpt ion sub-model
The SATURN t ra f f ic s i m u l a t i o n and a s s i g n m e n t model combines a
c o n v e n t i o n a l e q u i l i b r i u m a s s i g n m e n t model w i t h a d e t a i l e d t r a f f i c s i m u l a t i o n
model. The l a t t e r i s based on t h e same p r i n c i p l e s and assumpt i on which
TRANSYT u s e s b u t d e a l s w i t h e a c h t u r n i n g movement i n more d e t a i l .
The o u t p u t a v a i l a b l e f rom SATURN is p a r t i c u l a r l y s u i t e d f o r t h e
e s t i m a t i o n of f u e l consumpt ion as a l l t r a f f i c v a r i a b l e s of t h e sub-model
fo rm g i v e n by e q u a t i o n (311 are p r e s e n t i n SATURN.
A more d e t a i l e d e x p r e s s i o n f o r t h e c a l c u l a t i o n of f u e l consumpt ion
c a n be o b t a i n e d by t h e i n c l u s i o n o f more t h a n o n e t y p e of s t o p made by a
v e h i c l e a t a j u n c t i o n . One p o s s i b l e a p p r o a c h i s t o c o n s i d e r a v e r a g e
v a l u e s f o r t h e e x c e s s f u e l consumed f o r two d i s t i n c t t y p e s o f s t o p :
(11 The e x c e s s f u e l consumed when a v e h i c l e d e c e l e r a t e s
from a n a v e r a g e c r u i s i n g s p e e d t o a s t o p and accelerates
back t o t h e same a v e r a g e c r u i s i n g s p e e d [which w i l l
c o n t i n u e t o b e ' p e f e r r e d t o as a31.

and
(2) The excess f u e l consumed by t h e average subsequent s top a f t e r
t h e f i r s t . This w i l l be re fe r red t o as a4 and represents
t h e excess f u e l consumed when a v e h i c l e acce lera tes f rom a
stop t o a lower speed and decelerates back t o a stop, i .e .
t h e 'queue'crawl ing' manoeuvre analysed i n P a r t I.
From t h e - r e s u l t s g iven i n t h e previous Sect ion a f u e l consumption
expression can be pu t forward w i t h the fo l l ow ing coe f f i c i en ts :
Where t h e c o e f f i c i e n t o f S1 - 0.016 l i t r e s / s t o p - assumes t h a t f i r s t t ime
stops are made from an average speed o f 48 km/h - t h e assumed c r u i s i n g
speed - and t h e c o e f f i c i e n t o f S2 - 0.005 l i t r e s / s t o p - assumes t h a t t h e
average 'queue-crawling' stop reaches a speed of 20 km/h. Both coe f f i c i en ts .
which are obta ined from Sect ion 10.1, were t h e r e f o r e de r i ved through
somewhat a r b i t r a r y average speed assumptions. Equation (351 shows t h e
d e f a u l t c o e f f i c i e n t va lues p resen t l y used i n SATURN a l though i t i s poss ib le
t o a r r i v e a t d i f f e r e n t values by us ing o the r assumptions more appropr ia te
t o l o c a l cond i t i ons and t h e methodology presented i n P a r t I.
11. A COMPARISON OF SUB-MODELS USING SATURN OUTPUT DATA
The t h r e e types o f f u e l consumption sub-models p u t forward i n t h e
two prev ious sec t ions - i .e . t h e simple 'average speed' expression
[equat ion (2511,the more d e t a i l e d sub-model w i t h 3 v a r i a b l e s (equat ion (3311
and t h e SATURN expression us ing f o u r va r i ab les (equat ion [3511 - a r e now
compared us ing t h e r e s u l t s from a run o f SATURN w i t h da ta from t h e Cen t ra l
area o f L iverpoo l . The s e n s i t i v i t y of t h e f i n a l f u e l consumption est imates
t o changes i n t h e values o f t h e coe f f i c i en ts o f t h e sub-models i s a l s o
i n v e s t i g a t e d here.
The f o l l o w i n g se t o f SATURN outputs was used i n t h i s ana lys i s :
T o t a l number o f v e h i c l e t r i p s = 32982
T o t a l d is tance t r a v e l l e d [Dl = 26840 pcu kms/hr
T o t a l delayed t ime [Ttiell = 642 pcu hrs /hr

Total travel time [TI = 1306 pcu hrs/hr
Average speed = 20.5 kms/hr
Total number of first stops (S1l = 84953
Total number of secondary stops [S21 = 23910
These data refers to a run of SATURN using an evening peak origin-
destination vehicle trip matrix and a network which represents the base
year situation C19781 in the Central area of Liverpool.
Using the above data and equations (251, I331, and (351 the results
shown in Table 17 were obtained. The simple 'average speed' sub-model
gives an estimate of fuel consumption which is just over 2 percent lower
than that given by the SATURN expression - equation (351. Using equation
(331 the fuel consumption obtained is 12 percent lower than that given by
the SATURN model. Considering the estimates given by equation (351, we
have the following contributions of its constituent terms to the total
of 4128 litres shown in Table 17:
[il Distance term = 45 percent
(iil Delay term = 19
(iiil First stop term = 33
(ivl Subsequent stops term = 3
Table 17 Comparing the results of three fuel consumption sub-models
Where S is the total number of stops - [i.e. S1 + S21
Sub-model
0.07 0 + 1.65 T
0.07 0 + 1.2 TDel +
0.009 s O.Oy 0 + 1.2 TDel +
0.016 S1 + 0.005 S2
Therefore, for this example, changes in the coefficients representing
excess fuel due to first time stops are over ten times more important as
those in the coefficient representing the 'queue-crawling' manoeuvre.
Equation number in test
(251
(331
(351
Total fuel consumed, FC
Ill
4034
3629
4128
Consumption rate 11/100 kml
15.0
13.5
15.4

C l e a r l y t h e s e r e s u l t s are v e r y s e n s i t i v e t o t h e s p e c i f i c c a s e b e i n g
c o n s i d e r e d .
12 . SUMMARY AN0 DISCUSSION
Two t y p e s o f u rban f u e l consumpt ion e s t i m a t i o n p r o c e d u r e were
i n v e s t i g a t e d i n P a r t 11. A b r i e f summary o f t h e r e s u l t s o b t a i n e d f o r
e a c h w i l l now be g i v e n i n t u r n .
t i 1 A l i n e a r r e l a t i o n s h i p between f u e l consumed [FC). and t o t a l
d i s t a n c e t r a v e l l e d . 0. and t o t a l t r a v e l time, T, of t h e form:
FC = K1 0 + k2 T
where k and k are c o n s t a n t s found f r o m e m p i r i c a l e v i d e n c e and 1 2
V i s c a l c u l a t e d u s i n g t o t a l t r a v e l time i n c l u d i n g a l l d e l a y and
s t o p p e d time. The e v i d e n c e p r e s e n t e d i n S e c t i o n 9 s u g g e s t s t h a t
by u s i n g s u c h a n e q u a t i o n o n l y some s i x t y t o s e v e n t y p e r c e n t o f
t h e v a r i a t i o n i n f u e l consumpt ion, f rom one r o a d s e c t i o n t o
a n o t h e r , i s e x p l a i n e d .
I n s p i t e o f t h i s s h o r t c o m i n g such a n e x p r e s s i o n is u s e f u l i n
t h a t it can be used w i t h t h e o u t p u t of c o n v e n t i o n a l t r a n s p o r t
demand m o d e l l i n g t e c h n i q u e s . The t r a d i t i o n a l f o u r - s t e p p r o c e s s
wh ich b e g i n s w i t h t r i p g e n e r a t i o n and e n d s w i t h t h e l o a d i n g of
t r a f f i c o n t o a r o a d network, i . e . t r a f f i c ass ignmen t , p r o v i d e s
o v e r a l l d i s t a n c e t r a v e l l e d and time s p e n t on t h e ne twork , t h u s
e n a b l i n g f u e l consumpt ion t o be e s t i m a t e d d i r e c t l y .
The a v e r a g e v e h i c l e f o r t h e U.K. p a s s e n g e r c a r f lee t was t a k e n
t o have a n e n g i n e size o f 1500 cc. A l though t h i s v a l u e i s s u b j e c t e d
t o e r r o r s , t h e s u b s e q u e n t u s e t o which i t i s p u t h e r e means t h a t
t h e v a l u e is f a i r l y i n s e n s i t i v e t o s m a l l changes i n v e h i c l e size.
F o r s u c h a n a v e r a g e v e h i c l e t h e v a l u e s f o r K and K which were 1 2 p u t f o r w a r d a r e 0.07 l/km and 1.65 l / h r r e s p e c t i v e l y .
( i i l More d e t a i l e d e x p r e s s i o n s were a l s o a n a l y s e d i n wh ich f u e l
consumpt ion [F ) is g i v e n as a l i n e a r f u n c t i o n of t o t a l d i s t a n c e
t r a v e l l e d [ D l , t o t a l d e l a y [Toell, t h e t o t a l number of f i rs t time

s tops a t an approach t o an i n te rsec t i on (S I ' and t h e t o t a l number 1
of subsequent s tops a f t e r t h e f i r s t [ S I*. The fol lowing expressions 2
were p u t forward:
and FC = 0.07 D + 1.2 TDel + 0.009 S
where S. = S + SZ. - 1
The fol lowing assumptions were made when es t imat ing t h e above
c o e f f i c i e n t s :
a ) The average c ru i s ing speed coe f f i c i en t . 0.07 l / km, assumes
an average c ru i s ing speed of 48 km/h Li.e. t h e speed l i m i t
on most urban roads) .
bl The excess f u e l c o e f f i c i e n t re la ted t o t h e t o t a l number of
s tops , S, assumes t h a t t h e average s top is made from a speed
of 30 km/h.
c l The excess f u e l coe f f i c i en t re la ted t o t h e number of f i rst
t ime s tops (S 1 i s based on an average i n i t i a l and f i n a l 1
speed f o r such s tops of 48 km/h, i . e . t h e same a s t h e assumed
c ru i s ing speeds.
d ) The excess f u e l r e l a t e d t o t h e number of subsequent s tops
a f t e r t h e f i rst , i . e . t h e 'queue-crawling' manoeuvre, assumes
average i n i t i a l and f i n a l speeds f o r such s t o p s of 20 km/h.
Although such an assumption i s somewhat a r b i t r a r y - t h e
ana lys i s of s tops i n t h e Leeds experiment was not disaggregated
i n t h i s way - it i s f e l t t h a t t h i s i s a reasonable assumption,
given t h e ove ra l l d i s t r i b u t i o n of f i n a l and i n i t i a l speeds i n
t h e Leeds case.
A comparison of t h e r e s u l t s of using t h e t h r e e f u e l consumption
* S and S represent respec t i ve l y the va lues of f i r s t t ime and subsequent
1 2 s tops summed over a l l approaches and over a l l i n t e r s e c t i o n s .

express ions descr ibed under ( i l and [ i i l above was undertaken using t h e
SATURN t r a f f i c simulation/assignment model with da ta from t h e Centra l Area
of Liverpool. Using t h e ' t y p i c a l ' va lues given above f o r t h e coe f f i c i en ts
of both equat ions, t h e f i n a l f u e l consumption t o t a l s were found t o be
within 12 percent of each o ther . The ove ra l l veh i c le consumption r a t e
of 13.5 t o 15.4 l i t r e s per 100 km f o r t h e average 1500 cc engine veh ic le
found from these r e s u l t s should be compared with t h e 14.3 l i t r e s per km
found by Weeks. t19811 using an- instrumented veh ic le of 1100 cc i n Centra l
London. The average journey speeds f o r both cases a r e very s i m i l a r [ i . e .
f o r t h e Centra l Area of Liverpool, a s given i n Sect ion 11, t h e average
journey speed was 20.5 km/h and speeds i n Centra l London a r e c lose t o
t h i s * ] .
The case f o r using a p a r t i c u l a r method of f u e l consumption est imat ion
depends on t h e use t o which t h e r e s u l t s w i l l be put , i . e . t h e reasons f o r
t h e est imat ion i n t h e first ins tance, a s wel l a s on t h e l e v e l of d e t a i l
of t h e a v a i l a b l e input data. The more de ta i l ed express ion, which inc ludes
the two types of s tops a s descr ibed i n Sect ion 10.2 is t o be pre fer red f o r
an evaluat ion of a number of d i f f e r e n t t r a f f i c management schemes f o r an
urban a rea where t h e degree of congestion is high and t h e main ob jec t ive
i s t o a l l e v i a t e t h a t congestion. This is t h e case of such t r a f f i c management
measures a s improvements t o junct ion cont ro l [ e i t h e r i nd i v idua l l y o r a s
p a r t of an area t r a f f i c cont ro l system], veh ic le r e s t r a i n t measures o r
t h e in t roduc t ion of environmental areas.
A s was discussed i n Sect ion 6, t h e coe f f i c i en ts given above do not
inc lude t h e e f f e c t of s t a r t i n g with a cold engine which, a s was seen, can
be considerable i n t h e case of very sho r t t r i p s . If t h e average journey
length and t h e proport ion of t r i p s which s t a r t from cold a r e known, it
is poss ib le t o ad jus t t h e equat ions by adding an a d d i t i o n a l term which
would be a constant - i . e . t h e excess f u e l due t o a ' co ld ' s t a r t per t r i p - t imes t h e number of t r i p s a f fec ted .
Other f a c t o r s not accounted f o r d i r e c t l y by any of t h e sub-models . . . . . ... . . . ... . . . ... ... . . . ... . . . . . . ... *
The average speeds f o r t h e Centra l Area of London i n 1980 were 19.4
km/h and 18.6 km/h i n t h e peak and off-peak respec t ive ly , [GLC
T r a f f i c Monitoring Review; 1981).

proposed h e r e i n c l u d e t h e effect o f slowdowns and o t h e r s p e e d f l u c t u a t i o n s ,
a s well a s t h e effect o f d i f f e r e n t g r a d i e n t s . T h i s l a t t e r f a c t o r may
be i m p o r t a n t when t r a n s f e r r i n g t h e r e s u l t s i n s p a c e o r when q u a n t i f y i n g
t h e e f fects o f UTM measu res which a r e l i k e l y t o c a u s e r e r o u t i n g t o o r
f rom l i n k s o f c o n s i d e r a b l y d i f f e r e n t g r a d i e n t s .

REFERENCES
AKCEKLIC. R. [19801. S t o p s a t t r a f f i c s i g n a l s . Proceed ings:
A u s t r a l i a n Road Research Conference. Vermont South , V i c t o r i a .
AKCELIC, R . (1982). D e r i v a t i o n and c a l i b r a t i o n o f f u e l consumption
models. A u s t r a l i a n Road Research Board. A I R 367-3. ARRB, Vermont
South. V i c t o r i a .
CHANG. M . , EVANS, L. and WASIECEWSKI, P. (1976). Gaso l ine consumption
i n urban t r a f f i c . T r a n s p o r t a t i o n Research Record 599, Washington.
CLAFFEY, P.J. (19711. Running c o s t s o f motor v e h i c l e s a s a f f e c t e d by
road des ign and t r a f f i c . Highway Research Board, NCHRP Repor t 111,
Washington.
CLAFFEY, P.J. (19761. Passenger c a r fue l c o n s e r v a t i o n . F e d e r a l Highway
Admin is t ra t i on . Repor t FHWA-PL-77009, Washington.
EVANS, L. and TAKASAKI, G.N. [1981]. Fuel used t o a c c e l e r a t e v e h i c l e s
from r e s t t o c r u i s i n g speeds. Genera l Motors Research, GMR - 3555,
G.M. L a b o r a t o r i e s , D e t r o i t .
EVERALL, P.F. (19681. The e f f e c t of road and t r a f f i c c o n d i t i o n s on
f u e l consumptian. TRRL Report LR 226. TRRL, Crowthorne.
EVERALL, P.F. and NORTHROP. J. (19701. The e x c e s s f u e l consumed by
c a r s when s t a r t i n g from c o l d . TRRL Report LR 315. TRRL, Crowthorne.
FERREIRA, L.J.A. [19801. The s i m u l a t i o n of v e h i c l e s t o p s i n SATURN.
I n s t i t u t e f o r T r a n s p o r t S t u d i e s . Techn ica l Note 32. U n i v e r s i t y
o f Leeds, Leeds.
FRYBOURG, A. (19791. Les consommations u r i t a i v e s d ' e n e r g i e d a n s l e s
t r a n s p o r t s . M i n i s t e r e d e s T ranspor ts , P a r i s .
- MESSENGER, G . S . , RICHARDSON, 0.8.. GRAFFE, P.W. and MUFTI, J.H. [19801.
Urban t r a f f i c s i g n a l c o n t r o l f o r f u e l economy. Na t iona l Bus Counci l ,
Mechanical Eng ineer ing Report ME - 247, Ottawa.

PELENSKY. E., BLUNDEN, W.R. and NUNRO, R.D. (19681. O p e r a t i n g c o s t s of
cars i n u rban a r e a s . P roceed ings , 4 t h A u s t r a l i a n Road Resea rch
Board Conference . ARRB, Vermont South , V i c t o r i a .
PIENAAR, W.J. (19811. C o s t o f c a r t r a v e l i n S o u t h A f r i c a n c i t ies .
N a t i o n a l I n s t i t u t e f o r T r a n s p o r t and Road Resea rch , T e c h n i c a l
R e p o r t RT/1/81. CSIR, P r e t o r i a .
PIENAAR, W.J. and JURGENS, F.X. (19801. Car f u e l consumpt ion r a t e s i n
S o u t h A f r i c a n c i t ies . N a t i o n a l I n s t i t u t e f o r T r a n s p o r t and Road
Research . T e c h n i c a l Repo r t RT/46/80. CSIR, P r e t o r i a .
RICHARDSON, A . J . (19821. The u s e of v e h i c l e maps i n t h e d e r i v a t i o n of
s t o p - s t a r t f u e l consumpt ion rates. Second Con fe rence on T r a f f i c ,
ene rgy and e m i s s i o n s . A u s t r a l i a n Road R e s e a r c h Board, Vermont.
V i c t o r i a .
ROBERTSON, 0.1. (19691. TRANSYT: A network s t u d y t o o l . TRRL R e p o r t
LR 253. TRRL, Crowthorne.
ROBERTSON, D.I., LUCAS, C.F. and BAKER, R.T. (19801. Co -o rd ina t i ng
t ra f f ic s i g n a l s t o r e d u c e f u e l consumpt ion . TRRL Repo r t LR 934.
TRRL, Crowthorne.
VINCENT. R.A.. MITCHELL, A . I . and ROBERTSON, 0.1. (19801. User g u i d e
t o TRANSYT - v e r s i o n 8. TRRL Repo r t LR 888. TRRL, Crowthorne.
WAGNER, F.A. (19801. Energy i m p a c t s o f u rban t r a n s p o r t a t i o n improvements.
P r e p a r e d f o r t h e I n s t i t u t e o f T r a n s p o r t a t i o n E n g i n e e r s , Wagner-Mcgee
A s s o c i a t e s , I n c . , A lexand r i 6 , V i r g i n i a .
WATERS, M. and LAKER, I. (19801. Resea rch on f u e l c o n s e r v a t i o n f o r cars.
TRRL Repo r t LR 921. TRRL, Crowthorne.
WATSON, H.C. U9801. S e n s i t i v i t y o f f u e l consumpt ion and e m i s s i o n s t o
d r i v i n g p a t t e r n s and v e h i c l e d e s i g n . A u s t r a l i a n Road Resea rch -. . Board Con fe rence V a n t r a f f i t management r e d u c e fuel consumpt i on? '
Vermont Sou th , V i c t o r i a .

WATSON, H.C., MILKINS, E., PRESTON, M.. BEAROSLEY, P. (19821. Fur ther
app l i ca t i on of t h e PKE - Average speed f u e l consumption and
emissions model. Austra l ian Road Research Board Conference on
T ra f f i c , Energy and Emissions. ARRB, Vermount South, V ic tor ia .
WEEKS, R . (19811. Fuel consumption of a d i e s e l and a p e t r o l c a r .
TRRL Report LR 964. TRRL, Crowthorne.

APPENDIX A
THE LEEDS FUEL CONSUMPTION SURVEY
USING INSTRUMENTED VEHICLES
A 1 INTRODUCTION
T h i s Appendix d e s c r i b e s a n expe r imen t conduc ted i n May 1982 w i t h two
i n s t r u m e n t e d cars p r o v i d e d by t h e T r a n s p o r t and Road Resea rch L a b o r a t o r y
(TRRL]. The o r i g i n a l aims o f t h e expe r imen t were t o test t h e a u t o m a t i c
r e c o r d i n g o f j o u r n e y times a s p a r t o f a r e s e a r c h p r o j e c t c u r r e n t l y under-
way a t t h e ITS. U n i v e r s i t y o f Leeds, concerned w i t h t h e m o n i t o r i n g o f
u rban c o n g e s t i o n . It was d e c i d e d t o e x t e n d t h e s c o p e of t h e expe r imen t
by add ing an a d d i t i o n a l r o u t e c o v e r i n g t h e C e n t r a l Area o f Leeds t o t h e
f i v e r a d i a l r o u t e s o r i g i n a l l y p l anned . The C e n t r a l Area r o u t e and t h e
of f -peak time p e r i o d were i n c l u d e d f o r f u e l consumpt ion p u r p o s e s on l y .
The n e x t s e c t i o n d e s c r i b e s t h e v e h i c l e s used and g i v e s d e t a i l s o f t h e
r o u t e s covered . The d a t a o b t a i n e d f o r t h e i n s t r u m e n t a t i o n on boa rd t h e
v e h i c l e s is a l s o d e s c r i b e d a t t h i s s t a g e .
A2 THE VEHICLES
The two v e h i c l e s used have i d e n t i c a l d e s i g n c h a r a c t e r i s t i c s which
are shown i n T a b l e A l . Both cars were a c q u i r e d new by t h e TRRL e a r l y i n
1982 and w i l l be r e f e r r e d t o as car W [ w h i t e l and car B [ b l u e ] .
T a b l e A 1 The i n s t r u m e n t e d v e h i c l e s
Make : Ford C o r t i n a
Model: 2 .0 GL
Year o f Manufac tu re : 1982
Eng ine size: 1993 cc
T ransmiss ion : Au tomat ic
Unladen we igh t : 1042 kg
The c a r s were f i t t e d w i t h i n s t r u m e n t a t i o n which e n a b l e d t h e f u e l
consumpt ion and d i s t a n c e t r a v e l l e d t o be r e c o r d e d f o r e a c h one second of
v e h i c l e o p e r a t i o n . The f u e l meters i n s t a l l e d i n t h e two v e h i c l e s are of
t h e p o s i t i v e d i s p l a c e m e n t t y p e and a r e c o n s i d e r a b l y more a c c u r a t e t h a n
t h o s e i n s t a l l e d i n p a s t TRRL v e h i c l e s , Rober tson e t a1 t19801. The f u e l

meter r e s o l u t i o n i s 1 m l and t h e d is tance can be recorded i n u n i t s o f one
quar te r o f a metre.
A3 THE ROUTES
The veh ic les were d r i v e n i n Leeds from Monday t o F r i d a y i n t h e week
beginning on the .24 th flay 1982. S i x d i f f e ren t rou tes were covered and these
are shown i n F igu re Al. Each r o u t e was subdivided i n t o sect ions, c a l l e d
l i n k s , t h e end p o i n t s o f which were chosen main ly where delay was expected
t o occur (e.g. t r a f f i c s ignals, zebra crossings and o the r r e s t r i c t i o n s ) .
I n a few cases l ong sec t ions o f a rou te were sub-divided a t appropr ia te land-
marks t o o b t a i n more disaggregate data. The veh ic le ins t rumenta t ion enabled
summary data t o be obta ined f o r each l i n k and f o r t h e whole r o u t e separate ly .
Tables A2 and A3 show t h e c h a r a c t e r i s t i c s of each r o u t e and g i v e
d e t a i l s of t h e runs made by each veh ic le . Two d r i v e r s were used throughout
t h e experiment w i t h d r i v e r 1 being a l l oca ted t o t h e wh i te car, and d r i v e r 2
t o t h e b lue car . Only i n t h e case o f a smal l number o f runs on t h e Cent ra l
Area rou te d i d t h i s schedule have t o change due t o ins t rumenta t ion problems
associated w i t h one o f t h e veh ic les . An observer was always present t o moni tor
t h e ins t rumenta t ion and i d e n t i f y t h e passing o f t h e t i m i n g p o i n t a t t h e end
o f each l i n k on a rou te . The observer was requ i red t o check a log-sheet
l i s t i n g t h e t i m i n g po in ts .
Table A4 g ives d e t a i l s o f j u n c t i o n types f o r each o f t h e rou tes covered.
A4 THE OUTPUT DATA - In format ion from each r u n was s tored on a magnetic tape which was then
used as i n p u t t o a program developed by t h e Urban Networks. D i v i s i o n o f TRRL.
Th i s program outputs two types of data:
t i 1 Summary data f o r each l i n k o f t h e rou te . An example o f such data
i s shown i n Table AS. For each l i n k t h e f o l l o w i n g i n f o r m a t i o n i s
ava i l ab le : distance; t r a v e l t ime; stopped time; p e t r o l consumed
and t h e l o s s o f k i n e t i c energy experienced by t h e v e h i c l e over t h e
l i n k . The cumulat ive data f o r d is tance t rave l l ed , p e t r o l consumed
and k i n e t i c losses s ince t h e s t a r t of t h e run, are a l s o ou tput a t
t h i s stage - and

( i i l The v e h i c l e speed p r o f i l e a s shown i n F i g u r e A2. The d i s t a n c e
t r a v e l l e d and t h e f u e l consumed f o r each second a r e shown h e r e .
(Each d i s t a n c e p u l s e i s e q u i v a l e n t t o 0.21068 metres, and each
f u e l consumpt ion p u l s e r e p r e s e n t s 1 m l o f p e t r o l . ) The summary
i n f o r m a t i o n ment ioned i n ( i l i s a l s o g i v e n h e r e as shown i n
F i g u r e A2.
The o u t p u t d a t a f o r a l l r u n s e n a b l e d t h r e e sets o f d a t a t o be coded and
s t o r e d on t h e Laeds U n i v e r s i t y computer a s t h r e e s e p a r a t e d a t a f i l e s , namely:
1 1 Data on v e h i c l e s t o p s
21 L ink d a t a
and 31 Route d a t a .
A b r i e f d e s c r i p t i o n of t h e d a t a w i l l now be g i ven .
11 Data on v e h i c l e s t o p s
The i n f o r m a t i o n c o n t a i n e d i n t h e speed p r o f i l e o u t p u t was used
t o o b t a i n t h i s d a t a set . The f o l l o w i n g v a r i a b l e s were s t o r e d f o r each
s t o p / s t a r t manoeuvre:
Route number
Run number:
D r i v e r ;
Time p e r i o d ;
J u n c t i o n t y p e ;
S topped time;
F u e l consumed w h i l s t
i d l i n g ;
Speed a t which d e c e l e r a t i o n
s t a r t s [Vi);
9 ) Time t a k e n t o d e c e l e r a t e f rom
speed V . t o z e r o ( t d l ; 1
1 0 ) F u e l consumed d u r i n g time td;
1 1 ) F i n a l speed r e a c h e d a f t e r
a c c e l e r a t i o n (Vf I ;
1 2 ) Time t a k e n t o a c c e l e r a t e f rom
speed z e r o t o Vf ( t a l ;
131 F u e l consumed d u r i n g time ta.
21 L ink d a t a
The t o t a l number o f r u n s made o v e r a l l r o u t e s g e n e r a t e d
i n f o r m a t i o n f o r a t o t a l of 946 o b s e r v a t i o n s w i t h a mean l i n k l e n g t h
of 302 metres [ s t a n d a r d d e v i a t i o n of 227 metres]. The l i n k l e n g t h
f r equency d i s t r i b u t i o n i s shown i n F i g u r e A 3 . F o r e a c h l i n k t h e -

f o l l o w i n g d a t a was s t o r e d * . I d e n t i f i c a t i o n o f r o u t e ; d r i v e r ; r un ;
time p e r i o d ; and l i n k a s well a s t h e f o l l o w i n g t r a f f i c p a r a m e t e r s :
1 1 T r a v e l d i s t a n c e : 31 S topped time;
21 T r a v e l time; 41 P e t r o l consumed and k i n e t i c ene rgy l o s s .
31 Route d a t a
A t h i r d d a t a set was b u i l t up u s i n g a g g r e g a t e i n f o r m a t i o n f o r
e a c h r u n . Only r u n s f o r which t h e r e was c o m p l e t e i n f o r m a t i o n were
used and t h e f o l l o w i n g d a t a was s t o r e d :
1 1 Run d i s t a n c e ; 51 F u e l consumed;
21 J o u r n e y time; 6 1 Delay assuming a f ree f l o w speed o f
31 S topped time; 60 km/h; and
41 Number o f s t o p s ; 71 De lay assuming 46 km/h as t h e f ree f l o w
speed .
T h i s d a t a was o b t a i n e d by m a n i p u l a t i o n o f t h e l i n k d a t a f i l e
d e s c r i b e d e a r l i e r and by a d d i n g t h e number o f comp le te s t o p s o b t a i n e d
f rom t h e speed p r o f i l e o u t p u t . Due t o d i f f i c u l t i e s w i t h v a p o r i s a t i o n
i n t h e f u e l p i p e s o n l y d a t a f o r 38 r u n s was i n c l u d e d i n t h i s a n a l y s i s .
A d e s c r i p t i o n of t h e r u n s i s g i v e n i n T a b l e A6.
* Due t o t e c h n i c a l d i f f i c u l t i e s w i t h one of t h e f u e l meters most of t h e
f u e l consumpt ion d a t a f o r C e n t r a l Area l i n k s was l o s t . A number of
r u n s on o t h e r r o u t e s were a l s o n o t a v a i l a b l e when t h e a n a l y s i s was
unde r taken due t o p rob lems i n r e a d i n g t h e magne t i c t a p e s .

Table A2 The routes surveyed
M . Peak period: 0700h - 0930h
Off Peak period: 1400h - 1600h
Ev. Peak period: 1700h - 1800h
Number o f runs Number o f
Links
14
10
Route Distance
(h)
5.9
3.1
Route Number
1
2
Blue Car
5
9
Route Name
York ~ d / Selby Rd
Hunsle t Rd
White Car
' 5
9 1
Day o f Survey
Monday
Tuesday
(1) Time Period
M. Peak
M. Peak

Table A3 Runs on Central Area route - .
(I) ~ / 1 4 White car, dr iver 1.
~ / 2 3 Blue car, dr iver 2
Table A4 Junction type by route
Runs made (~eh ic le /d r iver ) (1)
3 (w/l)
- 2
* 3 3 iw/l) (B/z)
3 (w/1)
3 3 (W/1) ( ~ / 2 )
3 (!$/2)
1 1 (W/l) ( ~ / 2 )
-
Day of Week
Monday
Tuesday
Wednesday'
Thursday
-
Time Period
Off Peak
Ev. Peak
Off Peak '
Ev. Peak
Off Peak
Ev. Peak
Off Peak
Ev. Peak
TS - Traff ic signal; PJ - Pr io r i t y junction; R - Roundabout P - Pelican crossing; Z - Zebra.
J
Route Number
1
2
3
4 5 6
Number of
Junctions (1)
Z
1
TS
4 6
4 6
5 21
P
- 1 4 2
- - 2 2
- - 6 4
4
- 1 2 3
2 - 3 2
PJ R
- -

A7 Table A5 Output l i nk data
Time of Day -.- -.,... ..,,.J p411[+ijKf< 4.1 TAPE ri\JN NU 41 S l A ' f E O N T,C+[+E: y!Q 3 .", ..<'' 1 1.) 3 0 ...... ....
... fi\jN C4lli'&Cb. .I,:\, y f i l ' ~ ' -. r;\.jN No 4:L UA:l'l_ Obi TAPE .:.!Q.. 7 39 30 " '1.p U%ST C U I ~ I ~ JT !3 T PET CUF'ET KE iCUI(I<
TP - DXST -
CUMS - JT - ST -
PET - CUPET -
m - CUKE -
Timing point (i.e. end of a Link)
Distance t rave l led from previous t o present TP (m)
Total distance t rave l led on this run so far (m)
Total t r ave l time from previous t o present TP (sec.)
Stopped time from previous t o present TP (sec.)
Pet ro l consumed from previous t o present TP (ml)
Total pe t ro l consumed on this run so f a r (ml)
Kinetic energy l o s s from previous t o present TP
Total k ine t i c energy losses on this run so fa r .

Table A6 The 38 complete runs
. Route Number
1
2
3
4
5
6
Driver
1
1
1
1
1
1
2
TOTAL
Number of
Runs
5 9 6
7
5
4 2
38
Total Distance (h)
29.5
27.9
45.6 32.2
28.5
37.8
201.5 *

t h e -


All
Figure A3 INSTFUMENED CARS - LEEDS RUNS
FREQ. DISTRIBUTION - LINK DISTANCE


![Beano 2376 [1988-01-30]](https://img.pdfslide.us/doc/110x75/55cf8cde5503462b13903893/beano-2376-1988-01-30.jpg)