Embed Size (px)
Citation preview
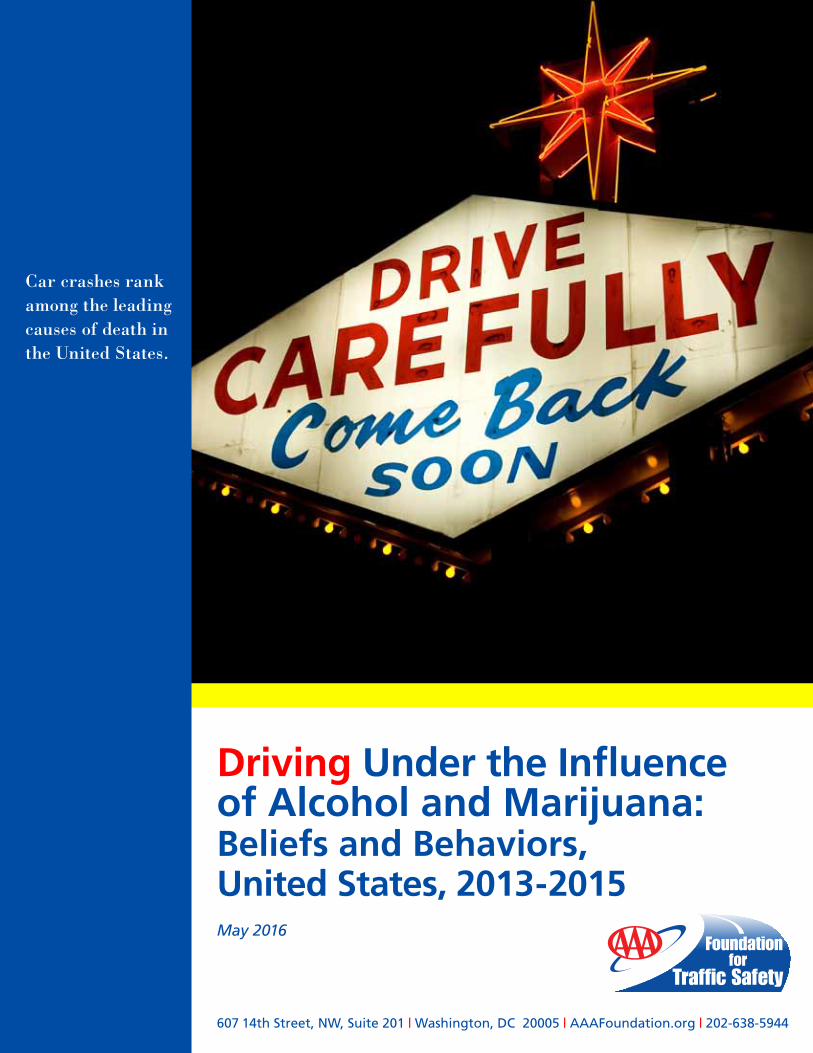
Driving Under the Influence of Alcohol and Marijuana: Beliefs and Behaviors, United States, 2013-2015 May 2016
607 14th Street, NW, Suite 201 | Washington, DC 20005 | AAAFoundation.org | 202-638-5944
Car crashes rank among the leading causes of death in the United States.
Title
Driving Under the Influence of Alcohol and Marijuana: Beliefs and Behaviors, United
States, 2013-2015. (May 2016)
Authors
Lindsay S. Arnold & Brian C. Tefft
AAA Foundation for Traffic Safety
About the Sponsor
AAA Foundation for Traffic Safety
607 14th Street, NW, Suite 201
Washington, DC 20005
202-638-5944
www.aaafoundation.org
Founded in 1947, the AAA Foundation in Washington, D.C. is a not-for-profit, publicly
supported charitable research and education organization dedicated to saving lives by
preventing traffic crashes and reducing injuries when crashes occur. Funding for this report
was provided by voluntary contributions from AAA/CAA and their affiliated motor clubs,
from individual members, from AAA-affiliated insurance companies, as well as from other
organizations or sources.
This publication is distributed by the AAA Foundation for Traffic Safety at no charge, as a
public service. It may not be resold or used for commercial purposes without the explicit
permission of the Foundation. It may, however, be copied in whole or in part and
distributed for free via any medium, provided the AAA Foundation is given appropriate
credit as the source of the material. The AAA Foundation for Traffic Safety assumes no
liability for the use or misuse of any information, opinions, findings, conclusions, or
recommendations contained in this report.
If trade or manufacturer’s names are mentioned, it is only because they are considered
essential to the object of this report and their mention should not be construed as an
endorsement. The AAA Foundation for Traffic Safety does not endorse products or
manufacturers.
©2016, AAA Foundation for Traffic Safety
Executive Summary
The purpose of this study was to provide estimates of the prevalence of self-reported use
and driving under the influence of alcohol and marijuana, and related perceptions and
beliefs among drivers 18 and older in the United States, and to present an analysis of
changes in these behaviors between 2013 and 2015. The data analyzed were collected via
nationally-representative surveys administered during this period.
From 2013-2015, an estimated 14.0 percent of drivers drove with a BAC close to or over the
legal limit in the past year, and 4.6 percent drove within an hour of using marijuana.
Drivers are divided with regard to their perceptions of the effect of using marijuana an hour
prior to driving on one’s risk of causing a crash: 58.3 percent believe this risk is increased,
6.2 percent believe it is not affected, 3.6 percent believe it is decreased, and 31.8 percent
indicated that they do not know how using marijuana an hour before driving affects crash
risk. Drivers who reported using marijuana, and those who reported driving within an hour
of use in the past year were less likely to believe that using marijuana increases crash risk,
and more likely to believe that such use does not affect or decreases crash risk. Awareness
of per se DUI laws for marijuana was low: in states that did have a per se law, only 48.5
percent were aware of it; in states without a per se law, 44.7 percent indicated incorrectly
that their state had such a law. Irrespective of whether their state actually had a per se law
for marijuana, more than half of all drivers reported that they did not know whether or not
their state had such a law.
1

Methods
The data reported here were collected as part of the AAA Foundation’s 2013-2015 Traffic
Safety Culture Index (TSCI) surveys. The TSCI is an annual survey administered online to
a sample of U.S. residents ages 16 years and older who were enrolled in a research panel
recruited by research firm GfK using random-digit dial and address based sampling
methods and designed to be representative of the United States population. The
methodology of the TSCI is described in detail in AAA Foundation for Traffic Safety (2014,
2015, 2016); the design of the panel from which the sample was drawn in described in detail
in GfK (2013).
The TSCI includes a core series of questions pertaining to the respondent’s attitudes about
traffic safety, perceptions of social norms, and self-reported driving behavior. Relevant to
the current study, the core survey includes questions regarding respondents’ frequency of
drinking alcohol and using marijuana, and questions about the respondents’ driving under
the influence of alcohol and/or marijuana. The survey also includes questions regarding
related beliefs and perceptions, and support for countermeasures designed to address
alcohol- and marijuana-involved driving. Survey questions analyzed in this study included:
“How often do you consume beer, wine, liquor, or other drinks containing alcohol?”
(Responses: a few times a week, a few times a month, one or two times a month, less
than once a month, never).
For the purpose of this study, respondents who reported that they drank alcohol at
all (more often than “never”) were classified as drinkers.
“In the past year, how often have you used marijuana?” (a few times a week, a few
times a month, less than once a month, just once, never).
Those who reported that they used marijuana at least once in the past year were
categorized as users of marijuana.
“In the past year, how often have you driven…”
o “when you thought your alcohol level might have been close to or possibly over
the legal limit?”
o “within 1 hour of using marijuana?”
o “within one hour of consuming both marijuana and alcohol, even if you
weren’t drunk?”
Response options were: regularly, fairly often, rarely, just once, never.
“In the state where you live, is it against the law for the driver to have more than a
certain amount of marijuana in their system?” (yes, no, I don’t know).
States were coded as having a law that makes it illegal per se (in itself) to drive with
a certain amount of marijuana in one’s system, if such a law was in effect prior to
each survey administration. Arizona, Delaware, Georgia, Illinois, Indiana, Iowa,
Michigan, Nevada, Ohio, Pennsylvania, Rhode Island, Utah, Washington, and
Wisconsin had per se laws for marijuana in effect for the entire study period.
2
Montana and Oklahoma had per se laws for marijuana become effective during the
2013 survey, thus, responses from respondents in these states were excluded in 2013
but coded as having a per se law in 2014 and 2015. Responses from respondents in
North Carolina and South Dakota were excluded because they had per se laws only
applicable to drivers under age 21. Responses from respondents in Colorado were
excluded because the state has a specified threshold for impairment from marijuana
but is not technically a per se law (Colo. Rev. Stat. Ann. § 42-4-1301 (6)). All other
states were coded as not having a per se law for marijuana.
“In general, how do you think using marijuana one hour before driving affects a
person’s driving?” (it makes them much more likely to cause an accident, it makes
them somewhat more likely to cause an accident, it does not affect their driving, it
makes them somewhat less likely to cause an accident, it makes them much less likely
to cause an accident, I don’t know).
“In the United States, the legal limit for a driver’s blood alcohol concentration (a
measure of the amount of alcohol in a person’s blood) is 0.08 grams of alcohol per
deciliter of blood. In Australia, France, Italy, Spain, and several other countries, the
limit is 0.05. How strongly do you support or oppose lowering the limit in the United
States from 0.08 to 0.05?” (support strongly, support somewhat, oppose somewhat,
oppose strongly).
“How strongly do you support or oppose having a law making it illegal to drive with
more than a certain amount of marijuana in your system?” (support strongly, support
somewhat, oppose somewhat, oppose strongly).
“How acceptable do you, personally, feel it is for a driver to…?”
o “Drive when they think they may have had too much to drink”
o “Drive one hour after using marijuana”
o “Drive after using both marijuana and alcohol”
Response options were: completely acceptable, somewhat acceptable, somewhat
unacceptable, and completely unacceptable.
This study is based on data from respondents age 18 and older who reported that they had
driven at least once in the 30 days before they completed the questionnaire. Some questions
related to marijuana use and driving were not included in the 2014 TSCI. The AAA
Foundation conducted another supplemental survey in 2014 using the same sample design
which included these questions (hereafter referred to as 2014 supplement). Questions about
alcohol use and driving were included in the supplement so that responses to the questions
about marijuana use and driving could be analyzed in relation to alcohol use. Unless
otherwise noted, analyses are based on data from 6,612 respondents from the 2013 TSCI,
2014 supplement, and 2015 TSCI surveys. Estimated proportions of drivers with responses
of interest for each item analyzed were tabulated in relation to driver demographic and
other characteristics, as well as by year. Linear regression analyses were performed to test
for trends by year across the study period. All analyses were performed on weighted data,
all reported statistics (except sample size) are based on weighted data, and all analyses
excluded non-responses.
3
The margin of error varies by question depending on the number of respondents that
answered the question and the distribution of responses. The margin of error is larger in
this survey than it would have been for a simple random sample of the same size due to the
design of the panel from which the sample was drawn and stratification by Census
Division. The approximate margin of error for statistics derived from all respondents from
the 2013 TSCI, 2014 supplement, and 2015 TSCI is plus or minus 0.8, 1.1, 1.3, 1.4, and 1.4
percentage points for percentages near 90 or 10, 80 or 20, 70 or 30, 60 or 40, and 50,
respectively; the margin of error is larger for items asked of only a subset of respondents.
The margin of error reflects a range of percentages that would be expected to include the
result that would be obtained if the survey were administered to the entire population from
which the sample was drawn, rather than to a sample, 19 times out of 20. Note that the
margin of error reflects only the statistical variability associated with using the survey
sample to draw inferences about the entire population. It does not reflect errors related to
systematic non-coverage of certain segments of the population (e.g., people who cannot read
in English nor in Spanish), non-response (i.e., eligible respondents who either cannot be
contacted or refuse to participate), differences in respondents’ understanding of survey
questions or response options, or deliberate misreporting of information (e.g.,
underreporting of behaviors that may be perceived as undesirable).
4

Results
Alcohol and marijuana use
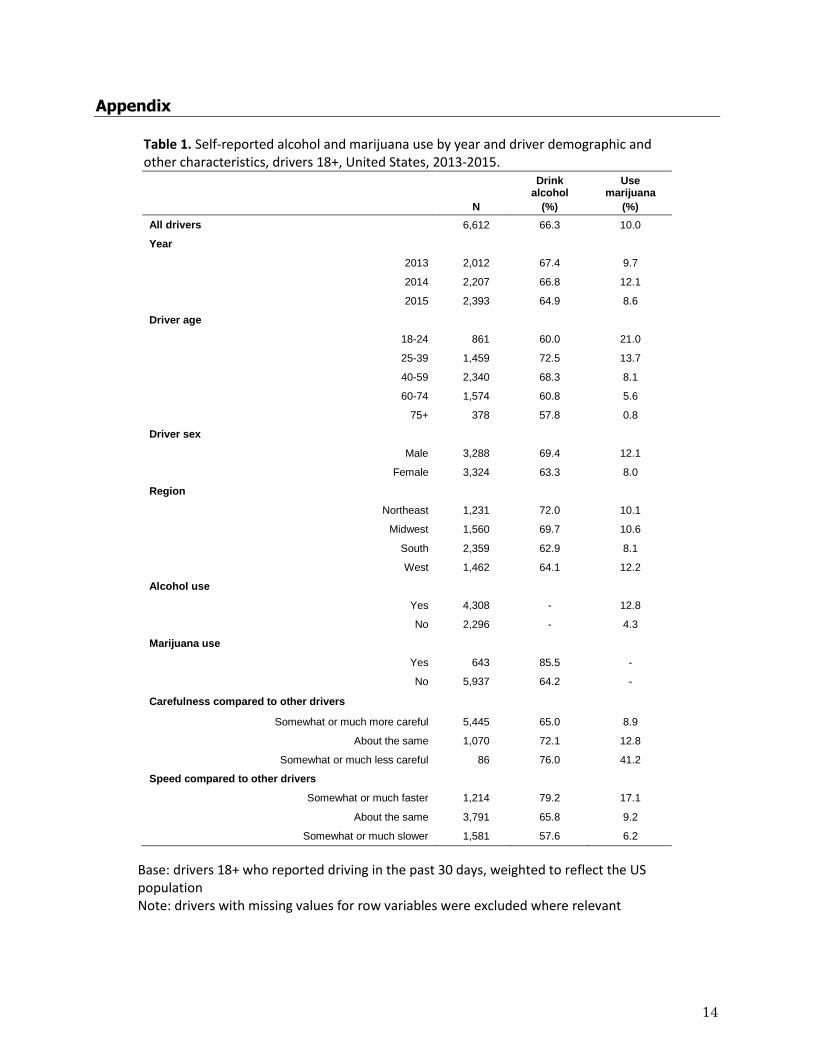
Nearly two in three drivers (66.3%) reported that they drink alcohol at least occasionally;
this percentage was relatively stable over the study period (see Table 1 in Appendix). One
in ten drivers (10.0%) reported having used marijuana at least once in the past year; there
was some year-to-year fluctuation in this percentage, but no evidence of a trend. Drivers
ages 25-39 and those ages 40-59 were the most likely to report alcohol use, while those ages
18-24 were the most likely to report using marijuana at least once in the past year (21.0%).
Male drivers were more likely than female drivers to report using alcohol and marijuana
(both p<0.001). There was significant regional variation in the proportion of drivers who
reported drink alcohol (p<0.001) and using marijuana (p=0.004). Drivers who reported
drinking alcohol were significantly more likely than non-drinkers to report also using
marijuana, and similarly, drivers who reported having used marijuana in the past year
were significantly more likely to report drinking alcohol (both p<0.001). Both alcohol use
and marijuana use were most prevalent among drivers who rated themselves as somewhat
or much less careful compared to other drivers (76.0% and 41.2% for alcohol and marijuana,
respectively) (Table 1). With regard to speed compared to other drivers, drivers who
reported driving somewhat or much faster than other drivers were the most likely to report
alcohol use (79.2%), as well as marijuana use (17.1%).
Driving under the influence of alcohol and/or marijuana
Nearly one in seven drivers (14.0%) reported that, within the past year, they drove when
their BAC was close to or over the legal limit at least once; this proportion was relatively
stable over the study period (see Table 2 in Appendix). Fewer drivers reported having
driven within an hour of using marijuana (4.6%), or using both marijuana and alcohol
(2.4%) during the same time period. The proportions of drivers who reported in engaging in
each of the behaviors were relatively stable over the study period. Reported engagement in
each of the behaviors generally increased with age (p<0.001). Drivers ages 25-39 were the
most likely to report having driven with a BAC close to or over the legal limit at least once
in the past year (19.1%), while drivers ages 18-24 were the most likely to report having
done this regularly or fairly often (4.1%), having driven within an hour of using marijuana
(9.9%) or using both marijuana and alcohol (5.5%) at least once, and having done either
regularly or fairly often (5.1% and 3.2%, respectively). Male drivers were more likely than
females to report having driven with a BAC close to or over the legal limit at least once in
the past year (18.4% vs. 10.0%), and having done this regularly or fairly often (2.8% vs.
1.2%) (p<0.001 for both); while fewer drivers reported having driven after using marijuana,
males were also more likely than females to report having driven within an hour of using
marijuana (6.0% vs. 3.3%) or using both marijuana and alcohol (3.3% vs. 1.6%) at least once
in the past year, and to have done the former regularly or fairly often (2.8% vs. 1.6%)
(p≤0.005 for all). Drivers who rated themselves as somewhat or much less careful, or
somewhat or much faster than other drivers, were consistently the most likely to have
reported engaging in each of the impaired driving behaviors examined at least once within
the past year, and to have done so regularly or fairly often (p≤0.002 for all) (Table 2). The
only behavior which varied with respect to region was driving within an hour of using
marijuana at least once in the past year (p=0.05): drivers in the Midwest were the most
5
likely to report having driven within an hour of using marijuana in the past year, while
those in the South were the least likely to report having done so.
Drivers who reported that they drink alcohol were more likely than non-drinkers to report
having driven within an hour after having used marijuana in the past year and to report
having done so regularly or fairly often (p<0.001 for both) (Table 2). Drivers who reported
using marijuana were more likely than non-marijuana users to report having driven with a
BAC close to or over the legal limit at least once in the past year (41.0% vs. 11.1%), and
doing so regularly or fairly often (10.8% vs. 1.0%) (p<0.001 for both). While 21.2 percent of
drivers who drink alcohol reported driving with a BAC close to or over the legal limit in the
past year, 46.8 percent of marijuana users reported having driven within an hour of using
the drug in the same time period. The proportion of drivers who reported having driven
within an hour after using marijuana or using both marijuana and alcohol did not vary
significantly in relation to whether the state had a per se law for marijuana (p≥0.2 for both).
Knowledge of per se laws for marijuana
More than half of drivers (51.2%) stated that they did not know whether their state had a
per se law for marijuana. Fewer than half of drivers (48.5%) in states with per se laws for
marijuana are aware of the law, and only 2.8 percent of drivers in states without such laws
correctly knew that their state did not have such a law. Knowledge of per se laws for
marijuana was relatively stable over the study period. Drivers who reported using
marijuana at least once in the past year were less likely than those who did not to believe
that their state had a per se law for marijuana, and more likely to believe that their state
did not have such a law (p<0.001 for both). The proportion of respondents who stated that
they did not know whether their state had such a law did not vary with respect to
marijuana use (p=0.108). Drivers who reported having driven within an hour of using
marijuana in the past year were less likely than those who did not to believe that their
state did have a per se law for marijuana (29.8% vs. 46.9%), and more likely to believe that
their state did not have such a law (15.1% vs. 2.1%) (p<0.001 for both). In states with per se
laws for marijuana, drivers were equally likely to respond that they do not know whether
their state has such a law as they were to respond correctly regarding the law (see Table 3
in Appendix). Drivers in states without per se laws for marijuana were only slightly less
likely than drivers in states with such laws to believe that their states did have such a law
(p=0.015), and equally likely to believe that their state did not have such a law (p=0.337).
While drivers in states with per se laws for marijuana were less likely than those in states
without such laws to respond that they do not know whether their state has such a law
(p=0.033), the difference was small (49.1% vs. 52.4%). In states with per se laws for
marijuana, drivers who reported using marijuana were less likely than drivers who did not
to correctly report that their state has such a law, and more likely to believe, incorrectly,
that their state did not have such a law (p≤0.006 for both) (Table 3). In states without per se
laws for marijuana, drivers who reported using marijuana were more likely than non-users
to correctly respond that their state does not have such a law (10.3% vs. 2.0%), and less
likely to incorrectly believe that their states does have such a law (35.0% vs. 45.8%)
(p<0.001 for both).
6

Beliefs about effect of marijuana on driving
More than half of drivers (58.3%) report that they believe that, in general, driving within
one hour of using marijuana makes one somewhat or much more likely to cause a crash,
while nearly one in three drivers (31.8%) report that they do not know how driving within
an hour of use affects one’s crash risk, and one in ten reported that they believe such use
does not affect (6.2%) or decreases crash risk (3.6%); these proportions were relatively
stable over the study period (see Table 4 in Appendix). Drivers age 40 and older where the
most likely to believe that using marijuana within an hour of driving increases crash risk;
those ages 18-24 were most likely to indicate that such use does not affect crash risk;
drivers ages 25-39 were the most likely to indicate that such use decreases crash risk; and
those age 75 and older were the most likely to indicate that they do not know how such use
affects crash risk. Female drivers were more likely than male drivers to believe that using
marijuana within an hour of driving increases crash risk, while males were more likely
than females to believe that such use does not affect crash risk or decreases crash risk
(p<0.05 for all); however, differences in responses by gender were small. Male and female
respondents were equally likely to indicate that they do not know how using marijuana
within an hour of driving affects crash risk. Beliefs about the effect of using marijuana
within an hour of driving did not vary regionally (p=0.286).
Drivers who reported having used marijuana in the past year were much less likely than
those who did not to believe that using marijuana within an hour of driving increases one’s
crash risk (37.9% vs. 60.5%), or to respond that they do not know (16.7% vs. 33.5%), and
much more likely to believe that such use does not affect (29.4% vs. 3.7%) or decreases
crash risk (16.1% vs. 2.3%) (p<0.001 for all). These differences were even greater when
comparing the responses of drivers who reported having driven within 1 hour of using
marijuana in the past year versus those who reported having not done so in the past year.
While the differences were small, drivers in states with per se laws for marijuana were
more likely than drivers in states without such laws to believe that using marijuana within
an hour of driving increases crash risk (p=0.002), and less likely to respond that they do not
know (p=0.017); drivers in states with and without per se laws for marijuana were equally
likely to believe that such use does not affect, or decreases crash risk (p≥0.5 for both).
Drivers who reported that they drive somewhat or much less carefully than other drivers
were the least likely to believe that using marijuana within an hour of driving increases
crash risk (p=0.005), and the most likely to believe that such use does not affect crash risk
(p=0.05). These drivers also appeared to be the most likely to believe that using marijuana
within an hour of driving decreases crash risk, or to respond that they do not know,
however, the differences were not statistically significant (p≥0.1 for both). While the
proportion of drivers who believe that marijuana use increases crash risk did not vary with
respect to self-rated speed, those who reported that they drive somewhat or much faster
than other drivers were the most likely to believe that marijuana use does not affect or
decreases crash risk, and the least likely to respond that they do not know (p≤0.02 for all).
7
Acceptance of impaired driving
Virtually all drivers report that they feel it is unacceptable to drive when one may have had
too much to drink (97.9%), and to drive after using both marijuana and alcohol (98.0%), and
most (91.7%) say the same about driving one hour after using marijuana (see Table 5 in
Appendix). The proportion of drivers reporting that they feel that it is unacceptable to drive
when one may have had too much to drink generally increased with driver age, though the
overwhelming majority of drivers in every age group agreed with this (Table 5). The
proportion who feel it is unacceptable to drive one hour after using marijuana also
increased with driver age (p<0.001); drivers aged 18-24 were the least likely to report
feeling that it is unacceptable to do so (87.9%), while those age 75 and older were the most
likely to report the same (97.4%). Acceptability of driving after using both marijuana and
alcohol did not vary significantly by age, as more than 97% of drivers in every age group
rated this as unacceptable. Female drivers were significantly more likely than males to rate
all three of these behaviors as unacceptable (p≤0.006 for all); however, differences in
responses by gender were small. Acceptance of these behaviors did not vary by region of
country (p≥0.3 for all). Drivers who rated themselves as somewhat or much less careful
than most other drivers were much more accepting of driving after drinking too much
alcohol or using marijuana individually (both p<0.001), and appeared to also be slightly
more accepting of driving after using both marijuana and alcohol, however, that difference
was not statistically significant (p=0.252). Differences in acceptance of these behaviors in
relation to self-rated driving speed relative to other drivers were not large, but drivers who
reported that they drive somewhat or much slower than other drivers were consistently the
most likely to rate each of the behaviors as unacceptable. The proportions of drivers who
believe it is unacceptable to drive one hour after using marijuana, and to drive after using
both marijuana and alcohol, did not vary with respect to whether the drivers’ state of
residence had a per se law for marijuana (p≥0.4 for both).
Support for impaired driving countermeasures
There was majority support for both of the impaired driving countermeasures examined:
82.9 percent of drivers support having a per se law for marijuana, while 63.6 percent
support reducing the per se BAC limit from 0.08 to 0.05 grams per deciliter (see Table 6 in
Appendix). While support for reducing the BAC limit was stable over the study period,
support for having a per se law for marijuana fluctuated over the study period (p=0.004);
there was, however, no evidence of a trend in support for the latter by year. Support for
lowering the BAC limit did not vary with respect to driver age (p=0.654); in contrast,
support for a per se law for marijuana did vary by age (p<0.001), with drivers ages 25-39
the least likely to support such a law (77.2%) and those age 75 and older the most likely
(92.0%). Female drivers were more likely than males to support each of the
countermeasures (p<0.001 for both). Drivers who rated themselves as somewhat or much
more careful, or somewhat or much slower, compared to other drivers, were the most likely
to support each of the countermeasures. Drivers in states with per se laws for marijuana
were more likely than drivers in states without such laws to support reducing the BAC
limit (p=0.002); support for having a per se law for marijuana, however, did not vary with
respect to whether a driver’s state of residence had such a law. Support for reducing the
BAC limit and having a per se law for marijuana both varied regionally (p≤0.03 for both);
drivers in the West and South were the most likely to support reducing the BAC limit,
8
while drivers in the West were the most likely to support having a per se law for marijuana
(Table 6).
Discussion
From 2013-2015, nearly one in seven drivers reported driving with a BAC close to or over
the legal limit in the past year, and 4.6 percent reported driving within an hour using
marijuana in the same time period. Drivers who were aged 25-39, male, and those who
reported using marijuana were the most likely to report having driven with a BAC close to
or over the legal limit. Drivers who were aged 18-24, male, and lived in the Midwest were
the most likely to report having driven within an hour of using marijuana.
The proportion of drivers who reported driving after marijuana use did not vary with
respect to whether a driver’s state of residence had a per se law for marijuana; however,
more than half of all drivers admitted that they did not know whether their state had such
a law or not. Given respondents’ low levels of awareness of their states’ marijuana-related
driving laws, a post hoc analysis was performed to investigate whether respondents’ driving
after using marijuana was associated with whether they thought that their state had a per
se law for marijuana, and results showed a strong relationship. While only 2.7 percent of
drivers believed that their state did not have a per se law for marijuana, fully one in four of
these drivers (25.6%) reported having driven within one hour after having used marijuana
in the past year and 13.8 percent reported doing so fairly often or regularly. In contrast, of
the drivers who reported that they believed their state did have a per se law (46.1% of
drivers), only 3.0% reported having driven within an hour after having used marijuana in
the past year (1.8% fairly often or regularly). Of the 51.2 percent of respondents who
reported that they did not know whether their state had a per se law for marijuana, 5.0
percent reported having driven within an hour after having used marijuana in the past
year (1.9% fairly often or regularly). Thus, while self-reported driving after using marijuana
was not associated with actual state per se laws regarding marijuana and driving, it was
significantly associated with what people thought their states’ laws were.
Virtually all drivers feel it is unacceptable to drive when one may have had too much to
drink and after using both marijuana and alcohol; nearly one in ten feels it is acceptable to
drive one hour after using marijuana. Drivers who reported using marijuana, and those
who reported driving within an hour of use in the past year were less likely to believe that
using marijuana increases crash risk, and more likely to believe that such use does not
affect or decreases crash risk. A majority of drivers support reducing the BAC limit from
0.08 to 0.05 grams per deciliter and support having a per se law for marijuana.
The Substance Abuse and Mental Health Services Administration (SAMHSA) conducts an
annual survey, and while the methods and questions differ somewhat from those of the
AAA Foundation surveys, the estimates of alcohol and marijuana use, and driving under
the influence of alcohol or illicit drugs generally agree with those of the present study. The
2013 and 2014 SAMSHA surveys estimated that 70.9 percent of persons aged 18 or older
reported drinking alcohol in the past year, 11.7 percent reported “driving under the
influence of alcohol” in the past year, 12.9 percent reported having used marijuana in the
past year, and 4.0 percent of drivers reported driving under the influence of illicit drugs,
9
including marijuana, in the past year (Center for Behavioral Health Statistics and Quality,
2015), all of which were very similar to the results of the current study. (Note that the
SAMHSA estimates include non-drivers, which the present study does not. In the current
study, 87.1 percent of all respondents aged 18 and older were drivers.)
Previous research has shown that young drivers, in particular, view driving after using
marijuana as more acceptable and less risky than driving after using alcohol, and are more
willing to drive after using marijuana than alcohol. Among various samples of young
drivers examined, driving after marijuana use was nearly as common or more common than
driving after alcohol use (Asbridge, 2014; Danton et al., 2003; McCarthy et al., 2007). In the
present study, a smaller proportion of the youngest drivers (aged 18-24) said they feel it is
unacceptable to drive one hour after using marijuana (87.9%) than said the same with
regard to driving when one may have had too much to drink (95.9%). These drivers were
also the least likely to believe that using marijuana within an hour of driving increases
one’s crash risk, and the most likely to believe such use does not affect crash risk. In the
present study, only nineteen-year-old drivers were more likely to report having driven
within an hour of using marijuana than with a BAC close to or over the legal limit in the
past year (15.1% vs. 12.9%).
In the present study, drivers who used marijuana were significantly less likely than those
who did not to believe that using marijuana within an hour of driving increases one’s crash
risk, and much more likely to believe that such use does not affect or decreases crash risk.
These findings align with previous surveys which have demonstrated that, among drivers
who have used marijuana and/or driven after use, some perceive that their driving was
negatively affected, typically minimally, while others perceive no effect or report improved
driving (Lacey et al., 2012; Pacific Institute for Research and Evaluation, 2014; Terry &
Wright, 2005). Research on the relationship between marijuana use and risk of crash
involvement, which typically relies on the detection of THC, the main active component of
marijuana, has been inconclusive. While some studies have found that THC was associated
with significantly elevated crash risk, others, including a recent study by the National
Highway Traffic Safety Administration, have found that, after controlling for factors
associated with a driver’s crash risk, THC was not significantly associated with elevated
crash risk (Asbridge et al., 2012; Compton & Berning, 2015; Elvik, 2013).
This study demonstrated that many drivers are unaware of whether their state has a per se
law for marijuana and driving. We were unable to identify prior research that has
examined driver knowledge of per se laws for marijuana, or other drugs excluding alcohol,
however, a lack of awareness of the effects of drugs on driving among the public is evident
(Cafaro, 2010; Government Accountability Office, 2015). Surveys by the AAA Foundation
for Traffic Safety have repeatedly demonstrated that, while most drivers view drivers
drinking alcohol as a very serious threat (65.9-71.1% during the study period), slightly
fewer express the same concern with regard to people driving after using illegal drugs
(56.2-61.5%) (AAA Foundation for Traffic Safety, 2014, 2015, 2016). A survey conducted by
Gallup in 2015 showed similar results, with many more drivers rating drivers impaired by
alcohol as a very serious problem (79%) than expressing the same concern about those
impaired by marijuana (29%) (Ander & Swift, 2015). There is no conclusive evidence that
per se laws for drugs other than alcohol reduce drug-impaired driving or traffic fatalities,
although the lack of sufficient data has limited such research (Anderson & Rees, 2015;
Goodwin et al., 2015; Government Accountability Office, 2015; Lacey et al., 2010). If drug
10

per se laws are, in fact, ineffective, it may be due, at least in part, to a lack of awareness of
the laws.
11
References
AAA Foundation for Traffic Safety. (2014). 2013 Traffic Safety Culture Index. Washington,
DC: AAA Foundation for Traffic Safety.
AAA Foundation for Traffic Safety. (2015). 2014 Traffic Safety Culture Index. Washington,
DC: AAA Foundation for Traffic Safety.
AAA Foundation for Traffic Safety. (2016). 2015 Traffic Safety Culture Index. Washington,
DC: AAA Foundation for Traffic Safety.
Ander, S. & Swift, A. (2015). More Say Alcohol Threatens Auto Safety Than Pot, Pills.
Washington, DC: Gallup, Inc. Retrieved March 29, 2016, from
http://www.gallup.com/poll/183878/say-alcohol-threatens-auto-safety-pot-pills.aspx
Anderson, D. M., & Rees, D. I. (2015). Per se drugged driving laws and traffic fatalities.
International Review of Law and Economics, 42, 122–134.
Asbridge M., Hayden, J. A., & Cartwright, J. L. (2012). Acute cannabis consumption and
motor vehicle collision risk: A systematic review of observational studies and meta-
analysis. BMJ, 344:e536.
Berning A., Compton, R., & Wochinger, K. (2015). Results of the 2013-2014 National
Roadside Survey of Alcohol and Drug Use by Drivers. (Report No. DOT HS 812 118).
Washington, DC: National Highway Traffic Safety Administration.
Cafaro, T. W. (2010). Slipping through the cracks: Why can’t we stop drugged
driving? Western New England Law Review, 32 32(1 Article 2).
Center for Behavioral Health Statistics and Quality. (2015). 2014 National Survey on Drug
Use and Health: Detailed Tables. Substance Abuse and Mental Health Services
Administration, Rockville, MD.
Compton, R. P. & Berning, A. (2015). Drug and Alcohol Crash Risk. (Report No. DOT HS
812 117). Washington, DC: National Highway Traffic Safety Administration.
Danton, K., Misselke, L., Bacon, R., & Done, J. (2003). Attitudes of young people toward
driving after smoking cannabis or after drinking alcohol. Health Education Journal,
62(1), 50–60.
Elvik, R. (2013). Risk of road accident associated with the use of drugs: A systematic review
and meta-analysis of evidence from epidemiological studies. Accident Analysis &
Prevention, 60: 254-267.
GfK (2013). Knowledge Panel® Design Summary. Retrieved October 7, 2015, from
http://www.knowledgenetworks.com/knpanel/docs/knowledgepanel(R)-design-
summary-description.pdf
12
Goodwin, A., Thomas, L., Kirley, B., Hall, W., O’Brien, N., & Hill, K. (2015).
Countermeasures that work: A highway safety countermeasure guide for State
highway safety offices, Eighth edition. (Report No. DOT HS 812 202). Washington,
DC: National Highway Traffic Safety Administration.
Government Accountability Office. (2015). Drug-Impaired Driving: Additional Support
Needed for Public Awareness Initiatives (Report to Congressional Committees No.
GAO-15-293). United States Government Accountability Office.
Lacey, J., Brainard, K., & Snitow, S. (2010). Drug Per Se Laws: A Review of Their Use in
States. (Report No. DOT HS 811 317). Washington, DC: National Highway Traffic
Safety Administration.
Lacey, J. H., Kelley-Baker, T., Romano, E., Brainard, K., & Ramirez, A. (2012). Results of
the 2012 California Roadside Survey of Nighttime Weekend Drivers’ Alcohol and
Drug Use. Calverton, MD: Pacific Institute for Research and Evaluation.
McCarthy, D. M., Lynch, A. M., & Pederson, S. L. (2007). Driving after use of alcohol and
marijuana in college students. Psychology of Addictive Behaviors: Journal of the
Society of Psychologists in Addictive Behaviors, 21(3), 425–430.
Pacific Institute for Research and Evaluation. (2014). Washington State Roadside Survey.
Calverton, MD.
Terry, P., & Wright, K. A. (2005). Self-reported driving behaviour and attitudes towards
driving under the influence of cannabis among three different user groups in
England. Addictive Behaviors, 30(3), 619–626.
13
Appendix
Table 1. Self-reported alcohol and marijuana use by year and driver demographic and other characteristics, drivers 18+, United States, 2013-2015.
Drink
alcohol Use
marijuana
N (%) (%)
All drivers 6,612 66.3 10.0
Year
2013 2,012 67.4 9.7
2014 2,207 66.8 12.1
2015 2,393 64.9 8.6
Driver age
18-24 861 60.0 21.0
25-39 1,459 72.5 13.7
40-59 2,340 68.3 8.1
60-74 1,574 60.8 5.6
75+ 378 57.8 0.8
Driver sex
Male 3,288 69.4 12.1
Female 3,324 63.3 8.0
Region
Northeast 1,231 72.0 10.1
Midwest 1,560 69.7 10.6
South 2,359 62.9 8.1
West 1,462 64.1 12.2
Alcohol use
Yes 4,308 - 12.8
No 2,296 - 4.3
Marijuana use
Yes 643 85.5 -
No 5,937 64.2 -
Carefulness compared to other drivers
Somewhat or much more careful 5,445 65.0 8.9
About the same 1,070 72.1 12.8
Somewhat or much less careful 86 76.0 41.2
Speed compared to other drivers
Somewhat or much faster 1,214 79.2 17.1
About the same 3,791 65.8 9.2
Somewhat or much slower 1,581 57.6 6.2
Base: drivers 18+ who reported driving in the past 30 days, weighted to reflect the US population Note: drivers with missing values for row variables were excluded where relevant
14
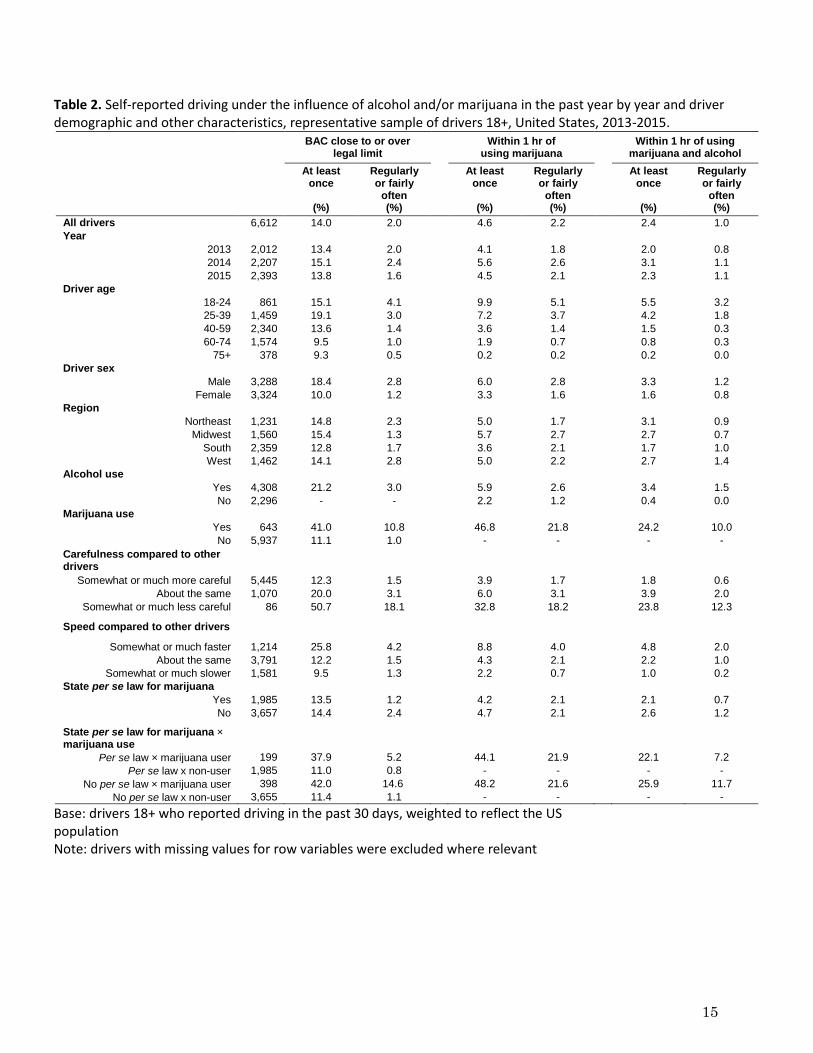
Table 2. Self-reported driving under the influence of alcohol and/or marijuana in the past year by year and driver demographic and other characteristics, representative sample of drivers 18+, United States, 2013-2015.
BAC close to or over legal limit
Within 1 hr of
using marijuana
Within 1 hr of using marijuana and alcohol
At least once
(%)
Regularly or fairly
often (%)
At least once
(%)
Regularly or fairly
often (%)
At least once
(%)
Regularly or fairly
often (%)
All drivers 6,612 14.0 2.0 4.6 2.2 2.4 1.0
Year
2013 2,012 13.4 2.0 4.1 1.8 2.0 0.8
2014 2,207 15.1 2.4 5.6 2.6 3.1 1.1
2015 2,393 13.8 1.6 4.5 2.1 2.3 1.1
Driver age
18-24 861 15.1 4.1 9.9 5.1 5.5 3.2
25-39 1,459 19.1 3.0 7.2 3.7 4.2 1.8
40-59 2,340 13.6 1.4 3.6 1.4 1.5 0.3
60-74 1,574 9.5 1.0 1.9 0.7 0.8 0.3
75+ 378 9.3 0.5 0.2 0.2 0.2 0.0
Driver sex
Male 3,288 18.4 2.8 6.0 2.8 3.3 1.2
Female 3,324 10.0 1.2 3.3 1.6 1.6 0.8
Region
Northeast 1,231 14.8 2.3 5.0 1.7 3.1 0.9
Midwest 1,560 15.4 1.3 5.7 2.7 2.7 0.7
South 2,359 12.8 1.7 3.6 2.1 1.7 1.0
West 1,462 14.1 2.8 5.0 2.2 2.7 1.4
Alcohol use
Yes 4,308 21.2 3.0 5.9 2.6 3.4 1.5
No 2,296 - - 2.2 1.2 0.4 0.0
Marijuana use
Yes 643 41.0 10.8 46.8 21.8 24.2 10.0
No 5,937 11.1 1.0 - - - -
Carefulness compared to other drivers
Somewhat or much more careful 5,445 12.3 1.5 3.9 1.7 1.8 0.6
About the same 1,070 20.0 3.1 6.0 3.1 3.9 2.0
Somewhat or much less careful 86 50.7 18.1 32.8 18.2 23.8 12.3
Speed compared to other drivers
Somewhat or much faster 1,214 25.8 4.2 8.8 4.0 4.8 2.0
About the same 3,791 12.2 1.5 4.3 2.1 2.2 1.0
Somewhat or much slower 1,581 9.5 1.3 2.2 0.7 1.0 0.2
State per se law for marijuana
Yes 1,985 13.5 1.2 4.2 2.1 2.1 0.7
No 3,657 14.4 2.4 4.7 2.1 2.6 1.2
State per se law for marijuana × marijuana use
Per se law × marijuana user 199 37.9 5.2 44.1 21.9 22.1 7.2
Per se law x non-user 1,985 11.0 0.8 - - - -
No per se law × marijuana user 398 42.0 14.6 48.2 21.6 25.9 11.7
No per se law x non-user 3,655 11.4 1.1 - - - -
Base: drivers 18+ who reported driving in the past 30 days, weighted to reflect the US population Note: drivers with missing values for row variables were excluded where relevant
15

Table 3. Knowledge of per se laws for marijuana by year, state law status, and marijuana use, representative sample of drivers 18+, United States, 2013-2015.
Base: drivers 18+ who reported driving in the past 30 days, weighted to reflect the US population Note: drivers with missing values for row variables were excluded where relevant
Yes No "I don't know"
N
All drivers 6,612 46.1 2.7 51.2
Year
2013 2,012 45.0 2.6 52.4
2014 2,207 47.2 3.3 49.5
2015 2,393 46.4 2.5 51.1
State per se law for marijuana
Yes 1,985 48.5 2.4 49.1
No 3,657 44.7 2.8 52.4
Marijuana use
Yes 643 36.4 9.1 54.6
No 5,937 47.3 2.0 50.7
Drove within 1 hr of using
marijuana in past year
Yes 286 29.8 15.1 55.2
No 6,313 46.9 2.1 50.9
State per se law for marijuana x
marijuana use
Per se law x marijuana user 200 37.5 7.7 54.9
Per se law x non-user 1,985 49.7 1.8 48.5
No per se law x marijuana user 398 35.0 10.3 54.7
No per se law x non-user 3,657 45.8 2.0 52.2
State per se law for marijuana x
drove within 1 hr of using
marijuana in past year
Per se law x drove after use 80 32.6 12.8 54.6
Per se law x did not drive after use 2,111 49.2 1.9 48.9
No per se law x drove after use 186 29.1 17.2 53.7
No per se law x did not drive after use 3,881 45.5 2.1 52.4
(Row %)
Per se law for marijuana
16
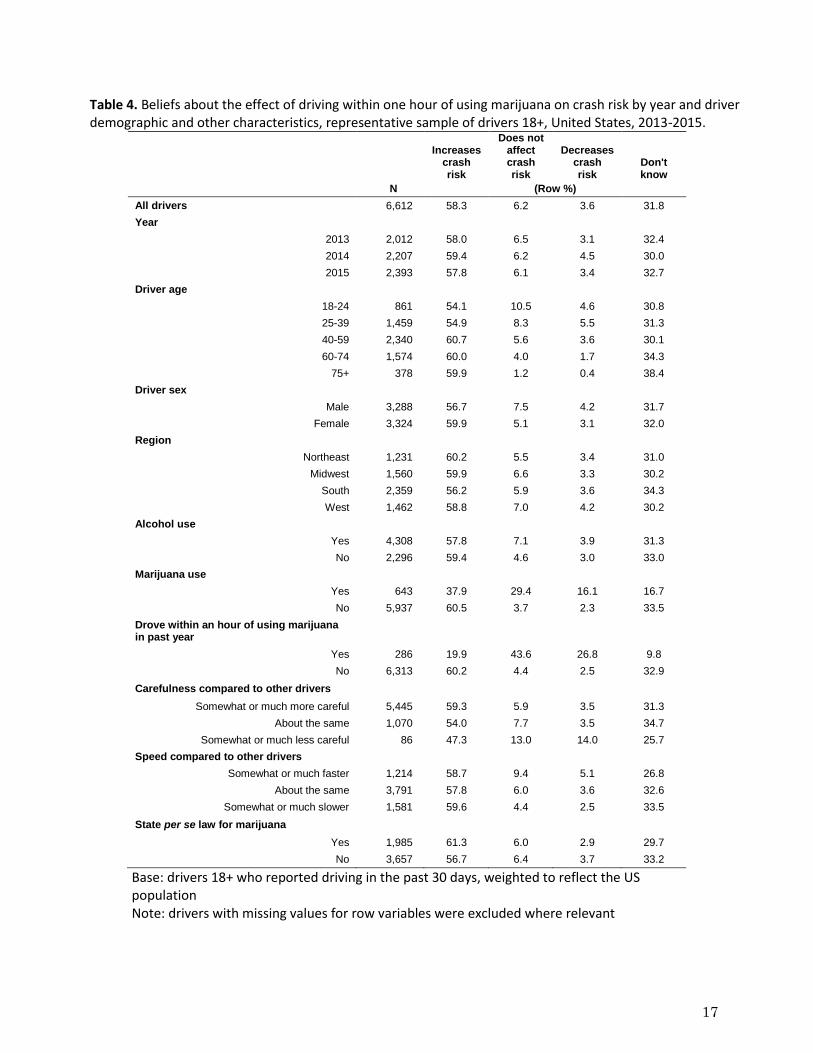
Table 4. Beliefs about the effect of driving within one hour of using marijuana on crash risk by year and driver demographic and other characteristics, representative sample of drivers 18+, United States, 2013-2015.
Increases
crash risk
Does not affect crash risk
Decreases crash risk
Don't know
N (Row %)
All drivers 6,612 58.3 6.2 3.6 31.8
Year
2013 2,012 58.0 6.5 3.1 32.4
2014 2,207 59.4 6.2 4.5 30.0
2015 2,393 57.8 6.1 3.4 32.7
Driver age
18-24 861 54.1 10.5 4.6 30.8
25-39 1,459 54.9 8.3 5.5 31.3
40-59 2,340 60.7 5.6 3.6 30.1
60-74 1,574 60.0 4.0 1.7 34.3
75+ 378 59.9 1.2 0.4 38.4
Driver sex
Male 3,288 56.7 7.5 4.2 31.7
Female 3,324 59.9 5.1 3.1 32.0
Region
Northeast 1,231 60.2 5.5 3.4 31.0
Midwest 1,560 59.9 6.6 3.3 30.2
South 2,359 56.2 5.9 3.6 34.3
West 1,462 58.8 7.0 4.2 30.2
Alcohol use
Yes 4,308 57.8 7.1 3.9 31.3
No 2,296 59.4 4.6 3.0 33.0
Marijuana use
Yes 643 37.9 29.4 16.1 16.7
No 5,937 60.5 3.7 2.3 33.5
Drove within an hour of using marijuana in past year
Yes 286 19.9 43.6 26.8 9.8
No 6,313 60.2 4.4 2.5 32.9
Carefulness compared to other drivers
Somewhat or much more careful 5,445 59.3 5.9 3.5 31.3
About the same 1,070 54.0 7.7 3.5 34.7
Somewhat or much less careful 86 47.3 13.0 14.0 25.7
Speed compared to other drivers
Somewhat or much faster 1,214 58.7 9.4 5.1 26.8
About the same 3,791 57.8 6.0 3.6 32.6
Somewhat or much slower 1,581 59.6 4.4 2.5 33.5
State per se law for marijuana
Yes 1,985 61.3 6.0 2.9 29.7
No 3,657 56.7 6.4 3.7 33.2
Base: drivers 18+ who reported driving in the past 30 days, weighted to reflect the US population Note: drivers with missing values for row variables were excluded where relevant
17
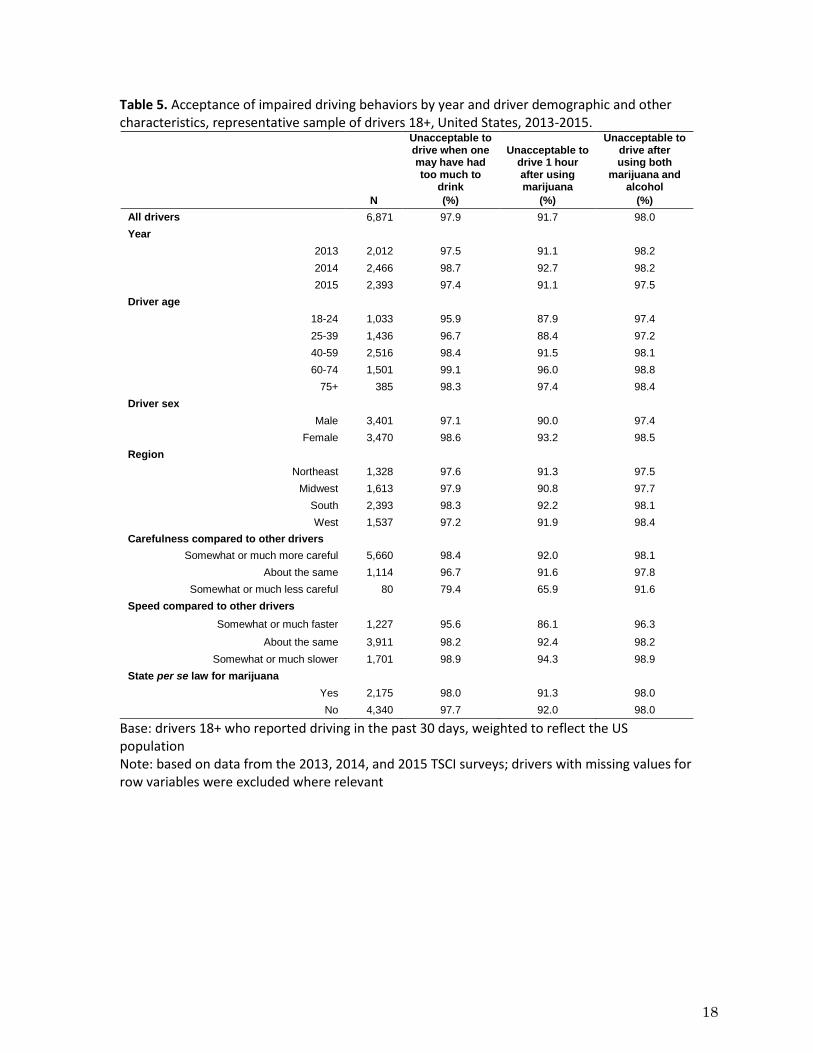
Table 5. Acceptance of impaired driving behaviors by year and driver demographic and other characteristics, representative sample of drivers 18+, United States, 2013-2015.
Unacceptable to drive when one may have had too much to
drink
Unacceptable to drive 1 hour after using marijuana
Unacceptable to drive after using both
marijuana and alcohol
N (%) (%) (%)
All drivers 6,871 97.9 91.7 98.0
Year
2013 2,012 97.5 91.1 98.2
2014 2,466 98.7 92.7 98.2
2015 2,393 97.4 91.1 97.5
Driver age
18-24 1,033 95.9 87.9 97.4
25-39 1,436 96.7 88.4 97.2
40-59 2,516 98.4 91.5 98.1
60-74 1,501 99.1 96.0 98.8
75+ 385 98.3 97.4 98.4
Driver sex
Male 3,401 97.1 90.0 97.4
Female 3,470 98.6 93.2 98.5
Region
Northeast 1,328 97.6 91.3 97.5
Midwest 1,613 97.9 90.8 97.7
South 2,393 98.3 92.2 98.1
West 1,537 97.2 91.9 98.4
Carefulness compared to other drivers
Somewhat or much more careful 5,660 98.4 92.0 98.1
About the same 1,114 96.7 91.6 97.8
Somewhat or much less careful 80 79.4 65.9 91.6
Speed compared to other drivers
Somewhat or much faster 1,227 95.6 86.1 96.3
About the same 3,911 98.2 92.4 98.2
Somewhat or much slower 1,701 98.9 94.3 98.9
State per se law for marijuana
Yes 2,175 98.0 91.3 98.0
No 4,340 97.7 92.0 98.0
Base: drivers 18+ who reported driving in the past 30 days, weighted to reflect the US population Note: based on data from the 2013, 2014, and 2015 TSCI surveys; drivers with missing values for row variables were excluded where relevant
18
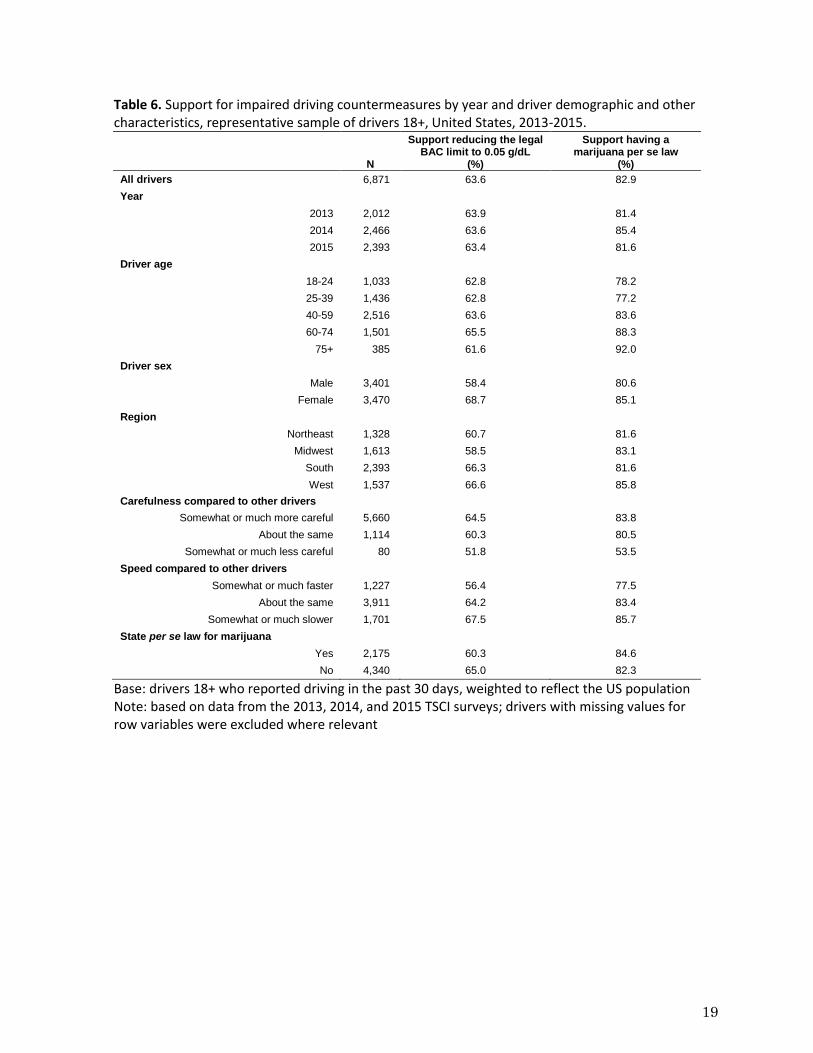
Table 6. Support for impaired driving countermeasures by year and driver demographic and other characteristics, representative sample of drivers 18+, United States, 2013-2015.
Support reducing the legal
BAC limit to 0.05 g/dL Support having a
marijuana per se law N (%) (%)
All drivers 6,871 63.6 82.9
Year
2013 2,012 63.9 81.4
2014 2,466 63.6 85.4
2015 2,393 63.4 81.6
Driver age
18-24 1,033 62.8 78.2
25-39 1,436 62.8 77.2
40-59 2,516 63.6 83.6
60-74 1,501 65.5 88.3
75+ 385 61.6 92.0
Driver sex
Male 3,401 58.4 80.6
Female 3,470 68.7 85.1
Region
Northeast 1,328 60.7 81.6
Midwest 1,613 58.5 83.1
South 2,393 66.3 81.6
West 1,537 66.6 85.8
Carefulness compared to other drivers
Somewhat or much more careful 5,660 64.5 83.8
About the same 1,114 60.3 80.5
Somewhat or much less careful 80 51.8 53.5
Speed compared to other drivers
Somewhat or much faster 1,227 56.4 77.5
About the same 3,911 64.2 83.4
Somewhat or much slower 1,701 67.5 85.7
State per se law for marijuana
Yes 2,175 60.3 84.6
No 4,340 65.0 82.3
Base: drivers 18+ who reported driving in the past 30 days, weighted to reflect the US population Note: based on data from the 2013, 2014, and 2015 TSCI surveys; drivers with missing values for row variables were excluded where relevant
19