Embed Size (px)
Citation preview

Capturing the Value of Offshore Wind A multi-criteria, portfolio approach to shaping the UK’s future electricity generation mix
Dr Mark Cooper October 2012

ii
Dr Mark Cooper,
Senior Research Fellow for Economic Analysis,
Institute for Energy and the Environment,
Vermont Law School.

Capturing the Value of Offshore Wind
i
Table of Contents
Table of ContentsGlossary iii
Foreword v
Executive Summary vii
Author’s Preface 1 A. The Challenge and Opportunity 1 B. The Quest for Low Carbon Generation Resources 1 C. Policy Implications 3 D. The Need for New Analytical Tools 4 E. Outline 6I. The Traditional Approach to Cost Analysis Applied to Low-Carbon Generation Technology Choice
in the United Kingdom 9 A. Basic Assumption of the Analysis 9
B. The Key Resources and Main Technologies 11 1. Fossil Fuels 2. Offshore Wind 3. Nuclear reactors C. The Key Drivers of Cost and Ambiguity in the Mid-Term 14
II. Decision Making in Complex Environments Where Knowledge is Limited 19 A. The Terrain of Knowledge 19 B. Empirical Measures for Describing Resources 23 1. Risk: Portfolio Development with Hedging 2. Uncertainty: Real Option Analysis 3. Vagueness: Learning, The Cost of Capital, Environmental Impacts 4. The Region of Unknowns: Surprises C. Multi-Criteria Measures of UK Resources 28 1. The Cost-Risk Tradeoff 2. Valuing Real Options 3. Capital costs of Vagueness
III. Multi-Criteria Evaluation 33 A. Optimisation Analysis 33 B. Potential Gains from Policies to Promote Low-Carbon Resources and a Balanced
Portfolio Approach 35 C. Comparison to Qualitative Factors in Traditional Analysis 37
IV. Policy Implications 41 A. Ending the Implicit Subsidy on Fossil Fuels 41 B. Market Barriers and Imperfections: The Link to Market Reform 42 C. Reducing Barriers and Sources of Ambiguity 44
Appendix A: Intellectual Origins of the Multi-Criteria Approach 47
Appendix B: Market Imperfections that Suppress Investment in Offshore Wind 57
Bibliograpy 65

Capturing the Value of Offshore Wind
ii
Table of Contents
List of TablesI-1 Market Barriers in the Regions of Knowledge and Policy Responses 4, 45I-2 Comparison of Assumptions, Data and Analytic Approaches 9II-1 Ambiguity in the Increasingly Complex Terrain of Knowledge 20III-1 Potential Upside of Policies and Portfolios Promoting Investment in Offshore Wind 36III-2 Electricity System Performance, Characteristics and Strategies 38 III-3 Qualitative Comparison of Generic Features of Generation Technologies Operationalised in the Multi-Criteria Portfolio Analysis 40A-1 Framing the Terrain of Knowledge in Three Perspectives 48A-2 Defining Policy Rules For the Regions of Knowledge 54B-1 Market Imperfections that Suppress investment in Offshore Wind 57B-2 Market Imperfections and Policy Responses 62
List of FiguresI-1 Decision Space in the Traditional Approach 2, 17 I-2 Decision Space in Multi-Criteria Portfolio Analysis 3, 9 I-3 Levelised Cost, Mid Term 2020-2023 11I-4 Average Prices of Fuels Purchased by the Major UK Power Producers 12I-5 Overnight Cost of Nuclear Reactors (2011$/kW) 13I-6 MacDonald Levelised Cost Estimates Offshore Wind and Gas w/CCS Across Time 14I-7 CEC Overnight Cost Trends Compared to Arup, 2011; MacDonald 2011 16II-1 Risk/Cost Reward, Cost/Risk Analysis 24II-2 One-Step Approach to Evaluating Cost Risk Trade-offs 24II-3 Uncertainty: The Opportunity Cost of Waiting Must be Compared to the Expected Value
of Making Decisions with more Information 26II-4 The Basic Cost-Risk Framework: Adding Offshore Wind to the Portfolio 29II-5 Sunk Costs as an Indicator of Exposure to Uncertainty 30II-6 Conceptual Measures of Real Option Value of Waiting in Building a Generation Portfolio 31II-7 Potential Gains from Policies to Lower Risk and Lower Capital Needs 2023 32III-1 Multi-Criteria Array of Low Carbon Resource Options 34III-2 Expected Cost of Fossil Fuel – Offshore Wind Portfolios 35III-3 The Cost of Future Electricity Capacity 37III-4 Qualitative Rank Ordering of Environmental Impacts 39B-1 Market Imperfections Shift the Investment/Adoption Frontier Leading to Under Investment, Lower Adoption and Reductions in Social Welfare 63

Capturing the Value of Offshore Wind
iii
Glossary
GlossaryBlack Swan unexpected events of large magnitude and negative consequence -- extreme outliers
-- that deviate beyond what is normally expected of a situation and that would be extremely difficult to predict.
Busbar Costs the price of the power leaving the plant. All capital, fuel, and operating costs are taken into account in busbar costs.
CCGT gas with CCS Combined Cycle Gas Turbine with carbon capture and storage
Cost of Capital the rate of return that capital could be expected to earn in an alternative investment of equivalent risk.
Discount Rate The interest rate used to determine the present value of future cash flows. The discount rate takes into account the time value of money (the idea that money available now is worth more than the same amount of money available in the future because it could be earning interest) and the risk or uncertainty of the anticipated future cash flows (which might be less than expected).
Economies of scale reductions in unit cost as the size of a facility and the usage levels of other inputs increase
Feed-in Tariff guarantee grid access under long term contracts based on the cost of generation.
FOAK First of a kind, assumes little learning.
Gas w/ccs Future combined cycle gas fired generation with carbon capture and storage.
IGCC w/ccs Future coal fired generation with carbon capture and storage.
Instant cost usually referred to as overnight costs -- the cost of a construction project if no interest was incurred during construction, as if the project was completed “overnight.”
kW kilowatt, unit of electrical or other power equivalent to one thousand watts
kWh kilowatt hour is a unit of energy equivalent to one kilowatt (1 kW) of power expended for one hour (1 h) of time.
Learning effects technological progress resulting from the experience of carrying out an operation independent of economies of scale.
MW Megawatt, unit of electrical or other power equivalent to one million watts
MWh Megawatt hour is a unit of energy equivalent to one Megawatt (1 MW) of power expended for one hour (1 h) of time.
Natural gas CCT Combined Cycle Gas Turbine
NOAK Nth of a kind, assumes extensive learning to lower cost/risk.
Nuclear Future nuclear generation.
Offshore – R2 UK Round 1 & 2 “near” offshore wind.
Offshore – R3 UK Round 3 “far” offshore wind.
Overnight cost the cost of a construction project if no interest was incurred during construction, as if the project was completed “overnight.”

Capturing the Value of Offshore Wind
iv
Supergrid an electricity system, mainly based on direct current, designed to facilitate large-scale sustainable power generation in remote areas for transmission to centres of consumption
Unabated Gas current combined cycle gas fired generation without carbon capture and storage (“ccs”)
Unabated IGCC Integrated Gasification Combined Cycle without carbon capture and storage or other measures to reduce carbon emissions
White Swan unexpected events of large magnitude and positive consequence -- extreme outliers -- that deviate beyond what is normally expected of a situation and that would be extremely difficult to predict.

Capturing the Value of Offshore Wind Foreword
v
ForewordThe Value of WindEddie O’ConnorFounder and Chief Executive, Mainstream Renewable Power
I have been developing and building wind and solar plant in markets around the world since 1997. In 2008 together with a group of uniquely experienced and talented colleagues, I founded Mainstream. Mainstream is now the UK’s leading independent offshore wind company, with over 5000 MW in development. In most, but not all, of the other markets in which we operate, government or the regulator has offered a revenue or capital support scheme to incentivise renewable energy development. Critics of renewable energy have argued that the provision of such schemes “prove” that wind and solar energy are uneconomic, inefficient and costly. What I know, from insights gained over the last 15 years, and from evidence gathered from global markets, is that the benefits to electricity consumers or taxpayers delivered by wind and solar energy outweigh the costs.
At Mainstream, we refer to these benefits as the “Value of Wind”. Part of our mission as a company is to ensure that the Value of Wind can be more readily understood, and used to help shift policy discussion from the costs to the benefits of renewable energy. This Paper from Dr. Mark Cooper, and its companion Paper from economic forecaster, Cebr, published in June this year, continues that mission. They clearly illustrate the value of the investment in, and support for, offshore wind to the UK economy.
In 2010 the Offshore Valuation Group set out to measure the value of the UK’s offshore renewable energy resource.1 The Group concluded that, by harnessing less than a third of that resource, the UK could, by 2050:
• Generate the electricity equivalent of 1bn barrels of oil a year;• Reduce its CO2 emissions by 1bn tonnes; and• Create over 145,000 new jobs.
The June 2012 Paper on the Value of Offshore Wind from the Cebr built on that work by exploring the impact of planned investment in offshore wind electricity generation in the UK. It concluded2 that that investment could be expected:
• By 2015, to increase UK GDP by 0.2%, and create over 45,000 full time jobs, delivering employment and economic growth at a time of economic fragility.
• By 2020, to double that GDP contribution to 0.4%, and the number of people employed to over 97,000. • By 2030, in addition to adding 0.6% GDP growth, and creating 173,000 jobs, the sector will deliver an
increase in net exports of £18.8 billion, sufficient to fill nearly 75% of the UK’s current balance of trade deficit. These benefits will accrue from pursuing current moderate build out rates of offshore wind. A more aggressive, but achievable, approach could see an annual 1% uplift to GDP, the creation of over 200,000 jobs and an increase in net exports of £22.5 billion – almost enough to entirely plug the country’s balance of trade deficit.
1 Offshore Valuation Group, 2010.2 Based on Cebr’s analysis of foreign trade multipliers for offshore wind investment.

Capturing the Value of Offshore WindForeword
vi
We commissioned Cebr and Mark Cooper to look at the UK’s emerging offshore wind sector to illustrate its present – and future – contribution to the UK economy. Offshore wind has the potential to transform electricity generation by delivering – in a decarbonised power sector - a very large amount of carbon and fuel-free power to consumers, and by enabling the UK to capture significant additional value from the wider industrial benefits that the sector will deliver.
We have set out to build on the work of the Offshore Valuation Group in this project. The “Value of Offshore Wind” to the UK is truly significant. The Cebr has shown that the net economic benefit to UK plc from investment in offshore wind, both in terms of contribution to GDP, and to the country’s balance of trade is considerable. In this Paper, Mark Cooper shows that, in addition to these effects, offshore wind in the UK provides policymakers with a generation asset that fits squarely within the optimum generation mix required to deliver decarbonised, affordable and secure electricity.
Other recently published studies reinforce the conclusion that even within a diverse energy mix like that of the UK, wind power provides a net economic benefit to the economy and is a reliable and efficient generation technology.3
We have embarked on a once off transition from fossil fuels towards a low carbon economy. All forms of renewable energy, from solar energy to tidal energy, will contribute to delivering this transition in the UK. Offshore wind provides this country with a clear global comparative advantage, and will assist in providing affordable electricity to consumers and enhancing the country’s energy security.
As Cebr and Mark Cooper show wind energy, and particularly offshore wind, offers a clear low carbon growth path for the UK economy, and a clear low carbon growth strategy for the UK Government. Their work is a very valuable addition to the debate on this country’s energy policy and I welcome its publication.
October 2012
3 Analysis of the value creation potential of wind energy policies Ernst & Young July 2012; Beyond the Bluster IPPR August 2012

vii
Capturing the Value of Offshore Wind Executive Summary
Executive SummaryIt makes sense as a country to be less reliant on sources of oil and other fuels from difficult and dangerous parts of the world. It makes sense to be more diversified and what could be more diversified than local sources and locally produced energy.
The Rt Hon. David Cameron MP 14 September 20124
Electricity is important. It is important to the economy, society and the individual. It has implications far beyond the core activity of generating and consuming electrical energy.
Electricity has been the most important form of energy consumption in advanced industrial societies in the 20th century and is destined to play an even larger role in the digital economy of the 21st century. Successfully managing the decarbonisation of the electricity sector, while maintaining affordability and energy security, is a singularly important and urgent policy objective.
The choices as to which generation technologies to include in the overall UK portfolio and how much of each to facilitate will determine whether or not this policy objective is met.
But these are difficult choices.
In an increasingly complex policy environment it is fundamentally important that those choices are made with the best information and the most appropriate analytical tools. This Paper makes the case that new tools are required to ensure the best electricity generation options are chosen from the wide range available. Traditionally, policymakers conducted cost and risk analysis of a range of technologies based on historic data and some forward assumptions. This analysis, based on the levelised cost of energy (“LCOE”) was sufficient in a world of stable fuel prices, in which no or little consideration was given to issues of energy security, diversity of supply, or decarbonisation. In that analysis offshore wind is seen as expensive as its capital costs are greater than those of alternative – fossil based – generation.
Today, that analysis is no longer sufficient.5 It fails to account for the risks and uncertainties borne by UK electricity consumers that result from unabated fossil fuel consumption, and puts no value on the wider economic benefits that accrue through the development of offshore wind, or other forms of renewable energy.
This paper makes the case that a more effective approach is to apply modern investment portfolio theory to energy policy. The insights offered by multi criteria financial portfolio risk management, or “multi-criteria portfolio theory” provide energy policymakers with a set of tools to help them shape a future electricity portfolio
4 PM backs ‘virtual power station’ scheme 21 September 2012: http://www.link2portal.com/pm-backs-%E2%80%98virtual-power-station%E2%80%99-scheme
5 Analysis of the value creation potential of wind energy p.2: “Policy makers increasingly need to take informed decisions on the opportunities to support renewable energy generation. In most cases, choices are based on a comparison of the respective Levelised Cost of Energy (LCOE) of technologies but seldom include a comprehensive analysis of the additional economic costs or benefits. On the basis of the LCOE analysis, renewable energy technology such as wind power generation present in most cases a higher cost than fossil fuel based generation technologies. However wind power also triggers returns for the domestic economy by generating local added value and job creation.”

viii
Capturing the Value of Offshore WindExecutive Summary
that delivers the best return for UK consumers by more effectively managing risks and uncertainty associated with different forms of generation.
The multi-criteria portfolio approach accepts that the future is often uncertain and seeks to identify risks and unknowns in the decision making process so as to deliver a generation portfolio that creates the greatest value while minimising risk. As well as cost and risk, policymakers now need to account for the increasing levels of uncertainty and vagueness in the decision making process. They also must anticipate a range of unknowns or Black Swans.
Using existing data the paper identifies a range of risks that are not currently captured in decision making, and incorporates them into an analysis of the UK’s electricity generation sector. The analysis shows that a rising share of offshore wind in the UK’s electricity generation portfolio is the key to achieving Government’s near and long-term goals of supplying affordable, clean and secure energy to UK consumers. Policy makers have a number of conventional and low-carbon technology options to choose from to meet the need for electricity in the UK. Historically, gas and coal- powered electricity have appeared the most attractive. But folding uncertainty and vagueness into the decision-making analysis, as well as carbon reduction requirements reveals that a generation portfolio dominated by unabated gas and coal will be the most risky and costly option for the UK.6
In contrast, developing a diverse incremental portfolio of assets that includes very significant amounts of offshore wind lowers both the risk and the expected costs of generation.
Further, if policy makers adopt a “no technology” approach, where generators simply pay a carbon tax and no particular generation technologies are favoured over others, energy costs are projected to rise much more steeply. Indeed, carbon taxes could double the cost of electricity. However, a strategy that actively promotes low cost alternatives through supporting innovation and development of technology like offshore wind will significantly reduce the incremental costs of decarbonisation.
Applying that analysis, this Paper shows that for the UK, offshore wind is one of the most attractive options available to deliver current energy objectives for the following key reasons:
• Offshore wind provides low-carbon, secure, and indigenous energy. Offshore wind meets the wide-ranging needs for the energy sector, while potential costs are as low as, or lower than, the other major available alternatives. Offshore wind is also insulated against fuel and carbon price risks, and its addition to a generation portfolio lowers variable cost risk dramatically.
• Offshore wind competes with conventional energy sources on cost. The current UK market assumption is that the costs of offshore wind will converge around £100/MWh in the medium term, making it competitive on cost with other onshore technologies. However, as set out above, offshore wind delivers other benefits to the UK’s generation portfolio today which make it an essential part of the current generation mix.
• Offshore wind minimises energy price risk for consumers. Putting assets, such as coal and gas, that covary strongly and that are price-volatile into the UK’s generation portfolio increases the risk of dramatic price spikes, which recent history shows are passed on directly to UK consumers. Providing consumer support for renewable technologies like offshore wind helps reduce that risk, and lowers the overall cost of energy.
6 Analysis of the value creation potential of wind energy – the net economic benefits of wind energy to the UK are broadly equal or greater than those of gas, despite the UK’s significant reserves of the latter.

ix
Capturing the Value of Offshore Wind Executive Summary
• Offshore wind costs will fall through learning. For coal and gas, the cost of capital and learning are not very important, but the future price of fuel is. Future price rises cannot be hedged by cheaper deployment costs. For offshore wind, the cost of capital and learning are of great importance. With free fuel, reductions in the deployment costs of offshore wind will have a significant and guaranteed downward impact on the cost of energy.
• Offshore wind development adapts well to periods of uncertainty. The relatively short construction time and smaller increments in which offshore wind generation can be delivered compared to conventional alternatives are attractive attributes, giving wind an advantage with respect to uncertainty.
• Offshore wind provides major economic development opportunities. Although near-term costs of offshore wind are high, over the long term costs will decline and it can play an important role in providing a major source of economic growth for the UK. Offshore wind technology and expertise can be exported to the electricity sector across a world that is increasingly focused on decarbonisation.
By the 2030s, when the Committee on Climate Change expects the UK’s power sector to be fully decarbonised, wind will be the most attractive of the UK’s main generation resources and in terms of price, offshore wind will be the most competitive. Indeed, looking over the broader range of technologies offshore wind could well be considered to be the resource of choice against which other all other resources are measured.
Despite offshore wind’s clear advantages over conventional energy sources, it faces a number of barriers. These barriers, such as the negative externalities of fossil fuel-based electricity that have been unaccounted for in past generation choices, and the difficulties and costs associated with switching from high to low carbon energy infrastructure, have made offshore wind unattractive to policy makers solely concerned about upfront costs. But employing the Multi-Criteria Portfolio Analysis, as recommended in this Paper, may help overcome some of these barriers. The Paper shows that offshore wind brings the UK closer to meeting its diverse energy policy objectives than any of the conventional alternatives.
Echoing the words of the Prime Minister, this Paper argues that offshore wind should form an essential and substantial component of any future UK generation portfolio. It also adds rigorous analytical support to the growing body of evidence that asserts a substantial expansion of offshore wind generation in the UK is feasible (technologically), beneficial (economically), efficient (in resource utilisation) and practicable (administratively). The sooner UK energy policies reflect this reality, the better. Continuing to rely on fossil fuels into the coming decades will make shifting to cleaner and locally produced energy sources significantly more expensive than if that process begins today.

x
Capturing the Value of Offshore Wind Executive Summary

1
Capturing the Value of Offshore Wind Author’s Preface
Author’s PrefaceA. The Challenge and OpportunityHow do we power the future at the lowest total cost, while creating the greatest potential to grow the economy?
Since electricity has been the most important form of energy consumption in advanced industrial society in the 20th century and is destined to play an even larger role in the digital economy of the 21st century, successfully managing the decarbonisation of the electricity sector is a particularly important and urgent task.
The search for alternatives to mitigate the impact of fossil fuels on climate change is underway. The analysis set out in this Paper shows that there are a number of options that can help to constrain the increase in the cost of electricity, although it will rise in real terms. In the UK’s decarbonised electricity sector, offshore wind is one of the more attractive options in two important ways.
• In the narrow sense of meeting the need for electricity, it is a carbon free, secure, local renewable resource that does not have to be imported and that has costs that can be as low, or lower, than the other major available alternatives.
• In the broader sense of growing the economy, it can also play an important role in providing a major source of exports to the growing decarbonised, global electricity sector. The policy challenge for the next quarter century is to build a route to that future.
Generation technology choices in the electricity sector have always been complex and must balance multiple considerations, like cost, reliability, and environmental impact. The fact that the activity involves a vital service with no close substitutes and a key input for much economic activity has long made electricity generation technology choice an urgent economic policy. Over the past couple of decades, however, the complexity and difficulty of the decision making process has increased significantly, as the risks associated with traditional fuels have multiplied.
The decision to decarbonise the economy, including the electricity sector, multiplies the ambiguity of and the pressure on these choices exponentially. Fossil fuels that have been the primary source of power to drive electricity generators for decades are one of the major sources of greenhouse gas emissions. This Paper shows how the UK Government can identify and then tackle the pressures on technology choices and by so doing deliver the best outcome to consumers. In managing the sources of the UK’s electricity generation, indigenous low carbon resources are preferable for price risk, supply security and local economic multiplier effects. Given the richness of the wind resource in the UK, it has a chance to both meet its domestic needs and become an exporter of a technology that will have a significant global market.
B. The Quest for Low Carbon Generation ResourcesThe search for alternative sources of power has triggered a second search, an effort to develop decision making tools to ensure that the best options are chosen. Building on a long tradition of analysis with ties to the UK electricity sector through Shimon Awerbuch and Andrew Stirling, this Paper seeks to place multi-criteria portfolio analysis at the heart of generation technology decision making. As shown in Figure ES-1, the Paper begins by extracting the maximum amount of information from the traditional approach to resource acquisition analysis.

2
Capturing the Value of Off shore WindAuthor’s Preface
Figure I-1: Decision Space in the Traditional Approach: Mott MacDonald Base Case Levelised Mid- and Long-Term Cost of Low Carbon Generation Technologies
300
0
50
100
150
200
250
Onsh
ore
Win
d (S
)On
shor
e W
ind
(L)
O�s
hore
Win
dW
ave
Fixe
dW
ave
Floa
ting
Tida
l Str
eam
Tida
l Bar
rage
Hydr
o RO
RSo
lar P
V Cr
ysta
lline
– R
oof
Sola
r PV
Crys
talli
ne –
Gro
und
Sola
r PV
Thin
Film
– R
oof
Sola
r PV
Thin
Film
– G
roun
dGe
othe
rmal
Nucl
ear P
WR
Nucl
ear B
WR
ASC
Coal
– R
etro
Oxy
-CCS
ASC
Coal
– R
etro
PC-
CCS
ASC
Coal
– O
xy-C
CSAS
C Co
al –
PC-
CCS
IGCC
Pre
com
b CC
SCC
GT P
reco
mb
CCS
CCGY
Pos
tC C
CSAd
vnac
ed A
D Se
wag
e Sl
udge
Food
Was
re A
DM
anur
e Sl
urry
AD
Ener
gy C
rops
AD
Woo
d –
Grat
eW
ood
– Ga
sific
atio
nM
SW-S
RF P
yrol
ysis
Woo
d –
BFBC
Woo
d –
CFBC
Was
te W
ood
– Gr
ate
2020£/MWh
Onsh
ore
Win
d (S
)On
shor
e W
ind
(L)
O�s
hore
Win
dW
ave
Fixe
dW
ave
Floa
ting
Tida
l Str
eam
Tida
l Bar
rage
Hydr
o RO
RSo
lar P
V Cr
ysta
lline
– R
oof
Sola
r PV
Crys
talli
ne –
Gro
und
Sola
r PV
Thin
Film
– R
oof
Sola
r PV
Thin
Film
– G
roun
dGe
othe
rmal
Nucl
ear P
WR
Nucl
ear B
WR
ASC
Coal
– R
etro
Oxy
-CCS
ASC
Coal
– R
etro
PC-
CCS
ASC
Coal
– O
xy-C
CSAS
C Co
al –
PC-
CCS
IGCC
Pre
com
b CC
SCC
GT P
reco
mb
CCS
CCGY
Pos
tC C
CSAd
vnac
ed A
D Se
wag
e Sl
udge
Food
Was
re A
DM
anur
e Sl
urry
AD
Ener
gy C
rops
AD
Woo
d –
Grat
eW
ood
– Ga
sific
atio
nM
SW-S
RF P
yrol
ysis
Woo
d –
BFBC
Woo
d –
CFBC
Was
te W
ood
– Gr
ate
2040
O�shore WindCoalGas
Source: Derived from Mott MacDonald, Cost of Low-Carbon Generation Technologies (Committee on Climate Change, May 2011), Figure 7.4. See Section I.
Figure I-1 shows the results of a major analysis recently prepared for Committee on Climate Change by a leading UK energy analysis fi rm. It shows that, over time low carbon alternatives cluster in the range of about £100/MWh, under the assumption that signifi cant learning takes place, which lowers both the amount of capital investment needed and the cost of capital. Rising and volatile fuel and carbon prices continue to be endemic to fossil fuels, so the alternatives like off shore wind become relatively more attractive over time. The traditional approach leaves unanswered the question of which of the alternatives should be chosen and in what proportions.
Figure I-2 shows the results of the multi-criteria portfolio approach applied to the underlying cost data used in the traditional analysis. It assesses the impact of adding increments of diff erent resources on the cost and variability of the portfolio. It shows that creating portfolios of assets that blend fossil fuels and off shore wind lowers risk and cost. For the incremental additions, the optimum outcome is in the range of 40% to 60% off shore wind. Since the level of wind in the current UK generation mix is relatively low, wind’s share can grow signifi cantly over a number of years without approaching the upper boundary of this conclusion. Over the longer term, improvements in grid management, storage capabilities, Supergrid deployment, would all enable the contribution of wind (and a number of the other low carbon resources) to be further expanded.

3
Capturing the Value of Off shore Wind Author’s Preface
Figure I-2: Decision Space in Multi-Criteria Portfolio Analysis: Optimisation of Expected Cost of Fossil Fuel – Off shore Wind Portfolios
£135
£130
£125
£120
£115
£110
£105
Levilised/ MWhAdjusted for time value of sunk costs
Ambiguity = Standard Devations includes Risk + Uncertainty + Vagueness
£100£0 £40£35£30£25£20£15£10£5
Fossil E�cient Frontier
100% O�shoreR2–R3
50% Fossil, 50% O�shore R2–R3
100% Fossil, 50-50 Gas & Coal w/CCS
Source: Calculated by author, see Sections II and III.
C. Policy ImplicationsOff shore wind is an investment that fulfi ls the basic tenets of advice that is off ered in portfolio analysis. Faced with a great deal that is not known about certain elements of the prospective generation portfolio and their cost, availability and impact on the environment, technology/capacity choices should:
• be hedged against risk by identifying the trade-off s between cost and risk to enable the decision maker to lower risk through hedging;
• maximise options that reduce exposure to uncertainty by buying time and acquiring small increments of capacity that can be added quickly;
• be fl exible with respect to vague outcomes by avoiding assets that have unknown or uncontrollable eff ects and creating systems that monitor conditions and can adapt to change in order to maintain system performance;
• be insulated against the unknown by buying insurance with a diversifi ed portfolio of assets that exhibit variety, balance and disparity.
From a policy perspective, wind is attractive not only because of its direct benefi cial eff ects in electricity sector risk reduction and its economy wide growth stimulating potential, but also because the policies that are necessary to expand its contribution to the decarbonised economy entail attributes that can be eff ectively addressed by policy, as suggested in Table I-1. Moreover, there is growing and compelling evidence that aggressive measures to stimulate innovation in alternative technologies results in lower transition costs. If public policy can effi ciently capture the benefi ts of learning by doing, correcting the misallocation of the risk of fuel price volatility, and reducing the bias (risk aversion) against new technology, the long-term constraint on the contribution of off shore wind will be neither the availability nor the cost of the resource, but the ability to manage and integrate it into a reliable electricity grid.

4
Capturing the Value of Offshore WindAuthor’s Preface
Table I-1: Market Barriers in the Regions of Knowledge and Policy Responses
Vagueness Risk
Barriers: Public Goods learning-by doing, lack of economies of scale result in high capital cost and Interest rate
Policy Responses: Incentivise learning, capture economies of scale and network effects with obligations, loan guarantees
Barriers: Perverse Incentives, Agencyproblems caused by misallocation of fuel price risk
Policy Responses: Reflect merit in dispatch, compensate low risk resources with a Feed-In tariff
Unknowns Uncertainty
Barriers: Black Swan: Network ManagementWhite Swan: GDP multiplier and consumption externalities
Policy Response: Promote diversity with funding of R&D, Education, infrastructure funding
Barriers: Faulty calculation causes loss of real option value by choice of long lead time, high sunk cost projects
Policy Responses: Reward flexibility with capacity adders, facilitate consenting
Source: Author, see Section IV
Stimulating learning, increasing deployment to trigger economies of scale, reduction of risk premia, basic research into information and network infrastructure, are more readily addressable than the price of fossil fuels.
This Paper adds substantial analytic support to the growing body of evidence that shows a substantial expansion of offshore wind generation is feasible (technologically), beneficial (economically), efficient (in resource utilisation) and practicable (administratively). One of the most important conclusions of the analysis is that the sooner policy is put in place to expand the role of offshore wind in the UK electricity sector and economy, the smoother the transition to a low carbon economy will be and the greater the benefits.
D. The Need for New Analytical ToolsThe economic and policy context for generation capacity choices has stimulated intense efforts across the globe to identify cost effective, low carbon alternatives and the policies necessary to bring them into the electricity sector on an accelerated basis. Ensuring adequate supply at affordable prices which had become increasingly challenging in recent years as fossil fuel costs rose, will be significantly more challenging in a decarbonised environment, not because there are no alternatives available, but because, until now, analytic, investment and economic policy attention has been focused on fossil fuels as the preferred power source.
The search for alternative sources of power has triggered a second search, an effort to develop decision making tools to ensure that the best options are chosen.7 While this search for better decision making tools has recently become more intense, a substantial effort to improve decision making with ties to the UK electricity sector
7 In addition to the country and method specific studies cited in notes 17, 18 and 20 and the work of Awerbuch and Stirling, we have recent “how to” proposals including Binz, 2012, Tennessee Valley authority, 201; Hempling, 2011, Ohio Consumers Counsel, 2006,and NARUC, 2006.

5
Capturing the Value of Offshore Wind Author’s Preface
stretches back at least a couple of decades in the work of Shimon Awerbuch8 and Andrew Stirling.9 Their work identified critically important directions for decision making and influenced decisions in important ways, even before the full commitment to decarbonisation.
Awerbuch’s work showed that adding a significant contribution of wind to the mix of resources in the electricity sector would lower risk and cost because it creates a more balanced portfolio of generation assets. Experience over the past decade validates his conclusions. The decarbonisation policy increases the importance of analytic approaches like Awerbuch’s risk-based portfolio approach that can quantify numerous factors and assess how different attributes affect the attractiveness of long term options. Yet, the formal portfolio approach remains the exception in debates about how much and what type of generation technology should be pursued. While the increasingly important role of risk and uncertainty are recognised, they have so far not been included in a systematic way.
Building on the intellectual platform created by Stirling and Awerbuch, this Paper seeks to place multi-criteria portfolio analysis at the heart of generation technology/capacity decision making. The hypothesis that this analysis rests on is the underlying insight that efficient generating portfolios can minimise society’s energy price risk.10
• It restates the underlying principles with references to a growing body of analysis of decision making in complex ambiguous environments,
• It adds a layer of specificity to the analysis and extends it to cover a broader range of ambiguity in ways that will be accessible and useful to decision makers who are familiar with the traditional resource acquisition framework,
• In order to build a bridge between the traditional approach and the multi-criteria portfolio approach, it relies on data that is generally already available in traditional resource acquisition proceedings.
The central premise of this analysis is that the key insights needed for the delivery of effective public policy will not come from tweaking cost estimates to make more accurate projections because the factors that affect future prices are complex and the outcomes are ambiguous. Rather, the key insights for policy making lie in embedding existing information in a framework for decision making that identifies the major sources of ambiguity and adopting policies and approaches that can deal with complex ambiguity. My goal in this Paper is to extract the maximum amount of knowledge from the existing data by configuring it in new ways that shed more light on the available options.
I have applied this framework to assess resources in the United States focusing on various alternatives (wind, efficiency, nuclear power, vehicle fuel economy standards) tailored for different decision making arenas (regulatory commissions and broad policy). 11 The framework is generally applicable across resources, technologies and nations. Specific recommendations may vary from nation-to-nation because resource endowments may be richer or poorer across nations, but the analytic approach is generally applicable across nations and technologies.
The multiple goals of public policy – decarbonisation, affordability, security of supply – underlying the ongoing evaluation of electricity generation technology/capacity choices in the United Kingdom and the role of offshore wind in the future generation mix provide an ideal subject for the application of this framework. The simultaneous
8 Early and recent examples can be found at Awerbuch, 1993, 2008.9 Early and recent examples can be found at Stirling, 1994, 2010.10 Awerbuch and Berger, 2003, p. 1. 11 Cooper, 2011, 2011a, 2012, 2012.

6
Capturing the Value of Offshore WindAuthor’s Preface
reform of the electricity market means that both the goals and policy instruments are in flux. At one level this compounds the complexity and ambiguity. At another level it creates flexibility to tailor new solutions to new problems.
This Paper forms the second part of a project to review the value of offshore wind to the UK economy. The first part, a Paper by the economic consultancy Cebr demonstrated that from the point of view of growing the economy in the 21st century, offshore wind provides an attractive opportunity for the UK to take a leadership role, expand output and promote regional and global exports in a sector that is destined to play an increasingly important part in the global economy.12 Offshore wind is an important technological investment that will expand the UK economy in the decarbonised global economy of the 21st century. That finding is a critically important input for policy makers, but the first question that electricity policy must address is, how can the need for electricity be met with a reliable, affordable source supply?
The attractiveness of offshore wind as an investment for the economy would be significantly diminished if it were not also an attractive investment from the point of view of the electricity sector. This Paper extends Awerbuch’s approach to show offshore wind is an extremely attractive technology for the electricity sector. Moreover, from the point of view of implementation, the Paper identifies the obstacles to achieving a larger contribution from offshore wind and describes the steps necessary to overcome them.
In short, this Paper adds substantial analytic support to the growing body of evidence that shows a substantial expansion of offshore wind generation is feasible (technologically), beneficial (economically), efficient (in resource utilisation) and practicable (administratively). One of the most important conclusions of the analysis is that the sooner policy is put in place to expand the role of offshore wind in the UK electricity sector and economy, the smoother the transition to a low carbon economy will be and the greater the benefits.
E. OutlineImplementing a strategy of building on the existing, traditional approach to generation technology/capacity decision analysis, the Paper is organised as follows:
Section I describes the underlying data used in traditional decision analysis and extracts the key insights for decision making that can be reached based on the traditional approach. It describes the derivation of the levelised cost estimates for each of the technologies considered in the analysis. Because levelised cost is the mainstay of traditional analysis, I make it the launching point for multi-criteria analysis with the objective of showing how the data embedded in the existing levelised cost analysis can be used to improve decision making. The most detailed cost analysis that provides the granular detail needed for the multi-criteria analysis has been updated by several different authors, which makes it necessary to derive an up-to-date cost estimate. The cost estimates I utilise are entirely consistent with the existing estimates. This analysis shows that there are a number of low carbon options available. The multi-criteria portfolio analysis takes the next step and shows why and how the options should be combined into a portfolio of diversified generation resources.
Section II begins by defining the key concepts of multi-criteria portfolio analysis and describes empirical methodologies that can be used to measure how risk, uncertainty and vagueness affect and distort generation technology/capacity decisions, if not carefully analysed. I then present UK-specific measures for each economic
12 Cebr, 2012.

7
Capturing the Value of Offshore Wind Author’s Preface
concept. A discussion of the intellectual origins and grounding of the multi-criteria portfolio approach is placed in Appendix A of the Paper.
Section III presents the quantitative multi-criteria analysis of the mid-term options for low carbon generation in the UK. It examines individual resources and portfolios of resources to define risk-cost trade offs and least cost combinations. It compares the quantitative results with qualitative rankings from traditional analysis.
Section IV presents policy recommendations. Given the policy context, it is not necessary to invoke market failure as a justification for policy intervention, which is where most policy discussions like this commence, because the decarbonisation policy is driven by the recognition of a major market problem – the failure of markets to internalise the environmental harm of fossil fuel use. However, in the current policy context market imperfections are a legitimate and important topic of inquiry in order to identify the barriers that must be overcome to achieve the decarbonisation goal at lowest cost. The policy discussion briefly reviews the implicit subsidy of fossil fuel use that is being eliminated by the decarbonisation decision, the market imperfections that will hinder a smooth transition to alternative, low carbon resources, and the policies necessary to address the imperfections that currently act against offshore wind making its full contribution.

8
Capturing the Value of Offshore WindAuthor’s Preface

9
Capturing the Value of Offshore Wind Section I
I. The Traditional Approach to Cost Analysis Applied to the Challenge of Low-Carbon, Generation Capacity ChoiceA. Basic Assumptions of the AnalysisSince my goal is to locate the current, familiar approaches to capacity decisions in a more systematic and transparent framework for decision making, I start with the approach used by the Mott MacDonald 2010 update of generation costs presented to the Department of Energy and Climate Change (DECC). Although subsequent updates have been made, the MacDonald 2010 analysis has the advantage of including all the major options in a single framework and providing a full suite of alternative assumptions. Where appropriate, I adjust the basic estimates with more recent updates. I focus on the mid-term (2020–2025) because this initial period is the most challenging in terms of cost, as learning effects and economies of scale are incipient. Longer term, the costs of offshore wind are projected to decline substantially in all the cost analyses and become more attractive as an investment option.
Mott MacDonald’s approach is straight forward and reflects the current practice. It uses some universal assumptions and then considers alternative specifications for key variables in the analysis. Table I-2 summarises the similarities and differences between the traditional approach and the multi-criteria approach. In this section, I examine and test the traditional approach for useful insights into the choice of resources.
Table I-2: Comparison of Assumptions, Data and Analytic Approaches
Assumptions Traditional Approach Multi-Criteria Portfolio Analysis
Capital Cost Range of capital costs Fossil fuel capital cost adjusted for Parsons Brinckerhoff 2011, ARUP 2011 estimates
Fuel Costs High and low fuel costs for 2017 High, mid and low fuel costs for 2023 estimated
Decarbonisation Costs Mid and low carbon values High, mid and low carbon values
Technology Technology specific assumptions Same construction periods, plant life, etc.
Time Period Options are evaluated over the short (2017) and mid (2023) term
Focus on the mid-term, 2020–2025 recognising long term is more favourable
Interest Rates High and low interest rates (and therefore capital costs)
Same
Learning Effects Short term costs with and without learning; mid-term costs include learning
Same

10
Capturing the Value of Offshore WindSection I
Analytic Approaches Traditional Approach Multi-Criteria Portfolio Analysis
Reference Point Natural gas CCT cost without carbon capture is the base case.
Efficient frontiers for both gas and coal are identified. Optimum portfolios identified. Wind used as referent for qualitative analysis.
Cost Levelised Same
Risk Average with range, time is the X-axis
Variability = standard deviation of costs used as the X-axis, distance as expected value
Uncertainty Range of estimates and scenarios Price adjusted by lost use of money, Variability adjusted by possibility of abandonment
Vagueness Hi-Lo capital cost; Hi-lo discount rate
All cases average and variation in capital and operating costs included in x-axis adjusted risk/uncertainty
The Mott MacDonald 2010 analysis provides the required detail needed for multi-criteria analysis. It allows us to disentangle the effects of the amount of capital needed, the cost of capital, the cost of fuel, the cost of carbon, and operating costs. The use of the cost of capital as a measureable variable is critically important to the analysis. Subsequent updates changed one or two of these underlying cost drivers (usually capital amount and fuel costs), but did not replicate the detail contained within the Mott MacDonald analysis that is needed for multi-criteria analysis.
The Mott MacDonald analysis was used to derive a levelised revenue requirement multiplier per pound of capital invested (£/MWh) and a levelised revenue requirement per pound of operating cost. Then I applied that multiplier to the updated estimates of the underlying costs, where they are available. For fuel and carbon costs, I use Mott MacDonald’s estimates of high and low costs for 2017. For natural gas, there is no further increase over the long-term. Mott MacDonald did not use a high carbon price case, which I have added. I derive a cost of carbon multiplier based on the Mott MacDonald base case and apply it to a high carbon cost scenario. For coal, the current DECC costs are higher than Mott MacDonald used, but I have not made that adjustment. Other environmental impacts of coal are substantial. Consequently, the costs of coal-based generation are underestimated significantly.
Figure I-3 compares the costs used in this analysis to the published estimates. The first entry is my calculated cost, which is used in subsequent analysis. The Figure then shows the Mott MacDonald 2010 results based on similar assumptions (time and cost components). The entries from ARUP 2011 and PB 2011 show the results from the studies that were used to provided inputs to my update of Mott MacDonald 2010. Finally Figure I-3 shows the Mott MacDonald 2011 results for the mid-term (2020) and the long-term (2040).

11
Capturing the Value of Off shore Wind Section I
Figure I-3: Levelised Cost, Mid Term 2020-2023: Based on 10% Discount Rate Including Learning (Noak), Long Term (2040) Includes Learning and Reduced Discount Rate
£200
£0
£20
£40
£60
£80
£100
£120
£140
£160
£180
MC20
23–1
0%MC
2023
–7.5
%MM
2023
PB20
17/2
3MC
2023
–10%
MC20
23–7
.5%
MM20
23MM
2020
PB20
17/2
3MM
2040
MC20
23–1
0%MC
2023
–7.5
%MM
2023
ARUP
2025
MM20
20AR
UP20
30MM
2040
MC20
23–1
0%MC
2023
–7.5
%MM
2023
MM20
20AR
UP20
25AR
UP20
30MM
2040
MC20
23–1
0%MC
2023
–7.5
%MM
2023
MM20
20PB
2017
/23
MM20
40MC
2023
–15%
MM20
23–1
0%
Unabated Gas Gas w/CCS O�shore – R3 O�shore – R2 IGCC w/CCS Nuclear
MC = calculated by author at 10% and 7.5% discount rates, as described in text and Exhibit III-1; MM2023 = from Mott MacDonald, 2010, using Hi-Lo fuel and carbon in 2017 for 2023 and 7.5% discount for low; ARUP = ARUP, 2011; PB2017/23 = PB, 2011 with 2017 adjusted to 2023 based on MM (2010) Hi-Lo fuel and carbon; MM2020 and MM2040 is from Mott MacDonald (2011)
Figure I-3 supports three important observations for putting the subsequent analysis in perspective. First, the values I have used are consistent with other estimates of the cost of generation. Second, centring the analysis on the calculated, mid-term values uses the most challenging values for off shore wind. If the case for off shore wind can be made with these cost estimates, it would be even stronger with other, longer term estimates. Third, in the long-term, with the assumption that learning lowers costs and experience equalises the interest rate across technologies, the costs converge around £100/MWh. Decisions about which resources to include in the portfolio of generation assets will turn on other characteristics of those resources.
B. The Key Resources and Main Technologies The Mott MacDonald Cost of Generation Study on which my analysis relies identifi es four major resources – gas, wind, coal and nuclear, and ten technologies in its detailed analysis of the “Main Technologies.” My analysis subjects three of those resources and fi ve of those technologies to the detailed multi-criteria analysis – unabated gas, CCGT Gas with CCS, IGCC coal with CCS (“w/CCS”), Off shore Wind R2 and Off shore Wind R3. These are included for the following reasons.

12
Capturing the Value of Off shore WindSection I
1. Fossil Fuels Gas is the fuel of choice at present and has potential to be combined with other resources because of its ability to meet peak load. Unabated gas is a baseline for measuring the value of seeking technology-based approaches to decarbonisation. New technologies can be applied to natural gas and coal to meet the decarbonisation goals. In the Mott MacDonald, 2010 analysis IGCC w/CCS is the lower of the coal-based, decarbonised technologies. These technologies are very early in their development. More importantly, these technologies do not address the other underlying problems that have made fossil fuels less attractive in recent years; namely, dramatically rising, extremely volatile prices and strong correlation between gas and coal prices. Figure I-4 shows the past two decades of natural gas and coal prices delivered to major electricity producers. Putting assets that covary strongly and that are volatile into the resource portfolio increases the risk of dramatic price spikes. One goal of building portfolios is to avoid that risk.
Figure I-4: Average Prices of Fuels Purchased by the Major UK Power Producers (Quarterly)
£2.50
Per MWh
£2.00
£1.50
£1.00
£0.50
£0.001993 1994 1995 1996 1997 1998 1999 2000 2001 2002 2003 2004 2005 2006 2007 2008 2009 20112010
Natural GasCoal
Source: DECC, Quarterly Prices
2. Off shore WindIn order to properly refl ect the nature and cost of the off shore wind resource, it is necessary to include both off shore wind in the R2 and R3 categories, since they represent types of locations that can make a substantial contribution to long run supply and they have diff erent cost characteristics. Existing studies have included this distinction.13 Onshore wind is a very attractive resource and there is no question that it belongs in the generation resource portfolio, but the resource base is more limited in the long-term.
3. NuclearI do not include nuclear power in the detailed analysis below because my analysis of nuclear power concludes that it is not a rational economic choice, at this time.14 In the context of the multi-criteria framework, it is a “Black Swan,”15 and as such should not be included.
13 MacDonald, 2010; ARUP, 2011.14 Cooper 2010, 2012a 15 See Appendix A.

13
Capturing the Value of Off shore Wind Section I
The costs of building new nuclear reactors in market economies are completely unknown at present. History shows that because of the complexity of the technology, the constant challenge of nuclear safety and the changes in design from one generation to the next, the cost reducing processes found in most industries – learning-by-doing and economies of scale – do not apply to nuclear power (see Figure I-5). Unlike the other low-carbon generation technologies, there is insuffi cient evidence to use the assumption that nuclear costs will decline over time.
Figure I-5 shows my analysis of the history of nuclear construction costs in the U.S. and more recent projections. It can be seen that the Mott MacDonald estimates are inconsistent with the available evidence. In addition, the huge unit size and long lead times of nuclear power makes it very expensive in terms of lost real options. The risks and history of nuclear construction are such that fi nancing new reactors in capital markets requires large risk premia. These factors make it a very unattractive investment. The cost estimates prepared for DECC do not appropriately refl ect these key factors.
In Figure I-5 and Figure I-3, above, and Figure I-7 below I have included the Mott MacDonald estimate of the costs of nuclear power and my own, based on the following assumptions derived from my earlier work. Compared to Mott MacDonald, the capital cost (amount of investment) would be at least 50% higher (well over £4000/kW). The cost of capital (ROI) would be at least 50% higher (15%). Figure II-3 contrasts my recent estimate of the overnight cost of nuclear to the recent announcement by EDF for construction cost in the UK and the estimates in the most recent DECC analysis. The real option cost of nuclear, which is not included in the above estimate, would be more than twice as high as that of coal. For these reasons, nuclear would not enter any rational portfolio and is not included in the detailed analysis in the next section.
Figure I-5: Overnight Cost of Nuclear Reactors (2011£/kW)
£9,000
£6,000
£8,000
$0
£1,000
£2,000
£3,000
£4,000
£5,000
£7,000
1970 1975 1980 1985 1990 1995 2000 2005 2010 2015 2020
ActualUtility EstimatesAnalyst EstimatesMacDonald, 2010Cooper, 2012EDF, 2012
Source: Cooper, 2009, 2012.

14
Capturing the Value of Off shore WindSection I
C. The Key Drivers of Cost and Ambiguity in the Mid-TermUnderlying the point estimates and ranges in Figure I-3, above, is a great deal of variation around three key factors that are highlighted in Figure I-6. The Figure shows graphically the result of applying the traditional approach to the comparison between CCGT gas w/CCS and off shore wind. It highlights the complexity of decision making in the current environment. I use the cost with CCS to match the compliance status of the options.
The graph below shows that, depending on which assumptions come to pass, either of the resources could be lower in cost by 2017. That is, in the 2017 time frame, the range of outcomes for gas overlaps with the range of outcomes for off shore wind. Although there is overlap, the off shore wind costs are towards the upper bound. It is important to note that by 2023, in the Mott MacDonald analysis a great deal of learning and cost reduction are assumed. Therefore, by 2023 the range of estimates is quite narrow, except for the hi-lo estimate of gas costs that is quite wide. The base case estimate for off shore wind ranges from about £70/MWh to about £130/MWh. The high-lo case estimates range from just under £70/MWh to over £140/ MWh. With learning off shore wind is centred in the range.
Figure I-6: MacDonald Levelised Cost Estimates Off shore Wind and Gas w/CCS Across TimeOverlapping Range of Estimates in the Mid Term
£200
£0
£20
£40
£60
£80
£100
£120
£140
£160
£180
2009 2011 2013 2015 2017 2019 2021 2023
O�shore – R2O�shore – R3
Base GasLow GasHigh Gas
Levelised/MWh

15
Capturing the Value of Off shore Wind Section I
Key Drivers of Cost Across Time – Off shore Wind R-3 v. CCT Gas w/CCS
£200
£0
£20
£40
£60
£80
£100
£120
£140
£160
£180
2009 2011 2013 2015 2017 2019 2021 2023
O�shore – R2O�shore – R3
Base GasLow GasHigh Gas
Levelised/MWh
@ 10%, w/o Learning
@ 10%, w/Learning
@ 7.5%, w/o Learning
@ 7.5%, w/Learning
@ 10%, w/o Learning
@ 10%, w/Learning
Value of ReducedCapital Risk
Value of Learning
Long-TermGas Price Risk
Source: Adapted from Mott MacDonald 2010
The graph above sheds considerable light on the factors that aff ect the price projections. The value of learning is estimated as the diff erence between the cost estimated for a First of a Kind (FOAK) project and a later project, described as the Nth of a Kind (NOAK). Reduction in the cost of capital is refl ected in the diff erence in the discount rate. For ease of presentation, the Figure includes R3 off shore wind only. R2 shows similar eff ects of learning and the cost of capital at much lower levels of cost. It would clearly be the preferred choice, if the resource were unconstrained. For gas, the cost of capital and learning are not very important, but the future price of fuel is. For wind, the cost of capital and learning are of great importance. The learning lowers the cost estimate by as much as £50/MWh. Reducing risk (i.e. the discount rate) lowers the cost as much as £20/MWh.
If the decision maker does not have a basis to favour one set of assumptions over another, the prudence of several of the earlier observations is self-evident. Diversifying the portfolio would be appropriate if one wants to lower the risk of ending up with high prices. Buying time would be appropriate, if more information is likely to become available and resolve ambiguities about learning, interest rates or the direction of gas prices. This is common knowledge, but there is a qualitative point to be made that fl ows from the framework on decision making under conditions of ambiguity. To the extent that decision makers have the option, they want to tie their fate to factors over which they have greater control.
The price of gas is something they cannot aff ect very much. In the medium to long term, the range of fuel costs is very wide. It exposes consumers to a great deal of risk. In the 2017 time frame, the uncertainty around gas prices equals the risk around learning. By 2023, the risk around gas prices is much wider.
The discount rate is an analytic construct used to evaluate options. Policy makers can aff ect it directly by making choices about how to promote various options (although ultimately, unless direct subsidies are involved, the capital markets will decide). Learning is something policy makers can aff ect (with policy) and monitor. The cost of off shore wind should be more accessible to the infl uence of policy interventions.

16
Capturing the Value of Off shore WindSection I
The analysis of trends in capital costs of various technologies based on the MacDonald data, is corroborated by a recent analysis of the Cost of Central Station Generation prepared by the California Energy Commission (CEC) (see Figure I-7). I have overlaid the projections for the 2030 scenario for the overnight capital costs of off shore wind from MacDonald 2011 and ARUP 2011. All three sources exhibit a strong downward trend and by 2030, their projected costs are within about 10 percent of each other. Several other trends in the CEC data are also relevant to the above discussion. Nuclear is seen as becoming extremely expensive, which supports my earlier observation. Solar power costs are projected to decline even more sharply than off shore wind. Onshore wind shows a modest cost decline. The natural gas technologies do not exhibit any cost decline, which is consistent with the earlier analysis, although these estimates are for gas generation without carbon capture and storage.
In addition to giving us confi dence about the cost projections, the agreement on cost trends provides a key learning point. The cost of power generated by any specifi c resource will refl ect both the cost of deploying the technology and the quality of the resource. The quality of the resource can vary widely from place to place, but the cost of the technology tends to vary less for a given type of environment (e.g. deep off shore). This analysis points toward the major longer term analysis presented by MacDonald in the 2011 study for the Committee on Climate Change.
Figure I-7: CEC Overnight Cost Trends Compared to Arup, 2011; MacDonald 2011
8000
7000
6000
5000
4000
3000
2000
1000
$02008
Instant Cost (Real 2009$/kW)
2010 2012 2014 2016 2018 2020 2022 2024 2026 2028
Small Simple Cycle
Conventional Simple Cycle
Advanced Simple Cycle
Solar – Photovoltaic (Single Axis)
Solar – Parabolic Trough
Conventional Combined Cycle (CC)
Conventional CC – Duct Fired
Advanced Combined Cycle
Coal – IGCC
Nuclear Westinghouse AP1000 (2018)
Biomass IGCC
Biomass Combustion – Fluidized Bed Boiler
Biomass Combustion – Stoker Boiler
Geothermal – Binary
Geothermal – Flash
Hydro – Small Scale & Developed Sites
Hydro – Capacity Upgrade of Existing Site
Ocean Wave (In Service 2018)
Onshore Wind – Class 3/4
Onshore Wind – Class 5
Offshore Wind – Class 5 (In Service 2018)
Arup, 2011, R-3 X
MacDonald, 2011, Offshore
MacDonald, 2011, Offshore
CEC Nuclear
ARUP, 2011, R-3 X
CEC Offshore
CEC Onshore Wind
Source: California Energy Commission, Cost of Central Station Generation, January 2010; ARUP, 2011, MacDonald, 2011
Note: The author does not have the underlying data to convert $ to £, so the UK estimates are converted to $

17
Capturing the Value of Off shore Wind Section I
Figure I-1 highlights the shift of the range of off shore wind costs between the mid- and long-terms and its increase in attractiveness compared to low-carbon fossil fuels. By 2040, wind is the most attractive of the main resources and off shore wind dominates the others in terms of price. Indeed, looking over the broader range of technologies included in Figure I-1, if we focus on the range set by the off shore wind projection, we fi nd that it could well be considered to be the resource of choice against which other resources are measured. It is true that we fi nd a number that are as, or more attractive, but with the exception of onshore wind, these are considered minor technologies, limited either by a lack of available resource or the very nascent status of the technology.
The traditional analysis provides a range of estimates across a number of technologies and leads to the conclusion that there are a set of competitive alternatives that could be available in the mid and long term to decarbonise the electricity sector. If policy helps to bring long-term costs into the range identifi ed as possible, decarbonised electricity will be aff ordable. However, substantial ambiguity still exists in these with fairly wide ranges of overlapping estimates. The challenge of building a portfolio that reduces the risk, uncertainty and vagueness remains.
Figure I-1: Decision Space in the Traditional Approach: Mott MacDonald Base Case Levelised Mid- and Long-Term Cost of Low Carbon Generation Technologies
300
0
50
100
150
200
250
Onsh
ore
Win
d (S
)On
shor
e W
ind
(L)
O�s
hore
Win
dW
ave
Fixe
dW
ave
Floa
ting
Tida
l Str
eam
Tida
l Bar
rage
Hydr
o RO
RSo
lar P
V Cr
ysta
lline
– R
oof
Sola
r PV
Crys
talli
ne –
Gro
und
Sola
r PV
Thin
Film
– R
oof
Sola
r PV
Thin
Film
– G
roun
dGe
othe
rmal
Nucl
ear P
WR
Nucl
ear B
WR
ASC
Coal
– R
etro
Oxy
-CCS
ASC
Coal
– R
etro
PC-
CCS
ASC
Coal
– O
xy-C
CSAS
C Co
al –
PC-
CCS
IGCC
Pre
com
b CC
SCC
GT P
reco
mb
CCS
CCGY
Pos
tC C
CSAd
vnac
ed A
D Se
wag
e Sl
udge
Food
Was
re A
DM
anur
e Sl
urry
AD
Ener
gy C
rops
AD
Woo
d –
Grat
eW
ood
– Ga
sific
atio
nM
SW-S
RF P
yrol
ysis
Woo
d –
BFBC
Woo
d –
CFBC
Was
te W
ood
– Gr
ate
2020£/MWh
Onsh
ore
Win
d (S
)On
shor
e W
ind
(L)
O�s
hore
Win
dW
ave
Fixe
dW
ave
Floa
ting
Tida
l Str
eam
Tida
l Bar
rage
Hydr
o RO
RSo
lar P
V Cr
ysta
lline
– R
oof
Sola
r PV
Crys
talli
ne –
Gro
und
Sola
r PV
Thin
Film
– R
oof
Sola
r PV
Thin
Film
– G
roun
dGe
othe
rmal
Nucl
ear P
WR
Nucl
ear B
WR
ASC
Coal
– R
etro
Oxy
-CCS
ASC
Coal
– R
etro
PC-
CCS
ASC
Coal
– O
xy-C
CSAS
C Co
al –
PC-
CCS
IGCC
Pre
com
b CC
SCC
GT P
reco
mb
CCS
CCGY
Pos
tC C
CSAd
vnac
ed A
D Se
wag
e Sl
udge
Food
Was
re A
DM
anur
e Sl
urry
AD
Ener
gy C
rops
AD
Woo
d –
Grat
eW
ood
– Ga
sific
atio
nM
SW-S
RF P
yrol
ysis
Woo
d –
BFBC
Woo
d –
CFBC
Was
te W
ood
– Gr
ate
2040
O�shore WindCoalGas
Source: Mott MacDonald, Cost of Low-Carbon Generation Technologies (Committee on Climate Change, May 2011), Figure 7.4

18
Capturing the Value of Offshore WindSection I

19
Capturing the Value of Offshore Wind Section II
II. Decision making in complex environments where knowledge is limited: a conceptual and empirical frameworkThis section describes the conceptual and empirical approach to multi-criteria portfolio analysis. It begins with a brief discussion of the three major approaches to decision making in complex environments where knowledge is limited. Table II-1 summarises three bodies of work that have attempted to analyse the terrain of knowledge and identify tools and approaches to improve decision making under these difficult circumstances. Appendix A presents a discussion of the intellectual origin and grounding of this framework. Here I emphasise the practical applications in capacity and technology decision making in the electricity sector.
A. The Terrain of KnowledgeHow does one make effective decisions in a space where the impacts of significant events or use of important resources are unclear (outcomes unknown) and the occurrence of those events or the availability and price of those resources are unpredictable (the probabilities are unknown)? Analysts across a number of disciplines have developed frameworks for facilitating decision making under conditions where the terrain of knowledge is complex and ambiguous, starting from the premise that there are two primary sources of ambiguity. Lacking knowledge about the nature of outcomes and/or the probabilities of outcomes decision makers may encounter different problems in four regions of knowledge, risk, uncertainty, vagueness and the unknown.16 The decision making space is most challenging where knowledge is lacking, but each region of knowledge presents a distinct challenge to the decision maker.
Risk: In some circumstances the decision maker can clearly describe the outcomes and attach probabilities to them. Risk analysis allows the decision maker to hedge by creating a portfolio that balances more and less risky assets, particularly ones whose variations are uncorrelated. This risk analysis has its origin in the financial sector and was first articulated over half a century ago.17 The statistical methods that lie beneath risk-based probability analysis have been the primary targets of criticism in Black Swan Theory and Technology Risk Analysis because the underlying distribution of outcomes is frequently unpredictable.
Uncertainty: In some circumstances the decision maker can clearly describe the outcomes but cannot attach probabilities to them. Here the decision maker would like to keep options open by not deciding, if that is beneficial. If the decision maker cannot wait, then the path chosen should be flexible, so that it affords the opportunity to deal with whatever outcomes occur. Real option analysis also emerged from the financial sector – a little over a quarter of a century ago.18
Vagueness: In yet another circumstance, decision makers may not be able to clearly identify the outcomes, but they know that the system will fluctuate. It would appear that the complexity of outcomes deserves at
16 Dictionary definitions of the three key concepts suggest the differences, but overlap. Risk: The possibility of suffering harm or loss; Uncertain: Not having sure knowledge: Vague: Lacking definite shape, form, or character; indistinct; Ambiguous: Open to more than one interpretation
17 Grubb, Chapuis and Duong, 1995; Awerbuch and Berger, 2003; Awerbuch, 2004, McLoghlin and Bazilian, 2006; Moller, et al., 2011; Delarue, et al., 2011,
18 Chatterjee, and Ramseh, 1999; Hiouska, et al., 2002; Murto, and Nese, 2002; Siclari and Castellacci, N.D; Blyth, et al., 2007; Abdelhamid, Aloui and Chaton, 2009.

20
Capturing the Value of Off shore WindSection II
least as much attention as risk and uncertainty. Outcomes in the real world are complex and unknown. In this analysis, a useful lesson is that one should avoid areas of vagueness. Here the decision maker wants to take an approach that can monitor the condition of the system and adapt as it changes. An approach to this situation of vagueness called “fuzzy logic” emerged from the computer science and engineering fi elds at about the same time as real option analysis.19
Table II-1: Ambiguity in the Increasingly Complex Terrain of Knowledge
ClearUnclear
Predictable
Knowledge ofLikelihood of Outcomes
Knowledge ofNature of Outcomes
Unpredictable
Vagueness Risk
Unknowns Uncertainty
Unknowns Vagueness Uncertainty Risk
Topographic Features
Technology Risk Assessment
Challenges
Outcomes
Probabilities
Unanticipated eff ects
Unclear
Unpredictable
Contested framing
Unclear
Predictable
Nonlinear systems
Clear
Unpredictable
Familiar systems
Clear
Predictable
Black Swan Theory
Challenges
Conditions
Distributions
Payoff s
Black Swans
Wild randomness
Extremely fragile
Fat tailed
Complex
Sort of Safe
Quite robust
Thin tailed
Complex
Safe
Quite robust
Fat tailed
Simple
Extremely safe
Mild randomness
Extremely robust
Thin tailed
Simple
Project and Risk Mitigation Management
Challenges
Conditions
Chaos
Unknown/unknowns
Unforeseen uncertainty
Unknown/knowns
Foreseen uncertainty
Known/unknowns
Variation
Known/knowns
19 The original ideas were presented in a series of papers by Zadeh (1965, 1968) in the 1960s. The fi rst logic controller was built at the University of London in 1973. Dery, 2002; Bates and Young, 2008; Goyal and Zang, 2008; and Salmeron, 2009, suggest the application to human decision making.

21
Capturing the Value of Offshore Wind Section II
Unknowns Vagueness Uncertainty Risk
Navigation Devices
Framework
Analysis
Focus
Multi-criteria analysis
Diversity assessment
Internal resources & structure
Fuzzy logic
Sensitivity analysis
Internal resources & structure
Decision heuristics
Scenario analysis
External challenges
Statistics
Portfolio evaluation
External challenges
Data & Measurement
Swan Search
Consistency
Unintended impacts
Externalities
Sufficiency
Diversity
Structural Alternative Instrmts.
Vagueness
Capital Requirements cost, return
Supply security physical, economic
Environmental impact
Air, Land, water, climate
Uncertainty
Capacity
Construction period
Sunk cost
(Total capital = MW * $/MW)
Cost -Risk
Levelised cost
Cost variability
Fuel
O&M
Carbon
Policy Instruments
Processes
Instruments
Advice/Rules
Learning
Insurance/diversity
Adapting
Monitor & Adjust
Planning
Optionality
Controlling
Hedging
Technology Risk Assessment
Precaution
Buy insurance for system survival
Accept non-optimisation
Diversity
Variety
Balance
Disparity
Black Swan Theory
Truncate Exposure
Buy insurance for system survival
Accept non-optimisation
Redundancy
Numerical
Functional
Adaptive
Technology Risk Assessment
Resilience
Adaptability
Black Swan Theory
Multi- functionality
What Works
Technology Risk Assessment
Flexibility Across Time Across Space
Black Swan Theory
Optionality
Technology Risk Assessment
Resilience
Robustness
Hedge
Black Swan Theory
Robust to Error
Small, Confined, Early Mistakes
Incentive & disincentives
Avoid Moral Hazard
Hedge
Sources: Nassim Nicholas Taleb, The Black Swan (New York: Random House, 2010), Postscript; Andrew Stirling, On Science and Precaution in the Management of Technological Risk (European Science and Technology Observatory, May 1999), p. 17, On the Economics and Analysis of Diversity (Science Policy Research Unit, University
of Sussex, 2000), Chapter 2; “Risk, Precaution and Science; Toward a More Constructive Policy Debate,” EMBO Reports, 8:4, 2007; David A. Maluf, Yuri O. Gawdisk and David G. Bell, On Space Exploration and Human Error: A Paper on Reliability and Safety, N.D.; Gele B. Alleman, Five Easy Pieces of Risk Management, May 8, 2008; see also, Arnoud De Meyer, Christopher H. Lock and Michel t Pich, “Managing Project Uncertainty: From Variation to Chaos,” MIT Sloan Management Review, Winter 2002.
Unknowns: In the most challenging situation, knowledge of the nature of the outcomes and the probabilities is limited.20 Even in this state of ignorance, decision makers have strategies to cope and policies that can insulate the system. Here the analyst looks more inward, to the characteristics of the system to identify those that are most important. The decision maker seeks to build systems that ensure the critical internal functions are performed adequately to maintain system viability under the most trying of circumstances. This framework
20 Stirling, 1994; Stirling, 2000; Stirling, 2007; Stirling, Andrew, 2007a; Grubb, Butler and Twomey, 2006; Yoshizawa, Stirling and Suzuki, 2009; Stirling 2010,

22
Capturing the Value of Offshore WindSection II
has been developing for about two decades in technology risk assessment and the energy sector. Multi-criteria evaluations of outcomes lead to strategies that buy insurance and diversify assets are recommended – summarised in the expression, “put lots of eggs in lots of baskets.”
Table II-1 identifies three aspects of the regions of knowledge – the topographic features, navigational devices and policy tools. The multi-criteria approach identifies the key unknowns that confront policy makers in the complex terrain of electricity generation technology/capacity decisions and provides analytical tools and decision making principles that improve the ability to navigate in an increasingly complex and ambiguous decision space.
The topographic features of the terrain of knowledge show the primary challenge created by the conditions in the region. Each of the approaches describes the terrain slightly differently, but the underlying concepts are similar. The challenges arise from the lack of knowledge about outcomes or their probabilities, or both.
Under the navigational devices I include the analytic approaches, methods and focal points as well as the data that are used in the analysis. The traditional resource acquisition approach produces an ocean of estimates based on multiple scenarios and sensitivity analyses with little insight into how to navigate between the available options. The multi-criteria analysis recognises the usefulness of this data, which become the key inputs into the broader decision making framework.
The payoff of the analysis is to identify policy instruments that improve decision making. The policy tools and rules are grouped according to the regions for which they are best suited, but they should be viewed as a mutually reinforcing global set of principles. The integrated approach allows the decision maker to array the options under consideration in a multi-attribute space.21
The policy principles that can be extracted from these approaches include the following observations:
• Identify the trade-offs between cost and risk and hedge to lower risk. • Reduce exposure to uncertainty by buying time. • Keep options open by acquiring small assets that can be added quickly. • Fail small and early (if at all).• Minimise surprises by avoiding assets that have unknown or uncontrollable effects. • Create systems that monitor conditions and can adapt to change to maintain system performance. • Buy insurance where possible.• Recognise that diversity is the best insurance against the unknown. • Build resilience with diversified assets by increasing variety, balance and heterogeneity in the resource mix.
21 Cooper, 2011, shows two different ways of characterising the regions from Greek Mythology and Catholicism that are deeply embedded in western culture, which suggest that the problem of drawing a knowledge map has a long history.

23
Capturing the Value of Offshore Wind Section II
To apply this advice, we need more precise tools to analyse the terrain of the regions of knowledge in the electricity sector. The remainder of this section describes specific empirical approaches to improve decision making in each of the regions of knowledge.
B. Empirical Measures for Describing Resources1. Risk: Portfolio Development with HedgingFollowing Awerbuch, my framing of the empirical approach to developing navigation tools is based on financial market theory, which provides a framework for evaluating the trade-off between performance and risk. The top graph in Figure II-1 presents the basic approach, as a publication from the National Regulatory Research Institute attempted to introduce it to regulators.22 Investors want to be on the efficient frontier, where risk and reward are balanced. They can improve their expected returns if they can increase their reward without increasing their risk, or they can lower their risk without reducing their reward. In the financial literature, risk is measured by the standard deviation of the reward.
In applying this framework to the evaluation of generation options, analysts frequently measure reward as kilowatts per dollar (a measure of economic efficiency). This is the inverse of cost. Indeed, they use efficiency and cost interchangeably.23 The lower graph in Figure II-1 shows the cost/risk frontier. Options that would move the portfolio toward the efficient frontier should be adopted since they embody lower cost and/or risk.24
Much of the literature on portfolio and real option management as applied to the electricity sector focuses on identifying the optimal long- term mix of resources. Because so many factors are so variable over the long term, these analyses become a complex array of assumptions and alternative scenarios that then must hypothesize constraints or state preferences in order to sort out the wide range of possible outcomes. The results are complex and even though the patterns are instructive, the cost in terms of complexity and transparency is significant.
An alternative approach that can be found in the literature is to use these tools to deal with more incremental decisions, as in Figure II-2. The map of the terrain of decision making indicates which alternatives are preferable today, on an individual basis. In other words, rather than worry about the optimal end point, we can focus on the relative position of the individual technologies in the decision space and ask whether including the asset in the portfolio would be moving in the right direction. This approach was offered in direct response to a desire for more incremental and transparent applications of the theory. As shown in the Figure II-2, movement toward the origin is considered positive. Movement along the risk-cost frontier is neutral. Movement away from the origin is less desirable.
22 Costello, 2005.23 Jansen Beurskens, and Tiburg, 2006, p. 13 argue for a risk-cost frontier.24 Jansen Beurskens, and Tiburg, 2006, Appendix, p. 59, “”the question of whether a tool could be develop for gauging the
impact of incremental technology deployment… the use of a (sort of) Sharpe ratio, showing the tangent of the direction a certain portfolio at (or to the right of) the efficient frontier would move into by incremental use of a certain technology.”

24
Capturing the Value of Off shore WindSection II
Figure II-1: Risk/Cost Reward, Cost/Risk Analysis
Reward
Risk
Current Portfolio
E�cient Frontier
Lower RiskSame Reward
Same RiskHigher Reward
Cost
Risk
Current Portfolio
E�cient Frontier
Same Risk Lower Cost
Same CostLess Risk
Source: Ken Costello, Making the Most of Alternative Generation Technologies: A Perspective on Fuel Diversity, (NRRI, March (2005), p.12, upper graph
Figure II-2: One-Step Approach to Evaluating Cost Risk Trade-off s
Portfolio Cost
Risk
E�cient Frontier
Higher CostLower Risk
Higher CostHigher Risk
Lower CostLower Risk
Lower CostHigher Risk
Source: Jansen, J.C., L.W. M. Beurskens, and X, van Tilburg, Application of Portfolio analysis to the Dutch Generating Mix, ECN, February, 2006

25
Capturing the Value of Offshore Wind Section II
In the empirical analysis below, I use the array of resources in this space to map two key features of the terrain of decision making. First, I identify a cost-risk frontier defined by gas. Natural gas is the fuel of choice at present but, based on recent history and contemporary debates, it may expose consumers to a great deal of risk. The cost-risk trade-off may be substantial. Resources that involve much less risk are more attractive, particularly if they do not involve significantly higher costs. I calculate the risk free price of gas to define the efficient frontier as the highest cost for power generated with natural gas under the scenarios and sensitivity cases being studied.25
Second, I use the array of resources to calculate a measure of attractiveness. The distance of a resource from the origin measures the risk-cost characteristics of the resource (giving risk and cost equal weight). Resources that are farther from the origin (measured as the Euclidean distance with each factor weighted equally) are less attractive.
This approach to asset portfolio assessment is the basic approach used throughout the analysis. To incorporate uncertainty and vagueness, I develop estimates that adjust the value of each asset along these two dimensions
2. Uncertainty: Real Option AnalysisReal option analysis asks whether the expected outcome can be improved by waiting for more information.
Unlike traditional discounted cash-flow analysis, real option theory explicitly accounts for flexibility in the manner in which an asset is developed and operated, often leading to higher asset values, as well as different optimal capacity planning and operation decisions. For example, accounting for different plant construction lead times in the face of demand uncertainty can lead to significantly different optimal capacity planning strategies.26
A discussion of the real option approach to assessing the impact of the uncertainty surrounding climate change policy provides a more technical summary of this issue in terms of Figure II-3.
[T]he company has the opportunity to wait … before making the investment. This allows it to avoid the potential loss that might occur if conditions turn out worse than expected…. Waiting could lead to a greater return on investment—the new expected gross margin from the project would be higher than the original expected gross margin without the option of waiting—but revenues from the project would only accrue… if the project does go ahead. It would be rational to invest [sooner] only if this value of waiting is overcome by the opportunity cost of waiting (i.e. the income forgone due to delaying the investment). In order to trigger immediate investment, the expected gross margin of the project would need to exceed some threshold level which makes the opportunity cost of waiting greater than the value of waiting. This threshold depends on the length of time before [the investment must be made] the size of the anticipated price shock and the discount rate. These thresholds are calculated using a cash-flow model in which climate change policy is represented using carbon price as a proxy.27
25 Following Awerbuch and Berger, 2003.26 Gardner and Zhuang, 2000, p. 9.27 Blyth, et al., 2007, 5268.

26
Capturing the Value of Off shore WindSection II
Figure II-3: Uncertainty
The opportunity of waiting must be compared to the expected value of making decisions with more information.
Cash Flow ($)
timeNowt=0
t=TP
Adjusting Cost Estimates for Uncertainty.
Levelised Cost
Risk = St. Dev. of Cost
Opportunity cost of waiting
Faster, smaller options have fewer opportunity costs
Capital cost
Avoided loss
Upper estimate of gross margin
New expected (mean) gross marginOriginal expected gross margin
Lower estimate of gross margin
Source: Blyth, William, et al., 2007, Investment Risk under Uncertain Climate Change Policy, Energy Policy, 35, p. 5268
The analysis of uncertainty can be approached from the principles of real option analysis. Real option calculations would be specifi c to projects, but general insight into the issue of uncertainty can be gained by focusing on key factors that expose consumers and utilities to the ravages of uncertainty. In conditions of uncertainty, the greater the ability to wait or change, the better. Several key characteristics of technology options aff ect the ability to wait or change – the construction period, the size of the facility and the capital costs that must be sunk into the project. In this analysis I integrate the uncertainty analysis into the Cost-Risk analysis by developing separate estimates of the cost of resources that refl ect the time value of being able to wait to make decisions. The approach is based on the observation that resources that involve large investment and require long lead times force decisions to be made earlier and place larger sunk costs at risk.
3. Vagueness: Learning, the Cost of Capital, Environmental Impacts and Security of SupplySeveral outcomes that fall in the area of vagueness in the utility sector are readily identifi able in the literature. I derive the approach to measuring vagueness by extending the logic of risk measurement to capital costs. Risk is generally used to refer to fuel price risk. In the short and mid-term capital costs are fi xed (rate-based). In the regulated context, fuel price adjustment clauses shift all the fuel price risk for fossil fuels onto the ratepayer. In the market context, the market clearing price is often set by the variable cost of gas-fi red generation, which means price risk is also eff ectively transferred to consumers. From the consumer/societal perspective fuel price volatility should be taken into account. Portfolio theory was off ered as the analytic approach to do so.

27
Capturing the Value of Offshore Wind Section II
Moving to the longer term, there are other sources of vagueness that come into play. Capital costs are not known or fixed. With new technologies that have not been deployed, important processes, like learning-by-doing and economies of scale, can lower capital costs significantly. In this way, the range of capital costs represents vagueness in the estimation of costs. Instead of calculating the variance of operating costs, we can calculate the variance of total cost, including the range of capital costs. In the current analysis, with the wide range of capital costs, there is a clear policy implication. Learning and economies of scale can lower the necessary investment.
The vagueness surrounding capital costs for new low carbon technologies affects both the amount of capital, and affects the cost of capital. Several of the analyses of technology costs recognise this, using different costs of capital for different technologies and assuming that the cost of capital declines over time as technologies mature.
Other areas of vagueness exist. The most common area of vagueness in electricity resource acquisition involves environmental impacts. There are fundamental debates over, and evolving policy to address, a range of environmental issues (climate change, hydraulic fracking, nuclear waste handling); major black swans like accidents (nuclear melt downs, coal waste releases, mine explosions) and surprise findings (biomass emissions, methane leaks from pipelines). Given the extreme vagueness of environmental impacts, there are many, varied and complex approaches to evaluating options. At root, they all embody judgments about the various aspects of the impact. The decision to decarbonise the electricity sector removes this as an area of dispute, although there is still a question about the value of carbon. In theory this is reflected in the risk analysis above in the form of high and low carbon prices. There are other environmental costs associated with coal, but these do not appear to have been included in any of the cost of generation studies.
A second area of vagueness stems from the prospects for long term supply. The peak oil controversy, shifts in projections of the natural gas resource base and debates about the quality of coal and uranium deposits, are examples of this area of vagueness. These concerns are often combined with concerns about the scope of the market in which fuels are acquired. Both concerns tap into the overall concern with security of supply. These issues fundamentally depend on the reliability and inability to control long-term supply. In theory, these should be included in the fuel price scenarios.

28
Capturing the Value of Offshore WindSection II
4. The Region of Unknowns: Surprises and SwansDecision makers should examine the preferred alternatives identified in the of the regions of knowledge for evidence that surprises, black or white swans, could be lurking beyond the area where the analysis has shed light by identifying additional potential costs and benefits that flow from sources of risk, uncertainty or vagueness that have not been included in the previous analysis. In the words of Black Swan theory, this “robustifies” the confidence in the path chosen. While the primary concern is black swans, decision makers should not miss the opportunity to exploit the benefits of white swans. Consistency: One obvious type of black swan to look for is inconsistencies in recommendations from the other three regions. These would indicate an important area for analysis in the unknown region. Unintended consequences: Similar to inconsistencies, but broader, are unintended consequences. For example, increasing the reliance on variable renewables can create grid management challenges where the grid was built to handle “traditional” fossil-fired generation. At current relatively low levels of variable renewables penetration, however, this is not a major problem, but as their use rises a new innovative approaches to grid and demand management will be appropriate. Externalities: Finally, other Black Swans are positive and negative externalities. For example, for gas, fracking and other environmental concerns arise. Renewables and efficiency that displace gas can have large, positive consumption externalities. Efficiency raises rebound effects, where consumers spend some of their savings on bills to purchase more electricity.
Given the primary goal of ensuring an adequate supply, the sufficiency of the resources that are identified as preferable to meet the need for electricity should be considered as an independent question. The uncertainty/real option component of the overall approach is intended to address this issue, but it deserves special attention. Adequacy: The objective of achieving a robust resource mix points toward diversity of resources as a primary goal, but diversity should not come at the expense of sufficiency. Insufficiency is the most important black swan to consider. A properly defined concept of diversity takes this into account. Thus, insufficiency is a constraint on diversity. Sequence: When analysing sufficiency, time is of the essence. Long term predictions are extremely ambiguous. Flexibility requires that options are kept open as long as possible. The decision making time frame should be only as long as the longest lead time of the options being considered. If there are preferable options with shorter lead times, then they should be chosen, since there will be adequate time to bring the inferior option online later, if or when the preferable options are exhausted. Sufficiency analysis also should recognise constraints on both the availability and management of resources.
C. Empirical Measures of Characteristics 1. Measuring the UK Cost-Risk Generation Resource Trade-off Figure II-4 demonstrates the basic cost-risk portfolio concept using the cost number from the MacDonald 2010 estimate of costs for three of the major low carbon technologies considered, gas with CCS, IGCC w/CCS and offshore wind R2 and R3, as well as unabated gas and unabated coal. Risk is measured as the standard deviation of variable costs (fuel + carbon + operating costs). Since the analysis focuses on incremental decisions, I also model the impact of adding increments to the resource mix that are half fossil fuels w/CCS and half wind (R2 and R3 separately). The incremental assets added would be one-quarter each of low-carbon gas, coal, offshore wind R2 and offshore wind R3.

29
Capturing the Value of Off shore Wind Section II
Figure II-4: The Basic Cost-Risk Framework: Adding Off shore Wind to the Portfolio Reduces Risk and Lowers Expected Costs
260
Levelised/MWh
Risk = St. Dev. Fuel+Carbon Cost + Op. Cost
100
120
140
160
180
200
220
240
£0 £10 £20 £30 £40 £50 £60 £70 £80
Unabated IGCCUnabated GasGas w/CCS
O�shore – R3O�shore - R2IGCC w/CCS
1/4 Each Gas & IGCC/CCS, R2, R3
Source: Calculated by Author
There are three important insights in this initial analysis. First, the point made by Awerbuch long ago is clear. On a stand-alone basis wind and the portfolios that include wind are inside the effi cient frontier. Adding assets, like off shore wind, that have less operating cost variation that does not covary with the variable costs of other resources, lowers risk dramatically with little or no increase in expected cost. When risk, uncertainty and vagueness are taken into account in later analysis, acquiring a diverse incremental portfolio of assets that includes half off shore wind lowers both risk and expected cost. It is also noteworthy that all of the non-gas options and portfolios including off shore wind are inside the effi cient frontier, which supports the observation from the traditional analysis that the UK has a number of options available to meet the need for electricity in a low carbon environment. Second, I include the unabated cost for the two dominant fossil fuels to underscore the potential savings that the development of low-carbon technologies can achieve. The cost savings are potentially quite large. Finally, the fact that there are several options with similar costs but diff erent risk levels means that diversity can be achieved without increasing costs signifi cantly.
2. Valuing Real Options in the UK Generation Resource Choice Figure II-5 shows two measures of exposure to uncertainty that I use to operationalise the concepts of real option analysis. The data, which involves assumptions about the size, cost and construction period, is taken from Mott MacDonald, 2010. The top graph plots the size of the project against the construction period. Large projects not only take longer, but I have shown that they tend to crowd out smaller projects, so they take away real options.28 The bottom graph plots sunk costs (cost per MW times the number of MW) against the construction period. Failing to take the diff erence in exposure to uncertainty into account ignores the real option value of being able to wait to make decisions that sink costs. This can distort the terrain of decision making signifi cantly. Even if off shore wind projects increase in size signifi cantly, they would still be exposed to less uncertainty than the alternatives.
28 Cooper, Mark, 2010,

30
Capturing the Value of Off shore WindSection II
Figure II-5: Sunk Costs as an Indicator of Exposure to UncertaintyConstruction Period and Size
1800
0
200
400
600
800
1000
1200
1400
1600
0 0.5 1 1.5 2 2.5 3 3.5 4 4.5 5
Size in MW
Construction Period (years)
O�shore Wind
IGCC Base Gas
Coal
Capital Cost and Size, with Distance Measure of Exposure to Uncertainty
£4,500
£0
£500
£1,000
£1,500
£2,000
£2,500
£3,000
£3,500
£4,000
0 0.5 1 1.5 2 2.5 3 3.5 4 4.5 5
Sunk Cost
Construction Period (years)
O�shore Wind
IGCC
Base Gas
Coal
Source: Mott MacDonald, 2010
Figure II-6 presents an approach to valuing the loss of real options. The revenue requirement is taken from a Mott MacDonald depiction of the revenue requirement from a hypothetical generation project. I identify two critical impacts that shorter lead times and smaller sunk costs can have on how the project is assessed. If the

31
Capturing the Value of Off shore Wind Section II
construction decision can be delayed, interest is earned and the interest on interest compounds over the life of the project. This is an option that is foregone by making the investment in the project. It could be refl ected in a higher rate of return being required of the project. It has a small but not insignifi cant monetary value. I add this to the cost of the alternative with the longer construction period.
The second aspect of the value of real options has to do with the possibility that conditions will change unfavourably (e.g. the price of gas increases or the externalities of fracking are internalised). The project might have to be abandoned, or its economic value dramatically reduced.
Figure 11-6: Conceptual Measures of Real Option Value of Waiting in Building a Generation Portfolio: Base Case Wind v Gas Comparison
£2,500Discounted, Real
Year
£0
£500
£1,000
£1,500
£2,000
1 2 3 4 5 6 7 8 9 10 11 12 13 14 15 16 17 18 19 20 21 22 23 24 25 26 27 28
Cumulative revenue requirement
Possibility of Abandonment Added to Risk
Lost Use of MoneyAdded to Price
Value of Interest on InterestSunk Costs at Risk4 Decisions
£112Cost Adjusted for Time Value of Money
Risk Adjusted for Uncertainty of Abandonment
£100
£102
£106
£108
£110
£20 £22 £24 £26 £28 £30 £32 £34
£104
Values used in the analysis based on 2 year build for wind and 4 year build for Gas w/CCS and Coal w/CCS: Gas w/CCS IGCC w/CCSLevelised Cost 2.7% 5.4%Standard Deviation 13.0% 26.0%
By being forced to invest sooner because of the longer construction period, the investor runs the risk that things will change, the economics of the project will become less attractive than alternatives and the project will be abandoned. In a regulated utility world there would be a brouhaha over abandonment costs, with denials of recovery possible. In a less regulated market, the investor would have to take a write off or accept a reduced rate of return. This uncertainty can be treated as an increase in the variability of cost, from the societal point of view. I add this amount to the estimate of the variability of cost.29 As shown at the bottom of the Figure, this has a small impact on the expected cost of gas w/CCS but a large impact on the expected cost of coal w/CCS because of the larger sunk costs.
29 This is the obverse of “to go” analysis. With projects that require long construction periods (and escalating costs) utilities frequently calculate the costs that are still to be incurred to complete the project. These “to go” costs are then compared to the cost of starting an alternative from scratch, since sunk costs are not supposed to infl uence forward looking analysis. Here I calculate the “before you go costs,” in order to show to the decision maker the “cost” of giving up the real option of not sinking costs. This avoids the sinking of costs that might distort future decisions.
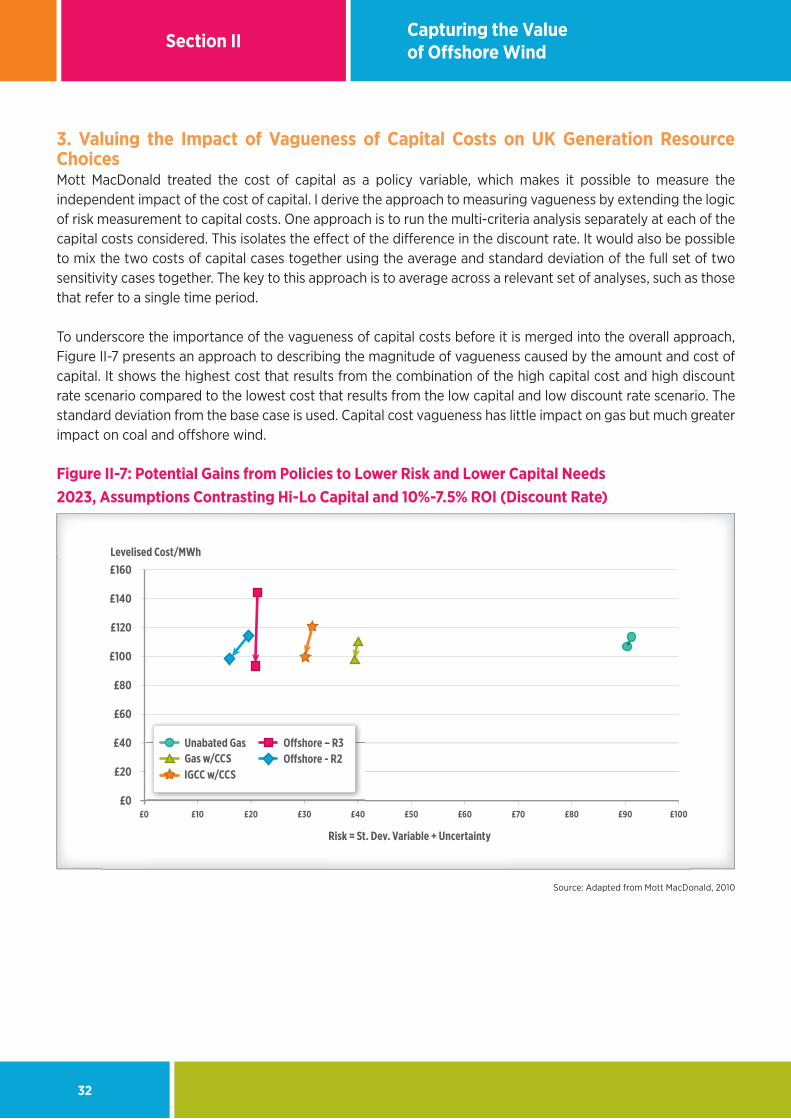
32
Capturing the Value of Off shore WindSection II
3. Valuing the Impact of Vagueness of Capital Costs on UK Generation Resource ChoicesMott MacDonald treated the cost of capital as a policy variable, which makes it possible to measure the independent impact of the cost of capital. I derive the approach to measuring vagueness by extending the logic of risk measurement to capital costs. One approach is to run the multi-criteria analysis separately at each of the capital costs considered. This isolates the eff ect of the diff erence in the discount rate. It would also be possible to mix the two costs of capital cases together using the average and standard deviation of the full set of two sensitivity cases together. The key to this approach is to average across a relevant set of analyses, such as those that refer to a single time period.
To underscore the importance of the vagueness of capital costs before it is merged into the overall approach, Figure II-7 presents an approach to describing the magnitude of vagueness caused by the amount and cost of capital. It shows the highest cost that results from the combination of the high capital cost and high discount rate scenario compared to the lowest cost that results from the low capital and low discount rate scenario. The standard deviation from the base case is used. Capital cost vagueness has little impact on gas but much greater impact on coal and off shore wind.
Figure II-7: Potential Gains from Policies to Lower Risk and Lower Capital Needs2023, Assumptions Contrasting Hi-Lo Capital and 10%-7.5% ROI (Discount Rate)
£160Levelised Cost/MWh
Risk = St. Dev. Variable + Uncertainty
£0
£20
£40
£60
£80
£100
£120
£140
£0 £10 £20 £30 £40 £50 £60 £70 £80 £90 £100
Unabated Gas O�shore – R3O�shore - R2
IGCC w/CCSGas w/CCS
Source: Adapted from Mott MacDonald, 2010

33
Capturing the Value of Offshore Wind Section III
III. The Multi-Criteria EvaluationThe cost projections used here are the updated estimates described in Section I. I have included the uncertainty adjustments for coal and gas and the vagueness adjustments for capital cost by calculating the standard deviation of total cost. For the purposes of integrating the vagueness concept into the general frame I present the results in two ways. This incorporates the capital cost vagueness directly into the estimation of the risk adjusted cost of electricity from each resource.
A. Optimisation AnalysisFigure III-1 presents the full multi-criteria analysis. The X-axis is labelled ambiguity to reflect the fact that the standard deviation of the cost estimated includes the operating cost risk (fuel, operating and carbon), uncertainty (the value of the risk of abandonment) and the vagueness (the range of capital cost estimates). The Y-axis is based on the levelised cost adjusted for the loss of use of funds that are sunk. The analysis includes the balanced portfolio that assumes that fossil fuel is split equally between gas and coal (both with CCS) and that offshore wind is equally split between R2 and R3.
When we fold the uncertainty and vagueness into the analysis the conclusions reached on the basis of the simple risk analysis and the earlier traditional analysis still hold. Unabated coal is the most costly approach, while unabated gas is the next most costly. The low carbon alternatives are tightly clustered in terms of cost, falling in the range of £100/MWh to £125/MWh. The range of ambiguity is as large as the range of levelised cost, from £20/MWh to £40/MWh. Offshore R2 wind is the most attractive option. Creating the balanced portfolio of equal parts decarbonised resource (coal, gas R2 offshore and R3 offshore) delivers a cost/risk performance that is well below the frontier. With a lower discount rate (cost of capital) the balanced portfolio is even more attractive.
Figure III-2 reinforces this conclusion by presenting a version of the “optimisation” analysis that was suggested by Awerbuch. It uses the 10% discount rate, which is the most challenging for offshore wind and the combined 10% and 7.5% sensitivity cases. The minimum expected price occurs in the range of 40% to 60% offshore wind. These are calculated using the distance measures discussed in Section II.
Since this is framed as an incremental decision analysis (i.e. 50% of the additions to resources) which build of over time, those percentages are readily manageable. Because the array of expected costs is quite flat bottomed, the strongest message is that the extremes, all fossil fuel or all offshore wind, should be avoided. Diversity is a better portfolio strategy. The results are less dramatic than the earlier Awerbuch analysis because the ambiguity measure used for the X-axis includes more variability in the wind cost (due to the long-term capital cost uncertainty).

34
Capturing the Value of Off shore WindSection III
Figure III-1: Multi-Criteria Array of Low Carbon Resource Options Discount Rate = 10%
£250
£200
£150
£100
£50
Levelised/MWh Adjusted
Ambiguity = Risk + Uncertainty + Vagueness
£0£0 £20 £40 £60 £80 £100 £120
Unabated IGCCUnabated GasGas w/CCS
O�shore – R3O�shore - R2IGCC w/CCS
1/4 Each Gas, Coal, R2, R3
Discount Rate = 7.5%
£140
£120
£100
£80
£60
£40
£20
Levelised/MWh Adjusted
Ambiguity = Risk + Uncertainty + Vagueness
£0
Unabated GasGas w/CCS
O�shore – R3O�shore - R2
IGCC w/CCS1/4 Each Gas, Coal, R2, R3
£0 £20 £40 £60 £80 £100 £120
Mixed Discount Rate = 10% & 7.5%
£200
£150
£100
£50
Levelised/MWh + Real Option
Ambiguity = Risk + Uncertainty + Vagueness
£0
Series 7
O�shore – R3O�shore - R2IGCC w/CCS
1/4 Each Gas, Coal, R2, R3
Unabated GasGas w/CCS
£0 £20 £40 £60 £80 £100 £120
Source: Calculated by Author

35
Capturing the Value of Off shore Wind Section III
Figure III-2: Expected Cost of Fossil Fuel – Off shore Wind PortfoliosDiscount Rate = 10%
£135
£130
£125
£120
£115
£110
£105
Levelised/MWh Adjusted
Ambiguity = Risk + Uncertainty + Vagueness
£100£0 £5 £10 £15 £20 £25 £30 £35 £40
Fossil E�cient Frontier100% O�shore
R2–R3
50% Fossil, 50% O�shore R2–R3
100% Fossil, 50-50 Gas & Coal w/CCS
Mixed Discount Rate = 10% & 7.5%
£135
£130
£125
£120
£115
£110
£105
Levelised/MWh Adjusted
Ambiguity = Risk + Uncertainty + Vagueness
£100£0 £5 £10 £15 £20 £25 £30 £35 £40
Fossil E�cient Frontier
100% O�shoreR2–R3
50% Fossil, 50% O�shore R2–R3
100% Fossil, 50-50 Gas & Coal w/CCS
Source: Calculated by Author
B. Potential Gains from Policies to Promote Low-Carbon Resources and a Balanced Portfolio Approach It is useful to have an appreciation of the rewards that eff ective policy can deliver. Table III-1 presents an approach that gives a sense of the potential gains by calculating the impact on the cost of resources that fl ow from each of the sources of ambiguity. The Table shows how much the cost can be reduced by moving the key variables to the full extent considered in the cost of generation studies. Recalling that in the long run the costs of the low carbon resources converged in a relatively narrow range, policies that reduce the cost of off shore wind have a large pay off in terms of reduction in the amount of ambiguity that remains.
Unabated fossil fuels are a high risk, high cost option. Policy makers must act to promote and ensure the development of low carbon resources. That action should focus on the sources of ambiguity that can be

36
Capturing the Value of Offshore WindSection III
addressed by public policy. The basic observation made a decade ago by Awerbuch that offshore wind is an attractive asset because it lowers expected costs by lowering risk without increasing cost holds in the future, if we can get there.
Table III-1: Potential Upside of Policies and Portfolios Promoting Offshore Wind (Magnitude of Difference Between Highest and Lowest Scenarios in £/MWh)
Resource/ Ambiguity Eliminated by Ambiguity Remaining (10% & 7,5% combined, Measures of Uncertainty &
Vagueness included)
Technology Learning FOAK> NOAK
Risk reduction 10%> 7.5%
Operating Cost Total
Unabated coal 0 0 77 113
Unabated gas 0 0 53 67
Gas w/CCS 13 4 29 37
IGCC w/CCS 35 9 15 26
Offshore R-2 33 18 3 18
Offshore R-3 45 20 4 16
Balanced Portfolio 16 23
FOAK= First of a kind; NOAK = Nth of a kind Source: Calculated by Author
The stakes are quite large. Figure III-3 shows an order of magnitude estimate of the value of adopting policies to ensure new technologies quickly come to market and achieve the cost reduction indicated by the resource cost analysis. It is based on Mott MacDonald, 2010 without any adjustments. In this analysis, I assume that, without decarbonisation, fossil fuel prices will follow the high price scenario (since there is so much demand that the resource base is pressured) and that decarbonised fossil fuels and offshore wind are at their lowest scenarios (all learning and reduced risk). The cost of electricity is expected to rise, about 25 percent, even if the decarbonisation policy is not pursued, because of the rising cost of extraction of fossil fuels and other market factors.

37
Capturing the Value of Off shore Wind Section III
Figure III-3: The Cost of Future Electricity Capacity
£0
£20
£40
£60
£80
£100
£120
£140
£160
2010 2015 2020 2025
Just Pay the Carbon TaxUse Advanced TechnologyIgnore Carbon
Source: Calculated by author based on Mott MacDonald, 2010
If a no technology approach, which simply paid the carbon tax, is taken, costs are projected to rise much more steeply. Carbon fees would double the cost of electricity. A strategy that seeks low cost alternatives through technology development cuts the incremental cost that is caused by decarbonisation by about 60% .
Since the assumption of the analysis is that decarbonisation is the policy, the focal point of further analysis must be on what policies are needed to bring about the technological revolution implicit in these estimates.
C. Comparison to Qualitative Factors in Traditional analysisIn building the analytic framework, I noted that after the quantitative analysis is completed decision makers should examine the terrain for qualitative factors that might contradict or complicate the quantitative analysis. The following section shows that qualitative assessments of resource options are consistent with the general conclusions above.
Economic cost has never been the sole criteria on which electricity capacity/technology has been selected, as shown in Table III-2. Reliability has been a second consideration that greatly infl uences decisions. Electricity systems are built to an extremely high level of reliability – a 1-in-10,000 standard. To achieve this level of reliability, one must not only include individual components that are reliable but the individual parts of the system must complement and reinforce one another. A substantial amount of spare capacity is generally needed to meet the daily and seasonal fl uctuations in demand.

38
Capturing the Value of Offshore WindSection III
Table III-2: Electricity System Performance, Characteristics and Strategies
MultiplePerformance
Key SystemCharacteristics
CopingStrategies
StrategyEffects
Criteria
Stirling, 2010FinancialOperationalSupply security EnvironmentalHealthSocial Wellbeing
Stirling, 2010Technology Combustion Fossil v. Other Non-combustion Geographic Scale Local, Regional, National, GlobalResource Depleting Non-depletable Renewable
Stirling, 2010Risk Management Real Options Portfolio Hedging Diversity
Stirling, 2010Portfolio Benefits Hedging ignorance Mitigating lock-in Fostering innovation Accommodating
pluralism Positive SynergiesPortfolio Challenges Negative Feedback Crowding out
Costello, 2005EconomicOperationalSupply security EnvironmentalSocial Wellbeing
Costello, 2005Technology Type Lead Time IntermittencyGeographic DomesticResource Abundance Supply security
Costello, 2005Hedge Against Price Supply Reliability Regulatory RiskFuel Diversity
Costello, 2005Portfolio theoryReal Options theory
The list of performance criteria by which the electricity system is evaluated varies from study to study, as shown in Table III-2, but it generally includes the following: economic costs (including financial, capital and operating cost), price volatility, reliability (including operational characteristics), variety, security (including availability and origin of fuel supply), flexibility (including operation and construction lead time) environmental impacts (including greenhouse gasses, pollutants, waste, water and land use) and social wellbeing (including health and consumption externalities).
These other criteria are frequently treated in qualitative analyses. For example, although decarbonisation is the focal point of the current round of environmental policy making, there are other environmental concerns that affect electricity generation resource acquisition that are not fully internalised in transaction prices including issues like waste products and water consumption. Figure III-4 shows the average “score” for ten technologies based on several older studies that evaluated environmental impacts qualitatively. These qualitative considerations favour wind, as shown in Figure III-4.
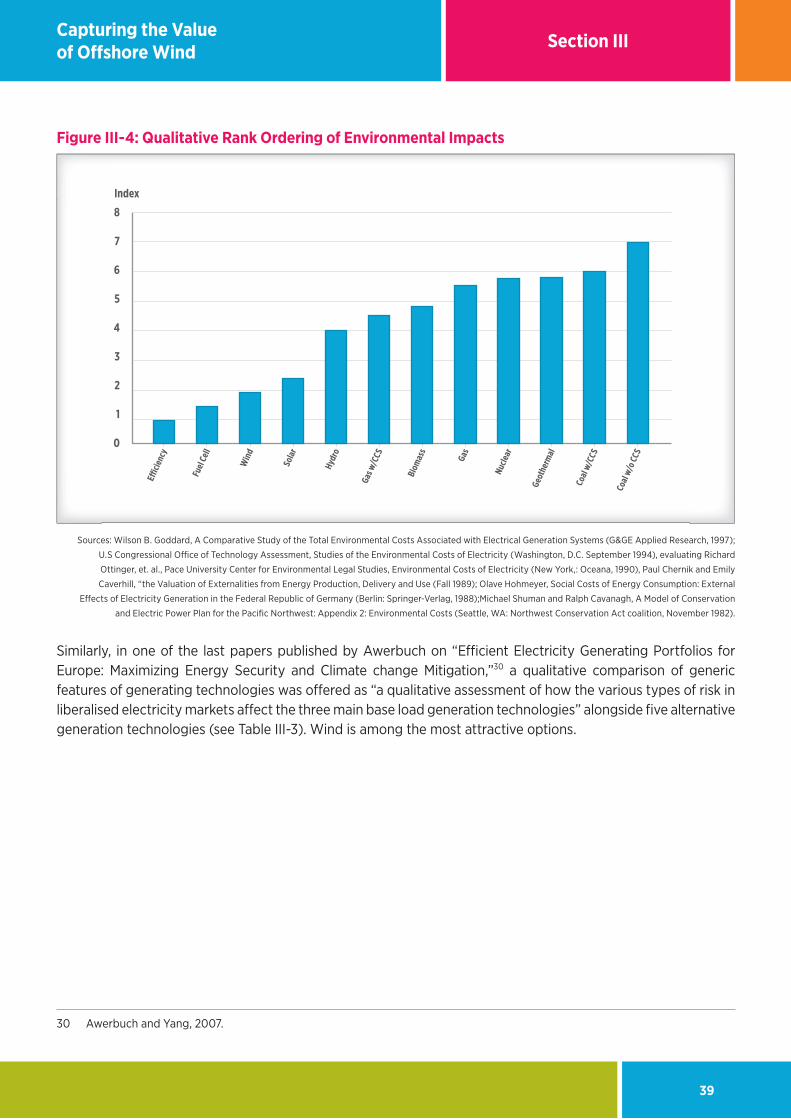
39
Capturing the Value of Off shore Wind Section III
Figure III-4: Qualitative Rank Ordering of Environmental Impacts
0
1
2
3
4
5
6
7
8
Index
E�cie
ncy
Fuel
Cell
Win
d
Sola
r
Hydr
o
Gas w
/CCS
Biom
ass
Gas
Nucle
ar
Geot
herm
al
Coal
w/CC
S
Coal
w/o C
CS
Sources: Wilson B. Goddard, A Comparative Study of the Total Environmental Costs Associated with Electrical Generation Systems (G&GE Applied Research, 1997);
U.S Congressional Offi ce of Technology Assessment, Studies of the Environmental Costs of Electricity (Washington, D.C. September 1994), evaluating Richard
Ottinger, et. al., Pace University Center for Environmental Legal Studies, Environmental Costs of Electricity (New York,: Oceana, 1990), Paul Chernik and Emily
Caverhill, “the Valuation of Externalities from Energy Production, Delivery and Use (Fall 1989); Olave Hohmeyer, Social Costs of Energy Consumption: External
Eff ects of Electricity Generation in the Federal Republic of Germany (Berlin: Springer-Verlag, 1988);Michael Shuman and Ralph Cavanagh, A Model of Conservation
and Electric Power Plan for the Pacifi c Northwest: Appendix 2: Environmental Costs (Seattle, WA: Northwest Conservation Act coalition, November 1982).
Similarly, in one of the last papers published by Awerbuch on “Effi cient Electricity Generating Portfolios for Europe: Maximizing Energy Security and Climate change Mitigation,”30 a qualitative comparison of generic features of generating technologies was off ered as “a qualitative assessment of how the various types of risk in liberalised electricity markets aff ect the three main base load generation technologies” alongside fi ve alternative generation technologies (see Table III-3). Wind is among the most attractive options.
30 Awerbuch and Yang, 2007.

40
Capturing the Value of Offshore WindSection III
Table III-3: Qualitative comparison of Generic Features of Generation Technologies Operationalised in the Multi-Criteria Portfolio analysis
Region of Knowledge and Sources of Ambiguity
GenericFeatures
Risk Uncertainty Vagueness Regulatory
Fuel Prices
CO2 Emissions
Operating Costs
Unit Size
Lead Time Capital Cost
(Quantity & ROI)
Risk
Technologies
CCGT High Medium Low Medium Short Low Low
Coal Medium High Medium Large Long High High
Nuclear Low Nil Medium Very Large Long High High
Wind Nil Nil Very Low Small Short High Medium
Hydro Nil Nil Very Low Large Long Very High High
Reciprocating Engine High Medium Low Small Very Short Low Medium
Fuel Cells High Medium Medium Small Very Short Very High Low
Photovoltaics Nil Nil Very Low Very Small Very Short Very High Medium
Source: Shimon Awerbuch and Spencer Yang, “Using Portfolio Theory to Value Power Generation Investments” in Bazillian and Roques (Eds.),
Analytic Methods for Energy Diversity and Security (Elsevier, 2008), p. 63, citing International Energy Agency/Nuclear Energy Agency (2005),
Projected Costs of Generating Electricity (Paris: OECD).
The quantitative analysis in Sections II and II has captured the first six features, as they affect cost, risk, uncertainty and vagueness surrounding these technologies (see Table III-3). The seventh feature in the table – regulatory risk – is treated as the target policy variable in this analysis, not a feature of the generation technologies. I turn to that next.

41
Capturing the Value of Offshore Wind Section IV
IV. Policy Implications The multi-criteria portfolio view of offshore wind suggests it is a resource whose value should be captured with a large role in the future generation mix of low carbon resources, as did the earlier Cebr analysis of macroeconomic impact.31 This is only the first step in the decision making process. The more challenging part is to design policies to achieve the outcome supported by the analysis. The existing structure of resources centred on fossil fuels has been in place for a long period and has a great deal of inertia on its side. The change is being dictated by the decarbonisation policy, although offshore wind can be justified by its general risk reducing characteristic compared to fossil fuels. Without policies to break that inertia of fossil fuels, change will not come about. In order to appreciate the magnitude of the challenge, this section reviews the sources of the inertia that will prevent change as well as the steps necessary to overcome it.
Electricity market reform recognises that there are severe challenges that must be overcome and it constitutes a huge undertaking. This section offers three high level observations on the nature of the challenge and its implications in terms of the foregoing analysis.
A. Ending the Implicit Subsidy on Fossil FuelsBecause decarbonisation is such a large commitment, placing the decision to decarbonise in a broader historical context provides an important perspective to help appreciate both the challenge and the opportunity that the UK faces. For the past two centuries fossil fuels have been the primary form of energy that powered the industrial revolution, having replaced wind, water and draught animals directly in the 19th century and indirectly through the use of electricity in the 20th century. Fossil fuels were preferred because they were inexpensive for the power they delivered. Capitalist societies burned the cheap fuel and invested in technologies to save on other factors of production that are less abundant and more costly.
There were a number of reasons that fossil fuels were an attractive energy resource, three of which are quite relevant to the current policy context. First, fossil fuels have moderate levels of energy intensity, which means that the technologies needed to turn fossil fuels into power are comparatively simple, relatively inexpensive and extensions of existing technologies. Resources with much lower intensity require more capital investment to extract useful power. Resources with much higher levels of energy intensity require high levels of capital investment to control the release of power. As a result, fossil fuels required relatively little capital investment and were lower in cost.
Second, part of the relatively low cost of fossil fuels also reflected the availability of the resource in deposits that were relatively easy to exploit. In short, fossil fuels were easy to supply and easy to use. In recent years the economic cost of production of fossil fuels has begun to rise as the more easily exploited resources have been depleted, as shown in Figure I-2, above.
Third, part of the relatively low cost of fossil fuels reflected a market imperfection, the failure of the market price to reflect the external costs (environmental and health effects) that fossil fuels imposed on society, which represented an implicit subsidy. About a half century ago, society began to force fossil fuels to bear the external costs by imposing regulations that required them to control the waste products of their consumption, like smog
31 Cebr 2012
42
Capturing the Value of Offshore WindSection IV
and the precursors of acid rain, as well as the external costs of their production. The decision to decarbonise the economy in recognition of the harm that burning fossil fuels does is a dramatic change, compared to previous policies, and it will have a much larger impact on the cost of fossil fuels. Current estimates indicate that if the reliance on fossil fuels were maintained at current levels and generators just paid the tax on carbon, the cost of consumption of natural gas and coal used to generate electricity would double. However, that does not have to be the case, as shown in Section III.
The intelligent, economic response to removal of the implicit subsidy that fossil fuels have enjoyed is not to simply pay the carbon penalty, it is to invest in alternative technologies that emit less carbon, if those technologies have a lower total cost (including the cost of carbon). In the mid- and long-term, decarbonisation with new technologies will be less costly than burning fossil fuels without abating carbon emissions, particularly if the risk (cost of capital) for low carbon alternatives can be lowered by public policy. Aggressive policies to lower new technology costs by accelerating learning-by-doing, capturing network effects, promoting economies of scale and lowering risk premiums can dramatically reduce the long-term cost of decarbonisation.
B. Market Barriers and Imperfections: The Link to Market ReformIf the only barrier to an efficient response to the end of the implicit subsidy for fossil fuels was the internalization of the cost of carbon, policy makers could just impose a substantial tax on carbon and let the marketplace work. Unfortunately, that simple approach will not be effective because the electricity sector is a complex arena which is tasked by policy makers with delivering a multitude of sometimes competing outcomes, in the face of significant barriers and imperfections.
There are other positive externalities that will not be internalised by simply raising the price on carbon.
• The new technologies on which a decarbonised electricity sector must depend would benefit from learning-by-doing, economies of scale and network effects that are difficult for individual companies to capture. Treating these as public goods, public policy can facilitate and accelerate the capture of all of these positive externalities.
• The transmission grid is a shared resource that needs public policy to promote the common good.32 • The potential for the growth of an export sector is also an externality that individual companies will not fully
value in their private calculations.
As the Electricity Market Reform project recognises, in the UK there are major barriers or imperfections in the market that will prevent reliance on the simplest market mechanism – price (i.e. a tax on carbon) – from reaching the goal decarbonisation that relies on lower cost alternatives. Empirical experience is consistent with the economic theory that recognises the barriers to efficient development of offshore wind. Since the problem of market barriers or imperfections has been acknowledged, we can sidestep most of the never ending debate about regulation v. deregulation. However, briefly reviewing some of the issues that affect offshore wind is important to the process of designing policies to reduce them. The barriers that offshore wind faces are among the more widely recognised market imperfections and understanding their origins helps to design policies to overcome them.
32 In the U.S. even the most conservative analysts recognised the common nature of the grid, see Cooper, 2005.

43
Capturing the Value of Offshore Wind Section IV
An interesting starting point is a report by Ryan Avent, the Washington-based economic correspondent for the Economist, that noted “a great session on climate policy”33 moderated by Lord Stern at the annual meeting of the American Economic Association. The session focused on
“... the environment and directed technical change”. He noted that it suggested, economics is clearly moving beyond the carbon tax alone position on climate change, which is a good thing. If the world is to reduce emissions, it needs technologies that are both green and cheap enough to be attractive to economically-stressed countries and people. And a carbon tax alone may not generate the necessary innovation… [T]he carbon externality isn’t the only relevant externality in the mix. There is another important dynamic in which technological innovation draws on previous research, and so firms are more likely to continue on established innovation trajectories than to start new ones.34
The challenge of the underlying environmental externality is compounded by two other externalities, an innovation externality and network externalities, as well as a number of other market barriers. Framed in high level analytical terms, the analysis has immediate and practical implications that have stimulated a vigorous discussion in the U.S.35 The theoretical analysis describes the reality that policy makers in the UK have recognised in the ongoing debate over decarbonisation and market reform.
A long period in which the carbon externality was not internalised has created a large market in the use of fossil fuels which is the focal point of resources and investment and will be the focal point of innovative activity. Since the alternative technologies are at a disadvantage in terms of development and the ability to attract resources, just raising the cost of the dominant fuels does not overcome the inertia and actually allows the gap between the incumbent and alternative technologies to persist or even grow.
[T]his structure implies that innovation builds on the existing level of quality of a machine and, thus, incorporates the “building on the shoulders of giants” feature. [T]his implies that here is a “state dependence” in the innovation possibilities frontier, in the sense that advances in one sector make future advances in that sector more profitable or more effective. This is a natural feature in the current context, since improvements in fossil fuel should not (and in practice do not) directly translate into innovation in alternative and renewable energy sources.36
The inertia can be compounded by several other factors including monopolistic distortions in the incumbent market, a lack of substitutability between the alternatives and limited spillovers from innovation in the incumbent technology. With an exhaustible resource the problem can be particularly acute, as a tendency to underestimate the long term consequences of continuing dependence on it are not fully reflected in current decision making.
The analysis reaches this conclusion because delaying the start of the transition or allowing these factors to slow its progress results in a longer, more costly transition with higher costs and greater reductions in economic activity for a longer period. Under some circumstances, the losses are permanent.
33 Avant, 2011.34 Avant, 2011.35 See the long thread of Debate at the Breakthrough Journal on the “Yale Environment 360 Debate”.36 Acemoglu, et al, 2012, pp. 137.

44
Capturing the Value of Offshore WindSection IV
... delay increases the technological gap between clean dirty sectors, necessitating a more extended period of economic slowdown in the future… Even though a carbon tax would by itself discourage research in the dirty sector, using this tax both to reduce current emissions and to influence the path of research would lead to excessive distortions. Instead, optimal policy relies less on a carbon tax and instead involves direct encouragement to the development of clean technologies. 37
The “state dependence” with respect to innovation is one type of a widely recognised social process that deeply affects change – path dependence. As Douglas North, a Nobel laureate leader of New Institutional Economics states, Institutions provide the basic structure by which human beings throughout history have created order and attempted to reduce uncertainty in exchange. Together with the technology employed, they determine the transaction and transformation costs and hence the profitability and feasibility of engaging in economic activity.38
Institutions form the incentive structure of a society and the political and economic institutions, in consequence, are the underlying determinant of economic performance. Time as it relates to economic and social change is the dimension in which the learning process of human beings shapes the way institutions evolve.39
The viability, profitability and indeed survival of the organisations of a society typically depend on the existing institutional matrix. That institutional matrix has brought them into existence and upon it their complex web of interdependent contracts and other relationships have been constructed. Two implications follow. Institutional change is typically incremental and is path dependent…
It is incremental because large scale change will create too many opponents among exiting organisations that will be harmed and therefore oppose change…. Path dependence will occur because the direction of the incremental institutional change will be broadly consistent with the existing institutional matrix and will be governed by the kinds of knowledge and skills that entrepreneurs and members of organisations have invested in.40
C. Reducing Market Barriers and Sources of AmbiguityThis analysis of the market barriers to new technology adoption highlights an important point about policy that has been well recognised in energy policy debates for some time. Specific policies are better suited to address different market imperfections. This harkens back to a highly developed debate that took place about energy efficiency in the mid-1990s, as electricity restructuring spread across the U.S. Analysts at Lawrence Berkeley National Laboratory raised the concern that simply getting the price right would not stimulate innovation and investment in energy efficiency because there were other market imperfections that were barriers to efficiency-oriented economic activity.41 Resources for the Future has offered a similar analysis of both energy efficiency and climate change.42 Appendix B presents a discussion of this literature and what we can learn from it.
37 Acemoglu, et al, 2012, pp. 13238 North, 1990. pp. 133… 118.39 North, 1993, at 1.40 North, 20005, p. 6241 Golove and Eto, 1996, Sathaye and Murtishaw, 2004.42 Gillingham, Newell and Palmer, 2009; Kopp and Pizer, 2007.

45
Capturing the Value of Offshore Wind Section IV
In the scope of the present analysis, the important point is that we can identify specific policies to respond to specific imperfections that have their grounding in different regions of knowledge, as suggested by Table IV-1 which presents examples of the market barriers that are relevant to offshore wind under the conditions in the current electricity market and policies that can reduce those barriers.
One set of policies requires the market structural issues to be resolved so that offshore wind and renewables can compete on a level playing field in terms of incentives. Policies like merit order dispatch and Feed-in Tariffs deliver immediate rewards to alternative, showing the price signals. These compensate for the misallocation of risk that fails to take pricing volatility into account.
Table I-1: Market Imperfections in the Regions of Knowledge and Policy Responses
Vagueness Risk
Barriers: Public Goods learning-by doing, lack of economies of scale result in high capital cost and interest rate
Policy Responses: Incent learning, capture economies of scale and network effects with obligations, loan guarantees
Barriers: Perverse Incentives, agencyproblems caused by misallocation of fuel price risk
Policy Responses: Reflect merit in dispatch, compensate low risk resources with a Feed-In tariff
Unknowns Uncertainty
Barriers: Black Swan: Network ManagementWhite Swan: GDP multiplier and consumption externalities
Policy Response: Promote diversity with funding of R&D, Education, infrastructure funding
Barriers: Faulty calculation causes loss of real option value by choice of long lead time, high sunk cost projects,
Policy Responses: Reward flexibility with capacity adders, facilitate consenting
The second set of policies aims to reduce the time it takes to bring projects on line. Facilitating the consenting process is one obvious possibility.
The third set of policies requires efforts to direct investment toward the newer resources. All low carbon resources suffer from high capital costs and high hurdle rates of return because of their “newness” state. Potential for reduction of capital costs through learning and economies of scale are observed for all. 43
The fourth set of issues involves research into relieving the network management constraints so that the technological and economic limits of the contribution of offshore wind are more clearly defined. Exploring the technologies that can expand the contribution of offshore wind in the longer term – interconnection, smarter grid and appliance technologies – has broader justification than supporting offshore wind on its own. They create a more efficient sector generally and one that will be able to more readily accommodate more uses, like
43 Gerlagh Kverndokk and Rosendahl, 2009, p. 388. “If the public authority can directly steer the development of energy-related technology, either through public energy-related R&D or through targeted private R&D, then it is efficient to spend much of the initial effort on this technological development… However, if the public authority cannot directly determine the development of an emission reducing technology, then efficiency considerations suggest that the clean technology should be extra stimulated through an increased demand for its produced goods. The technology pull policy should be relatively strong during the emerging phase of climate change problems, when the abatement technologies still have to mature.”

46
Capturing the Value of Offshore WindSection IV
the electrification of the transportation sector, and one that is less susceptible to volatile swings in price.
• Spreading the renewable resource base across geographic regions and resources creates a less variable pattern of generation.
• Storage capacity enhances the value of all variable resources and reduces the volatility of input prices.44 • Smarter networks increase the ability to balance generation and load.• Supergrid development creates export markets for surpluses and more efficient import markets to meet
deficits.
ConclusionOffshore wind is an attractive resource that deserves near term policy support to enable it to make a major contribution to long-term policy goals.
• Offshore wind is a rich, indigenous, zero-carbon resource, not subject to external economic shocks or political manipulation. Insulated against fuel and carbon price risks, its addition to a generation resource portfolio lowers variable cost risk dramatically.
• The relatively short construction time and smaller increments in which offshore wind generation can be delivered are attractive attributes, giving wind an advantage with respect to uncertainty.
• In the near–term the capital cost of offshore wind is high, but in the long term it has the potential among the major, lower cost resources.
If public policy does a good job of capturing the benefits of learning, correcting the misallocation of the risk of fuel price volatility, and reducing the bias (risk aversion) against new technology, the long-term constraint on the contribution of offshore wind will be neither the availability nor the cost of the resource, but the ability to manage and integrate it into a reliable electricity grid. Given the current, relatively low level of contribution of offshore wind, policy should chart a course that seeks to expand the role of offshore wind by adding generation resources that equal the level of decarbonised fossil fuels.
Indigenous low carbon resources are preferable for price risk, supply security and local economic multiplier effects. The resources are available around the globe. The opportunity exists to develop the technologies and systems to make these resources economic. Given the richness of the wind resource in the UK, it has a chance to both meet its domestic needs and become an exporter of a technology that will have a significant global market.
44 Johnstone and Haccic, 2010, p.25 “Since innovating in storage technologies is an important complement to innovation in all intermittent renewable generating technologies such a strategy reduces the risk of (not) picking winners. Moreover, the technologies are at a relatively early stage of development, with greater need for support.”

47
Capturing the Value of Offshore Wind Appendix A
Appendix A: Intellectual Origins of the Multi-Criteria ApproachThis Appendix provides a discussion of the background and logical structure of the multi-criteria portfolio framework from several strands of literature. Where appropriate, I repeat some text to demonstrate the manner in which the earlier arguments are supported by the discussion in this Appendix.
Figure A-1 present the characterizations used in the three approaches from which I draw to develop the multi-criteria analytic framework. These are the basis for the dimensions and names used to characterise the regions of knowledge. The two dimension of knowledge (outcomes and probabilities) are shown for each school. I then offer some quotes from the literature to capture the essence of the formulation. In the Figure A-1, which reproduces the original framing from the three schools of thought, we find that the dimensions are presented as decreasing levels of knowledge. They run from highest to lowest knowledge. In Figure II-1 above, which introduced my approach to the analysis, I present the axes as increasing levels of knowledge. I reverse the polarities. The decision making space is darkest near the origin where knowledge is lacking. I think a good way to characterise the endeavour of policy, regulatory and financial analysts is to shed more light on the decision making environment so that we can navigate better in and expand the regions of partial knowledge, and avoid harmful surprises in the region of the unknowns.
These frameworks arrive at the similar mapping of the terrain of knowledge and policy rules for coping with a lack of knowledge because they share a fundamental critique of the statistical models used in much predictive analysis.
• Statistical models are not very useful (are essentially useless) to predict rare events because the assumptions about frequencies or distributions necessary to build the models do not fit the reality of rare events.
• The application of inappropriate statistical models to predict improperly defined outcomes increases the exposure to rare events (surprise) because model builders “don’t know what they don’t know” and therefore they do not take the proper precautions against rare events.
• More broadly, the narrow optimization approach that flows from the statistical models that dominate economics increases the risk of harm from negative black swans because it produces social structures (organizations, institutions) that are overly specialised and unable to adapt to perturbation in their environment.
The contemporary critique focuses heavily on the over reliance on probabilities, which are suited to only one of the four regions, risk, where both outcomes and probabilities are known. The size of that region is overestimated by some analysts and others act as if risk is the only source of ambiguity in the decision space. Technology Risk Assessment frames this issue as follows:

48
Capturing the Value of Offshore WindAppendix A
Table A-1: Framing the Terrain of Knowledge in Three Perspectives
Project Management Uncertainty-Ambiguity Matrix
AmbiguityUncertainty
Low High
Low Variation
Model UsingVariables knownValues knownRelationships known
Model UsingVariables knownValues unknownRelationships known
High , Level 1 ForseenUncertainty
Model BuildingVariables knownValues knownRelationships unknown
Model BuildingVariables knownValues unknownRelationships unknown
UnforseenUncertainty
High, Level 2 Variables unknownrelationships unknown Chaos
Technology Risk Assessment
Knowledge about Likelihoods
Knowledge about Outcomes
Continuum of outcomes Set of Discrete outcomes Poorly defined
Risk Fuzziness
Firm basis for probabilities
Apply:frequentistdistributionfunctions
Apply:discrete
frequentistprobabilities
Apply:fuzzy logic
Shaky basis for probabilities
Bayesiandistributionfunctions
discreteBayesian
probabilities
Uncertainty Ignorance
No basis for probabilities Apply:scenario analysis
Apply:divesity
Black Swan Theory
Application
Domain Simple payoffs Complex Payoffs
Distribution 1 (“thin tailed) Extremely robust to Black Swans Quite robust to Black Swans
Distribution 2 (“heavy” and/or unknown tails, no or unknown characteristic scale)
Quite robust to Black Swan LIMITS of Statistics extreme fragility to Black Swans

49
Capturing the Value of Offshore Wind Appendix A
Table A-1: Cont’d. Descriptions of the Terrain of Knowledge
Uncertainty-Ambiguity MatrixTwo dimensions of the environment are identified. The simple-complex dimension is defined as the number of factors taken into consideration in decision making. The static-dynamic dimension is viewed as the degree to which these factors in the decision unit’s environment remain basically the same over time or are in a continual process of change. Results indicate that individuals in decision units with dynamic-complex environments experience the greatest amount of uncertainty in decision making. The data also indicate that the static-dynamic dimension of the environment is a more important contributor to uncertainty than the simple-complex dimension. (Duncan, Robert B., 1972, Characteristics of Organisational Environments and Perceived Environmental Uncertainty, Administrative Science Quarterly, 17
Uncertainty: Characteristic of a situation in which the problem solver considers the structure of the problem (including the set of relevant variables) as given, but is dissatisfied with his or her knowledge of the value of these variables. Ambiguity level 1: Characteristic of a situation in which the problem solver considers the set of potential relevant variables as given. The relationships between the variables and the problem solving algorithm are perceived as in need of determination. Ambiguity level 2: Characteristic of a situation in which the set of relevant variables as well as their functional relationship and the problem solving algorithm are seen in need of determination. In the case of uncertainty reduction the key tasks are information gathering and integration. In the case of ambiguity reduction, the tasks are model building, negotiation, problem framing evaluating and reframing, and model testing. (Schrader, Stephen Schrader, William M. Riggs and Robert P. Smith, 1993, Choice over Uncertainty and Ambiguity in Technical Problem Solving, Alfred Sloan School of Management, Working Paper #3533-93-BPS, February 1993)
Managing “in the presence” of risk, variance and uncertainty is the key to success. …Although each uncertainty type is distinct, a single project may encounter some combination of four types:1 Variation – comes from many small influences and yields a range of values on a particular activity. 2 Foreseen Uncertainty – are uncertainties identifiable and understood influences that the team cannot be sure will occur. There
needs to be a mitigation plan for these foreseen uncertainties.3. Unforeseen Uncertainty – is uncertainty that can’t be identified during project planning. When these occur, a new plan is needed.4. Chaos – appears in the presence of “unknown unknowns.” (Gele B. Alleman, Five Easy Pieces of Risk Management, May 8, 2008)
Technology Risk AnalysisTechnology Risk Assessment: Risk is conventionally regarded to comprise the two basic elements of probabilities and magnitudes… Risk is a condition under which it is possible both to define a comprehensive set of all possible outcomes and to resolve a discrete set of probabilities (or a density function) across this array of outcome.
The strict sense of the term uncertainty, by contrast, applies to a condition under which there is confidence in the completeness of the set of outcomes, but where there is acknowledged to exist no valid theoretical or empirical basis for the assigning of probabilities to these outcomes…
The condition of ‘fuzziness,’ under which the various possible outcomes do not admit of discrete definition.
Finally, there is the condition of ignorance. This applies in circumstances where there not only exists no basis for the assigning of probabilities (as under uncertainty), but where the definition of a complete set of outcome is also problematic. (Andrew Stirling, On Science and Precaution in the Management of Technological Risk (European Science and Technology Observatory, May 1999), p. 15…17)
Black Swan TheoryFirst Quadrant: Simple binary payoffs… forecasting is safe, life is easy, models work… These situations are, unfortunately more common in laboratories and games than in real life. We rarely observe these payoffs in economic decision-making… Second Quadrant: Complex payoffs… statistical methods may work satisfactorily, though there are some risks... use of models may not be a panacea, owing to preasymptotics, lack of independence, and model error. Three clearly are problems here... Third Quadrant: Simple payoffs… there is little harm in being wrong, because the possibility of extreme events does not impact the payoffs. Don’t worry too much about Black Swans. Fourth Quadrant: Complex payoffs…is where the problem resides, opportunities are present too. We need to avoid prediction of remote payoffs, though not necessarily ordinary ones. Payoffs from remote parts of the distribution are more difficult to predict than those from closer points. (Nassim Nicholas Taleb, The Black Swan (New York: Random House, 2010), pp. 364-365).

50
Capturing the Value of Offshore WindAppendix A
Unfortunately, exclusively ‘realist’ or ’frequentist’ probabilistic understandings of incertitude are open to serious doubts concerning the comparability of past and future circumstances and outcomes. The concept of a hypothetical series of trials is singularly inappropriate in cases where the decisions in question are large in scale or essentially unique, take place in a complex and rapidly changing environment or involve effectively irreversible impacts. Where the different aspects of performance are many in number and incommensurable in form, attempts to reduce this to a single metric further compound the difficulties. In disciplines such as financial investment appraisal , the existence of short time horizons and a dominating monetary ‘bottom line’ are often held to supersede such difficulties and justify the imposition of a single numeraire. Yet in fields such as industrial strategy, policy analysis and technology assessment, these issues of sale, novelty, uniqueness, complexity, change, irreversibility an incommensurability are manifestly the norm and cannot be readily set aside. In a strict ‘frequentist’ sense, then, techniques based on probability theory are quite simply inapplicable to many of the most important decision that take place within the economy. In these contexts at least… probability does not exist.45
B. Integrating the ApproachesThe fundamental difference between Black Swan Theory and the other approaches is that it launches from and is preoccupied with a negative framing of the issue – a critique of the approaches analysts grounded in statistical models take. Black Swan Theory sees the primary task as insulation against the harmful effects of negative black swans. In fact, Black Swan theory suggests that “while in the first three quadrants you can use the best model you can find, this is dangerous in the fourth quadrant: no model should be better than just any model.”46 However, Black Swan theory does not examine those models, in part because they have been highly developed in the fields that the theory is critiquing.
Black Swan Theory argues that rare events have a huge impact on the development of daily life. The importance of rare events has been growing, but rare events are inherently unpredictable and humans have difficulty dealing with them.47
“The inability to predict implies the inability to predict the course of history… But we act as though we are able to predict historical events, or, even worse, as if we are able to change the course of history… Black Swans being unpredictable, we need to adjust to their existence (rather than naively try to predict them). There are so many things we can do if we focus on anti-knowledge, or what we do not know.”48
Simplification of complex outcomes is highlighted in Black Swan theory because it “can have explosive consequences since it rules out some sources of uncertainty; it drives us to misunderstanding the fabric of the world.”49
Instead of focusing on gaining more precise knowledge about what is predictable, we need to gain a better understanding of what is unpredictable. Using the wrong models to try to predict the unpredictable causes us
45 Stirling 2000, p. 15.46 Taleb, 2008, p. 1647 Stirling 2000, p. 15, 48 Taleb, 2007, p. xx-xxi49 Nassim Taleb, 2007, p. 213.

51
Capturing the Value of Offshore Wind Appendix A
to expose ourselves to even greater risk and to be less prepared for events we failed to predict. The goal is not to predict, the future, but to offer observations about the possible rare events – “it is not easy to compute their probability, but it is easy to get a general idea about the possibility of their occurrence. We can turn these Black Swans into Gray Swans, reducing their surprise effect.”50
Technology Risk Assessment takes a positive approach, seeking to examine the methods used in the other quadrants and extract useful insights, without losing sight of the limitations of the methods in the face of the unknown. The idea is to use the methods to explore each region to narrow the size of the region of ignorance. It may well be that the unknown is not the simple sum of risk, uncertainty and vagueness, but it is also reasonable to use what we can learn from the analysis of risk, uncertainty and vagueness to narrow the scope of the unknown, as long as we do not make the mistake of assuming that that is all there is to the unknown.
Technology Risk Assessment launches from a positive assessment of the value of diversity. The performance of a diverse system is superior because it fosters innovation and creativity, mobility, flexibility (anti-lock in), pluralism and a more rigorous selection process. Thus diverse systems diminish the impact of black swans and are better equipped to exploit the opportunity of white swans.
Technology risk assessment frames the challenge as follows: “Knowing your ignorance is the best part of knowledge.”51
A ‘scientific’ approach to the regulatory appraisal of risk is conventionally taken to imply the use of quantitative aggregating techniques…. The basic aspiration underlying the use of ‘risk-based’ techniques is that in and of themselves, they offer a robust means to prescribe and justify commercial and regulatory decision-making in the governance of technological risk. The authority of this ‘risk-based’ approach lies in an appeal to monolithic notions of methodological rigour and on the unitary nature of the analytical results thereby obtained.
For its part, a ‘precautionary’ approach reflects a rather different perspective, introducing a wide range of emerging concerns in the risk governance debate. In the most general of terms, it contrasts with a reductive ‘risk-based’ approach in extending attention to them such as complexity, variability and nonlinear vulnerabilities in natural systems. A precautionary approach highlights the consequent potential for ‘surprise.’ It places greater emphasis on active and dynamic choices between technology and policy alternatives than do ‘risk-based’ approaches.52
The precautionary approach to decision making argues that it requires a more active and dynamic approach to process, more than structure, but it is reliability and risk mitigation management that emphasises these processes, particularly with regard to information flow and human error.
In general, when work is distributed across space and time among multiple people, certain latent conditions necessarily exist that may lead to future mishaps. These include information sharing, coordination, communication, procedures, training, and knowledge capture and reuse. Information sharing may be absent, incomplete, incorrect, or not done in a timely manner. Coordination activities may be disorganised, untimely, missing, or unnecessarily difficult for a particular organisational
50 Taleb, 2007.51 Stirling 1999, p. 16.52 Stirling, 2001, p. 56.

52
Capturing the Value of Offshore WindAppendix A
structure. Poor communications practices, inappropriate initial framing of the interaction, poor training and poor procedure design may lead to poor information sharing and coordination, which may directly lead to mishaps… Distributed work also requires distributed knowledge; therefore, poor knowledge capture and lack of reuse are issues as well.
The challenge in managing uncertainty, to whatever degree, is to find the balance between planning and learning. Planning provides discipline… Projects in which variation and foreseen uncertainty dominate allow more planning, whereas projects with high levels of unforeseen uncertainty and chaos require greater emphasis on learning.53
Awerbuch and Berger (2003), commenting on the work of Stirling (1999) noted the tension between the assumptions underlying the different approaches to decision making in the face of ambiguity.
Andrew C. Stirling (1994) rejected the applicability of mean-variance portfolio theory on the grounds that fuel price movements have no pattern. He argued that “Decisions in the complex and rapidly changing environment of electricity supply are unique, major and effectively irreversible…. Differentiating three basic states of incertitude…
Stirling states that ignorance rather than risk or uncertainty dominates real electricity investment decisions. He conceptualises diversification as a response to ignorance.
Portfolio risk, however, is properly defined as total risk (the sum of random and systematic fluctuations) measured as the standard deviation of periodic historic returns.
This is not to say, however, that certain fundamental changes in the future, such as significant market restructuring or radically new technologies, could not create ‘surprises’ by altering observed historic risk patterns. Such radical, discontinuous change is generally unpredictable. However, rather than letting such probabilities drive our decision approach, we find it more plausible to assume that the totality of random events… cover the reasonable range of expectations for the future.54
I do not believe the tension between the approaches poses a serious problem. The strategy that I advocate is for decision makers to intensively explore the risk, uncertainty and vagueness regions, thereby, hopefully, shrinking the region of the unknowns. When the first three regions have been explored, the analyst should consider what else is still unknown and what needs to be done about it.
This is consistent with the observation offered by Black Swan theory and underscores an important point –knowledge and action go hand in hand in these schools of thought.
A map is a useful thing because you know where you are safe and where your knowledge is questionable. So I drew… a tableau showing the boundaries where statistics work well and where it is questionable. Now once you identify where the danger zone is, where your knowledge is no longer valid, you can easily make some policy rules.55
53 Meyer, Loch and Pich, 2002, p. 6754 Awerbuch and Berger, 2003,pp. 16-17.55 Nassim Nichols Taleb, “The fourth quadrant: A Map of the Limits of Statistics,” Edge: the third culture, September, 15, 2008, p. 3.

53
Capturing the Value of Offshore Wind Appendix A
Black Swan theory argues that the increasing importance of rare evens stems from the nature of the modern world.
Our modern, complex, and increasingly recursive world… means that the world in which we live has an increasing number of feedback loops, causing events to be the cause of more events, thus generating snowballs and arbitrary unpredictable planet-wide winner-take all effects. We live in an environment where information flows too rapidly, accelerating epidemics. Likewise events can happen because they are not supposed to happen.56
A related second characteristic of the modern world that increases the importance of rare events is their viral nature which results in scalability – the tendency for impacts to spread widely.57
This is particularly important for policy and regulatory decision makers who deal with electricity resource acquisition. They are in an extremely difficult situation because they have the real time challenge of keeping the lights on, preferably at reasonable and affordable prices. The challenge flows from the physics of electrons, which are very demanding, and the importance of electricity in daily life. The characteristics of the contemporary world that cause the increasing importance of Black Swan, rare events are characteristics that the electricity grid has always possessed. It is a recursive, scalable network through which black swans can spread virally.
As a description of the challenges of a hostile environment in which the terrain and presence of swans is difficult to see, the expression “fog of war” interpreted to mean that “[w]ar is inherently volatile, uncertain, complex and ambiguous” 58 can be aptly applied to these efforts to map the terrain of knowledge.59 The advice offered to the military commanders when contemplating “cyberwar” is similar to the advice derived from the schools of thought cited in this section.
We need to practice with the “radios turned off” and officers must become comfortable with uncertainty rather than keep grasping for more certainty. While we have the most robust communications, we also want to make sure we can operate with none of it… Advantage on any battlefield – albeit episodic and ephemeral – will favour the commanders who best manage what they cannot master.60
56 Taleb, p. xxii.57 Taleb, 2008, p. 30, Taleb, 2010, p. 317)58 Clauzwitz is credited with the metaphor based on quotes like “War is the realm of uncertainty; three quarters of the factors
on which action is based are wrapped in a fog of greater or lesser uncertainty. “The great uncertainty of all data in war is a peculiar difficulty, because all action must, to a certain extent, be planned in a mere twilight, which in addition not infrequently — like the effect of a fog or moonshine — gives to things exaggerated dimensions and unnatural appearance. (cited in Kiesling, 2001).
59 It certainly fits the description of space exploration above. It did not work as an excuse for not finding weapons of mass destruction, as Secretary of Defense Rumsfeld found when he invoked the terminology of Reliability and Risk Mitigation management. He was roasted in the press for his statement that [T]here are known knowns; there are things we know we know. We also know there are known unknowns; that is to say we know there are some things we do not know. But there are also unknown unknowns – the ones we don’t know we don’t know.” http://www.defense.gov/transcripts/transcript.aspx?transcriptid=2636; The producer of the Documentary on McNamara’s musing on the fog of war provides insights and identifies the affliction of not knowing what we don’t know, “The Anosognosic’s Dilemma: Something’s Wrong but You’ll Never Know What It Is (Part 1),” in a New York times blog, Morris, 2010.
60 Campden, 2010. Efforts to statistically model attacks in modern warfare end up in the “precaution” mode: Bland, 2010, “This won’t necessarily help a commander in the field deal with the day-to-day… However, if the model predicts that a large attach is likely to happen soon, governments or military commanders could take steps to prevent its occurrence by more closely monitoring communications of enemy combatants. Officials may also potentially lessen the impact of an attack by moving civilians and soldiers away from likely targets. “

54
Capturing the Value of Offshore WindAppendix A
The literature on space exploration summarises the challenges as follows:
NASA space exploration should largely address a problem class in reliability and risk management stemming primarily from human error, system risk and multi-objective trade-off analysis by conducting research into system complexity, risk characterisation and modeling, and system reasoning. In general, in every mission we can distinguish risk in three possible ways: a) known-known, b) known-unknown, and c) unknown-unknown….
Human reliability in systems cannot be verified with full coverage and components will fail or degrade, operators will make mistakes, and operating environments are uncertain. In addition the state of the system and its environment may dynamically increase control complexity or decrease reaction times such that traditional control means are inadequate.61
Resource acquisition in today’s electricity sector may not be as daunting as war or space exploration, but it faces the “fog of the future,” which, at the start of the 21st century, has certainly become much more “volatile, uncertain, complex and ambiguous.” I suggest that the analytic tools and policy instruments identified by these efforts to describe the regions of knowledge can help decision makers to become comfortable with dramatically increased uncertainty and to be better able to manage what they have become much less able to master.
Table A-1 provides some detail about how the principles are derived. It shows that Technology Risk Assessment and Black Swan Theory both draw heavily on biological and ecological sciences for their recommendations. Both analogise and emphasise the importance of insurance and look to natural forms, such as redundancy, flexibility and adaptability.
Table A-2: Defining Policy Rules For the Regions of Knowledge
Precaution Robustness to Error Diversity Redundancy Resilience/
Durability
Truncate Exposure
Buy insurance for system survival
Accept Non-optimization
Small, Confined,
Early Mistakes
Avoid Moral Hazard
Incentive & disincentives
Hedge
Variety,
Balance,
Disparity
Numerical
Functional
Adaptive
Adaptability
Multi-functionality
What Works
Flexibility/Optionality
Across Time & Space
61 Maluf, Gawdisk and Bell, N.D. David A. Maluf, Yuri O. Gawdisk and David G. Bell, N.D. I have added the fourth region, unknown-known to arrive at four quadrants.

55
Capturing the Value of Offshore Wind Appendix A
Technology Risk Analysis Black Swan Theory Reliability & Risk Mitigation
Knowing your ignorance is the best part of knowledge. Precaution: Specific methods, techniques, instruments or measures which implement an approach which directly addresses the problems of multidimensionality, incommensurability and ignorance. (a: 40)
Diversity: diversity remains effective (at least in part) even if the source or modalities of the prospective disruptions are effectively unknown By maintaining an evenly balanced variety of mutually disparate options, we may hope to resist impacts on any subset of these, even if we do not know in advance what these impacts might be. parallel series of different strategies Diversity => the inclusion of options which appear to perform less well as an insurance against changes in performance in other options (a: 27)
• Variety: e.g. the number of functionally redundant – but morphologically or operationally distinct – options sustained in parallel (b: 39)
• Balance: the pattern in the apportionment across the relevant categories of the options. (b: 39)
• Disparity: the nature and degree to which the categories themselves are different from each other (b: 40)
Flexibility• Capacity to retain as many options
for as long as possible in advance of commitment, and
• Ability to withdraw (when commitment is made) without great penalty if prohibitive conditions arise (a: 27)
Resilience: capacity to sustain performance under external perturbation (b: 2 • Robustness: The capacity to
sustain performance under extreme perturbation maintaining an established internal structure
• Adaptability: The capacity to sustain performance under external perturbation by changing internal structures (a: 27)
The Black Swan attempts to provide a map of where we get hurt by what we don’t know, to set systematic limits to the fragility of -- knowledge. and to provide exact locations where these maps no longer work (347) The most obvious way to exit the Fourth Quadrant is by “truncating,” cutting certain exposures by purchasing insurance, when available (370); One can buy insurance, or construct it to “robustify” a portfolio (371)
Redundancy equals insurance and the apparent inefficiencies are with the cost of maintaining these spare parts and the energy needed associated – to keep them around in spite of their idleness exact opposite of redundancy is naïve optimization (312)
• Numerical, functional, adaptive: The availability of spare parts, where the same function can be performed by identical elements, very often the same function can be performed by two different structures. When an organ can be employed to perform a certain function that is not its current central one (316- 317). Species density: Based on the nonlinearity in damage, spread the damage … larger environment are more scalable allowing the biggest to get even bigger, at the expense of the smallest… the successful killer will spread vastly more effectively (317)
Avoid over-specialization, promote optionality The organism with the largest number of secondary uses is the one that will gain the most from environmental randomness and epistemic opacity (318) Optionality – since you have the option of taking the freebie from randomness(319) Compensate complexity with simplicity (375)
Robust to error: Nothing should ever become too big to fail. What is fragile should break early, while it is small (374). Big is ugly & fragile: Mother Nature does not limit the interactions between entities; it just limits the size of the units (314)
Confine mistakes The idea is simply to let human mistakes and miscalculations remain confined and to prevent their spreading through the system (322)
Durability: Things that have worked for a long time are preferable (371) No Socialization of losses and privatization of gains (374).
No incentives without disincentives (375)
Development of critical technologies that provide system resiliency will enable future systems to adapt and recover from these unanticipated problems. …
Current technologies are not optimal for carrying out effective risk mitigation as they lack significant capability to assess system condition or to validate system performance. System robustness, redundancy and capability for rapid recovery are currently inadequate….
NASA space exploration should largely address a problem class in reliability and risk management stemming primarily from human errors, system risk and multi-objective trade-off analysis, by conducting research into system complexity, risk characterization and modeling, and system reasoning... Development activity will have to support risk analysis, design robustness, failure modeling, and system trade-offs through the entire lifecycle of the enterprise, with particular emphasis on early-phase capabilities.
Development of tools for identifying, assessing and trading risks before and during formulation…
Development of safety and risk related systems analysis tools combines two thrusts, addressing a) how risk profiles can be maintained and utilised through the fully lifecycle, and b) how system evolution affects designs.
Development of methods and tools that constitute a human learning ‘feedback’ loop. Their goal is to improve our understanding of the factors that contribute to aerospace accidents and to develop ways to use that experience to improve designs.
Sources: Nassim Nicholas Taleb, (New York: Random House, 2010), p.365; Andrew Stirling, (European Science and Technology Observatory, May 1999),
p. 17, (Science Policy Research Unit, University of Sussex, 2000), Chapter 2; “Risk, Precaution and Science; Toward a More Constructive Policy Debate,”
8:4, 2007; David A. Maluf, Yuri O. Gawdisk and David G. Bell, N.D.

56
Capturing the Value of Offshore WindAppendix A

57
Capturing the Value of Offshore Wind Appendix B
Appendix B: Market Imperfections that Suppress Investment in Offshore WindThis Appendix summarises two discussions of market failure by two major research organizations published over a decade apart. Table B-1 provides annotated references to the analysis of two research institutions I draw on to identify market imperfections and policy solutions. The institutions are dedicated to energy analysis but they generally have very different views on the need for public policy. One source is a series of papers by researchers at the Lawrence Berkeley Laboratory (LBL), who are generally supportive of government intervention in the market. The second draws from a series of papers written over a decade later by researchers at Resources for the Future (RFF), who are generally skeptical of government intervention. Despite the many years and a difference in perspective between them, they produce very similar discussions of the problem of market failure. The analyses were focused on energy efficiency as the target investment strategy, but Table B-1 extracts those arguments that are relevant to the investment in offshore wind.
Table B-1: Market Imperfections that Suppress investment in Offshore Wind
Neoclassical & Industrial Economics New Institutional & Behavioural Economics
SOCIETAL FLAWSTraditional Externalities A,1 Positive Negative Public Goods 22, a Basic research B, b Information Learning-by-doing C, c Learning-by-using DNetwork effects g
ENDEMIC IMPERFECTIONSAsymmetric Information 9 Agency 4Perverse Incentives 1Conflict of InterestInequality Physical Capital E, e
TRANSACTION COST 2Search and Information Imperfect Information G, 10 Availability Accuracy 12 Search Cost 12Bargaining Risk & Uncertainty 6, 7 Technology Marketplace Policy Financial Liability h, iEnforcement Switching costs j Sunk costs g, k, 3 Monitoring Costs
BEHAVIOURAL BASICS KCalculation Bounded rationality M, 26 Ability to process info 27 Limited understanding Heuristic Decision Making N Rules of thumb Information O Discounting E Low Probability Events Long-Term Small Outcomes
INDUSTRY STRUCTURE Imperfect Competition 28Regulatory failure 14
Sources and Notes: Numbers: Golove, William H. and Joseph H. Eto, Market Barriers to Energy Efficiency:
A Critical Reappraisal of the Rationale for Public Policies to Promote Energy Efficiency;
Capital letters are from Kenneth Gillingham, Richard G. Newell, and Karen Palmer, Energy Efficiency Economics and Policy April 2009);
Lower case letters are from Raymond J. Kopp and William A Pizer, Assessing U.S. Climate Policy Options (Washington, D.C.: November 2007)
1) Six market barriers were initially identified: 1) misplaced incentives, 2) lack of access to financing, 3) flaws in market structure, 4) mis-pricing imposed by regulation, 5) decision influenced by custom, and 6) lack of information or misinformation. Subsequently a seventh barrier, referred to as “gold plating,” was added to the taxonomy (p.9).
2) Neo-classical economics generally relies on the assumption of frictionless transactions in which no costs are associated with the transaction itself. In other words, the costs of such activities as collecting and analysing information; negotiating with potential suppliers, partners, and customers; and assuming risk are assumed to be nonexistent or insignificant. This assumption has been increasingly challenged in recent years. The insights developed through these challenges represent an important new way to evaluate aspects of various market failures (especially those associated with imperfect information). Transaction cost economics examines the implications of evidence suggesting that transaction costs are not insignificant but, in fact, constitute a primary explanation for the particular form taken by many economic institutions and contractual relations (p. 22).
3) Transaction cost economics also offers support for claims that the illiquidity of certain investments leads to higher interest rates being required by investors in those investments (p. 23).

58
Capturing the Value of Offshore WindAppendix B
4) Misplaced, or split, incentives are transactions or exchanges where the economic benefits… do not accrue to the person who [making the investment] (p. 9).
5) Thus, as the rated lifetime of equipment increases, the uncertainty and the value of future benefits will be discounted significantly. The irreversibility of most energy… investments is said to increase the cost of such investments because secondary markets do not exist or are not well-developed for most types of efficient equipment. This argument contends that illiquidity results in an option value to delaying investment…, which multiplies the necessary return from such investments (p. 16)
6) It… should reduce the risk to the lender (by improving the borrower’s net cash flow, one component of credit-worthiness, and should, but does not, reduce the interest rate, according to the proponents of the theory of market barriers. (p.10).
6a) Potential investors, it is argued, will increase their discount rates to account for this uncertainty or risk because they are unable to diversify it away. The capital asset pricing model (CAPM) is invoked to make this point (p. 16).
7) Perfect information includes knowledge of the future, including, for example, future energy prices. Because the future is unknowable, uncertainty and risk are imposed on many transactions. The extent to which these unresolvable uncertainties affect the value of energy [investment] is one of the central questions in the market barriers debate. Of course, inability to predict the future is not unique to energy service markets. What is unique is the inability to diversify the risks associated with future uncertainty to the same extent that is available in other markets (p. 20).
9) Finally, Williamson (1985) argues that the key issue surrounding information is not its public goods character, but rather its asymmetric distribution combined with the tendency of those who have it to use it opportunistically (p. 23).
10) [K]nowledge of current and future prices, technological options and developments, and all other factors that might influence the economics of a particular investment. Economists acknowledge that these conditions are frequently not and in some cases can never be met. A series of information market failures have been identified as inhibiting investments in energy efficiency: (1) the lack of information, (2) the cost of information, (3) the accuracy of information, and (4) the ability to use or act upon information (p. 20).
12) Even when information is potentially available, it frequently is expensive to acquire, requiring time, money or both (p. 20).14) The regulation barrier referred to mis-pricing energy forms (such as electricity and natural gas) whose price was set administratively
by regulatory bodies (p. 11).20) Externalities refer to costs or benefits associated with a particular economic activity or transaction that do not accrue to the
participants in the activity (p. 18).22) Public goods are said to represent a market failure. It has been generally acknowledged by economists and efficiency advocates
that public good market failures affect the energy services market. (p. 19) [T]he creation of information is limited because information has public good qualities. That is, there may be limits to the creator’s ability to capture the full benefits of the sale or transfer of information, in part because of the low cost of subsequent reproduction and distribution of the information, thus reducing the incentive to create information that might otherwise have significant value (p. 20).
23) Investment in basic research in believed to be subject to this shortcoming; because the information created as a result of such research may not be protected by patent or other property right, the producer of the information may be unable to capture the value of his/her creation (p. 19).
25) The information created by the adoption of a new technology by a given firm also has the characteristics of a public good. To the extent that this information is known by competitors, the risk associated with the subsequent adoption of this same technology may be reduced, yet the value inherent in this reduced risk cannot be captured by its creator (p. 19).
26) This work is consistent with the notion of bounded rationality in economic theory. In contrast to the standard economic assumption that all decision makers are perfectly informed and have the absolute intention and ability to make decisions that maximise their own welfare, bounded rationality emphasises limitations to rational decision making that are imposed by constraints on a decision maker’s attention, resources, and ability to process information. It assumes that economic actors intend to be rational, but are only able to exercise their rationality to a limited extent (p.21).
27) Finally, individuals and firms are limited in their ability to use — store, retrieve, and analyse — information. Given the quantity and complexity of information pertinent to energy efficiency investment decisions, this condition has received much consideration in the market barriers debate (p. 20).
28) This barrier suggests that certain powerful firms may be able to inhibit the introduction by competitors of energy-efficient, cost-effective products (p. 10).
A) Externalities: the common theme in energy market failures is that energy prices do not reflect the true marginal social cost of energy consumption, either through environmental externalities, average cost pricing, or national security (p. 9).
B) R&D spillovers may lead to underinvestment in energy-efficient technology innovation due to the public good nature of knowledge, whereby individual firms are unable to fully capture the benefits from their innovation efforts, which instead accrue partly to other firms and consumers (p. 11).
C) Learning-by-doing (LBD) refers to the empirical observation that as cumulative production of new technologies increases, the cost of production tends to decline as the firm learns from experience how to reduce its costs (Arrow 1962). LBD may be associated with a market failure if the learning creates knowledge that spills over to other firms in the industry, lowering the costs for others without compensation.
D) Learning by Using: Positive externalities associated with learning-by-using can exist where the adopter of a new energy-efficient product creates knowledge about the product through its use, and others freely benefit from the information generated about the existence, characteristics, and performance of the product (p. 12).
E) Capital: Some purchasers of equipment may choose the less energy-efficient product due to lack of access to credit, resulting in

59
Capturing the Value of Offshore Wind Appendix B
underinvestment in energy efficiency and reflected in an implicit discount rate that is above typical market levels (p. 13). G) Lack of information and asymmetric information are often given as reasons why consumers systematically underinvest in energy
efficiency. The idea is that… lack [of] sufficient information about the difference in future operating costs… necessary to make proper investment decisions (p. 11).
J) Prices faced by consumers in electricity markets also may not reflect marginal social costs due to the common use of average-cost pricing under utility regulation. Average-cost pricing could lead to under- or overuse of electricity relative to the economic optimum (p. 10).
K) Behavioural: Systematic biases in decision making that lead to underinvestment relative to the cost-minimizing level are also often included among market barriers. (p. 8); The behavioural economics literature has drawn attention to several systematic biases in decision making that may be relevant... Similar insights can be gained from the literature on energy decision-making in psychology and sociology. The evidence that decisions are not always perfectly rational is quite strong, beginning with Tversky and Kahneman’s research indicating that both sophisticated and naïve respondents will consistently violate axioms of rational choice in certain situations (p. 15).
M) Bounded rationality suggests that consumers are rational, but face cognitive constraints in processing information that lead to deviation from rationality in certain circumstances (p. 16);
Ma) Assessing the future savings requires forming expectations of future energy prices, changes in other operating costs… Comparing these expected future cash flows to the initial cost requires discounting the future cash flows to present values (p. 3).
N) Heuristic decision-making is related closely to bounded rationality and encompasses a variety of decision strategies that differ in some critical way from conventional utility maximization in order to reduce the cognitive burden of decision-making… The salience effect may influence energy…decisions, potentially contributing to an overemphasis on the initial cost of an energy-efficient purchase, leading to an underinvestment... This may be related to evidence suggesting that decision makers are more sensitive to up-front investment costs than energy operating costs, although this evidence may also be the result of inappropriate measures of expectations of future energy use and prices (p. 17).
O) Alternatively, information problems may occur when there are behavioural failures, so that… [decision makers] are not appropriately taking future reductions in energy costs into account in making present investments in energy efficiency (p. 12).
a) Public Goods: Many technologies have competing or multiplicative (rather than additive) impact. The most compelling economics typically reside with the first abatement options in the analytical sequence… The mismatch between near-term technology investment and long-term needs is likely to be even greater in a situation where the magnitude of desired GHG reductions can be expected to increase over time. If more stringent emissions constraint will eventually be needed, society will benefit from near-term R&D to lower the cost of achieving those reductions in the future. Similarly, rationales for public support of technology demonstration projects tend to point to the… inability of private firms to capture the rewards for rewards for designing and constructing first-of-a-kind facilities. (p. 120)
(b) R&D tends to be underprovided in a competitive markets because its benefits are often widely distributed and difficult to capture by individual firms…. economics literature on R&D points to the difficulty firms face in capturing all the benefits from their investments in innovation, which tend to spill over to other technology producers and users.. (pp. 118-120);… Generic public funding for research tends to receive widespread support based on significant positive spillovers that are often associated with the generation of new knowledge. (p. 136).
(c) Another potential rationale involves spillover effects that the process of so-called “learning-by-doing” – a term that describes the tendency for production costs to fall as manufacturers gain production experience.”(p. 136)
(e) Network Effects: Network effects provide a motivation for deployment policies aimed at improving coordination and planning – and where appropriate, developing compatibility standards – in situations that involve interrelated technologies, particularly within large integrated systems (for example, energy productions, transmission, and distribution networks). Setting standards in a network context may reduce excess inertia (for example, the so-called chicken-and-egg problems with alternative fuel vehicles), while simultaneously reducing search and coordination costs, but standard scan also reduce the diversity of technology options offered and may impede innovation over time. (p. 137)
(f) Similarly, rationales for public support of technology demonstration projects tend to point to the large expense; high degree of technical, market and regulatory risk; and inability of private firms to capture the rewards for rewards for designing and constructing first-of-a-kind facilities. (p. 120)
h) “Finally, incomplete insurance markets may provide a rationale for liability protection or other policies for certain technology options (for example, long-term CO2 storage, [.137).”
(I) “The problem of private-sector under investment in technology innovation may be exacerbated in the climate context where the energy assets involved are often very-long lives and where the incentives for bringing forward new technology rest heavily on domestic and international policies rather than natural market forces… “Put another way, the development of climate-friendly technologies has little market value absent a sustained, credible government com

60
Capturing the Value of Offshore WindAppendix B
A. The LBL ApproachA 1996 paper prepared by analysts at the Lawrence Berkeley National Laboratory,62 provides a good background for this technology investment analysis. It was written in the midst of the electricity deregulation movement and was driven by a concern that “ratepayer-funded utility energy-efficiency programs are likely to change in size, scope, and nature as the deregulation process proceeds.”63 The paper “focuses on understanding to what extent some form of future intervention may be warranted and how we might judge the success of particular interventions.”64 These questions remain front and centre today. Deregulation in the electricity sector did not spread throughout the utility industry, and, in fact, in the past few years, reliance on interventions in the market to increase efficiency and renewables has grown, even in the deregulated states.65 The growth of market interventions is consistent with the conclusions in the LBL paper. “We conclude that there are compelling justifications for future energy-efficiency policies. Nevertheless, in order to succeed, they must be based on a sound understanding of the market problems they seek to correct and a realistic assessment of their likely efficacy”.66
The LBL paper identified four broad categories of factors that inhibited investments in energy efficiency – barriers, transactions costs, market failures, and behavioural (noneconomic) factors. It identifies about two-dozen specific factors spread roughly equally across these four categories. A key aspect of the analysis is to identify each of the categories as coming from a different tradition in the economic literature. The barriers category is made up of market structural factors. The market failure category is made up of externalities and imperfect competition. The LBL paper bases a substantial part of its argument on a transaction cost perspective as a critique of neo-classical economics.67 The final category is made up of behavioural factors.
B. The RFF FrameworkA more recent paper from Resources for the Future, entitled Energy Efficiency Economics and Policy, addresses exactly the same issues as the earlier LBL paper. It reviews the debate over the “efficiency gap” observed in energy markets.68 The RFF paper suggests three broad categories of market failures – the individual, the interaction between economic agents and the fit between economic agents and society. 69 I refer to these three levels as the behavioural, the market structural and the societal levels.
62 Golove and Eto, 1996, p. iv63 Golove and Eto, 1996, p. iv.64 Golove and Eto, 1996, p. iv.65 There has recently, however, been a dramatic re-commitment to publicly sponsored energy efficiency and a substantial increase
in allocated resources. Sanstad and Howarth, p. 6-5.66 Golove and Eto, 1996, p. x.67 Golove and Eto, 1996, p. 22. Neo-classical economics generally relies on the assumption of frictionless transactions in which
no costs are associated with the transaction itself. In other words, the cost of such activities as collecting and analyzing information; negotiating with potential suppliers, partners and customers; and risk are assumed to be nonexistent or insignificant. This assumption has been increasingly challenged in recent years. The insights developed through these challenges represent an important way to evaluate aspects of various market failures (especially those associated with imperfect information).
68 Gillingham, Newell, Palmer, 2009, p. 7. Much of the literature on energy efficiency focuses on elucidating the potential rationales for policy intervention and evaluating the effectiveness and cost of such interventions in practice. Within this literature there is a long-standing debate surrounding the commonly cited “energy efficiency gap...” Within the investment framework… the energy efficiency gap takes the form of under investment in energy efficiency relative to a description of the socially optimal level of energy efficiency. Such under investment is also sometimes described as an observed rate or probability of adoption of energy-efficient technologies that is “too slow.”
69 Gillingham, Newell and Palmer, 2009,p. 8.

61
Capturing the Value of Offshore Wind Appendix B
There are about a dozen specific market failures spread across these categories. Table B-1 also adds several supply-side considerations from a second RFF paper. The text to define each of the barriers is provided in Table B-1. The societal level market failures are closest to what the traditional sources of the economic literature refer to as market failure. These are primarily externalities and public goods. These were also considered market failures in the LBL framework. The LBL barriers and transaction costs fit in the category of interactions between economic agents, as would imperfect competition.
One obvious and important point is that information problems occur in all three categories of the RFF analysis, with several manifestations in each. Information can be a problem at the societal level since it can be considered a public good that is not produced because the authors of the information cannot capture the social value of information. It is a structural problem because, where it is lacking, even capable, well-motivated individuals cannot make efficient choices. Finally, information can be a structural problem where it is asymmetric, individuals can take advantage of the less informed to produce outcomes that are not efficient. It is a problem at the behavioural level where individuals lack the ability to process and use information.
LBL did not offer specific policy recommendations to address the market imperfections, but RFF did. These are included in Table B-2.
A second paper from RFF emphasises a broader range of supply-side market imperfections that affects the long-term availability of technology. These affect research, development and demonstration, in addition to deployment. Beyond the general externality issue there are a number of more discrete problems identified in the energy sector that are akin to classic externalities. Individual firms have little incentive to invest in basic research or to deploy enabling technologies because they have difficulty capturing the gains. There are investments that are necessary to support a variety of complementary investments whose value cannot be captured by individual actions. More broadly, knowledge spillovers flow from technological development in a manner that may have much greater social value than individual firms can capture. Similarly, network effects of complex energy systems may create social values that exceed the private value of individual actions. The challenge of large or complex projects can pose problems. In complex systems developing and deploying new technologies in response to policy mandates, assessing and assigning liability and providing insurance may be a great challenge.
Individuals or firms can be expected to make private calculations that minimise their direct cost, but they cannot be expected to figure the benefits of avoiding the impact of more expensive alternatives down the road, costs that have broader impacts, particularly when the options impose high costs on a dispersed set of individuals. Cost compression and learning/innovation resulting from economies of scale is a benefit that policy may promote where individuals cannot.
C. Sources of Inertia in the Development of AlternativesIn the discussion in text, attention was focused on processes and factor that inhibit the shift of investment and innovation to the newer alternatives. A long period in which the carbon externality was not internalised has created a large market in the use of fossil fuels which is the focal point of resources and investment and will be the focal point of innovative activity. Since the alternative technologies are at a disadvantage in terms of development and the ability to attract resources, just raising the cost of the dominant fuels does not overcome the inertia and actually allows the gap between the incumbent and alternative technologies to persist or even grow.

62
Capturing the Value of Offshore WindAppendix B
Table B-2: Market Imperfections and Policy Responses
Type of Imperfection Specific Imperfection Potential Policy Options
Societal
Environmental Externalities Energy Security Public GoodsInnovation market failures R& D underinvestment Learning-by-doing spillovers Learning-by-using Network Effect
Emissions pricing (tax, cap and trade)Energy Taxation; strategic reservesPublic Funding
R&D tax credit; public fundingIncentives for early adoptionInformation programStandards
Endemic
Capital Market Failures Liquidity constraintsInformation problemsAsymmetric info. > Adverse selectionPrincipal-agent problems
Finance/Loan ProgramsInformation programsInformation programsInformation programs
Transaction Lack of Information Information Programs
Costs Asset livesIncomplete Market
Structure Scale economies Investment horizon
Regulatory Policy Average-cost electricity pricing`
Uncertainty Liability
Real-time pricing; market pricing
Behavioural Prospect theory Bounded rationalityHeuristic decision makingInformation
Education, information, product Stds.Education, information, product Stds.Education, information, product Stds.Education, information, product Stds
Sources and Notes: Kenneth Gillingham, Richard G. Newell, and Karen Palmer, Energy Efficiency Economics and Policy April 2009);
Letters: Raymond J. Kopp and William A Pizer, Assessing U.S. Climate Policy Options (Washington, D.C.: November 2007)
The inertia can be compounded by several other factors including monopolistic distortions in the incumbent market, a lack of substitutability between the alternatives and limited spillovers from innovation in the incumbent technology. With an exhaustible resource the problem can be particularly acute, as a tendency to underestimate the long term consequences of continuing dependence on it are not fully reflected in current decision making.
A 2004 report to the California Energy Commission from the Lawrence Berkeley National Laboratory captures much of the above discussion of market failure in the form of technology penetration frontiers (see Figure B-1). The output variable is the reduction of greenhouse gas emissions. I have preserved the labels from the original, but added in some of the specific factors the analysis cites in its case studies. The graph shows the penetration of energy efficiency technologies along the X-axis and cost of carbon along the Y-axis.

63
Capturing the Value of Off shore Wind Appendix B
Figure B-1: Market Imperfections Shift the Investment/Adoption Frontier Leading to Under Investment, Lower Adoption and Reductions in Social Welfare
StructureEndemicTransactionBehaviourOptimal Level
SocialValue
Investement/Deployment/Adoption
Reduction in Total Social Welfare
Societal Actual
Optimal Level
Source: Based on Jayant Sathaye and Scott Murtishaw, Market Failures, Consumer Preferences, and Transaction Costs in Energy Effi ciency Purchase Decisions
(California Energy Commission, 2004), p. 11.
At the extreme right is the maximum technical potential reduction in carbon achievable with the penetration of available technology. The level of reduction in carbon that is achieved in the marketplace is lower than the theoretical potential because several factors keep the technologies from penetrating the market. The exhibit identifi es all of the major categories of market imperfections, barriers, obstacles, etc. discussed above – behavioural factors (social, cultural & institutional), economic factors and transaction costs – each of which establishes a diff erent technology frontier. Technological change and public policy play an important role in determining where the market will settle along a given frontier, as well as infl uencing where the technological limit is. Thus, this presentation summarises the market structure analysis presented in Table B-1 in a technology investment framework.

64
Capturing the Value of Offshore WindAppendix B

65
Capturing the Value of Offshore Wind Bibliography
BibliographyAbdelhamid, Mohamed Ben, Chakar Aloui and Corinne Chaton, 2009, A Real Option Approach to Investing in the First Nuclear Power Plant Under Cost Uncertainty: Comparison with Natural Gas Power Plant for the Tunisian Case, International Journal of Oil, Gas and Coal Technology, 2:1
Acemoglu, Daron, et al., 2012, “The Environment and Dedicated Technical Change,” American Economic Review, 102(1),
Alleman, Glenn, B., 2008, Five Easy Pieces of Risk Management, May 8
Allen, Stephen John, 2003, Towards a Non-Aristotelian Epistemology of Science, A Review of General Semantics, 60:3
ARUP, 2011, Review of Generation Cost and Deployment Potential of Renewable Electricity Technologies in the UK
Avant, Roger, 2011, “Creating the Clean Economy,” The Economist, June 11.
Awerbuch, Shimon, 1993, The Surprising Role of Risk in Utility Integrated Resource Planning, Electricity Journal, 6
Awerbuch, Shimon, 1995, Market-based IRP: It’s Easy, Electricity Journal, 8
Awerbuch, Shimon, 2000, Getting it Right: The Real Cost Impacts of a Renewables Portfolio Standard, Public Utilities Fortnightly, February 15
Awerbuch, Shimon and Martin Berger, 2003, Applying Portfolio Theory to EU Electricity Planning and Policy-Making, IEA/EET Working Paper, February
Awerbuch, Shimon, 2004, Portfolio-Based Electricity Generation Planning, REEP
Awerbuch, Simon, 2005, The Role of Wind in Enhancing UK Energy Diversity and Security, February 2
Awerbuch, Shimon, 2006, A Risk Adjusted Approach to Estimating the Cost of Electricity From Fossils and Renewable Resources, Estimating Electricity Generating Costs: A CPM Approach, Chapter 1, May 5
Awerbuch, Simon, 2006a, The Role of Wind in Enhancing Scotland’s Energy Diversity and Security, Scottish Parliament, January
Awerbuch, Shimon, 2006, Portfolio-based electricity Generation Planning: Policy Implications for Renewables and Energy Security, Mitigation and Adaptation Strategies for Global Change, 11
Awerbuch Shimon and Spencer Yang, 2007, Efficient Electricity Portfolios For Europe: Maximising Energy Security And Climate Change Mitigation, European Investment Papers, 12
Awerbuch and Spencer Yang, 2008, “Using Portfolio Theory to Value Power Generation Investments” in Bazillian and Roques (Eds.), Analytic Methods for Energy Diversity and Security, Elsevier
Bates, Jason T. and Michael P. Young,2008,, Applying Fuzzy Logic to Medical Decision Making in the Intensive Care Unit, Am. J. Respir. Crit. Care Med. 167 (7)
Benarock, Michel, et al., 2006, Real Options in IT Risk Management, MIS Quarterly,
Benhamou, Franciouse, Renato, G. Flores, Jr. and Stephanie Peltier, Diversity Analysis in Cultural Economic: Theoretical and Empirical Considerations, Granem, September
Bergeson, J.A. and L.B. Lave, 2007, Base Load Coal Investment Decisions under Uncertain Carbon Legislation, Environmental Science & Technology, 4
Berry David, 2005, Renewable Energy as a Natural Gas Price Hedge: The Case of Wind, Energy Policy, 33
Binz, Ron, et al., 2012, Practicing Risk-Aware Electricity Regulation, 2012
Black & Veatch, 2007, 20 Percent Wind Energy Penetration in the United States, Walnut Creek
Bland, Eric, 2010, Fog of War Demystified by Financial ‘Power Law,’ Discovery News, January 7.
Blyth, William, et al., 2007, Investment Risk under Uncertain Climate Change Policy, Energy Policy, 35

66
Capturing the Value of Offshore WindBibliography
Bolinger, Mark, et al, 2004, Accounting of Fuel Price Risk When Comparing Renewable to Gas-Fired Generation: The Role of Forward Natural Gas Prices, LBNL
Bolinger, Mark, et. al, 2002, Quantifying the Value that Wind Power Provides as a Hedge Against Volatile Natural Gas Prices, LBNL
Boonin, David Magnus, N.D., Reinventing the Crystal Ball: Assessing Uncertainty in Utility Resource Proposals, ElectricityPolcy.com
Breakthrough Journal, Yale Environment 360 Debate,
California Energy Commission, 2010, Cost of Central Station Generation, January
Campden, Alan D.., 2010, Cyberspace Spawns a New Fog of War, SIGNAL Magazine,
Canina, Osvaldo Peunha, 2007, The Fog of War and Friction in the Current Conflicts: Fundamental Aspects of the Management of Modern Conflicts, Passadico
Carlson, J. Lon, et al, 2010, An Assessment of the Economic Impact of the Wind Turbine Supply Chain in Illinois, Electricity Journal, 23
Cebr, 2012, The Macroeconomic Benefits of the UK’s Plans for Investment in Offshore Wind, June.
Chatterjee, Dhiman and V.C. Ramseh, 1999, Real Options for Risk Management in Information Technology Projects, 32nd Hawaii International Conference on System Sciences
Chernik, Paul and Emily Caverhill, 1989, The Valuation of Externalities from Energy Production, Delivery and Use, Fall
Cohen, Linda R., 2008, Investment, Risks and Policy Innovation in the Electricity Supply Sector, EIA Workshop on consumer and Investor Decision-Making and the Use of Expectation, January 23
Cooper, Mark, 2005, “Too Much Deregulation or Not Enough,” Natural Gas and Electricity, June
Cooper Mark, 2009, The Economics of Nuclear Reactors: Renaissance of Relapse, Institute for Energy and the Environment, Vermont Law School, June 2009
Cooper, Mark, 2010, Policy Challenges of Nuclear Reactor Construction, Cost Escalation and Crowding Out Alternatives: Lessons from the U.S. and France for the Effort to Revive the U.S. Industry with Loan Guarantees and Tax Subsidies, Institute for Energy and the Environment, Vermont Law School September.
Cooper Mark, 2011, Least-Cost Planning For 21st Century Electricity Supply Meeting the Challenges of Complexity and Ambiguity in Decision Making, Mid-America Regulatory Utility Conference
Cooper, Mark, 2011a, “Prudent Resource Acquisition in a Complex Decision Making Environment: Multidimensional Analysis Highlights the Superiority of Efficiency,” Current Approaches to Integrated Resource Planning, 2011 ACEEE National Conference on Energy Efficiency as a Resource, Denver, September 26
Cooper Mark, 2011b, Nuclear liability: The market-based, post-Fukushima case for ending Price-Anderson, Bulletin of the Atomic Scientists, October
Cooper, Mark, 2012, Nuclear Safety and Nuclear Economics, Fukushima Reignites the Never Ending Debate, Symposium on the Future of Nuclear Power, University of Pittsburgh, March 27-28,
Cooper, Mark, 2012a; Nuclear safety and affordable reactors: Can we have both? Bulletin of the Atomic Scientists, July-August
Costello, Ken, 2002, Regulatory Questions on Hedging: The Case of Natural Gas, Electricity Journal, 15
Costello, Ken, 2004, Increased Dependence on Natural Gas for Electric Generation: Meeting the Challenge, Electricity Journal, 17
Costello, Ken, 2005, Making the Most of Alternative Generation Technologies: A Perspective on Fuel Diversity, NRRI, March

67
Capturing the Value of Offshore Wind Bibliography
Costello, Ken, 2007, Diversity of Generation Technologies: Implications for Decision making and Public Policy, Electricity Journal, 20
Costello, Ken, 2010, How Regulators Should Use Natural Gas Price Forecasts, Electricity Journal, 23
DeCesaro, Jennifer, et al, 2009, Wind Energy and Power System Operations: A Review of Wind Integration Studies to Date, Electricity Journal, 22
Delarue, Erik, et al., 2011, Applying Portfolio Theory to the Electricity Sector: Energy versus Power, Energy Economics, 33
De Meyer, Arnoud De Meyer, Christoph H. Lock and Michel Pitch, 2002, Managing Project Uncertainty: From Variation to Chaos, MIT Sloan Management Review, Winter
Dery, David, “Fuzzy Control,” Journal of Public Administration Research and Theory, 12 (2)
DB Climate Change Advisors, 2010, Natural Gas and Renewables: A Secure Low Carbon Future Energy Plan for the United States, Deutche Bank
Duncan, Robert B., 1972, Characteristics of Organizational Environments and Perceived Environmental Uncertainty, Administrative Science Quarterly, 17
Electricity Journal, 2010, Nuclear Cost: Clouded, but Rising, Electricity Journal, 23
Electricity Journal, 2010, Unanticipated Outcome? Wind Gains are Proving to be Natural Gas Loss, Electricity Journal, 23
Electricity Journal, 2010, So How Much Will it Cost to Build a Nuke?, Electricity Journal, 23
Electricity Journal, 2010, Integrating Renewables Moves to Center Stage, Electricity Journal, 23
Electricity Journal, 2009, CCS is Looking More Expensive than Hoped, Electricity Journal, 22
Electricity Journal, 2009, Do Alternative Energy Subsidies Create Jobs or Destroy Them? The Debate Intensifies, Electricity Journal, 22
Electricity Journal, 2009, What if the Economy Rebounds, But Consumer Demand Doesn’t, Electricity Journal, 22
Electricity Journal, 2009, Unconventional Gas: Truly a Game Changer?, Electricity Journal, 22
European Investment Bank, 2007, An Efficient, Sustainable and Secure Supply of Energy for Europe,
Energy Information Administration, 2009, Impacts of a 25-Percent Renewable Electricity Standard as Proposed in the American Clean Energy And Security Act Discussion Draft
Energy Information Administration, 2008, 20% Wind Energy by 2030, July
Ernst & Young, 2012, Analysis Of The Value Creation Potential Of Wind Energy Policies, July
Feldman, Marvin, Diversity and Risk analysis in a Restructured California Electricity Market, October 20
Fischer, Carolyn, 2010, Renewable Portfolio Standards: When Do They Lower Energy Prices?, The Energy Journal, 31
Fleten, S.E. and E. Nasakakalia, 2010, Gas-Fired Power Plants: Investment Timing, Operating Flexibility and CO2 Capture, Energy Economics
Frayer, Julia and Nazil Z. Uludere, 2001, What is it Worth, Application of Real Options Theory to the Valuation of Generation Assets, Electricity Journal, 14
Fuss, s., et al, 2009, Impact of Climate Policy Uncertainty on the Adoption of Electricity Generating Technologies, Energy Policy, 37
Galvani, Valentina and Andre Plourde, 2010, Portfolio Diversification in Energy Markets, Energy Economics, 32
Gardner, Doug and Yiping Zhuang, 2000, Valuation of Power Generation Assets: A Real Options Approach ALGO Research Q., 3.

68
Capturing the Value of Offshore WindBibliography
Gerlagh, Reyer, Snorre Kvoerndokk, and Knute Einar Rosendahl, “Optimal Timing of clime Change Policy: Interaction Between Carbon Taxes and Innovation Externalities.
Gillingham, Kenneth, Richard G. Newell, and Karen Palmer, 2009, Energy Efficiency Economics and Policy (Resources for the Future, April
Goddard, Wilson B.,1997, A Comparative Study of the Total Environmental Costs Associated with Electrical Generation Systems , G&GE Applied Research
Goeschi, Timo and Grischa Perino, 2009, On Backstops and Boomerangs: Environmental R&D Under Technological Uncertainty, Energy Economics, 32
Golove, William H. and Joseph H. Eto, 1996, Market Barriers to Energy Efficiency: A Critical Reappraisal of the Rationale for Public Policies to Promote Energy Efficiency.
Goyol, Madhu, Jie Lu, and Guang Zang, 2008, “Decision Making in Multi-Issue E-market Auctioning Using Fuzzy Techniques and Negotiable Attitudes,” Journal of Theoretical and Applied Electronic Commerce Research (3(2)
Graves, Frank and Julia Litinova, 2009, Hedging Effects of Wind on Retail Electric Supply Costs, Electricity Journal, 22
Green, Richard and Nicholas Vasilakos, 2011, The Economics of Offshore Wind, Energy Policy, 39
Gross, Robert, et al, 2010, Risks, Revenues and Investment in Electricity Generation: Why Policy Needs to Look Beyond Costs, Energy Economics, 32
Grubb, Michael, Thierry Chapuis and Minh Ha Duong, 1995, The Economics of Changing Course: Implications of Adaptability and Inertia for Optimal Climate Policy,
Grubb, Michael, Lucy Butler and Paul Twomey, 2006, Diversity and Security in UK Electricity Generation, Energy Policy, 34
Hand, M. et al, 2008, Power System Modeling of 20% Wind-Generated Electricity by 2030, NREL
Hand, Thomas J., 2001, Using Real Options for Policy Analysis, National Energy Technology Laboratory, November 9.
Hansen, Philip and Frank Graves, 2007, Utility Supply Portfolio Diversity Requirements, Electricity Journal, 20
Harrington, Cheryl, et al, 2002, Portfolio Management: Looking after the Interests of Ordinary Customers in an Electric Market that Isn’t Working Very Well, Regulatory Assistance Project
Hassett, 1993, Energy Conservation Investment, Energy Policy, 21
Hempling, Scott 2011, A Guide for Ontario Energy Policy Makers: Multi-Criteria Design Analysis to Develop Sound Energy Policy & Promote Green Energy,
Heydart, Somayeh, et al, 2010, Real Option Analysis of Investment in Carbon Capture and Sequestration Technology, Computational Management Science, 10
Hiouska, Jaroslava et al., 2002, Real Option Models and Electricity Portfolio Management, OSCOGEN
Hohmeyer, Olave, 1988, Social Costs of Energy Consumption: External Effects of Electricity Generation in the Federal Republic of Germany (Berlin: Springer-Verlag
Holcombe, Ronald G. and Russell S. Sobel, 2000, Consumption Externalities and Economic Welfare, Eastern Economic Journal, 26
Holt, Lynne, et al., 2010, Nuclear Power Expansion: Thinking About Uncertainty, Electricity Journal, 23
Ilkilic, Cumali, et al., 2011, The Current Status of Wind Energy in Turkey and in the World, Energy Policy, 39
IPRR, Institutte for Public Policy Research, 2012, Beyond the Bluster: Why Wind Poer is and Effective Technology, August
Ishii, Jun and Jingming Yan, 2004, Investment under Regulatory Uncertainty: U.S. Electricity Generation Investment Since 1996, UCEI

69
Capturing the Value of Offshore Wind Bibliography
Jansen, J.C., L.W. M. Beurskens, and X, van Tilburg, 2006, Application of Portfolio Analysis to the Dutch Generating Mix, ECN, February
Janson, Peter Mark and Richard A. Michelfelder, 2008, Integrating Renewables into the U.S. Grid: Is it Sustainable, Electricity Journal, 21
Johnstone, Nick and Ivan Hascic, Directing Technological Change while Reducing the Risk of (not) Picking Winners: The Case of Renewable Energy, OECD Environmental Directorate
Jovanocic Boyan and Peter L. Rousseau, “General Purpose Technologies,” in P. Aghion and S. N. Durlhauf (Eds.) Handbook of Economic Growth, 2005, and Rousseau, 2005
Kahn, Edward, 2011, Wind Integration Studies: Optimization v. Stimulation, Electricity Journal, 23
Kahn, Alfred E., 1988, The Economics of Regulation: Principles and Institutions, Cambridge: MIT Press
Kennett, Ron S. and Charles S. Tapiero, 2009, Quality, Risk and the Taleb quadrants, Quality and Productive Research Conference/ Reliability Assessment and Verification Session, June 3-5
Kettunen, et al, 2011, Investment Propensities under Carbon Policy Uncertainty, Energy Journal, 32
Kiesendorf, Mark, 2010, Comparing the Economics of Nuclear and Renewable Sources of Electricity, Institute of Environmental Studies, Solar 2010, AUSES Annual Conference, December
Kiesling, Eugenia, C, 2001, On War Without the Fog, Military Review, September-October
Kitasei, Saya, 2010, Powering the Low-Carbon Economy, Worldwatch Report 184
Kopp, Raymond J. and William A Pizer, 2007, Assessing U.S. Climate Policy Options Washington, D.C.: November
Kumbaroglu, Gurkan, et al, 2005, A Real Option Evaluation Model for the Diffusion Prospects of New Renewable Power Generation Technologies, CEPE, Working Paper No. 35.
Maluf, David A. Maluf, Yuri O. Gawdisk and David G. Bell, N.D., On Space Exploration and Human Error: A Paper on Reliability and Safety
McLohglin, Eoin and Morgan Bazilian, 2006, Application of Portfolio Analysis to the Irish Generating Mix in 2020, Sustainable Energy Ireland, June
Moller, Christopher, et al., 2011, Balancing Energy Strategies in Electric Portfolio Management, Energy Economics, 33
Morris, Errol, 2010, The Anosognosic’s Dilemma: something is Wrong but You’llNever Know What It Is, New York times, June
Mosey, Gail and Laura Vimmerstedt, 2009, Renewable Electricity Benefits Quantification Methodology, NREL
Mott MacDonald, 2010, UK Electricity Generation: Cost Update
Mott MacDonald, 2011, Cost of Low Carbon Generation Technologies
Murto, Pauli and Gjermund Nese, 2002, Input Price Risk and Optimal Timing of Energy Investment: Choice Between Fossil and Biofuels, System Analysis Laboratory, Helsinki University of Technology
NARUC, 2006, Energy Portfolio Management: Tools & Resources for State Public Utility Commissions, 2006
North, Douglass, C., 1990, Institutions, Institutional Change and Economic Performance
North, Douglass, C., 1993, Lecture to the memory of Alfred Nobel, Economic Performance through Time, December 9
North, Douglass, C., 2005, Understanding the Process of Economic Change, Princeton University Press
Offshore Valuation Group, 2010, The Offshore Valuation, Public Interest Research Centre
Office of Ohio consumers’ Council, 2006, Integrate Portfolio Management in a Restructured Supply Market
Ottinger, Richard et. al.,1990, Pace University Center for Environmental Legal Studies, Environmental Costs of Electricity, New York,: Oceana

70
Capturing the Value of Offshore WindBibliography
Parson Brinckerhoff, 2011, Electricity Generation Cost Model – 2011 Update Revision 1
Patinio-Etchevaria, D., 2007, Should a Coal Fired Power Plant be Replaced or Retrofitted, Environmental Science & Technology
Pich, Michael T., Christoph H. Loch, and Arnoud De Meyer, 2002, On Uncertainty, Ambiguity, and Complexity in Project Management, Management Science 48
Pivlak, Alex, 2008, The Economic Value of Wind, Electricity Journal, 21
Puga, J. Nicolas, 2010, The Importance of Combined Cycle Generating Plants in Integrating Large Levels of Wind Power Generation, Electricity Journal, 23
Qadrdan, Meysam, et al., 2010, Impact of a Large Penetration of Wind Generation on the GB Gas Network, Energy Policy, 38
Reedman, L et al., 2006, Using a Real Option Approach to Model Technology Adoption under Carbon Price Uncertainty, Economic Record, 82
Reuters, 2012 “UK Nuclear Build Requires Taxpayer Rescue – CITI, 8 May
Reuters, 2012a, PM Backs ‘Virtual Power Station’ Scheme 21 September
Ristuccia, Cristian Andrea and Solomos Solomou, 2010, General Purpose Technologies and Economic Growth: Electricity Diffusion in the Manufacturing Sector Before WWII, CWPE 1048, September
Roques, F.A., et al, 2006, Nuclear Power: A Hedge Against Uncertain Gas and Carbon Prices, Energy Journal, 28
Roques, Fabien, A, et al., 2006, Fuel Mix Diversification Incentives in Liberalised Electricity Market: A Mean-Variance Portfolio Theory
Roques, Fabien, A., 2008, Analytic Approaches to Quantify and Value Fuel Mix Diversity, July
Roques, Fabien, et al., 2009, Optimal Wind Power Deployment in Europe - A Portfolio Approach, Energy Policy, 38
Rothwell, G., 2006, A Real Option Approach to Evaluating New Nuclear Power Plants, Energy Journal, 28
Salmeron, Jose L., 2009, “Supporting Decision Makers with Fuzzy Cognitive Maps,” Research Technology Management, 52(3).
Sanstad, Alan H. and Richard B. Howarth, 1994, “’Normal Markets, Market Imperfections and Energy Efficiency,” Energy Policy, 22
Sathaye, Jayant and Scott Murtishaw, 2004, Market Failures, Consumer Preferences, And Transaction Costs In Energy Efficiency Purchase Decisions, November
Schrader, Stephen Schrader, William M. Riggs and Robert P. Smith, 1993, Choice over Uncertainty and Ambiguity in Technical Problem Solving, Alfred Sloan School of Management, Working Paper #3533-93-BPS, February 1993.
Shuman, Michael and Ralph Cavanagh,1982, A Model of Conservation and Electric Power Plan for the Pacific Northwest: Appendix 2: Environmental Costs (Seattle, WA: Northwest Conservation Act coalition, November 1982
Siclari, Michael and Giuseppe Castellacci, N.D, Real Options for Flexible Power Generation Modeling, Energy Risk International
Siddiiqui, Afzal and Stein-Erik Fleten, 2010, How to Proceed with Competing Alternative Energy Technologies: A Real Options Analysis, Energy Economics, 32
Skea, Jim, 2010, Valuing Diversity in Energy Supply, Energy Policy, 38
Smith, Charles, et al., 2010, Grid Impacts of Wind Power Variability: Recent Assessments from a Variety of Utilities in the United States, NREL
Springer, Urs, 2002, Quantifying Risks and Risk Correlations of Investment in Climate Mitigation, IWOE, October
Stanley, Roya, 2003, Natural Gas: Acquisition and Response, NREL
Stirling, Andrew, 1994, Diversity and Ignorance in Electricity Supply Investment, Energy Policy, March

71
Capturing the Value of Offshore Wind Bibliography
Stirling, Andrew, 1999, On Science and Precaution in the Management of Technological Risk, European Science and Technology Observatory, May
Stirling, Andrew, 2000, On the Economics and Analysis of Diversity, University of Sussex, SPRU, Paper No. 28.
Stirling, Andrew, 2001, “Science and Precaution in the Appraisal of Electricity Supply,” Journal of Hazardous Material, 86
Stirling, Andrew, 2006, Analysis, Participation and Power, Land Use Policy
Stirling, Andrew, 2007, Risk, Precaution and Science: Towards a More constructive Policy Debate, EMBO Reports, 8
Stirling, Andrew, 2007a, A General Framework for Analyzing Diversity in Science, Technology and Society, Interface, Journal of the Royal Society, 4
Stirling, Andrew, 2010, Multicriteria Diversity Analysis; A Novel Heuristic Framework for Appraising energy Portfolios, Energy Policy, 38
Sustainable Energy Advantage, 2003, Using Wind Power to Hedge Volatile Electricity Prices for Commercial and Industrial Customers in New York, NYSERDA, May 14
Synapse, 2006, Energy Portfolio Management: Tools & Resources for State Public Utility Commissions, NARUC
Szolgayova, J.S. and M. Obersteiner, 2008, Assessing the Effects of CO2 Price Caps on electricity Investment -- A Real Options Solutions, Energy Policy, 36
Taleb, Nassim 2007, The Black Swan, New York: Random House
Taleb, Nassim Nicholas, 2008, “The Fourth Quadrant: A Map of the Limits of Statistics,” Edge: The Third culture,
Taleb, Nassim 2010, The Black Swan (New York: Random House)
Tennessee Valley Authority, 2011 TVA’s Environmental and Energy Future
U.S. Department of Energy, 2010, 2009 Wind Technologies Market Report
U.S Congressional Office of Technology Assessment, 1994, Studies of the Environmental Costs of Electricity (Washington, D.C. September
Venetsanos, Knostantinos, et al., 2002, Renewable Energy Sources Project Appraisal Under Uncertainty: The Case of Wind Energy Exploitation within a Changing Energy Market Environment, Energy Policy, 30
Verrastro, Frank and Conor Branch, 2010, Developing America’s Unconventional Gas Resources: Benefits and Challenges, CSIS
Wiser, Ryan, et al., 2005, Easing the Natural Gas Crisis: Reducing Natural Gas Prices through Increased Deployment of Renewable Energy and Efficiency, LBNL
Yang, M., et al., 2008, Evaluating the Power Investment Options with Uncertainty in Climate Policy Energy Economics, 30
Yoshizawa, Go, Andy Stirling and Tatsujiro Suzuki, 2009,”Electricity System Diversity in the UK and Japan - A Multi-criteria Diversity Analysis,” University of Sussex, SEWPS, Paper No. 176.
Zadeh, L. A., 1965. Fuzzy sets. Inf. and Control 8: 338–353.
Zadeh, L. A., 1968. Fuzzy logic, IEEE Computer 21(4): 83–93.

Mainstream Renewable Power11th Floor, 140 London Wall,London EC2Y 5DN, [email protected]