Embed Size (px)
Citation preview
CAPTIVE MODEL TESTI�G FOR SHIP-TO-SHIP OPERATIO�S
Evert LATAIRE (Ghent University, Belgium)
Marc VA�TORRE (Ghent University, Belgium)
Guillaume DELEFORTRIE (Flanders Hydraulics Research, Belgium)
In the frame of the research project entitled “Investigating Hydrodynamic Aspects and Control Strategies for
Ship-to-Ship Operations” [1], co-ordinated by MARINTEK (Trondheim, Norway) and supported financially by
the Research Council of Norway, a captive model test program has been carried out at the Towing Tank for
Manoeuvres in Shallow Water (co-operation Flanders Hydraulics Research – Ghent University) in Antwerp,
Belgium. The present paper will give an overview of the entire model test program. For a limited amount of tests
all measured data will be made available, free to use.
1. INTRODUCTION
Through their large capacity, very (VLCC) and ultra
(ULCC) large crude carriers offer the advantage to
transport huge quantities of crude oil per voyage,
which reduces the transport cost considerably. On the
other hand, they suffer from different disadvantages
such as the limited access to harbours due to their
size or governmental restrictions that want to
preserve the safety and environment in coastal areas.
To unload the cargo in harbours it must be transferred
to smaller service ships, with a typical capacity of
100,000 ton. This operation, called lightering,
typically takes place in open sea and at a certain
ahead speed. The application of ship-to-ship
operations for liquid cargo transfer, will be increasing
in the future, not only for crude oil, but also for
liquefied natural gas (LNG). Moreover, such
operations are expected to take place in more severe
environmental conditions.
The main objective of the research project entitled
“Investigating Hydrodynamic Aspects and Control
Strategies for Ship-to-Ship Operations” is to improve
existing simulator based training activities for crews,
mooring masters and other experts involved in
complex ship-to-ship operations in open seas through
increased knowledge and understanding of the
complex water flow between two ships operating in
close proximity. As a final goal, a new generation
simulation tools for ship-to-ship operations
incorporating up-to-date knowledge of fluid
dynamics has to be established. The research project
consists of four work packages: Computational Fluid
Dynamics (CFD); Particle Image Velocimetry (PIV);
Mathematical models for simulators; and Nautical
safety and control aspects.
In the frame of the third work package, captive
model tests have been carried out at the Towing Tank
for Manoeuvres in Shallow Water (co-operation
Flanders Hydraulics Research – Ghent University) in
Antwerp, Belgium. The model of an Aframax tanker
is attached to the computer controlled planar motion
carriage and a VLCC model is attached to the main
carriage of this mechanism. Two types of tests are
considered: steady state tests, during which the main
tests parameters (ships’ speed, relative longitudinal
and lateral position, propeller rates, drift angle of the
Aframax tanker, rudder angle) are kept constant, and
dynamic tests, characterised by a varying rudder
angle, lateral distance and/or heading. Horizontal
forces and moments, propeller thrust and torque, and
vertical motions are measured on both ship models,
while the vertical motions of the free surface are
monitored at three fixed points in the towing tank.
For five steady state tests and one dynamic test the
measured data will be made available. This data
contains all measurements of forces, moments and
motions on both models and includes the registered
wave pattern by all three wave gauges.
2. TEST PROGRAM
2.1 Test facilities
At present the shallow water towing tank, with main
dimensions 88 x 7 x 0.5 m³, is equipped with a planar
motion carriage, a wave generator and an auxiliary
carriage for ship-to-ship interaction tests for ships at
different forward speeds. Thanks to full computer
control, the facilities are operated in an unmanned
way, so experimental programs are running day and
night, 7 days a week. An average of 35 tests a day
can be carried out.
One ship model is connected to the carriage by
means of a mechanism which allows free heave and
pitch; roll can be restrained or free. In the horizontal
plane, a rigid connection is provided. The three
horizontal motion modes, the wave generator,
rudders, propulsions, the auxiliary carriage and other
external devices are controlled by a PC and six
DIOCs (Direct Input Output Control). The DIOCs
also assure the sampling of the analogue input
signals.
A secondary beam is added to the main carriage of
the towing tank to be able to perform ship-to-ship
interaction tests for ships with a zero longitudinal
speed difference. This secondary beam is a
construction of Rose+Krieger profiles with a length
of 6.0 m in the longitudinal direction of the tank. The
second ship model is connected to this secondary
beam in two points by means of a system of rods and
hinges that allows heave and trim. Both connection
points are equipped with longitudinal and lateral
force gauges; principally the longitudinal force
between the carriage and the ship model applies in
the most forward connection point only. This setup is
shown in Figure 1.
Figure 1 Schematic setup of the connection ship -
secondary beam
The transversal position of the ship attached to the
secondary beam can be adjusted manually over a
range of about 3.00m. During this project the
position of the centre line of this ship is fixed at
1.007m out of the centre of the towing tank. The
vertical position can be changed so the connection
blocks do not induce forces on the model at different
combinations of water depth and draft.
2.2 Ship models
Two ship models have been used: a model of a
VLCC and an Aframax tanker, both on a scale of
1/75.
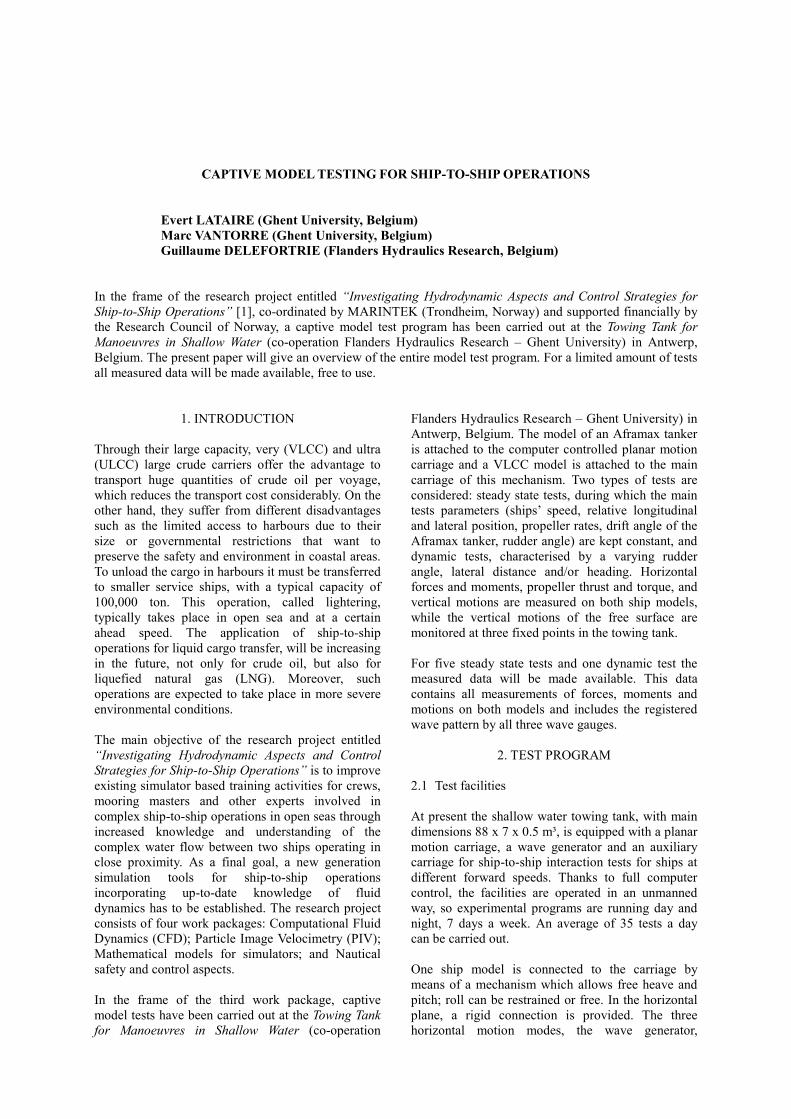
Figure 2 Shallow water towing tank (empty) at
Flanders Hydraulics Research with secondary beam
Figure 3 STBL model being prepared for tests
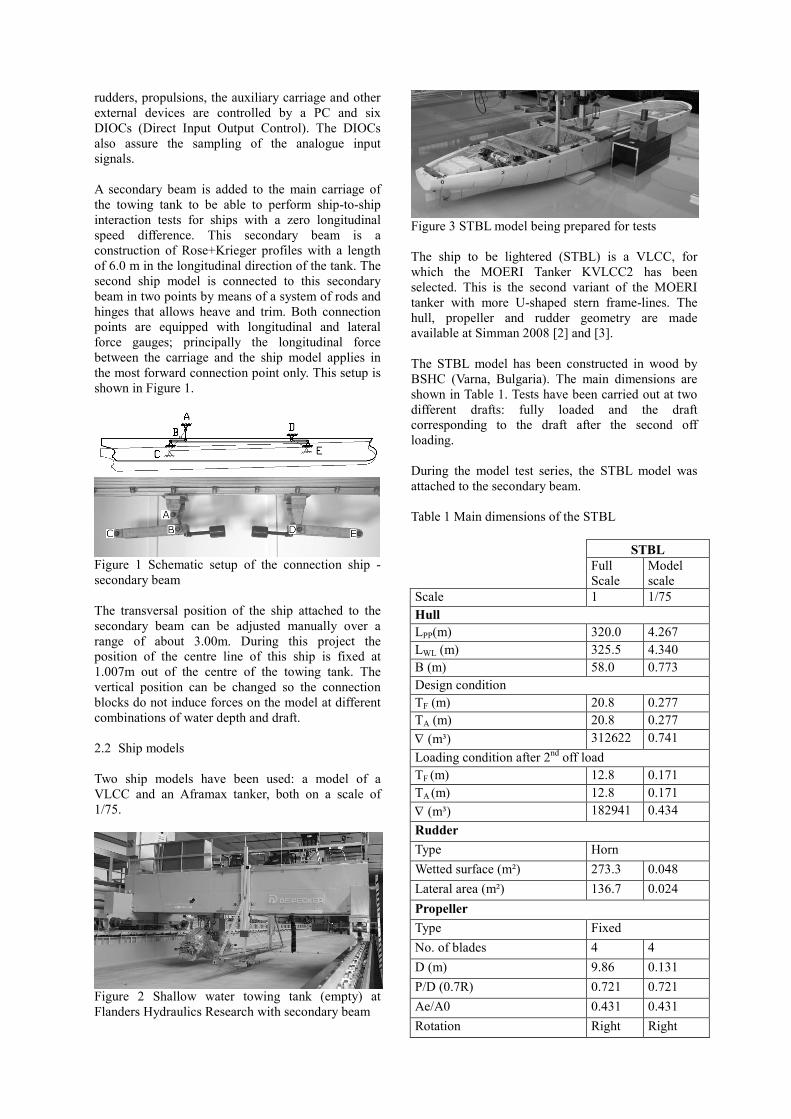
The ship to be lightered (STBL) is a VLCC, for
which the MOERI Tanker KVLCC2 has been
selected. This is the second variant of the MOERI
tanker with more U-shaped stern frame-lines. The
hull, propeller and rudder geometry are made
available at Simman 2008 [2] and [3].
The STBL model has been constructed in wood by
BSHC (Varna, Bulgaria). The main dimensions are
shown in Table 1. Tests have been carried out at two
different drafts: fully loaded and the draft
corresponding to the draft after the second off
loading.
During the model test series, the STBL model was
attached to the secondary beam.
Table 1 Main dimensions of the STBL
STBL
Full
Scale
Model
scale
Scale 1 1/75
Hull
LPP(m) 320.0 4.267
LWL (m) 325.5 4.340
B (m) 58.0 0.773
Design condition
TF (m) 20.8 0.277
TA (m) 20.8 0.277
∇ (m³) 312622 0.741
Loading condition after 2nd off load
TF (m) 12.8 0.171
TA (m) 12.8 0.171
∇ (m³) 182941 0.434
Rudder
Type Horn
Wetted surface (m²) 273.3 0.048
Lateral area (m²) 136.7 0.024
Propeller
Type Fixed
No. of blades 4 4
D (m) 9.86 0.131
P/D (0.7R) 0.721 0.721
Ae/A0 0.431 0.431
Rotation Right Right
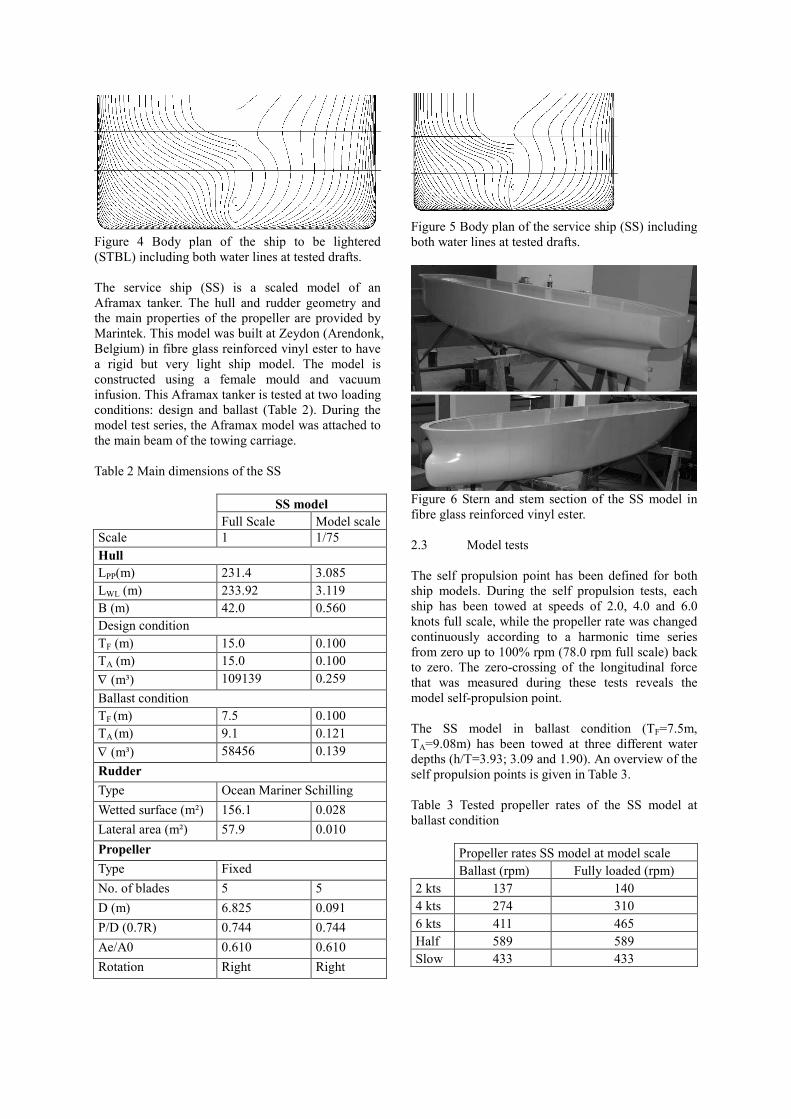
Figure 4 Body plan of the ship to be lightered
(STBL) including both water lines at tested drafts.
The service ship (SS) is a scaled model of an
Aframax tanker. The hull and rudder geometry and
the main properties of the propeller are provided by
Marintek. This model was built at Zeydon (Arendonk,
Belgium) in fibre glass reinforced vinyl ester to have
a rigid but very light ship model. The model is
constructed using a female mould and vacuum
infusion. This Aframax tanker is tested at two loading
conditions: design and ballast (Table 2). During the
model test series, the Aframax model was attached to
the main beam of the towing carriage.
Table 2 Main dimensions of the SS
SS model
Full Scale Model scale
Scale 1 1/75
Hull
LPP(m) 231.4 3.085
LWL (m) 233.92 3.119
B (m) 42.0 0.560
Design condition
TF (m) 15.0 0.100
TA (m) 15.0 0.100
∇ (m³) 109139 0.259
Ballast condition
TF (m) 7.5 0.100
TA (m) 9.1 0.121
∇ (m³) 58456 0.139
Rudder
Type Ocean Mariner Schilling
Wetted surface (m²) 156.1 0.028
Lateral area (m²) 57.9 0.010
Propeller
Type Fixed
No. of blades 5 5
D (m) 6.825 0.091
P/D (0.7R) 0.744 0.744
Ae/A0 0.610 0.610
Rotation Right Right
Figure 5 Body plan of the service ship (SS) including
both water lines at tested drafts.
Figure 6 Stern and stem section of the SS model in
fibre glass reinforced vinyl ester.
2.3 Model tests
The self propulsion point has been defined for both
ship models. During the self propulsion tests, each
ship has been towed at speeds of 2.0, 4.0 and 6.0
knots full scale, while the propeller rate was changed
continuously according to a harmonic time series
from zero up to 100% rpm (78.0 rpm full scale) back
to zero. The zero-crossing of the longitudinal force
that was measured during these tests reveals the
model self-propulsion point.
The SS model in ballast condition (TF=7.5m,
TA=9.08m) has been towed at three different water
depths (h/T=3.93; 3.09 and 1.90). An overview of the
self propulsion points is given in Table 3.
Table 3 Tested propeller rates of the SS model at
ballast condition
Propeller rates SS model at model scale
Ballast (rpm) Fully loaded (rpm)
2 kts 137 140
4 kts 274 310
6 kts 411 465
Half 589 589
Slow 433 433
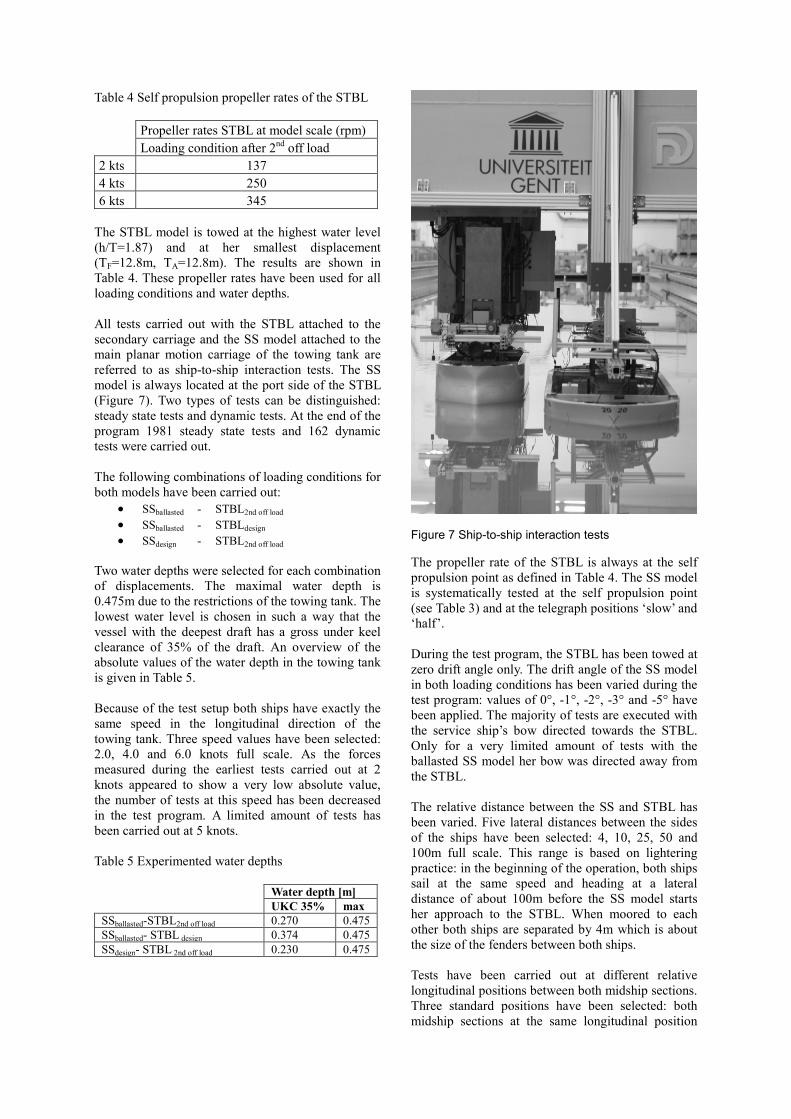
Table 4 Self propulsion propeller rates of the STBL
Propeller rates STBL at model scale (rpm)
Loading condition after 2nd off load
2 kts 137
4 kts 250
6 kts 345
The STBL model is towed at the highest water level
(h/T=1.87) and at her smallest displacement
(TF=12.8m, TA=12.8m). The results are shown in
Table 4. These propeller rates have been used for all
loading conditions and water depths.
All tests carried out with the STBL attached to the
secondary carriage and the SS model attached to the
main planar motion carriage of the towing tank are
referred to as ship-to-ship interaction tests. The SS
model is always located at the port side of the STBL
(Figure 7). Two types of tests can be distinguished:
steady state tests and dynamic tests. At the end of the
program 1981 steady state tests and 162 dynamic
tests were carried out.
The following combinations of loading conditions for
both models have been carried out:
• SSballasted - STBL2nd off load
• SSballasted - STBLdesign
• SSdesign - STBL2nd off load
Two water depths were selected for each combination
of displacements. The maximal water depth is
0.475m due to the restrictions of the towing tank. The
lowest water level is chosen in such a way that the
vessel with the deepest draft has a gross under keel
clearance of 35% of the draft. An overview of the
absolute values of the water depth in the towing tank
is given in Table 5.
Because of the test setup both ships have exactly the
same speed in the longitudinal direction of the
towing tank. Three speed values have been selected:
2.0, 4.0 and 6.0 knots full scale. As the forces
measured during the earliest tests carried out at 2
knots appeared to show a very low absolute value,
the number of tests at this speed has been decreased
in the test program. A limited amount of tests has
been carried out at 5 knots.
Table 5 Experimented water depths
Water depth [m]
UKC 35% max
SSballasted-STBL2nd off load 0.270 0.475
SSballasted- STBL design 0.374 0.475
SSdesign- STBL 2nd off load 0.230 0.475
Figure 7 Ship-to-ship interaction tests
The propeller rate of the STBL is always at the self
propulsion point as defined in Table 4. The SS model
is systematically tested at the self propulsion point
(see Table 3) and at the telegraph positions ‘slow’ and
‘half’.
During the test program, the STBL has been towed at
zero drift angle only. The drift angle of the SS model
in both loading conditions has been varied during the
test program: values of 0°, -1°, -2°, -3° and -5° have
been applied. The majority of tests are executed with
the service ship’s bow directed towards the STBL.
Only for a very limited amount of tests with the
ballasted SS model her bow was directed away from
the STBL.
The relative distance between the SS and STBL has
been varied. Five lateral distances between the sides
of the ships have been selected: 4, 10, 25, 50 and
100m full scale. This range is based on lightering
practice: in the beginning of the operation, both ships
sail at the same speed and heading at a lateral
distance of about 100m before the SS model starts
her approach to the STBL. When moored to each
other both ships are separated by 4m which is about
the size of the fenders between both ships.
Tests have been carried out at different relative
longitudinal positions between both midship sections.
Three standard positions have been selected: both
midship sections at the same longitudinal position

(0%), the SS model half a ship length (LppSS) fore of
the STBL (+50%), and the SS model half a ship
length aft of the STBL (-50%).
A short series of tests has been carried out at a wide
range of longitudinal positions between both ships.
Figure 8 shows the results of such a series for the
(non dimensional) yaw moment of the SS model.
When the midship section of the SS model is located
in front of the midship section of the STBL a yaw
moment is induced on the SS directed with her bow
towards the STBL. When the midship of the STBL is
in front of the SS model the yaw moment on the SS
is directed with her bow away from the STBL. The
highest magnitude of the yaw moment occurs when
the bow of the SS and the stern of the STBL, and
vice versa, are about the same longitudinal position.
All parameters varied during the systematic steady
state tests are summarized in Table 6.
During the dynamic tests the values of one or more
parameters are varied harmonically as a function of
time, while other parameters are kept constant. The
following types of dynamic tests have been executed:
harmonic sway tests harmonic yaw tests harmonic rudder angle tests.
Figure 8 Yaw moment of SS at one lateral distance
and different longitudinal distances to the STBL
Table 6 Overview of the variation of all tested
parameters during steady state tests. (Grey box
indicates not tested at all combinations.)
h TSTBL nSTBL V TSS ψSS nSS δδδδy δx
[m] [m] [] [kts] [m] [deg] [] [m] [m]
hmax 20.8 self 2.0 7.5 180 slow 4 0
1.35 TSTBL 12.8 4.0 15 179 half 10 L/2
5.0 178 self 25 -L/2
6.0 177 50
175 100
Figure 9 Harmonic sway test
Figure 10 Harmonic yaw test
During a harmonic sway test the main carriage
moves with a constant forward speed, while the SS
model performs a sway motion with a harmonically
varying lateral speed (Figure 9). The heading is
always parallel to the longitudinal axis of the towing
tank, and therefore equal to the STBL’s heading. At
the beginning of the tests, the lateral distance
between the sides of both models is 100m full scale,
the closest distance between both ships’ sides is 4m
and at the end of the test the lateral separation
between both ships is again 100m.
During a harmonic yaw test, the SS model performs a
motion characterised by a constant longitudinal ship
speed component, a zero drift angle and a
harmonically varying heading angle (Figure 10). The
lateral separation between the sides of both models
also varies between a maximum of 100m and a
minimum of 4m full scale. In order to obtain a
constant velocity component along the SS model’s
longitudinal axis the main carriage speed is not
constant but contains higher harmonics because of
the harmonic motion of the yawing table. As a result,
the forward speed of the STBL slightly oscillates
during harmonic yaw tests.
Finally tests have been carried out with a harmonic
variation of the SS model’s rudder angle. During
these tests the relative lateral distance between both
ship sides is kept constant at 10.0m full scale. The
rudder angle changes harmonically as a function of
time between -40° and +40°.
3. OPEN STS DATA
For five steady state tests and one dynamic test the
forces, moments and motions are made available. All
different coordinate systems used in this project are
summed up and the position of their origin and
orientation of relevant axes explained. Figure 11
shows the test setup and the three rectangular,
right-handed coordinate systems of importance:
• O0x0y0z0 (fixed to towing tank)
• OSSxSSySSzSS (fixed to SS model)
• OSTBLxSTBLySTBLzSTBL (fixed to STBL model)
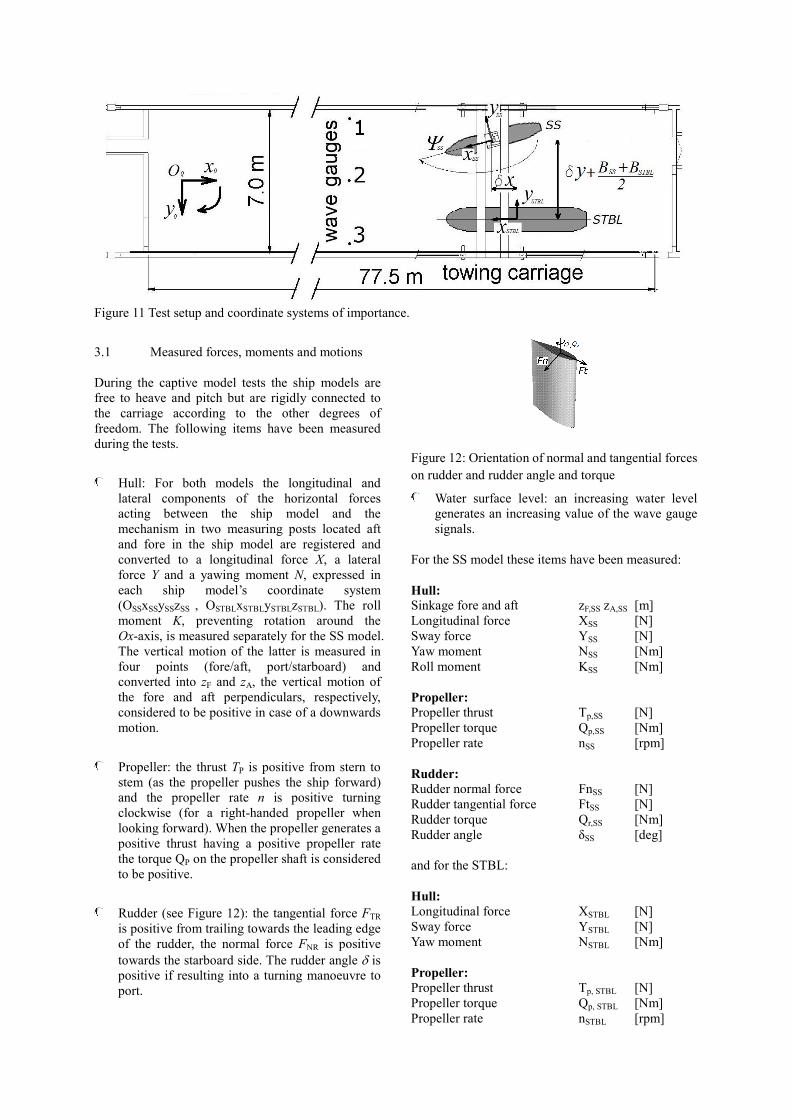
Figure 11 Test setup and coordinate systems of importance.
3.1 Measured forces, moments and motions
During the captive model tests the ship models are
free to heave and pitch but are rigidly connected to
the carriage according to the other degrees of
freedom. The following items have been measured
during the tests.
Hull: For both models the longitudinal and lateral components of the horizontal forces
acting between the ship model and the
mechanism in two measuring posts located aft
and fore in the ship model are registered and
converted to a longitudinal force X, a lateral
force Y and a yawing moment %, expressed in
each ship model’s coordinate system
(OSSxSSySSzSS , OSTBLxSTBLySTBLzSTBL). The roll
moment K, preventing rotation around the
Ox-axis, is measured separately for the SS model.
The vertical motion of the latter is measured in
four points (fore/aft, port/starboard) and
converted into zF and zA, the vertical motion of
the fore and aft perpendiculars, respectively,
considered to be positive in case of a downwards
motion.
Propeller: the thrust TP is positive from stern to stem (as the propeller pushes the ship forward)
and the propeller rate n is positive turning
clockwise (for a right-handed propeller when
looking forward). When the propeller generates a
positive thrust having a positive propeller rate
the torque QP on the propeller shaft is considered
to be positive.
Rudder (see Figure 12): the tangential force FTR is positive from trailing towards the leading edge
of the rudder, the normal force FNR is positive
towards the starboard side. The rudder angle δ is positive if resulting into a turning manoeuvre to
port.
Figure 12: Orientation of normal and tangential forces
on rudder and rudder angle and torque
Water surface level: an increasing water level generates an increasing value of the wave gauge
signals.
For the SS model these items have been measured:
Hull:
Sinkage fore and aft zF,SS zA,SS [m]
Longitudinal force XSS [N]
Sway force YSS [N]
Yaw moment NSS [Nm]
Roll moment KSS [Nm]
Propeller:
Propeller thrust Tp,SS [N]
Propeller torque Qp,SS [Nm]
Propeller rate nSS [rpm]
Rudder:
Rudder normal force FnSS [N]
Rudder tangential force FtSS [N]
Rudder torque Qr,SS [Nm]
Rudder angle δSS [deg]
and for the STBL:
Hull:
Longitudinal force XSTBL [N]
Sway force YSTBL [N]
Yaw moment NSTBL [Nm]
Propeller:
Propeller thrust Tp, STBL [N]
Propeller torque Qp, STBL [Nm]
Propeller rate nSTBL [rpm]
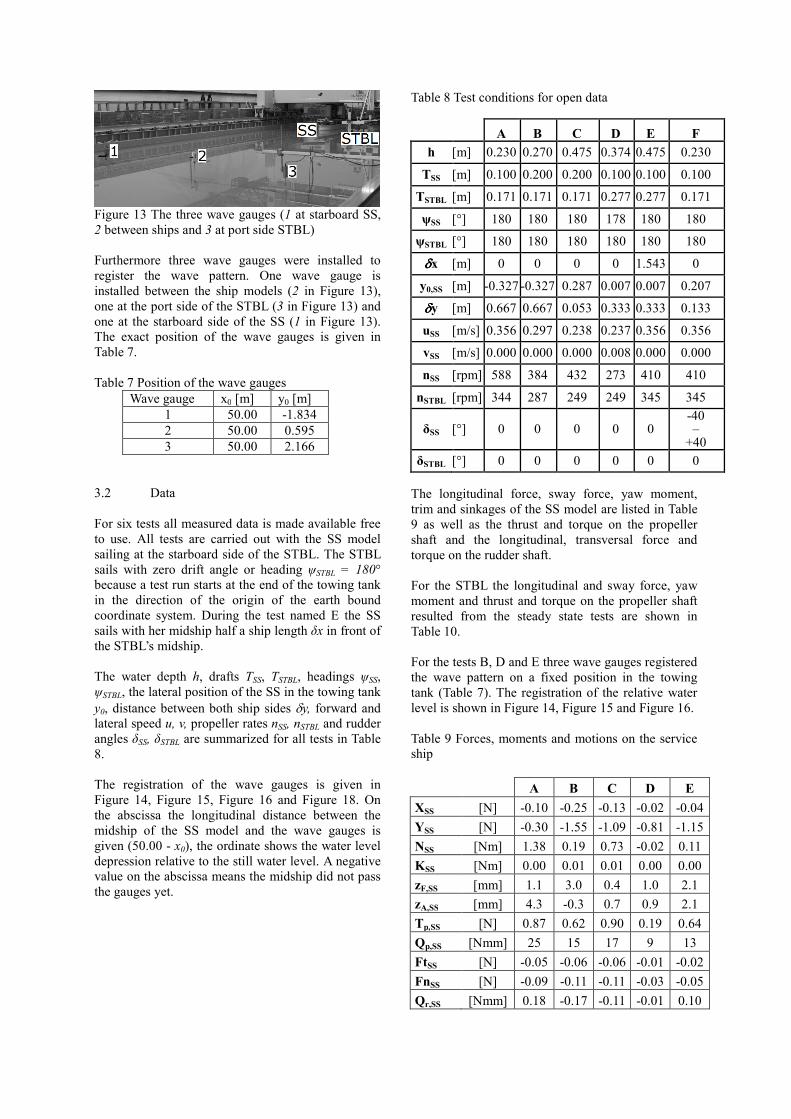
Figure 13 The three wave gauges (1 at starboard SS,
2 between ships and 3 at port side STBL)
Furthermore three wave gauges were installed to
register the wave pattern. One wave gauge is
installed between the ship models (2 in Figure 13),
one at the port side of the STBL (3 in Figure 13) and
one at the starboard side of the SS (1 in Figure 13).
The exact position of the wave gauges is given in
Table 7.
Table 7 Position of the wave gauges
Wave gauge x0 [m] y0 [m]
1 50.00 -1.834
2 50.00 0.595
3 50.00 2.166
3.2 Data
For six tests all measured data is made available free
to use. All tests are carried out with the SS model
sailing at the starboard side of the STBL. The STBL
sails with zero drift angle or heading ψSTBL = 180°
because a test run starts at the end of the towing tank
in the direction of the origin of the earth bound
coordinate system. During the test named E the SS
sails with her midship half a ship length δx in front of
the STBL’s midship.
The water depth h, drafts TSS, TSTBL, headings ψSS,
ψSTBL, the lateral position of the SS in the towing tank
y0, distance between both ship sides δy, forward and lateral speed u, v, propeller rates nSS, nSTBL and rudder
angles δSS, δSTBL are summarized for all tests in Table
8.
The registration of the wave gauges is given in
Figure 14, Figure 15, Figure 16 and Figure 18. On
the abscissa the longitudinal distance between the
midship of the SS model and the wave gauges is
given (50.00 - x0), the ordinate shows the water level
depression relative to the still water level. A negative
value on the abscissa means the midship did not pass
the gauges yet.
Table 8 Test conditions for open data
A B C D E F
h [m] 0.230 0.270 0.475 0.374 0.475 0.230
TSS [m] 0.100 0.200 0.200 0.100 0.100 0.100
TSTBL [m] 0.171 0.171 0.171 0.277 0.277 0.171
ψSS [°] 180 180 180 178 180 180
ψSTBL [°] 180 180 180 180 180 180
δδδδx [m] 0 0 0 0 1.543 0
y0,SS [m] -0.327 -0.327 0.287 0.007 0.007 0.207
δδδδy [m] 0.667 0.667 0.053 0.333 0.333 0.133
uSS [m/s] 0.356 0.297 0.238 0.237 0.356 0.356
vSS [m/s] 0.000 0.000 0.000 0.008 0.000 0.000
nSS [rpm] 588 384 432 273 410 410
nSTBL [rpm] 344 287 249 249 345 345
δSS [°] 0 0 0 0 0 -40 – +40
δSTBL [°] 0 0 0 0 0 0
The longitudinal force, sway force, yaw moment,
trim and sinkages of the SS model are listed in Table
9 as well as the thrust and torque on the propeller
shaft and the longitudinal, transversal force and
torque on the rudder shaft.
For the STBL the longitudinal and sway force, yaw
moment and thrust and torque on the propeller shaft
resulted from the steady state tests are shown in
Table 10.
For the tests B, D and E three wave gauges registered
the wave pattern on a fixed position in the towing
tank (Table 7). The registration of the relative water
level is shown in Figure 14, Figure 15 and Figure 16.
Table 9 Forces, moments and motions on the service
ship
A B C D E
XSS [N] -0.10 -0.25 -0.13 -0.02 -0.04
YSS [N] -0.30 -1.55 -1.09 -0.81 -1.15
�SS [Nm] 1.38 0.19 0.73 -0.02 0.11
KSS [Nm] 0.00 0.01 0.01 0.00 0.00
zF,SS [mm] 1.1 3.0 0.4 1.0 2.1
zA,SS [mm] 4.3 -0.3 0.7 0.9 2.1
Tp,SS [N] 0.87 0.62 0.90 0.19 0.64
Qp,SS [Nmm] 25 15 17 9 13
FtSS [N] -0.05 -0.06 -0.06 -0.01 -0.02
FnSS [N] -0.09 -0.11 -0.11 -0.03 -0.05
Qr,SS [Nmm] 0.18 -0.17 -0.11 -0.01 0.10
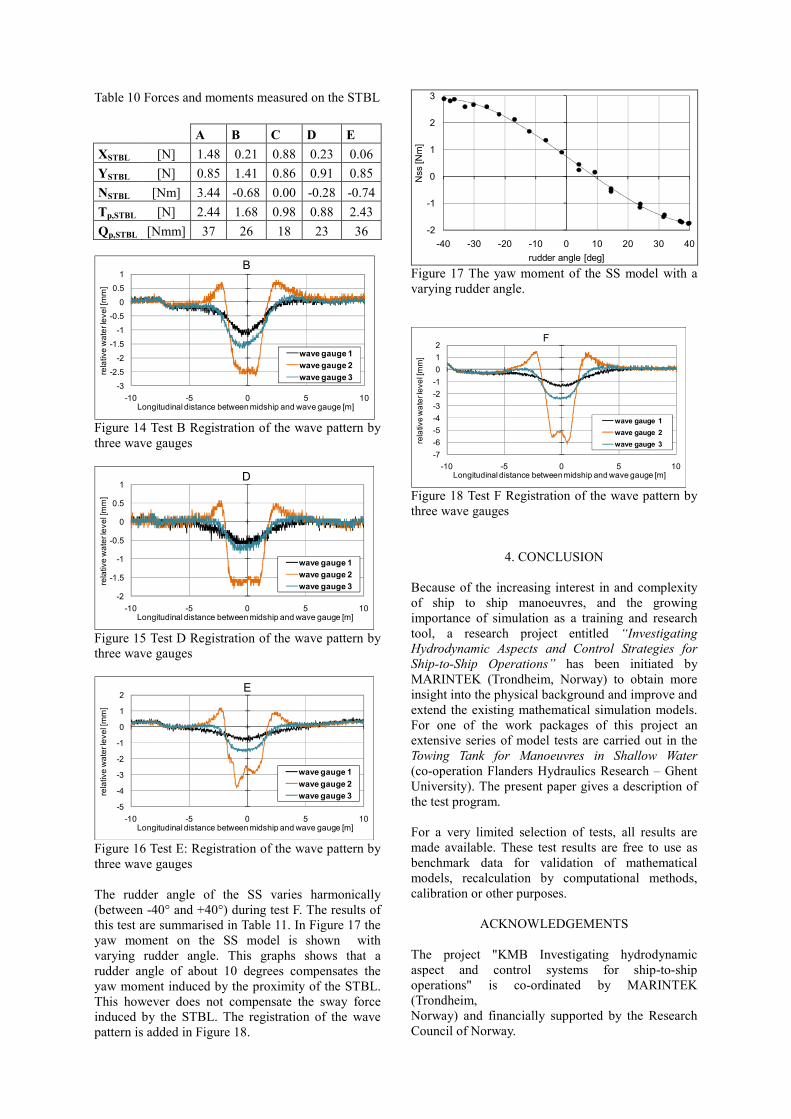
Table 10 Forces and moments measured on the STBL
A B C D E
XSTBL [N] 1.48 0.21 0.88 0.23 0.06
YSTBL [N] 0.85 1.41 0.86 0.91 0.85
�STBL [Nm] 3.44 -0.68 0.00 -0.28 -0.74
Tp,STBL [N] 2.44 1.68 0.98 0.88 2.43
Qp,STBL [Nmm] 37 26 18 23 36
-3
-2.5
-2
-1.5
-1
-0.5
0
0.5
1
-10 -5 0 5 10
relative water level [mm]
Longitudinal distance between midship and wave gauge [m]
B
wave gauge 1
wave gauge 2
wave gauge 3
Figure 14 Test B Registration of the wave pattern by
three wave gauges
-2
-1.5
-1
-0.5
0
0.5
1
-10 -5 0 5 10
relative water level [mm]
Longitudinal distance between midship and wave gauge [m]
D
wave gauge 1
wave gauge 2
wave gauge 3
Figure 15 Test D Registration of the wave pattern by
three wave gauges
-5
-4
-3
-2
-1
0
1
2
-10 -5 0 5 10
relative water level [mm]
Longitudinal distance between midship and wave gauge [m]
E
wave gauge 1
wave gauge 2
wave gauge 3
Figure 16 Test E: Registration of the wave pattern by
three wave gauges
The rudder angle of the SS varies harmonically
(between -40° and +40°) during test F. The results of
this test are summarised in Table 11. In Figure 17 the
yaw moment on the SS model is shown with
varying rudder angle. This graphs shows that a
rudder angle of about 10 degrees compensates the
yaw moment induced by the proximity of the STBL.
This however does not compensate the sway force
induced by the STBL. The registration of the wave
pattern is added in Figure 18.
-2
-1
0
1
2
3
-40 -30 -20 -10 0 10 20 30 40
Nss [Nm]
rudder angle [deg] Figure 17 The yaw moment of the SS model with a
varying rudder angle.
-7
-6
-5
-4
-3
-2
-1
0
1
2
-10 -5 0 5 10
relative water level [mm]
Longitudinal distance between midship and wave gauge [m]
F
wave gauge 1
wave gauge 2
wave gauge 3
Figure 18 Test F Registration of the wave pattern by
three wave gauges
4. CONCLUSION
Because of the increasing interest in and complexity
of ship to ship manoeuvres, and the growing
importance of simulation as a training and research
tool, a research project entitled “Investigating
Hydrodynamic Aspects and Control Strategies for
Ship-to-Ship Operations” has been initiated by
MARINTEK (Trondheim, Norway) to obtain more
insight into the physical background and improve and
extend the existing mathematical simulation models.
For one of the work packages of this project an
extensive series of model tests are carried out in the
Towing Tank for Manoeuvres in Shallow Water
(co-operation Flanders Hydraulics Research – Ghent
University). The present paper gives a description of
the test program.
For a very limited selection of tests, all results are
made available. These test results are free to use as
benchmark data for validation of mathematical
models, recalculation by computational methods,
calibration or other purposes.
ACKNOWLEDGEMENTS
The project "KMB Investigating hydrodynamic
aspect and control systems for ship-to-ship
operations" is co-ordinated by MARINTEK
(Trondheim,
Norway) and financially supported by the Research
Council of Norway.
5. NOMENCLATURE
AE [m²] expanded area of the propeller
A0 [m] disc area of the propeller
B [m] beam of the ship
D [m] propeller diameter
F%R [N] rudder normal force
FTR [N] rudder tangential force
h [m] water depth
LWL [m] length on the waterline
LPP [m] length between perpendiculars
K [%m] roll moment
% [Nm] yaw moment
n [rpm] propeller rate
P [m] pitch
QP [Nmm] torque on the propeller shaft
QR [Nmm] torque on the rudder shaft
TA [m] draft aft
TF [m] draft fore
TP [m] thrust of the propeller
UKC [] under keel clearance
u [m/s] linear velocity along ship x-axis
v [m/s] linear velocity along ship y-axis
V [m/s] ship speed
X [N] longitudinal force
Y [N] sway force
zA [m] sinkage aft
zF [m] sinkage fore
δ [°] rudder angle+
δx [m] longitudinal distance between midships,
(>0 if midship SS is in front of STBL)
δ y [m] lateral distance between ship sides
ρ [kg/m³] density
∇ [m³] displacement volume
ψ [°] heading
Subscripts:
SS [] service ship
STBL [] ship to be lightered
REFERENCES
[1] http://www. sintef.no/Projectweb/STSOps/ [2] http://www.simman2008.dk/KVLCC/KVLCC2/tanker2.html
[3] Simman 2008, Workshop on Verification and Validation of Ship Manoeuvring Simulation Methods,
Copenhagen, Denmark, April 14th-16
th 2008
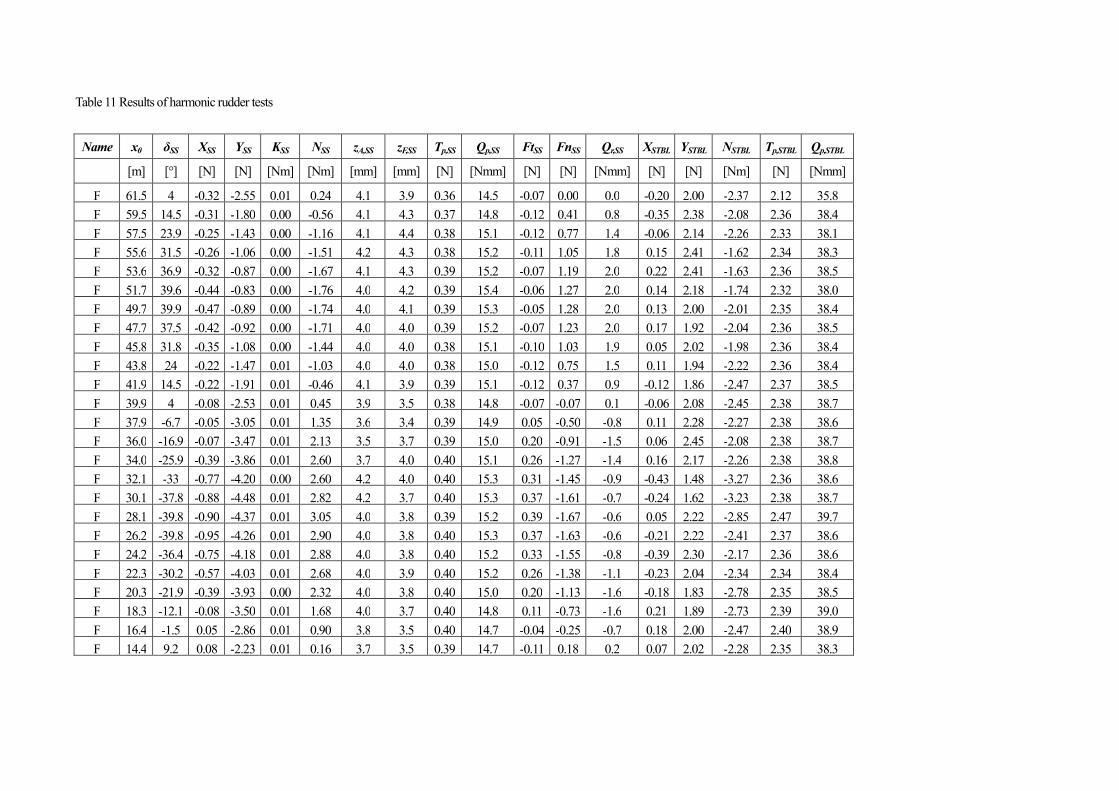
Table 11 Results of harmonic rudder tests
�ame x0 δSS XSS YSS KSS �SS zA,SS zF,SS Tp,SS Qp,SS FtSS FnSS Qr,SS XSTBL YSTBL �STBL Tp,STBL Qp,STBL
[m] [°] [N] [N] [Nm] [Nm] [mm] [mm] [N] [Nmm] [N] [N] [Nmm] [N] [N] [Nm] [N] [Nmm]
F 61.5 4 -0.32 -2.55 0.01 0.24 4.1 3.9 0.36 14.5 -0.07 0.00 0.0 -0.20 2.00 -2.37 2.12 35.8
F 59.5 14.5 -0.31 -1.80 0.00 -0.56 4.1 4.3 0.37 14.8 -0.12 0.41 0.8 -0.35 2.38 -2.08 2.36 38.4
F 57.5 23.9 -0.25 -1.43 0.00 -1.16 4.1 4.4 0.38 15.1 -0.12 0.77 1.4 -0.06 2.14 -2.26 2.33 38.1
F 55.6 31.5 -0.26 -1.06 0.00 -1.51 4.2 4.3 0.38 15.2 -0.11 1.05 1.8 0.15 2.41 -1.62 2.34 38.3
F 53.6 36.9 -0.32 -0.87 0.00 -1.67 4.1 4.3 0.39 15.2 -0.07 1.19 2.0 0.22 2.41 -1.63 2.36 38.5
F 51.7 39.6 -0.44 -0.83 0.00 -1.76 4.0 4.2 0.39 15.4 -0.06 1.27 2.0 0.14 2.18 -1.74 2.32 38.0
F 49.7 39.9 -0.47 -0.89 0.00 -1.74 4.0 4.1 0.39 15.3 -0.05 1.28 2.0 0.13 2.00 -2.01 2.35 38.4
F 47.7 37.5 -0.42 -0.92 0.00 -1.71 4.0 4.0 0.39 15.2 -0.07 1.23 2.0 0.17 1.92 -2.04 2.36 38.5
F 45.8 31.8 -0.35 -1.08 0.00 -1.44 4.0 4.0 0.38 15.1 -0.10 1.03 1.9 0.05 2.02 -1.98 2.36 38.4
F 43.8 24 -0.22 -1.47 0.01 -1.03 4.0 4.0 0.38 15.0 -0.12 0.75 1.5 0.11 1.94 -2.22 2.36 38.4
F 41.9 14.5 -0.22 -1.91 0.01 -0.46 4.1 3.9 0.39 15.1 -0.12 0.37 0.9 -0.12 1.86 -2.47 2.37 38.5
F 39.9 4 -0.08 -2.53 0.01 0.45 3.9 3.5 0.38 14.8 -0.07 -0.07 0.1 -0.06 2.08 -2.45 2.38 38.7
F 37.9 -6.7 -0.05 -3.05 0.01 1.35 3.6 3.4 0.39 14.9 0.05 -0.50 -0.8 0.11 2.28 -2.27 2.38 38.6
F 36.0 -16.9 -0.07 -3.47 0.01 2.13 3.5 3.7 0.39 15.0 0.20 -0.91 -1.5 0.06 2.45 -2.08 2.38 38.7
F 34.0 -25.9 -0.39 -3.86 0.01 2.60 3.7 4.0 0.40 15.1 0.26 -1.27 -1.4 0.16 2.17 -2.26 2.38 38.8
F 32.1 -33 -0.77 -4.20 0.00 2.60 4.2 4.0 0.40 15.3 0.31 -1.45 -0.9 -0.43 1.48 -3.27 2.36 38.6
F 30.1 -37.8 -0.88 -4.48 0.01 2.82 4.2 3.7 0.40 15.3 0.37 -1.61 -0.7 -0.24 1.62 -3.23 2.38 38.7
F 28.1 -39.8 -0.90 -4.37 0.01 3.05 4.0 3.8 0.39 15.2 0.39 -1.67 -0.6 0.05 2.22 -2.85 2.47 39.7
F 26.2 -39.8 -0.95 -4.26 0.01 2.90 4.0 3.8 0.40 15.3 0.37 -1.63 -0.6 -0.21 2.22 -2.41 2.37 38.6
F 24.2 -36.4 -0.75 -4.18 0.01 2.88 4.0 3.8 0.40 15.2 0.33 -1.55 -0.8 -0.39 2.30 -2.17 2.36 38.6
F 22.3 -30.2 -0.57 -4.03 0.01 2.68 4.0 3.9 0.40 15.2 0.26 -1.38 -1.1 -0.23 2.04 -2.34 2.34 38.4
F 20.3 -21.9 -0.39 -3.93 0.00 2.32 4.0 3.8 0.40 15.0 0.20 -1.13 -1.6 -0.18 1.83 -2.78 2.35 38.5
F 18.3 -12.1 -0.08 -3.50 0.01 1.68 4.0 3.7 0.40 14.8 0.11 -0.73 -1.6 0.21 1.89 -2.73 2.39 39.0
F 16.4 -1.5 0.05 -2.86 0.01 0.90 3.8 3.5 0.40 14.7 -0.04 -0.25 -0.7 0.18 2.00 -2.47 2.40 38.9
F 14.4 9.2 0.08 -2.23 0.01 0.16 3.7 3.5 0.39 14.7 -0.11 0.18 0.2 0.07 2.02 -2.28 2.35 38.3