Embed Size (px)
Citation preview

2015
C A P S T O N E T U R B I N E
A N N U A LR E P O R T
10938_2015 Capstone AR_Cover.indd 3 6/24/15 11:00 AM

2 | Capstone Turbine Corporation 2015 Annual Report | 2
08 | Capstone Turbine Corporation
02 LETTER TO STOCKHOLDERS
06 VERTICAL CHANNEL DISTRIBUTION
08 MARKET AND GEOGRAPHIC DIVERSIFICATION
10 GLOBAL MARKET SEGMENTS
11 MEGAWATTS SHIPPED AND GLOBAL HIGHLIGHTS
14 BROAD SUITE OF PRODUCTS
16 AFTERMARKET SERVICES
18 FUTURE GROWTH
20 FINANCIAL AND OPERATING SUMMARY
21 KEY FINANCIAL FIGURES
CONTENTS
10938_2015 Capstone Annual Report_23June_R1.indd 2 6/26/15 5:10 PM

2 | Capstone Turbine Corporation 2015 Annual Report | 2
DEAR FELLOW STOCKHOLDERS
In fiscal 2015, Capstone continued to make significant progress in strengthening our company by further diversifying our business, growing and maturing our distribution network, improving our
product reliability, implementing cost savings and expanding into promising new geographies. The operational improvements to our cost structure that we implemented over the past several years resulted in flat gross margins year over year despite the 13 percent decline in top line revenue. Additionally, gross margin was impacted by a non-cash reserve for slow moving inventory and certain direct material costs were recorded without the associated revenue as of March 31, 2015. Gross margin has been in the double digits since the third quarter of 2013, or 10 consecutive quarters. However, our operational progress has been eclipsed by the challenging macroeconomic headwinds that have confronted us over the last year. The dramatic downturn of the oil markets, a substantially stronger U.S. dollar making our products more expensive overseas and ongoing geopolitical tensions in Russia, North Africa and the Middle East were all factors that have negatively impacted our business.
Despite these challenging global and economic market dynamics, we have pushed onward and adapted in ways that have undoubtedly built a more resilient Capstone today and for the future. By improving our supply chain and making strategic management adjustments, we have significantly reduced operational costs within the organization. Additionally, as our installed base of microturbines continues to grow, it will drive more predictable and recurring revenue from our service business. This will help to accelerate the overall market acceptance of our product solutions and fuel new business development.
VERTICAL CHANNEL DISTRIBUTION
Our most valuable and intangible asset is our worldwide distribution network that we have proudly developed from the ground up. We have built this robust distribution network through education, training and empowerment. In addition, our flexibility in working with our distributors in a more challenging environment has further strengthened our relationships and fostered a mutual bond of loyalty built on trust and teamwork. Capstone is building long-term sustainable growth potential within our
network of 88 distributors and 9 OEM partners. This gives Capstone the global presence and manpower of approximately 740 employees collectively spread out across 152 locations around the world. Each one of our distributors is a strategically placed independent partner out on the front lines marketing and selling Capstone products and services. We look to a promising future as our existing distributors mature and succeed. As we continue to bring on new distributors in our expanding geographies, we expect to capture an increasing share of the worldwide distributed generation market.
10938_2015 Capstone Annual Report_23June.indd 2 6/24/15 11:21 AM

3 | Capstone Turbine Corporation 2015 Annual Report | 4
MARKET AND GEOGRAPHIC DIVERSIFICATION
Recognition of the Capstone brand and interest in our microturbine products continues to grow in all six of our major vertical markets – oil, gas and other natural resources, energy efficiency, renewable energy, critical power supply, marine and transportation. Demand for clean-and-green power generation technology continues to flourish worldwide and we estimate the global market opportunity for microturbine technology to be valued at approximately $15 billion, with Capstone’s potential market share at $1.5 billion.
Capstone is expanding its market share in a challenging oil, gas and other natural resources market. In Mexico, we are capitalizing on the opportunities that resulted from the Mexican energy reform, which has established reduced electricity and gas prices. One of our Mexican distributors, Industrias Energetícas, secured two of the largest orders in Capstone's history in participation with the Los Ramones pipeline project in eastern Mexico. With this type of success, Mexico is poised to be one of our top markets throughout fiscal 2016. Furthermore, we have seen strong demand for flare gas reduction in the Middle East and Africa. We see positive growth going forward in these markets as our distribution network matures in new regions and we expect to capitalize on these opportunities, offsetting business that may be down in other markets next year.
We have seen an increase in combined heat and power (CHP) projects around the world. In particular, we have experienced strong traction
in Australia, Mexico, Germany, Italy and Brazil. In the United States, the CHP market is growing in several states including New York, New Jersey, Pennsylvania, California, Alaska and Hawaii. Despite the slowdown in oil production in Russia, one of our distributors, BPC Engineering, is pursuing growth in the sales of CHP and combined cooling, heat and power (CCHP) plants within the Russian manufacturing sector and in neighboring Kazakhstan and Belarus. Although Europe remains economically constrained, we are encouraged by the strengthening demand for CHP applications in a number of other countries including Germany, Italy, Austria, Switzerland, Finland, Poland and the United Kingdom.
With oil, gas and other natural resources serving as one of Capstone’s larger market segments in the United States, shale plays have become a major focus going into fiscal 2016. Capstone microturbines provide shale oil and gas operations with ultra-low emission, low maintenance and reliable solutions that operate more efficiently and for longer periods of time than typical reciprocating engine generators. This helps to solidify Capstone’s position as the preferred option for new and repeat oil and gas customers.
Capstone continues to search the globe for opportunities in new markets and recently found success in developing power projects from palm oil production in Malaysia and propane-based CHP in the Caribbean. These new markets showcase tremendous opportunities for us. Palm oil is a multi-billion dollar industry Capstone can most certainly
10938_2015 Capstone Annual Report_23June.indd 3 6/24/15 11:21 AM

3 | Capstone Turbine Corporation 2015 Annual Report | 4
Gary D. SimonChairman of the Board
Darren R. JamisonPresident and Chief Executive Officer
capitalize on. In addition, the Caribbean utility rates are extremely high, making CHP a very attractive alternative.
AFTERMARKET SERVICE
The recent design enhancements to our flagship C200 and C1000 series products combined with the improvements we made to our aftermarket service business have led to reduced warranty expenses and higher Factory Protection Plan (FPP) contribution margins. Our FPP backlog grew to approximately $61.2 million by March 31, 2015 — a new record for Capstone. Our market-leading FPP also better aligns our service offering with our customer requirements. Approximately 20 percent of our units in the field are currently operating under a FPP, leaving plenty of opportunity to both expand and further scale our aftermarket services business. Overall, our aftermarket services carry higher margins, which we expect to increase as a percentage of total revenue as our global fleet continues to grow each year.
FUTURE GROWTH
The headwinds we faced in fiscal 2015 led us to flatten our organization. By streamlining our internal operations, we can better foster innovation and creativity, focus on product robustness and broaden our aftermarket services. These actions will lower operating costs and result in an estimated $2 million
in annual savings after severance costs. Our long-term outlook for the future of Capstone remains positive as we continue to expand and mature our worldwide distribution network, drive accelerated growth through new emerging markets, deliver ongoing product enhancements and develop new and improved microturbine products and services.
Without question the economic challenges we encountered this past year made it a difficult one, pushing out our anticipated achievement of EBITDA breakeven. While we are disappointed in this outcome, we have focused on adapting quickly and executing better under these new circumstances.
Today, Capstone is stronger, leaner, more flexible and better positioned for growth than ever before. Our team is extremely motivated and driven by the highest standards of open communication, creativity, collaboration, adaptability and accountability, keeping customer satisfaction and stockholder value at the center of all our business decisions. We would like to thank our stockholders, customers, employees, distributors and suppliers for your continued support, confidence and patience as we continue on our mission to deliver world-class clean energy solutions. We look forward to reporting on our progress over the next year.
10938_2015 Capstone Annual Report_23June.indd 4 6/24/15 11:21 AM

5 | Capstone Turbine Corporation 2015 Annual Report | 6
10938_2015 Capstone Annual Report_23June.indd 5 6/24/15 11:21 AM

5 | Capstone Turbine Corporation 2015 Annual Report | 6
Capstone’s global distribution network is constantly expanding and evolving to better serve our customers. As we continue to penetrate markets in new and developing regions, Capstone and our distributors are working harder than ever to raise brand awareness and drive a more robust sales pipeline. With integrated marketing efforts, a more advanced applications training program and the increased availability of parts and services, we remain on track to further mature our global distribution network.
GROWING CHANNEL TO MARKET
152 88 9 740LOCATIONS DISTRIBUTORS OEMs DISTRIBUTOR EMPLOYEES
Through trust and innovation, we have established our distributor network as one of our top competitive advantages. Our 88 distributors and 9 OEM partners provide a vital link between Capstone and our customer base, by collaborating with us to provide the highest-quality products, services and customer experience possible. Our refined distribution network extends our workforce presence to approximately 740 employees across 152 locations around the world. Through this network we are able to penetrate geographies and market segments more efficiently by leveraging the local expertise of each region. Capstone was successful in signing 10 new distribution partners over the last year in new and emerging market regions. With a focus on
expanding our global reach, Capstone signed contracts with new distributors in France, Jordan, Kuwait, The Netherlands, Republic of Moldova, Saudi Arabia, Trinidad and Tobago, Turkey and the United States. Success in new geographies and vertical markets is critical for company growth as it further diversifies and strengthens our global distribution.
Capstone only invests in distribution partners that are committed to align strategically with our business in order to accelerate channel optimization. Once a distribution partner is signed, we stand shoulder-to-shoulder with them in order to grow our global presence and deliver the best industry-leading power generation solutions.
VERTICAL CHANNEL DISTRIBUTION
10938_2015 Capstone Annual Report_23June.indd 6 6/24/15 11:21 AM

7 | Capstone Turbine Corporation 2015 Annual Report | 8
10938_2015 Capstone Annual Report_23June.indd 7 6/24/15 11:21 AM

7 | Capstone Turbine Corporation 2015 Annual Report | 8
OIL, GAS AND OTHER NATURAL RESOURCES
Over the past year, the precipitous drop in global oil prices and other macroeconomic challenges faced within the oil and gas industry have all affected the rate at which customers are adopting Capstone products. Despite a shift in oil and gas production worldwide, the advantages Capstone solutions has over its competitors have led to follow-on orders for traditional oil and gas applications and further expansion into the flare gas market.
Producers of oil, gas and other natural resources are continually looking for energy systems that reduce operational costs while being both reliable and easy to maintain. Capstone microturbines are the proven solution for oil and gas operations worldwide as many of the operations are off-the-grid or in remote locations.
ENERGY EFFICIENCY
High energy demand and unpredictable fluctuations in energy costs have led companies across the United States, Europe and Australia to seek out more efficient energy solutions. We have significantly grown our installed microturbine fleet within the CHP and CCHP markets by diversifying in key regions. Capstone had a 39 percent increase
in revenue from the energy efficiency market to $39 million in fiscal 2015 from $28 million in fiscal 2014.
We expect this high demand for CHP and CCHP applications to grow exponentially in other regions including Asia Pacific, Europe, Russia and South America. With CHP efficiency levels exceeding 80 percent, the cost benefits achieved by owning a Capstone microturbine outweigh those of our competitors.
RENEWABLE ENERGY
As an important part of our commitment to improving the efficiency of the world’s energy infrastructure and reducing global emissions, Capstone microturbines can be configured to operate on numerous types of biogases to produce renewable energy. Capstone continues to prove its ability to produce renewable energy by securing projects in Lithuania, Malaysia and the United States. These customers can now operate knowing that their carbon footprint is smaller and reliance on the local utility is lower. With their high reliability, low operating costs and low emissions, Capstone microturbines represent a smart power generation solution that can easily integrate with leading-edge green waste conversion technologies.
The global demand for alternative energy technologies is steadily growing across all six of our vertical markets. As we strengthen Capstone’s global presence through a maturing distributor network and improved supply chain, the value and benefits of owning a Capstone microturbine continues to define the standard for power generation solutions.
MARKET AND GEOGRAPHIC DIVERSIFICATION
FY14
$28M
FY15
$39M
Capstone EnergyEfficiency Market
$340Mpotential market capture
of renewable energy
10938_2015 Capstone Annual Report_23June.indd 8 6/24/15 11:22 AM

9 | Capstone Turbine Corporation 2015 Annual Report | 10
CRITICAL POWER SUPPLY
Businesses such as hospitals and data centers demand the highest level of energy reliability. These facilities cannot suffer even a momentary lapse in power without potentially devastating effects. To meet the needs of these customers, Capstone has developed two solutions that deliver the dependability and security they require. The Capstone UPSource and the hybrid uninterruptible power supply (HUPS) both provide primary and emergency power for critical loads. These integrated solutions can also be deployed in a high efficiency CHP configuration, providing heating and/or cooling to the facility and further reducing operating costs.
TRANSPORTATION
Capstone microturbines operate in conjunction with mobile onboard battery packs to provide electrical power as needed for hybrid electric vehicle (HEV) applications. There are many benefits to implementing Capstone’s technology into HEVs, including low noise, no
vibration and ultra-low emissions. Capstone stands ready to help propel the transportation market into the future as our microturbines provide an overall lower environmental footprint than any other onboard power source.
MARINE
Capstone microturbines can be deployed in a number of marine applications, from workboats to luxury yachts, providing onboard power to ancillary equipment and living quarters. In a CHP configuration, microturbines can increase the overall efficiency of a vessel by providing space heating, hot water and cold water. With the ability to run on liquid fuel or liquefied natural gas (LNG), microturbines can serve as an onboard range extender or drive the electrical propulsion system. With many added benefits including reduced fuel consumption, lower emissions, higher reliability, longer maintenance intervals and minimal vibration, Capstone microturbines provide a superior alternative for powering the marine industry.
54267
301
112
734
4,144
3,750
274343
8,511
CUMULATIVE UNITS SHIPPEDCUMULATIVE MEGAWATTS SHIPPED
C600|C800|C1000C200C65C30
average cost of one minute of data center downtime
$7,900
10938_2015 Capstone Annual Report_23June.indd 9 6/24/15 11:22 AM

9 | Capstone Turbine Corporation 2015 Annual Report | 10
Capture and utilize thermal energy from the clean exhaust in CHP and CCHP
applications for Hotels, Large Residential Complexes, Retail Buildings and
Office Buildings.
Cleanly and efficiently operate on biogas and other waste products to create
high-efficiency renewable power and heat for Farm Digesters, Landfills, Food Waste
and Solid Waste Management.
Generate on-site power for all phases of oil and gas production in both onshore
and offshore applications including Drilling Operations, Flare Gas Reduction,
Gas Compression, Mining and Water Conversion.
Operate in conjunction with battery packs to provide onboard battery charging and vehicle range extension to Commercial
Trucks, Heavy-duty Vehicles, Supercars, Transit Buses and Delivery Vehicles.
Mission critical businesses have an uninterruptible power source with the
world’s only microturbine-powered UPS solution for Data Centers, Hospitals,
Telecom and Power Rentals.
Provide onboard auxiliary power, vessel range extension and utilize thermal
energy for onboard heating and cooling for Cargo Ships, Commercial Vessels, Luxury
Yachts and Work Boats.
Potential Market $100MPotential Market $90MPotential Market $250M
Potential Market $340MPotential Market $440MPotential Market $310M
Energy Efficiency Renewable EnergyOil, Gas and OtherNatural Resources
TransportationCritical Power Supply Marine
GLOBAL MARKET SEGMENTS
10938_2015 Capstone Annual Report_23June.indd 10 6/24/15 11:22 AM

11 | Capstone Turbine Corporation 2015 Annual Report | 12
GLOBAL HIGHLIGHTS FY15
91MWMEGAWATTS SHIPPED FY15
13 C800 microturbines and 16 C30 microturbines to power two major phases of the Los Ramones pipeline project in Northeastern Mexico.
Natural-gas-fueled C600 microturbines installed at three compressor stations in the Marcellus and Utica Shale plays.
A 14MW order for multiple CHP projects in Mexico to help boost the energy efficiency of the country’s manufacturing sector.
A C1000 provides electricity, heating and cooling to help a business district in Medellín, Colombia meet its growing energy needs.
Capstone’s first project in El Salvador with a propane-fueled C200 microturbine (CCHP) for a plastics manufacturing plant in San Salvador.
A natural-gas-fueled C1000 microturbine to upgrade a cancer treatment center in New York City.
A 1MW order to upgrade a Southern California water recycling plant in Irvine using biogas produced on-site.
A propane-fueled Capstone C1000 deployed in a CCHP configuration will provide 24/7 prime power for an exclusive resort in the U.S. Virgin Islands.
North AmericaEurope
South America
47MW12MW
2MW
Energy Efficiency
Renewable Energy
Critical Power Supply
Oil, Gas and Other Natural Resources
10938_2015 Capstone Annual Report_23June_R1.indd 11 6/26/15 5:10 PM

11 | Capstone Turbine Corporation 2015 Annual Report | 12
Capstone’s first project in El Salvador with a propane-fueled C200 microturbine (CCHP) for a plastics manufacturing plant in San Salvador.
A natural-gas-fueled C1000 microturbine to upgrade a cancer treatment center in New York City.
A 1MW order to upgrade a Southern California water recycling plant in Irvine using biogas produced on-site.
A propane-fueled Capstone C1000 deployed in a CCHP configuration will provide 24/7 prime power for exclusive resort in U.S. Virgin Islands.
A natural-gas-fueled C600 microturbine to power a popular Russian rubber footwear manufacturing facility in Astrakhan.
Capstone’s first project in Oman with two natural-gas-fueled C65 microturbines for an oil and gas pipeline supply company.
One of the first Italian food retailers to implement Capstone technology with a methane-fueled C800 microturbine (CCHP) in Fiano Romano.
Two C1000’s installed on an offshore platform in Africa will run on flare gas to power artificial lift equipment (electrical submersible pumps) that is used to increase oil production.
Two orders totaling 3MW to provide power to palm oil processing plants in Malaysia using biogas-fueled microturbines.
A 5.5MW (CHP) order to upgrade two Russian sports centers in Sochi and in Kislovodsk.
A 1.4MW (CCHP) order to upgrade a building in a major Australian business center in Sydney.
Capstone natural gas C1000 in a CHP configuration will provide 1MW of clean power and heat to a new Metro-City residential high-rise in Masan, South Korea.
Asia
Australia
Russia
Africa
Middle East
7MW
5MW
16MW
2MW
<1MW
10938_2015 Capstone Annual Report_23June.indd 12 6/24/15 11:22 AM

13 | Capstone Turbine Corporation 2015 Annual Report | 14
10938_2015 Capstone Annual Report_23June.indd 13 6/24/15 11:22 AM

13 | Capstone Turbine Corporation 2015 Annual Report | 14
Features Benefits
Patented air bearing technology No lubricants or coolants needed
Clean waste heat Thermal energy for CHP and CCHP
Remote monitoring View performance and diagnostics 24/7
Capstone offers a comprehensive lineup of clean-and-green microturbines that are scalable from 30kW to 30MW and can operate on a variety of gaseous or liquid fuels. Capstone microturbines are the ideal solution for today’s distributed generation needs. Reliable power when and where you need it. Clean and simple.
BROAD SUITE OF PRODUCTS
Only one moving part Longer service intervals, low operating cost
High power density Compact footprint, small modular design
Stand alone or grid connect Multiple applications and industries
Wide fuel range Operates on gaseous, renewable and liquid fuels
COMPETITIVE ADVANTAGES
Advanced combustion controls Low emissions, no exhaust aftertreatment
10938_2015 Capstone Annual Report_23June.indd 14 6/24/15 11:22 AM

15 | Capstone Turbine Corporation 2015 Annual Report | 16
10938_2015 Capstone Annual Report_23June.indd 15 6/24/15 11:22 AM

15 | Capstone Turbine Corporation 2015 Annual Report | 16
Capstone’s global network of distribution partners provide on-site problem diagnosis and repairs any day of the year, ensuring minimal downtime for our customers’ operations.
Capstone provides factory and on-site training to certify all personnel that are allowed to perform service on our microturbines. Certified individuals are called authorized service providers (ASPs) and must be employed by a distributor in order to perform work pursuant to a Capstone FPP.
We are actively working with our ASPs to strengthen our service offerings and fine tune our FPP to provide higher availability and reliability through a more comprehensive service package. The success of Capstone hinges on both distributor and customer satisfaction. A greater focus on service has led our team to develop and implement a mutually agreeable, definable and actionable plan to advance the business and grow Capstone’s global presence.
Capstone has increased the emphasis on regional teams composed of representatives from our Sales and Marketing, Applications and Customer Service groups. These teams provide improved communication methods and better escalation processes that translate to a superior customer experience. The overarching goals, which stretch across the entire organization, are to maximize revenue
growth and heighten support for both our customers and distribution partners. Capstone prides itself on being the world’s leading clean technology manufacturer of microturbine energy systems. With this increased focus on aftermarket support around the world, Capstone is committed to providing the best customer service and product support.
We at Capstone understand the critical nature of reliable power generation. Capstone microturbines have approximately 60 million cumulative operating hours in the field and the installed base continues to grow. Manufacturing a reliable product is the first step to ensuring a customer’s needs are met and a working relationship is established. The next step is properly managing that relationship by providing the very best service and support in a timely manner.
Customers from each of our market segments, from oil and gas producers to food manufacturers, rely on our product expertise to guide them towards the return on their investment. We will continue to take the quality of our service business to the next level by working closely with our customers as they pursue their energy goals.
One of our top priorities going into fiscal 2016 is to further strengthen our aftermarket service business to better align with the needs of our customers.
AFTERMARKET SERVICES
FY14
$47.2M
FY15
$61.2M
FPP Backlog+30% from FY14
cumulative operating hours,15% increase from FY14
60M
10938_2015 Capstone Annual Report_23June.indd 16 6/24/15 11:22 AM

17 | Capstone Turbine Corporation 2015 Annual Report | 18
10938_2015 Capstone Annual Report_23June.indd 17 6/24/15 11:22 AM

17 | Capstone Turbine Corporation 2015 Annual Report | 18
Over the last year, Capstone has identified and successively targeted market segments that are experiencing significant growth. Shortly after signing a new Middle East and Africa distributor, Micro Turbine Power (M.T.P.), Capstone secured two major flare reduction projects in the region. With consistent onshore and offshore oil production in the Middle East and Africa, we anticipate substantial new business opportunities in these areas. Capstone is committed to expanding our global presence, especially in the developing regions of the world.
Capstone is also targeting new and emerging markets. For example, Malaysia has seen a surge in the demand and subsequent extraction of crude palm oil, making it the second largest palm oil producer in the world. Palm oil production plants require continuous power for around-the-clock manufacturing and Capstone microturbines are able to use the waste from the oil extraction process as a sustainable fuel for power generation. We are excited to be pursuing an industry conservatively estimated to be greater than $40 billion globally and one that is expected to double by 2020.
Our company has made improvements both internally and cooperatively with our distribution partners. Our flattened organizational approach will ensure that we create a more efficient management structure
to further capitalize on worldwide opportunities through increased collaboration and open communication. We will expand our global distributor network as a platform for long-term sustainable growth. The expansion of our distributor network provides Capstone a competitive advantage and will include new distributors being signed on as independent partners, as well as the goal of having our distributors increase their sales force by collectively adding 100 new sales positions to their staff during fiscal year 2016.
There have been new levels of excitement, dedication, teamwork and cross-functional cooperation within Capstone and across our greater distributor and OEM networks. By improving the quality and structure of our operations across our entire organization, Capstone will continue to lead the way in clean-and-green microturbine energy systems.
Our market-leading FPP closely aligns our service offering with customer requirements and we believe it is virtually unmatched in the industry. We look to accelerate our aftermarket service business to better leverage growth and improve overall margins.
We are more confident than ever that once the current economic challenges subside, we will emerge better positioned for global growth than ever before.
The future for Capstone is brighter than ever. Even with the global and economic challenges we faced over the past year, there are vast opportunities across all six of our vertical markets and in new and developing regions.
FUTURE GROWTH
10
$40 billion
distributors added in FY15
palm oil industry
10938_2015 Capstone Annual Report_23June_R1.indd 18 6/26/15 5:10 PM

19 | Capstone Turbine Corporation 2015 Annual Report | 20
10938_2015 Capstone Annual Report_23June.indd 19 6/24/15 11:22 AM

19 | Capstone Turbine Corporation 2015 Annual Report | 20
During fiscal 2015, our revenue was impacted by a weakness in the oil and gas market, stronger U.S. dollar and a challenging Russian economy. However, we did experience an increase in our Australian and South American markets by $3.6 million and $0.8 million, respectively, as the result of our continued efforts to improve our distribution channels in these developing regions. Capstone continues to invest in its aftermarket service business, creating both a market-leading FPP business and lower warranty expenses. Fiscal 2015 was the first year in which our FPP business generated both a higher percentage of revenue and a record level FPP backlog of $61.2 million. As a result of these efforts, we continue to create a more efficient business.
FINANCIAL AND OPERATING SUMMARY
OPERATING LEVERAGE
FY15FY14FY13FY12FY11FY10
$115.5$127.6
$133.1
$109.4
$81.9
$61.6
$14.7 $14.5$14.6$14.8$13.4$13.5
• Capstone’s product backlog as of March 31, 2015 was $165.7 million, down 3 percent year over year. On a unit basis we had 787 units, or 182.8 megawatts, in total backlog.
• Accessories, parts and service revenue increased
7 percent, to $26.1 million compared to fiscal 2014. The growing installed base of equipment is increasing demand for aftermarket parts and services, overhauls and upgrades.
• FPP backlog increased 30 percent compared to fiscal 2014, demonstrating our growing installed base around the world and affirming the market’s acceptance of our FPP offering.
• Warranty expense decreased 10 percent to $3.5
million compared to fiscal 2014. We are seeing improved product reliability, which decreases warranty and maintenance costs associated with our fixed price FPP contracts.
RESULTS AND HIGHLIGHTS
Revenue(Dollars in Millions)
Production Laborand Overhead(Dollars in Millions)
$24.3M
FY14 FY15
$26.1M
Accessories, Parts & Service
decrease in warranty expense in FY15
10%
10938_2015 Capstone Annual Report_23June_R1.indd 20 6/26/15 5:10 PM

KEY FINANCIAL FIGURESDollars in millions except gross margin, shares outstanding, loss per share, megawatts, and units shipped.
FY15 FY14 FY13 FY12 FY11 FY15 Y/Y
Revenue $115.5 $133.1 $127.6 $109.4 $81.9 (13%)
Gross Margin (Loss) % 16% 16% 11% 5% (1%) 0bps
Research and Development $9.7 $9.0 $9.0 $8.2 $7.0 8%
Selling, General, and Administrative(1) $39.5 $28.0 $27.4 $28.9 $26.2 41%
Loss from Operations ($30.9) ($15.3) ($22.0) ($31.7) ($33.7) 102%
Weighted Average Shares Outstanding (in millions) 328.0 307.1 302.2 266.9 245.9 7%
Loss per Share ($0.10) ($0.05) ($0.07) ($0.07) ($0.16) 100%
Stock-Based Compensation Expense $2.2 $2.1 $1.6 $1.7 $2.4 5%
Depreciation and Amortization $1.7 $2.3 $2.8 $3.4 $3.8 (26%)
Capital Expenditures $1.6 $1.2 $1.2 $1.4 $1.0 33%
Cash and Cash Equivalents $32.2 $27.9 $38.8 $50.0 $33.5 15%(1) The company recorded bad debt expense of approximetly $10.1 million, $0.2 million, $0.3 million, $2.3 million and $0.2 million for the years ended March 31, 2015, 2014, 2013, 2012 and 2011 respectively.
See also Notes to our Condensed Consolidated Financial Statements.
Supplemental Data (Unaudited)
New Orders $84.5 $131.5 $112.6 $122.5 $86.5 (36%)
New Orders in Megawatts 86 135.3 107.2 136.3 91.9 (36%)
Microturbine Units Shipped 620 671 628 627 611 (8%)
Megawatts Shipped 91.4 109.9 103.2 96.1 69.7 (17%)
Total Backlog $165.7 $171.6 $148.9 $139.0 $106.4 (3%)
FY11 FY12 FY13 FY14 FY15
106.4
139.0148.9
171.6165.7
Total Backlog(In Millions)
81.9
109.4
127.6133.1
115.5
FY11 FY12 FY13 FY14 FY15
Revenue(In Millions)
FY11 FY12 FY13 FY14 FY15
5%
11%
16% 16%
(1%)
Gross Margin (Loss)
21 | Capstone Turbine Corporation
10938_2015 Capstone Annual Report_23June_R1.indd 21 6/26/15 5:10 PM

UNITED STATESSECURITIES AND EXCHANGE COMMISSION
Washington, D.C. 20549
FORM 10-K(Mark One)
� ANNUAL REPORT PURSUANT TO SECTION 13 OR 15(d) OF THE SECURITIES EXCHANGEACT OF 1934
For the fiscal year ended March 31, 2015
or
� TRANSITION REPORT PURSUANT TO SECTION 13 OR 15(d) OF THE SECURITIESEXCHANGE ACT OF 1934
For the transition period from to
Commission file number 001-15957
CAPSTONE TURBINE CORPORATION(Exact name of registrant as specified in its charter)
Delaware 95-4180883(State or other jurisdiction of (I.R.S. Employerincorporation or organization) Identification No.)
21211 Nordhoff Street, 91311Chatsworth, California (Zip Code)
(Address of principal executive offices)(818) 734-5300
(Registrant’s telephone number, including area code)Securities registered pursuant to Section 12(b) of the Act:
Title of each class Name of exchange on which registered
Common Stock, par value $.001 per share NASDAQ Global MarketSeries A Preferred Stock Purchase Rights
Securities registered pursuant to Section 12(g) of the Act: None
Indicate by check mark if the registrant is a well-known seasoned issuer, as defined in Rule 405 of the SecuritiesAct. Yes � No �
Indicate by check mark if the registrant is not required to file reports pursuant to Section 13 or Section 15(d) of theAct. Yes � No �
Indicate by check mark whether the registrant (1) has filed all reports required to be filed by Section 13 or 15(d) ofthe Securities Exchange Act of 1934 during the preceding 12 months (or for such shorter period that the registrant wasrequired to file such reports), and (2) has been subject to such filing requirements for the past 90 days. Yes � No �
Indicate by check mark whether the registrant has submitted electronically and posted on its corporate Web site, ifany, every Interactive Data File required to be submitted and posted pursuant to Rule 405 of Regulation S-T (§232.405 ofthis chapter) during the preceding 12 months (or for such shorter period that the registrant was required to submit and postsuch files). Yes � No �
Indicate by check mark if disclosure of delinquent filers pursuant to Item 405 of Regulation S-K is not containedherein, and will not be contained, to the best of registrant’s knowledge, in definitive proxy or information statementsincorporated by reference in Part III of this Form 10-K or any amendment to this Form 10-K. �
Indicate by check mark whether the registrant is a large accelerated filer, an accelerated filer, a non-accelerated filer,or a smaller reporting company. See the definitions of ‘‘large accelerated filer,’’ ‘‘accelerated filer’’ and ‘‘smaller reportingcompany’’ in Rule 12b-2 of the Exchange Act.
Large accelerated filer � Accelerated filer � Non-accelerated filer � Smaller reporting company �(Do not check if a
smaller reporting company)
Indicate by check mark whether the registrant is a shell company (as defined in Rule 12b-2 of the ExchangeAct). Yes � No �
The aggregate market value of the shares of Common Stock of the registrant held by non-affiliates on September 30,2014 was approximately $353.3 million.
As of June 8, 2015, there were 330,689,556 shares of the registrant’s Common Stock issued and outstanding.
DOCUMENTS INCORPORATED BY REFERENCE
Portions of the definitive proxy statement relating to the registrant’s 2015 annual meeting of stockholders areincorporated by reference into Part III of this report to the extent described therein.

CAPSTONE TURBINE CORPORATION
FORM 10-K
TABLE OF CONTENTS
Page
PART IItem 1. Business . . . . . . . . . . . . . . . . . . . . . . . . . . . . . . . . . . . . . . . . . . . . . . . . . . . . . . . . 2Item 1A. Risk Factors . . . . . . . . . . . . . . . . . . . . . . . . . . . . . . . . . . . . . . . . . . . . . . . . . . . . . . 18Item 1B. Unresolved Staff Comments . . . . . . . . . . . . . . . . . . . . . . . . . . . . . . . . . . . . . . . . . . 32Item 2. Properties . . . . . . . . . . . . . . . . . . . . . . . . . . . . . . . . . . . . . . . . . . . . . . . . . . . . . . . 32Item 3. Legal Proceedings . . . . . . . . . . . . . . . . . . . . . . . . . . . . . . . . . . . . . . . . . . . . . . . . . 33Item 4. Mine Safety Disclosures . . . . . . . . . . . . . . . . . . . . . . . . . . . . . . . . . . . . . . . . . . . . . 33
PART IIItem 5. Market for Registrant’s Common Equity, Related Stockholder Matters and Issuer
Purchases of Equity Securities . . . . . . . . . . . . . . . . . . . . . . . . . . . . . . . . . . . . . . . 33Item 6. Selected Financial Data . . . . . . . . . . . . . . . . . . . . . . . . . . . . . . . . . . . . . . . . . . . . . 34Item 7. Management’s Discussion and Analysis of Financial Condition and Results of
Operations . . . . . . . . . . . . . . . . . . . . . . . . . . . . . . . . . . . . . . . . . . . . . . . . . . . . . 35Item 7A. Quantitative and Qualitative Disclosures About Market Risk . . . . . . . . . . . . . . . . . . 53Item 8. Financial Statements and Supplementary Data . . . . . . . . . . . . . . . . . . . . . . . . . . . . . 53Item 9. Changes in and Disagreements with Accountants on Accounting and Financial
Disclosure . . . . . . . . . . . . . . . . . . . . . . . . . . . . . . . . . . . . . . . . . . . . . . . . . . . . . 53Item 9A. Controls and Procedures . . . . . . . . . . . . . . . . . . . . . . . . . . . . . . . . . . . . . . . . . . . . . 53Item 9B. Other Information . . . . . . . . . . . . . . . . . . . . . . . . . . . . . . . . . . . . . . . . . . . . . . . . . 56
PART IIIItem 10. Directors, Executive Officers and Corporate Governance . . . . . . . . . . . . . . . . . . . . . 56Item 11. Executive Compensation . . . . . . . . . . . . . . . . . . . . . . . . . . . . . . . . . . . . . . . . . . . . . 56Item 12. Security Ownership of Certain Beneficial Owners and Management and Related
Stockholder Matters . . . . . . . . . . . . . . . . . . . . . . . . . . . . . . . . . . . . . . . . . . . . . . 57Item 13. Certain Relationships and Related Transactions, and Director Independence . . . . . . . 57Item 14. Principal Accounting Firm Fees and Services . . . . . . . . . . . . . . . . . . . . . . . . . . . . . . 57
PART IVItem 15. Exhibits and Financial Statement Schedules . . . . . . . . . . . . . . . . . . . . . . . . . . . . . . . 58

PART I
Item 1. Business.
Overview
Capstone Turbine Corporation (‘‘Capstone’’ or the ‘‘Company’’) develops, manufactures, marketsand services microturbine technology solutions for use in stationary distributed power generationapplications, including cogeneration (combined heat and power (‘‘CHP’’), integrated combined heatand power (‘‘ICHP’’), and combined cooling, heat and power (‘‘CCHP’’)), renewable energy, naturalresources and critical power supply. In addition, our microturbines can be used as battery charginggenerators for hybrid electric vehicle applications. Microturbines allow customers to produce poweron-site in parallel with the electric grid or stand alone when no utility grid is available. Severaltechnologies are used to provide ‘‘on-site power generation’’ (also called ‘‘distributed generation’’) suchas reciprocating engines, solar power, wind powered systems and fuel cells. For customers who do nothave access to the electric utility grid, microturbines provide clean, on-site power with fewer scheduledmaintenance intervals and greater fuel flexibility than competing technologies. For customers withaccess to the electric grid, microturbines provide an additional source of continuous duty power,thereby providing additional reliability and potential cost savings. With our stand-alone feature,customers can produce their own energy in the event of a power outage and can use microturbines astheir primary source of power for extended periods. Because our microturbines also produce clean,usable heat energy, they provide economic advantages to customers who can benefit from the use ofhot water, chilled water, air conditioning and heating. Our microturbines are sold, installed andserviced primarily through our global distribution network. Together we offer new and remanufacturedparts as well as a comprehensive Factory Protection Plan (‘‘FPP’’). Successful implementation ofmicroturbines relies on the quality of the microturbine, marketability for appropriate applications, andthe quality of the installation and support.
We believe we were the first company to offer a commercially available power source usingmicroturbine technology. Capstone offers microturbines designed for commercial, industrial and utilityusers with product offerings ranging from 30 kilowatts (‘‘kW’’) to one megawatt in electric poweroutput. Our 30 kW (‘‘C30’’) microturbine can produce enough electricity to power a small conveniencestore. The 65 kW (‘‘C65’’) microturbine can produce enough heat to provide hot water to a 100-roomhotel while also providing about one-third of its electrical requirements. Our 200 kW (‘‘C200’’)microturbine is well suited for larger hotels, office buildings and wastewater treatment plants, amongothers. By packaging the C200 microturbine power modules into an International Organization forStandardization (‘‘ISO’’) sized container, Capstone has created a family of microturbine offerings from600 kW up to one megawatt in a compact footprint. Our 1000 kW (‘‘C1000 Series’’) microturbines arewell suited for utility substations, larger commercial and industrial facilities and remote oil and gasapplications. Our microturbines combine patented air-bearing technology, advanced combustiontechnology and sophisticated power electronics to form efficient and ultra-low emission electricity andcooling and heat production systems. Because of our air-bearing technology, our microturbines do notrequire liquid lubricants. This means they do not require routine maintenance to change and dispose ofoil or other liquid lubricants, as do the most common competing products. Capstone microturbines canbe fueled by various sources, including natural gas, propane, sour gas, renewable fuels such as landfillor digester gas, kerosene, diesel and biodiesel. The C65 and C200 microturbines are available withintegrated heat exchangers, making them easy to engineer and install in applications where hot water isused. Our products produce exceptionally clean power. Our natural gas-fueled C65 andC200 microturbines were certified by the California Air Resources Board (‘‘CARB’’) as meeting itsstringent 2007 emissions requirements—the same emissions standard used to certify fuel cells and thesame emissions levels as a state-of-the-art central power plant. Our C65 Landfill and Digester Gassystems were certified in January 2008 by CARB as meeting 2008 waste gas emissions requirements forlandfill and digester gas applications. Our C200 Landfill and Digester Gas systems were certified in
2

November 2010 by CARB as meeting 2008 waste gas emissions requirements for landfill and digestergas applications.
On February 1, 2010, we acquired the 100 kW (‘‘TA100’’) microturbine product line from CalnetixPower Solutions, Inc. (‘‘CPS’’). The TA100 microturbine is most similar to the Capstone product designcompared to other microturbine products in the industry.
We sell complete microturbine units, subassemblies, components and various accessories. We alsoremanufacture microturbine engines and provide after-market parts and services. Our microturbines aresold primarily through distributors and Original Equipment Manufacturers (‘‘OEMs’’). Distributorspurchase our products for sale to end users and also provide application engineering and installationsupport. Distributors are also required to provide a variety of additional services, including engineeringthe applications in which the microturbines will be used, installation support of the products at the endusers’ sites, commissioning the installed applications and providing post-commissioning service. Ourdistributors perform as value-added resellers. OEMs integrate Capstone’s products into their ownproduct solutions.
To assure proper installation of Capstone microturbine systems, we have instituted a FactoryTrained Installer (‘‘FTI’’) training and certification program. Personnel from our distributors andOEMs, as well as design engineering firms, contractors and end users attend this FTI training. We offerto assist all customers by reviewing their installation designs to confirm that the technical requirementsfor proper operation have been met, such as electrical interconnections, load requirements, fuel typeand pressure, cooling air flow and turbine exhaust routing. As part of the microturbine commissioningprocess, we also receive a checklist to confirm that the final installation adheres to Capstone technicalrequirements before we accept any warranty obligations. This is aimed at providing the end user with aproper installation that will operate as expected for the life of the equipment.
Through our global distribution network, we offer a comprehensive FPP for a fixed annual fee toperform regularly scheduled and unscheduled maintenance as needed. Capstone provides factory andon-site training to certify all personnel that are allowed to perform service on our microturbines.Individuals who are certified are called Authorized Service Providers (‘‘ASPs’’), and must be employedby a distributor in order to perform work pursuant to a Capstone FPP. The majority of our distributorsprovide these services.
This Annual Report on Form 10-K (this ‘‘Form 10-K’’) refers to Capstone’s fiscal years endingMarch 31 as its ‘‘Fiscal’’ years.
Our Products
We began commercial sales of our C30 products in 1998, targeting the emerging distributedgeneration industry that was being driven by fundamental changes in power requirements. InSeptember 2000, we shipped the first commercial unit of our 60 kW microturbine (‘‘C60’’), which wasreplaced by the C65 model during the quarter ended March 31, 2006. We began shipping theC60 ICHP solution in 2003. The first commercial C200 microturbine was shipped on August 28, 2008.Our C1000 Series product was developed based on Capstone’s C200 microturbine engine. TheC1000 Series product can be configured into 1,000 kW, 800 kW and 600 kW solutions in a singleISO-sized container. The first commercial shipment of our C1000 Series product was on December 29,2008. We began shipping TA100 microturbines in March 2010.
During Fiscal 2015, we booked total orders of $84.5 million for 587 units, or 86.0 megawatts,compared to $131.5 million for 675 units, or 135.3 megawatts, during Fiscal 2014. We shipped 620 unitswith an aggregate of 91.4 megawatts, generating revenue of $90.4 million compared to 671 units withan aggregate of 109.9 megawatts, generating revenue of $108.8 million during Fiscal 2014. Total backlogas of March 31, 2015 decreased $5.9 million, or 3%, to $165.7 million from $171.6 million at March 31,
3

2014. As of March 31, 2015, we had 787 units, or 182.8 megawatts, in total backlog compared to820 units, or 188.2 megawatts, at the same date last year. The decrease in backlog was primarily theresult of the downturn of the oil markets, a substantially stronger U.S. dollar making our productsmore expensive overseas and on-going geopolitical tensions in Russia, North Africa and the MiddleEast. The timing of the backlog is based on the requirement date indicated by our customers. However,based on historical experience, management expects that a significant portion of our backlog may notbe shipped within the next twelve months. The timing of shipments is subject to change based onseveral variables (including customer deposits, payments, availability of credit and customer deliveryschedule changes), most of which are not in our control and can affect the timing of our revenue.
The following table summarizes our backlog:
As of March 31,
2015 2014
Megawatts Units Megawatts Units
C30 . . . . . . . . . . . . . . . . . . . . . . . . . . . . . . . . . . . . . . . . . . . . . 2.9 97 3.0 101C65 . . . . . . . . . . . . . . . . . . . . . . . . . . . . . . . . . . . . . . . . . . . . . 32.6 502 33.8 520TA100 . . . . . . . . . . . . . . . . . . . . . . . . . . . . . . . . . . . . . . . . . . . 1.9 19 1.9 19C200 . . . . . . . . . . . . . . . . . . . . . . . . . . . . . . . . . . . . . . . . . . . . 2.4 12 3.4 17C600 . . . . . . . . . . . . . . . . . . . . . . . . . . . . . . . . . . . . . . . . . . . . 7.2 12 9.0 15C800 . . . . . . . . . . . . . . . . . . . . . . . . . . . . . . . . . . . . . . . . . . . . 9.8 12 8.8 11C1000 . . . . . . . . . . . . . . . . . . . . . . . . . . . . . . . . . . . . . . . . . . . 125.0 125 127.0 127Waste heat recovery generator . . . . . . . . . . . . . . . . . . . . . . . . . 1.0 8 1.3 10
Total Backlog . . . . . . . . . . . . . . . . . . . . . . . . . . . . . . . . . . . . . . . 182.8 787 188.2 820
Capstone microturbines are compact, lightweight and environmentally friendly generators ofelectricity and heat compared to competing technologies. They operate on the same principle as a jetengine with the added capability of using a variety of commercially available fuels. For example, ourmicroturbines can operate on low British Thermal Unit (‘‘BTU’’) gas, which is gas with lower energycontent, and can also operate on gas with a high amount of sulfur, known in the industry as sour gas.Examples of these fuel sources include methane from facilities such as wastewater treatment plants,landfills and anaerobic digesters.
Our microturbines incorporate four major design features:
• advanced combustion technology;
• patented air-bearing technology;
• digital power electronics; and
• remote monitoring capability.
Our advanced combustion technology allows Capstone microturbines to achieve low emissions witha design geared towards manufacturability. These low emission levels not only provide anenvironmentally friendly product, but also eliminate permitting requirements in several municipalitiesfor continuously operated onsite power generation. The air-bearing system allows the microturbine’ssingle moving assembly to produce power without the need for typical petroleum-based lubrication.Air-bearings use a high-pressure field of air rather than petroleum lubricants. This improves reliabilityand reduces maintenance such as oil changes. The electronic controls manage critical functions andmonitor operations of the microturbine. For instance, our electronics control the microturbine’s speed,temperature and fuel flow and communicate with external networks and building management systems.The power electronics coordinate with the grid when the units are operated in a grid-connect modeand with the onboard battery when equipped for stand-alone mode. All control functions are
4

performed digitally. Performance is optimized, resulting in lower emissions, higher reliability and highefficiency over a variable power range.
The electrical output of our units can be paralleled in multiple unit configurations through ourAdvanced Power Server product and a digital communications cable to serve larger installationsrequiring electrical loads up to ten megawatts.
Our products can operate:
• connected to the electric utility grid as a current source;
• on a stand-alone basis as a voltage source;
• multipacked to support larger loads as a ‘‘virtual single’’ unit; and
• in dual mode, where the microturbine operates connected to the electric utility grid or operatesindependently.
We also offer C65 and C200 ICHP systems. These systems combine the standard C65 andC200 microturbine unit with a heat recovery module that provides electricity and heats water.
Our family of products is offered in the following configurations:
C30 C65 TA100 C200 C1000 Series
Grid Dual Grid Dual Grid Dual Grid Dual Grid DualFuel Types Connect Mode Connect Mode Connect Mode Connect Mode Connect Mode
Low pressure natural gas . . . . X X X X X X X X X XHigh pressure natural gas . . . . X X X X X X X X X XCompressed natural gas . . . . . X X X X X X X X X XLandfill gas . . . . . . . . . . . . . . X X X XDigester gas . . . . . . . . . . . . . . X X X XGaseous propane . . . . . . . . . . X X X X X X X XHigh pressure sour gas . . . . . . X X X X X X X XDiesel . . . . . . . . . . . . . . . . . . X X X X X X X XKerosene . . . . . . . . . . . . . . . . X X X X
We offer various accessories for our products including rotary gas compressors with digitalcontrols, heat recovery modules for CHP applications, dual mode controllers that allow automatictransition between grid connect and stand-alone modes, batteries with digital controls for stand-aloneor dual-mode operations, power servers for large multipacked installations, protocol converters forInternet access, packaging options and miscellaneous parts such as frames, exhaust ducting andinstallation hardware. We also sell microturbine components and subassemblies.
Our electronic controls manage microturbines using Capstone’s proprietary software and advancedalgorithms. The controls:
• start the turbogenerator and manage its load;
• coordinate the functioning of the microturbine with the grid;
• manage the speed, fuel flow and exhaust temperature of the microturbine;
• convert the variable frequency, up to a maximum of 1,600 Hertz and variable voltage powerproduced by the generator into a usable output of either 50 or 60 Hertz AC for stationaryapplications or DC for hybrid electric vehicle applications; and
• provide digital communications to externally maintain and control the equipment.
5

In addition, our proprietary Capstone Remote Monitoring Software (‘‘CRMS’’) allows end users toremotely operate and manage the microturbine. Unlike the technology of other power sources thatrequire on-site monitoring and maintenance, the CRMS allows end users to remotely and efficientlymonitor their microturbine systems. This remote capability can provide end users with powergeneration flexibility and cost savings.
The C30 microturbines were initially designed to operate connected to an electric utility grid andto use a high pressure natural gas fuel source. We have expanded our microturbine’s functionality tooperate with different fuels. The combustor system remains the same for all fuels except for the fuelinjectors, which currently vary between liquid and gaseous fuels. The Capstone microturbine’s multi-fuelcapability provides significant competitive advantages with respect to some of our selected verticalmarkets.
Our C65 grid-connect and stand-alone microturbine power systems are listed by UnderwritersLaboratories (‘‘UL’’) as meeting the UL 2200 stationary engine generator standards and the UL 1741utility interconnection requirements. Our products are manufactured by processes that areISO 9001:2008 and ISO 14001:2004 certified.
In 2002, the California Energy Commission certified our C30 and C60 microturbines as the firstproducts to comply with the requirements of its ‘‘Rule 21’’ grid interconnection standard. This standardstreamlines the process for connecting distributed generation systems to the grid in California. Thebenefits of achieving this standard include avoiding both costly external equipment procurementrequirements and extensive site-by-site and utility-by-utility analysis. Our protective relay functionalityhas also been recognized by the State of New York, which has pre-cleared our microturbines forconnection to New York’s electric utility grid.
Our C60 microturbine was the first combustion power generation product to be certified by theCARB as meeting its stringent distributed generation emissions standards that went into effect in 2003.Our C65 microturbine now meets the even more stringent CARB 2007 standard for natural gas.
The TA100 microturbine offers a digital communication interface which can be connected to anexternal controller (not sold by Capstone) to provide multiple unit and dual mode dispatchingfunctionality. An external synchronization board is provided to parallel the electrical output in multipleunit configurations for stand-alone operation.
We are the first microturbine manufacturer to achieve UL Class I, Division 2 certification foroperation in hazardous-area oil and gas applications. These specially packaged systems are applied inoil and gas production areas with potentially explosive environments. In September 2009, we receivedUL certification for our C200 grid-connect and stand-alone microturbine as meeting the UL 2200stationary engine generator standards and the UL 1741 utility interconnection requirements. In June2010, we received UL certification for our C1000 Series grid-connect and stand-alone microturbine asmeeting the UL 2200 stationary engine generator standards and the UL 1741 utility interconnectionrequirements.
Applications
Worldwide, stationary power generation applications vary from huge central stationary generatingfacilities up to 1,000 MW to back-up generators as small as 2 kW. Historically, power generation inmost developed countries such as the United States has been part of a regulated utility system. Anumber of developments related primarily to the deregulation of the utility industry as well assignificant technology advances have broadened the range of power supply choices available to all typesof customers.
Capstone products serve multiple vertical markets worldwide. Within the markets served, we focuson vertical markets that we have identified as having the greatest near-term potential. In the markets
6

we are focusing on, which are energy efficiency, renewable energy, natural resources, critical powersupply, transportation and marine, we have identified specific targeted vertical market segments.
Energy Efficiency—CHP/CCHP
Energy efficiency maximizes the use of energy produced by the microturbines, reduces emissionscompared with traditional power generation and enhances the economic advantage to customers.Energy efficiency uses both the heat and electric energy produced in the power generation process.Using the heat and electricity created from a single combustion process increases the efficiency of thesystem from approximately 30% to 75% or more. The increased operating efficiency reduces overallgreenhouse gas emissions compared with traditional independent sources such as power generation andlocal thermal generation and, through displacement of other separate systems, can reduce operatingcosts. Our microturbines’ emissions of commonly found air pollutants (‘‘criteria pollutants’’), such asnitrogen oxides (‘‘NOx’’), carbon monoxide (‘‘CO’’) and volatile organic compounds (‘‘VOCs’’), arelower than those from the on-site boilers that our CHP system displaces, meaning that local emissionsof these pollutants are actually reduced when a Capstone energy efficiency CHP system is installed.This high CHP efficiency also means more efficient use of fuel and can reduce net utility costs for endusers. The most common uses of heat energy include space heating and air conditioning, heating andcooling water, as well as drying and other applications. For example, we have used the heat generatedby the microturbines to supply hot water solutions for hotels, office buildings and retail, commercialand industrial customers. When our microturbine exhaust drives an absorption chiller, the chillerproduces chilled water for air conditioning and other uses.
There are energy efficiency markets for CHP and CCHP applications worldwide. A U.S.Department of Energy (‘‘DOE’’) report cited the total technical potential for the energy efficiency CHPat commercial, institutional and industrial sites in the United States to be over 130 gigawatts. Manygovernments have encouraged more efficient use of the power generation process to reduce pollution,lower dependence on fossil fuels and control the cost of locally produced goods. To access thesemarkets, we have entered into agreements with distributors which have engineered energy efficiencyCHP packages that utilize the hot exhaust air of the microturbine for heating water and also use thehot exhaust to run an absorption chiller for air conditioning. We also offer our own integrated energyefficiency CHP and CCHP product for the C65, C200 and C1000 Series products.
Renewable Energy
Our microturbines can use renewable methane gases from landfills, wastewater treatment facilitiesand other biogas applications such as food processing and agricultural waste, referred to as greenwaste, and cow, pig and chicken manure. They can burn these renewable waste gases with minimalemissions, thereby, in some cases, avoiding the imposition of penalties incurred for pollution whilesimultaneously producing electricity from this ‘‘free’’ renewable fuel for use at the site or in thesurrounding areas. The microturbines have demonstrated effectiveness in these applications andoutperform conventional combustion engines in a number of situations, including when the gas containsa high amount of sulfur.
Capstone released for sale the C65 stand-alone digester product in the renewable energy marketsegment in 2007. This product is targeted at remote villages in third-world countries with wastewatertreatment facilities that offer a valuable source of fuel which can be converted to electricity. A jointapplications and engineering team evaluated the performance of the existing C65 digester gas system toensure that the combustion system would be stable from 0 to 100% power output. Minor controlschanges were implemented to increase stability at low power levels. The ability to convert this low BTUfuel to electricity along with the high reliability and low maintenance features of this product make itwell suited for this market.
7

Natural Resources—Oil, Natural Gas, Shale Gas & Mining
On a worldwide basis, there are thousands of locations where the drilling, production, compressionand transportation of natural resources and other extraction and production processes create fuelbyproducts, which traditionally have been released or burned into the atmosphere. Our microturbinesare installed in the natural resource market to be used in oil and gas exploration, production,compression and transmission sites both onshore and offshore as a highly reliable critical source ofpower generation. In addition, our microturbines can use flare gas as a fuel to provide prime power.Typically these oil and gas or mining operations have no electric utility grid and rely solely onCapstone’s microturbine for reliable low emission power supply.
Many major oil and gas companies are exploring large shale reserves, or plays, in the UnitedStates. In mid-2010 Capstone sold its first microturbines into the U.S. shale gas market in the EagleFord and Marcellus shale plays. The addressable market for Capstone microturbines in this industry issignificant. The shale gas market for microturbines is expected to grow substantially as demand fornatural gas continues to rise and the U.S. Environmental Protection Agency (‘‘EPA’’), the Departmentof the Interior and other federal and state agencies work to reduce emissions of methane, volatileorganic compounds and hazardous air pollutants associated with natural gas development. Capstone hasbeen invited to participate in numerous Natural Gas STAR workshops in the United States and foreignmarkets to demonstrate the emissions reductions our technology can provide.
The C200 product is offered for sale configured to meet Class 1 Zone 2 hazardous locationrequirements for the oil and gas market. Hazardous location requirements are met through packageventilation changes for purging and pressurizing package air to avoid potential flammable mixtures aswell as controls for emergency disconnect of fuel and electrical sources. The package is upgraded tostainless steel construction to withstand the corrosive offshore environments where these units areinstalled. Oil and gas customers prefer the low maintenance and high reliability attributes offered byour turbines to ensure continued production. Capstone also offers C30 and C65 microturbine productsin similar configurations.
Critical Power Supply
Because of the potentially catastrophic consequences of even momentary system failure, certainpower users such as high technology, health care and information systems facilities require particularlyhigh levels of reliability in their power service. To meet these customer requirements, traditionalsolutions utilize Uninterruptible Power Supplies (‘‘UPS’’) to protect critical loads from momentarypower disturbances along with backup diesel generators for extended outages. Capstone offers analternative solution that can both meet customer reliability requirements and reduce operating costs.
Capstone has developed the world’s only microturbine powered UPS solutions that offer clean,IT-grade power and can completely displace the need for traditional UPS and backup diesel generators.We offer two microturbine-powered UPS solutions. The Capstone UPSource microturbine-poweredUPS solution provides prime or emergency power solutions. Capstone’s Hybrid UPS microturbinepowered solution provides power when dispatched in high efficiency, standard UPS and emergencypower solutions. Both critical power supply products offer 99.999999% availability in an n+1configuration when the product has at least one independent backup. Our microturbine-powered UPSsolutions are UL listed. These integrated solutions are ideal for new construction or facility expansionand are typically installed with absorption chillers or other heat recovery systems to obtain highefficiency and reduce operating costs compared with traditional solutions.
Dual mode units operating in a prime power configuration can support a 150% overload for10 seconds during transient conditions. Dual mode units operating in grid parallel mode can providecustomers a back-up power system with an economic return. These systems offer high onsite energyefficiency when combined with a heat exchanger (CHP) to create hot water or with a chiller (CCHP)
8

for air conditioning at these facilities. This configuration, when combined with the Capstone DualMode Controller, can transition from the grid parallel mode to prime power mode in less than tenseconds. Capstone microturbines can also be installed along with a rotary UPS to provide a completeline-interactive continuous power solution. In this case, the microturbines remain in grid connect modewhile the rotary UPS stabilizes the utility voltage and provides a seamless transfer from operationconnected to the grid to operation isolated from the grid.
Transportation
Our technology is also used in hybrid electric vehicle (‘‘HEV’’) applications. Our customers haveapplied our products in hybrid electric vehicles such as transit buses and trucks. In these applicationsthe microturbine acts as an onboard battery charger to recharge the battery system as needed. Thebenefits of microturbine hybrids include extended range, fuel economy gains, quieter operation,reduced emissions and higher reliability compared with traditional internal combustion engines. Internalcombustion diesel engine manufacturers have been challenged for the last several years to developtechnology improvements, prior to aftertreatment that reduce emissions to levels specified by the EPAand CARB 2007 and 2010 standards. Many manufacturers are incorporating aftertreatment thatincreases upfront equipment costs, vehicle weight and life cycle costs and may reduce overall engineefficiency.
Marine
Our technology is also used in marine applications. Our customers have applied our products inthe commercial vessel and luxury yacht markets. The most immediate market for our marine productsis for use as a ship auxiliary engine. In this application, the microturbines provide power to the vessel’selectrical loads and, in some cases, the vessel is able to utilize the exhaust energy to increase theoverall efficiency of the application, reducing overall fuel consumption and emissions. The otherapplication is similar to our HEV application where the vessel is driven by an electric propulsionsystem and the microturbine serves as an on board range extender. Our marine customers use both ourliquid fueled and natural gas products. Liquefied natural gas (‘‘LNG’’) is in its early stages as a marinefuel, and the number of vessels powered by LNG is forecasted to double every two years over the nextdecade. Vessel owners can receive the same benefits as users of stationary Capstone products: lowemissions with no aftertreatment, long maintenance intervals, high reliability, low noise and novibration.
Sales, Marketing and Distribution
We primarily sell our microturbine product, parts and service through distributors. Our world-widedistribution network is our most valuable intangible asset that we have proudly developed from theground up. Each one of our distributors is a strategically placed independent partner of Capstonemarketing and selling the Capstone products and services on our behalf. Our typical terms of saleinclude shipment of the products with title, care, custody and control transferring at our dock, paymentdue anywhere from in advance of shipment to 90 days from shipment, and warranty periods ofapproximately 15 to 18 months from shipment. We typically do not have customer acceptanceprovisions in our agreements.
North America
We have distribution agreements with a number of companies throughout North America for theresale of our products. Many of these distributors serve multiple markets in their select geographicregions. The primary markets served in this region have been energy efficiency, renewable energy,natural resources, critical power and mobile products. The energy efficiency and natural resourcesvertical markets are expected to grow as a result of an increased domestic production of hydrocarbons,the low downstream price of natural gas and public and regulatory acceptance of distributedgeneration.
9

Recent energy reform in Mexico has opened new market opportunities by allowing competitionand enabling power generation companies to sell directly to consumers instead of only to the state-owned Federal Electricity Commission. Capstone’s strategy in Mexico is to leverage our distributionnetwork in Mexico across various market verticals.
In developing our sales opportunities we have identified the need to address various requirementspresent in our target localities. These requirements include electric grid interconnection standards, gasutility connection requirements, emissions standards, building and fire safety codes and variousinspections and approvals. The costs and scheduling ramifications of these various approvals, inconjunction with normal bidding process requirements and construction delays, can be significant to thecompletion of an installation. Our goal is to work with the applicable regulating entities to establishcompliant standards for the installation of our microturbines so that the costs and installation timelinesare minimized for our customers. Management believes that we can create market advantages for ourproducts through enhancing the ease of deploying our distributed generation solutions.
Asia and Australia
Our sales and marketing strategy in Asia and Australia has been to develop and strengthendistributor relationships throughout these continents.
Our target markets in Asia and Australia are energy efficiency, renewable energy and naturalresources. Our historical sales in Southeast Asia and Australia have primarily been in the CHP, CCHPand the oil and gas market. Other areas in Asia and the Pacific Rim offer attractive opportunities aswell. China is expected to see growth in the oil and gas market, while biogas recovery is showing signsof growth in Southeast Asia.
Middle East and Africa
Our target market in the Middle East and Africa is primarily oil and gas. Flare gas to powerprojects are a particularly attractive market opportunity given the volume of gas being flared and theacute and chronic need for stable power in the region. Management has targeted distributors andcustomers involved in the capture and use of flare gas in the oil and gas market. However, thegeopolitical environment in this region is still volatile, which can impact our sales.
Europe and Russia
To address the European market, including Russia, we are strengthening our relationships withexisting and new distributors and have increased Capstone local sales and service support. We have anoffice in Europe for the purpose of working with our distributors there on a daily basis to realizegrowth opportunities. We have established a spare parts distribution center in Europe to make partsreadily available to our distributors. Europe has a history of extensive use of distributed generationtechnologies. During Fiscal 2015, the pace of economic recovery in Europe was slow and demandremained soft with a decrease in revenue of 30%, primarily from Russia, compared to Fiscal 2014.Further, the continuation or escalation of the current geopolitical instability in Russia and Ukrainecould continue to negatively impact our operations, sales, and future growth prospects in that region.For more information, see ‘‘Risk Factors’’ beginning on Page 14 of this Form 10-K.
South America
South America constitutes a diverse group of markets that vary greatly in potential capture forCapstone based on a number of factors including availability of oil and gas production andtransmission, energy pricing and political and investment climate. While Capstone has distributors innearly all South American countries, management is focused on what we consider to be the topmarkets, such as Colombia, Brazil, Chile and Ecuador. Our target markets in South America are
10

energy efficiency, renewable energy and natural resources. Our historical sales in South America haveprimarily been in the natural resources market.
Revenue
For geographic and segment revenue information, please see Note 2—Summary of SignificantAccounting Policies—Segment Reporting in the ‘‘Notes to Consolidated Financial Statements.’’
Customers
Sales to Horizon Power Systems (‘‘Horizon’’), one of the Company’s domestic distributors,accounted for 17%, 12% and 27% of our revenue for the years ended March 31, 2015, 2014 and 2013,respectively. Sales to BPC Engineering (‘‘BPC’’), one of the Company’s Russian distributors, accountedfor 11%, 17% and 11% of our revenue for the years ended March 31, 2015, 2014 and 2013,respectively. Sales to E-Finity Distributed Generation, LLC (‘‘E-Finity), one of the Company’s domesticdistributors, accounted for 19% of our revenue for the year ended March 31, 2014. Additionally,Optimal Group Australia Pty Ltd (‘‘Optimal’’), one of the Company’s Australian distributors, accountedfor 17% of net accounts receivable as of March 31, 2015. BPC, Electro Mecanique Industries (‘‘EMI’’),one of the Company’s distributors in the Middle East and Africa, and E-Finity accounted for 26%,18% and 16%, respectively, of net accounts receivable as of March 31, 2014.
During the three months ended March 31, 2015, we recorded approximately $7.1 million withrespect to the accounts receivable allowance from BPC. We determined that the collectability of thisaccounts receivable balance was not reasonably assured based on BPC’s recent payment history andbecause the impact of the steep decline of the Russian ruble could continue to negatively impact itsability to pay its outstanding accounts receivable balance. Also during the three months endedSeptember 30, 2014, we recorded approximately $2.6 million with respect to the accounts receivableallowance from EMI. We determined that the collectability of this accounts receivable balance was notreasonably assured based on EMI’s payment history. The Company recorded bad debt expense ofapproximately $10.1 million, $0.2 million and $0.3 million for the years ended March 31, 2015, 2014and 2013, respectively.
Competition
The market for our products is highly competitive. Our microturbines compete with existingtechnologies such as reciprocating engines and may also compete with emerging distributed generationtechnologies, including solar power, wind-powered systems, fuel cells and other microturbines. Manypotential customers rely on the utility grid for their electrical power. Many of our distributedgeneration competitors are large, well-established companies that derive competitive advantages fromproduction economies of scale, worldwide presence, brand recognition and greater resources which theycan devote to product development or promotion.
Generally, power purchased from the electric utility grid is less costly than power produced bydistributed generation technologies. Utilities may also charge fees to interconnect to their power grids.However, we can provide economic benefits to end users in instances where the waste heat from ourmicroturbine has value (CHP and CCHP), where fuel costs are low (renewable energy/renewable fuels),where the costs of connecting to the grid may be high or impractical (such as remote powerapplications), where reliability and power quality are of critical importance, or in situations where peakshaving could be economically advantageous because of highly variable electricity prices. BecauseCapstone microturbines can provide a reliable source of power and can operate on multiple fuelsources, management believes they offer a level of flexibility not currently offered by other technologiessuch as reciprocating engines.
11

Our reciprocating engine competitors have products and markets that are well developed andtechnologies that have been proven for some time. A reciprocating engine, also known as an internalcombustion engine, is similar to those used in automotive applications. Reciprocating engines arepopular for primary and back-up power applications despite higher levels of emissions, noise andmaintenance. These technologies, which typically have a lower up-front cost than microturbines, arecurrently produced by Caterpillar Inc., Cummins Inc., Deutz Corporation, GE Gas Engines (which nowincludes Waukesha and Jenbacher), MAN SE, Tecogen, Inc. and Wartsila Corporation, among others.
Our microturbines may also compete with other distributed generation technologies, includingsolar power, wind power systems and fuel cells. Solar and wind powered systems produce no emissions.The main drawbacks to solar and wind powered systems are their dependence on weather conditions,the utility grid and high capital costs that can often make these systems uneconomical withoutgovernment subsidies depending upon geographic locale and application of the technology. Althoughthe market for fuel cells is still developing, a number of companies are focused on markets similar toours, including FuelCell Energy Inc., Bloom Energy Corporation, LG Fuel Cell Systems, a business unitof LG Electronics, Plug Power Inc. and Ballard Power Systems Inc. Fuel cells have lower levels of NOx,CO, VOCs and other criteria pollutant emissions than our microturbines. Fuel cells, like solar and windpowered systems, have received higher levels of incentives for the same type of applications asmicroturbines. Management believes that, absent these higher government incentives, microturbinesprovide a better value to end users in most applications. However, over the medium-to-long term, fuelcell technology companies may introduce products that compete more directly with our microturbines.
We also compete with other companies who have microturbine products, including FlexEnergy andTurbec S.p.A.
Overall, we compete with end users’ other options for electrical power and heat generation on thebasis of our microturbine’s ability to:
• provide power when a utility grid is not available or goes out of service;
• reduce total cost of purchasing electricity and fuel;
• improve electric power availability and provide high power quality;
• operate on multiple fuel types;
• reduce emissions (both criteria pollutants and greenhouse gases);
• simplify operation; and
• control maintenance costs and associated disposal of hazardous materials.
Governmental and Regulatory Impact
Our markets can be positively or negatively impacted by the effects of governmental and regulatorymatters. We are affected not only by energy policy, laws, regulations and incentives of governments inthe markets in which we sell, but also by rules, regulations and costs imposed by utilities. Utilitycompanies or governmental entities may place barriers on the installation or interconnection of ourproduct with the electric grid. Further, utility companies may charge additional fees to customers whoinstall on-site power generation; thereby reducing the electricity they take from the utility, or for havingthe capacity to use power from the grid for back-up or standby purposes. These types of restrictions,fees or charges could hamper the ability to install or effectively use our product, or increase the cost toour potential customers for using our systems. This could make our systems less desirable, therebyadversely affecting our revenue and profitability. In addition, utility rate reductions can make ourproducts less competitive which would have a material adverse effect on our operations. These costs,incentives and rules are not always the same as those faced by technologies with which we compete.
12

However, rules, regulations, laws and incentives could also provide an advantage to our distributedgeneration solutions as compared with competing technologies if we are able to achieve requiredcompliance in a lower cost, more efficient manner. Additionally, reduced emissions and higher fuelefficiency could help our customers combat the effects of global warming. Accordingly, we may benefitfrom increased government regulations that impose tighter emission and fuel efficiency standards.
Capstone continues to engage with federal and state policymakers to develop governmentprograms to promote the deployment of Capstone’s low emission and energy efficient products. KevinMullin, Speaker Pro Tempore and Assembly member for California’s 22nd Assembly district, recentlyintroduced A.B. 674 in the California legislature. This bill may stimulate the market in California forCapstone products by revising utility charges and standby rates that apply to distributed generationprojects. We cannot provide assurance that any such legislation will be enacted, however. In the wakeof numerous destructive storms, several state and local governments are putting greater value inresilient distributed generation resources, including CHP and microgrids, and even reassessing thetraditional utility model. However, utilities in other states have asked public utility commissioners torevisit incentive programs and exemptions from grid usage charges for distributed generationtechnologies, arguing that these policies shift costs to other rate payers.
The United States Government is focused on promoting exports of American products with aspecific emphasis on clean energy goods. Capstone participates in export promotion activities such astrade missions which help us enter new markets by facilitating interactions with foreign buyers anddistributors. Government funding can impact the rate of development of new technologies. While wecontinue to receive development funding, committed amounts remaining are relatively low. Competingnew technologies generally receive larger incentives and development funding than do microturbines.There are certain recent federal funding solicitations that may support microturbine development. Wecannot provide any assurance that any proposal Capstone submits will be funded.
Sourcing and Manufacturing
We are focused on continuously improving our supply chain effectiveness, strengthening ourmanufacturing processes and increasing operational efficiencies within our organization. Ourmicroturbines are designed to achieve high volume and low cost production objectives. Ourmanufacturing designs include the use of conventional technology, which has been proven in highvolume automotive and turbocharger production for many years. Many components used in themanufacture of our products are readily fabricated from commonly available raw materials oroff-the-shelf items available from multiple supply sources; however, certain items are custom made tomeet our specifications. We believe that in most cases, adequate capacity exists at our suppliers andthat alternative sources of supply are available or could be developed within a reasonable period oftime. We have an on-going program to develop alternative back-up suppliers for sole source parts. Weregularly reassess the adequacy and abilities of our suppliers to meet our needs. We continue toevaluate and implement new systems designed to provide improved quality, reliability, service, greaterefficiency and lower supply chain costs. We have substantially increased our focus on process controlsand validations, supplier controls, distribution controls and providing our operations teams with thetraining and tools necessary to drive continuous improvement in product quality. In addition, weremain focused on examining our operations and general business activities to identifycost-improvement opportunities in order to enhance our operational effectiveness. Our ability toleverage these capabilities may be affected by the current variability in our demand volumes andforecasting. Our strategy is to identify primary and secondary sources for critical components whenavailable to minimize factory down time due to unavailability of such parts, which could affect ourability to meet manufacturing schedules.
We have a combined total of approximately 102,000 square foot manufacturing footprint runningon a single shift in the San Fernando Valley area of Southern California. We assemble and test units as
13

well as manufacture air-bearings and certain combustion system components at our facility inChatsworth, California. Additionally, we assemble and test our C200 and C1000 Series products andmanufacture recuperator cores at our facility in Van Nuys, California. Management believes ourmanufacturing facilities located in Chatsworth and Van Nuys, California have a combined productioncapacity of approximately 2,000 units per year, depending on product mix. Excluding working capitalrequirements, management believes we can expand our combined production capacity to approximately4,000 units per year, depending on product mix, with approximately $10 to $15 million of capitalexpenditures. We have not committed to this expansion nor identified a source for its funding, ifavailable.
Solar Turbines Incorporated (‘‘Solar’’), a wholly owned subsidiary of Caterpillar Inc., was our solesupplier of recuperator cores prior to 2001. In 2000, we exercised an option to license Solar’stechnology, which allows us to manufacture these cores ourselves and we began manufacturing them inJune 2001. The cores are subject to a per-unit royalty fee. As of March 31, 2015, cumulative royaltiesof $0.6 million have been paid under the terms of the licensing agreement with Solar.
The Company is a party to a Development and License Agreement with Carrier Corporation(‘‘Carrier’’) regarding the payment of royalties on the sale of each of the Company’s 200 kilowatt(‘‘C200’’) microturbines. During the three months ended September 30, 2013, we reached ourrepayment threshold level and the fixed rate royalty was reduced by 50% on future sale of each of ourC200 microturbines. As of March 31, 2015, cumulative royalties of $15.2 million have been paid underthe terms of the Development Agreement with Carrier.
Research and Development (‘‘R&D’’)
For the fiscal years ended March 31, 2015, 2014 and 2013, R&D expenses were $9.7 million,$9.0 million and $9.0 million, respectively, which amounts are equivalent to 8%, 7% and 7% of totalrevenue, respectively, for these fiscal years. R&D expenses are reported net of benefits fromcost-sharing programs, such as DOE grants and the Development Agreement with Carrier. Benefitsfrom cost-sharing programs were $0.5 million, $1.4 million and $1.7 million for Fiscal 2015, 2014 and2013, respectively. Our R&D activities enabled us to become one of the first companies to develop acommercially available microturbine that operates in parallel with the grid. We were the first companyto successfully demonstrate a commercially available microturbine that operates on a stand-alone basis.
During Fiscal 2015 we made significant development in variants of the C1000 Series product line.A liquid fuel version of the C1000 Series was produced with the use of Capstone’s lean premixcombustion technology based on the development work done previously with the C200 liquid fuelsystem. Liquid fuel products are well suited for markets where customers do not have access to gaseousfuels but still demand the low emissions, low maintenance, and high reliability benefits offered byCapstone’s microturbine products. Additionally, a dual-mode (grid connect & standalone capability)Digester gas C1000 was produced to run off the Palm Oil Milling Effluent (POME) biogas produced asa byproduct of the palm oil extraction process. Advancement realized in both of these products opensup new markets for Capstone and also allows for further development possibilities in the areas of liquidfuel and biogas.
During Fiscal 2014 we achieved compliance with the German low voltage requirements, which havebeen adopted throughout much of Europe. During Fiscal 2015 we continued to make improvements toall our microturbine products to be compliant with other widely adopted European low and mediumvoltage grid inter-connect requirements for decentralized power generation. Compliance with otherwidely adopted European requirements for both low and medium voltage are planned to be completedduring Fiscal 2016. This work will prepare us for the expected expansion of distributed generation gridinter-connect requirements within the US market. In addition, we continue to work both cost reductionand performance enhancement activities to improve the value of our microturbine products for our
14

customer base. Cost reduction activities are focused on leveraging the capabilities of our supply baseand internal design lean manufacturing improvements. Product enhancements are focused on reducingthe already very low maintenance requirements for our products, while at the same time improvingoperational efficiency; thereby reducing our customers’ total cost of ownership.
We are continuing to work on product improvements to our C30 and C65 microturbine productstargeted at the hybrid electric bus and truck market. Because of Capstone’s single moving assembly,manufacturers believe there is also the opportunity to produce a lower cost product in largerautomotive volumes. Our current focus is on a next generation product that would include existingcomponents and a liquid-cooled set of electronics that are consistent with the size, cost and coolingstrategies employed on vehicles today.
Capstone is working with the Kenworth Truck Company to demonstrate a Class 7 series hybriddelivery truck with funding support from the South Coast Air Quality Management District and theSan Joaquin Valley Air Pollution Control District. This truck will be operated on actual customerdelivery routes in both air districts to quantify the performance, emissions, fuel economy, and otherbenefits of a microturbine-based series hybrid solution. The Kenworth Class 7 hybrid truck is currentlybeing retrofitted with a refrigerated box body and should be ready for track testing at Kenworthfacilities later in the year. The truck will then be used in a demonstration phase to a large commercialcustomer within the San Joaquin Valley, California. Capstone expects to collect and utilize informationfrom the Kenworth Class 7 hybrid truck’s road testing and demonstration processes for future productdevelopments and enhancements. A prototype or concept vehicle may take several years to go intocommercial production following completion of rigorous testing.
Capstone also worked with Peterbilt Motors to develop a series hybrid drivetrain as part of aconcept Class 8 tractor for Walmart. The Walmart Advanced Vehicle Experience (‘‘WAVE’’) concepttruck is the latest in Walmart’s fleet efficiency program. The WAVE concept truck has advancedaerodynamics and is powered by a Capstone C30 range-extending microturbine in its hybrid powertrain.This futuristic concept truck was unveiled at the Mid America Trucking Show in March, 2014. Futuredevelopment efforts will be based on the lessons learned from these programs. As such, Capstone isworking with both Peterbilt and Walmart as they continue to showcase the WAVE truck at variousexpos and hybrid vehicle shows around the country.
Capstone liquid fuel microturbines have demonstrated emissions levels which meet the CARB 2010standards for Heavy Duty Diesel Engines (‘‘HDDE’’). Capstone is able to meet these extremely lowemissions requirements using its lean premix combustion technology with no exhaust aftertreatment.Competitive reciprocating engine technologies require aftertreatment components that increase systemcost, require frequent maintenance, and impact engine efficiency. Capstone’s compressed natural gas(‘‘CNG’’) fueled microturbines also meet extremely low emission standards, including the U.S.Environmental Protection Agency and CARB 2010 emissions requirements for On-Road HDDE forUrban Bus. Test emissions from our Natural Gas microturbines measured dramatically less than theemissions levels set forth by the CARB standard including NOx at 75% and CO at 96% less than therequired levels. These microturbines are now certified by CARB and available for production in Fiscal2016.
Capstone is expanding into the marine sector through collaboration with vessel owners, shipyards,and its marine OEM partner, Microturbine Marine Energy. Capstone’s marine products can be used toprovide hybrid electric marine propulsion, ‘‘hotel power,’’ CHP, or CCHP. They are especially ideal forsmall- and mid-size commercial ships that travel inland waterways and emissions controlled areas(ECAs). A notable case study is the Deen Shipping’s Argonon, where LNG fuels two C30microturbines. Both units have been in operation since 2011 and have saved 25 tons of dieselequivalents per year, compared to conventional accommodation heating and chilling. Capstone has alsobeen working with major marine certifying bodies (Lloyd’s Register and DNV-GL) on Type Approval
15

for its marine products, which is expected in 2015. Type Approval provides independent productverification that the product conforms to recognized industry quality standards, InternationalConventions and/or Marine Classification Society Rules, through a process of independent designreview, sample testing and verification of production controls.
Capstone continues to evolve our C65 Hybrid UPS product line. After having received the 2011NOVA Award from the Construction Innovation Forum for the C65 Hybrid UPS Microturbine atSyracuse University’s data center—labeled one of the greenest data centers in the world, Capstone’sC65 Hybrid UPS system has continued development and has recent installations at Sempra inMonterey Park, CA and Capstone’s own Data Center in Chatsworth, CA. The product utilizesCapstone’s inverter electronics and controls technology to provide continuous power quality to meet thecustomer’s critical load. The load inverter is connected through a central power bus to provide powerfrom one of three available power sources including the utility grid, battery storage system, ormicroturbine generator. Power to the critical load is synchronized to an available utility grid to allowdirect bypass of the critical load to the utility grid. This redundant functionality is provided in a singleintegrated package that can be scaled to a larger seamless power unit through Capstone’s multipackfeature. These units can also be combined with a heat recovery module or an absorption chiller toprovide higher total output efficiency. Unlike current UPS products combined with reciprocatingengines for backup, the low emissions Capstone Hybrid UPS product allows for continuous operationyear round allowing customers the ability to receive a payback on their capital equipment investment.
Capstone is working with the Department of Energy (‘‘DOE’’) on two next generation technologyroadmap programs, including a High Efficiency Microturbine with integral heat recovery and advancedAFA (Alumina Forming Austenitic) stainless steel material program in partnership with Oak RidgeNational Laboratory (ORNL). The High Efficiency Microturbine with integral heat recovery is focusedon improving microturbine electrical efficiency and overall system efficiency utilizing heat recovery. Weare currently focusing efforts on the development of the C370 Dual Spool High Efficiency Microturbinewith integral heat recovery system. In March 2013, Capstone successfully completed proof-of-concepttesting of the low pressure spool also known as the C250 that produced >270 kW as part of the firstphase of development. This allowed Capstone to successfully achieve Phase Gate 2 requirements of theDOE contract and proceed with high pressure spool development. Capstone also demonstrated andincreased capability of the power electronics and electrical system required to support this higher powergenerator. The final phase of the program, which is expected to be completed during Fiscal 2016, willincorporate further engine efficiency improvements, resulting in a product design with a projectedelectrical efficiency of 42% and targeted power output of 370 kW. Improvements in efficiency are keyto all markets as improved fuel efficiency benefits users through lower operating costs. AFA stainlesssteel is a material that offers superior oxidation and creep resistance to commercial heat-resistant steelalloys used in Capstone microturbines at a significantly reduced cost. In Fiscal 2015, we successfullycompleted the first of two long term endurance tests and have engaged industry partners oncommercialization viability. In Fiscal 2017, we expect to complete the second endurance test, afterwhich we will be positioned to make a commercialization decision.
Protecting our Intellectual Property Rights and Patents
We rely on a combination of patent, trade secret, copyright and trademark law and nondisclosureagreements to establish and protect our intellectual property rights in our products. In this regard, wehave obtained 103 U.S. and 34 international patents (in certain cases covering the same technology inmultiple jurisdictions). The patents we have obtained will expire between 2015 and 2027.
Management believes that a policy of protecting intellectual property is an important componentof our strategy of being the leader in microturbine system technology and will provide us with along-term competitive advantage. In addition, we implement security procedures at our plants and
16

facilities and have confidentiality agreements with our suppliers, distributors, employees and certainvisitors to our facilities.
Organization and Employees
We were organized in 1988. On June 22, 2000, we reincorporated as a Delaware corporation.
As of March 31, 2015, we had 236 employees. No employees are covered by collective bargainingarrangements. We consider relations with our employees to be good.
Available Information
This Form 10-K, as well as our quarterly reports on Form 10-Q, current reports on Form 8-K andamendments to those reports filed or furnished pursuant to section 13(a) or 15(d) of the SecuritiesExchange Act of 1934, as amended (the ‘‘Exchange Act’’) are made available free of charge on theCompany’s Internet website (http://www.capstoneturbine.com) as soon as reasonably practicable aftersuch materials are electronically filed with or furnished to the Securities and Exchange Commission(‘‘SEC’’).
17

Item 1A. Risk Factors.
This document contains certain forward-looking statements (as such term is defined in Section 27A ofthe Securities Act of 1933, as amended (the ‘‘Securities Act’’) and Section 21E of the Exchange Act)pertaining to, among other things,
• our results of operations;
• profits and losses;
• R&D activities;
• sales expectations;
• our ability to develop markets for our products;
• sources for parts;
• federal, state and local government regulations;
• general business;
• industry and economic conditions applicable to us;
• the efficiency, reliability and environmental advantages of our products and their need formaintenance;
• our ability to be cost-competitive and to outperform competition;
• customer satisfaction;
• the value of using our products;
• our ability to achieve economies of scale;
• market advantage;
• return on investments;
• issues with suppliers;
• anticipation of product supply requirements;
• listing requirements;
• our microturbine technology;
• the utilization of our products;
• competition;
• the introduction of new technologies;
• our production capacity;
• international markets;
• protection of intellectual property;
• the adequacy of our facilities;
• dividends;
• business strategy;
• product development;
18

• capital resources;
• capital expenditures;
• liquidity;
• amortization expense of intangibles;
• cost of warranties;
• stock-based compensation;
• our stockholders rights plan;
• purchase and lease commitments;
• current liabilities;
• recently issued accounting standards;
• market risk;
• the strength of the U.S. dollar;
• interest rate sensitivity; and
• growth of the shale gas market.
These statements are based largely on our current expectations, estimates and forecasts and are subjectto a number of risks and uncertainties. Actual results could differ materially from those anticipated by theseforward-looking statements. Factors that can cause actual results to differ materially include, but are notlimited to, those discussed below. Readers are cautioned not to place undue reliance on these forward-looking statements, which speak only as of the date hereof. The following factors should be considered inaddition to the other information contained herein in evaluating Capstone and its business. We assume noobligation to update any of the forward-looking statements after the filing of this Annual Report to conformsuch statements to actual results or to changes in our expectations, except as may be required by law.
The following are risk factors that could affect our business, financial condition, results of operations,and cash flows. These risk factors should be considered in connection with evaluating the forward-lookingstatements contained in this Annual Report because these factors could cause actual results and conditionsto differ materially from those projected in forward-looking statements. Before you invest in our publiclytraded securities, you should know that making such an investment involves some risks, including the risksdescribed below. Additional risks of which we may not be aware or that we currently believe are immaterialmay also impair our business operations or our stock price. If any of the risks actually occur, our business,financial condition, results of operations or cash flow could be negatively affected. In that case, the tradingprice of our common stock could decline, and you may lose all or part of your investment. In assessingthese risks, investors should also refer to the other information contained or incorporated by reference in thisAnnual Report, our quarterly reports on Form 10-Q and other documents filed by us from time to time.
Our operating history is characterized by net losses. We anticipate further losses and we may never becomeprofitable.
Since inception, we have incurred annual operating losses. We expect this trend to continue untilsuch time that we can sell a sufficient number of units and achieve a cost structure to becomeprofitable. Our business is such that we have relatively few customers and limited repeat business. As aresult, we may not maintain or increase revenue. We may not have adequate cash resources to reachthe point of profitability, and we may never become profitable. Even if we do achieve profitability, wemay be unable to increase our sales and sustain or increase our profitability in the future.
19

We may be unable to fund our future operating requirements, which could force us to curtail our operations.
To the extent that the funds we now have on hand are insufficient to fund our future operatingrequirements, we would need to raise additional funds, through further public or private equity or debtfinancings depending upon prevailing market conditions. These financings may not be available or, ifavailable, may be on terms that are not favorable to us and could result in dilution to our stockholdersand reduction of the trading price of our stock. The state of worldwide capital markets could alsoimpede our ability to raise additional capital on favorable terms or at all. If adequate capital were notavailable to us, we likely would be required to significantly curtail our operations or possibly even ceaseour operations.
We maintain two Credit and Security Agreements (the ‘‘Agreements’’), with Wells Fargo Bank,National Association, (‘‘Wells Fargo’’), that provide us with a credit facility up to $15.0 million in theaggregate. At March 31, 2015, we had $13.0 million outstanding under this line of credit. Under thiscredit facility, we are required to satisfy specified financial and restrictive covenants. Failure to complywith these covenants could cause an event of default which, if not cured or waived, could require us torepay substantial indebtedness immediately or allow Wells Fargo to terminate the credit facility. Inaddition, we have pledged our accounts receivable, inventories, equipment, patents and other assets ascollateral under the Agreements which would be subject to seizure by Wells Fargo if we were in defaultand unable to repay the indebtedness.
Several times since entering into the Agreements, we have not been in compliance with certaincovenants under the Agreements. In connection with each event of noncompliance, Wells Fargo waivedthe event of default and, on several occasions, we amended the Agreements in response to the default.As of March 31, 2015, we were not in compliance with the annual net income financial covenantcontained in the Agreements, as amended. On June 10, 2015, we received from Wells Fargo a waiver ofsuch noncompliance. If we had not obtained the default waivers, or if we are ever again innoncompliance, we would not be able to draw additional funds under the credit facility. TheAgreement also defines an event of default to include a material adverse effect on our business, asdetermined by Wells Fargo. An event of default for this or any other reason, if not waived, would havea material adverse effect on the Company.
Our obligations under the credit facility could have important consequences, including thefollowing:
• We may have difficulty obtaining additional financing at favorable interest rates to meet ourrequirements for operations, capital expenditures, general corporate or other purposes.
• We will be required to dedicate a substantial portion of our cash flow to the payment ofprincipal and interest on indebtedness, which will reduce the amount of funds available foroperations, capital expenditures and future acquisitions.
• We may be required to repay our indebtedness immediately if we default on any of thenumerous financial or other restrictive covenants contained in the Agreements. It is not certainwhether we will have, or will be able to obtain, sufficient funds to make these acceleratedpayments. If any outstanding indebtedness under the credit facility is accelerated, our assets maynot be sufficient to repay such indebtedness.
For more information, see the section below entitled ‘‘Management’s Discussion and Analysis ofFinancial Condition and Results of Operations—Liquidity and Capital Resources.’’
20

If we are unable to either substantially improve our operating results or obtain additional financing, we maybe unable to continue as a going concern.
Should we be unable to execute our plans to build sales and margins while controlling costs, wemay be unable to continue as a going concern on a longer term basis. In particular, we must generatepositive cash flow from operations and net income and otherwise improve our results of operationssubstantially on a longer term basis. Our available cash and proceeds from future financings, if any,that we may be able to obtain, may not be sufficient to fund our operating expenses, capitalexpenditures and other cash requirements. Any such lack of funds would affect our ability to continueas a going concern. These events and circumstances could have a material adverse effect on our abilityto raise additional capital and on the market value of our common stock and our ability to maintain acredit facility acceptable to the Company. Moreover, should we experience a cash shortage thatrequires us to curtail or cease our operations, or should we be unable to continue as a going concern,you could lose all or part of your investments in our securities.
Impairment charges on our long-lived assets, including intangible assets with finite lives would adversely affectour financial position and results of operations.
We evaluate the carrying value of long-lived assets, including intangible assets with finite lives, forimpairment whenever events or changes in circumstances indicate that the carrying value of such assetsmay not be recoverable. To determine whether impairment has occurred, we compare the undiscountedcash flows of the long-lived asset group with its carrying value. The estimation of future cash flowsrequires significant estimates of factors that include future sales growth, gross margin performance,including our estimates of reductions in our direct material costs, and reductions in operating expenses.If our sales growth, gross margin performance or other estimated operating results are not achieved ator above our forecasted level, or inflation exceeds our forecast, the carrying value of our asset groupmay prove to be unrecoverable and we may incur impairment charges in the future. In addition,significant and unanticipated changes in circumstances, such as significant adverse changes in businessclimate, unanticipated competition, loss of key customers or changes in technology or markets, couldrequire a charge for impairment that can materially and adversely affect our reported net loss and ourstockholders’ equity.
A sustainable market for microturbines may never develop or may take longer to develop than we anticipatewhich would adversely affect our results of operations.
Our products represent an emerging market, and we do not know whether our targeted customerswill accept our technology or will purchase our products in sufficient quantities to allow our business togrow. To succeed, demand for our products must increase significantly in existing markets, and theremust be strong demand for products that we introduce in the future. If a sustainable market fails todevelop or develops more slowly than we anticipate, we may be unable to recover the losses we haveincurred to develop our products, we may have further impairment of assets, and we may be unable tomeet our operational expenses. The development of a sustainable market for our systems may behindered by many factors, including some that are out of our control. Examples include:
• consumer reluctance to try a new product;
• regulatory requirements;
• the cost competitiveness of our microturbines;
• costs associated with the installation and commissioning of our microturbines;
• maintenance and repair costs associated with our microturbines;
• the future costs and availability of fuels used by our microturbines;
21

• economic downturns and reduction in capital spending;
• consumer perceptions of our microturbines’ safety and quality;
• the emergence of newer, more competitive technologies and products; and
• decrease in domestic and international incentives.
Our operating results are dependent, in large part, upon the successful commercialization of our products.Failure to produce our products as scheduled and budgeted would materially and adversely affect our businessand financial condition.
We cannot be certain that we will deliver ordered products in a timely manner. Any reliability orquality issues that may arise with our products could prevent or delay scheduled deliveries or adverselyimpact the performance of our products. Any such delays or costs could significantly impact ourbusiness, financial condition and operating results.
We may not be able to produce our products on a timely basis if we fail to correctly anticipate product supplyrequirements or if we suffer delays in production resulting from issues with our suppliers. Our suppliers maynot supply us with a sufficient amount of components or components of adequate quality, or they may providecomponents at significantly increased prices.
Some of our components are currently available only from a single source or limited sources. Wemay experience delays in production if we fail to identify alternative suppliers, or if any parts supply isinterrupted, each of which could materially adversely affect our business and operations. In order toreduce manufacturing lead times and ensure adequate component supply, we enter into agreementswith certain suppliers that allow them to procure inventories based upon criteria defined by us. If wefail to anticipate customer demand properly, an oversupply of parts could result in excess or obsoleteinventories, which could adversely affect our business. Additionally, if we fail to correctly anticipate ourinternal supply requirements, an undersupply of parts could limit our production capacity. Our inabilityto meet volume commitments with suppliers could affect the availability or pricing of our parts andcomponents. A reduction or interruption in supply, a significant increase in price of one or morecomponents or a decrease in demand of products could materially adversely affect our business andoperations and could materially damage our customer relationships. Financial problems of suppliers onwhom we rely could limit our supply of components or increase our costs. Also, we cannot guaranteethat any of the parts or components that we purchase will be of adequate quality or that the prices wepay for the parts or components will not increase. Inadequate quality of products from suppliers couldinterrupt our ability to supply quality products to our customers in a timely manner. Additionally,defects in materials or products supplied by our suppliers that are not identified before our productsare placed in service by our customers could result in higher warranty costs and damage to ourreputation. We also outsource certain of our components internationally. As a result of outsourcinginternationally, we may be subject to delays in delivery because of regulations associated with theimport/export process, delays in transportation or regional instability.
We may not be able to effectively manage our growth, expand our production capabilities or improve ouroperational, financial and management information systems, which would impair our results of operations.
If we are successful in executing our business plan, we will experience growth in our business thatcould place a significant strain on our business operations, management and other resources. Ourability to manage our growth will require us to expand our production capabilities, continue to improveour operational, financial and management information systems, and to motivate and effectivelymanage our employees. We cannot provide assurance that our systems, procedures and controls orfinancial resources will be adequate, or that our management will keep pace with this growth. Wecannot provide assurance that our management will be able to manage this growth effectively.
22
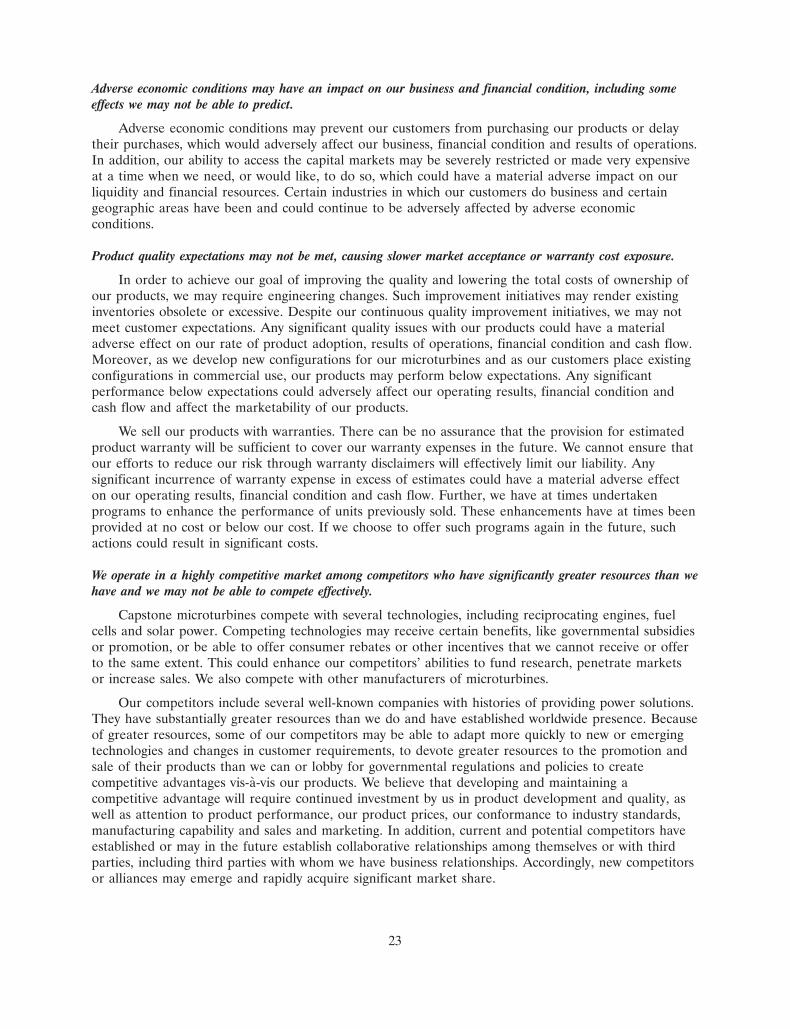
Adverse economic conditions may have an impact on our business and financial condition, including someeffects we may not be able to predict.
Adverse economic conditions may prevent our customers from purchasing our products or delaytheir purchases, which would adversely affect our business, financial condition and results of operations.In addition, our ability to access the capital markets may be severely restricted or made very expensiveat a time when we need, or would like, to do so, which could have a material adverse impact on ourliquidity and financial resources. Certain industries in which our customers do business and certaingeographic areas have been and could continue to be adversely affected by adverse economicconditions.
Product quality expectations may not be met, causing slower market acceptance or warranty cost exposure.
In order to achieve our goal of improving the quality and lowering the total costs of ownership ofour products, we may require engineering changes. Such improvement initiatives may render existinginventories obsolete or excessive. Despite our continuous quality improvement initiatives, we may notmeet customer expectations. Any significant quality issues with our products could have a materialadverse effect on our rate of product adoption, results of operations, financial condition and cash flow.Moreover, as we develop new configurations for our microturbines and as our customers place existingconfigurations in commercial use, our products may perform below expectations. Any significantperformance below expectations could adversely affect our operating results, financial condition andcash flow and affect the marketability of our products.
We sell our products with warranties. There can be no assurance that the provision for estimatedproduct warranty will be sufficient to cover our warranty expenses in the future. We cannot ensure thatour efforts to reduce our risk through warranty disclaimers will effectively limit our liability. Anysignificant incurrence of warranty expense in excess of estimates could have a material adverse effecton our operating results, financial condition and cash flow. Further, we have at times undertakenprograms to enhance the performance of units previously sold. These enhancements have at times beenprovided at no cost or below our cost. If we choose to offer such programs again in the future, suchactions could result in significant costs.
We operate in a highly competitive market among competitors who have significantly greater resources than wehave and we may not be able to compete effectively.
Capstone microturbines compete with several technologies, including reciprocating engines, fuelcells and solar power. Competing technologies may receive certain benefits, like governmental subsidiesor promotion, or be able to offer consumer rebates or other incentives that we cannot receive or offerto the same extent. This could enhance our competitors’ abilities to fund research, penetrate marketsor increase sales. We also compete with other manufacturers of microturbines.
Our competitors include several well-known companies with histories of providing power solutions.They have substantially greater resources than we do and have established worldwide presence. Becauseof greater resources, some of our competitors may be able to adapt more quickly to new or emergingtechnologies and changes in customer requirements, to devote greater resources to the promotion andsale of their products than we can or lobby for governmental regulations and policies to createcompetitive advantages vis-a-vis our products. We believe that developing and maintaining acompetitive advantage will require continued investment by us in product development and quality, aswell as attention to product performance, our product prices, our conformance to industry standards,manufacturing capability and sales and marketing. In addition, current and potential competitors haveestablished or may in the future establish collaborative relationships among themselves or with thirdparties, including third parties with whom we have business relationships. Accordingly, new competitorsor alliances may emerge and rapidly acquire significant market share.
23

Overall, the market for our products is highly competitive and is changing rapidly. We believe thatthe primary competitive factors affecting the market for our products, including some that are outsideof our control, include:
• name recognition, historical performance and market power of our competitors;
• product quality and performance;
• operating efficiency;
• product price;
• availability, price and compatibility of fuel;
• development of new products and features; and
• emissions levels.
There is no assurance that we will be able to successfully compete against either current orpotential competitors or that competition will not have a material adverse effect on our business,operating results, financial condition and cash flow.
If we do not effectively implement our sales, marketing and service plans, our sales will not grow and ourresults of operations will suffer.
Our sales and marketing efforts may not achieve intended results and, therefore, may not generatethe revenue we anticipate. As a result of our corporate strategies, we have decided to focus ourresources on selected vertical markets. We may change our focus to other markets or applications inthe future. There can be no assurance that our focus or our near term plans will be successful. If weare not able to address markets for our products successfully, we may not be able to grow our business,compete effectively or achieve profitability.
Our sales and results of operations could be materially and adversely impacted by risks inherent ininternational markets.
As we expand in international markets, customers may have difficulty or be unable to integrate ourproducts into their existing systems or may have difficulty complying with foreign regulatory andcommercial requirements. As a result, our products may require redesign. Any redesign of the productmay delay sales or cause quality issues. In addition, we may be subject to a variety of other risksassociated with international business, including import/export restrictions, fluctuations in currencyexchange rates and economic or political instability.
The current geopolitical instability in Russia and Ukraine and related sanctions by the U.S. governmentagainst certain companies and individuals may hinder our ability to conduct business with potential orexisting customers and vendors in these countries.
We derived approximately 11% and 17% of our revenue from Russia during Fiscal 2015 and Fiscal2014, respectively. The continuation or escalation of the current geopolitical instability in Russia andUkraine could negatively impact our operations, sales, and future growth prospects in that region.Recently, the U.S. government imposed sanctions through several executive orders restricting U.S.companies from conducting certain oil and gas production related business activities with specifiedRussian and Ukrainian individuals and companies and requiring export licenses for certain of suchactivities. While we believe that the executive orders currently do not preclude us from conductingbusiness with our current customers in Russia, the sanctions imposed by the U.S. government could beexpanded in the future to restrict us from engaging with them. If we are unable to conduct businesswith new or existing customers or pursue opportunities in Russia or Ukraine or elsewhere, our
24

business, including revenue, profitability and cash flows, could be materially adversely affected. Inaddition, we are currently evaluating the impact of the executive orders on our relationships withvendors. If we are unable to conduct business with certain vendors, our operations in Russia andUkraine could be materially adversely affected.
We cannot be certain of the future effectiveness of our internal controls over financial reporting. If we areunable to maintain effective internal controls over our financial reporting, investors may lose confidence inour ability to provide reliable and timely financial reports and the value of our common stock may decline.
Pursuant to Section 404 of the Sarbanes-Oxley Act of 2002, we are required to include in ourannual reports on Form 10-K our assessment of the effectiveness of our internal controls over financialreporting. This assessment includes disclosure of any material weaknesses identified by ourmanagement in our internal controls over financial reporting, as well as a statement that ourindependent registered public accounting firm has issued an attestation report on the effectiveness ofour internal controls over financial reporting. Our management concluded that our internal controlsover financial reporting were ineffective as of March 31, 2014 because a material weakness wasdetected which related to our risk assessment process. Management determined that this materialweakness was remediated during Fiscal 2015. Refer to Item 9A, ‘‘Controls and Procedures’’ foradditional information. We may in the future identify further material weaknesses in our internalcontrols over financial reporting that we have not discovered to date. If we cannot adequately maintainthe effectiveness of our internal controls over financial reporting, we might be subject to sanctions orinvestigation by regulatory authorities, such as the SEC. Any such action could adversely affect ourfinancial results and the market price of our securities.
We may not be able to retain or develop relationships with OEMs or distributors in our targeted markets, inwhich case our sales would not increase as expected.
In order to serve certain of our targeted markets, we believe that we must ally ourselves withcompanies that have particular expertise or better access to those markets. We believe that retaining ordeveloping relationships with strong OEMs (which to date have typically resold our products undertheir own brands or packaged our products with other products as part of an integrated unit) ordistributors in these targeted markets can improve the rate of adoption as well as reduce the directfinancial burden of introducing a new technology and creating a new market. Because of OEMs’ anddistributors’ relationships in their respective markets, the loss of an OEM or distributor could adverselyimpact the ability to penetrate our target markets. We offer our OEMs and distributors stateddiscounts from list price for the products they purchase. In the future, to attract and retain OEMs anddistributors we may provide volume price discounts or otherwise incur significant costs that may reducethe potential revenues from these relationships. We may not be able to retain or develop appropriateOEMs and distributors on a timely basis, and we cannot provide assurance that the OEMs anddistributors will focus adequate resources on selling our products or will be successful in selling them.In addition, some of the relationships may require that we grant exclusive distribution rights in definedterritories. These exclusive distribution arrangements could result in our being unable to enter intoother arrangements at a time when the OEM or distributor with whom we form a relationship is notsuccessful in selling our products or has reduced its commitment to market our products. We cannotprovide assurance that we will be able to negotiate collaborative relationships on favorable terms or atall. Our inability to have appropriate distribution in our target markets may adversely affect ourfinancial condition, results of operations and cash flow.
25

Activities necessary to integrate any future acquisitions may result in costs in excess of current expectations orbe less successful than anticipated.
During Fiscal 2010, we completed the acquisition of certain assets relating to the microturbinebusiness of CPS, and we may acquire other businesses in the future. The success of these transactionswill depend on, among other things, our ability to develop productive relationships with thecorresponding distributors and to integrate assets and personnel, if any, acquired in these transactionsand to apply our internal controls processes to these acquired businesses. The integration of anyacquired businesses or significant assets may require significant attention from our management, andthe diversion of management’s attention and resources could have a material adverse effect on ourability to manage our business. Furthermore, we may not realize the degree or timing of benefits weanticipated when we first enter into these transactions. If actual integration costs are higher thanamounts assumed, if we are unable to integrate the assets and personnel acquired in an acquisition asanticipated, or if we are unable to fully benefit from anticipated synergies, our business, financialcondition, results of operations, and cash flows could be materially adversely affected.
We have substantial accounts receivable, and increased bad debt expense or delays in collecting accountsreceivable could have a material adverse effect on our cash flows and results of operations.
Our accounts receivable balance, net of allowances, was $13.1million and $28.0 million as ofMarch 31, 2015 and March 31, 2014, respectively. Days sales outstanding in accounts receivable (DSO)at the end of Fiscal 2015 was 40 days, compared with 70 days at the end of Fiscal 2014. We recordedbad debt expense of $10.1 million and $0.2 million during Fiscal 2015 and Fiscal 2014, respectively. Noassurances can be given that future bad debt expense will not increase above current operating levels.Increased bad debt expense or delays in collecting accounts receivable could have a material adverseeffect on cash flows and results of operations.
Loss of a significant customer could have a material adverse effect on our results of operations.
Horizon and BPC accounted for approximately 17% and 11%, respectively, of our revenue forFiscal 2015. Additionally, Optimal accounted for 17% of net accounts receivable as of March 31, 2015.The loss of Horizon, BPC or any other significant customers could adversely affect our results ofoperations.
We may not be able to develop sufficiently trained applications engineering, installation and service support toserve our targeted markets.
Our ability to identify and develop business relationships with companies who can provide quality,cost-effective application engineering, installation and service can significantly affect our success. Theapplication engineering and proper installation of our microturbines, as well as proper maintenance andservice, are critical to the performance of the units. Additionally, we need to reduce the total installedcost of our microturbines to enhance market opportunities. Our inability to improve the quality ofapplications, installation and service while reducing associated costs could affect the marketability ofour products.
Changes in our product components may require us to replace parts held at distributors.
We have entered into agreements with some of our distributors requiring that if we render partsobsolete in inventories they own and hold in support of their obligations to serve fielded microturbines,we are required to replace the affected stock at no cost to the distributors. It is possible that futurechanges in our product technology could involve costs that have a material adverse effect on our resultsof operations, cash flow or financial position.
26

We operate in a highly regulated business environment, and changes in regulation could impose significantcosts on us or make our products less economical, thereby affecting demand for our microturbines.
Our products are subject to federal, state, local and foreign laws and regulations, governing, amongother things, emissions and occupational health and safety. Regulatory agencies may impose specialrequirements for the implementation and operation of our products or that may significantly affect oreven eliminate some of our target markets. We may incur material costs or liabilities in complying withgovernment regulations. In addition, potentially significant expenditures could be required in order tocomply with evolving environmental and health and safety laws, regulations and requirements that maybe adopted or imposed in the future. Furthermore, our potential utility customers must comply withnumerous laws and regulations. The deregulation of the utility industry may also create challenges forour marketing efforts. For example, as part of electric utility deregulation, federal, state and localgovernmental authorities may impose transitional charges or exit fees, which would make it lesseconomical for some potential customers to switch to our products. We can provide no assurances thatwe will be able to obtain these approvals and changes in a timely manner, or at all. Non-compliancewith applicable regulations could have a material adverse effect on our operating results.
The market for electricity and generation products is heavily influenced by federal and stategovernment regulations and policies. The deregulation and restructuring of the electric industry in theUnited States and elsewhere may cause rule changes that may reduce or eliminate some of theadvantages of such deregulation and restructuring. We cannot determine how any deregulation orrestructuring of the electric utility industry may ultimately affect the market for our microturbines.Changes in regulatory standards or policies could reduce the level of investment in the research anddevelopment of alternative power sources, including microturbines. Any reduction or termination ofsuch programs could increase the cost to our potential customers, making our systems less desirable,and thereby adversely affect our revenue and other operating results.
Utility companies or governmental entities could place barriers to our entry into the marketplace, and we maynot be able to effectively sell our products.
Utility companies or governmental entities could place barriers on the installation of our productsor the interconnection of the products with the electric grid. Further, they may charge additional feesto customers who install on-site generation or have the capacity to use power from the grid for back-upor standby purposes. These types of restrictions, fees or charges could hamper the ability to install oreffectively use our products or increase the cost to our potential customers for using our systems. Thiscould make our systems less desirable, thereby adversely affecting our revenue and other operatingresults. In addition, utility rate reductions can make our products less competitive which would have amaterial adverse effect on our operations. The cost of electric power generation bears a closerelationship to natural gas and other fuels. However, changes to electric utility tariffs often requirelengthy regulatory approval and include a mix of fuel types as well as customer categories. Potentialcustomers may perceive the resulting swings in natural gas and electric pricing as an increased risk ofinvesting in on-site generation.
We depend upon the development of new products and enhancements of existing products.
Our operating results depend on our ability to develop and introduce new products, enhanceexisting products and reduce the costs to produce our products. The success of our products isdependent on several factors, including proper product definition, product cost, timely completion andintroduction of the products, differentiation of products from those of our competitors, meetingchanging customer requirements, emerging industry standards and market acceptance of these products.The development of new, technologically advanced products and enhancements is a complex anduncertain process requiring high levels of innovation, as well as the accurate anticipation oftechnological and market trends. There can be no assurance that we will successfully identify new
27
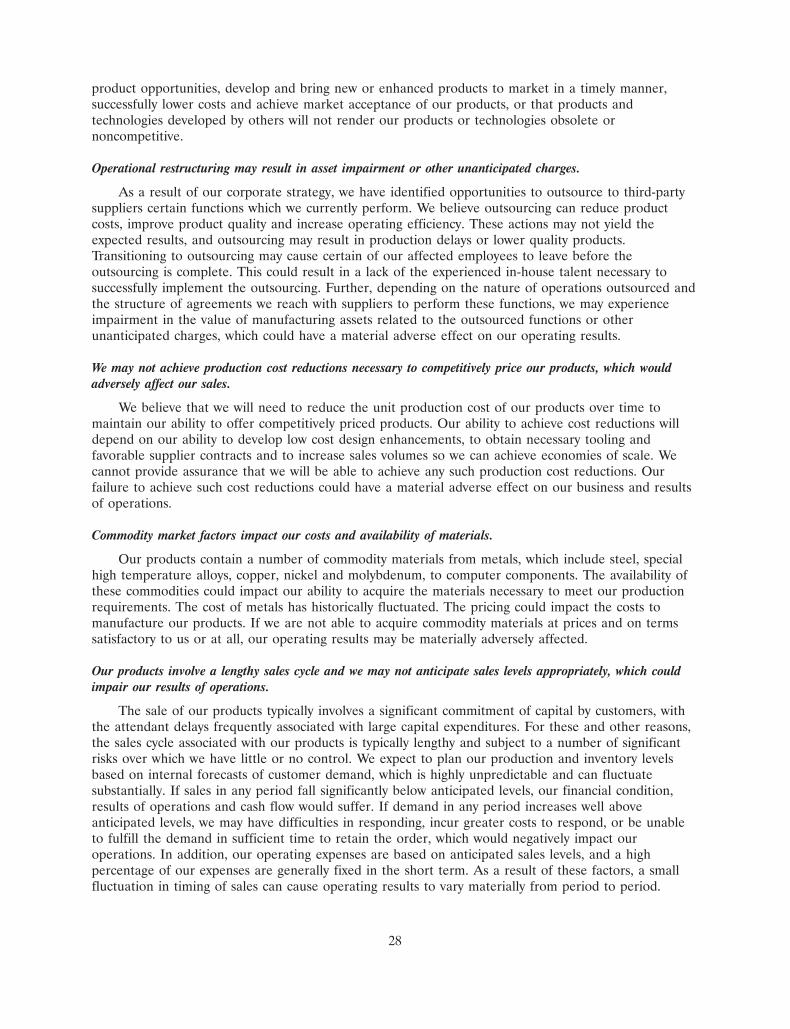
product opportunities, develop and bring new or enhanced products to market in a timely manner,successfully lower costs and achieve market acceptance of our products, or that products andtechnologies developed by others will not render our products or technologies obsolete ornoncompetitive.
Operational restructuring may result in asset impairment or other unanticipated charges.
As a result of our corporate strategy, we have identified opportunities to outsource to third-partysuppliers certain functions which we currently perform. We believe outsourcing can reduce productcosts, improve product quality and increase operating efficiency. These actions may not yield theexpected results, and outsourcing may result in production delays or lower quality products.Transitioning to outsourcing may cause certain of our affected employees to leave before theoutsourcing is complete. This could result in a lack of the experienced in-house talent necessary tosuccessfully implement the outsourcing. Further, depending on the nature of operations outsourced andthe structure of agreements we reach with suppliers to perform these functions, we may experienceimpairment in the value of manufacturing assets related to the outsourced functions or otherunanticipated charges, which could have a material adverse effect on our operating results.
We may not achieve production cost reductions necessary to competitively price our products, which wouldadversely affect our sales.
We believe that we will need to reduce the unit production cost of our products over time tomaintain our ability to offer competitively priced products. Our ability to achieve cost reductions willdepend on our ability to develop low cost design enhancements, to obtain necessary tooling andfavorable supplier contracts and to increase sales volumes so we can achieve economies of scale. Wecannot provide assurance that we will be able to achieve any such production cost reductions. Ourfailure to achieve such cost reductions could have a material adverse effect on our business and resultsof operations.
Commodity market factors impact our costs and availability of materials.
Our products contain a number of commodity materials from metals, which include steel, specialhigh temperature alloys, copper, nickel and molybdenum, to computer components. The availability ofthese commodities could impact our ability to acquire the materials necessary to meet our productionrequirements. The cost of metals has historically fluctuated. The pricing could impact the costs tomanufacture our products. If we are not able to acquire commodity materials at prices and on termssatisfactory to us or at all, our operating results may be materially adversely affected.
Our products involve a lengthy sales cycle and we may not anticipate sales levels appropriately, which couldimpair our results of operations.
The sale of our products typically involves a significant commitment of capital by customers, withthe attendant delays frequently associated with large capital expenditures. For these and other reasons,the sales cycle associated with our products is typically lengthy and subject to a number of significantrisks over which we have little or no control. We expect to plan our production and inventory levelsbased on internal forecasts of customer demand, which is highly unpredictable and can fluctuatesubstantially. If sales in any period fall significantly below anticipated levels, our financial condition,results of operations and cash flow would suffer. If demand in any period increases well aboveanticipated levels, we may have difficulties in responding, incur greater costs to respond, or be unableto fulfill the demand in sufficient time to retain the order, which would negatively impact ouroperations. In addition, our operating expenses are based on anticipated sales levels, and a highpercentage of our expenses are generally fixed in the short term. As a result of these factors, a smallfluctuation in timing of sales can cause operating results to vary materially from period to period.
28

Potential litigation may adversely impact our business.
We may face litigation relating to labor matters or other matters. Any litigation could be costly,divert management attention or result in increased cost of doing business.
Our business could be negatively impacted if we fail to adequately protect our intellectual property rights or ifthird parties claim that we are in violation of their intellectual property rights.
We view our intellectual property rights as important assets. We seek to protect our intellectualproperty rights through a combination of patent, trademark, copyright and trade secret laws, as well aslicensing and confidentiality agreements. These protections may not be adequate to prevent thirdparties from using our intellectual property without our authorization, breaching any confidentialityagreements with us, copying or reverse engineering our products, or developing and marketing productsthat are substantially equivalent to or superior to our own. The unauthorized use of our intellectualproperty by others could reduce our competitive advantage and harm our business. If it becamenecessary for us to litigate to protect these rights, any proceedings could be burdensome and costly andwe may not prevail. We cannot guarantee that any patents, issued or pending, will provide us with anycompetitive advantage or will not be challenged by third parties. Moreover, the expiration of ourpatents may lead to increased competition with respect to certain products. In addition, we cannot becertain that we do not or will not infringe third parties’ intellectual property rights. Any such claim,even if it is without merit, may be expensive and time-consuming to defend, subject us to damages,cause us to cease making, using or selling certain products that incorporate the disputed intellectualproperty, require us to redesign our products, divert management time and attention and/or require usto enter into costly royalty or licensing arrangements.
Our results of operations could be materially and adversely affected by risks related to cyber security threats.
As a manufacturer of high technology commercial products, we face cyber security threats, as wellas the potential for business disruptions associated with information technology failures or cybersecurity attacks. We routinely experience cyber security threats, threats to our information technologyinfrastructure and attempts to gain access to our sensitive information. Because of the evolving natureof these security threats, the impact of any future incident cannot be predicted. The occurrence of anyof these events could adversely affect our results of operations, the services we provide to customers,the competitive advantages derived from our R&D efforts, the usefulness of our products and services,our reputation or our stock price.
We may incur costs and liabilities as a result of product liability claims.
We face a risk of exposure to product liability claims in the event that the use of our products isalleged to have resulted in injury or other damage. Although we currently maintain product liabilityinsurance coverage, we may not be able to obtain such insurance on acceptable terms in the future, ifat all, or obtain insurance that will provide adequate coverage against potential claims. Product liabilityclaims can be expensive to defend and can divert the attention of management and other personnel forlong periods of time, regardless of the ultimate outcome. A significant unsuccessful product liabilitydefense could have a material adverse effect on our financial condition and results of operations. Inaddition, we believe our business depends on the strong brand reputation we have developed. If ourreputation is damaged, we may face difficulty in maintaining our market share and pricing with respectto some of our products, which could reduce our sales and profitability.
We have significant tax assets, usage of which may be subject to limitations in the future.
At March 31, 2015, we had federal and state net operating loss carryforwards of approximately$626 million and $203 million, respectively, which may be utilized to reduce future taxable income,
29

subject to limitations under Section 382 of the Internal Revenue Code of 1986. These deferred taxassets have been fully offset by a valuation allowance. Any subsequent accumulations of common stockownership leading to a change of control under Section 382 of the U.S. Internal Revenue Code of1986, including through sales of stock by large stockholders, all of which are outside of our control,could limit and defer our ability to utilize our net operating loss carryforwards to offset future federalincome tax liabilities.
Our success depends in significant part upon the continuing service of management and key employees.
Our success depends in significant part upon the continuing service of our executive officers, seniormanagement and sales and technical personnel. The failure of our personnel to execute our strategy orour failure to retain management and personnel could have a material adverse effect on our business.Our success will be dependent on our continued ability to attract, retain and motivate highly skilledemployees. There can be no assurance that we can do so.
Our internal control systems rely on people trained in the execution of the controls. Loss of thesepeople or our inability to replace them with similarly skilled and trained individuals or new processes ina timely manner could adversely impact our internal control mechanisms.
Our operations are vulnerable to interruption by fire, earthquake and other events beyond our control.
Our operations are vulnerable to interruption by fire, earthquake and other events beyond ourcontrol. Our executive offices and manufacturing facilities are located in southern California. Becausethe southern California area is located in an earthquake-sensitive area, we are particularly susceptibleto the risk of damage to, or total destruction of, our facilities in southern California and thesurrounding transportation infrastructure, which could affect our ability to make and transport ourproducts. If an earthquake, fire or other natural disaster occurs at or near our facilities, our business,financial condition, operating results and cash flow could be materially adversely affected.
If we continue to fail to meet all applicable Nasdaq Global Market requirements and Nasdaq determines todelist our common stock, the delisting could adversely affect the market liquidity of our common stock, impairthe value of your investment and adversely affect our ability to raise needed funds.
Our common stock is listed on the Nasdaq Global Market. In order to maintain that listing, wemust satisfy minimum financial and other requirements. On December 19, 2014, we received a noticefrom the Nasdaq Listing Qualifications Department stating that, for 30 consecutive business dayspreceding the notice date, the closing bid price for our common stock had been below the minimum$1.00 per share requirement for continued listing on the Nasdaq Global Market as set forth in NasdaqListing Rule 5450(a)(1). In accordance with Nasdaq Listing Rule 5810(c)(3)(A), we have been provided180 calendar days, or until June 17, 2015, to regain compliance with the minimum bid pricerequirement. In order to regain compliance, the bid price of our common stock must close at $1.00 pershare or more for a minimum of ten consecutive business days, at which time Nasdaq ListingQualifications Department would provide written confirmation of our compliance. In the event we donot meet the minimum bid price requirement during the initial 180-day grace period, we may beeligible for an additional 180-day grace period under the Nasdaq listing rules if we meet the listingstandards for The Nasdaq Capital Market. We may need to implement a reverse stock split to regaincompliance with the Nasdaq Listing Rules.
If we continue to fail to meet all applicable Nasdaq Global Market requirements in the future andNasdaq determines to delist our common stock, the delisting could adversely affect the market liquidityof our common stock and adversely affect our ability to obtain financing for the continuation of ouroperations. This delisting could also impair the value of your investment.
30

The market price of our common stock has been and may continue to be highly volatile and you could lose allor part of your investment in our securities.
An investment in our securities is risky, and stockholders could lose their investment in oursecurities or suffer significant losses and wide fluctuations in the market value of their investment. Themarket price of our common stock is highly volatile and is likely to continue to be highly volatile.Given the continued uncertainty surrounding many variables that may affect our business and theindustry in which we operate, our ability to foresee results for future periods is limited. This variabilitycould affect our operating results and thereby adversely affect our stock price. Many factors thatcontribute to this volatility are beyond our control and may cause the market price of our commonstock to change, regardless of our operating performance. Factors that could cause fluctuation in ourstock price may include, among other things:
• actual or anticipated variations in quarterly operating results;
• market sentiment toward alternative energy stocks in general or toward Capstone;
• changes in financial estimates or recommendations by securities analysts;
• conditions or trends in our industry or the overall economy;
• loss of one or more of our significant customers;
• errors, omissions or failures by third parties in meeting commitments to us;
• changes in the market valuations or earnings of our competitors or other technology companies;
• the trading of options on our common stock;
• announcements by us or our competitors of significant acquisitions, strategic partnerships,divestitures, joint ventures or other strategic initiatives;
• announcements of significant market events, such as power outages, regulatory changes ortechnology changes;
• changes in the estimation of the future size and growth rate of our market;
• future equity financings;
• the failure to produce our products on a timely basis in accordance with customer expectations;
• the inability to obtain necessary components on time and at a reasonable cost;
• litigation or disputes with customers or business partners;
• capital commitments;
• additions or departures of key personnel;
• sales or purchases of our common stock;
• the trading volume of our common stock;
• developments relating to litigation or governmental investigations; and
• decreases in oil, natural gas and electricity prices.
In addition, the stock market in general, and the Nasdaq Global Market and the market fortechnology companies in particular, have experienced extreme price and volume fluctuations that haveoften been unrelated or disproportionate to the operating performance of particular companiesaffected. The market prices of securities of technology companies and companies servicing thetechnology industries have been particularly volatile. These broad market and industry factors may
31

cause a material decline in the market price of our common stock, regardless of our operatingperformance. In the past, following periods of volatility in the market price of a company’s securities,securities class—action litigation has often been instituted against that company. This type of litigation,regardless of whether we prevail on the underlying claim, could result in substantial costs and adiversion of management’s attention and resources, which could materially harm our financialcondition, results of operations and cash flow.
Provisions in our certificate of incorporation, bylaws and our stockholder rights plan, as well as Delaware law,may discourage, delay or prevent a merger or acquisition at a premium price.
Provisions of our second amended and restated certificate of incorporation, amended and restatedbylaws and our stockholder rights plan, as well as provisions of the General Corporation Law of theState of Delaware, could discourage, delay or prevent unsolicited proposals to merge with or acquireus, even though such proposals may be at a premium price or otherwise beneficial to you. Theseprovisions include our board’s authorization to issue shares of preferred stock, on terms the boarddetermines in its discretion, without stockholder approval, and the following provisions of Delaware lawthat restrict many business combinations.
We are subject to the provisions of Section 203 of the General Corporation Law of the State ofDelaware, which could prevent us from engaging in a business combination with a 15% or greaterstockholder for a period of three years from the date such stockholder acquired such status unlessappropriate board or stockholder approvals are obtained.
Our board of directors has adopted a stockholder rights plan, pursuant to which one preferredstock purchase right has been issued for each share of our common stock authorized and outstanding.Until the occurrence of certain prescribed events, the rights are not exercisable and are transferablealong with, and only with, each share of our common stock and are evidenced by the common stockcertificates. One preferred stock purchase right will also be issued with each share of our commonstock we issue in the future until the rights plan expires or is terminated or we redeem or exchange therights for other property in accordance with the terms of the rights plan or at such time, if any, as therights separate from each share of our common stock and become exercisable. Each share of Series AJunior Participating Preferred Stock will be entitled to receive, when, as and if declared by our boardof directors out of funds legally available for the purpose, dividends payable in cash in an amount pershare (rounded to the nearest cent) equal to 100 times the aggregate per share amount of all dividendsor other distributions, including non-cash dividends (payable in kind), declared on our common stockother than a dividend payable in shares of common stock or a subdivision of the outstanding shares ofcommon stock. The rights plan prohibits the issuance of additional rights after the rights separate fromour common stock. The rights plan is intended to protect our stockholders in the event of an unfair orcoercive offer to acquire us. However, the existence of the rights plan may discourage, delay or preventa merger or acquisition of us that is not supported by our board of directors.
Item 1B. Unresolved Staff Comments.
None.
Item 2. Properties.
Our principal corporate offices, administrative, sales and marketing, R&D and support facilitiesconsist of approximately 98,000 square feet of leased office space, warehouse space and assembly andtest space located at 21211 Nordhoff Street in Chatsworth, California. Our lease for those premisesexpires in September 2019, and we have one five-year option to extend the term of this lease. We alsolease an approximately 79,000 square foot facility at 16640 Stagg Street in Van Nuys, California as anengineering test and manufacturing facility for our recuperator cores. This lease will expire inDecember 2017. Management believes our facilities are adequate for our current needs.
32

Item 3. Legal Proceedings.
From time to time, the Company may become subject to certain legal proceedings, claims andlitigation arising in the ordinary course of business. In the opinion of management, we are not a partyto any other material legal proceedings, nor are we aware of any other pending or threatened litigationthat would have a material effect on our business, operating results, cash flows, financial position orresults of operations should such litigation be resolved unfavorably.
Item 4. Mine Safety Disclosures.
Not applicable.
PART II
Item 5. Market for Registrant’s Common Equity, Related Stockholder Matters and Issuer Purchasesof Equity Securities.
Price Range of Common Stock
Our common stock is publicly traded on the Nasdaq Global Market under the symbol ‘‘CPST’’.The following table sets forth the low and high sales prices for each period indicated.
High Low
Year Ended March 31, 2015:First Quarter . . . . . . . . . . . . . . . . . . . . . . . . . . . . . . . . . . . . . . . . . $2.32 $1.28Second Quarter . . . . . . . . . . . . . . . . . . . . . . . . . . . . . . . . . . . . . . . $1.53 $1.03Third Quarter . . . . . . . . . . . . . . . . . . . . . . . . . . . . . . . . . . . . . . . . . $1.08 $0.56Fourth Quarter . . . . . . . . . . . . . . . . . . . . . . . . . . . . . . . . . . . . . . . . $0.77 $0.59Year Ended March 31, 2014:First Quarter . . . . . . . . . . . . . . . . . . . . . . . . . . . . . . . . . . . . . . . . . $1.34 $0.82Second Quarter . . . . . . . . . . . . . . . . . . . . . . . . . . . . . . . . . . . . . . . $1.52 $1.07Third Quarter . . . . . . . . . . . . . . . . . . . . . . . . . . . . . . . . . . . . . . . . . $1.45 $1.12Fourth Quarter . . . . . . . . . . . . . . . . . . . . . . . . . . . . . . . . . . . . . . . . $2.60 $1.26
As of June 8, 2015, the last reported sale price of our common stock on the Nasdaq GlobalMarket was $0.55 per share.
Stockholders
As of June 8, 2015, there were 560 stockholders of record of our common stock. This does notinclude the number of persons whose stock is held in nominee or ‘‘street name’’ accounts throughbrokers.
Dividend Policy
We currently intend to retain any earnings for use in our business and, therefore, we do notanticipate paying any cash dividends in the foreseeable future. We have never declared or paid any cashdividends on our capital stock. In the future, the decision to pay any cash dividends will depend uponour results of operations, financial condition, cash flow and capital expenditure plans, as well as suchother factors as our Board of Directors, in its sole discretion, may consider relevant. Additionally, theconsent of Wells Fargo would be necessary in order for the Company to declare and pay a dividend inaccordance with the terms of the Credit Agreements.
33

Item 6. Selected Financial Data.
The selected financial data shown below have been derived from the audited financial statementsof Capstone. The historical results are not necessarily indicative of the operating results to be expectedin the future. The selected financial data should be read in conjunction with ‘‘Risk Factors,’’‘‘Management’s Discussion and Analysis of Financial Condition and Results of Operations’’ and theconsolidated financial statements and related notes included elsewhere in this Annual Report.
Year Ended March 31,
2015 2014 2013 2012 2011(In thousands, except per share data)
Statement of Operations:Revenue . . . . . . . . . . . . . . . . . . . . . . . . . . . . $115,461 $133,105 $127,557 $109,371 $ 81,890Cost of goods sold . . . . . . . . . . . . . . . . . . . . . 97,174 111,409 113,172 103,944 82,427
Gross margin (loss) . . . . . . . . . . . . . . . . . 18,287 21,696 14,385 5,427 (537)Operating costs and expenses:
Research and development . . . . . . . . . . . . . 9,679 9,029 8,979 8,237 6,986Selling, general and administrative(1) . . . . . . 39,517 27,981 27,364 28,927 26,203
Loss from operations . . . . . . . . . . . . . . . . (30,909) (15,314) (21,958) (31,737) (33,726)Net loss . . . . . . . . . . . . . . . . . . . . . . . . . . $ (31,533) $(16,256) $(22,563) $(18,764) $(38,470)Net loss per share of common stock—basic
and diluted . . . . . . . . . . . . . . . . . . . . . $ (0.10) $ (0.05) $ (0.07) $ (0.07) $ (0.16)
As of March 31,
2015 2014 2013 2012 2011
Balance Sheet Data:Cash and cash equivalents . . . . . . . . . . . . . . . . . . . . $32,221 $27,859 $38,817 $49,952 $33,456Working capital . . . . . . . . . . . . . . . . . . . . . . . . . . . 27,528 26,443 32,782 49,532 22,274Total assets . . . . . . . . . . . . . . . . . . . . . . . . . . . . . . 78,927 84,118 87,338 99,792 87,019Revolving credit facility . . . . . . . . . . . . . . . . . . . . . . 12,953 13,228 13,476 10,431 7,080Capital lease/note payable obligations . . . . . . . . . . . 496 645 594 433 297Long-term liabilities . . . . . . . . . . . . . . . . . . . . . . . . 161 70 142 254 309Stockholders’ equity . . . . . . . . . . . . . . . . . . . . . . . . $34,704 $34,093 $41,886 $58,617 $34,480
(1) The Company recorded bad debt expense of approximately $10.1 million, $0.2 million, $0.3 million,$2.3 million and $0.2 million for the years ended March 31, 2015, 2014, 2013, 2012 and 2011,respectively.
34
Item 7. Management’s Discussion and Analysis of Financial Condition and Results of Operations.
The following Management’s Discussion and Analysis of Financial Condition and Results ofOperations contains forward-looking statements that involve risks and uncertainties. Our actual results maydiffer materially from the results discussed in the forward-looking statements. Factors that might cause adifference include, but are not limited to, those discussed under Item 1A (Risk Factors) in this AnnualReport. The following section is qualified in its entirety by the more detailed information, including ourfinancial statements and the notes thereto, which appears elsewhere in this Annual Report.
Overview
Capstone is the market leader in microturbines based on the number of microturbines sold.Generally, power purchased from the electric utility grid is less costly than power produced bydistributed generation technologies. Utilities may also charge fees to interconnect to their power grids.However, we can provide economic benefits to end users in instances where the waste heat from ourmicroturbine has value (combined heat and power (‘‘CHP’’) and combined cooling, heat and power(‘‘CCHP’’)), where fuel costs are low (renewable energy/renewable fuels), where the costs of connectingto the grid may be high or impractical (such as remote power applications), where reliability and powerquality are of critical importance, or in situations where peak shaving could be economicallyadvantageous because of highly variable electricity prices. Because Capstone microturbines can providea reliable source of power and can operate on multiple fuel sources, management believes they offer alevel of flexibility not currently offered by other technologies such as reciprocating engines.
During Fiscal 2015 our net loss increased by 93% to $31.5 million and our net loss per shareincreased by 100% to $0.10 compared to the same period last year. The increase in the net loss wasprimarily the result of lower revenue and accounts receivable allowance for two customers during Fiscal2015 compared to the same period last year. Please see Results of Operations on page 34 for furtherdiscussion on the lower revenue and accounts receivable allowance. We continue to remain focused onimproving our gross margin. Our gross margin was 16% for each of Fiscal 2015 and Fiscal 2014. Whileour year over year revenue decreased 13%, our gross margin rate remained flat compared to Fiscal2014. During Fiscal 2015 we benefitted from our ongoing efforts in manufacturing cost reductions thatwere entirely offset by lower volume and lower average selling prices for our microturbines comparedto the same period last year. Fiscal 2015 was characterized by lower revenue as our operationalprogress was eclipsed by challenging macroeconomic headwinds over the last year which included thedramatic downturn of the oil markets, a substantially stronger U.S. dollar making our products moreexpensive overseas and ongoing geopolitical tensions in Russia, North Africa and the Middle East; allof these factors negatively impacted our business.
Capstone products continue to gain interest in all six of the major vertical markets (energyefficiency, renewable energy, natural resources, critical power supply, marine and transportation). In theenergy efficiency market, we continue to expand our market presence in hotels, office buildings,hospitals, retail and industrial applications globally. The renewable energy market is fueled by landfillgas, biodiesel, and biogas from sources such as food processing, agricultural waste and cow, pig andchicken manure. Our success in the oil and gas and other natural resources market, which continues tobe a growing market worldwide is driven by our microturbines reliability, emissions profile and ease ofinstallation. We have also seen increased interest in critical power supply solution applications ascustomers want solutions that can handle both primary and backup power. Capstone’s transportationmarket, which utilizes microturbines for electric vehicle industries, is gaining interest as liquid naturalgas becomes more readily available as a transportation fuel and emission regulations continue to betightened on the diesel engine industry.
We continue to focus on improving our products based on customer input, building brandawareness and new channels to market by developing a diversified network of strategic distribution
35

partners. Our focus is on products and solutions that provide near-term opportunities to driverepeatable business rather than discrete projects for niche markets. In addition, management closelymanages operating expenses and strives to improve manufacturing efficiencies while simultaneouslylowering direct material costs and increasing average selling prices. The key drivers to Capstone’ssuccess are revenue growth, higher average selling prices, lower direct material costs, positive new orderflow and reduced cash usage.
To support our opportunities to grow in our targeted markets, we continue to enhance thereliability and performance of our products by regularly developing new processes and enhancingtraining to assist those who apply, install and use our products.
An overview of our direction, targets and key initiatives follows:
1) Focus on Vertical Markets Within the distributed generation markets that we serve, we focuson vertical markets that we identify as having the greatest near-term potential. In our primaryproducts and applications (energy efficiency, renewable energy, natural resources, criticalpower supply, marine and transportation products), we identify specific targeted verticalmarket segments. Within each of these segments, we identify what we believe to be the criticalfactors to success and base our plans on those factors.
During Fiscal 2015, we booked orders for 86.0 megawatts and shipped 91.4 megawatts ofproducts, which combined with our backlog at March 31, 2014, resulted in 182.8 megawatts inbacklog at the end of the fiscal year. Our product shipments in Fiscal 2015 were: 49% for usein natural resources applications, 44% for use in energy efficiency applications and 7% for usein renewable energy applications.
Energy Efficiency—CHP/CCHP
Energy efficiency maximizes the use of energy produced by the microturbines, reducesemissions compared with traditional power generation and enhances the economic advantageto customers. Energy efficiency applications use both the heat and electric energy produced inthe power generation process. Using the heat and electricity created from a single combustionprocess increases the efficiency of the system from approximately 30% to 75% or more. Theincreased operating efficiency reduces overall greenhouse gas emissions compared withtraditional independent sources such as power generation and local thermal generation and,through displacement of other separate systems, can reduce variable production costs.
Renewable Energy
Our microturbines can use renewable methane gases from landfills, wastewater treatmentfacilities and biogas from sources such as food processing, agricultural waste and cow, pig andchicken manure. Capstone’s microturbines can burn these renewable waste gases with minimalemissions, thereby, in some cases, avoiding the imposition of penalties incurred for pollutionwhile simultaneously producing electricity from this ‘‘free’’ renewable fuel for use at the siteor in the surrounding area. Capstone’s microturbines have demonstrated effectiveness in theseapplications and outperform conventional combustion engines in a number of situations,including when the gas contains a high amount of sulfur.
Natural Resources—Oil, Natural Gas, Shale Gas & Mining
On a worldwide basis, there are thousands of locations where the drilling, production,compression and transportation of natural resources and other extraction and productionprocesses create fuel byproducts, which traditionally have been released or burned into theatmosphere. Our microturbines are installed in the natural resource market to be used in oil
36

and gas exploration, production, compression and transmission sites both onshore and offshoreas a highly reliable critical source of power generation. In addition, our microturbines can useflare gas as a fuel to provide prime power. Typically these oil and gas or mining operationshave no access to an electric utility grid and rely solely on Capstone’s microturbines for areliable low emission power supply.
Critical Power Supply
Because of the potentially catastrophic consequences of even momentary system failure,certain power users, such as high technology and information systems companies, requireparticularly high levels of reliability in their power service. Management believes thatCapstone’s critical power supply offerings are the world’s only microturbine poweredUninterruptible Power Source solutions that can offer clean, IT-grade power produced frommicroturbines, the utility or a combination of both.
Transportation
Our technology is also used in hybrid electric vehicle (‘‘HEV’’) applications. Our customershave applied our products in hybrid electric mobile applications, including transit buses andtrucks. In these applications the microturbine acts as an onboard battery charger to rechargethe battery system as needed. The benefits of microturbine hybrids include extended range,fuel economy gains, quieter operation, reduced emissions and higher reliability compared withtraditional internal combustion engines.
Marine
Our technology is also used in marine applications. Our customers have applied our productsin the commercial vessel and luxury yacht markets. The most immediate market for ourmarine products is for use as ship auxiliaries. In this application, the microturbines providepower to the vessel’s electrical loads and, in some cases, the vessel is able to utilize theexhaust energy to increase the overall efficiency of the application, reducing overall fuelconsumption and emissions. The other application is similar to our HEV application wherethe vessel is driven by an electric propulsion system and the microturbine serves as an onboard range extender.
2) Sales and Distribution Channels We seek out distributors that have business experience andcapabilities to support our growth plans in our targeted markets. A significant portion of ourrevenue is derived from sales to distributors who resell our products to end users. We have atotal of 97 distributors and Original Equipment Manufacturers (‘‘OEMs’’). In North America,we currently have 31 distributors and OEMs. Outside of North America, we currently have66 distributors and OEMs. We continue to refine the distribution channels to address ourspecific targeted markets.
3) Service We provide service primarily through our global distribution network. Together withour global distribution network we offer new and remanufactured parts as well as acomprehensive Factory Protection Plan (‘‘FPP’’). Through our global distribution network, weoffer a comprehensive FPP for a fixed annual fee to perform regularly scheduled andunscheduled maintenance as needed. Capstone provides factory and onsite training to certifyall personnel that are allowed to perform service on our microturbines. FPPs are generallypaid quarterly in advance. Our FPP backlog at the end of Fiscal 2015 and Fiscal 2014 was$61.2 million and $47.2 million, respectively, which represents the value of the contractualagreement for FPP services that has not been earned and extends through Fiscal 2029. Servicerevenue in Fiscal 2015 was approximately 9% of total revenue.
37

4) Product Robustness and Life Cycle Maintenance Costs We continue to invest in enhancementsthat relate to high performance and high reliability. An important element of our continuedinnovation and product strategy is to focus on the engineering of our product hardware andelectronics to make them work together more effectively and deliver improved microturbineperformance, reliability and low maintenance cost to our customers.
5) New Product Development Our new product development is targeted specifically to meet theneeds of our selected vertical markets. We expect that our existing product platforms, the C30,C65, TA100, C200 and C1000 Series microturbines, will be our foundational product lines forthe foreseeable future. Our research and development project portfolio is centered onenhancing the features of these base products. We are currently focusing efforts on enhancingour products to improve reliability, reduce direct material costs, and be compliant with thenew European grid interconnect requirements. We are also developing a more efficientmicroturbine CHP system with the DOE. The first phase of the development program hassuccessfully achieved 270 kW with a prototype C250 engine. Capstone plans to continuedevelopment of the engine as well as power electronics and software controls required forsuccessful commercialization. The second phase of the program is expected to incorporatefurther engine efficiency improvements, resulting in a product with a projected electricalefficiency of 42% and targeted power output of 370 kW. The DOE awarded us a grant of$5.0 million in support of this development program of which $3.9 million has been usedthrough March 31, 2015.
6) Cost and Core Competencies We believe that the core competencies of Capstone products areair-bearing technology, advanced combustion technology and sophisticated power electronicsto form efficient and ultra-low emission electricity and cooling and heat production systems.Our core intellectual property is contained within our air-bearing technology. We continue toreview avenues for cost reduction by sourcing to the best value supply chain option. In orderto utilize manufacturing facilities and technology more effectively, we are focused oncontinuous improvements in manufacturing processes. Additionally, considerable effort isbeing directed to manufacturing cost reduction through process improvement, product design,advanced manufacturing technology, supply management and logistics. Management expects tobe able to leverage our costs as product volumes increase.
Management believes that effective execution in each of these key areas will be necessary toleverage Capstone’s promising technology and early market leadership into achieving positive cash flowwith growing market presence and improving financial performance. Based on our recent progress andassuming achievement of targeted cost reductions, our financial model indicates that we will achievepositive cash flow when we ship approximately 200 units in a quarter, depending on an assumedproduct mix. Management believes our manufacturing facilities located in Chatsworth and Van Nuys,California have a combined production capacity of approximately 2,000 units per year, depending onproduct mix. Excluding working capital requirements, management believes we can expand ourcombined production capacity to approximately 4,000 units per year, depending on product mix, withapproximately $10 to $15 million of capital expenditures. We have not committed to this expansion noridentified a source for its funding.
Critical Accounting Policies
Our discussion and analysis of our financial condition and results of operations is based upon ourconsolidated financial statements, which have been prepared in accordance with accounting principlesgenerally accepted in the United States of America (‘‘GAAP’’). The preparation of these consolidatedfinancial statements requires us to make estimates and judgments that affect the reported amounts ofassets, liabilities, revenue and expenses and related disclosures of contingent liabilities. On an on-goingbasis, we evaluate our estimates, including but not limited to those related to long-lived assets,
38
including finite-lived intangible assets and fixed assets, bad debts, inventories, warranty obligations,stock-based compensation, income taxes and contingencies. We base our estimates on historicalexperience and on various other assumptions that we believe to be reasonable under the circumstances,the results of which form the basis for making judgments about the carrying values of assets andliabilities that are not readily apparent from other sources. Actual results may differ from theseestimates under different assumptions or conditions.
Management believes that the following critical accounting policies affect our more significantjudgments and estimates used in the preparation of our consolidated financial statements.
• We evaluate the carrying value of long-lived assets, including intangible assets with finite lives,for impairment whenever events or changes in circumstances indicate that the carrying value ofsuch assets may not be recoverable. Factors that are considered important that could trigger animpairment review include a current-period operating or cash flow loss combined with a historyof operating or cash flow losses and a projection or forecast that demonstrates continuing lossesor insufficient income associated with the use of a long-lived asset or asset group. Other factorsinclude a significant change in the manner of the use of the asset or a significant negativeindustry or economic trend. This evaluation is performed based on undiscounted estimatedfuture cash flows compared with the carrying value of the related assets. If the undiscountedestimated future cash flows are less than the carrying value, an impairment loss is recognizedand the loss is measured by the difference between the carrying value and the estimated fairvalue of the asset group. The estimated fair value of the assets are determined using the bestinformation available. On a quarterly basis, we assess whether events or changes incircumstances have occurred that potentially indicate the carrying value of long-lived assets maynot be recoverable. Intangible assets include a manufacturing license, technology, backlog andcustomer relationships. We reevaluate the useful life determinations for these intangible assetseach reporting period to determine whether events and circumstances warrant a revision in theirremaining useful lives. The Company performed an analysis as of March 31, 2015 anddetermined that no impairment was necessary. See Note 5—Intangible Assets in the ‘‘Notes toConsolidated Financial Statements.’’
• Our inventories are valued on a first in first out (‘‘FIFO’’) basis and at the lower of cost ormarket. We routinely evaluate the composition of our inventories and identify slow-moving,excess, obsolete or otherwise impaired inventories. Inventories identified as impaired areevaluated to determine if write-downs are required. Included in this assessment is a review forobsolescence as a result of engineering changes in our product. Future product enhancementand development may render certain inventories obsolete, resulting in additional write-downs ofinventories. In addition, inventories are classified as current or long-term based on our salesforecast and also, in part, based on our projected usage for warranty claims and service. Achange in forecast could impact the classification of inventories.
• We provide for the estimated cost of warranties at the time revenue from sales is recognized.We also accrue the estimated costs to address reliability repairs on products no longer underwarranty when, in our judgment, and in accordance with a specific plan developed by us, it isprudent to provide such repairs. We estimate warranty expenses based upon historical andprojected product failure rates, estimated costs of parts, labor and shipping to repair or replacea unit and the number of units covered under the warranty period. While we engage in extensivequality programs and processes, our warranty obligation is affected by failure rates and servicecosts in correcting failures. As we have more units commissioned and longer periods of actualperformance, additional data becomes available to assess future warranty costs. When we havesufficient evidence that product changes are altering the historical failure occurrence rates, theimpact of such changes is then taken into account in estimating future warranty liabilities.Changes in estimates are recorded in the period that new information, such as design changes,
39
cost of repair and product enhancements, becomes available. Should actual failure rates orservice costs differ from our estimates, revisions to the warranty liability would be required andcould be material to our financial condition, results of operations and cash flow.
• Our revenue consists of sales of products, parts, accessories and service, which includes FPPs,net of discounts. Our distributors purchase products, parts and FPPs for sale to end users andare also required to provide a variety of additional services, including application engineering,installation, commissioning and post-commissioning service. Our standard terms of sales todistributors and direct end users include transfer of title, care, custody and control at the pointof shipment, payment terms ranging from full payment in advance of shipment to payment in90 days, no right of return or exchange, and no post-shipment performance obligations by usexcept for warranties provided on the products and parts sold. We recognize revenue when all ofthe following criteria are met: persuasive evidence of an arrangement exists, delivery hasoccurred or service has been rendered, selling price is fixed or determinable and collectability isreasonably assured. Service revenue derived from time and materials contracts is recognized asthe service is performed. FPP contracts are agreements to perform certain agreed-upon serviceto maintain a product for a specified period of time. Service revenue derived from FPP contractsis recognized on a straight-line basis over the contract period. We occasionally enter intoagreements that contain multiple elements, such as equipment, installation, engineering and/orservice.
• Trade accounts receivable are recorded at the invoiced amount and typically non-interestbearing. We maintain allowances for estimated losses resulting from the inability of ourcustomers to make required payments and other accounts receivable allowances. We evaluate allaccounts aged over 60 days past payment terms. If the financial condition of our customersdeteriorates or if other conditions arise that result in an impairment of their ability or intentionto make payments, additional allowances may be required.
• We have a history of unprofitable operations. These losses generated significant federal and statenet operating loss (‘‘NOL’’) carryforwards. We record a valuation allowance against the netdeferred income tax assets associated with these NOLs if it is ‘‘more likely than not’’ that we willnot be able to utilize them to offset future income taxes. Because of the uncertainty surroundingthe timing of realizing the benefits of our favorable tax attributes in future income tax returns, avaluation allowance has been provided against all of our net deferred income tax assets. Wecurrently provide for income taxes only to the extent that we expect to pay cash taxes, primarilyforeign and state taxes. It is possible, however, that we could be profitable in the future at levelswhich could cause management to determine that it is more likely than not that we will realizeall or a portion of the NOL carryforwards. Upon reaching such a conclusion, we would recordthe amount of net deferred tax assets that are expected to be realized. Such adjustment wouldincrease income in the period that the determination was made.
• We recognize stock-based compensation expense associated with stock options in the statementof operations. Determining the amount of stock-based compensation to be recorded requires usto develop estimates to be used in calculating the grant-date fair value of stock options. Wecalculate the grant-date fair values using the Black-Scholes valuation model.
The use of Black-Scholes model requires us to make estimates of the following assumptions:
• Expected volatility—The estimated stock price volatility was derived based upon theCompany’s actual historic stock prices over the expected option life, which represents theCompany’s best estimate of expected volatility.
40

• Expected option life—The expected life, or term, of options granted was derived fromhistorical exercise behavior and represents the period of time that stock option awards areexpected to be outstanding.
• Risk-free interest rate—We used the yield on zero-coupon U.S. Treasury securities for aperiod that is commensurate with the expected life assumption as the risk-free interest rate.
The amount of stock-based compensation recognized during a period is based on the value of theportion of the awards that are ultimately expected to vest. We estimate forfeitures at the time of grantand revise, if necessary, in subsequent periods if actual forfeitures differ from those estimates. Theterm ‘‘forfeitures’’ is distinct from ‘‘cancellations’’ or ‘‘expirations’’ and represents only the unvestedportion of the surrendered option. We review historical forfeiture data and determine the appropriateforfeiture rate based on that data. We re-evaluate this analysis periodically and adjust the forfeiturerate as necessary. Ultimately, we recognize the actual expense over the vesting period only for theshares that vest.
Results of Operations
Year Ended March 31, 2015 Compared to Year Ended March 31, 2014
Revenue Revenue for Fiscal 2015 decreased $17.6 million, or 13%, to $115.5 million from$133.1 million for Fiscal 2014. The change in revenue for Fiscal 2015 compared to Fiscal 2014 includeddecreases in revenue of $12.3 million from the European market, $4.3 million from the African market,$3.9 million from the North American market and $1.5 million from the Asian market. The decrease inthe European market was primarily the result of the continuing geopolitical instability in Russia andUkraine and the effects of a stronger U.S. dollar making our product more expensive overseascompared to Fiscal 2014. The revenue decline during Fiscal 2015 in the North American market wasprimarily the result of a drop in the oil and gas market which has affected the timing of customerdemand for our products compared to the same period last year. Revenue from the Asian and Africanmarkets decreased during Fiscal 2015 because of the impact of a decline in the oil and gas market andstronger U.S. dollar. These overall decreases in revenue were offset by increases in revenue of$3.6 million from the Australian market and $0.8 million from the South American market. Theincrease in the Australian and South American markets was primarily the result of our continuedefforts to improve distribution channels.
Megawatts shipped, microturbine units shipped and average revenue per unit decreased primarilyas a result of lower sales volume and shift in product mix for our microturbines during Fiscal 2015compared to the same period last year. Revenue from microturbine products during Fiscal 2015decreased $19.4 million, or 18%, to $89.4 million from $108.8 million for Fiscal 2014. Microturbinemegawatts shipped during Fiscal 2015 decreased 18.5 megawatts to 91.4 megawatts from109.9 megawatts for Fiscal 2014. Microturbine units shipped during Fiscal 2015 decreased 51 units to620 units from 671 units shipped during Fiscal 2014. Average revenue per unit shipped decreased forFiscal 2015 to approximately $144,000 compared to approximately $162,000 per unit for Fiscal 2014.The decrease in average revenue per unit was primarily the result of a decrease in shipments of ourC1000 Series systems partially offset by an increase in shipments of our C65 microturbines duringFiscal 2015 compared to the same period last year.
For Fiscal 2015, revenue from our accessories, parts and service increased $1.8 million, or 7%, to$26.1 million from $24.3 million for Fiscal 2014. The increase in revenue resulted primarily from higherFPP contract enrollment and sales of microturbine parts, partially offset by lower sales of microturbineservice work.
The timing of shipments is subject to change based on several variables (including customerdeposits, payments, availability of credit and delivery schedule changes), most of which are not within
41

our control and can affect the timing of our revenue. Therefore, we evaluate historical revenue inconjunction with backlog to anticipate the growth trend of our revenue.
The following table summarizes our revenue (revenue amounts in millions):
Years Ended March 31,
2015 2014
Revenue Megawatts Units Revenue Megawatts Units
C30 . . . . . . . . . . . . . . . . . . . . . . . . . . . . . . . . . $ 4.8 2.9 97 $ 5.6 3.7 124C65 . . . . . . . . . . . . . . . . . . . . . . . . . . . . . . . . . 30.1 27.8 427 29.1 26.1 402TA100 . . . . . . . . . . . . . . . . . . . . . . . . . . . . . . . 0.3 0.2 2 0.5 0.4 4C200 . . . . . . . . . . . . . . . . . . . . . . . . . . . . . . . . 7.1 6.6 33 14.8 12.6 63C600 . . . . . . . . . . . . . . . . . . . . . . . . . . . . . . . . 5.9 6.0 10 10.4 10.8 18C800 . . . . . . . . . . . . . . . . . . . . . . . . . . . . . . . . 8.3 8.8 11 10.1 11.2 14C1000 . . . . . . . . . . . . . . . . . . . . . . . . . . . . . . . 32.7 39.0 39 38.1 45.0 45Waste heat recovery generator . . . . . . . . . . . . . 0.2 0.1 1 0.2 0.1 1Unit upgrades . . . . . . . . . . . . . . . . . . . . . . . . . — — — — — —
Total from Microturbine Products . . . . . . . . . . . $ 89.4 91.4 620 $108.8 109.9 671Accessories, Parts and Service . . . . . . . . . . . . . . 26.1 — — 24.3 — —
Total . . . . . . . . . . . . . . . . . . . . . . . . . . . . . . . . $115.5 91.4 620 $133.1 109.9 671
Sales to Horizon Power Systems (‘‘Horizon’’), one of the Company’s domestic distributors,accounted for 17%, 12% and 27% of our revenue for the years ended March 31, 2015, 2014 and 2013,respectively. Sales to BPC Engineering (‘‘BPC’’), one of the Company’s Russian distributors, accountedfor 11%, 17% and 11% of our revenue for the years ended March 31, 2015, 2014 and 2013,respectively. Sales to E-Finity Distributed Generation, LLC (‘‘E-Finity), one of the Company’s domesticdistributors, accounted for 19% of our revenue for the year ended March 31, 2014.
Gross Margin Cost of goods sold includes direct material costs, production and service centerlabor and overhead, inventory charges and provision for estimated product warranty expenses. Thegross margin was $18.3 million, or 16% of revenue, for Fiscal 2015 compared to a gross margin of$21.7 million, or 16% of revenue, for Fiscal 2014. The change in the gross margin during Fiscal 2015compared to Fiscal 2014 was driven by multiple factors including lower royalty expense of $1.2 million,lower production and service center labor and overhead expense of $1.0 million and lower warrantyexpense of $0.4 million. The positive impact of these factors was offset by the adverse impact of lowervolume, lower average selling prices and a change in product mix for our microturbines of $5.0 millionand higher inventory charges of $1.0 million. Management continues to implement initiatives toimprove gross margin by further reducing manufacturing overhead fixed and direct material costs as wework to achieve profitability and improving product performance.
Royalty expense decreased $1.2 million during Fiscal 2015 compared to Fiscal 2014 as a result of areduction in the predetermined fixed rate royalty. We pay a predetermined fixed rate royalty for eachmicroturbine system covered by our Development and License Agreement with Carrier. The fixed rateroyalty was reduced by 50% during the three months ended September 30, 2013 as a result of thecontractual reduction.
Production and service center labor and overhead expense decreased approximately $1.0 millionduring Fiscal 2015 compared to Fiscal 2014 primarily as the result of decreases in service center travelexpense of approximately $0.3 million, facilities expense of $0.3 million, salaries expense of $0.2 millionand supplies expense of $0.2 million.
42

Warranty expense is a combination of a standard warranty provision recorded at the time revenueis recognized and changes, if any, in estimates for reliability repair programs. Reliability repairprograms are based upon estimates that are recorded in the period that new information becomesavailable, including design changes, cost of repair and product enhancements, which can include bothin-warranty and out-of-warranty systems. The decrease in warranty expense of $0.4 million reflects adecrease in the standard warranty provision as a result of sales volume and a decrease in reliabilityrepair programs during Fiscal 2015 compared to the prior year. Management expects warranty claimlevels for C200 and C1000 Series systems to decline as reliability repair programs are completed andthese products mature.
Inventory charges increased approximately $1.0 million during Fiscal 2015 compared to Fiscal 2014primarily as a result of an allowance for slow-moving inventory related to our waste heat recoverygenerators.
During the three months ended March 31, 2015, we shipped approximately $0.7 million of productto BPC. Given the uncertainty as to the collectability of the sale, revenue recognition on this shipmentwas deferred. However, as we do not have title to the product or rights to receive the product back inthe event we are not paid, such amounts were expensed through cost of goods sold for Fiscal 2015.
Research and Development Expenses R&D expenses include compensation, engineering departmentexpenses, overhead allocations for administration and facilities and materials costs associated withdevelopment. R&D expenses for Fiscal 2015 increased $0.7 million, or 8%, to $9.7 million from$9.0 million for Fiscal 2014. R&D expenses are reported net of benefits from cost-sharing programs,such as DOE grants. During Fiscal 2015 cost sharing benefits decreased approximately $0.9 millionoffset by a decrease of approximately $0.2 million in professional services expense. There wereapproximately $0.5 million of cost-sharing benefits for Fiscal 2015 and $1.4 million of such benefits forFiscal 2014. Cost-sharing programs vary from period to period depending on the phase of theprograms. Management expects R&D expenses in Fiscal 2016 to be slightly higher than in Fiscal 2015as we continue product robustness and direct material cost reduction initiatives.
Selling, General and Administrative (‘‘SG&A’’) Expenses SG&A expenses for Fiscal 2015 increased$11.5 million, or 41%, to $39.5 million from $28.0 million for Fiscal 2014. The net increase in SG&Aexpenses was comprised of increases of $9.9 million in bad debt expense, $0.9 million in salariesexpense, $0.6 million in professional services expense, which includes legal expense, $0.4 million inmarketing expense and $0.1 million in business travel expense, offset by a decreases of $0.2 million infacilities expense and $0.2 million in supplies expense. The increase in the bad debt expense wasprimarily the result of accounts receivable allowances recorded for BPC and Electro MecaniqueIndustries (‘‘EMI’’), one of the Company’s distributors in the Middle East and Africa, during Fiscal2015. During the three months ended March 31, 2015, we recorded approximately $7.1 million withrespect to the accounts receivable allowance from BPC. We determined that the collectability of thisaccounts receivable balance was not reasonably assured based on BPC’s recent payment history andbecause the impact of the steep decline of the Russian ruble could continue to negatively impact itsability to pay its outstanding accounts receivable balance. Also during three months endedSeptember 30, 2014, we recorded approximately $2.6 million with respect to EMI. We determined thatthe collectability of this accounts receivable balance was not reasonably assured based on EMI’spayment history. Excluding bad debt expense, management expects SG&A expenses in Fiscal 2016 tobe higher than in Fiscal 2015 primarily as a result of expanding our aftermarket services, which mayrequire paying incentive-based compensation to certain key Capstone employees in the event thatCapstone achieves its planned results of operations.
Interest Expense Interest expense decreased $0.2 million, or 29%, to $0.5 million during Fiscal2015 from $0.7 million during Fiscal 2014. Interest expense is primarily from the average balances
43

outstanding under the Credit Facility. As of March 31, 2015, we had total debt of $13.0 millionoutstanding under the Credit Facility.
Change in Fair Value of Warrant Liability Effective September 23, 2013, warrants issued inconnection with the September 23, 2008 registered direct placement to purchase 4.0 million sharesexpired, and the liability associated with the warrants was reversed. The reversal of the warrant liabilityresulted in a benefit of approximately $10,000 for Fiscal 2014. This reversal of the warrant liability hadno impact on our cash balances.
Income Tax Provision Income tax expense decreased $0.1 million, or 50%, to $0.1 million duringFiscal 2015 from $0.2 million during Fiscal 2014. Income tax expense incurred was related to state andforeign taxes. The effective income tax rate of �0.4% differs from the federal and state blendedstatutory rate of approximately 37% primarily as a result of recording taxable losses. At March 31,2015, we had federal and state net operating loss carryforwards of approximately $626 million and$202 million, respectively, which may be utilized to reduce future taxable income, subject to limitationsunder Section 382 of the Internal Revenue Code of 1986. We provided a valuation allowance for 100%of our net deferred tax asset of $246.8 million at March 31, 2015 because the realization of the benefitsof these favorable tax attributes in future income tax returns is not deemed more likely than not.Similarly, at March 31, 2014, the net deferred tax asset was fully reserved.
Year Ended March 31, 2014 Compared to Year Ended March 31, 2013
Revenue Revenue for Fiscal 2014 increased $5.5 million, or 4%, to $133.1 million from$127.6 million for Fiscal 2013. The change in revenue for Fiscal 2014 compared to Fiscal 2013 includedincreases in revenue of $15.2 million from the European market, $6.1 million from the African marketand $2.3 million from the Asian market. The increase in the European market was primarily related toincreased sales into the Russian natural resources vertical market. The increase in the African marketwas primarily the result of further market adoption of our products in this market. The increase in theAsian market was primarily because of an increase in average selling prices of microturbine unitsshipped in Asia during Fiscal 2014 compared to the same period last year. This overall increase inrevenue was offset by decreases in revenue of $16.4 million from the North American market,$1.5 million from the South American market and $0.2 million from the Australian market. Thedecreases in the North American, South American and Australian markets were primarily the result ofa shift in certain customers’ project timelines compared to the same period last year.
Megawatts shipped and microturbine units shipped during Fiscal 2014 increased as a result ofhigher sales volume for our C65 microturbine and a change in product mix of the C1000 Seriessystems, offset by lower sales volume for our C30, TA100 and C200 microturbines. For Fiscal 2014,revenue from microturbine products increased $6.1 million, or 6%, to $108.8 million from$102.7 million for Fiscal 2013. Microturbine megawatts shipped during Fiscal 2014 increased 6.7megawatts to 109.9 megawatts from 103.2 megawatts for Fiscal 2013. Microturbine units shipped duringFiscal 2014 increased 43 units to 671 units from 628 units for Fiscal 2013. Average revenue per unitdecreased for Fiscal 2014 to approximately $162,000 compared to approximately $163,000 per unit forFiscal 2013. The decrease in average revenue per unit was primarily the result of a change in mix ofC1000 Series systems and more C65 microturbines shipped during Fiscal 2014 compared to the sameperiod last year.
For Fiscal 2014, revenue from our accessories, parts and service decreased $0.6 million, or 2%, to$24.3 million from $24.9 million for Fiscal 2013. The decrease in revenue resulted primarily from lowersales of microturbine service work, partially offset by higher FPP contract enrollment, sales ofmicroturbine parts and sales of accessories.
The timing of shipments is subject to change based on several variables (including customerdeposits, payments, availability of credit and delivery schedule changes), most of which are not withinour control and can affect the timing of our revenue. Therefore, we evaluate historical revenue inconjunction with backlog to anticipate the growth trend of our revenue.
44

The following table summarizes our revenue (revenue amounts in millions):
Years Ended March 31,
2014 2013
Revenue Megawatts Units Revenue Megawatts Units
C30 . . . . . . . . . . . . . . . . . . . . . . . . . . . . . . . . . $ 5.6 3.7 124 $ 6.8 4.4 147C65 . . . . . . . . . . . . . . . . . . . . . . . . . . . . . . . . . 29.1 26.1 402 22.9 21.0 323TA100 . . . . . . . . . . . . . . . . . . . . . . . . . . . . . . . 0.5 0.4 4 1.5 0.8 8C200 . . . . . . . . . . . . . . . . . . . . . . . . . . . . . . . . 14.8 12.6 63 18.1 15.6 78C600 . . . . . . . . . . . . . . . . . . . . . . . . . . . . . . . . 10.4 10.8 18 12.4 12.6 21C800 . . . . . . . . . . . . . . . . . . . . . . . . . . . . . . . . 10.1 11.2 14 5.3 5.6 7C1000 . . . . . . . . . . . . . . . . . . . . . . . . . . . . . . . 38.1 45.0 45 35.6 43.0 43Waste heat recovery generator . . . . . . . . . . . . . 0.2 0.1 1 — — —Unit upgrades . . . . . . . . . . . . . . . . . . . . . . . . . — — — 0.1 0.2 1
Total from Microturbine Products . . . . . . . . . . . $108.8 109.9 671 $102.7 103.2 628Accessories, Parts and Service . . . . . . . . . . . . . . 24.3 — — 24.9 — —
Total . . . . . . . . . . . . . . . . . . . . . . . . . . . . . . . . $133.1 109.9 671 $127.6 103.2 628
Sales to E-Finity accounted for 19% of our revenue for the year ended March 31, 2014. Sales toBPC accounted for 17%, 11% and 26% of our revenue for the years ended March 31, 2014, 2013 and2012, respectively. Sales to Horizon accounted for 12%, 27% and 19% of our revenue for the yearsended March 31, 2014, 2013 and 2012, respectively.
Gross Margin Cost of goods sold includes direct material costs, production and service centerlabor and overhead, inventory charges and provision for estimated product warranty expenses. Thegross margin was $21.7 million, or 16% of revenue, for Fiscal 2014 compared to a gross margin of$14.4 million, or 11% of revenue, for Fiscal 2013. The increase of $7.3 million in gross margin was theresult of a $4.4 million improvement realized from overall higher revenue as a result of higher salesvolume of our microturbine products as discussed above, lower direct material costs primarily related tothe C1000 Series, decreases in our royalty expense of $1.5 million, warranty expense of $1.2 million andproduction and service center labor and overhead expenses of $0.2 million during Fiscal 2014 comparedto the prior year.
Royalty expense decreased $1.5 million during Fiscal 2014 compared to Fiscal 2013 as a result of areduction in the predetermined fixed rate royalty offset by higher volume of covered microturbinesystems. We pay a predetermined fixed rate royalty for each microturbine system covered by ourDevelopment and License Agreement with Carrier. The fixed rate royalty was reduced by 50% duringthe three months ended September 30, 2013 as a result of the contractual reduction.
Warranty expense is a combination of a standard warranty provision recorded at the time revenueis recognized and changes, if any, in estimates for reliability repair programs. Reliability repairprograms are based upon estimates that are recorded in the period that new information becomesavailable, including design changes, cost of repair and product enhancements, which can include bothin-warranty and out-of-warranty systems. The decrease in warranty expense of $1.2 million reflected adecrease in reliability repair programs, offset by an increase in the per unit standard warranty provisionas a result of sales mix and higher volume of units under warranty during Fiscal 2014 compared to theprior year.
Production and service center labor and overhead expense decreased approximately $0.2 millionduring Fiscal 2014 compared to Fiscal 2013 primarily as the result of a decrease in service center travelexpense of approximately $0.4 million, offset by an increase in facilities expense of approximately$0.2 million.
45

Research and Development Expenses R&D expenses include compensation, engineering departmentexpenses, overhead allocations for administration and facilities and materials costs associated withdevelopment. We had R&D expenses of approximately $9.0 million for each of Fiscal 2014 and Fiscal2013. R&D expenses are reported net of benefits from cost-sharing programs, such as DOE grants.During Fiscal 2014 supplies expense decreased approximately $0.3 million, offset by a decrease in costsharing benefits of approximately $0.3 million. There were approximately $1.4 million of cost-sharingbenefits for Fiscal 2014 and $1.7 million of such benefits for Fiscal 2013. Cost-sharing programs varyfrom period to period depending on the phase of the programs.
Selling, General and Administrative (‘‘SG&A’’) Expenses SG&A expenses for Fiscal 2014 increased$0.6 million, or 2%, to $28.0 million from $27.4 million for Fiscal 2013. The net increase in SG&Aexpenses was comprised of increases of approximately $0.7 million in salaries expense, $0.2 million infacilities expense $0.2 million in consulting expense and $0.2 million in supplies expense, offset by adecrease of approximately $0.7 million in marketing expense.
Interest Expense Interest expense for each of Fiscal 2014 and Fiscal 2013 was approximately$0.7 million. Interest expense is primarily from the average balances outstanding under the CreditFacility. As of March 31, 2014, we had total debt of $13.2 million outstanding under the Credit Facility.
Change in Fair Value of Warrant Liability Effective September 23, 2013, warrants to purchaseapproximately 4.0 million shares of common stock that were issued in connection with theSeptember 23, 2008 registered direct placement expired, and the liability associated with the warrantswas reversed. The reversal of the warrant liability resulted in a benefit of approximately $10,000 forFiscal 2014. This reversal of the warrant liability had no impact on our cash balances. The change infair value of the warrant liability resulted in a benefit of approximately $0.8 million for Fiscal 2013.This change in fair value of warrant liability was a result of warrant exercises and revaluing the warrantliability based on the Monte Carlo simulation valuation model which is based primarily upon thequoted price of the Company’s common stock in an active market. This revaluation of the warrantliability had no impact on our cash balances.
Income Tax Provision Income tax expense decreased $0.5 million, or 71%, to $0.2 million duringFiscal 2014 from $0.7 million during Fiscal 2013. Income tax expense incurred was primarily related toforeign taxes of $0.2 million. The effective income tax rate of 1.4% differs from the federal and stateblended statutory rate of 35% primarily as a result of recording taxable losses. At March 31, 2014, wehad federal and state net operating loss carryforwards of approximately $606.2 million and$226.9 million, respectively, which may be utilized to reduce future taxable income, subject tolimitations under Section 382 of the Internal Revenue Code of 1986. We provided a valuationallowance for 100% of our net deferred tax asset of $236.2 million at March 31, 2014 because therealization of the benefits of these favorable tax attributes in future income tax returns is not deemedmore likely than not. Similarly, at March 31, 2013, the net deferred tax asset was fully reserved.
Quarterly Results of Operations
The following table presents unaudited quarterly financial information. This information wasprepared in accordance with GAAP, and, in the opinion of management, contains all adjustmentsnecessary for a fair presentation of such quarterly information when read in conjunction with thefinancial statements included elsewhere herein. Our operating results for any prior quarters may notnecessarily indicate the results for any future periods.
46

(In thousands, except per share data)
Year Ended March 31, 2015 Year Ended March 31, 2014
Fourth Third Second First Fourth Third Second First(Unaudited) Quarter Quarter Quarter Quarter Quarter Quarter Quarter Quarter
Revenue . . . . . . . . . . . . . . . . . . . . . . . . . . . . $ 29,869 $30,084 $32,248 $23,260 $36,438 $37,003 $35,291 $24,373Cost of goods sold . . . . . . . . . . . . . . . . . . . . . 26,347 23,978 27,005 19,844 30,292 29,668 30,399 21,050
Gross margin . . . . . . . . . . . . . . . . . . . . . . . 3,522 6,106 5,243 3,416 6,146 7,335 4,892 3,323Operating expenses:
R&D . . . . . . . . . . . . . . . . . . . . . . . . . . . . 2,942 2,355 2,055 2,327 2,471 2,267 1,956 2,335SG&A . . . . . . . . . . . . . . . . . . . . . . . . . . . 14,702 7,508 9,543 7,764 6,781 6,991 6,641 7,568
Loss from operations . . . . . . . . . . . . . . . . . . (14,122) (3,757) (6,355) (6,675) (3,106) (1,923) (3,705) (6,580)
Net loss . . . . . . . . . . . . . . . . . . . . . . . . . . . $(14,298) $(3,935) $(6,529) $(6,771) $(3,381) $(2,189) $(3,888) $(6,798)
Net loss per common share—basic and diluted . . $ (0.05) $ (0.01) $ (0.02) $ (0.02) $ (0.01) $ (0.01) $ (0.01) $ (0.02)
During the three months ended March 31, 2015, we recorded an allowance of approximately$1.2 million for slow-moving inventory related to our waste heat recovery generators. In addition, weshipped approximately $0.7 million of product to BPC during the three months ended March 31, 2015.Given the uncertainty as to the collectability of the sale, the revenue for this shipment was notrecognized. Both transactions were included in cost of goods sold for the three months endedMarch 31, 2015.
During the three months ended March 31, 2015, we recorded approximately $7.1 million withrespect to the accounts receivable allowance from BPC. We determined that the collectability of thisaccounts receivable balance was not reasonably assured based on BPC’s recent payment history andbecause the impact of the recent steep decline of the Russian ruble could continue to negatively impactits ability to pay its outstanding accounts receivable balance. During the three months endedSeptember 30, 2014, we recorded approximately $2.6 million with respect to the accounts receivablebalance from EMI. We determined that the collectability of this accounts receivable balance was notreasonably assured based on EMI’s payment history. Both transactions were included in SG&A for thethree months ended March 31, 2015 and September 30, 2014, respectively.
Liquidity and Capital Resources
Our cash requirements depend on many factors, including the execution of our plan. We expect tocontinue to devote substantial capital resources to running our business and creating the strategicchanges summarized herein. Our planned capital expenditures for the year ending March 31, 2016include approximately $2.0 million for plant and equipment costs related to manufacturing andoperations. We have invested our cash in institutional funds that invest in high quality short-termmoney market instruments to provide liquidity for operations and for capital preservation.
Our cash and cash equivalent balances increased $4.4 million during the year ended March 31,2015, compared to a decrease of $11.0 million during the year ended March 31, 2014. The overallimprovement in cash used during the year ended March 31, 2015 compared to the year endedMarch 31, 2014 was primarily the result of cash provided by financing activities.
Operating Activities—During the year ended March 31, 2015, we used $23.0 million in cash in ouroperating activities, which consisted of a net loss for the period of $31.5 million and cash used forworking capital of $11.9 million, offset by non-cash adjustments (primarily accounts receivableallowances, warranty provision, depreciation and amortization, stock-based compensation and inventoryprovision) of $20.4 million. During the year ended March 31, 2014, operating cash usage was$15.4 million, which consisted of a net loss for the period of $16.3 million and cash used for workingcapital of $9.7 million, offset by non-cash adjustments of $10.6 million.
47
The following is a summary of the significant sources (uses) of cash from operating activities(amounts in thousands):
Year Ended March 31,
2015 2014
Net loss . . . . . . . . . . . . . . . . . . . . . . . . . . . . . . . . . . . . . . . . $(31,533) $(16,256)Non-cash operating activities(1) . . . . . . . . . . . . . . . . . . . . . . 20,444 10,562Changes in operating assets and liabilities:Accounts receivable . . . . . . . . . . . . . . . . . . . . . . . . . . . . . . 4,761 (10,320)Inventories . . . . . . . . . . . . . . . . . . . . . . . . . . . . . . . . . . . . . (7,125) (784)Accounts payable and accrued expenses . . . . . . . . . . . . . . . . (5,960) 4,475Other changes in operating assets and liabilities . . . . . . . . . . (3,605) (3,109)
Net cash used in operating activities . . . . . . . . . . . . . . . . . . . . $(23,018) $(15,432)
(1) Represents accounts receivable allowances, warranty provision, depreciation andamortization, stock-based compensation expense, inventory provision and change in fairvalue of warrant liability.
The increase in net cash used in operating activities during Fiscal 2015 compared to Fiscal 2014was primarily related to the increase in net loss, excluding non-cash operating activities, and loweraccounts payable and accrued expenses offset by cash provided from accounts receivable and change ininventories. The change of accounts payable and accrued expenses was primarily the result ofmanagement’s initiatives to reduce aged payables and the timing and level of inventory receiptscompared to vendor payments. The change in accounts receivable was primarily the result of timing ofcash receipts on lower revenue. The change in inventory was primarily because of higher finished goodsas of March 31, 2015. The increase in non-cash operating activities during Fiscal 2015 was primarily theresult of an accounts receivable allowance for BPC and EMI during Fiscal 2015 compared to the sameperiod last year.
Investing Activities Net cash used in investing activities of $1.6 million and $1.2 million during theyears ended March 31, 2015 and 2014 relates primarily to the acquisition of fixed assets.
Financing Activities During the year ended March 31, 2015, we generated approximately$29.0 million from financing activities compared to cash generated during the year ended March 31,2014 of approximately $5.7 million. The funds generated from financing activities during the year endedMarch 31, 2015 were primarily from the proceeds related to our underwritten public offering describedbelow. The funds generated from financing activities during the year ended March 31, 2014 wereprimarily the result of the exercise of warrants, described below which yielded $6.0 million in cash,offset by repayments under the Credit Facility. Net repayments under the Credit Facility wereapproximately $0.3 million during the year ended March 31, 2015 compared to net borrowings ofapproximately $0.2 million during the year ended March 31, 2014.
Effective May 6, 2014, the Company completed an underwritten public offering in which it sold18.8 million shares of the Company’s common stock at a price of $1.70 per share less underwritingdiscounts and commissions. The shares were allocated to a single institutional investor. The netproceeds to the Company from the sale of the common stock, after deducting fees and other offeringexpenses, were approximately $29.8 million.
On October 31, 2013, an unsolicited exercise of warrants to purchase 4.7 million shares resulted inproceeds of approximately $6.0 million. Effective October 31, 2013, all remaining outstanding warrantsexpired.
48

During the years ended March 31, 2015 and 2014, the amount of cash received from the exerciseof stock options was approximately $0.3 million and $0.5 million, respectively. Employee stockpurchases, net of repurchases of shares of our common stock for employee taxes due on vesting ofrestricted stock units, resulted in approximately $0.2 million of net cash used during the year endedMarch 31, 2015, compared with $0.1 million of net cash used during the year ended March 31, 2014.
We maintain two Credit and Security Agreements, as amended (the ‘‘Agreements’’), with WellsFargo, which provide the Company with a line of credit of up to $15.0 million in the aggregate. Theline of credit can be increased to an amount up to $20.0 million upon the request of the Companypursuant to the amendment described below (the ‘‘Credit Facility’’). In addition, Wells Fargo hasprovided the Company with a non-revolving capital expenditure line of credit up to $0.5 million toacquire additional eligible equipment for use in the Company’s business pursuant to the amendmentdescribed below. As of March 31, 2015 the Company had not requested that the maximum line amountbe increased to an aggregate of $20.0 million pursuant to the Agreements. The amount actuallyavailable to us may be less and may vary from time to time depending on, among other factors, theamount of eligible inventory and accounts receivable. As security for the payment and performance ofthe Credit Facility, we granted a security interest in favor of Wells Fargo in substantially all of ourassets. One of the Agreements will terminate in accordance with its terms on September 1, 2017, andthe other one will terminate on September 30, 2017. As of March 31, 2015 and March 31, 2014,$13.0 million and $13.2 million in borrowings were outstanding, respectively, under the Credit Facility.
The Agreements include affirmative covenants as well as negative covenants that prohibit a varietyof actions without Wells Fargo’s consent, including covenants that limit our ability to (a) incur orguarantee debt, (b) create liens, (c) enter into any merger, recapitalization or similar transaction orpurchase all or substantially all of the assets or stock of another entity, (d) pay dividends on, orpurchase, acquire, redeem or retire shares of, our capital stock, (e) sell, assign, transfer or otherwisedispose of all or substantially all of our assets, (f) change our accounting method or (g) enter into adifferent line of business. Furthermore, the Agreements contain financial covenants, including (i) arequirement not to exceed specified levels of losses, (ii) a requirement to maintain a substantialminimum monthly cash balance to outstanding line of credit advances based upon the Company’sfinancial performance, and (iii) limitations on our annual capital expenditures.
Several times since entering into the Agreements we were not in compliance with certaincovenants under the Credit Facility. In connection with each event of noncompliance, Wells Fargowaived the event of default and, on several occasions, the Company amended the Agreements inresponse to the default and waiver. The following summarizes the recent events, amendments andwaivers:
• On September 16, 2014, the Company entered into a letter agreement (the ‘‘Letter Agreement’’)with Wells Fargo. The Letter Agreement extended the maturity date under the Company’sCredit and Security Agreement (Ex-Im Subfacility) from September 30, 2014 to September 1,2017. The Letter Agreement also, among other things, changed the annual facility fee due toWells Fargo under the Credit and Security Agreement (Ex-Im Subfacility) and revised thecalculation of Capstone’s borrowing base under the portion of the Credit Facility established bythe Credit and Security Agreement (Ex-Im Subfacility) to increase the borrowing limit related toinventory.
• As of September 30, 2014, the Company determined that it was not in compliance with thefinancial covenant contained in the amended Agreements regarding the Company’s annual netincome for Fiscal 2015. On November 3, 2014, the Company received from Wells Fargo a waiverof such noncompliance and entered into an amendment to amend the financial covenantsregarding net income for Fiscal 2015.
49

• As of March 31, 2015, the Company determined that it was not in compliance with the financialcovenant contained in the amended Agreements regarding the Company’s annual net income forFiscal 2015. On June 10, 2015, the Company received from Wells Fargo a waiver of suchnoncompliance, and the Company and Wells Fargo entered into an amendment to theAgreements which set the financial covenants for Fiscal 2016. As a condition of the amendedAgreements, the Company has restricted $5.0 million of cash effective June 10, 2015 asadditional security for the Credit Facility.
If we had not obtained the waivers and amended the Agreements as described above, we wouldnot be able to draw additional funds under the Credit Facility. In addition, the Company has pledgedits accounts receivables, inventories, equipment, patents and other assets as collateral for itsAgreements, which would be subject to seizure by Wells Fargo if the Company were in default underthe Agreements and unable to repay the indebtedness. Wells Fargo also has the option to terminate theAgreements or accelerate the indebtedness during a period of noncompliance. Based on our currentforecasts, management believes we will maintain compliance with the covenants contained in theamended Agreements for at least the next twelve months. If a covenant violation were to occur,management would attempt to negotiate a waiver of compliance from Wells Fargo.
Management has the ability to manage certain operating assets and liabilities, specifically theprocurement of inventory and timing of payments of accounts payable, capital expenditures and certainoperating expenses depending on the results of its operations to extend its cash and cash equivalents.Management believes that existing cash and cash equivalents are sufficient to meet our anticipated cashneeds for at least the next twelve months. In the event that our anticipated cash needs change, it ispossible that we may need to raise additional capital in the future. We could seek to raise funds byselling additional securities to the public or to selected investors, or by obtaining additional debtfinancing. There is no assurance that we will be able to obtain additional funds on commerciallyfavorable terms, or at all. If the Company raises additional funds by issuing additional equity orconvertible debt securities, the fully diluted ownership percentages of existing stockholders will bereduced. In addition, the equity or debt securities that the Company would issue may have rights,preferences or privileges senior to those of the holders of its common stock.
Although we believe we have sufficient capital to fund our working capital and capital expendituresfor at least the next twelve months, depending on the timing of our future sales and collection ofrelated receivables, managing inventory costs and the timing of inventory purchases and deliveriesrequired to fulfill the backlog, our future capital requirements may vary materially from those nowplanned. The amount of capital that we will need in the future will require us to achieve significantlyincreased sales volume which is dependent on many factors, including:
• the market acceptance of our products and services;
• our business, product and capital expenditure plans;
• capital improvements to new and existing facilities;
• our competitors’ response to our products and services;
• our relationships with customers, distributors, dealers and project resellers; and
• our customers’ ability to afford and/or finance our products.
Our accounts receivable balance, net of allowances, was $13.1 million and $28.0 million as ofMarch 31, 2015 and March 31, 2014, respectively. Accounts receivable days sales outstanding (‘‘DSO’’)decreased by 30 days to 40 days as of March 31, 2015 compared to 70 days as of March 31, 2014. Thechange in DSO was largely the result of an accounts receivable allowance and timing of cash receiptson lower sales during the period. During the three months ended March 31, 2015, we recorded baddebt expense of approximately $7.1 million with respect to BPC. We determined that the collectability
50
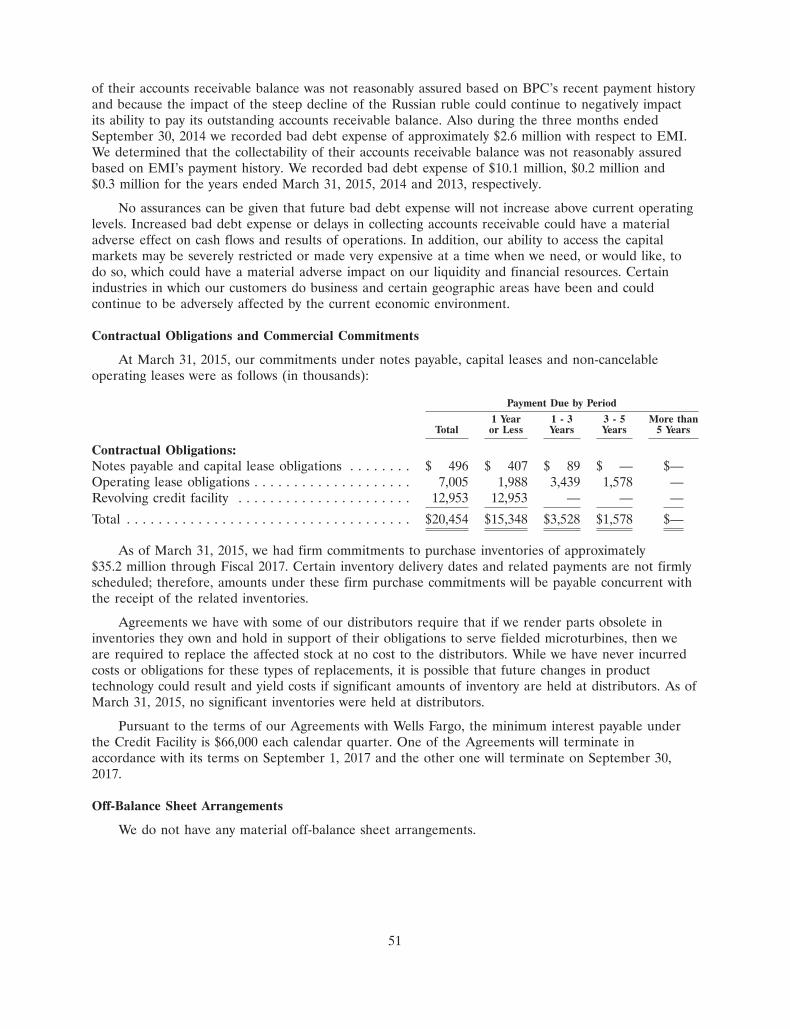
of their accounts receivable balance was not reasonably assured based on BPC’s recent payment historyand because the impact of the steep decline of the Russian ruble could continue to negatively impactits ability to pay its outstanding accounts receivable balance. Also during the three months endedSeptember 30, 2014 we recorded bad debt expense of approximately $2.6 million with respect to EMI.We determined that the collectability of their accounts receivable balance was not reasonably assuredbased on EMI’s payment history. We recorded bad debt expense of $10.1 million, $0.2 million and$0.3 million for the years ended March 31, 2015, 2014 and 2013, respectively.
No assurances can be given that future bad debt expense will not increase above current operatinglevels. Increased bad debt expense or delays in collecting accounts receivable could have a materialadverse effect on cash flows and results of operations. In addition, our ability to access the capitalmarkets may be severely restricted or made very expensive at a time when we need, or would like, todo so, which could have a material adverse impact on our liquidity and financial resources. Certainindustries in which our customers do business and certain geographic areas have been and couldcontinue to be adversely affected by the current economic environment.
Contractual Obligations and Commercial Commitments
At March 31, 2015, our commitments under notes payable, capital leases and non-cancelableoperating leases were as follows (in thousands):
Payment Due by Period
1 Year 1 - 3 3 - 5 More thanTotal or Less Years Years 5 Years
Contractual Obligations:Notes payable and capital lease obligations . . . . . . . . $ 496 $ 407 $ 89 $ — $—Operating lease obligations . . . . . . . . . . . . . . . . . . . . 7,005 1,988 3,439 1,578 —Revolving credit facility . . . . . . . . . . . . . . . . . . . . . . 12,953 12,953 — — —
Total . . . . . . . . . . . . . . . . . . . . . . . . . . . . . . . . . . . . $20,454 $15,348 $3,528 $1,578 $—
As of March 31, 2015, we had firm commitments to purchase inventories of approximately$35.2 million through Fiscal 2017. Certain inventory delivery dates and related payments are not firmlyscheduled; therefore, amounts under these firm purchase commitments will be payable concurrent withthe receipt of the related inventories.
Agreements we have with some of our distributors require that if we render parts obsolete ininventories they own and hold in support of their obligations to serve fielded microturbines, then weare required to replace the affected stock at no cost to the distributors. While we have never incurredcosts or obligations for these types of replacements, it is possible that future changes in producttechnology could result and yield costs if significant amounts of inventory are held at distributors. As ofMarch 31, 2015, no significant inventories were held at distributors.
Pursuant to the terms of our Agreements with Wells Fargo, the minimum interest payable underthe Credit Facility is $66,000 each calendar quarter. One of the Agreements will terminate inaccordance with its terms on September 1, 2017 and the other one will terminate on September 30,2017.
Off-Balance Sheet Arrangements
We do not have any material off-balance sheet arrangements.
51

Inflation
Inflation did not have a material impact on our results of operations or financial condition for thefiscal years ended March 31, 2015, 2014 and 2013. In an effort to offset the adverse impact of inflationon earnings, we have historically raised selling prices on all products, parts, accessories and services.However, any future adverse impact of inflation on our raw materials and energy costs may not besimilarly recoverable through our selling price increases.
Impact of Recently Issued Accounting Standards
In April 2015, the Financial Accounting Standards Board (the ‘‘FASB’’) issued AccountingStandard Update (‘‘ASU’’) 2015-03, Interest—Imputation of Interest (Subtopic 835-30). The ASU wasissued as part of FASB’s current plan to simplify overly complex standards. This ASU requires thatdebt issuance costs related to a recognized debt liability be presented in the balance sheet as a directdeduction from the carrying amount of that debt liability. The recognition and measurement guidancefor debt issuance costs are not affected by this ASU. The update requires retrospective application toall prior period amounts presented. This update is effective for annual and interim periods beginningon or after December 15, 2015, with early application permitted for financial statements that have notbeen issued. We are currently evaluating the potential impacts the new standard will have on ourreporting process.
In August 2014, the FASB issued ASU 2014-15, Disclosure of Uncertainties About an Entity’sAbility to Continue as a Going Concern (‘‘ASU 2014-15’’). ASU 2014-15 requires management toperform interim and annual assessments of an entity’s ability to continue as a going concern within oneyear of the date the financial statements are issued and provides guidance on determining when andhow to disclose going concern uncertainties in the financial statements. Certain disclosures will berequired if conditions give rise to substantial doubt about an entity’s ability to continue as a goingconcern. ASU 2014-15 applies to all entities and is effective for annual and interim reporting periodsending after December 15, 2016, with early adoption permitted. We are currently evaluating thepotential impacts the new standard will have on our reporting process.
In June 2014, the FASB issued ASU 2014-12, Accounting for Share-Based Payments When theTerms of an Award Provide That a Performance Target Could Be Achieved after the Requisite ServicePeriod (‘‘ASU 2014-12’’). ASU 2014-12 requires that a performance target that affects vesting and thatcould be achieved after the requisite service period be treated as a performance condition. As such, theperformance target should not be reflected in estimating the grant-date fair value of the award.ASU 2014-12 is effective for annual reporting periods beginning after December 15, 2015, with earlyadoption permitted. We are evaluating the potential impacts of the new standard on our existing stock-based compensation plans.
In May 2014, FASB issued ASU 2014-09, Revenue from Contracts with Customers(‘‘ASU 2014-09’’). ASU 2014-09 supersedes nearly all existing revenue recognition guidance underU.S. GAAP. The standard’s core principle is that a company will recognize revenue when it transferspromised goods or services to customers in an amount that reflects the consideration to which thecompany expects to be entitled in exchange for those goods or services. We are evaluating our existingrevenue recognition policies to determine whether any contracts in the scope of the guidance will beaffected by the new requirements. ASU 2014-09 is effective for annual reporting periods beginningafter December 15, 2016, including interim periods therein.
52

Item 7A. Quantitative and Qualitative Disclosure About Market Risk.
Foreign Currency
We currently develop products in the U.S. and market and sell our products predominantly inNorth America, Europe and Asia. As a result, factors such as changes in foreign currency exchangerates or weak economic conditions in foreign markets could affect our financial results. As all of oursales and purchases are currently made in U.S. dollars, we do not utilize foreign exchange contracts toreduce our exposure to foreign currency fluctuations. In the future, as our customers, employees andvendor bases expand, we may enter into transactions that are denominated in foreign currencies.
Interest
Our exposure to changes in the interest rates results primarily from our Credit Facility borrowings.As of March 31, 2015 we had $13.0 million of outstanding indebtedness subject to interest ratefluctuations. Based on these borrowings as of March 31, 2015, a hypothetical 100 basis point increase inthe then current LIBOR rate would increase our interest expense by $0.1 million on an annual basis.The level of outstanding indebtedness fluctuates from period to period and therefore could result inadditional interest.
Item 8. Financial Statements and Supplementary Data.
Our Consolidated Financial Statements and Financial Statement Schedule included in thisForm 10-K beginning at page F-1 are incorporated in this Item 8 by reference.
Item 9. Changes in and Disagreements with Accountants on Accounting and Financial Disclosure.
None.
Item 9A. Controls and Procedures.
Disclosure Controls and Procedures
We maintain disclosure controls and procedures that are designed to ensure that the informationrequired to be disclosed in the Company’s reports under the Exchange Act is recorded, processed,summarized, and reported within the time periods specified in the SEC’s rules and forms, and thatsuch information is accumulated and communicated to management, including our Chief ExecutiveOfficer (‘‘CEO’’) and Chief Financial Officer (‘‘CFO’’), as appropriate, to allow timely decisionsregarding required disclosure. In designing and evaluating the disclosure controls and procedures,management recognized that any controls and procedures, no matter how well designed and operated,can provide only reasonable assurance of achieving the desired control objectives.
In connection with the preparation of this Form 10-K for the year ended March 31, 2015, anevaluation was performed under the supervision and with the participation of our management,including the CEO and CFO, of the effectiveness of the design and operation of our disclosure controlsand procedures (as defined in Rule 13a-15(e) under the Exchange Act). Based on this evaluation, ourCEO and CFO have concluded that our disclosure controls and procedures are effective as ofMarch 31, 2015 to ensure that the information required to be disclosed by us in reports we submitunder the Exchange Act is recorded, processed, summarized, and reported within the time periodsspecified in the rules and forms prescribed by the SEC. Additionally, such information is accumulatedand communicated to management, including our CEO and CFO, as appropriate, to allow timelydecisions regarding required disclosure.
53
Management’s Annual Report on Internal Control Over Financial Reporting
Our management is responsible for establishing and maintaining adequate internal control overfinancial reporting. Internal control over financial reporting is defined in Rule 13a-15(f) or 15d-15(f)under the Exchange Act as a process designed by, or under the supervision of, the company’s CEO andCFO and effected by the company’s board of directors, management and other personnel, to providereasonable assurance regarding the reliability of financial reporting and the preparation of financialstatements for external purposes in accordance with GAAP and includes those policies and proceduresthat:
• Pertain to the maintenance of records that in reasonable detail accurately and fairly reflect thetransactions and dispositions of the company’s assets;
• Provide reasonable assurance that transactions are recorded as necessary to permit preparationof financial statements in accordance with GAAP, and that receipts and expenditures of thecompany are being made only in accordance with authorizations of management and directors ofthe company; and
• Provide reasonable assurance regarding prevention or timely detection of unauthorizedacquisition, use or disposition of the company’s assets that could have a material effect on thefinancial statements.
We conducted an evaluation of the effectiveness of our internal control over financial reportingbased on the 1992 framework in Internal Control—Integrated Framework issued by the Committee ofSponsoring Organization of the Treadway Commission. Based on our evaluation under the 1992framework in Internal Control—Integrated Framework, our management concluded that the Companymaintained effective internal control over financial reporting as of March 31, 2015.
KPMG LLP, the Company’s independent registered public accounting firm, has issued a report onthe Company’s internal control over financial reporting. The report of KPMG LLP follows. Projectionsof any evaluation of effectiveness to future periods are subject to the risks that controls may becomeinadequate because of changes in conditions, or that the degree of compliance with the policies orprocedures may deteriorate.
Changes in Internal Control Over Financial Reporting
There was no change in the Company’s internal control over financial reporting (as defined inRules 13a-15(f) and 15d-15(f) under the Exchange Act) during the Company’s most recently completedfiscal quarter that has materially affected, or is reasonably likely to materially affect, the Company’sinternal control over financial reporting, except for the remediation steps to address the materialweakness in internal control over financial reporting described below.
Remediation of Material Weakness
As previously disclosed in our Annual Report on Form 10-K for the fiscal year ended March 31,2014, although there were no material errors that resulted from control deficiencies, we identified amaterial weakness in our risk assessment process, specifically our internal controls related to the designof control activities involving FPP revenue, inventory and cost of goods sold as it relates to inventory.We have remediated all three of the measures related to the material weakness by enhancing theprocedures related to (a) the design of control activities with respect to the completeness and accuracyof our FPP revenue calculation, (b) the adequacy of documentation with respect to certain judgmentaldeterminations used in the inventory reserve analysis and (c) the investigation of inventorydiscrepancies through subcontractor year-end verification. Management is committed to improving theCompany’s internal control processes and believes the remediation measures have strengthened thedesign and operating effectiveness of our internal control over financial reporting.
54
REPORT OF INDEPENDENT REGISTERED PUBLIC ACCOUNTING FIRM
The Board of Directors and StockholdersCapstone Turbine Corporation
We have audited Capstone Turbine Corporation’s internal control over financial reporting as ofMarch 31, 2015, based on criteria established in Internal Control—Integrated Framework (1992) issuedby the Committee of Sponsoring Organizations of the Treadway Commission (COSO). CapstoneTurbine Corporation’s management is responsible for maintaining effective internal control overfinancial reporting and for its assessment of the effectiveness of internal control over financialreporting, included in the accompanying Management’s Annual Report on Internal Control overFinancial Reporting. Our responsibility is to express an opinion on the Company’s internal control overfinancial reporting based on our audit.
We conducted our audit in accordance with the standards of the Public Company AccountingOversight Board (United States). Those standards require that we plan and perform the audit to obtainreasonable assurance about whether effective internal control over financial reporting was maintainedin all material respects. Our audit included obtaining an understanding of internal control overfinancial reporting, assessing the risk that a material weakness exists, and testing and evaluating thedesign and operating effectiveness of internal control based on the assessed risk. Our audit alsoincluded performing such other procedures as we considered necessary in the circumstances. We believethat our audit provides a reasonable basis for our opinion.
A company’s internal control over financial reporting is a process designed to provide reasonableassurance regarding the reliability of financial reporting and the preparation of financial statements forexternal purposes in accordance with generally accepted accounting principles. A company’s internalcontrol over financial reporting includes those policies and procedures that (1) pertain to themaintenance of records that, in reasonable detail, accurately and fairly reflect the transactions anddispositions of the assets of the company; (2) provide reasonable assurance that transactions arerecorded as necessary to permit preparation of financial statements in accordance with generallyaccepted accounting principles, and that receipts and expenditures of the company are being made onlyin accordance with authorizations of management and directors of the company; and (3) providereasonable assurance regarding prevention or timely detection of unauthorized acquisition, use, ordisposition of the company’s assets that could have a material effect on the financial statements.
Because of its inherent limitations, internal control over financial reporting may not prevent ordetect misstatements. Also, projections of any evaluation of effectiveness to future periods are subjectto the risk that controls may become inadequate because of changes in conditions, or that the degreeof compliance with the policies or procedures may deteriorate.
In our opinion, Capstone Turbine Corporation maintained, in all material respects, effectiveinternal control over financial reporting as of March 31, 2015, based on criteria established in InternalControl—Integrated Framework (1992) issued by the Committee of Sponsoring Organizations of theTreadway Commission (COSO).
We also have audited, in accordance with the standards of the Public Company AccountingOversight Board (United States), the consolidated balance sheets of Capstone Turbine Corporation andsubsidiaries as of March 31, 2015 and 2014, and the related consolidated statements of operations,stockholders’ equity, and cash flows for each of the years in the three-year period ended March 31,2015, and our report dated June 15, 2015 expressed an unqualified opinion of those consolidatedfinancial statements.
(signed) KPMG LLP
Los Angeles, CaliforniaJune 15, 2015
55
Item 9B. Other Information.
None.
PART III
Item 10. Directors, Executive Officers and Corporate Governance.
Directors
Information contained under the caption ‘‘Proposal 1: Election of Directors to the Board ofDirectors’’ included in our proxy statement relating to our 2015 annual meeting of stockholders isincorporated herein by reference.
Executive Officers
Information contained under the caption ‘‘Executive Officers of the Company’’ included in ourproxy statement relating to our 2015 annual meeting of stockholders is incorporated herein byreference.
Compliance with Section 16(a) of the Exchange Act
Information contained under the caption ‘‘Other Information—Section 16(a) Beneficial OwnershipReporting Compliance’’ included in our proxy statement relating to our 2015 annual meeting ofstockholders is incorporated herein by reference.
Code of Ethics
Information contained under the caption ‘‘Other Information—Code of Business Conduct andCode of Ethics’’ included in our proxy statement relating to our 2015 annual meeting of stockholders isincorporated herein by reference.
Stockholder Nominees
Information contained under the caption ‘‘Governance of the Company and Practices of the Boardof Directors—Director Recommendation and Nomination Process’’ included in our proxy statementrelating to our 2015 annual meeting of stockholders is incorporated herein by reference.
Audit and Compliance Committee
Information contained under the caption ‘‘Governance of the Company and Practices of the Boardof Directors—Board Committees—Audit Committee’’ included in our proxy statement relating to our2015 annual meeting of stockholders is incorporated herein by reference.
Item 11. Executive Compensation.
Information contained under the captions ‘‘Compensation Discussion and Analysis,’’ ‘‘ExecutiveCompensation,’’ ‘‘Compensation of Directors,’’ ‘‘Compensation Committee Interlocks and InsiderParticipation’’ and ‘‘Compensation Committee Report’’ included in our proxy statement relating to our2015 annual meeting of stockholders is incorporated herein by reference.
56

Item 12. Security Ownership of Certain Beneficial Owners and Management and Related StockholderMatters.
Equity Compensation Plan Information
Information contained under the caption ‘‘Securities Authorized for Issuance under EquityCompensation Plans’’ included in our proxy statement relating to our 2015 annual meeting ofstockholders is incorporated herein by reference.
Security Ownership of Certain Beneficial Owners and Management
Information contained under the caption ‘‘Security Ownership of Certain Beneficial Owners andManagement’’ included in our proxy statement relating to our 2015 annual meeting of stockholders isincorporated herein by reference.
Item 13. Certain Relationships and Related Transactions, and Director Independence.
Information contained under the captions ‘‘Other Information—Related Person TransactionsPolicies and Procedures’’ and ‘‘Governance of the Company and Practices of the Board of Directors—Board of Directors; Leadership Structure’’ included in our proxy statement relating to our 2015 annualmeeting of stockholders is incorporated herein by reference.
Item 14. Principal Accounting Firm Fees and Services.
Information contained under the caption ‘‘Fees and Services of the Independent Registered PublicAccounting Firm’’ included in our proxy statement relating to our 2015 annual meeting of stockholdersis incorporated herein by reference.
57

PART IV
Item 15. Exhibits and Financial Statement Schedules.
(a) 1. and 2. Financial statements and financial statement schedule
The financial statements, notes and financial statement schedule are listed in the Index toConsolidated Financial Statements on page F-1 of this Report.
(a) 3. Index to Exhibits.
ExhibitNumber Description
2.1 Asset Purchase Agreement between Capstone Turbine Corporation and Calnetix PowerSolutions, Inc., dated February 1, 2010(a)
2.2 Amendment to Asset Purchase Agreement between Capstone Turbine Corporation andCalnetix Power Solutions, Inc., dated March 31, 2011(b)
2.3 Second Amendment to Asset Purchase Agreement between Capstone Turbine Corporationand Calnetix Power Solutions, Inc., dated April 28, 2011(b)
3.1 Second Amended and Restated Certificate of Incorporation of Capstone TurbineCorporation(c)
3.2 Certificate of Amendment to the Second Amended and Restated Certificate ofIncorporation of Capstone Turbine Corporation(d)
3.3 Amended and Restated Bylaws of Capstone Turbine Corporation(e)
4.1 Specimen stock certificate(f)
4.2 Certificate of Designation, Preferences and Rights of Series A Junior ParticipatingPreferred Stock(g)
4.3 Certificate of Amendment of Certificate of Designation, Preferences and Rights of Series AJunior Participating Preferred Stock of Capstone Turbine Corporation dated September 16,2008(h)
4.4 Certificate of Amendment to Certificate of Designation, Preferences and Rights of Series AJunior Participating Preferred Stock dated August 30, 2012(i)
4.5 Rights Agreement, dated July 7, 2005, between Capstone Turbine Corporation and MellonInvestor Services LLC(g)
4.6 Amendment No. 1 to Rights Agreement, dated July 3, 2008, between Capstone TurbineCorporation and Mellon Investor Services LLC(j)
4.7 Amendment No. 2 to Rights Agreement, dated June 9, 2011, between Capstone TurbineCorporation and Mellon Investor Services LLC(b)
4.8 Amendment No. 3 to Rights Agreement, dated July 1, 2014, between Capstone TurbineCorporation and Computershare Inc. as successor-in-interest to Mellon InvestorServices LLC(k)
4.9 Amendment No. 4 to Rights Agreement, dated August 5, 2014, between Capstone TurbineCorporation and Computershare Inc. as successor-in-interest to Mellon InvestorServices LLC(l)
58

ExhibitNumber Description
10.1 Amended and Restated License Agreement, dated August 2, 2000, by and between SolarTurbines Incorporated and Capstone Turbine Corporation(m)
10.2 Transition Agreement, dated August 2, 2000, by and between Capstone Turbine Corporationand Solar Turbines Incorporated(m)
10.3 Lease between Capstone Turbine Corporation and Northpark Industrial—LeahyDivision LLC, dated December 1, 1999, as amended, for leased premises at 21211 NordhoffStreet, Chatsworth, California(n)
10.4 Third Amendment to Lease, dated July 31, 2014, between Capstone Turbine Corporationand Northpark Industrial, for leased premises at 21211 Nordhoff Street, Chatsworth,California(l)
10.5 Fourth Amendment to Lease, dated September 30, 2014, between Capstone TurbineCorporation and Northpark Industrial, for leased premises at 21211 Nordhoff Street,Chatsworth, California(o)
10.6 Lease between Capstone Turbine Corporation and Prologis, L.P., formerly known as AMBProperty, L.P., dated September 25, 2000, as amended, for leased premises at 16640 StaggStreet, Van Nuys, California(p)
10.7* Capstone Turbine Corporation Amended and Restated 2000 Equity Incentive Plan asamended and restated effective August 30, 2012(q)
10.8* Form of Stock Option Agreement for Amended and Restated 2000 Equity Incentive Plan(r)
10.9* Form of Stock Bonus Agreement for Capstone Turbine Corporation 2000 Equity IncentivePlan(s)
10.10* Amended and Restated Capstone Turbine Corporation Change of Control SeverancePlan(t)
10.11 Development and License Agreement between Capstone Turbine Corporation and CarrierCorporation, successor in interest to UTC Power Corporation, dated September 4, 2007(u)
10.12 First Amendment to the Development and License Agreement between Capstone TurbineCorporation and Carrier Corporation, successor in interest to UTC Power Corporation,dated January 14, 2011(b)
10.13 Form of Investor Agreement, dated September 18, 2012, between Capstone TurbineCorporation and an investor in the 2012 registered direct offering(v)
10.14 Form of Investor Letter Agreement, dated February 21, 2013, between Capstone TurbineCorporation and investors in the 2012 registered direct offering(w)
10.15 Credit and Security Agreement between Capstone Turbine Corporation and Wells FargoBank, NA, dated February 9, 2009 (Domestic Facility)(x)
10.16 Credit and Security Agreement between Capstone Turbine Corporation and Wells FargoBank, NA, dated February 9, 2009 (Ex-Im Subfacility)(x)
10.17 First Amendment to Credit and Security Agreement between Capstone TurbineCorporation and Wells Fargo Bank, NA, dated June 9, 2009(x)
10.18 Second Amendment to the Credit and Security Agreements and Waiver of Defaultsbetween Capstone Turbine Corporation and Wells Fargo Bank, NA, dated November 5,2009(y)
59

ExhibitNumber Description
10.19 Third Amendment to the Credit and Security Agreements and Waiver of Defaults betweenCapstone Turbine Corporation and Wells Fargo Bank, NA, dated June 11, 2010(s)
10.20 Fourth Amendment to the Credit and Security Agreements and Waiver of Defaults betweenCapstone Turbine Corporation and Wells Fargo Bank, NA, dated June 29, 2010(z)
10.21 Fifth Amendment to the Credit and Security Agreements and Waiver of Defaults betweenCapstone Turbine Corporation and Wells Fargo Bank, NA, dated November 9, 2010(aa)
10.22 Sixth Amendment to the Credit and Security Agreements and Waiver of Defaults betweenCapstone Turbine Corporation and Wells Fargo Bank, NA, dated March 23, 2011(bb)
10.23 Seventh Amendment to the Credit and Security Agreements and Waiver of Defaultsbetween Capstone Turbine Corporation and Wells Fargo Bank, NA, dated June 9, 2011(b)
10.24 Eighth Amendment to the Credit and Security Agreements and Waiver of Defaults betweenCapstone Turbine Corporation and Wells Fargo Bank, NA, dated September 27, 2011(cc)
10.25 Ninth Amendment to the Credit and Security Agreements and Waiver of Defaults betweenCapstone Turbine Corporation and Wells Fargo Bank, NA, dated February 8, 2012(dd)
10.26 Tenth Amendment to the Credit and Security Agreements between Capstone TurbineCorporation and Wells Fargo Bank, NA, dated June 12, 2012(ee)
10.27 Eleventh Amendment to the Credit and Security Agreements between Capstone TurbineCorporation and Wells Fargo Bank, NA, dated June 7, 2013(p)
10.28 Waiver of Defaults between Capstone Turbine Corporation and Wells Fargo Bank, NA,dated April 25, 2014(ff)
10.29 Twelfth Amendment to the Credit and Security Agreements between Capstone TurbineCorporation and Wells Fargo Bank, NA, dated June 9, 2014(gg)
10.30 Letter Agreement, dated September 16, 2014, between by and between Capstone TurbineCorporation and Wells Fargo Bank, NA(hh)
10.31 Thirteenth Amendment to the Credit and Security Agreements and Waiver of Defaultbetween Capstone Turbine Corporation and Wells Fargo Bank, NA, dated November 3,2014(ii)
10.32 Fourteenth Amendment to the Credit and Security Agreements, Waiver of Default andConsent between Capstone Turbine Corporation and Wells Fargo Bank, NA, dated June 10,2015
10.33* Capstone Turbine Corporation Amended and Restated Executive Performance IncentivePlan as amended and restated effective August 29, 2013(jj)
10.34* Amendment to the Capstone Turbine Corporation Amended and Restated ExecutivePerformance Incentive Plan, dated June 9, 2014(kk)
10.35* Inducement Stock Option Agreement with Darren R. Jamison, dated December 18, 2006(ll)
10.36* Restricted Stock Agreement with Darren R. Jamison, dated December 18, 2006(ll)
10.37* Letter Agreement between Capstone Turbine Corporation and Darren R. Jamison, datedDecember 1, 2006(ll)
10.38* Amendment to Letter Agreement between Capstone Turbine Corporation and Darren R.Jamison, effective April 8, 2009(x)
60

ExhibitNumber Description
10.39* Letter Agreement between Capstone Turbine Corporation and James D. Crouse, datedJanuary 31, 2007(mm)
10.40* Inducement Stock Option Agreement with James D. Crouse, dated February 5, 2007(mm)
10.41* Restricted Stock Agreement with James D. Crouse, dated February 5, 2007(mm)
10.42* Form of Inducement Stock Option Agreement(nn)
10.43* Form of Inducement Restricted Stock Unit Agreement(nn)
10.44* Amended and Restated Change in Control Severance Agreement with Darren R. Jamison,dated June 14, 2012(ee)
10.45* First Amendment to Amended and Restated Change in Control Severance Agreement withDarren R. Jamison, effective June 14, 2015
10.46* Consulting Agreement with Mark Gilbreth, dated April 1, 2013(p)
10.47 Underwriting Agreement dated May 1, 2014 by and between the Company and Cowen andCompany, LLC, as representative of the several underwriters(oo)
10.48* Capstone Turbine Corporation Severance Pay Plan as amended and restated effectiveFebruary 1, 2010
14.1 Code of Business Conduct(ff)
14.2 Code of Ethics for Senior Financial Officers and Chief Executive Officer(ff)
21 Subsidiary List(b)
23 Consent of KPMG LLP
24 Power of Attorney (included on the signature page of this Form 10-K)
31.1 Certification of Chief Executive Officer pursuant to Section 302 of the Sarbanes—Oxley Actof 2002
31.2 Certification of Chief Financial Officer pursuant to Section 302 of the Sarbanes—Oxley Actof 2002
32 Certification of Chief Executive Officer and Chief Financial Officer pursuant to Section 906of the Sarbanes—Oxley Act of 2002
101.INS XBRL Instance Document
101.SCH XBRL Schema Document
101.CAL XBRL Calculation Linkbase Document
101.LAB XBRL Label Linkbase Document
101.PRE XBRL Presentation Linkbase Document
101.DEF XBRL Definition Linkbase Document
* Management contract or compensatory plan or arrangement
(a) Incorporated by reference to Capstone Turbine Corporation’s Current Report on Form 8-K, filedon February 5, 2010 (File No. 001-15957).
61

(b) Incorporated by reference to Capstone Turbine Corporation’s Annual Report on Form 10-K forthe fiscal year ended March 31, 2011 (File No. 001-15957).
(c) Incorporated by reference to Capstone Turbine Corporation’s Registration Statement onForm S-1/A, dated May 8, 2000 (File No. 333-33024).
(d) Incorporated by reference to Appendix B to Capstone Turbine Corporation’s Definitive ProxyStatement, filed on July 17, 2012 (File No. 001-15957).
(e) Incorporated by reference to Capstone Turbine Corporation’s Quarterly Report on Form 10-Qfor the quarterly period ended December 31, 2005 (File No. 001-15957).
(f) Incorporated by reference to Capstone Turbine Corporation’s Registration Statement onForm S-1/A, dated June 21, 2000 (File No. 333-33024).
(g) Incorporated by reference to Capstone Turbine Corporation’s Current Report on Form 8-K, filedon July 8, 2005 (File No. 001-15957).
(h) Incorporated by reference to Capstone Turbine Corporation’s Quarterly Report on Form 10-Qfor the quarterly period ended June 30, 2009 (File No. 001-15957).
(i) Incorporated by reference to Capstone Turbine Corporation’s Current Report on Form 8-K, filedon September 6, 2012 (File No. 001-15957).
(j) Incorporated by reference to Capstone Turbine Corporation’s Current Report on Form 8-K, filedon July 10, 2008 (File No. 001-15957).
(k) Incorporated by reference to Capstone Turbine Corporation’s Current Report on Form 8-K, filedon July 2, 2014 (File No. 001-15957).
(l) Incorporated by reference to Capstone Turbine Corporation’s Current Report on Form 8-K, filedon August 5, 2014 (File No. 001-15957).
(m) Incorporated by reference to Capstone Turbine Corporation’s Current Report on Form 8-K, filedon October 16, 2000 (File No. 001-15957).
(n) Incorporated by reference to Capstone Turbine Corporation’s Current Report on Form 8-K, filedon September 2, 2009 (File No. 001-15957).
(o) Incorporated by reference to Capstone Turbine Corporation’s Current Report on Form 8-K, filedon October 6, 2014 (File No. 001-15957).
(p) Incorporated by reference to Capstone Turbine Corporation’s Annual Report on Form 10-K forthe fiscal year ended March 31, 2013 (File No. 001-15957).
(q) Incorporated by reference to Appendix A to Capstone Turbine Corporation’s Definitive ProxyStatement, filed on July 17, 2012 (File No. 001-15957).
(r) Incorporated by reference to Capstone Turbine Corporation’s Quarterly Report on Form 10-Qfor the quarterly period ended September 30, 2005 (File No. 001-15957).
(s) Incorporated by reference to Capstone Turbine Corporation’s Annual Report on Form 10-K forthe fiscal year ended March 31, 2010 (File No. 001-15957).
(t) Incorporated by reference to Capstone Turbine Corporation’s Quarterly Report on Form 10-Qfor the quarterly period ended December 31, 2004 (File No. 001-15957).
(u) Incorporated by reference to Capstone Turbine Corporation’s Quarterly Report on Form 10-Qfor the quarterly period ended September 30, 2007 (File No. 001-15957).
62

(v) Incorporated by reference to Capstone Turbine Corporation’s Current Report on Form 8-K, filedon September 19, 2012 (File No. 001-15957).
(w) Incorporated by reference to Capstone Turbine Corporation’s Current Report on Form 8-K, filedon February 26, 2013 (File No. 001-15957).
(x) Incorporated by reference to Capstone Turbine Corporation’s Annual Report on Form 10-K forthe fiscal year ended March 31, 2009 (File No. 001-15957).
(y) Incorporated by reference to Capstone Turbine Corporation’s Quarterly Report on Form 10-Qfor quarterly period ended September 30, 2009 (File No. 001-15957).
(z) Incorporated by reference to Capstone Turbine Corporation’s Current Report on Form 8-K, filedon July 1, 2010 (File No. 001-15957).
(aa) Incorporated by reference to Capstone Turbine Corporation’s Current Report on Form 8-K, filedon November 12, 2010 (File No. 001-15957).
(bb) Incorporated by reference to Capstone Turbine Corporation’s Current Report on Form 8-K, filedon March 25, 2011 (File No. 001-15957).
(cc) Incorporated by reference to Capstone Turbine Corporation’s Current Report on Form 8-K, filedon October 3, 2011 (File No. 001-15957).
(dd) Incorporated by reference to Capstone Turbine Corporation’s Quarterly Report on Form 10-Qfor the quarterly period ended December 31, 2011 (File No. 001-15957).
(ee) Incorporated by reference to Capstone Turbine Corporation’s Annual Report on Form 10-K forthe fiscal year ended on March 31, 2012 (File No. 001-15957).
(ff) Incorporated by reference to Capstone Turbine Corporation’s Annual Report on Form 10-K forthe fiscal year ended March 31, 2014 (File No. 001-15957).
(gg) Incorporated by reference to Capstone Turbine Corporation’s Current Report on Form 8-K, filedon June 10, 2014 (File No. 001-15957).
(hh) Incorporated by reference to Capstone Turbine Corporation’s Current Report on Form 8-K, filedon September 19, 2014 (File No. 001-15957).
(ii) Incorporated by reference to Capstone Turbine Corporation’s Quarterly Report on Form 10-Qfor the quarterly period ended September 30, 2014 (File No. 001-15957).
(jj) Incorporated by reference to Capstone Turbine Corporation’s Quarterly Report on Form 10-Qfor the quarterly period ended September 30, 2013 (File No. 001-15957).
(kk) Incorporated by reference to Appendix B to Capstone Turbine Corporation’s Definitive ProxyStatement, filed on July 16, 2014 (File No. 001-15957).
(ll) Incorporated by reference to Capstone Turbine Corporation’s Quarterly Report on Form 10-Qfor the quarterly period ended December 31, 2006 (File No. 001-15957).
(mm) Incorporated by reference to Capstone Turbine Corporation’s Annual Report on Form 10-K forthe fiscal year ended on March 31, 2007 (File No. 001-15957).
(nn) Incorporated by reference to Capstone Turbine Corporation’s Registration Statement onForm S-8, dated June 17, 2009 (File No. 333-160049).
(oo) Incorporated by reference to Capstone Turbine Corporation’s Current Report on Form 8-K, filedon May 1, 2014 (File No. 001-15957).
63

CAPSTONE TURBINE CORPORATION AND SUBSIDIARIESINDEX TO CONSOLIDATED FINANCIAL STATEMENTS
Page
Report of Independent Registered Public Accounting Firm . . . . . . . . . . . . . . . . . . . . . . . . . . . . F-2Consolidated Financial Statements:
Consolidated Balance Sheets as of March 31, 2015 and 2014 . . . . . . . . . . . . . . . . . . . . . . . . . F-3For the years ended March 31, 2015, 2014 and 2013:Consolidated Statements of Operations . . . . . . . . . . . . . . . . . . . . . . . . . . . . . . . . . . . . . . . . F-4Consolidated Statements of Stockholders’ Equity . . . . . . . . . . . . . . . . . . . . . . . . . . . . . . . . . F-5Consolidated Statements of Cash Flows . . . . . . . . . . . . . . . . . . . . . . . . . . . . . . . . . . . . . . . . F-6
Notes to Consolidated Financial Statements . . . . . . . . . . . . . . . . . . . . . . . . . . . . . . . . . . . . . . . F-7Financial Statement Schedule:
Consolidated schedule for the years ended March 31, 2015, 2014 and 2013:Schedule II—Valuation and Qualifying Accounts . . . . . . . . . . . . . . . . . . . . . . . . . . . . . . . . . F-34
Financial statement schedules not included in this Annual Report on Form 10-K have beenomitted because they are not applicable or the required information is shown in the financialstatements or notes thereto.
F-1

REPORT OF INDEPENDENT REGISTERED PUBLIC ACCOUNTING FIRM
The Board of Directors and StockholdersCapstone Turbine Corporation:
We have audited the accompanying consolidated balance sheets of Capstone Turbine Corporationand subsidiaries as of March 31, 2015 and 2014, and the related consolidated statements of operations,stockholders’ equity, and cash flows for each of the years in the three-year period ended March 31,2015. In connection with our audits of the consolidated financial statements, we also have auditedfinancial statement schedule II. These consolidated financial statements and financial statementschedule are the responsibility of the Company’s management. Our responsibility is to express anopinion on these consolidated financial statements and financial statement schedule based on ouraudits.
We conducted our audits in accordance with the standards of the Public Company AccountingOversight Board (United States). Those standards require that we plan and perform the audit to obtainreasonable assurance about whether the financial statements are free of material misstatement. Anaudit includes examining, on a test basis, evidence supporting the amounts and disclosures in thefinancial statements. An audit also includes assessing the accounting principles used and significantestimates made by management, as well as evaluating the overall financial statement presentation. Webelieve that our audits provide a reasonable basis for our opinion.
In our opinion, the consolidated financial statements referred to above present fairly, in allmaterial respects, the financial position of Capstone Turbine Corporation and subsidiaries as ofMarch 31, 2015 and 2014, and the results of their operations and their cash flows for each of the threeyears in the period ended March 31, 2015, in conformity with U.S. generally accepted accountingprinciples. Also in our opinion, the related financial statement schedule, when considered in relation tothe basic consolidated financial statements taken as a whole, presents fairly, in all material respects, theinformation set forth therein.
We also have audited, in accordance with the standards of the Public Company AccountingOversight Board (United States), Capstone Turbine Corporation’s internal control over financialreporting as of March 31, 2015, based on criteria established in Internal Control—IntegratedFramework (1992) issued by the Committee of Sponsoring Organizations of the Treadway Commission(COSO), and our report dated June 15, 2015 expressed an unqualified opinion on the effectiveness ofthe Company’s internal control over financial reporting.
(signed) KPMG LLP
Los Angeles, CaliforniaJune 15, 2015
F-2

CAPSTONE TURBINE CORPORATION AND SUBSIDIARIES
CONSOLIDATED BALANCE SHEETS
(In thousands, except share amounts)
March 31, March 31,2015 2014
Assets
Current Assets:Cash and cash equivalents . . . . . . . . . . . . . . . . . . . . . . . . . . . . . . . . . . . . . $ 32,221 $ 27,859Accounts receivable, net of allowances of $11,041 at March 31, 2015 and
$2,246 at March 31, 2014 . . . . . . . . . . . . . . . . . . . . . . . . . . . . . . . . . . . . 13,120 28,019Inventories . . . . . . . . . . . . . . . . . . . . . . . . . . . . . . . . . . . . . . . . . . . . . . . . 23,097 18,102Prepaid expenses and other current assets . . . . . . . . . . . . . . . . . . . . . . . . . . 3,063 2,217
Total current assets . . . . . . . . . . . . . . . . . . . . . . . . . . . . . . . . . . . . . 71,501 76,197
Property, plant and equipment, net . . . . . . . . . . . . . . . . . . . . . . . . . . . . . . . . 3,523 2,891Non-current portion of inventories . . . . . . . . . . . . . . . . . . . . . . . . . . . . . . . . . 2,258 2,938Intangible assets, net . . . . . . . . . . . . . . . . . . . . . . . . . . . . . . . . . . . . . . . . . . . 1,337 1,790Other assets . . . . . . . . . . . . . . . . . . . . . . . . . . . . . . . . . . . . . . . . . . . . . . . . . 308 302
Total . . . . . . . . . . . . . . . . . . . . . . . . . . . . . . . . . . . . . . . . . . . . . . . . . $ 78,927 $ 84,118
Liabilities and Stockholders’ Equity
Current Liabilities:Accounts payable and accrued expenses . . . . . . . . . . . . . . . . . . . . . . . . . . . $ 22,266 $ 28,577Accrued salaries and wages . . . . . . . . . . . . . . . . . . . . . . . . . . . . . . . . . . . . 2,113 1,883Accrued warranty reserve . . . . . . . . . . . . . . . . . . . . . . . . . . . . . . . . . . . . . . 3,183 2,965Deferred revenue . . . . . . . . . . . . . . . . . . . . . . . . . . . . . . . . . . . . . . . . . . . . 3,051 2,657Revolving credit facility . . . . . . . . . . . . . . . . . . . . . . . . . . . . . . . . . . . . . . . 12,953 13,228Current portion of notes payable and capital lease obligations . . . . . . . . . . . 407 444
Total current liabilities . . . . . . . . . . . . . . . . . . . . . . . . . . . . . . . . . . . . . . . . 43,973 49,754
Long-term portion of notes payable and capital lease obligations . . . . . . . . . . . 89 201Other long-term liabilities . . . . . . . . . . . . . . . . . . . . . . . . . . . . . . . . . . . . . . . 161 70Commitments and contingencies (Note 12) . . . . . . . . . . . . . . . . . . . . . . . . . . .Stockholders’ Equity:
Preferred stock, $.001 par value; 10,000,000 shares authorized; none issuedCommon stock, $.001 par value; 515,000,000 shares authorized,
331,635,840 shares issued and 330,379,962 shares outstanding atMarch 31, 2015; 311,520,567 shares issued and 310,377,293 sharesoutstanding at March 31, 2014 . . . . . . . . . . . . . . . . . . . . . . . . . . . . . . . 332 312
Additional paid-in capital . . . . . . . . . . . . . . . . . . . . . . . . . . . . . . . . . . . . . . 837,650 805,342Accumulated deficit . . . . . . . . . . . . . . . . . . . . . . . . . . . . . . . . . . . . . . . . . . (801,764) (770,231)Treasury stock, at cost; 1,255,878 shares at March 31, 2015 and 1,143,274
shares at March 31, 2014 . . . . . . . . . . . . . . . . . . . . . . . . . . . . . . . . . . . . (1,514) (1,330)
Total stockholders’ equity . . . . . . . . . . . . . . . . . . . . . . . . . . . . . . . . . . . 34,704 34,093
Total . . . . . . . . . . . . . . . . . . . . . . . . . . . . . . . . . . . . . . . . . . . . . . . . . $ 78,927 $ 84,118
See accompanying notes to consolidated financial statements.
F-3

CAPSTONE TURBINE CORPORATION AND SUBSIDIARIES
CONSOLIDATED STATEMENTS OF OPERATIONS
(In thousands, except per share amounts)
Years Ended March 31,
2015 2014 2013
Revenue . . . . . . . . . . . . . . . . . . . . . . . . . . . . . . . . . . . . . . . . . . . . . $115,461 $133,105 $127,557Cost of goods sold . . . . . . . . . . . . . . . . . . . . . . . . . . . . . . . . . . . . . 97,174 111,409 113,172
Gross margin . . . . . . . . . . . . . . . . . . . . . . . . . . . . . . . . . . . . . . . . . 18,287 21,696 14,385Operating expenses:
Research and development . . . . . . . . . . . . . . . . . . . . . . . . . . . . . . 9,679 9,029 8,979Selling, general and administrative . . . . . . . . . . . . . . . . . . . . . . . . 39,517 27,981 27,364
Total operating expenses . . . . . . . . . . . . . . . . . . . . . . . . . . . . . . 49,196 37,010 36,343
Loss from operations . . . . . . . . . . . . . . . . . . . . . . . . . . . . . . . . . . . . (30,909) (15,314) (21,958)Other (expense) income . . . . . . . . . . . . . . . . . . . . . . . . . . . . . . . . . 41 (20) 25Interest expense . . . . . . . . . . . . . . . . . . . . . . . . . . . . . . . . . . . . . . . (548) (712) (717)Change in fair value of warrant liability . . . . . . . . . . . . . . . . . . . . . . — 10 781
Loss before income taxes . . . . . . . . . . . . . . . . . . . . . . . . . . . . . . . . . (31,416) (16,036) (21,869)Provision for income taxes . . . . . . . . . . . . . . . . . . . . . . . . . . . . . . . . 117 220 694
Net loss . . . . . . . . . . . . . . . . . . . . . . . . . . . . . . . . . . . . . . . . . . . . . $ (31,533) $(16,256) $(22,563)
Net loss per common share—basic and diluted . . . . . . . . . . . . . . . . . $ (0.10) $ (0.05) $ (0.07)
Weighted average shares used to calculate basic and diluted net lossper common share . . . . . . . . . . . . . . . . . . . . . . . . . . . . . . . . . . . . 328,012 307,060 302,168
See accompanying notes to consolidated financial statements.
F-4
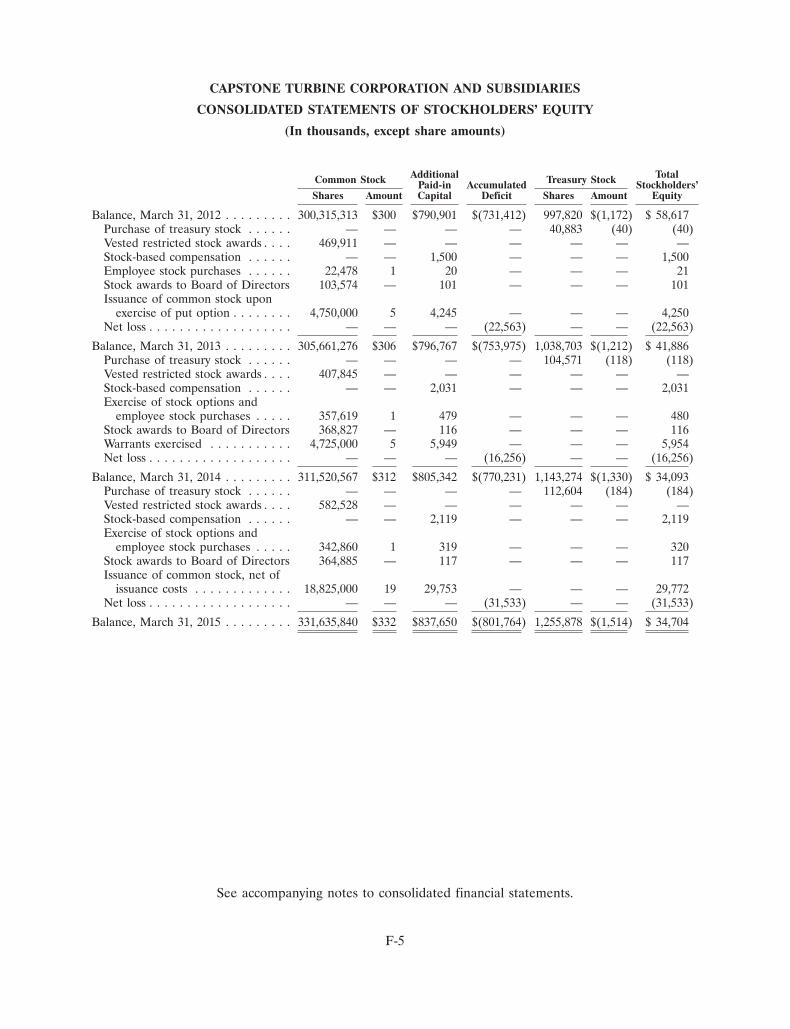
CAPSTONE TURBINE CORPORATION AND SUBSIDIARIES
CONSOLIDATED STATEMENTS OF STOCKHOLDERS’ EQUITY
(In thousands, except share amounts)
Additional TotalCommon Stock Treasury StockPaid-in Accumulated Stockholders’Shares Amount Capital Deficit Shares Amount Equity
Balance, March 31, 2012 . . . . . . . . . 300,315,313 $300 $790,901 $(731,412) 997,820 $(1,172) $ 58,617Purchase of treasury stock . . . . . . — — — — 40,883 (40) (40)Vested restricted stock awards . . . . 469,911 — — — — — —Stock-based compensation . . . . . . — — 1,500 — — — 1,500Employee stock purchases . . . . . . 22,478 1 20 — — — 21Stock awards to Board of Directors 103,574 — 101 — — — 101Issuance of common stock upon
exercise of put option . . . . . . . . 4,750,000 5 4,245 — — — 4,250Net loss . . . . . . . . . . . . . . . . . . . — — — (22,563) — — (22,563)
Balance, March 31, 2013 . . . . . . . . . 305,661,276 $306 $796,767 $(753,975) 1,038,703 $(1,212) $ 41,886Purchase of treasury stock . . . . . . — — — — 104,571 (118) (118)Vested restricted stock awards . . . . 407,845 — — — — — —Stock-based compensation . . . . . . — — 2,031 — — — 2,031Exercise of stock options and
employee stock purchases . . . . . 357,619 1 479 — — — 480Stock awards to Board of Directors 368,827 — 116 — — — 116Warrants exercised . . . . . . . . . . . 4,725,000 5 5,949 — — — 5,954Net loss . . . . . . . . . . . . . . . . . . . — — — (16,256) — — (16,256)
Balance, March 31, 2014 . . . . . . . . . 311,520,567 $312 $805,342 $(770,231) 1,143,274 $(1,330) $ 34,093Purchase of treasury stock . . . . . . — — — — 112,604 (184) (184)Vested restricted stock awards . . . . 582,528 — — — — — —Stock-based compensation . . . . . . — — 2,119 — — — 2,119Exercise of stock options and
employee stock purchases . . . . . 342,860 1 319 — — — 320Stock awards to Board of Directors 364,885 — 117 — — — 117Issuance of common stock, net of
issuance costs . . . . . . . . . . . . . 18,825,000 19 29,753 — — — 29,772Net loss . . . . . . . . . . . . . . . . . . . — — — (31,533) — — (31,533)
Balance, March 31, 2015 . . . . . . . . . 331,635,840 $332 $837,650 $(801,764) 1,255,878 $(1,514) $ 34,704
See accompanying notes to consolidated financial statements.
F-5

CAPSTONE TURBINE CORPORATION AND SUBSIDIARIES
CONSOLIDATED STATEMENTS OF CASH FLOWS
(In thousands)
Year Ended March 31,
2015 2014 2013
Cash Flows from Operating Activities:Net loss . . . . . . . . . . . . . . . . . . . . . . . . . . . . . . . . . . . . . . . . . . . . . . $(31,533) $(16,256) $(22,563)Adjustments to reconcile net loss to net cash used in operating
activities:Depreciation and amortization . . . . . . . . . . . . . . . . . . . . . . . . . . . . 1,697 2,323 2,820Amortization of deferred financing costs . . . . . . . . . . . . . . . . . . . . . 196 223 148Accounts receivable allowances . . . . . . . . . . . . . . . . . . . . . . . . . . . . 10,138 242 276Inventory provision . . . . . . . . . . . . . . . . . . . . . . . . . . . . . . . . . . . . 2,810 1,509 1,307Provision for warranty expenses . . . . . . . . . . . . . . . . . . . . . . . . . . . . 3,463 3,903 5,129Net (gain) loss on disposal of equipment . . . . . . . . . . . . . . . . . . . . . (96) 225 41Stock-based compensation . . . . . . . . . . . . . . . . . . . . . . . . . . . . . . . 2,236 2,147 1,601Change in fair value of warrant liability . . . . . . . . . . . . . . . . . . . . . . — (10) (781)
Changes in operating assets and liabilities:Accounts receivable . . . . . . . . . . . . . . . . . . . . . . . . . . . . . . . . . . . . 4,761 (10,320) 359Inventories . . . . . . . . . . . . . . . . . . . . . . . . . . . . . . . . . . . . . . . . . . (7,125) (784) (2,878)Prepaid expenses and other current assets . . . . . . . . . . . . . . . . . . . . (1,075) 470 587Accounts payable and accrued expenses . . . . . . . . . . . . . . . . . . . . . . (5,960) 4,475 1,221Accrued salaries and wages and long term liabilities . . . . . . . . . . . . . 321 90 (107)Accrued warranty reserve . . . . . . . . . . . . . . . . . . . . . . . . . . . . . . . . (3,245) (3,237) (4,324)Deferred revenue . . . . . . . . . . . . . . . . . . . . . . . . . . . . . . . . . . . . . 394 (432) 94
Net cash used in operating activities . . . . . . . . . . . . . . . . . . . . . . . (23,018) (15,432) (17,070)
Cash Flows from Investing Activities:Expenditures for property and equipment . . . . . . . . . . . . . . . . . . . . . . (1,606) (1,179) (1,213)
Net cash used in investing activities . . . . . . . . . . . . . . . . . . . . . . . (1,606) (1,179) (1,213)
Cash Flows from Financing Activities:Net (repayments of) proceeds from revolving credit facility . . . . . . . . . . (275) (248) 3,045Repayment of notes payable and capital lease obligations . . . . . . . . . . . (647) (415) (128)Net proceeds from (cash used in) employee stock-based transactions . . . 136 362 (19)Proceeds from exercise of common stock warrants and put options . . . . 29,772 5,954 4,250
Net cash provided by financing activities . . . . . . . . . . . . . . . . . . . . 28,986 5,653 7,148
Net increase (decrease) in Cash and Cash Equivalents . . . . . . . . . . . . . . . 4,362 (10,958) (11,135)Cash and Cash Equivalents, Beginning of Year . . . . . . . . . . . . . . . . . . . . 27,859 38,817 49,952
Cash and Cash Equivalents, End of Year . . . . . . . . . . . . . . . . . . . . . . . . $ 32,221 $ 27,859 $ 38,817
Supplemental Disclosures of Cash Flow Information:Cash paid during the year for:
Interest . . . . . . . . . . . . . . . . . . . . . . . . . . . . . . . . . . . . . . . . . . . . . $ 354 $ 506 $ 588Income taxes . . . . . . . . . . . . . . . . . . . . . . . . . . . . . . . . . . . . . . . . . $ 129 $ 246 $ 635
Supplemental Disclosures of Non-Cash Information::Acquisition of property and equipment through accounts payable . . . . $ 154 $ 7 $ 26Renewal of insurance contracts which was financed by notes payable . $ 447 $ 491 $ 476Acquisition of property and equipment in consideration for the
issuance of a note payable . . . . . . . . . . . . . . . . . . . . . . . . . . . . . . $ 418 $ 158 $ 306
See accompanying notes to consolidated financial statements.
F-6

CAPSTONE TURBINE CORPORATION AND SUBSIDIARIES
NOTES TO CONSOLIDATED FINANCIAL STATEMENTS
1. Description of the Company and Basis of Presentation
Capstone Turbine Corporation (the ‘‘Company’’) develops, manufactures, markets and servicesmicroturbine technology solutions for use in stationary distributed power generation applications,including cogeneration (combined heat and power (‘‘CHP’’), integrated combined heat and power(‘‘ICHP’’), and combined cooling, heat and power (‘‘CCHP’’)), renewable energy, natural resources andcritical power supply. In addition, the Company’s microturbines can be used as battery charginggenerators for hybrid electric vehicle applications. The Company was organized in 1988 and has beencommercially producing its microturbine generators since 1998.
The Company has incurred significant operating losses since its inception. Management anticipatesincurring additional losses until the Company can produce sufficient revenue to cover its operatingcosts. To date, the Company has funded its activities primarily through private and public equityofferings. This Annual Report on Form 10-K (this ‘‘Form 10-K’’) refers to the Company’s fiscal yearsending March 31 as its ‘‘Fiscal’’ years.
The consolidated financial statements have been prepared assuming the Company will continue asa going concern, which contemplates the realization of assets and satisfaction of liabilities in the normalcourse of business. The Company’s net loss from operations for the Fiscal years ended 2015, 2014 and2013 was $30.9 million, $15.3 million and $22.0 million, respectively. The lower than expected revenueduring Fiscal 2015 and an increase in accounts receivable allowance provided for two customers was theprimary cause of the increase in the net loss from operations. The Company’s cash and cashequivalents as of March 31, 2015 and 2014 were $32.2 million and $27.9 million, respectively. TheCompany’s working capital requirements during Fiscal 2015 were higher than planned primarily as aresult of lower than anticipated inventory turns and reductions to accounts payable as a result ofpayments made by the Company. Additionally, the Company did not fully achieve its planned numberof product shipments primarily as a result of continuing geopolitical instability in Russia and Ukraine,the dramatic downturn of the oil and gas markets and a substantially stronger U.S. dollar making ourproducts more expensive overseas.
Management has the ability to manage certain operating assets and liabilities, specifically theprocurement of inventory and timing of payments of accounts payable, capital expenditures and certainoperating expenses depending on the results of its operations to extend its cash and cash equivalents.Management believes that existing cash and cash equivalents are sufficient to meet the Company’santicipated cash needs for at least the next twelve months. In the event that our anticipated cash needschange, it is possible that the Company may need to raise additional capital in the future. TheCompany may seek to raise funds by selling additional securities to the public or to selected investorsor by obtaining additional debt financing. There is no assurance that the Company will be able toobtain additional funds on commercially favorable terms, or at all. If the Company raises additionalfunds by issuing additional equity or convertible debt securities, the fully diluted ownership percentagesof existing stockholders will be reduced. In addition, any equity or debt securities that the Companywould issue may have rights, preferences or privileges senior to those of the holders of its commonstock.
The consolidated financial statements include the accounts of the Company, Capstone TurbineInternational, Inc., its wholly owned subsidiary that was formed in June 2004, and Capstone TurbineSingapore Pte., Ltd., its wholly owned subsidiary that was formed in February 2011, after elimination ofinter-company transactions.
F-7

CAPSTONE TURBINE CORPORATION AND SUBSIDIARIES
NOTES TO CONSOLIDATED FINANCIAL STATEMENTS (Continued)
2. Summary of Significant Accounting Policies
Cash Equivalents The Company considers only those investments that are highly liquid and readilyconvertible to cash with original maturities of three months or less at date of purchase as cashequivalents.
Fair Value of Financial Instruments The carrying value of certain financial instruments, includingcash equivalents, accounts receivable, accounts payable, revolving credit facility and notes payableapproximate fair market value based on their short-term nature. See Note 10—Fair ValueMeasurements, for disclosure regarding the fair value of other financial instruments.
Accounts Receivable Trade accounts receivable are recorded at the invoiced amount and aretypically non-interest bearing. The Company maintains allowances for estimated losses resulting fromthe inability of customers to make required payments and other accounts receivable allowances.
Inventories The Company values inventories at first in first out (‘‘FIFO’’) basis and lower of costor market. The composition of inventory is routinely evaluated to identify slow-moving, excess, obsoleteor otherwise impaired inventories. Inventories identified as impaired are evaluated to determine ifwrite-downs are required. Included in the assessment is a review for obsolescence as a result ofengineering changes in the Company’s products. All inventories expected to be used in more than oneyear are classified as long-term. Inventory charges increased approximately $1.0 million during Fiscal2015 compared to Fiscal 2014 primarily as a result of an allowance for slow-moving inventory related tothe waste heat recovery generators.
Depreciation and Amortization Depreciation and amortization are provided for using thestraight-line method over the estimated useful lives of the related assets, ranging from two to ten years.Leasehold improvements are amortized over the lease term or the estimated useful lives of the assets,whichever is shorter. Intangible assets that have finite useful lives are amortized over their estimateduseful lives using the straight-line method with the exception of the backlog of 100 kW microturbines(‘‘TA100’’) acquired from Calnetix Power Solutions, Inc. (‘‘CPS’’). Purchased backlog is amortizedbased on unit sales and presented as a component of cost of goods sold.
Long-Lived Assets The Company reviews the recoverability of long-lived assets, includingintangible assets with finite lives, whenever events or changes in circumstances indicate that thecarrying value of such assets may not be recoverable. If the expected future cash flows from the use ofsuch assets (undiscounted and without interest charges) are less than the carrying value, the Companymay be required to record a write-down, which is determined based on the difference between thecarrying value of the assets and their estimated fair value. The Company performed an analysis as ofMarch 31, 2015 and determined that no impairment was necessary. Intangible assets include amanufacturing license, trade name, technology, backlog and customer relationships. See Note 5—Intangible Assets.
Deferred Revenue Deferred revenue consists of deferred product and service revenue and customerdeposits. Deferred revenue will be recognized when earned in accordance with the Company’s revenuerecognition policy. The Company has the right to retain all or part of customer deposits under certainconditions.
Revenue The Company’s revenue consists of sales of products, parts, accessories and service,which includes a comprehensive Factory Protection Plan (‘‘FPP’’), net of discounts. Capstone’s
F-8

CAPSTONE TURBINE CORPORATION AND SUBSIDIARIES
NOTES TO CONSOLIDATED FINANCIAL STATEMENTS (Continued)
2. Summary of Significant Accounting Policies (Continued)
distributors purchase products, parts and FPPs for sale to end users and are also required to provide avariety of additional services, including application engineering, installation, commissioning andpost-commissioning repair and maintenance service. The Company’s standard terms of sales todistributors and direct end-users include transfer of title, care, custody and control at the point ofshipment, payment terms ranging from full payment in advance of shipment to payment in 90 days, noright of return or exchange, and no post-shipment performance obligations by Capstone except forwarranties provided on the products and parts sold.
Revenue from the sale of products, parts and accessories is generally recognized and earned whenall of the following criteria are satisfied: (a) persuasive evidence of a sales arrangement exists; (b) priceis fixed or determinable; (c) collectability is reasonably assured; and (d) delivery has occurred. Deliverygenerally occurs when the title and the risks and rewards of ownership have substantially transferred tothe customer. Assuming all other revenue recognition criteria have been met, if it is determined thatcollection is not reasonably assured, revenue will not be recognized until collectability is reasonablyassured, which is generally upon receipt of payment. Management’s estimates regarding thecollectability of a particular sale may impact the timing of actual revenue recognized each period.
Service performed by the Company has consisted primarily of time and materials based contracts.The time and materials contracts are usually related to out-of-warranty units. Service revenue derivedfrom time and materials contracts is recognized as the service is performed.
The Company also provides maintenance service contracts to customers of its existing installedbase. The maintenance service contracts are agreements to perform certain services to maintain aproduct for a specified period of time. Service revenue derived from maintenance service contracts isrecognized on a straight-line basis over the contract period.
Warranty The Company provides for the estimated costs of warranties at the time revenue isrecognized. The specific terms and conditions of those warranties vary depending upon the productsold and geography of sale. The Company’s product warranties generally start from the delivery dateand continue for up to eighteen months. Factors that affect the Company’s warranty obligation includeproduct failure rates, anticipated hours of product operations and costs of repair or replacement incorrecting product failures. These factors are estimates that may change based on new information thatbecomes available each period. Similarly, the Company also accrues the estimated costs to addressreliability repairs on products no longer in warranty when, in the Company’s judgment, and inaccordance with a specific plan developed by the Company, it is prudent to provide such repairs. TheCompany assesses the adequacy of recorded warranty liabilities quarterly and makes adjustments to theliability as necessary. When the Company has sufficient evidence that product changes are altering thehistorical failure occurrence rates, the impact of such changes is then taken into account in estimatingfuture warranty liabilities.
Research and Development (‘‘R&D’’) The Company accounts for grant distributions anddevelopment funding as offsets to R&D expenses and both are recorded as the related costs areincurred. Total offsets to R&D expenses amounted to $0.5 million, $1.4 million and $1.7 million for theyears ended March 31, 2015, 2014 and 2013, respectively.
Income Taxes Deferred income tax assets and liabilities are computed for differences between theconsolidated financial statement and income tax basis of assets and liabilities. Such deferred income taxasset and liability computations are based on enacted tax laws and rates applicable to periods in which
F-9

CAPSTONE TURBINE CORPORATION AND SUBSIDIARIES
NOTES TO CONSOLIDATED FINANCIAL STATEMENTS (Continued)
2. Summary of Significant Accounting Policies (Continued)
the differences are expected to reverse. Valuation allowances are established, when necessary, to reducedeferred income tax assets to the amounts expected to be realized.
Contingencies The Company records an estimated loss from a loss contingency when informationavailable prior to issuance of its financial statements indicates that it is probable that an asset has beenimpaired or a liability has been incurred at the date of the financial statements and the amount of theloss can be reasonably estimated.
Risk Concentrations Financial instruments that potentially subject the Company to concentrationsof credit risk consist primarily of cash and cash equivalents and accounts receivable. At March 31, 2015,the majority of our cash balances were held at financial institutions located in California. The accountsat these institutions are insured by the Federal Deposit Insurance Corporation up to certain limits.Balances that exceed the insurance coverage aggregate to approximately $32.0 million as of March 31,2015. The Company places its cash and cash equivalents with high credit quality institutions. TheCompany performs ongoing credit evaluations of its customers and maintains an allowance for potentialcredit losses.
Sales to Horizon Power Systems (‘‘Horizon’’), one of the Company’s domestic distributors,accounted for 17%, 12% and 27% of our revenue for the years ended March 31, 2015, 2014 and 2013,respectively. Sales to BPC Engineering (‘‘BPC’’), one of the Company’s Russian distributors, accountedfor 11%, 17% and 11% of our revenue for the years ended March 31, 2015, 2014 and 2013,respectively. Sales to E-Finity Distributed Generation, LLC (‘‘E-Finity), one of the Company’s domesticdistributors, accounted for 19% of our revenue for the year ended March 31, 2014. Additionally,Optimal Group Australia Pty Ltd, one of the Company’s Australian distributors, accounted for 17% ofnet accounts receivable as of March 31, 2015. BPC, Electro Mecanique Industries (‘‘EMI’’), one of theCompany’s distributors in the Middle East and Africa, and E-Finity accounted for 26%, 18% and 16%,respectively, of net accounts receivable as of March 31, 2014.
During the three months ended March 31, 2015, the Company recorded approximately $7.1 millionwith respect to the accounts receivable allowance from BPC. The Company determined that thecollectability of this accounts receivable balance was not reasonably assured based on BPC’s paymenthistory and because the impact of the recent steep decline of the Russian ruble could continue tonegatively impact its ability to pay its outstanding accounts receivable balance. During the three monthsended September 30, 2014, the Company recorded approximately $2.6 million with respect to theaccounts receivable balance from EMI. The Company determined that the collectability of this accountsreceivable balance was not reasonably assured based on EMI’s payment history. The Company recordedbad debt expense of approximately $10.1 million, $0.2 million and $0.3 million for the years endedMarch 31, 2015, 2014 and 2013, respectively.
Certain components of the Company’s products are available from a limited number of suppliers.An interruption in supply could cause a delay in manufacturing, which would affect operating resultsadversely.
Estimates and Assumptions The preparation of financial statements in conformity with accountingprinciples generally accepted in the United States of America requires management to make certainestimates and assumptions that affect the amounts reported in the financial statements andaccompanying notes. Significant estimates include accounting for accounts receivable allowances, stock-based compensation, inventory write-downs, valuation of long-lived assets including intangible assets
F-10
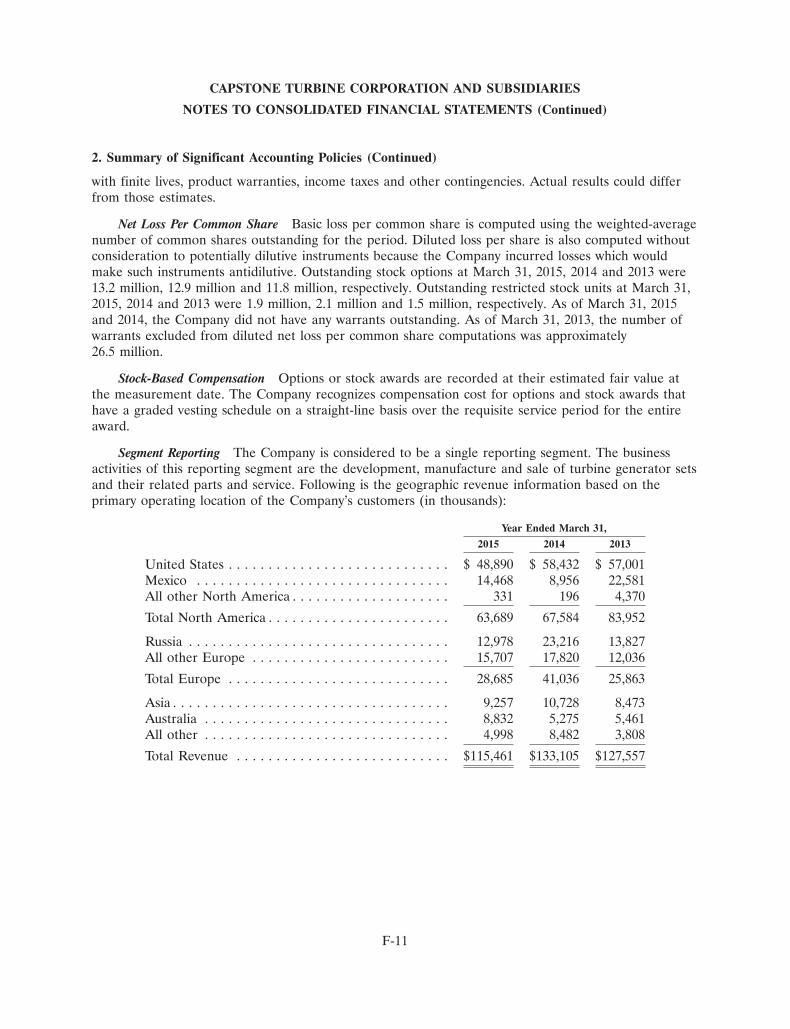
CAPSTONE TURBINE CORPORATION AND SUBSIDIARIES
NOTES TO CONSOLIDATED FINANCIAL STATEMENTS (Continued)
2. Summary of Significant Accounting Policies (Continued)
with finite lives, product warranties, income taxes and other contingencies. Actual results could differfrom those estimates.
Net Loss Per Common Share Basic loss per common share is computed using the weighted-averagenumber of common shares outstanding for the period. Diluted loss per share is also computed withoutconsideration to potentially dilutive instruments because the Company incurred losses which wouldmake such instruments antidilutive. Outstanding stock options at March 31, 2015, 2014 and 2013 were13.2 million, 12.9 million and 11.8 million, respectively. Outstanding restricted stock units at March 31,2015, 2014 and 2013 were 1.9 million, 2.1 million and 1.5 million, respectively. As of March 31, 2015and 2014, the Company did not have any warrants outstanding. As of March 31, 2013, the number ofwarrants excluded from diluted net loss per common share computations was approximately26.5 million.
Stock-Based Compensation Options or stock awards are recorded at their estimated fair value atthe measurement date. The Company recognizes compensation cost for options and stock awards thathave a graded vesting schedule on a straight-line basis over the requisite service period for the entireaward.
Segment Reporting The Company is considered to be a single reporting segment. The businessactivities of this reporting segment are the development, manufacture and sale of turbine generator setsand their related parts and service. Following is the geographic revenue information based on theprimary operating location of the Company’s customers (in thousands):
Year Ended March 31,
2015 2014 2013
United States . . . . . . . . . . . . . . . . . . . . . . . . . . . . $ 48,890 $ 58,432 $ 57,001Mexico . . . . . . . . . . . . . . . . . . . . . . . . . . . . . . . . 14,468 8,956 22,581All other North America . . . . . . . . . . . . . . . . . . . . 331 196 4,370
Total North America . . . . . . . . . . . . . . . . . . . . . . . 63,689 67,584 83,952
Russia . . . . . . . . . . . . . . . . . . . . . . . . . . . . . . . . . 12,978 23,216 13,827All other Europe . . . . . . . . . . . . . . . . . . . . . . . . . 15,707 17,820 12,036
Total Europe . . . . . . . . . . . . . . . . . . . . . . . . . . . . 28,685 41,036 25,863
Asia . . . . . . . . . . . . . . . . . . . . . . . . . . . . . . . . . . . 9,257 10,728 8,473Australia . . . . . . . . . . . . . . . . . . . . . . . . . . . . . . . 8,832 5,275 5,461All other . . . . . . . . . . . . . . . . . . . . . . . . . . . . . . . 4,998 8,482 3,808
Total Revenue . . . . . . . . . . . . . . . . . . . . . . . . . . . $115,461 $133,105 $127,557
F-11

CAPSTONE TURBINE CORPORATION AND SUBSIDIARIES
NOTES TO CONSOLIDATED FINANCIAL STATEMENTS (Continued)
2. Summary of Significant Accounting Policies (Continued)
The following table summarizes the Company’s revenue by product (in thousands):
Year Ended March 31,
2015 2014 2013
C30 . . . . . . . . . . . . . . . . . . . . . . . . . . . . . . . . . . . $ 4,804 $ 5,623 $ 6,756C65 . . . . . . . . . . . . . . . . . . . . . . . . . . . . . . . . . . . 30,118 29,107 22,899TA100 . . . . . . . . . . . . . . . . . . . . . . . . . . . . . . . . . 318 460 1,485C200 . . . . . . . . . . . . . . . . . . . . . . . . . . . . . . . . . . 7,120 14,754 18,099C600 . . . . . . . . . . . . . . . . . . . . . . . . . . . . . . . . . . 5,848 10,374 12,384C800 . . . . . . . . . . . . . . . . . . . . . . . . . . . . . . . . . . 8,319 10,127 5,324C1000 . . . . . . . . . . . . . . . . . . . . . . . . . . . . . . . . . 32,685 38,141 35,571Waste heat recovery generator . . . . . . . . . . . . . . . . 155 180 —Unit upgrades . . . . . . . . . . . . . . . . . . . . . . . . . . . — — 129
Total from Microturbine Products . . . . . . . . . . . . . 89,367 108,766 102,647Accessories, Parts and Service . . . . . . . . . . . . . . . . 26,094 24,339 24,910
Total . . . . . . . . . . . . . . . . . . . . . . . . . . . . . . . . . . $115,461 $133,105 $127,557
Substantially all of the Company’s operating assets are in the United States.
Recent Accounting Pronouncements In April 2015, the Financial Accounting Standards Board (the‘‘FASB’’) issued Accounting Standard Update (‘‘ASU’’) 2015-03, Interest—Imputation of Interest(Subtopic 835-30). The ASU was issued as part of FASB’s current plan to simplify overly complexstandards. This ASU requires that debt issuance costs related to a recognized debt liability bepresented in the balance sheet as a direct deduction from the carrying amount of that debt liability.The recognition and measurement guidance for debt issuance costs are not affected by this ASU. Theupdate requires retrospective application to all prior period amounts presented. This update is effectivefor annual and interim periods beginning on or after December 15, 2015, with early applicationpermitted for financial statements that have not been issued. We are currently evaluating the potentialimpacts the new standard will have on our reporting process.
In August 2014, the FASB issued ASU 2014-15, Disclosure of Uncertainties About an Entity’sAbility to Continue as a Going Concern (‘‘ASU 2014-15’’). ASU 2014-15 requires management toperform interim and annual assessments of an entity’s ability to continue as a going concern within oneyear of the date the financial statements are issued and provides guidance on determining when andhow to disclose going concern uncertainties in the financial statements. Certain disclosures will berequired if conditions give rise to substantial doubt about an entity’s ability to continue as a goingconcern. ASU 2014-15 applies to all entities and is effective for annual and interim reporting periodsending after December 15, 2016, with early adoption permitted. The Company is evaluating thepotential impacts the new standard will have on its reporting process.
In June 2014, the FASB issued ASU 2014-12, Accounting for Share-Based Payments When theTerms of an Award Provide That a Performance Target Could Be Achieved after the Requisite ServicePeriod (‘‘ASU 2014-12’’). ASU 2014-12 requires that a performance target that affects vesting and thatcould be achieved after the requisite service period be treated as a performance condition. As such, theperformance target should not be reflected in estimating the grant-date fair value of the award.ASU 2014-12 is effective for annual reporting periods beginning after December 15, 2015, with early
F-12

CAPSTONE TURBINE CORPORATION AND SUBSIDIARIES
NOTES TO CONSOLIDATED FINANCIAL STATEMENTS (Continued)
2. Summary of Significant Accounting Policies (Continued)
adoption permitted. The Company is evaluating the potential impacts of the new standard on itsexisting stock-based compensation plans.
In May 2014, the FASB issued ASU 2014-09, Revenue from Contracts with Customers(‘‘ASU 2014-09’’). ASU 2014-09 supersedes nearly all existing revenue recognition guidance underU.S. GAAP. The standard’s core principle is that a company will recognize revenue when it transferspromised goods or services to customers in an amount that reflects the consideration to which thecompany expects to be entitled in exchange for those goods or services. The Company is evaluating itsexisting revenue recognition policies to determine whether any contracts in the scope of the guidancewill be affected by the new requirements. ASU 2014-09 is effective for annual reporting periodsbeginning after December 15, 2016, including interim periods therein.
3. Inventories
Inventories are valued on a FIFO basis and lower of cost or market and consisted of the followingas of March 31, 2015 and 2014 (in thousands):
2015 2014
Raw materials . . . . . . . . . . . . . . . . . . . . . . . . . . . . . . . . . . . . . $19,955 $19,080Work in process . . . . . . . . . . . . . . . . . . . . . . . . . . . . . . . . . . . . — 5Finished goods . . . . . . . . . . . . . . . . . . . . . . . . . . . . . . . . . . . . . 5,400 1,955
Total . . . . . . . . . . . . . . . . . . . . . . . . . . . . . . . . . . . . . . . . . . 25,355 21,040Less non-current portion . . . . . . . . . . . . . . . . . . . . . . . . . . . . . (2,258) (2,938)
Current portion . . . . . . . . . . . . . . . . . . . . . . . . . . . . . . . . . . . . $23,097 $18,102
The non-current portion of inventories represents that portion of the inventories in excess ofamounts expected to be used in the next twelve months. The non-current inventories are primarilycomprised of repair parts for older generation products that are still in operation, but are nottechnologically compatible with current configurations. The weighted average age of the non-currentportion of inventories on hand as of March 31, 2015 is 2.0 years. The Company expects to use thenon-current portion of the inventories on hand as of March 31, 2015 over the periods presented in thefollowing table (in thousands):
Non-current InventoryExpected Period of Use Balance Expected to be Used
13 to 24 months . . . . . . . . . . . . . . . . . . . . . . . . . . . . . . . . $1,54425 to 36 months . . . . . . . . . . . . . . . . . . . . . . . . . . . . . . . . 55737 to 48 months . . . . . . . . . . . . . . . . . . . . . . . . . . . . . . . . 157
Total . . . . . . . . . . . . . . . . . . . . . . . . . . . . . . . . . . . . . . . . $2,258
F-13

CAPSTONE TURBINE CORPORATION AND SUBSIDIARIES
NOTES TO CONSOLIDATED FINANCIAL STATEMENTS (Continued)
4. Property, Plant and Equipment
Property, plant and equipment as of March 31, 2015 and 2014 consisted of the following (inthousands):
Estimated2015 2014 Useful Life
Machinery, rental equipment, equipment,automobiles and furniture . . . . . . . . . . . . . . . $ 20,873 $ 20,665 2 - 10 years
Leasehold improvements . . . . . . . . . . . . . . . . . . 9,760 9,731 10 yearsMolds and tooling . . . . . . . . . . . . . . . . . . . . . . . 3,722 5,138 2 - 5 years
34,355 35,534Less, accumulated depreciation . . . . . . . . . . . . . (30,832) (32,643)
Total property, plant and equipment, net . . . . . . $ 3,523 $ 2,891
Depreciation expense for property, plant and equipment was $1.2 million, $1.8 million and$2.3 million for the years ended March 31, 2015, 2014 and 2013, respectively.
5. Intangible Assets
Intangible assets consisted of the following (in thousands):
March 31, 2015
WeightedAverage Intangible Intangible
Amortization Assets, Accumulated Assets,Period Gross Amortization Net
Manufacturing license . . . . . . . . . . . . . . . . . . . . . . . . . 17 years $3,700 $3,585 $ 115Technology . . . . . . . . . . . . . . . . . . . . . . . . . . . . . . . . . 10 years 2,240 1,157 1,083Parts and service customer relationships . . . . . . . . . . . . 5 years 1,080 1,080 —TA100 customer relationships . . . . . . . . . . . . . . . . . . . 2 years 617 617 —Backlog . . . . . . . . . . . . . . . . . . . . . . . . . . . . . . . . . . . Various 490 351 139Trade name . . . . . . . . . . . . . . . . . . . . . . . . . . . . . . . . 1.2 years 69 69 —
Total . . . . . . . . . . . . . . . . . . . . . . . . . . . . . . . . . . . . . $8,196 $6,859 $1,337
March 31, 2014
WeightedAverage Intangible Intangible
Amortization Assets, Accumulated Assets,Period Gross Amortization Net
Manufacturing license . . . . . . . . . . . . . . . . . . . . . . . . . 17 years $3,700 $3,536 $ 164Technology . . . . . . . . . . . . . . . . . . . . . . . . . . . . . . . . . 10 years 2,240 933 1,307Parts and service customer relationships . . . . . . . . . . . . 5 years 1,080 900 180TA100 customer relationships . . . . . . . . . . . . . . . . . . . 2 years 617 617 —Backlog . . . . . . . . . . . . . . . . . . . . . . . . . . . . . . . . . . . Various 490 351 139Trade name . . . . . . . . . . . . . . . . . . . . . . . . . . . . . . . . 1.2 years 69 69 —
Total . . . . . . . . . . . . . . . . . . . . . . . . . . . . . . . . . . . . . $8,196 $6,406 $1,790
F-14

CAPSTONE TURBINE CORPORATION AND SUBSIDIARIES
NOTES TO CONSOLIDATED FINANCIAL STATEMENTS (Continued)
5. Intangible Assets (Continued)
Amortization expense for the intangible assets was $0.5 million for each of the years endedMarch 31, 2015, 2014 and 2013.
Expected future amortization expense of intangible assets as of March 31, 2015 is as follows (inthousands):
AmortizationYear Ending March 31, Expense
2016 . . . . . . . . . . . . . . . . . . . . . . . . . . . . . . . . . . . . . . . . . . . . . . . . . . $ 3322017 . . . . . . . . . . . . . . . . . . . . . . . . . . . . . . . . . . . . . . . . . . . . . . . . . . 3522018 . . . . . . . . . . . . . . . . . . . . . . . . . . . . . . . . . . . . . . . . . . . . . . . . . . 2422019 . . . . . . . . . . . . . . . . . . . . . . . . . . . . . . . . . . . . . . . . . . . . . . . . . . 2242020 . . . . . . . . . . . . . . . . . . . . . . . . . . . . . . . . . . . . . . . . . . . . . . . . . . 187Thereafter . . . . . . . . . . . . . . . . . . . . . . . . . . . . . . . . . . . . . . . . . . . . . —
Total expected future amortization . . . . . . . . . . . . . . . . . . . . . . . . . . . . $1,337
The manufacturing license provides the Company with the ability to manufacture recuperator corespreviously purchased from Solar Turbines Incorporated (‘‘Solar’’). The Company is required to pay aper-unit royalty fee over a seventeen-year period for cores manufactured and sold by the Companyusing the technology. Royalties of approximately $71,100, $83,000, and $76,700 were earned by Solarfor the years ended March 31, 2015, 2014 and 2013, respectively. Earned royalties of approximately$19,300 and $20,700 were unpaid as of March 31, 2015 and 2014, respectively, and are included inaccrued expenses in the accompanying balance sheets.
6. Accrued Warranty Reserve
Changes in the accrued warranty reserve are as follows as of March 31, 2015, 2014 and 2013 (inthousands):
2015 2014 2013
Balance, beginning of the period . . . . . . . . . . . . . . . . . $ 2,965 $ 2,299 $ 1,494Standard warranty provision . . . . . . . . . . . . . . . . . . . . 3,516 2,857 3,874Changes for accrual related to reliability repair
programs . . . . . . . . . . . . . . . . . . . . . . . . . . . . . . . . (53) 1,046 1,255Deductions for warranty claims . . . . . . . . . . . . . . . . . . (3,245) (3,237) (4,324)
Balance, end of the period . . . . . . . . . . . . . . . . . . . . . $ 3,183 $ 2,965 $ 2,299
F-15

CAPSTONE TURBINE CORPORATION AND SUBSIDIARIES
NOTES TO CONSOLIDATED FINANCIAL STATEMENTS (Continued)
7. Deferred Revenue
Changes in deferred revenue are as follows as of March 31, 2015, 2014 and 2013 (in thousands):
2015 2014 2013
FPP Balance, beginning of the period . . . . . . . . . . . . . $ 2,061 $ 1,412 $ 1,167FPP Billings . . . . . . . . . . . . . . . . . . . . . . . . . . . . . . 9,773 7,689 5,884FPP Revenue recognized . . . . . . . . . . . . . . . . . . . . . (9,343) (7,040) (5,639)
Balance attributed to FPP contracts . . . . . . . . . . . . . 2,491 2,061 1,412Deposits . . . . . . . . . . . . . . . . . . . . . . . . . . . . . . . . . . . 560 596 1,677
Deferred revenue balance, end of the period . . . . . . . . $ 3,051 $ 2,657 $ 3,089
Comprehensive FPP deferred revenue represents the unearned portion of our agreements. FPPagreements are generally paid quarterly in advance with revenue recognized on a straight line basisover the contract period. Deposits are primarily non-refundable cash payments from distributors forfuture orders.
8. Income Taxes
Current income tax provision is the amount of income taxes reported or expected to be reportedon our income tax return. The provision for current income taxes for the year ended March 31, 2015was $0.1 million, which was related to state income and foreign taxes. The Company did not havecurrent federal income taxes for the year ended March 31, 2015.
Actual income tax expense differed from the amount computed by applying statutory corporateincome tax rates to loss from operations before income taxes. A reconciliation of income tax (benefit)expense to the federal statutory rate follows (in thousands):
Year Ended March 31,
2015 2014 2013
Federal income tax at the statutory rate . . . . . . . . . . . $(10,681) $(5,452) $(7,436)State taxes, net of federal effect . . . . . . . . . . . . . . . . (671) (93) (661)Foreign taxes . . . . . . . . . . . . . . . . . . . . . . . . . . . . . . 33 134 675R&D tax credit . . . . . . . . . . . . . . . . . . . . . . . . . . . . (392) 37 (1,157)Impact of state rate change . . . . . . . . . . . . . . . . . . . . (2,627) 492 838Warrant liability . . . . . . . . . . . . . . . . . . . . . . . . . . . . — (3) (299)Expiring NOL . . . . . . . . . . . . . . . . . . . . . . . . . . . . . 3,865 1,543 —Valuation allowance . . . . . . . . . . . . . . . . . . . . . . . . . 10,583 3,614 (1,877)Excess tax benefit—stock compensation . . . . . . . . . . . — — 10,383Other . . . . . . . . . . . . . . . . . . . . . . . . . . . . . . . . . . . . 7 (52) 228
Income tax expense (benefit) . . . . . . . . . . . . . . . . . . . $ 117 $ 220 $ 694
F-16

CAPSTONE TURBINE CORPORATION AND SUBSIDIARIES
NOTES TO CONSOLIDATED FINANCIAL STATEMENTS (Continued)
8. Income Taxes (Continued)
The Company’s deferred tax assets and liabilities consisted of the following at March 31, 2015 and2014 (in thousands):
2015 2014
Deferred tax assets:Inventories . . . . . . . . . . . . . . . . . . . . . . . . . . . . . . . . . . . $ 3,323 $ 2,152Warranty reserve . . . . . . . . . . . . . . . . . . . . . . . . . . . . . . . 1,217 1,051Bad debt reserve . . . . . . . . . . . . . . . . . . . . . . . . . . . . . . . 4,223 803Deferred revenue . . . . . . . . . . . . . . . . . . . . . . . . . . . . . . 953 731Net operating loss (‘‘NOL’’) carryforwards . . . . . . . . . . . . 218,826 214,071Tax credit carryforwards . . . . . . . . . . . . . . . . . . . . . . . . . . 18,860 18,369Depreciation, amortization and impairment loss . . . . . . . . 3,231 3,631Other . . . . . . . . . . . . . . . . . . . . . . . . . . . . . . . . . . . . . . . 5,154 4,477
Deferred tax assets . . . . . . . . . . . . . . . . . . . . . . . . . . . . . . . 255,787 245,285Valuation allowance for deferred tax assets . . . . . . . . . . . . . (246,753) (236,169)
Deferred tax assets, net of valuation allowance . . . . . . . . . . . 9,034 9,116Deferred tax liabilities:
Federal benefit of state taxes . . . . . . . . . . . . . . . . . . . . . . (9,034) (9,116)
Net deferred tax assets . . . . . . . . . . . . . . . . . . . . . . . . . . . . $ — $ —
Because of the uncertainty surrounding the timing of realizing the benefits of favorable taxattributes in future income tax returns, the Company has placed a valuation allowance against its netdeferred income tax assets. The change in valuation allowance for Fiscal 2015, 2014 and 2013 was$10.6 million, $3.6 million and $1.9 million, respectively.
The Company’s NOL and tax credit carryforwards for federal and state income tax purposes atMarch 31, 2015 were as follows (in thousands):
ExpirationAmount Period
Federal NOL . . . . . . . . . . . . . . . . . . . . . . . . . . . . . . . . . . $625,918 2018 - 2035State NOL . . . . . . . . . . . . . . . . . . . . . . . . . . . . . . . . . . . . $202,275 2014 - 2035Federal tax credit carryforwards . . . . . . . . . . . . . . . . . . . . . $ 9,684 2018 - 2035State tax credit carryforwards . . . . . . . . . . . . . . . . . . . . . . $ 9,176 Indefinite
The NOLs and federal and state tax credits can be carried forward to offset future taxable income,if any. Utilization of the NOLs and tax credits are subject to an annual limitation of approximately$57.3 million due to the ownership change limitations provided by the Internal Revenue Code of 1986and similar state provisions. The federal tax credit carryforward is a research and development credit,which may be carried forward. The state tax credits consist of a research and development credit canbe carried forward indefinitely.
Tax benefits arising from the disposition of certain shares issued upon exercise of stock optionswithin two years of the date of grant or within one year of the date of exercise by the option holder(‘‘Disqualifying Dispositions’’) provide the Company with a tax deduction equal to the differencebetween the exercise price and the fair market value of the stock on the date of exercise.
F-17

CAPSTONE TURBINE CORPORATION AND SUBSIDIARIES
NOTES TO CONSOLIDATED FINANCIAL STATEMENTS (Continued)
8. Income Taxes (Continued)
Approximately $27.7 million of the Company’s federal and state NOL carryforwards as of March 31,2015 were generated by Disqualifying Dispositions of stock options and exercises of nonqualified stockoptions. In accordance with the reporting requirements under ASC 718, we did not includeapproximately $10.0 million of excess windfall tax benefits resulting from stock option exercises ascomponents of our gross deferred tax assets and corresponding valuation allowance disclosures, as taxattributes related to those windfall tax benefits should not be recognized until they result in a reductionof taxes payable. The tax effected amount of gross unrealized net operating loss carry forwardsexcluded under ASC 718 was approximately $10.0 million at March 31, 2015. When realized, thoseexcess windfall tax benefits are credited to additional paid-in capital.
Accounting Standards Codification (‘‘ASC’’) 740, Income Taxes clarifies the accounting for incometaxes by prescribing a minimum recognition threshold that a tax position is required to meet beforebeing recognized in the financial statements. ASC 740 also provides guidance on derecognition,measurement, classification, interest and penalties, accounting in interim periods, disclosure andtransition. Based on management’s evaluation, the total amount of unrecognized tax benefits related toresearch and development credits as of March 31, 2015 and 2014 was $2.6 million and $2.4 million,respectively. There were no interest or penalties related to unrecognized tax benefits as of March 31,2015 or March 31, 2014. The amount of unrecognized tax benefits that, if recognized, would affect theeffective tax rate as of March 31, 2015 and March 31, 2014 was $2.6 million and $2.4 million,respectively. However, this impact would be offset by an equal increase in the deferred tax valuationallowance as the Company has recorded a full valuation allowance against its deferred tax assetsbecause of uncertainty as to future realization. The fully reserved recognized federal and state deferredtax assets related to research and development credits balance as of March 31, 2015 and 2014 was$9.7 million and $9.2 million, and $9.5 million and $9.6 million, respectively.
A reconciliation of the beginning and ending amount of total gross unrecognized tax benefits is asfollows (in thousands):
Balance at March 31, 2012 . . . . . . . . . . . . . . . . . . . . . . . . . . . . . . . . . . . . $2,148Gross decrease related to prior year tax positions . . . . . . . . . . . . . . . . . . . . (100)Gross increase related to prior year tax positions . . . . . . . . . . . . . . . . . . . . 222Gross increase related to current year tax positions . . . . . . . . . . . . . . . . . . . 148Lapse of statute of limitations . . . . . . . . . . . . . . . . . . . . . . . . . . . . . . . . . . —
Balance at March 31, 2013 . . . . . . . . . . . . . . . . . . . . . . . . . . . . . . . . . . . . $2,418Gross decrease related to prior year tax positions . . . . . . . . . . . . . . . . . . . . (93)Gross increase related to prior year tax positions . . . . . . . . . . . . . . . . . . . . 1Gross increase related to current year tax positions . . . . . . . . . . . . . . . . . . . 115Lapse of statute of limitations . . . . . . . . . . . . . . . . . . . . . . . . . . . . . . . . . . —
Balance at March 31, 2014 . . . . . . . . . . . . . . . . . . . . . . . . . . . . . . . . . . . . $2,441Gross increase related to prior year tax positions . . . . . . . . . . . . . . . . . . . . 11Gross increase related to current year tax positions . . . . . . . . . . . . . . . . . . . 112Lapse of statute of limitations . . . . . . . . . . . . . . . . . . . . . . . . . . . . . . . . . . —
Balance at March 31, 2015 . . . . . . . . . . . . . . . . . . . . . . . . . . . . . . . . . . . . $2,564
F-18
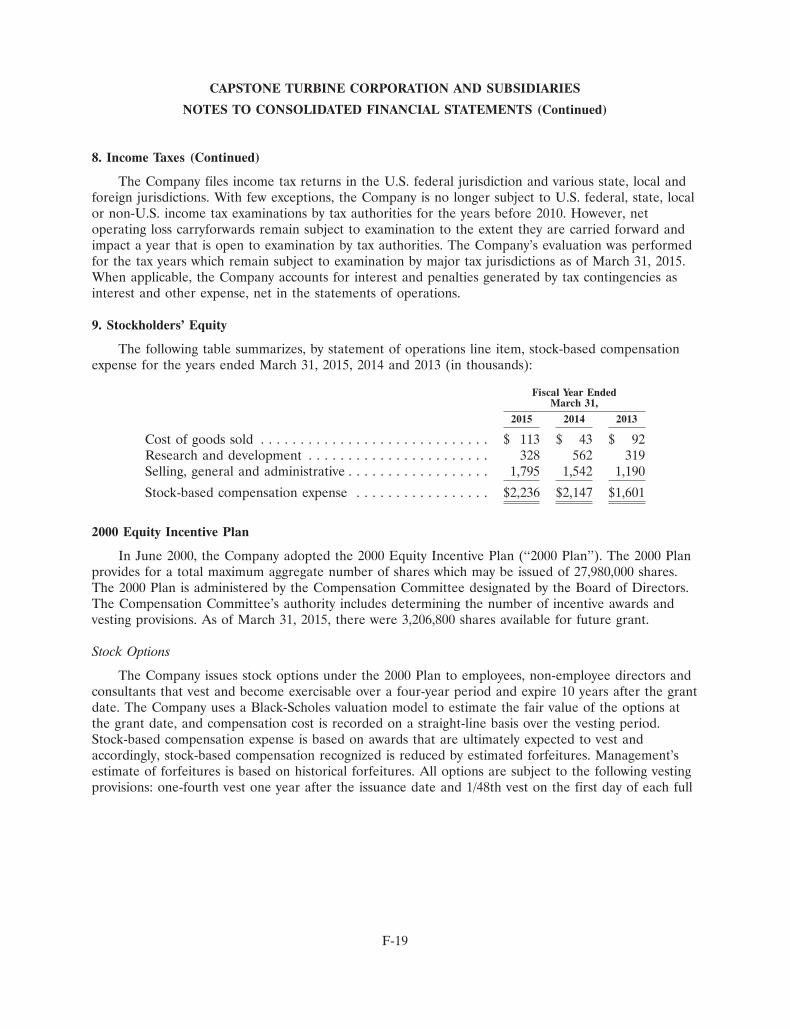
CAPSTONE TURBINE CORPORATION AND SUBSIDIARIES
NOTES TO CONSOLIDATED FINANCIAL STATEMENTS (Continued)
8. Income Taxes (Continued)
The Company files income tax returns in the U.S. federal jurisdiction and various state, local andforeign jurisdictions. With few exceptions, the Company is no longer subject to U.S. federal, state, localor non-U.S. income tax examinations by tax authorities for the years before 2010. However, netoperating loss carryforwards remain subject to examination to the extent they are carried forward andimpact a year that is open to examination by tax authorities. The Company’s evaluation was performedfor the tax years which remain subject to examination by major tax jurisdictions as of March 31, 2015.When applicable, the Company accounts for interest and penalties generated by tax contingencies asinterest and other expense, net in the statements of operations.
9. Stockholders’ Equity
The following table summarizes, by statement of operations line item, stock-based compensationexpense for the years ended March 31, 2015, 2014 and 2013 (in thousands):
Fiscal Year EndedMarch 31,
2015 2014 2013
Cost of goods sold . . . . . . . . . . . . . . . . . . . . . . . . . . . . . $ 113 $ 43 $ 92Research and development . . . . . . . . . . . . . . . . . . . . . . . 328 562 319Selling, general and administrative . . . . . . . . . . . . . . . . . . 1,795 1,542 1,190
Stock-based compensation expense . . . . . . . . . . . . . . . . . $2,236 $2,147 $1,601
2000 Equity Incentive Plan
In June 2000, the Company adopted the 2000 Equity Incentive Plan (‘‘2000 Plan’’). The 2000 Planprovides for a total maximum aggregate number of shares which may be issued of 27,980,000 shares.The 2000 Plan is administered by the Compensation Committee designated by the Board of Directors.The Compensation Committee’s authority includes determining the number of incentive awards andvesting provisions. As of March 31, 2015, there were 3,206,800 shares available for future grant.
Stock Options
The Company issues stock options under the 2000 Plan to employees, non-employee directors andconsultants that vest and become exercisable over a four-year period and expire 10 years after the grantdate. The Company uses a Black-Scholes valuation model to estimate the fair value of the options atthe grant date, and compensation cost is recorded on a straight-line basis over the vesting period.Stock-based compensation expense is based on awards that are ultimately expected to vest andaccordingly, stock-based compensation recognized is reduced by estimated forfeitures. Management’sestimate of forfeitures is based on historical forfeitures. All options are subject to the following vestingprovisions: one-fourth vest one year after the issuance date and 1/48th vest on the first day of each full
F-19

CAPSTONE TURBINE CORPORATION AND SUBSIDIARIES
NOTES TO CONSOLIDATED FINANCIAL STATEMENTS (Continued)
9. Stockholders’ Equity (Continued)
month thereafter, so that all options will be vested on the first day of the 48th month after the grantdate. Information relating to stock options for fiscal year ended March 31, 2015, is as follows:
Weighted-Average
Weighted- Remaining AggregateAverage Contractual Intrinsic
Shares Exercise Price Term Value
(in years)
Options outstanding at March 31, 2014 . . . . . . . . . . . 12,851,688 $1.27Granted . . . . . . . . . . . . . . . . . . . . . . . . . . . . . . . . 1,085,800 $1.43Exercised . . . . . . . . . . . . . . . . . . . . . . . . . . . . . . . (322,241) $0.94Forfeited, cancelled or expired . . . . . . . . . . . . . . . (451,884) $1.66
Options outstanding at March 31, 2015 . . . . . . . . . . . 13,163,363 $1.28 3.9 —Options fully vested at March 31, 2015 and those
expected to vest beyond March 31, 2015 . . . . . . . . 13,163,363 $1.28 3.9 —Options exercisable at March 31, 2015 . . . . . . . . . . . 10,568,511 $1.30 3.3 —
Black-Scholes Model Valuation Assumptions
The Company calculated the estimated fair value of each stock option on the date of grant usingthe Black-Scholes valuation method and the following weighted-average assumptions:
Fiscal Year EndedMarch 31,
2015 2014 2013
Risk-free interest rates . . . . . . . . . . . . . . . . . . . . . . . . . . . . . 1.8% 0.9% 0.8%Expected lives (in years) . . . . . . . . . . . . . . . . . . . . . . . . . . . 5.7 5.7 5.7Dividend yield . . . . . . . . . . . . . . . . . . . . . . . . . . . . . . . . . . . —% —% —%Expected volatility . . . . . . . . . . . . . . . . . . . . . . . . . . . . . . . . 77.0% 77.3% 79.8%Weighted average grant date fair value of options granted
during the period . . . . . . . . . . . . . . . . . . . . . . . . . . . . . . . $0.94 $0.60 $0.67
The Company’s computation of expected volatility for the fiscal years ended March 31, 2015, 2014and 2013 was based on historical volatility. The expected life, or term, of options granted is derivedfrom historical exercise behavior and represents the period of time that stock option awards areexpected to be outstanding. Management has selected a risk-free rate based on the implied yieldavailable on U.S. Treasury Securities with a maturity equivalent to the options’ expected term.
F-20

CAPSTONE TURBINE CORPORATION AND SUBSIDIARIES
NOTES TO CONSOLIDATED FINANCIAL STATEMENTS (Continued)
9. Stockholders’ Equity (Continued)
The following table provides additional information on stock options for the Company’s fiscal yearsended March 31, 2015, 2014 and 2013:
Fiscal Year EndedMarch 31,
2015 2014 2013
Stock option compensation expense (in thousands) . . . . . . . $1,071 $1,117 $942Cash received for exercise price (in thousands) . . . . . . . . . . $ 302 $ 464 —Intrinsic value (in thousands) . . . . . . . . . . . . . . . . . . . . . . . $ 129 $ 225 —Weighted average grant date fair value of options exercised
during the period . . . . . . . . . . . . . . . . . . . . . . . . . . . . . . $ 1.34 $ 1.35 —
As of March 31, 2015, there was approximately $1.6 million of total compensation cost related tounvested stock option awards that is expected to be recognized as expense over a weighted averageperiod of 2.3 years.
Restricted Stock Units and Performance Restricted Stock Units
The Company issues restricted stock units under the 2000 Plan to employees, non-employeedirectors and consultants. The restricted stock units are valued based on the closing price of theCompany’s common stock on the date of issuance, and compensation cost is recorded on a straight-linebasis over the vesting period. The related compensation expense recognized is reduced by estimatedforfeitures. The Company’s estimate of forfeitures is based on historical forfeitures. The restricted stockunits vest in equal installments over a period of four years. For restricted stock units with four yearvesting, one-fourth vest annually beginning one year after the issuance date. The restricted stock unitsissued to non-employee directors vest one year after the issuance date. The following table outlines therestricted stock and performance restricted stock unit (‘‘PRSU’’) activity:
WeightedAverage Grant
Date FairRestricted Stock and Performance Restricted Stock Units Shares Value
Nonvested restricted stock units outstanding at March 31,2014 . . . . . . . . . . . . . . . . . . . . . . . . . . . . . . . . . . . . . . 2,061,224 $1.11
Granted . . . . . . . . . . . . . . . . . . . . . . . . . . . . . . . . . . . . . 974,236 $1.37Vested and issued . . . . . . . . . . . . . . . . . . . . . . . . . . . . . . (828,136) $1.13PRSU adjustments . . . . . . . . . . . . . . . . . . . . . . . . . . . . . . (200,000) $1.56Forfeited . . . . . . . . . . . . . . . . . . . . . . . . . . . . . . . . . . . . . (138,750) $1.14
Nonvested restricted stock units outstanding at March 31,2015 . . . . . . . . . . . . . . . . . . . . . . . . . . . . . . . . . . . . . . 1,868,574 $1.19
Restricted stock units expected to vest beyond March 31,2015 . . . . . . . . . . . . . . . . . . . . . . . . . . . . . . . . . . . . . . 1,760,706 $1.19
F-21

CAPSTONE TURBINE CORPORATION AND SUBSIDIARIES
NOTES TO CONSOLIDATED FINANCIAL STATEMENTS (Continued)
9. Stockholders’ Equity (Continued)
The following table provides additional information on restricted stock units for the Company’sfiscal years ended March 31, 2015, 2014 and 2013:
Fiscal Year EndedMarch 31,
2015 2014 2013
Restricted stock compensation expense (in thousands) . . . . . $1,048 $ 914 $ 558Aggregate fair value of restricted stock units vested and
issued (in thousands) . . . . . . . . . . . . . . . . . . . . . . . . . . . $1,206 $ 806 $ 560Weighted average grant date fair value of restricted stock
units granted during the period . . . . . . . . . . . . . . . . . . . . $ 1.33 $1.09 $1.00
As of March 31, 2015, there was approximately $1.4 million of total compensation cost related tounvested restricted stock units that is expected to be recognized as expense over a weighted averageperiod of 2.1 years.
PRSU activity is included in the above restricted stock units tables. In May 2014, theCompensation Committee of the Company’s Board of Directors approved the new PerformanceRestricted Stock Unit Program, which is applicable to certain senior employees. The CompensationCommittee granted 200,000 PRSUs to the Chief Executive Officer under the 2000 Plan. The ChiefExecutive Officer is the only participant for Fiscal 2015. For the first year of the program, the PRSUgrant for the Chief Executive Officer is broken out into two performance measurement periods. Thefirst performance measurement period began on April 1, 2014 and will end on March 31, 2016; thesecond performance measurement period has a three-year term that began on April 1, 2014 and willend on March 31, 2017. Any earned PRSU awards will vest 50% after the end of the applicableperformance measurement period and 50% one year thereafter.
The weighted average per share grant date fair value of PRSUs granted during the fiscal yearended March 31, 2015 was $1.56. Based on our assessment as of March 31, 2015, the PRSU thresholdfor the first performance measurement likely will not be met and, as a result, the Chief ExecutiveOfficer PRSU awards were adjusted and no compensation expense was recorded or recognized duringFiscal 2015. Any compensation expense will be recognized over the corresponding requisite serviceperiod and will be adjusted in subsequent reporting periods if the Company’s assessment of theprobable level of achievement of the performance goals changes. The Company will continue toperiodically assess the likelihood of the PRSU threshold being met until the end of the applicableperformance period.
F-22

CAPSTONE TURBINE CORPORATION AND SUBSIDIARIES
NOTES TO CONSOLIDATED FINANCIAL STATEMENTS (Continued)
9. Stockholders’ Equity (Continued)
Non-employee Directors Stock Awards
The Company issues stock awards under the 2000 Plan to non-employee directors who elected totake payment of all or any part of the directors’ fees in stock in lieu of cash. The following tableoutlines the non-employee directors stock activity for the Company’s fiscal years ended March 31, 2015,2014 and 2013:
Fiscal Year Ended March 31,
2015 2014 2013
Non-employee directors stock awards compensationexpense (in thousands) . . . . . . . . . . . . . . . . . . . . $ 117 $ 116 $ 101
Non-employee director deferred stock awardsgranted . . . . . . . . . . . . . . . . . . . . . . . . . . . . . . . 119,277 91,603 103,574
Weighted average grant date fair value of restrictedstock awards granted during the period . . . . . . . . $ 0.99 $ 1.26 $ 0.98
For each term of the Board of Directors (beginning on the date of an annual meeting ofstockholders and ending on the date immediately preceding the next annual meeting of stockholders), anon-employee director may elect to receive a stock award in lieu of all or any portion of their annualretainer or committee fee cash payment. The shares of stock were valued based on the closing price ofthe Company’s common stock on the date of grant.
2000 Employee Stock Purchase Plan
In June 2000, the Company adopted the 2000 Employee Stock Purchase Plan (the ‘‘PurchasePlan’’), which provides for the granting of rights to purchase common stock to regular full andpart-time employees or officers of the Company and its subsidiaries. Under the Purchase Plan, sharesof common stock will be issued upon exercise of the purchase rights. Under the Purchase Plan, anaggregate of 900,000 shares may be issued pursuant to the exercise of purchase rights. In August 2010,the Board of Directors adopted and the stockholders approved an amendment and restatement of thePurchase Plan. The amendment and restatement includes an increase of 500,000 shares of commonstock that will be available under the Purchase Plan and extends the term of the Purchase Plan for aperiod of ten years. As amended, the Purchase Plan will continue by its terms through June 30, 2020,unless terminated sooner, and will reserve for issuance a total of 1,400,000 shares of common stock.The maximum amount that an employee can contribute during a purchase right period is $25,000 or15% of the employee’s regular compensation. Under the Purchase Plan, the exercise price of apurchase right is 95% of the fair market value of such shares on the last day of the purchase rightperiod. The fair market value of the stock is its closing price as reported on the Nasdaq Global Marketon the day in question. During the fiscal years ended March 31, 2015, 2014 and 2013, the Companyissued a total of 20,619 shares, 12,302 shares and 22,478 shares of stock, respectively, to regular full andpart-time employees or officers of the Company who elected to participate in the Purchase Plan. As ofMarch 31, 2015, there were 409,569 shares available for future grant under the Purchase Plan.
Grants outside of the 2000 Plan
As of March 31, 2015, the Company had outstanding 3,800,000 non-qualified common stockoptions and 93,750 restricted stock units issued outside of the 2000 Plan. The Company granted 250,000
F-23

CAPSTONE TURBINE CORPORATION AND SUBSIDIARIES
NOTES TO CONSOLIDATED FINANCIAL STATEMENTS (Continued)
9. Stockholders’ Equity (Continued)
of these stock options during Fiscal 2015, 250,000 of these stock options during Fiscal 2013, 3,300,000of these stock options prior to Fiscal 2013, 62,500 of these restricted stock units during Fiscal 2015 and31,250 of these restricted stock units during Fiscal 2013 as inducement grants to new officers andemployees of the Company, with exercise prices equal to the fair market value of the Company’scommon stock on the grant date.
Outside of 2000 Plan Options RSUs
Executive Vice President and Chief Executive Officer . . . . . . . . 2,000,000 —Executive Vice President of Sales and Marketing . . . . . . . . . . . . 850,000 —Vice President of Operations . . . . . . . . . . . . . . . . . . . . . . . . . . 250,000 62,500Former Senior Vice President of Customer Service . . . . . . . . . . 250,000 31,250Former Senior Vice President of Program Management . . . . . . . 250,000 —Former Senior Vice President of Human Resources . . . . . . . . . . 200,000 —
Outstanding stock outside of 2000 Plan . . . . . . . . . . . . . . . . . . . 3,800,000 93,750
Although the options and restricted stock units were not granted under the 2000 Plan, they aregoverned by terms and conditions identical to those under the 2000 Plan. All options are subject to thefollowing vesting provisions: one-fourth vest one year after the issuance date and 1⁄48th vest on the firstday of each full month thereafter, so that all options will be vested on the first day of the 48th monthafter the grant date. All outstanding options have a contractual term of ten years. The restricted stockunits vest in equal installments over a period of four years.
Stockholder Rights Plan
The Company has entered into a rights agreement (as amended, the ‘‘Rights Agreement’’) withComputershare Inc., successor-in-interest to Mellon Investor Services LLC, as rights agent. Inconnection with the rights agreement, the Company’s board of directors authorized and declared adividend distribution of one preferred stock purchase right for each share of the Company’s commonstock authorized and outstanding. Each right entitles the registered holder to purchase from theCompany a unit consisting of one one-hundredth of a share of Series A Junior Participating PreferredStock, par value $0.001 per share, at a purchase price of $10.00 per unit, subject to adjustment. Thedescription and terms of the rights are set forth in the rights agreement. Initially, the rights areattached to all common stock certificates representing shares then outstanding, and no separate rightscertificates are distributed. Subject to certain exceptions specified in the Rights Agreement, the rightswill separate from the common stock and will be exercisable upon the earlier of (i) 10 days following apublic announcement that a person or group of affiliated or associated persons has acquired, orobtained the right to acquire, beneficial ownership of 20% or more of the outstanding shares ofcommon stock, other than as a result of repurchases of stock by the Company or certain inadvertentactions by institutional or certain other stockholders, or (ii) 10 days (or such later date as theCompany’s Board of Directors shall determine) following the commencement of a tender offer orexchange offer (other than certain permitted offers described in the rights agreement) that would resultin a person or group beneficially owning 20% or more of the outstanding shares of the Company’scommon stock.
On July 1, 2014, the Company’s Board of Directors unanimously approved a third amendment tothe Rights Agreement pursuant to a ‘‘sunset provision,’’ which was approved by the stockholders at the
F-24

CAPSTONE TURBINE CORPORATION AND SUBSIDIARIES
NOTES TO CONSOLIDATED FINANCIAL STATEMENTS (Continued)
9. Stockholders’ Equity (Continued)
2014 annual meeting. The third amendment amends the Rights Agreement to provide that the rightswill expire on the 30th day after the 2017 annual meeting of stockholders unless continuation of theRights Agreement is approved by the stockholders at that meeting. On August 5, 2014, the Companyentered into a fourth amendment to the Rights Agreement. The fourth amendment amends the RightsAgreement to clarify that the term of the Rights Agreement may not be continued or extended unlessand until such amendment has received the approval of the stockholders of the Company at an annualor special meeting of the stockholders held prior to the termination of the Rights Agreement withouttaking into account such amendment.
The Rights Agreement is intended to protect the Company’s stockholders in the event of an unfairor coercive offer to acquire the Company. Management believes the Rights Agreement, however,should not affect any prospective offeror willing to make an offer at a fair price and otherwise in thebest interests of the Company and its stockholders, as determined by the Board of Directors. Also,management believes the Rights Agreement should not interfere with any merger or other businesscombination approved by the Board of Directors.
Underwritten and Registered Direct Placement of Common Stock
Effective May 6, 2014, the Company completed an underwritten public offering in which it sold18.8 million shares of the Company’s common stock at a price of $1.70 per share less underwritingdiscounts and commissions. The shares were allocated to a single institutional investor. The netproceeds to the Company from the sale of the Common Stock, after deducting fees and other offeringexpenses, were approximately $29.8 million.
Effective March 5, 2012, the Company completed a registered direct placement in which it sold22.6 million shares of the Company’s common stock, par value $.001 per share, and warrants topurchase 22.6 million shares of common stock with an initial exercise price of $1.55 per share, at aprice of $1.11 per unit (the ‘‘2012 Warrants’’). Each unit consisted of one share of common stock and awarrant to purchase one share of common stock. The 2012 Warrants expired on October 31, 2013. Inaddition, the Company obtained the right to require investors in the offering to purchase up to anaggregate maximum of 19.0 million additional shares of common stock from the Company (the ‘‘PutOptions’’) during two option exercise periods, the first such option exercise period beginningSeptember 10, 2012 and the second such option exercise period beginning March 4, 2013. Each PutOption was subject to certain conditions which reduced the number of shares that could be sold oreliminate the Put Option. These conditions included a minimum volume-weighted average price(VWAP) and a minimum average trading volume of the Company’s common shares during the30 trading days prior to the exercise of the Put Option. The March 2012 sale resulted in net proceedsof approximately $23.1 million net of direct incremental costs of approximately $1.9 million.
On September 18, 2012, the Company entered into an Investor Agreement with one of theinvestors in the 2012 registered direct offering pursuant to which the investor agreed to (i) waive thecondition precedent to the Company’s exercise of the Put Option requiring the arithmetic average ofthe average daily trading volumes during the measurement period set forth in the subscriptionagreement between the Company and the investor and on the exercise date be not less than1.75 million shares and (ii) amend the subscription agreement to provide that the purchase price of theadditional shares during the first exercise period would be discounted pursuant to a formula thatresulted in a purchase price for the first exercise period of $0.94 per share. Additionally, pursuant to
F-25

CAPSTONE TURBINE CORPORATION AND SUBSIDIARIES
NOTES TO CONSOLIDATED FINANCIAL STATEMENTS (Continued)
9. Stockholders’ Equity (Continued)
the Investor Agreement, the Company agreed to amend the exercise price of the 2012 Warrantsoriginally issued to the Investor to $1.26. The exercise of the first Put Option resulted in net proceedsof $4.2 million. The 2012 Warrants still outstanding as of March 31, 2013 provided for the purchase of22.6 million shares at a weighted average exercise price of $1.41 per share. On February 21, 2013, theCompany entered into a letter agreement (each a ‘‘Letter Agreement’’ and, collectively, the ‘‘LetterAgreements’’) with each of the investors in the March 5, 2012 registered direct offering. Pursuant tothe Letter Agreements, the parties evidenced their mutual agreement that the Company would notexercise any portion of the second Put Option. The Company chose not to exercise the second of thetwo Put Options because of its improved cash position and its desire to avoid stockholder dilution. OnOctober 31, 2013, an unsolicited exercise of 2012 Warrants to purchase 4.7 million shares resulted inproceeds of approximately $6.0 million. Effective October 31, 2013, all remaining outstanding 2012Warrants expired.
The following table outlines the warrant activity:
March 2012 September 2008
Shares Shares
Balance, March 31, 2012 . . . . . . . . . . . . . . . . . . . . . . . 22,550,000 3,910,034Anti-dilution provision . . . . . . . . . . . . . . . . . . . . . . . . . — 51,437
Balance, March 31, 2013 . . . . . . . . . . . . . . . . . . . . . . . 22,550,000 3,961,471Warrants exercised . . . . . . . . . . . . . . . . . . . . . . . . . . . (4,725,000) —Warrants expired . . . . . . . . . . . . . . . . . . . . . . . . . . . . . (17,825,000) (3,961,471)
Balance, March 31, 2014 . . . . . . . . . . . . . . . . . . . . . . . — —
10. Fair Value Measurements
The FASB has established a framework for measuring fair value in generally accepted accountingprinciples. That framework provides a fair value hierarchy that prioritizes the inputs to valuationtechniques used to measure fair value. The hierarchy gives the highest priority to unadjusted quotedprices in active markets for identical assets or liabilities (level 1 measurements) and the lowest priorityto unobservable inputs (level 3 measurements). The three levels of the fair value hierarchy aredescribed as follows:
Level 1. Inputs to the valuation methodology are unadjusted quoted prices for identicalassets or liabilities in active markets.
Level 2. Inputs to the valuation methodology include:
• Quoted prices for similar assets or liabilities in active markets
• Quoted prices for identical or similar assets or liabilities in inactive markets
• Inputs other than quoted prices that are observable for the asset or liability
• Inputs that are derived principally from or corroborated by observable market data bycorrelation or other means
F-26

CAPSTONE TURBINE CORPORATION AND SUBSIDIARIES
NOTES TO CONSOLIDATED FINANCIAL STATEMENTS (Continued)
10. Fair Value Measurements (Continued)
If the asset or liability has a specified (contractual) term, the level 2 input must be observable forsubstantially the full term of the asset or liability.
Level 3. Inputs to the valuation methodology are unobservable and significant to the fairvalue measurement.
The asset or liability’s fair value measurement level within the fair value hierarchy is based on thelowest level of any input that is significant to the fair value measurement. Valuation techniques usedneed to maximize the use of observable inputs and minimize the use of unobservable inputs.
The table below presents our assets and liabilities that are measured at fair value on a recurringbasis during Fiscal 2015 and are categorized using the fair value hierarchy (in thousands):
Fair Value Measurements at March 31, 2015
Quoted Prices inActive Markets Significant Other Significant
for Observable UnobservableIdentical Assets Inputs Inputs
Total (Level 1) (Level 2) (Level 3)
Cash equivalents . . . . . . . . . $13,737 $13,737 $— $—
Cash equivalents includes cash held in money market and U.S. Treasury Funds at March 31, 2014.
The table below presents our assets and liabilities that are measured at fair value on a recurringbasis during Fiscal 2014 and are categorized using the fair value hierarchy (in thousands):
Fair Value Measurements at March 31, 2014
Quoted Prices inQuoted Prices in Active Markets Significant
Active Markets for for UnobservableIdentical Assets Identical Assets Inputs
Total (Level 1) (Level 2) (Level 3)
Cash equivalents . . . . . . . . $13,737 $13,737 $— $—
Basis for Valuation
The carrying values reported in the consolidated balance sheets for cash and cash equivalents,restricted cash, accounts receivable and accounts payable approximate fair values because of theimmediate or short-term maturities of these financial instruments. As the Company’s obligations underthe Credit Facility are based on adjustable market interest rates, the Company has determined that thecarrying value approximates the fair value. The carrying values and estimated fair values of theseobligations are as follows (in thousands):
As of As ofMarch 31, 2015 March 31, 2014
Carrying Estimated Carrying EstimatedValue Fair Value Value Fair Value
Obligations under the credit facility . . . . . . $12,953 $12,953 $13,228 $13,228
F-27

CAPSTONE TURBINE CORPORATION AND SUBSIDIARIES
NOTES TO CONSOLIDATED FINANCIAL STATEMENTS (Continued)
10. Fair Value Measurements (Continued)
The Company calculated the estimated fair value of warrants on the date of issuance and at eachsubsequent reporting date using the following assumptions:
Fiscal Year EndedMarch 31, 2013
Risk-free interest rates range . . . . . . . . . . . . . . . . . . . . . . . . 0.1% to 0.2%Contractual term (in years) . . . . . . . . . . . . . . . . . . . . . . . . . 0.5 years to 1.2 yearsExpected volatility range . . . . . . . . . . . . . . . . . . . . . . . . . . . 37.2% to 65.8%
The Company has issued common stock warrants at times in the past; however, no warrants arecurrently outstanding. The Company does not enter into speculative derivative agreements and doesnot enter into derivative agreements for the purpose of hedging risks.
As discussed above, the Company adopted authoritative guidance issued by the FASB on contractsin an entity’s own equity that requires the common stock warrants to be classified as liabilities at theirestimated fair value with changes in fair value at each reporting date recognized in the statement ofoperations. The table below provides a reconciliation of the beginning and ending balances for thewarrant liability which is measured at fair value using significant unobservable inputs (Level 3) (inthousands):
Warrant liability:Balance as of March 31, 2012 . . . . . . . . . . . . . . . . . . . . . . . . . . . . . . . . . . . $ 791Total realized and unrealized (gains) losses:Income included in change in fair value of warrant liability . . . . . . . . . . . . . . (781)
Balance at March 31, 2013 . . . . . . . . . . . . . . . . . . . . . . . . . . . . . . . . . . . . . $ 10Total realized and unrealized (gains) losses:Income included in change in fair value of warrant liability . . . . . . . . . . . . . . (10)
Balance at March 31, 2014 . . . . . . . . . . . . . . . . . . . . . . . . . . . . . . . . . . . . . $ —
11. Revolving Credit Facility
The Company maintains two Credit and Security Agreements, as amended (the ‘‘Agreements’’),with Wells Fargo Bank, National Association (‘‘Wells Fargo’’), which provide the Company with a lineof credit of up to $15.0 million in the aggregate. The line of credit can be increased to an amount upto $20.0 million upon the request of the Company pursuant to the amendment described below (the‘‘Credit Facility’’). In addition, Wells Fargo has provided the Company with a non-revolving capitalexpenditure line of credit up to $0.5 million to acquire additional eligible equipment for use in theCompany’s business pursuant to the amendment described below. As of March 31, 2015, the Companyhad not requested that the maximum line amount be increased to an aggregate of $20.0 millionpursuant to the Agreements. The amount actually available to the Company may be less and may varyfrom time to time depending on, among other factors, the amount of its eligible inventory and accountsreceivable. As security for the payment and performance of the Credit Facility, the Company granted asecurity interest in favor of Wells Fargo in substantially all of the assets of the Company. One of theAgreements will terminate in accordance with its terms on September 1, 2017 and the other one willterminate on September 30, 2017.
F-28

CAPSTONE TURBINE CORPORATION AND SUBSIDIARIES
NOTES TO CONSOLIDATED FINANCIAL STATEMENTS (Continued)
11. Revolving Credit Facility (Continued)
The Agreements include affirmative covenants as well as negative covenants that prohibit a varietyof actions without Wells Fargo’s consent, including covenants that limit the Company’s ability to(a) incur or guarantee debt, (b) create liens, (c) enter into any merger, recapitalization or similartransaction or purchase all or substantially all of the assets or stock of another entity, (d) pay dividendson, or purchase, acquire, redeem or retire shares of, the Company’s capital stock, (e) sell, assign,transfer or otherwise dispose of all or substantially all of the Company’s assets, (f) change theCompany’s accounting method or (g) enter into a different line of business. Furthermore, theAgreements contain financial covenants, including (i) a requirement not to exceed specified levels oflosses, (ii) a requirement to maintain a substantial minimum cash balance relative to the outstandingline of credit advances, which was $11.8 million as of March 31, 2015, and (iii) limitations on theCompany’s annual capital expenditures. The Agreements also define an event of default to include amaterial adverse effect on the Company’s business, as determined by Wells Fargo. An event of defaultfor this or any other reason, if not waived, would have a material adverse effect on the Company.
Several times since entering into the Agreements the Company was not in compliance with certaincovenants under the Credit Facility. In connection with each event of noncompliance, Wells Fargowaived the event of default and, on several occasions, the Company amended the Agreements inresponse to the default and waiver. The following summarizes the recent events, amendments andwaivers:
• On September 16, 2014, the Company entered into a letter agreement (the ‘‘Letter Agreement’’)with Wells Fargo. The Letter Agreement extended the maturity date under the Company’sCredit and Security Agreement (Ex-Im Subfacility) from September 30, 2014 to September 1,2017. The Letter Agreement also, among other things, changed the annual facility fee due toWells Fargo under the Credit and Security Agreement (Ex-Im Subfacility) and revised thecalculation of Capstone’s borrowing base under the portion of the Credit Facility established bythe Credit and Security Agreement (Ex-Im Subfacility) to increase the borrowing limit related toinventory.
• As of September 30, 2014, the Company determined that it was not in compliance with thefinancial covenant contained in the amended Agreements regarding the Company’s annual netincome for Fiscal 2015. On November 3, 2014, the Company received from Wells Fargo a waiverof such noncompliance and entered into an amendment to amend the financial covenantsregarding net income for Fiscal 2015.
• As of March 31, 2015, the Company determined that it was not in compliance with the financialcovenant contained in the amended Agreements regarding the Company’s annual net income forFiscal 2015. On June 10, 2015, the Company received from Wells Fargo a waiver of suchnoncompliance, and the Company and Wells Fargo entered into an amendment to theAgreements which set the financial covenants for Fiscal 2016. As a condition of the amendedAgreements, the Company has restricted $5.0 million of cash effective June 10, 2015 asadditional security for the Credit Facility.
If the Company had not obtained the waivers and amended the Agreements as described above,the Company would not have been able to draw additional funds under the Credit Facility. In addition,the Company has pledged its accounts receivables, inventories, equipment, patents and other assets ascollateral for its Agreements, which would be subject to seizure by Wells Fargo if the Company were indefault under the Agreements and unable to repay the indebtedness. Wells Fargo also has the option to
F-29

CAPSTONE TURBINE CORPORATION AND SUBSIDIARIES
NOTES TO CONSOLIDATED FINANCIAL STATEMENTS (Continued)
11. Revolving Credit Facility (Continued)
terminate the Agreements or accelerate the indebtedness during a period of noncompliance. Based onthe Company’s current forecasts, the Company believes it will maintain compliance with the covenantscontained in the amended Agreements for at least the next twelve months. If a covenant violation wereto occur, the Company would attempt to negotiate a waiver of compliance from Wells Fargo.
The Company is required to maintain a Wells Fargo collection account for cash receipts on all ofits accounts receivable. These amounts are immediately applied to reduce the outstanding amount onthe Credit Facility. The floating rate for line of credit advances is the sum of daily three month LondonInter—Bank Offer Rate (‘‘LIBOR’’), which interest rate shall change whenever daily three monthLIBOR changes, plus applicable margin. Based on the revolving nature of the Company’s borrowingsand payments, the Company classifies all outstanding amounts as current liabilities. The applicablemargin varies based on net income and the minimum interest floor is set at $66,000 each calendarquarter. The Company’s borrowing rate was 4.0% at each of March 31, 2015 and March 31, 2014.
The Company is also required to pay an annual unused line fee of one-quarter of one percent ofthe daily average of the maximum line amount and 1.5% interest with respect to each letter of creditissued by Wells Fargo. These amounts, if any, are also recorded as interest expense by the Company.As of March 31, 2015 and March 31, 2014, $13.0 million and $13.2 million in borrowings wereoutstanding, respectively, under the Credit Facility. As of March 31, 2015, approximately $1.4 millionwas available for additional borrowing. Interest expense related to the Credit Facility during the yearended March 31, 2015 was $0.5 million, which includes $0.2 million in amortization of deferredfinancing costs. Interest expense related to the Credit Facility during the year ended March 31, 2014was $0.7 million, which includes $0.2 million in amortization of deferred financing costs. Interestexpense related to the Credit Facility during the year ended March 31, 2013 was $0.7 million, whichincludes $0.1 million in amortization of deferred financing costs.
12. Commitments and Contingencies
Purchase Commitments
As of March 31, 2015, the Company had firm commitments to purchase inventories ofapproximately $35.2 million through Fiscal 2018. Certain inventory delivery dates and related paymentsare not scheduled; therefore amounts under these firm purchase commitments will be payable upon thereceipt of the related inventories.
Lease Commitments
The Company leases offices and manufacturing facilities under various non-cancelable operatingleases expiring at various times through the fiscal year ending March 31, 2020. All of the leases requirethe Company to pay maintenance, insurance and property taxes. The lease agreements for primaryoffice and manufacturing facilities provide for rent escalation over the lease term and renewal optionsfor five-year periods. Rent expense is recognized on a straight-line basis over the term of the lease. Thedifference between rent expense recorded and the amount paid is credited or charged to deferred rent,which is included in other long-term liabilities in the accompanying consolidated balance sheets. Thebalance of deferred rent was approximately $0.2 million and $0.1 million as of March 31, 2015 and2014. Rent expense was approximately $2.4 million, $2.3 million and $2.1 million for the years endedMarch 31, 2015, 2014 and 2013, respectively.
F-30

CAPSTONE TURBINE CORPORATION AND SUBSIDIARIES
NOTES TO CONSOLIDATED FINANCIAL STATEMENTS (Continued)
12. Commitments and Contingencies (Continued)
On July 31, 2014, the Company and Northpark Industrial (‘‘Northpark’’) entered into a ThirdAmendment to Lease (the ‘‘Third Amendment’’) to amend the Standard Industrial/Commercial Single-Tenant Lease—Net, dated December 1, 1999, as amended (the ‘‘Lease’’), pursuant to which theCompany leases the premises located at 21211 Nordhoff Street, Chatsworth, California for use asprimary office space, engineering testing and manufacturing. The Third Amendment extended the termof the Lease for a period of two months commencing on August 1, 2014 and ending on September 30,2014 and set the monthly base rent payable by the Company under the Lease at $81,001 per month.
On September 30, 2014, the Company and Northpark entered into a Fourth Amendment to Lease(the ‘‘Fourth Amendment’’) to amend the Lease by extending the term of the Lease for a period offive years commencing on October 1, 2014 and ending on September 30, 2019. The Fourth Amendmentalso adjusts the monthly base rent payable by the Company under the Lease to the following: $39,500per month from October 1, 2014 through November 30, 2014; $79,000 per month from December 1,2014 through September 30, 2015; $81,225 per month from October 1, 2015 through September 30,2016; $83,600 per month from October 1, 2016 through September 30, 2017; $86,000 per month fromOctober 1, 2017 through September 30, 2018; and $88,500 per month from October 1, 2018 throughSeptember 30, 2019. The Fourth Amendment also provides the Company with an option to extend theLease by an additional five-year term following the expiration of the term of the Lease as amended bythe Fourth Amendment and provides that Northpark will perform certain capital improvements to theleased premises’ HVAC system.
On March 28, 2013, the Company and Prologis, L.P., formerly known as AMB Property, L.P.,entered into a third amendment (the ‘‘Van Nuys Amendment’’) to the Lease Agreement datedSeptember 25, 2000, for leased premises used by the Company for engineering testing andmanufacturing located in Van Nuys, California. The Van Nuys Amendment extends the term of theLease Agreement from December 31, 2012 to December 31, 2017. The Van Nuys Amendment alsoadjusts the monthly base rent payable by the Company under the Lease Agreement to the following:$60,000 per month from January 1, 2013 through June 30, 2015 and $65,000 per month from July 1,2015 through December 31, 2017.
At March 31, 2015, the Company’s minimum commitments under non-cancelable operating leaseswere as follows (in thousands):
OperatingYear Ending March 31, Leases
2016 . . . . . . . . . . . . . . . . . . . . . . . . . . . . . . . . . . . . . . . . . . . . . . . . . . . $1,9882017 . . . . . . . . . . . . . . . . . . . . . . . . . . . . . . . . . . . . . . . . . . . . . . . . . . . 1,8372018 . . . . . . . . . . . . . . . . . . . . . . . . . . . . . . . . . . . . . . . . . . . . . . . . . . . 1,6022019 . . . . . . . . . . . . . . . . . . . . . . . . . . . . . . . . . . . . . . . . . . . . . . . . . . . 1,0472020 . . . . . . . . . . . . . . . . . . . . . . . . . . . . . . . . . . . . . . . . . . . . . . . . . . . 531Thereafter . . . . . . . . . . . . . . . . . . . . . . . . . . . . . . . . . . . . . . . . . . . . . . . —
Total minimum lease payments . . . . . . . . . . . . . . . . . . . . . . . . . . . . . . . . $7,005
F-31

CAPSTONE TURBINE CORPORATION AND SUBSIDIARIES
NOTES TO CONSOLIDATED FINANCIAL STATEMENTS (Continued)
12. Commitments and Contingencies (Continued)
Other Commitments
In September 2010, the Company was awarded a grant from the DOE for the research,development and testing of a more efficient microturbine Combined Heat and Power (CHP) system.Part of the improved efficiency will come from an improved microturbine design, with a projectedelectrical efficiency of 42% and power output of 370 kW. The project is estimated to cost approximately$15.0 million. The DOE will contribute $5.0 million toward the project, and the Company will incurapproximately $10.0 million in research and development expense. The contract is over a five-yearperiod and will be completed by September 2015. The Company billed the DOE under the contract forthis project a cumulative amount of $3.9 million through March 31, 2015.
In May 2014, the Company began working with the DOE through Oak Ridge National Laboratory(‘‘ORNL’’) on an advanced Alumina Forming Austenitic stainless steel material program. ORNL willcontribute 100% of the project cost of $0.2 million toward the project. The contract has a term of19 months and is expected to be completed by December 30, 2015. The Company billed ORNL acumulative amount of $0.1 million under the contract for this project through March 31, 2015.
Agreements the Company has with some of its distributors require that if the Company rendersparts obsolete in inventories they own and hold in support of their obligations to serve fieldedmicroturbines, then the Company is required to replace the affected stock at no cost to the distributors.While the Company has never incurred costs or obligations for these types of replacements, it ispossible that future changes in the Company’s product technology could result and yield costs to theCompany if significant amounts of inventory are held at distributors. As of March 31, 2015, nosignificant inventories were held at distributors.
Legal Matters
From time to time, the Company may become subject to certain legal proceedings, claims andlitigation arising in the ordinary course of business. In the opinion of management, the Company is notcurrently a party to any material legal proceedings, nor is the Company aware of any pending orthreatened litigation that would have a material effect on the Company’s operating results, cash flows,financial position or results of operations should such litigation be resolved unfavorably.
13. Employee Benefit Plans
The Company maintains a defined contribution 401(k) profit-sharing plan in which all employeesare eligible to participate. Employees may contribute up to Internal Revenue Service annual limits or, ifless, 90% of their eligible compensation. Employees are fully vested in their contributions to the plan.The plan also provides for both Company matching and discretionary contributions, which aredetermined by the Board of Directors. The Company began matching 50 cents on the dollar up to 4%of the employee’s contributions in October 2006. Prior to that date, no Company contributions hadbeen made since the inception of the plan. The Company’s match vests 25% a year over four yearsstarting from the employee’s hire date. The expense recorded by the Company for the years endedMarch 31, 2015, 2014 and 2013 was approximately $0.3 million, $0.3 million and $0.2 million,respectively.
F-32

CAPSTONE TURBINE CORPORATION AND SUBSIDIARIES
NOTES TO CONSOLIDATED FINANCIAL STATEMENTS (Continued)
14. Other Current Liabilities
The Company is a party to a Development and License Agreement with Carrier Corporation(‘‘Carrier’’) regarding the payment of royalties on the sale of each of the Company’s 200 kilowatt(‘‘C200’’) microturbines. During the three months ended September 30, 2013, we reached ourrepayment threshold level and the fixed rate royalty was reduced by 50%. Carrier earned $1.6 million,$2.8 million and $4.3 million in royalties for C200 and C1000 Series system sales during the year endedMarch 31, 2015, 2014 and 2013, respectively. Earned royalties of $0.4 million and $0.6 million wereunpaid as of March 31, 2015 and March 31, 2014, respectively, and are included in accrued expenses inthe accompanying balance sheets.
15. Subsequent Events
On April 10, 2015, the Company announced that Edward I. Reich, the Executive Vice Presidentand Chief Financial Officer of the Company, would be leaving the Company to pursue otheropportunities, effective immediately. Mr. Reich will continue to serve the Company in a consultingcapacity until May 10, 2016. On April 11, 2015, Mr. Reich and the Company entered into a GeneralRelease and Separation Agreement (the ‘‘Separation Agreement’’), which provides for, among otherthings, severance payments to Mr. Reich equal to 12 months of Mr. Reich’s salary immediately prior tothe termination of his employment, payable in accordance with the Company’s regular payroll practices.The Separation Agreement also includes a general release of the Company and its affiliates byMr. Reich.
Effective June 14, 2015 the Company entered into a first amendment to the Amended andRestated Change of Control Severance Agreement with Darren R. Jamison, the Company’s Presidentand Chief Executive Officer. The first amendment extended the term of the Amended and RestatedChange of Control Severance Agreement to June 14, 2018.
F-33

SCHEDULE II
CAPSTONE TURBINE CORPORATION
VALUATION AND QUALIFYING ACCOUNTS
FOR THE YEARS ENDED MARCH 31, 2015, 2014 and 2013
(In thousands)
Accounts Receivable Allowances:
Balance, March 31, 2012 . . . . . . . . . . . . . . . . . . . . . . . . . . . . . . . . . . . . . . . . . . . . . . . . . . $ 2,228Additions charged to costs and expenses . . . . . . . . . . . . . . . . . . . . . . . . . . . . . . . . . . . . . . . 276Deductions . . . . . . . . . . . . . . . . . . . . . . . . . . . . . . . . . . . . . . . . . . . . . . . . . . . . . . . . . . . . (362)
Balance, March 31, 2013 . . . . . . . . . . . . . . . . . . . . . . . . . . . . . . . . . . . . . . . . . . . . . . . . . . $ 2,142Additions charged to costs and expenses . . . . . . . . . . . . . . . . . . . . . . . . . . . . . . . . . . . . . . . 242Deductions . . . . . . . . . . . . . . . . . . . . . . . . . . . . . . . . . . . . . . . . . . . . . . . . . . . . . . . . . . . . (138)
Balance, March 31, 2014 . . . . . . . . . . . . . . . . . . . . . . . . . . . . . . . . . . . . . . . . . . . . . . . . . . $ 2,246Additions charged to costs and expenses . . . . . . . . . . . . . . . . . . . . . . . . . . . . . . . . . . . . . . . 10,138Deductions . . . . . . . . . . . . . . . . . . . . . . . . . . . . . . . . . . . . . . . . . . . . . . . . . . . . . . . . . . . . (1,343)
Balance, March 31, 2015 . . . . . . . . . . . . . . . . . . . . . . . . . . . . . . . . . . . . . . . . . . . . . . . . . . $11,041
F-34

SIGNATURES
Pursuant to the requirements of Sections 13 or 15(d) of the Securities Exchange Act of 1934, theRegistrant has duly caused this report to be signed on its behalf by the undersigned, thereunto dulyauthorized.
CAPSTONE TURBINE CORPORATION
Date: June 15, 2015 By: /s/ JAYME L. BROOKS
Jayme L. BrooksChief Financial Officer & Chief AccountingOfficer (Principal Financial and Accounting
Officer)
KNOW ALL MEN BY THESE PRESENTS, that we, the undersigned officers and directors ofCapstone Turbine Corporation, hereby severally constitute Darren R. Jamison and Jayme L. Brooks,and each of them singly, our true and lawful attorneys with full power to them, and each of themsingly, to sign for us and in our names in the capacities indicated below, this Annual Report onForm 10-K and any and all amendments to said Form 10-K, and generally to do all such things in ournames and in our capacities as officers and directors to enable Capstone Turbine Corporation tocomply with the provisions of the Securities Exchange Act of 1934, and all requirements of theSecurities and Exchange Commission, hereby ratifying and confirming our signatures as they may besigned by our said attorneys, or any of them, to said Form 10-K and any and all amendments thereto.
Pursuant to the requirements of the Securities Exchange Act of 1934, this report has been signedbelow by the following persons on behalf of the Registrant and in the capacities and on the datesindicated.
Signature Title Date
/s/ DARREN R. JAMISON President, Chief Executive Officer and June 15, 2015Director (Principal Executive Officer)Darren R. Jamison
Chief Financial Officer and Chief/s/ JAYME L. BROOKSAccounting Officer (Principal Financial June 15, 2015
Jayme L. Brooks and Accounting Officer)
/s/ GARY D. SIMONChairman of the Board of Directors June 15, 2015
Gary D. Simon
/s/ RICHARD K. ATKINSONDirector June 15, 2015
Richard K. Atkinson
/s/ JOHN V. JAGGERSDirector June 15, 2015
John V. Jaggers
Signature Title Date
/s/ NOAM LOTANDirector June 15, 2015
Noam Lotan
/s/ GARY J. MAYODirector June 15, 2015
Gary J. Mayo
/s/ ELIOT G. PROTSCHDirector June 15, 2015
Eliot G. Protsch
/s/ HOLLY A. VAN DEURSENDirector June 15, 2015
Holly A. Van Deursen
/s/ DARRELL J. WILKDirector June 15, 2015
Darrell J. Wilk

29JUN201510283475
STOCK PERFORMANCE GRAPH
The graph below compares the cumulative total stockholder return on Capstone’s common stockwith the cumulative total return of the NASDAQ Composite Index and a peer group of smallcapitalization power technology companies (‘‘SCPT’’)(1). The stock price performance shown in thegraph below is not indicative of potential future stock price performance. Management believes that theNASDAQ Composite Index and the SCPT provide an appropriate measure of the Company’s commonstock price performance.
The graph assumes an initial investment of $100 on March 31, 2010 and reinvestment of quarterlydividends. No cash dividends have been declared on shares of the Company’s common stock.
Comparison of 5 Year Cumulative Total ReturnAmong Capstone Turbine Corporation, The NASDAQ Composite Index, and a Peer Group
$0$100$200$300$400$500$600$700$800$900
3/10 3/11 3/12 3/13 3/14 3/15
Capstone Turbine Corp. NASDAQ Composite Peer Group
* $100 invested on 3/31/10 in stock or index, including reinvestment of dividends. Fiscal year endingMarch 31.
Fiscal Year Ended
Mar-10 Mar-11 Mar-12 Mar-13 Mar-14 Mar-15
Capstone Turbine Corporation . . . . . . . . . . . . . . . . 100 143 80 71 168 51Peer Group . . . . . . . . . . . . . . . . . . . . . . . . . . . . . . 100 156 172 328 801 618NASDAQ Composite Index . . . . . . . . . . . . . . . . . . 100 117 133 144 188 220
(1) The SCPT consists of the following companies that are traded on the NASDAQ Capital Market:Active Power, Inc. (ACPW) and Plug Power, Inc. (PLUG). The SCPT also consists of FuelCellEnergy, Inc. (FCEL), which is traded on the NASDAQ Global Market, and GeneracHoldings, Inc. (GNRC), which is traded on the New York Stock Exchange.
This information shall not be deemed to be ‘‘soliciting material’’ or ‘‘filed’’ with the SEC orincorporated by reference into any filings with the SEC, or subject to the liabilities of Section 18 of theSecurities Exchange Act of 1934, except to the extent that the Company specifically requests that it betreated as soliciting material or incorporates it by reference into a document filed under the SecuritiesAct of 1933, as amended, or the Securities Exchange Act of 1934.

BOARD OF DIRECTORS Gary Simon AChairman, Capstone Turbine CorporationPresident & Chief Executive Officer, Acumentrics Corporation
Richard Atkinson A*
Non-Executive DirectorFormer Chief Financial Officer, Gradient Resources
John Jaggers C
Managing General Partner, Sevin Rosen Funds
Darren JamisonPresident & Chief Executive Officer, Capstone Turbine Corporation
Noam Lotan APresident & Chief Executive Officer, Resonate Industries, Inc.Former President & Chief Executive Officer, MRV Communications, Inc.
Gary Mayo B,C*
Non-Executive Director Former Vice President, Corporate Sustainability Strategies, MGM Resorts International
Eliot Protsch A,B
President, Wapsie Investment & Advisory, LLCFormer Chief Operating Officer & Chief Financial Officer,Alliant Energy Corporation
Holly Van Deursen B*,C
Non-Executive Director (several companies)Former Executive, BP plc/Amoco Corporation
Darrell Wilk B,C
President, Ace Label SystemsFormer Vice President, ITT Corp. Electronic Components
Committee MembershipA: Audit CommitteeB: Nominating and Corporate Governance CommitteeC: Compensation Committee
* Chairperson of Committee
EXECUTIVE OFFICERS
Darren JamisonPresident & Chief Executive Officer
Jayme BrooksChief Financial Officer & Chief Accounting Officer
James CrouseExecutive Vice President, Sales & Marketing
Richard LewisVice President, Operations
STOCK LISTING
Common Stock traded on NASDAQ: CPST
TRANSFER AGENT
Computershare, Inc.250 Royall StreetCanton, MA 02021www.computershare.com/investor
CORPORATE COUNSEL
Waller Lansden Dortch & Davis, LLP511 Union Street, Suite 2700Nashville, TN 37219www.wallerlaw.com
INDEPENDENT ACCOUNTANTS
KPMG LLP550 South Hope Street, Suite 1500Los Angeles, CA 90071
ANNUAL MEETING OF STOCKHOLDERS
The 2015 Annual Meeting of Stockholders will be held at Capstone Turbine Corporation Chatsworth headquarters on August 27, 2015 at 10:00 a.m. Pacific Time. Capstone Turbine Corporation will provide a listen only live audio webcast of the annual meeting. The listen only live audio webcast will be available via the Capstone Turbine Corporation Investor webpage at www.capstoneturbine.com/investor. A replay of the Webcast will be available on the website following the live event for 30 days.
This report contains “forward-looking statements,” as that term is used in the federal securities laws, about Capstone’s business, including statements regarding future sales and results of operations, expanded market opportunities and growth in existing markets, production expansion, improved supply chain management and operational efficiencies, advantages of our products over competing energy sources, compliance with government regulations, new product development and the success of future installations, increased revenue and backlog, the environmental advantages, reliability and efficiency of our products, growth of our aftermarket service business, lowered costs, improved gross margin, and positive EBITDA and cash flow. These forward-looking statements are subject to numerous assumptions, risks and uncertainties that may cause Capstone’s actual results to be materially different from any future results expressed or implied in such statements. These risks and uncertainties include those risks and uncertainties identified in Capstone’s filings with the Securities and Exchange Commission, including its Annual Report on Form 10-K filed on June 15, 2015. Capstone cautions you not to place undue reliance on these forward-looking statements, which speak only as of the date of this report. Capstone undertakes no obligation to revise any forward-looking statements to reflect events or circumstances occurring after the initial release of this report or to reflect the occurrence of unanticipated events.
10938_2015 Capstone Annual Report_23June.indd 22 6/24/15 11:22 AM

© 2015 Capstone Turbine Corporation. AR15 P0715
21211 Nordhoff Street | Chatsworth, California 91311Tel 818.734.5300 | Fax 818.734.5320 | Toll Free 866.422.7786www.capstoneturbine.com
10938_2015 Capstone AR_Cover.indd 2 6/24/15 11:00 AM