Embed Size (px)
Citation preview
THE STARBUCKS DATA HUNTPREDICTING STARBUCKS YELP SCORES TO FIND THE ISSUES THAT MATTER
CHRISTOPHER JOSE, 1/2017
MOTIVATION
• Executive, VIP Starbucks connoisseur who often clocks more hours at his local coffee bean hangout than even the baristas themselves
• Just like how a neighbor longs to improve their neighborhood, a coffee addict naturally wants the best for his coffee kingdom (aka caffeine drug dealer)
ISSUES AT STARBUCKS
• Lingering homeless people who smell horribly and talk to themselves
• Unclean bathrooms and overflowing garbage cans
• The “barista from hell”
• Inconsistent drink quality
OBJECTIVE
• Figure out which issues customers care more about using Yelp
•Do this by making models to predict Starbucks Yelp star scores, and then examining predictors that contribute the most to these models

YELP
• Yelp is a website that lets customers give public feedback to businesses.
• Feedback consists of written reviews and “star” scores ranging from 1 - 5
• 5=coffee nirvana, 1 = like going to a coffee slave camp

YELP DATA
• Yelp has freely provided some of its data as part of its “Yelp Dataset Challenge”
• The data consists of json files, two of which I import and convert to pandas DataFrames in Python
YELP DATA THAT I ACTUALLY USE
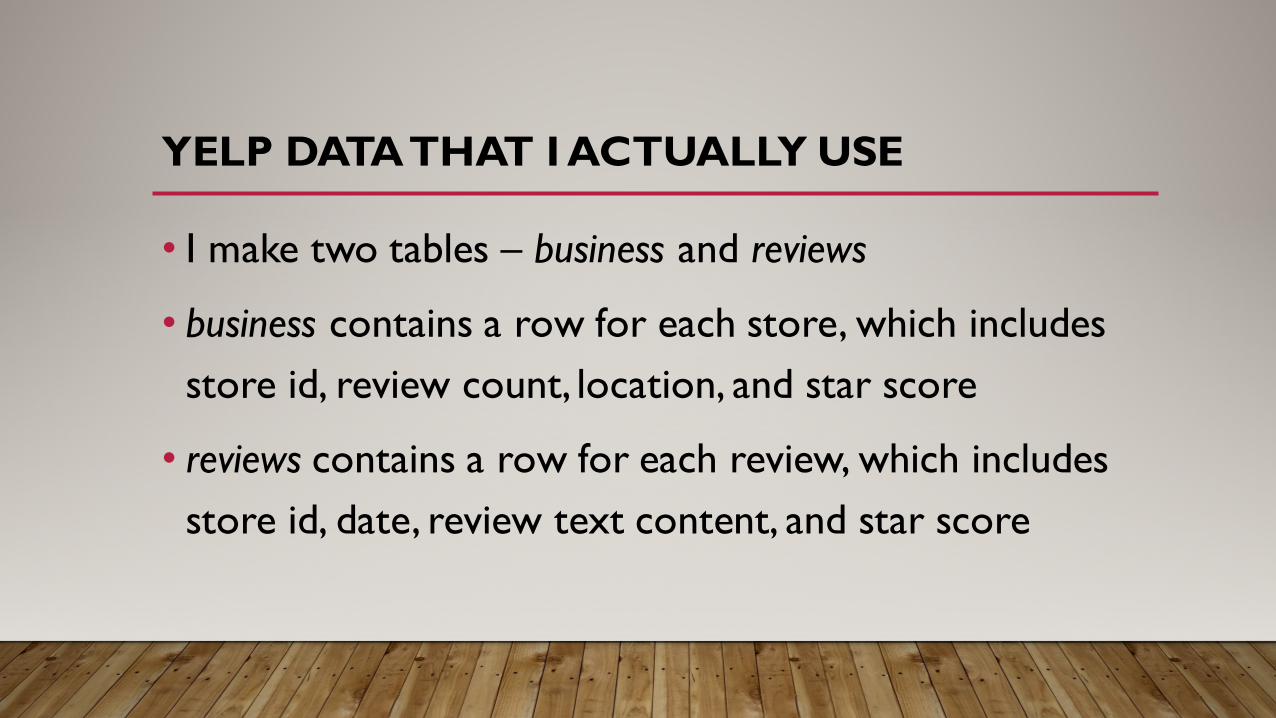
• I make two tables – business and reviews
• business contains a row for each store, which includes store id, review count, location, and star score
• reviews contains a row for each review, which includes store id, date, review text content, and star score
DATA WRANGLING
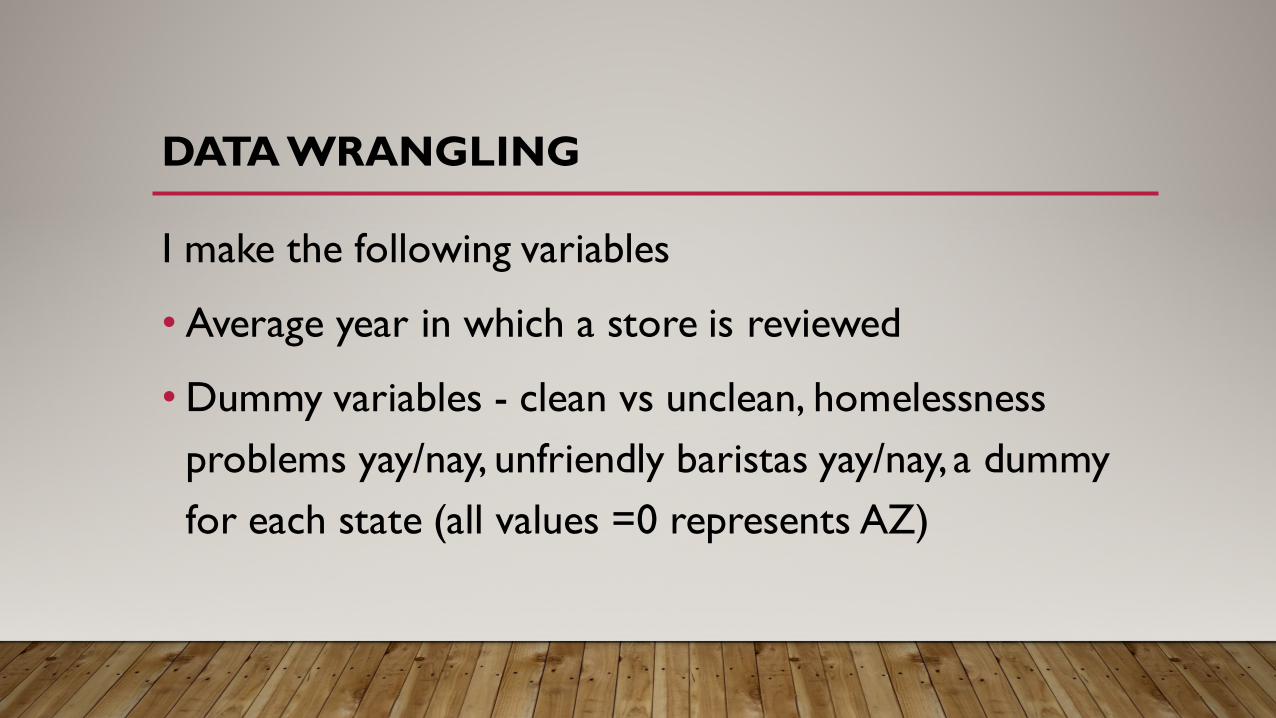
I make the following variables
• Average year in which a store is reviewed
•Dummy variables - clean vs unclean, homelessness problems yay/nay, unfriendly baristas yay/nay, a dummy for each state (all values =0 represents AZ)

EXPLORATORY DATA ANALYSIS
• 494 stores – 201 in AZ, 161 in NV
• 18 reviews per store on average
•Data is provided for only 7 states, and Canada
• Examine relationship between potential predictors and star score using statistical graphics
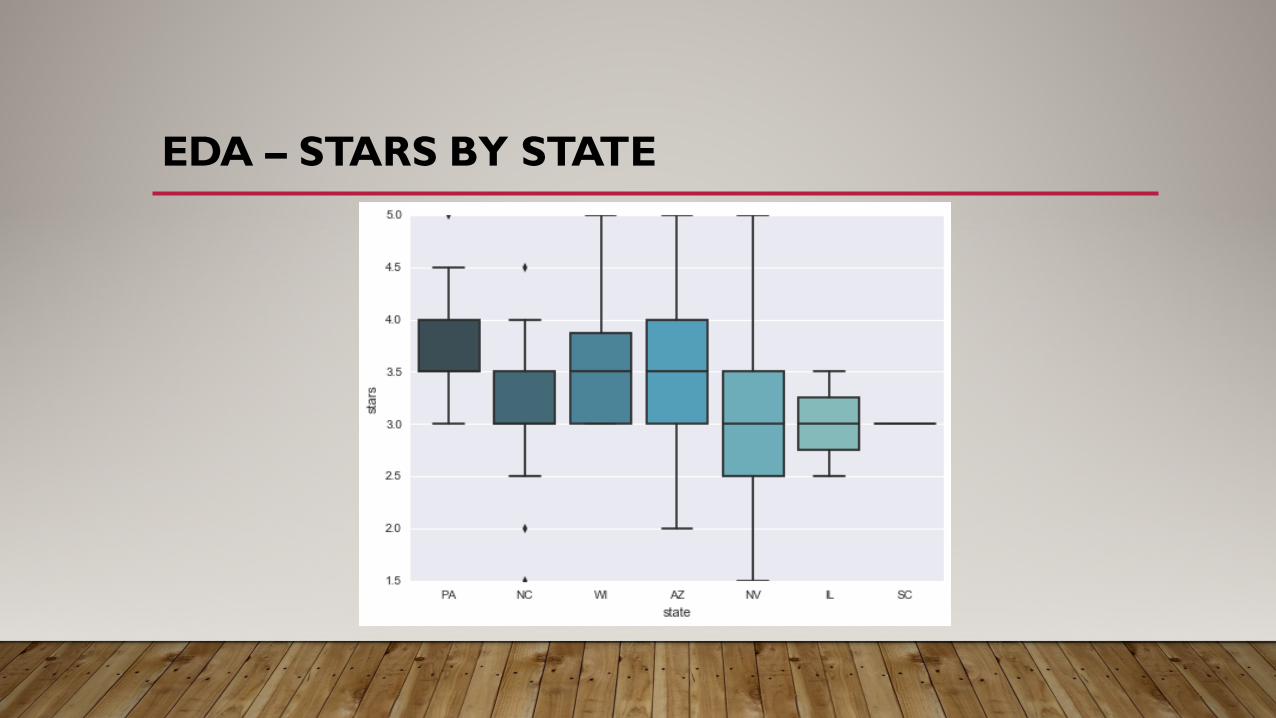
EDA – STARS BY STATE

EDA – STARS BY DUMMY VARIABLES
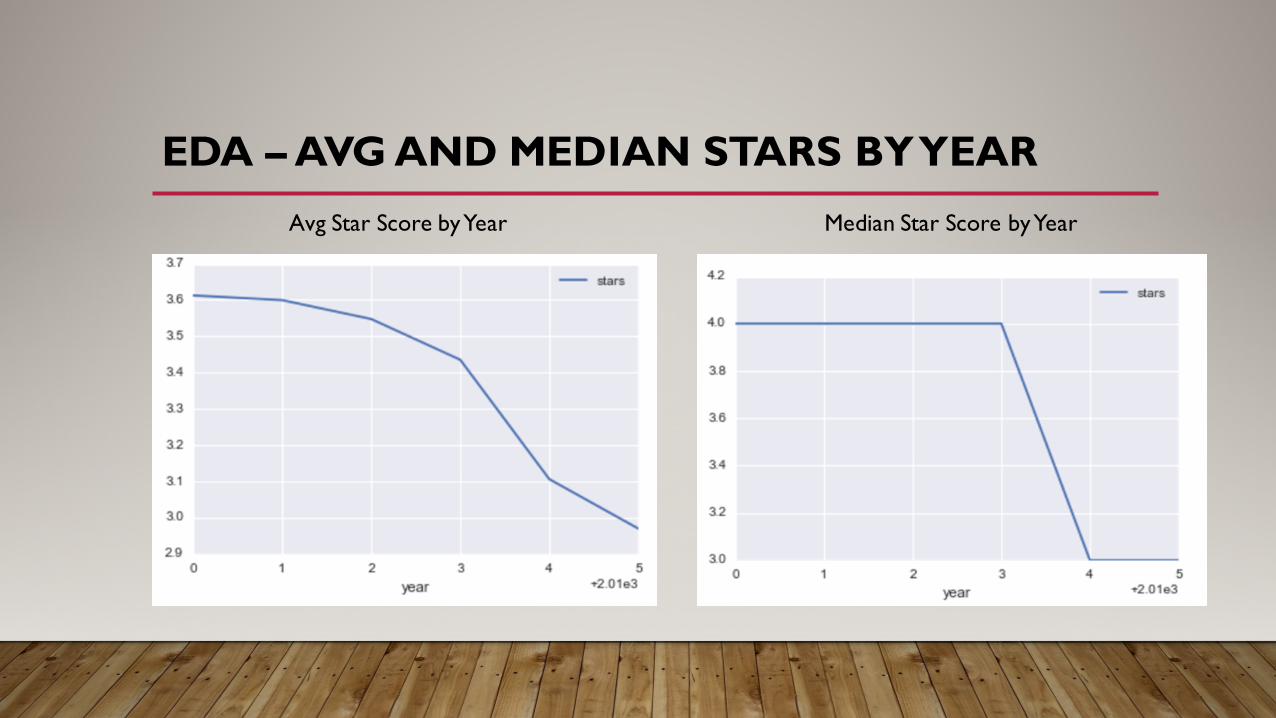
EDA – AVG AND MEDIAN STARS BY YEARAvg Star Score by Year Median Star Score by Year
PREDICTORS TO USE
•mean review year, unclean, homeless, unfriendly, state dummy variables
• review count, since it is correlated with unfriendly and unclean variables (.78, .54 correlation coefficients)

THE MODELS
• Linear Regression (LR) , Principal Component Regression (PCR), Random Forests (RF), Gradient Boosted Trees (GBT)
•Models will be compared and ranked by their root mean square error (rmse), the typical amount by which a model's predictions deviate from the actual values.
MODELING SPECIFICS
• LR and PCR built by splitting the data randomly into a 70% train split and 30% test split
• RF and GBT built using 5-fold cross validation and grid search to tune certain model parameters

LINEAR REGRESSION
• Significant coefficients at 5% level for : unclean, unfriendly, mean review year, NC, NV, and QC
• Unfriendly/Unclean stores see their predicted stars drop by .28 and .23, respectively
• rmse .6544
• Adj. R-Squared 13.7%,

PRINCIPAL COMPONENT REGRESSION
• Select 10 principal components (PCs) - 79% of variance is retained, eigenvalues close to zero are excluded
•Difficulty in interpreting resultant PCs and finding the most important variables
• rmse decreases to .645 (from .654)
• Adj. R-squared goes down to 10.8% (from 13.7%)

RANDOM FORESTS
•Grid search tunes the size of the random subset of features (max_features) used at each split to be .10
•Most important features are mean review year and review count, which does not seem interesting
• rmse is .6495 (PCR<RF<LR)

GRADIENT BOOSTED TREES
•Grid search optimizes: learning rate, tree depth, % of rows to sample while fitting model, max_features
•Most important features are again mean review year and review count
• rmse decreases to .622!

RESULTS – IMPORTANT FEATURES
• unclean, unfriendly, and state are important in LR
•mean review year and review count are important in RF and GBT
• In LR model, store cleanliness and barista friendliness are more important than homeless problems (though this model deserves further improvement)

RESULTS – PREDICTABILITY OF MODELS
RMSE
GBT .622 PCR .645
RF .649 LR .654
RMSE centered around the mean value

NEXT STEPSFURTHER RESEARCH AND RECOMMENDATIONS
• Perform more sophisticated text analysis or sentiment analysis in making existing dummy variables
• Include more variables using Yelp’s text review content
• Include more variables from data outside Yelp’s data
• Use internal Starbucks data

NEXT STEPS (CONT’D)FURTHER RESEARCH AND RECOMMENDATIONS
• Make models for subgroups of Yelp data, like a model for each state
• Make decisions from results of updated models. If drink quality is an issue, retrain baristas at stores with low star scores.
• Use predicted star score as a predictor in models that predict a metric that is correlated with star score. This would be needed for new stores or stores with little Yelp data. Use internal data as a proxy for Yelp data.

FINAL REMARKS
• Starbucks is a hub of community activity
• By improving the customer experience, we improve our communities
•Doing this also makes Starbucks more competitive and profitable. This is a win for everyone!