Embed Size (px)
Citation preview

Capital Structure of Nonprofit Organisations: A
Dynamic Framework
Yuri Khodjamirian
June, 2008
Abstract The existing literature on nonprofit capital structure is sparse and principally fo-
cuses on static theories. This paper takes a novel approach and models capital structure
in a dynamic framework, mirroring recent work in the for-profit literature. This is moti-
vated by the fact that, given the restricted nature of nonprofit organisation (NPO) capital,
it is false to assume that observed leverage ratios are optimal and instead we should model
the process as an adjustment to an organisation specific time varying target. Using a sam-
ple of 8380 US NPOs, this study presents estimates of the speed of adjustment suggesting
somewhat high adjustment costs. We also show that agency costs, financial deficit and
cash flow are important in determining target capital structure and the decision to borrow.
Acknowledgment : The author would like to thank the National Center for Charitable Statistics for providing
the data, St Catharine’s College Cambridge University for funding. Personally the author would like to thank
Professor Marc Jegers for helpful comments, Amir Girgis for discussions and Vera Schoeller for editing. This
paper is the culmination of work by the author while an undergraduate at Cambridge University and during
graduate study at the London School of Economics. E-mail address: [email protected]
1 Introduction
Scholars of the nonprofit (NP) sector would all agree with a statement made by Wedig in
1994; “The literature has abstracted away from a range of behaviours which might be termed
corporate financial in nature” (p. 258). This gap, identified by a host of other authors (Bow-
man (2002), Jegers and Vershueren (2006) (JV)), is rather surprising given the overwhelming
importance of financial decisions for the successful operation of any organisation. Therefore,
understanding financial decisions, is “central to understanding how these organisations ef-
ficiently pursue their philanthropic objective” (Wedig 1994, p. 258). Currently there are a
mere 7 papers on nonprofit capital structure which signals a serious deficit.
The major objective of this paper is to fill some of this gap by investigating empirically
and discussing theoretically the capital structure of nonprofit organisations. We first begin
with an elucidation of what makes nonprofit finance unique, as well as a discussion of ap-
plying traditional theories, based on the profit organisations (POs) literature. It is observed
that NPOs operate in an environment of incomplete markets and restricted capital which
motivates the study of leverage decisions in a dynamic framework. We derive a partial ad-
justment model and focus on understanding the process and determinants of total leverage
as well as financial leverage (where debt that takes the form of formal negotiated contracts).
Using a panel of 8380 US 501(c)(3) NPOs over the period 1988-2005 and Blundell and
Bond’s (1998) system GMM dynamic panel estimator, we find support for a model with a
modestly sluggish adjustment process. In this framework we investigate several hypothe-
ses regarding the determinants of a time varying NPO specific target. Significant among
these are financial deficit, cash flow over total assets to measure equity constraints and total
salaries over total assets as a proxy for agency costs. We extend our study of dynamics by
endogenizing the speed of adjustment to investigate whether macroeconomic factors impact
this process. Finally, observing that many NPOs do not borrow using formal financial in-
struments, we employ a fixed effects logit specification to discover which of our determinants
motivate this decision.
2
2 Capital Structure Theories - New and Old
Capital structure refers to the mixture of financing sources i.e. liabilities and assets. As the
theoretical literature on NPO capital structure is still in its infancy, initial forays into the
field have relied on existing PO theories (see surveys by Harris and Raviv (1991), Masulis
(1988)). In this section we first elucidate the unique features of NPO corporate finance
followed by a discussion of new and existing theories.
2.1 Uniqueness of Nonprofit Finance
The NPO form is generally defined through the non-distribution constraint coined by Hans-
mann (1980), stating that NPOs are precluded from distributing financial surplus from
operation. Thus, NPOs lack private ownership or stock trading on an equity market. This
constraint allows NPOs to attract private donations which are tax-deductible, as well as
being exempt from corporate profit tax and other taxes1.
Just as in POs we can distinguish between two major sources of capital - debt and equity.
Unlike in the realm of POs, we must recognise that lack of an equity market for the NPO
residual implies inherently an incomplete markets framework.
Equity
Despite the aforementioned equity gap, there are distinct internal and external sources
of equity for the NPO. The latter includes primarily donative capital that is solicited from a
well functioning philanthropy market2. In this context, Wedig(1994) develops a framework
that treats donors as equity holders and donations as external equity, where dividend is
paid out in kind3. Such dividend-in-kind is neither alienable nor perfectly substitutable for
cash dividends. Instead it provides marginal utility at a decreasing rate. However, this is a
weak metaphor as, given heterogeneous donors, dividend-in-kind is not comparable on a per
dollar invested basis and in some sense accrues automatically and not at the discretion of
3
any board. Furthermore, it is important to recognise that donative capital is often restricted
and in general the arbitrage of returns on assets of similar characteristics is meaningless,
and, therefore, so is the opportunity cost of capital.
Internal equity can take two forms. The first, which is also found in POs, is fund bal-
ance. The second, is the NPO endowment4 which consists of perpetual investments, the
returns on which are used for precautionary savings (Fisman and Hubbard (2005)) and
investment. Recognising the importance of the endowment Bowman(2002) proposes that
NPOs be thought of as holding companies - made up of an operating company and a sup-
porting mutual fund.
Debt
Both market and non-market debt constitute NPO borrowing channels. Market debt is
assessed on a commercial basis and hence investor’s required rate of return is established in
the market. Non-market debt on the other hand is mostly sourced from individuals with
close links to the NPO. Covenants and rates on such loans depend on the utility functions
of providers and will often be more generous than market rates. Market debt instruments
are similar to those found in POs and include mortgages, bank loans and regular bond
covenants. The difference is found in NPOs’ access to cheaper tax-exempt private activity
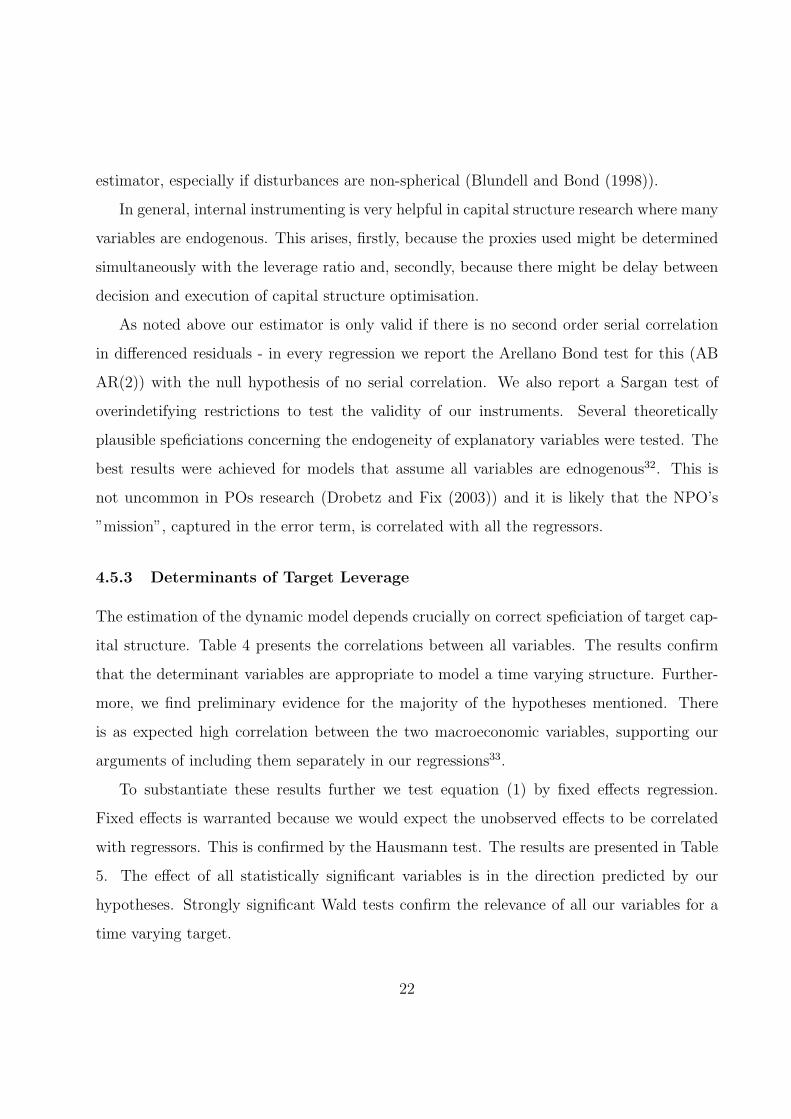
bonds5 (see Figure 1), issued through state or local authority to fund ”qualified” projects6.
In 1986 Congress restricted the volume of issues for each NPO to $150 million (hospitals
were excluded), lifting the restriction only in 1997. Figure 1 demonstrates that the total
nominal volume of issues in the US, though fluctuating due to interest rates, has grown 96%
over the period 1988-2004.
It is significant to note that Federal law barrs creditors from legally prosecuting financially
unstable NPOs, yet allows NPOs to file for voluntary bankruptcy in order to liquidate. While
such procedures are unlikely to recover lent funds they mean that NPOs are not always
solvent. Despite a virtually non-existent direct cost of bankruptcy it can be argued that
4
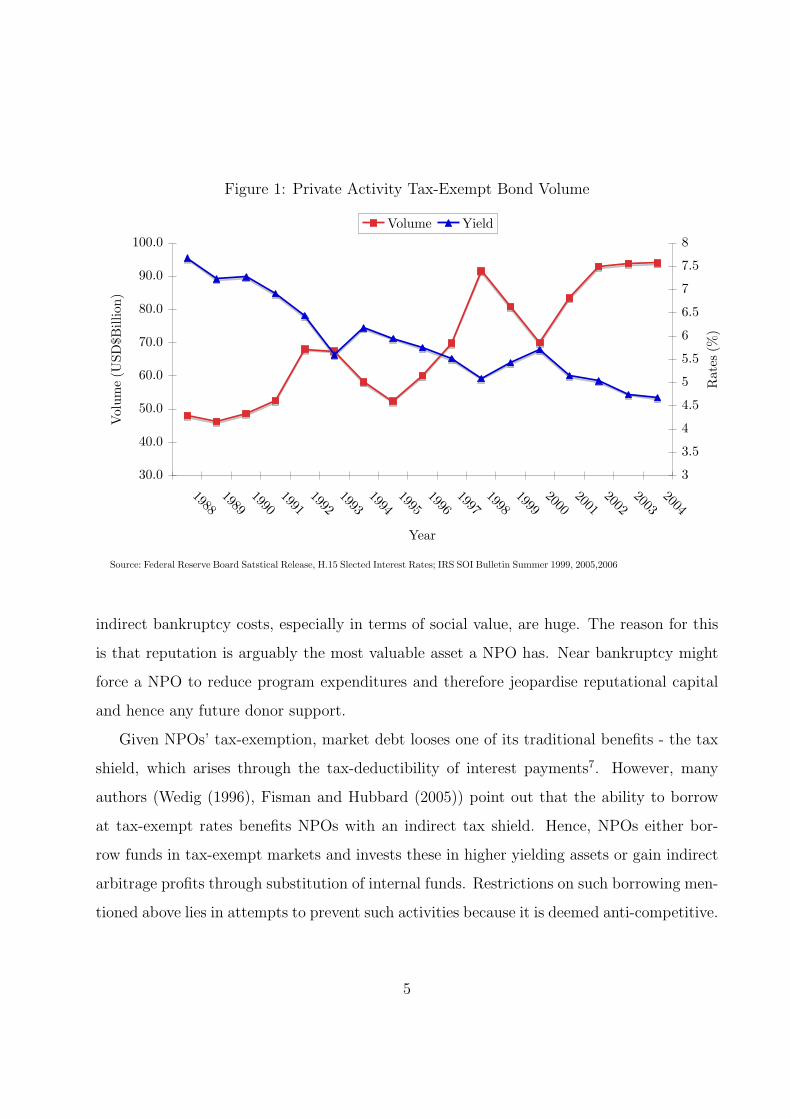
Figure 1: Private Activity Tax-Exempt Bond Volume
Sheet3 Chart 1
Page 1
Source: Federal Reserve Board Satstical Release, H.15 Slected Interest Rates; IRS SOI Bulletin Summer 1999, 2005,2006
30.0
40.0
50.0
60.0
70.0
80.0
90.0
100.0
19881989199019911992199319941995199619971998199920002001200220032004
Year
Vo
lum
e (U
SD
$Bil
lio
n)
3
3.5
4
4.5
5
5.5
6
6.5
7
7.5
8
Rat
es (
%)
Volume Yield
indirect bankruptcy costs, especially in terms of social value, are huge. The reason for this
is that reputation is arguably the most valuable asset a NPO has. Near bankruptcy might
force a NPO to reduce program expenditures and therefore jeopardise reputational capital
and hence any future donor support.
Given NPOs’ tax-exemption, market debt looses one of its traditional benefits - the tax
shield, which arises through the tax-deductibility of interest payments7. However, many
authors (Wedig (1996), Fisman and Hubbard (2005)) point out that the ability to borrow
at tax-exempt rates benefits NPOs with an indirect tax shield. Hence, NPOs either bor-
row funds in tax-exempt markets and invests these in higher yielding assets or gain indirect
arbitrage profits through substitution of internal funds. Restrictions on such borrowing men-
tioned above lies in attempts to prevent such activities because it is deemed anti-competitive.
5
2.2 Modigliani and Miller Theory for NPO
No discussion of capital structure theory can begin without considering the benchmark of
such theories in the PO world - the Modigliani Miller (1958) Proposition - that under cer-
tain conditions8 leverage is irrelevant for firm valuation. Fundamentally these conditions
specify no distortions and perfect and complete capital markets. A risk-class arbitrage proof
establishes that two firms with identical (risk adjusted) cash flows can not have differing
total value in the market. Otherwise investors can, by using “home-made” leverage, gain an
arbitrage profit. Capital structure research since the publication of this result has focused
on relaxing the conditions and investigating the interplay between leverage and firm value.
Somewhat surprisingly, no attempt has been made in the literature to apply the M&M
proposition to the realm of NPOs. The reason for this is evident from the inherent incomplete
markets nature of NPO capital structure. Hence, we can not invoke arbitrage arguments,
even if a dividend-in-kind framework can be argued for. Formally, even if debt markets are
complete, an ”investor” can not sell a “donation” like he can a share.
2.3 Static Tradeoff Theory
Once M&M assumptions9 are relaxed, the classic Static Tradeoff Theory sees POs trading
off the benefit of debt in the form of the tax-shield against the expected bankruptcy costs
of high leverage. As noted before, the NPO does not benefit from a direct debt tax-shield
and indirect bankruptcy costs are considered extremely high. Even when accounting for a
restricted indirect tax-arbitrage-shield, the large costs of debt suggest an all equity capital
structure.
However, observing positive NPO leverage ratios force a shift from classic trade-off theory
to seeking further benefits of debt issuance. A simple answer could be that, given incomplete
markets, debt is necessary to fill a funding gap. Another potential avenue lies in Agency
Theory, for example Jensen’s (1986) free cash flow hypothesis (see below).
6
2.4 Asymmetric information and the Pecking Order Theory
With the advent of information economics theorists began to apply the concepts of asymmet-
ric information to capital structure - an extremely fruitful exercise. One competing theory
claims that managers have a preference for certain forms of finance, forming a pecking order,
based on informational costs (Myers (1984)). The standard claim sees managers preferring
internal funds and only turning to debt followed by more expensive equity once these are
exhausted.
NPOs’ pecking order is only partially informed by informational concerns. Bowman
(2002) suggests the following preference in NPOs; retained earnings should be used first,
followed by borrowing and finally endowment funds. A preference for retained earnings
is explained by NPO managers being averse to default risk and having limited access to
other funding. The second preferences is explained by the indirect arbitrage arguments
above10. Finally, earnings will be preferred to endowment since conversion of assets involves
transaction costs. Jegers (1997) proposes an alternative ranking arguing that NPO’s prefer
internal funds followed by equity then debt, non-market being preferred to market debt.
Pecking order considerations are reflected below when we develop the ideas of equity and
debt constraints as well as in our discussion of agency costs.
3 Dynamic Framework
This section breaks from an elucidation of the theories behind NPO finance and analyses
capital structure behaviour in a dynamic target adjustment framework. Such models have
recently become popular in PO capital structure research (Titman and Tsyplakov (2006),
Goldstein et al (2001)). We motivate a target approach by noting that tradeoff allows an
illumination of the benefits and costs of leverage. In addition, survey evidence from POs
suggests targets are used in practice11. Furthermore, NPO adjustment costs are potentially
large because capital is often restricted e.g. from donations or tax-exempt borrowing. Thus,
7
Myers states:
“If adjustment costs are large, so that some firms take extended excursions away
from their targets, then we ought to give less attention to refining our static
tradeoff stories and relatively more to understanding what the adjustment costs
are, why they are so important and how rational managers would respond to
them” (1977 p. 587)
3.1 Model
To model this hypothesis we specify a partial target adjustment model, adopting the novel
approach of Drobetz and Wanzenried (2006), and De Miguel and Pindado (2001). We assume
that target leverage ratio for NPO i at time t is given by L∗it, which is a linear function of a
set of k explanatory variables Xjit (where j = 1, 2, ...., k) including a constant12:
L∗it =k∑
j=1
βjXjit (1)
Observed leverage ratios, given costly adjustment, evolve according to the following partial
adjustment equation:
∆Lit = λ(L∗it − Li,t−1) (2)
where λ measures the speed of adjustment to the target debt ratio. If λ > 0 (λ = 0), there is
(no) adjustment towards a target and, if λ < 1 (λ > 1), there are positive (no) adjustment
costs13. Given our discussion of potentially high adjustment costs a first hypothesis can be
formulated:
H1: NPOs will have sluggish convergence to target debt ratios implying high adjustment
costs i.e. λ substantially less than 1.
8
λ itself can also be modeled endogenously:
λit = α0 +
p∑j=1
αjQjt (3)
where α0 is a constant and Qt is a vector of p determinants of the speed of adjustment,
primarily macroeconomic variables (hence the t subscript). If all αj = 0 then adjustment
speeds are constant.
3.2 Determinants of Target Capital Structure - Xjit
Here we consider the variables that are thought to determine target capital structure, basing
our analysis on existing static models14. In what follows we present hypotheses relating to
both financial and total leverage.
Agency
NPOs suffer from agency costs similarly to PO, especially given that the nature of their
output precludes the use of incentive contracts. However, as Caers et al (2006) show, the
extent of these problems is far from clear. Many authors argue that NPO principal agent
relationships are actually described best by Stewardship Theory - which sees parties agreeing
on goals rather than the usual agency conflicts. While further discussion15 is beyond the
scope of this paper, for current purposes it suffices to assume that some forms of management
expropriation could arise in large NPOs.
We thus turn to Jensen’s free-cash flow hypothesis (mentioned in JV) in exploring how
agency problems in NPOs relate to leverage. NPO principals (the board) should issue debt
in order to tie up any cash flows above those needed for positive net present (social) value
investments. Thereby avoiding expropriation by opportunistic managers. Such borrowing
often takes the form of formal debt securities due to the ability of external monitoring by
investors. Thus,
9
H2a: NPOs with higher agency problems will have higher target leverage, ceteris paribus.
Equity Constraint
JV argue that one of the key determinants of target capital structure is the availability
of equity, or constraints on equity. These arise because, as noted by several authors (no-
tably JV and Wedig (1988)), the cost of equity for NPOs is probably lower than the cost
of debt. However, given incomplete markets equity is likely to be scarce and hence subject
to quantity constraints. If an NPO operates under tighter constraints it is likely to borrow
more to make up the funding shortfall. In this way equity constraints in some way account
for pecking order considerations, Thus
H2b: NPOs subject to stronger equity constraints are likely to have higher leverage ratios
ceteris paribus.
Borrowing Constraints
Because many NPOs face constraints imposed by capital markets borrowing is not always
an option. Amongst other reasons, such constraints are primarily related to assessment of
the creditworthiness of the organisation. Thus,
H2c: NPOs with a tighter borrowing constraints will have lower target leverage ratios, ceteris
paribus.
However given the large size of the NPOs studied in this paper, we may expect H2c not
to apply on grounds of negligible borrowing constraints
Direct/Indirect Bankruptcy Costs
While direct bankruptcy costs are low, given a lack of involuntary financial liquidation,
10

indirect costs are potentially high. Such costs will deter borrowing. Unfortunately, it is next
to impossible to measure indirect costs as this would involve estimation of social value, a
hitherto speculative exercise.
Endowment
Endowments act as buffer funds for NPOs by providing precautionary saving as well as
mitigating NPOs’ limited access to capital markets. In addition, endowment assets can be
a vehicle for acquisition of an indirect tax-shield. Gentry (2002) finds that, for hospitals,
endowment assets are positive predictors of borrowing in tax-exempt markets. The interplay
of endowment leverage ratios is complicated; higher endowment funds means lower target
leverage ratios while the presence of such funds could imply tax-arbitrage and hence a higher
ratio. Thus,
H2d: NPOs with more endowment will have lower or higher target leverage ratios, ceteris
paribus.
Fixed Assets
Fixed assets as a key determinant of creditworthiness. Firstly they provide collateral
and, secondly, a large value of fixed assets is likely to imply a history of successful debt
repayment. Hence, we would expect leverage ratios to be positively related to the level of
such assets.
H2e: NPOs with more fixed assets will have higher target leverage ratio, ceteris paribus.
Donations
Following Bowman(2002), we also investigate the effect of donations on capital structure.
While more contributions decrease the need for borrowing, a large ratio of contributions to
11
total revenue could completely change the nature of the NPO’s behaviour. JV explicitly
include dummies to account for this. Hence we can’t discern a clear effect.
H2f : NPOs that rely more on donations will have lower or higher target leverage, ceteris
paribus.
Size
In general larger NPOs have better access to capital markets but might not need further
funds. Furthermore, including size in regressions serves as a good control. Thus,
H2g: Larger NPOs will have higher target leverage, ceteris paribus.
Financial Deficit
The extent of borrowing will depend on the necessity of external funds. We thus expect
a NPO with a larger gap between available funds and those needed to cover mission related
expenses, to be more disposed to borrowing. Hence,
H2h: Larger the financial deficit the higher target leverage, ceteris paribus.
Arbitrage Rate
As we noted above NPOs often borrow at tax-exempt rates to earn an indirect arbitrage.
This can be captured by noting the difference in the yield on such bonds and the yield at-
tainable by investing the proceeds (or some internal funds) in (nearly) risk-free assets. Thus,
H2i: The higher the arbitrage spread the higher target leverage, ceteris paribus.
12
3.3 Determinants of the Speed of Adjustment to the Target Cap-
ital Structure - Qjt
Drobetz and Wanzenried (2006) show that economy wide factors, specifically the stage of
the business cycle or more precisely agent’s expectations of business cycle fluctuations, have
an impact on the speed of adjustment. In order to capture this we propose using two
macroeconomic factors - the term spread and the short term (ST) interest rate.
The term spread, defined as the spread between yields on long term and short term
US government bonds, is generally assumed to be a good predictor of the phases of future
business cycles. As argued in the literature16, a negatively (positively) sloping yield curve
is a relatively robust predictor of recessions (upswings). Generally, an economic upswing
implies higher cash flows and asset valuation, easier access to capital markets and hence
faster adjustment of capital structure.
ST rates motivate debt issuance because, firstly, debt is cheaper and, secondly, credit
market conditions are more receptive. It is also plausible to assume that NPOs time market
interest rates implying smoother adjustment when rates ST rates are lower.
The above discussion motivates the following two hypotheses. Importantly both are not
theoretically grounded and merely serve as questions posed to the data. Therefore,
H3a: Do higher term spreads imply faster adjustment speeds, ceteris paribus?
H3b: Does a higher short term rate imply slower adjustment speeds, ceteris paribus?
4 Empirical Analysis
4.1 Empirical Literature
The empirical research on NPO capital structure is severely lacking, not extending far beyond
the two major papers that we have so far been drawing on. The first, Bowman (2002), tests,
13
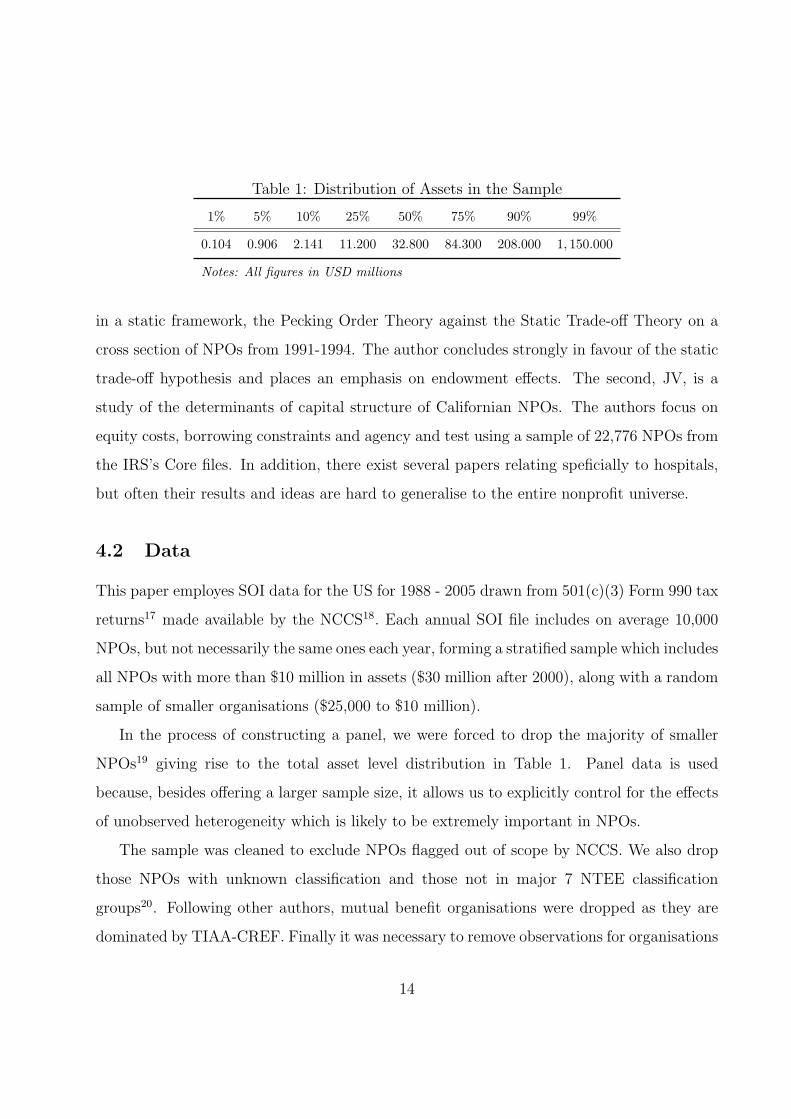
Table 1: Distribution of Assets in the Sample
1% 5% 10% 25% 50% 75% 90% 99%
0.104 0.906 2.141 11.200 32.800 84.300 208.000 1, 150.000
Notes: All figures in USD millions
in a static framework, the Pecking Order Theory against the Static Trade-off Theory on a
cross section of NPOs from 1991-1994. The author concludes strongly in favour of the static
trade-off hypothesis and places an emphasis on endowment effects. The second, JV, is a
study of the determinants of capital structure of Californian NPOs. The authors focus on
equity costs, borrowing constraints and agency and test using a sample of 22,776 NPOs from
the IRS’s Core files. In addition, there exist several papers relating speficially to hospitals,
but often their results and ideas are hard to generalise to the entire nonprofit universe.
4.2 Data
This paper employes SOI data for the US for 1988 - 2005 drawn from 501(c)(3) Form 990 tax
returns17 made available by the NCCS18. Each annual SOI file includes on average 10,000
NPOs, but not necessarily the same ones each year, forming a stratified sample which includes
all NPOs with more than $10 million in assets ($30 million after 2000), along with a random
sample of smaller organisations ($25,000 to $10 million).
In the process of constructing a panel, we were forced to drop the majority of smaller
NPOs19 giving rise to the total asset level distribution in Table 1. Panel data is used
because, besides offering a larger sample size, it allows us to explicitly control for the effects
of unobserved heterogeneity which is likely to be extremely important in NPOs.
The sample was cleaned to exclude NPOs flagged out of scope by NCCS. We also drop
those NPOs with unknown classification and those not in major 7 NTEE classification
groups20. Following other authors, mutual benefit organisations were dropped as they are
dominated by TIAA-CREF. Finally it was necessary to remove observations for organisations
14
that had errors in their statements21. For statistical reasons, extreme values of observations
of the key variables were removed22. All dollar values were deflated using a implicit price
deflator23. Finally, in order to apply our dynamic framework it was necessary to exclude
organisations for which we had less than 10 years of observations. The final sample contains
an unbalanced panel of 8380 NPOs over an average 14.8 years, giving 124,177 observations.
4.3 Variables
In this section we describe how each of the determinants and variables alluded to above are
measured. All values are end of fiscal year. It is important to note at this stage the proxy
nature of most of the variables; this is very common in capital structure research.
4.3.1 Dependent Variables
Leverage
Capital structure (Lev) is defined as:
Lev = total liabilities24/total assets
These variables are inevitably reported at book value. The existence of market values
for most of them is not even conceivable25. This variable, as pointed out in JV, is noisy as
certain assets and liabilities accrue automatically.
Financial Leverage
Following JV we also use financial leverage defined as
FLev = (Tax-exempt bonds + Mortgages and notes payable)/total assets
which measures borrowing ratios that involve formal financial contracts. Firstly, the value of
tax-exempt bond liabilities is only available in our data from 1993 onwards. Secondly, since
over 34.14% of our sample report no financial leverage, we run regressions only on non-zero
15
values of this variable. This leaves a second unbalanced panel of 6386 NPOs, totaling 57,552
observations.
We also define a dummy variable FlevD which takes the value of 1 if financial leverage is
positive and 0 otherwise. We use the latter variable in our investigating of the determinants
of formal borrowing.
4.3.2 Explanatory Variables
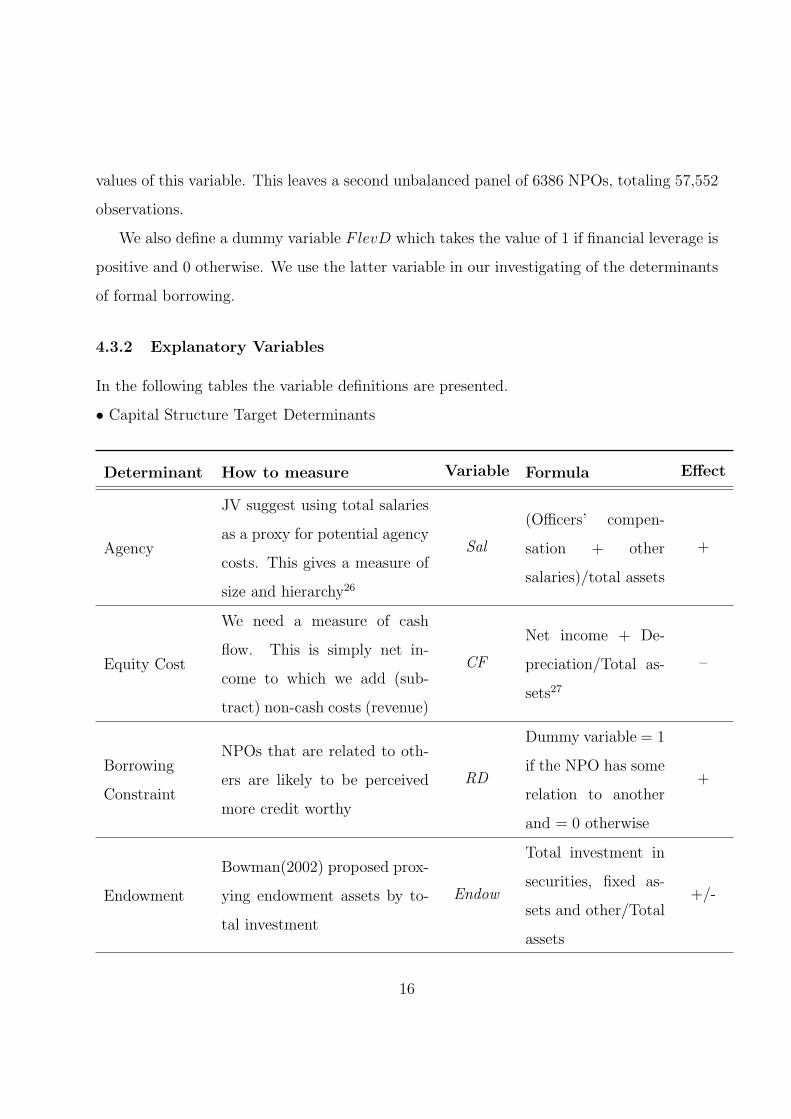
In the following tables the variable definitions are presented.
• Capital Structure Target Determinants
Determinant How to measure Variable Formula Effect
Agency
JV suggest using total salaries
as a proxy for potential agency
costs. This gives a measure of
size and hierarchy26
Sal
(Officers’ compen-
sation + other
salaries)/total assets
+
Equity Cost
We need a measure of cash
flow. This is simply net in-
come to which we add (sub-
tract) non-cash costs (revenue)
CF
Net income + De-
preciation/Total as-
sets27
–
Borrowing
Constraint
NPOs that are related to oth-
ers are likely to be perceived
more credit worthy
RD
Dummy variable = 1
if the NPO has some
relation to another
and = 0 otherwise
+
Endowment
Bowman(2002) proposed prox-
ying endowment assets by to-
tal investment
Endow
Total investment in
securities, fixed as-
sets and other/Total
assets
+/-
16
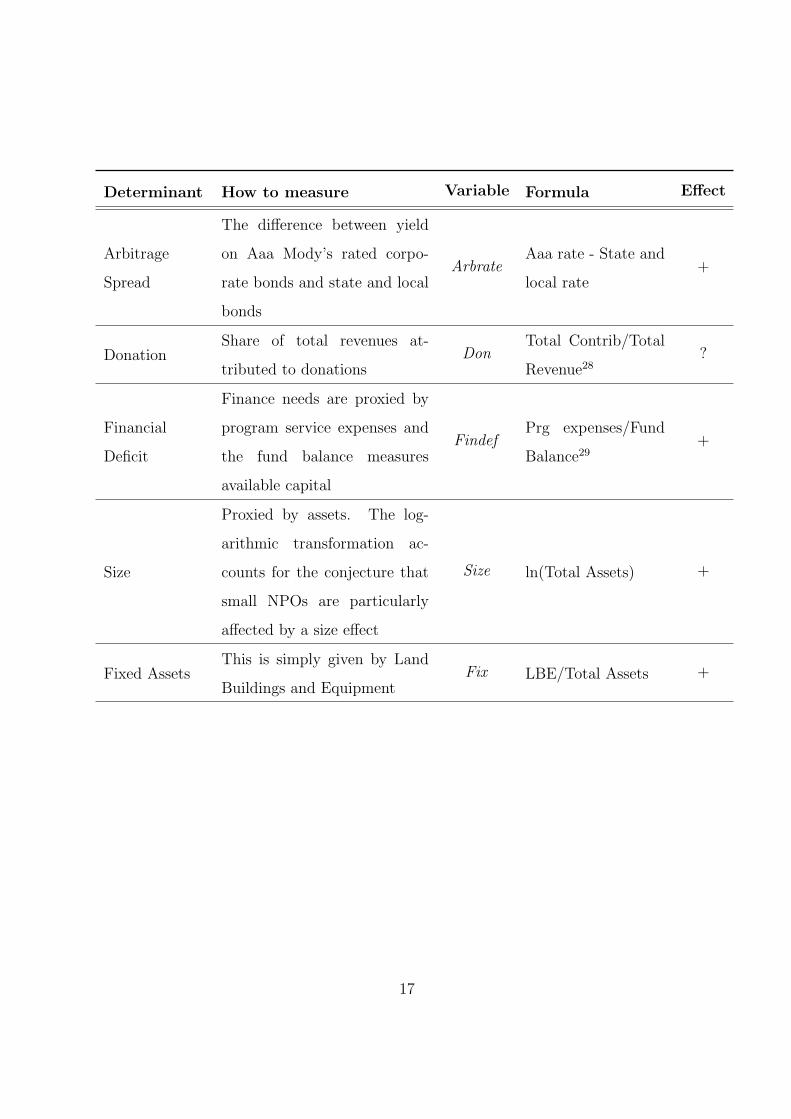
Determinant How to measure Variable Formula Effect
Arbitrage
Spread
The difference between yield
on Aaa Mody’s rated corpo-
rate bonds and state and local
bonds
ArbrateAaa rate - State and
local rate+
DonationShare of total revenues at-
tributed to donationsDon
Total Contrib/Total
Revenue28?
Financial
Deficit
Finance needs are proxied by
program service expenses and
the fund balance measures
available capital
FindefPrg expenses/Fund
Balance29+
Size
Proxied by assets. The log-
arithmic transformation ac-
counts for the conjecture that
small NPOs are particularly
affected by a size effect
Size ln(Total Assets) +
Fixed AssetsThis is simply given by Land
Buildings and EquipmentFix LBE/Total Assets +
17
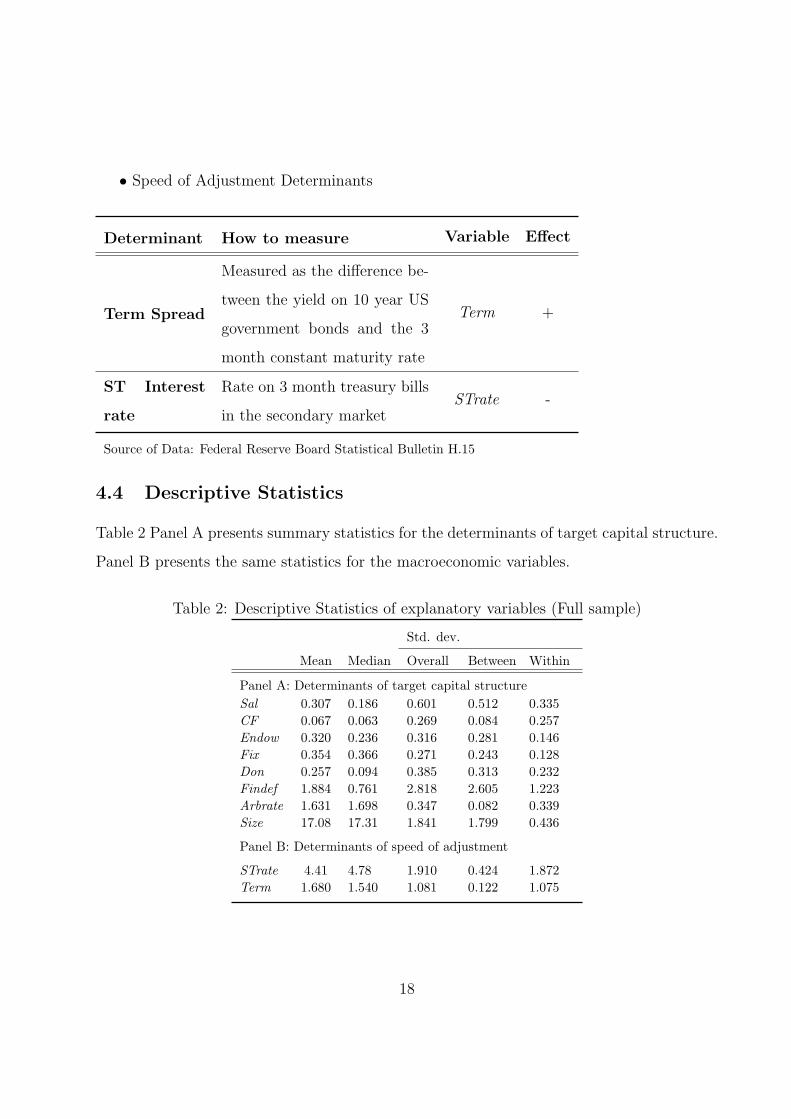
• Speed of Adjustment Determinants
Determinant How to measure Variable Effect
Term Spread
Measured as the difference be-
tween the yield on 10 year US
government bonds and the 3
month constant maturity rate
Term +
ST Interest
rate
Rate on 3 month treasury bills
in the secondary marketSTrate -
Source of Data: Federal Reserve Board Statistical Bulletin H.15
4.4 Descriptive Statistics
Table 2 Panel A presents summary statistics for the determinants of target capital structure.
Panel B presents the same statistics for the macroeconomic variables.
Table 2: Descriptive Statistics of explanatory variables (Full sample)
Std. dev.
Mean Median Overall Between Within
Panel A: Determinants of target capital structureSal 0.307 0.186 0.601 0.512 0.335CF 0.067 0.063 0.269 0.084 0.257Endow 0.320 0.236 0.316 0.281 0.146Fix 0.354 0.366 0.271 0.243 0.128Don 0.257 0.094 0.385 0.313 0.232Findef 1.884 0.761 2.818 2.605 1.223Arbrate 1.631 1.698 0.347 0.082 0.339Size 17.08 17.31 1.841 1.799 0.436
Panel B: Determinants of speed of adjustment
STrate 4.41 4.78 1.910 0.424 1.872Term 1.680 1.540 1.081 0.122 1.075
18
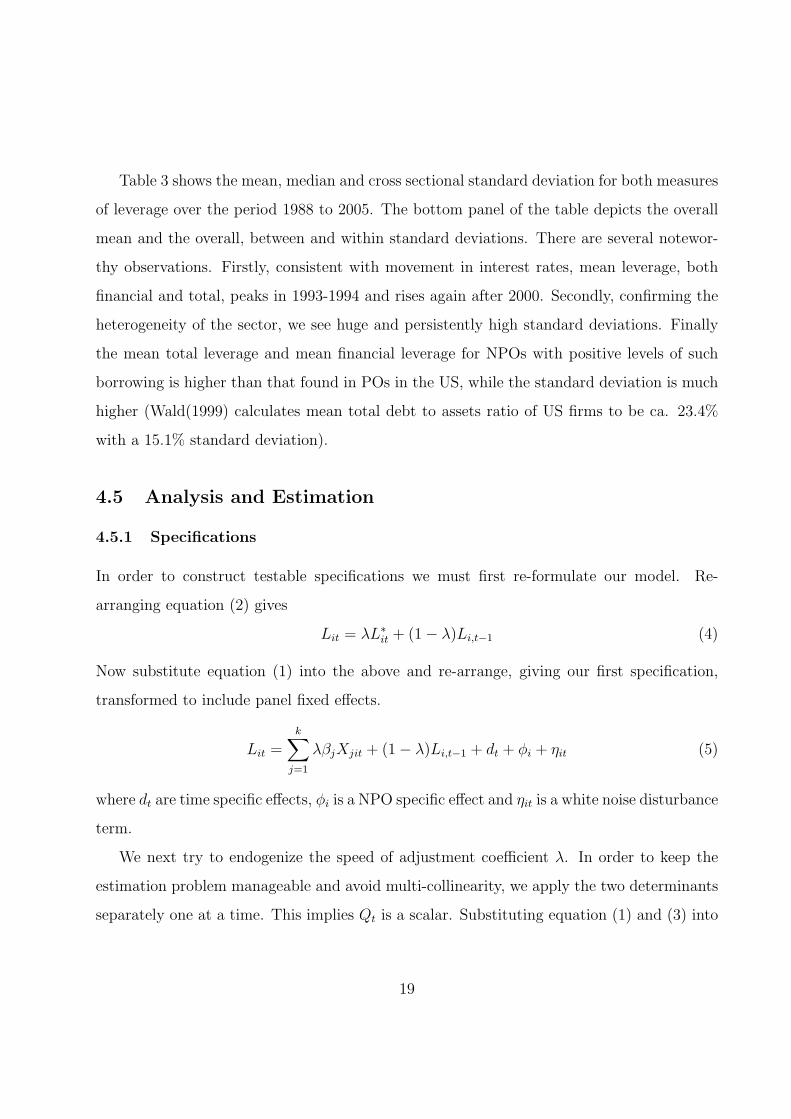
Table 3 shows the mean, median and cross sectional standard deviation for both measures
of leverage over the period 1988 to 2005. The bottom panel of the table depicts the overall
mean and the overall, between and within standard deviations. There are several notewor-
thy observations. Firstly, consistent with movement in interest rates, mean leverage, both
financial and total, peaks in 1993-1994 and rises again after 2000. Secondly, confirming the
heterogeneity of the sector, we see huge and persistently high standard deviations. Finally
the mean total leverage and mean financial leverage for NPOs with positive levels of such
borrowing is higher than that found in POs in the US, while the standard deviation is much
higher (Wald(1999) calculates mean total debt to assets ratio of US firms to be ca. 23.4%
with a 15.1% standard deviation).
4.5 Analysis and Estimation
4.5.1 Specifications
In order to construct testable specifications we must first re-formulate our model. Re-
arranging equation (2) gives
Lit = λL∗it + (1− λ)Li,t−1 (4)
Now substitute equation (1) into the above and re-arrange, giving our first specification,
transformed to include panel fixed effects.
Lit =k∑
j=1
λβjXjit + (1− λ)Li,t−1 + dt + φi + ηit (5)
where dt are time specific effects, φi is a NPO specific effect and ηit is a white noise disturbance
term.
We next try to endogenize the speed of adjustment coefficient λ. In order to keep the
estimation problem manageable and avoid multi-collinearity, we apply the two determinants
separately one at a time. This implies Qt is a scalar. Substituting equation (1) and (3) into
19
Table 3: Descriptive Statistics of Leverage
Lev (8390 groups)
Year Mean Median SD.1988 36.88 28.60 35.121989 37.67 29.80 35.901990 38.61 30.95 37.261991 39.75 32.52 36.47 FLev (8107 groups) Flev (> 0) (6386 groups)1992 40.04 33.24 35.28 Mean Median SD. Mean Median SD.1993 40.15 33.31 35.13 23.47 8.63 32.29 37.95 32.97 33.711994 40.49 34.11 35.11 21.14 9.26 27.78 31.81 25.62 28.661995 39.54 32.49 35.88 20.58 9.12 28.05 30.94 24.38 29.361996 38.11 30.69 35.93 19.98 8.32 31.17 30.29 23.60 34.071997 37.43 29.41 36.41 19.41 7.92 27.00 29.83 23.04 28.461998 37.55 29.36 37.60 19.42 7.45 27.50 30.34 23.53 29.161999 37.50 29.32 36.32 19.66 7.96 27.74 30.42 23.62 29.382000 37.77 29.53 36.84 20.06 9.07 28.01 30.73 23.82 29.562001 38.72 30.14 39.72 20.28 9.82 27.58 30.78 24.20 28.842002 39.86 32.11 38.52 20.87 10.88 27.38 31.33 25.26 28.242003 39.84 32.14 38.90 20.89 11.13 28.81 31.38 25.31 30.292004 39.45 31.73 40.34 20.54 11.19 27.11 30.74 25.05 28.052005 37.25 30.81 33.88 19.83 12.10 25.14 28.47 23.28 25.73
Lev Flev Flev (> 0)
Overall Mean 38.73 20.31 30.83Overall Median 31.10 9.42 24.40Overall Std. dev. 36.82 28.01 29.43Between Std. dev. 33.90 25.96 27.46Within Std. dev. 16.26 11.14 11.61
Notes: All numbers are expressed as %; SD. denotes standard deviation
equation (4) gives:
Lit = (α0 + α1Qt)k∑
j=1
βjXjit + (1− α0 + α1Qt)Li,t−1 + uit (6)
Multiplying out, results in our second specification:
Lit = (1− α0)Li,t−1 + α1QtLi,t−1 + α0
k∑j=1
βjXjit +k∑
j=1
βjα1QtXjit + dt + φi + uit (7)
where φit and dt are as above and uit is a white noise error term. In this equation, as noted
20
before, we are mainly interested in the coefficient on the interaction term QtLi,t−1, namely
α1.
4.5.2 Estimation Technique
The basic problem with estimating our models, containing a lagged dependent variable,
is that the traditional OLS and panel estimators will be inconsistent30. Hence we apply
a different approach. We first difference the data to help remove the NPO specific time
invariant effect, φi. This still leaves the problem that the lagged dependent variable is
endogenous since ∆Li,t−1 = Li,t−1 − Li,t−2 correlates with the ηi,t−1 in ∆ηit = ηit − ηi,t−1.
This problem suggests a instrumental variable approach.
Arellano and Bond (1991) suggest a method that employs deeper lags of the level variables
as instruments and a Generalised Method of Momements (GMM) framework to obtain a
consistent estimator - Dif-GMM estimator. Although Dif-GMM is superior, recent work has
shown it suffers from the problem of weak instruments as it ignores information concerning
the parameters in the level variables (Arellano and Bover (1995)). A better estimator,
developed in Blundell and Bond (1998) proposes using instruments in first differences for
the equation in levels and instruments in levels for equation in first difference forming a
system GMM estimator (sys-GMM). This has several advantages primarily in that it is
more efficient that the Dif-GMM estimator if the dependent variable is persistent (which is
likely to be the case of leverage (Drobetz and Wanzenried (2006), Antonious et al (2008)).
In addition, because two equations are estimated, apart from controlling for individual fixed
effects, variations among firms can be partially retained. Therefore, following Antonious et
al (2008) and Lemmon et al (2007), we adopt this estimator for our dynamic model.
In our regressions we use the two step version, which use one-step residuals to construct
asymptotically optimal weighting matrices. We also invoke the Windmeijer (2005) adjust-
ment to correct the standard errors for downward bias31. Windmeijer (2005) shows that
the two-step estimator with corrected standard errors is modestly superior to the one-step
21
estimator, especially if disturbances are non-spherical (Blundell and Bond (1998)).
In general, internal instrumenting is very helpful in capital structure research where many
variables are endogenous. This arises, firstly, because the proxies used might be determined
simultaneously with the leverage ratio and, secondly, because there might be delay between
decision and execution of capital structure optimisation.
As noted above our estimator is only valid if there is no second order serial correlation
in differenced residuals - in every regression we report the Arellano Bond test for this (AB
AR(2)) with the null hypothesis of no serial correlation. We also report a Sargan test of
overindetifying restrictions to test the validity of our instruments. Several theoretically
plausible speficiations concerning the endogeneity of explanatory variables were tested. The
best results were achieved for models that assume all variables are ednogenous32. This is
not uncommon in POs research (Drobetz and Fix (2003)) and it is likely that the NPO’s
”mission”, captured in the error term, is correlated with all the regressors.
4.5.3 Determinants of Target Leverage
The estimation of the dynamic model depends crucially on correct speficiation of target cap-
ital structure. Table 4 presents the correlations between all variables. The results confirm
that the determinant variables are appropriate to model a time varying structure. Further-
more, we find preliminary evidence for the majority of the hypotheses mentioned. There
is as expected high correlation between the two macroeconomic variables, supporting our
arguments of including them separately in our regressions33.
To substantiate these results further we test equation (1) by fixed effects regression.
Fixed effects is warranted because we would expect the unobserved effects to be correlated
with regressors. This is confirmed by the Hausmann test. The results are presented in Table
5. The effect of all statistically significant variables is in the direction predicted by our
hypotheses. Strongly significant Wald tests confirm the relevance of all our variables for a
time varying target.
22
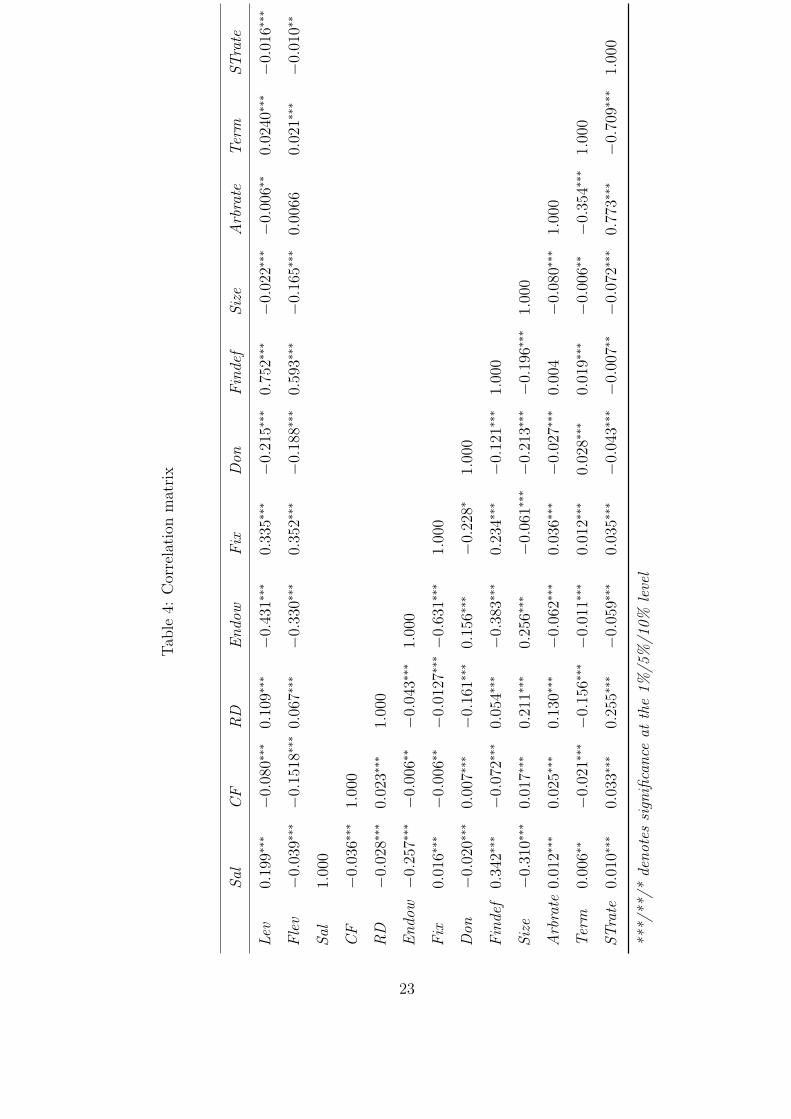
Tab
le4:
Cor
rela
tion
mat
rix
Sal
CF
RD
En
dow
Fix
Don
Fin
def
Siz
eA
rbra
teT
erm
ST
rate
Lev
0.19
9∗∗∗
−0.
080∗
∗∗0.
109∗
∗∗−
0.43
1∗∗∗
0.33
5∗∗∗
−0.
215∗
∗∗0.
752∗
∗∗−
0.02
2∗∗∗
−0.
006∗
∗0.
0240
∗∗∗
−0.
016∗
∗∗
Fle
v−
0.03
9∗∗∗
−0.
1518
∗∗∗
0.06
7∗∗∗
−0.
330∗
∗∗0.
352∗
∗∗−
0.18
8∗∗∗
0.59
3∗∗∗
−0.
165∗
∗∗0.
0066
0.02
1∗∗∗
−0.
010∗
∗
Sal
1.00
0
CF
−0.
036∗
∗∗1.
000
RD
−0.
028∗
∗∗0.
023∗
∗∗1.
000
En
dow
−0.
257∗
∗∗−
0.00
6∗∗
−0.
043∗
∗∗1.
000
Fix
0.01
6∗∗∗
−0.
006∗
∗−
0.01
27∗∗∗−
0.63
1∗∗∗
1.00
0
Don
−0.
020∗
∗∗0.
007∗
∗∗−
0.16
1∗∗∗
0.15
6∗∗∗
−0.
228∗
1.00
0
Fin
def
0.34
2∗∗∗
−0.
072∗
∗∗0.
054∗
∗∗−
0.38
3∗∗∗
0.23
4∗∗∗
−0.
121∗
∗∗1.
000
Siz
e−
0.31
0∗∗∗
0.01
7∗∗∗
0.21
1∗∗∗
0.25
6∗∗∗
−0.
061∗
∗∗−
0.21
3∗∗∗
−0.
196∗
∗∗1.
000
Arb
rate
0.01
2∗∗∗
0.02
5∗∗∗
0.13
0∗∗∗
−0.
062∗
∗∗0.
036∗
∗∗−
0.02
7∗∗∗
0.00
4−
0.08
0∗∗∗
1.00
0
Ter
m0.
006∗
∗−
0.02
1∗∗∗
−0.
156∗
∗∗−
0.01
1∗∗∗
0.01
2∗∗∗
0.02
8∗∗∗
0.01
9∗∗∗
−0.
006∗
∗−
0.35
4∗∗∗
1.00
0
ST
rate
0.01
0∗∗∗
0.03
3∗∗∗
0.25
5∗∗∗
−0.
059∗
∗∗0.
035∗
∗∗−
0.04
3∗∗∗
−0.
007∗
∗−
0.07
2∗∗∗
0.77
3∗∗∗
−0.
709∗
∗∗1.
000
***/
**/*
den
otes
sign
ifica
nce
atth
e1%
/5%
/10%
leve
l
23
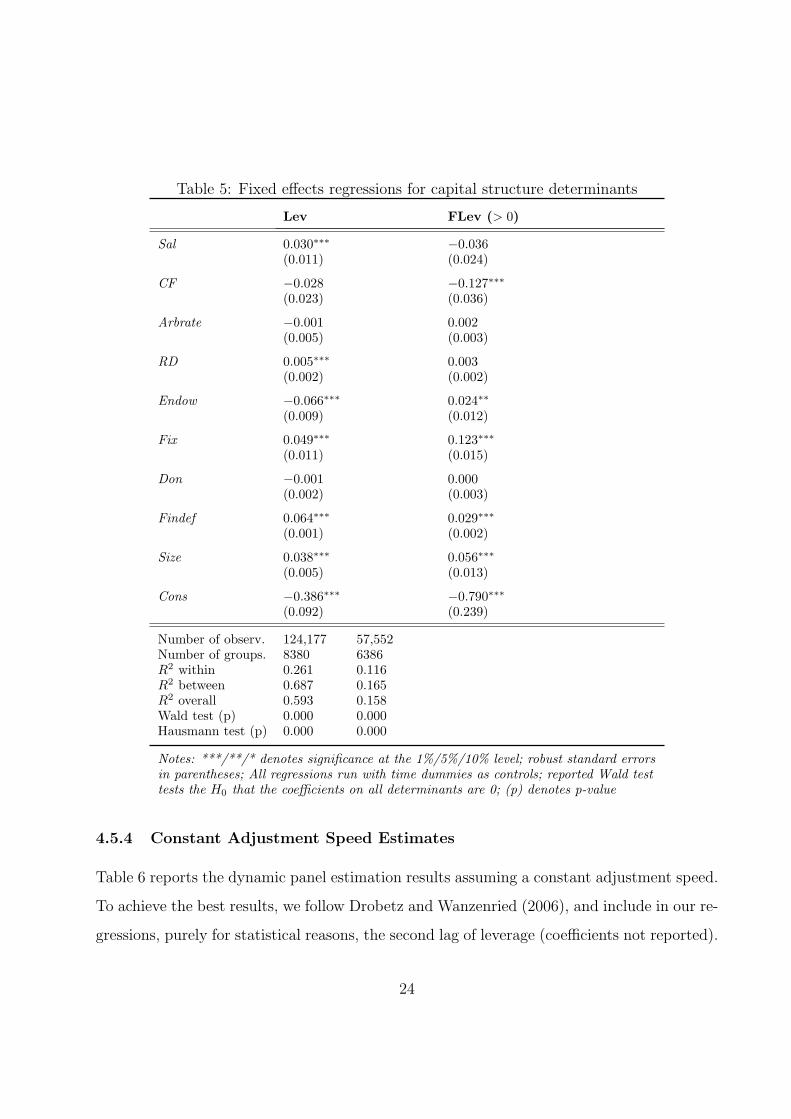
Table 5: Fixed effects regressions for capital structure determinants
Lev FLev (> 0)
Sal 0.030∗∗∗ −0.036(0.011) (0.024)
CF −0.028 −0.127∗∗∗(0.023) (0.036)
Arbrate −0.001 0.002(0.005) (0.003)
RD 0.005∗∗∗ 0.003(0.002) (0.002)
Endow −0.066∗∗∗ 0.024∗∗(0.009) (0.012)
Fix 0.049∗∗∗ 0.123∗∗∗(0.011) (0.015)
Don −0.001 0.000(0.002) (0.003)
Findef 0.064∗∗∗ 0.029∗∗∗(0.001) (0.002)
Size 0.038∗∗∗ 0.056∗∗∗(0.005) (0.013)
Cons −0.386∗∗∗ −0.790∗∗∗(0.092) (0.239)
Number of observ. 124,177 57,552Number of groups. 8380 6386R2 within 0.261 0.116R2 between 0.687 0.165R2 overall 0.593 0.158Wald test (p) 0.000 0.000Hausmann test (p) 0.000 0.000
Notes: ***/**/* denotes significance at the 1%/5%/10% level; robust standard errorsin parentheses; All regressions run with time dummies as controls; reported Wald testtests the H0 that the coefficients on all determinants are 0; (p) denotes p-value
4.5.4 Constant Adjustment Speed Estimates
Table 6 reports the dynamic panel estimation results assuming a constant adjustment speed.
To achieve the best results, we follow Drobetz and Wanzenried (2006), and include in our re-
gressions, purely for statistical reasons, the second lag of leverage (coefficients not reported).
24
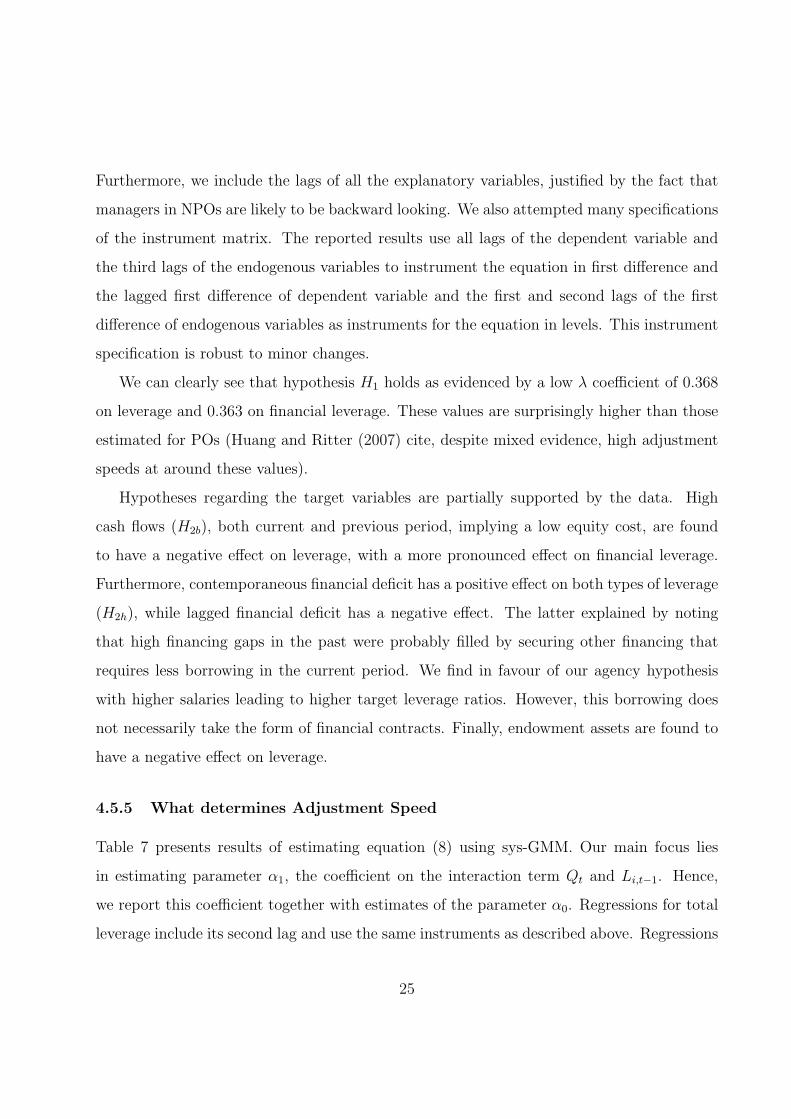
Furthermore, we include the lags of all the explanatory variables, justified by the fact that
managers in NPOs are likely to be backward looking. We also attempted many specifications
of the instrument matrix. The reported results use all lags of the dependent variable and
the third lags of the endogenous variables to instrument the equation in first difference and
the lagged first difference of dependent variable and the first and second lags of the first
difference of endogenous variables as instruments for the equation in levels. This instrument
specification is robust to minor changes.
We can clearly see that hypothesis H1 holds as evidenced by a low λ coefficient of 0.368
on leverage and 0.363 on financial leverage. These values are surprisingly higher than those
estimated for POs (Huang and Ritter (2007) cite, despite mixed evidence, high adjustment
speeds at around these values).
Hypotheses regarding the target variables are partially supported by the data. High
cash flows (H2b), both current and previous period, implying a low equity cost, are found
to have a negative effect on leverage, with a more pronounced effect on financial leverage.
Furthermore, contemporaneous financial deficit has a positive effect on both types of leverage
(H2h), while lagged financial deficit has a negative effect. The latter explained by noting
that high financing gaps in the past were probably filled by securing other financing that
requires less borrowing in the current period. We find in favour of our agency hypothesis
with higher salaries leading to higher target leverage ratios. However, this borrowing does
not necessarily take the form of financial contracts. Finally, endowment assets are found to
have a negative effect on leverage.
4.5.5 What determines Adjustment Speed
Table 7 presents results of estimating equation (8) using sys-GMM. Our main focus lies
in estimating parameter α1, the coefficient on the interaction term Qt and Li,t−1. Hence,
we report this coefficient together with estimates of the parameter α0. Regressions for total
leverage include its second lag and use the same instruments as described above. Regressions
25
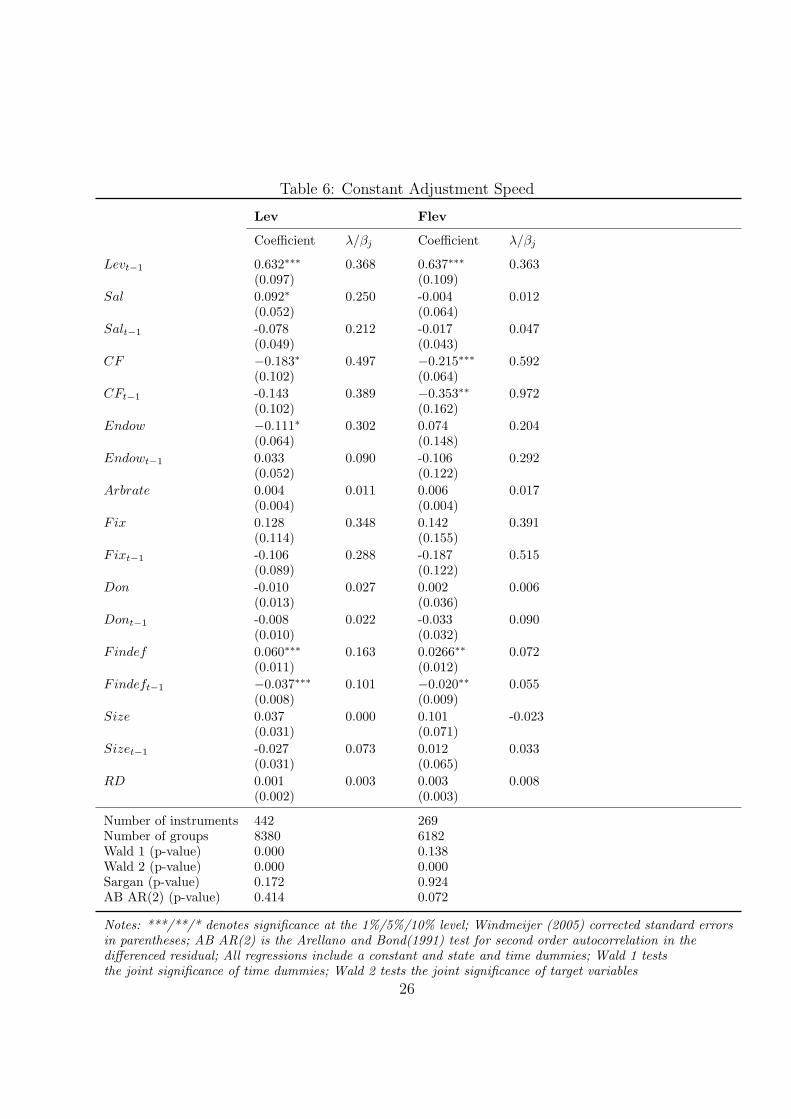
Table 6: Constant Adjustment Speed
Lev Flev
Coefficient λ/βj Coefficient λ/βj
Levt−1 0.632∗∗∗ 0.368 0.637∗∗∗ 0.363(0.097) (0.109)
Sal 0.092∗ 0.250 -0.004 0.012(0.052) (0.064)
Salt−1 -0.078 0.212 -0.017 0.047(0.049) (0.043)
CF −0.183∗ 0.497 −0.215∗∗∗ 0.592(0.102) (0.064)
CFt−1 -0.143 0.389 −0.353∗∗ 0.972(0.102) (0.162)
Endow −0.111∗ 0.302 0.074 0.204(0.064) (0.148)
Endowt−1 0.033 0.090 -0.106 0.292(0.052) (0.122)
Arbrate 0.004 0.011 0.006 0.017(0.004) (0.004)
Fix 0.128 0.348 0.142 0.391(0.114) (0.155)
Fixt−1 -0.106 0.288 -0.187 0.515(0.089) (0.122)
Don -0.010 0.027 0.002 0.006(0.013) (0.036)
Dont−1 -0.008 0.022 -0.033 0.090(0.010) (0.032)
Findef 0.060∗∗∗ 0.163 0.0266∗∗ 0.072(0.011) (0.012)
Findeft−1 −0.037∗∗∗ 0.101 −0.020∗∗ 0.055(0.008) (0.009)
Size 0.037 0.000 0.101 -0.023(0.031) (0.071)
Sizet−1 -0.027 0.073 0.012 0.033(0.031) (0.065)
RD 0.001 0.003 0.003 0.008(0.002) (0.003)
Number of instruments 442 269Number of groups 8380 6182Wald 1 (p-value) 0.000 0.138Wald 2 (p-value) 0.000 0.000Sargan (p-value) 0.172 0.924AB AR(2) (p-value) 0.414 0.072
Notes: ***/**/* denotes significance at the 1%/5%/10% level; Windmeijer (2005) corrected standard errorsin parentheses; AB AR(2) is the Arellano and Bond(1991) test for second order autocorrelation in thedifferenced residual; All regressions include a constant and state and time dummies; Wald 1 teststhe joint significance of time dummies; Wald 2 tests the joint significance of target variables
26
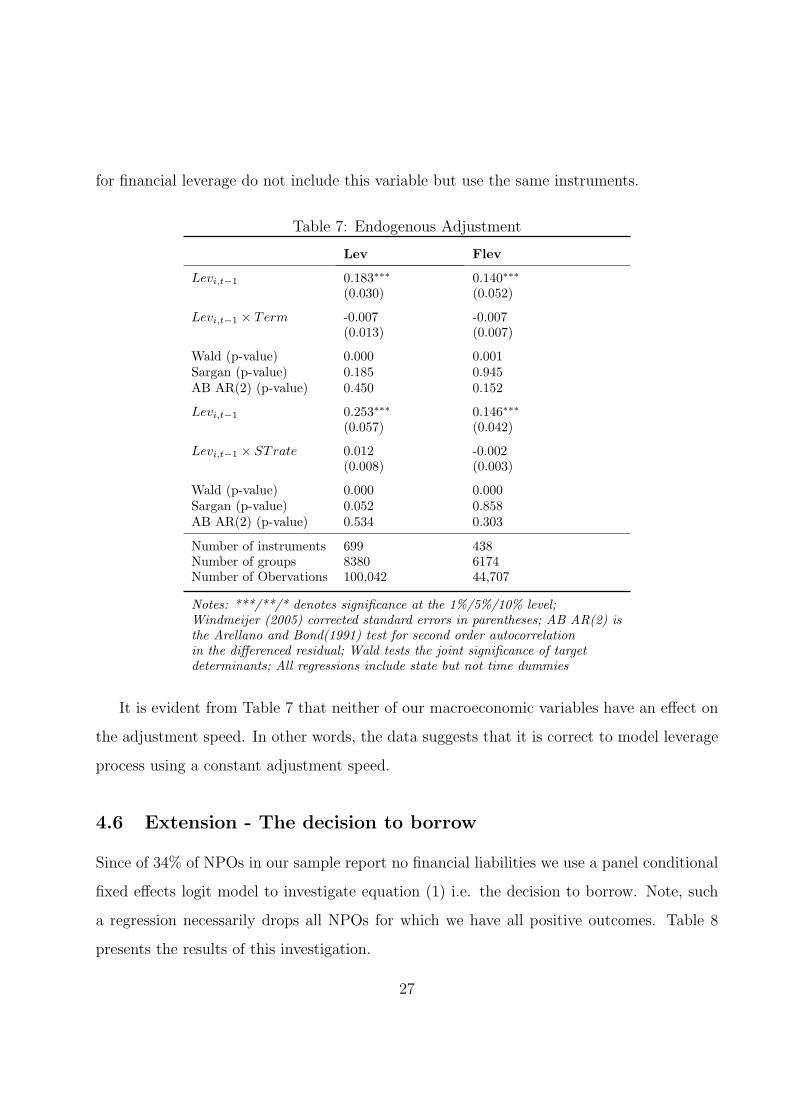
for financial leverage do not include this variable but use the same instruments.
Table 7: Endogenous Adjustment
Lev Flev
Levi,t−1 0.183∗∗∗ 0.140∗∗∗(0.030) (0.052)
Levi,t−1 × Term -0.007 -0.007(0.013) (0.007)
Wald (p-value) 0.000 0.001Sargan (p-value) 0.185 0.945AB AR(2) (p-value) 0.450 0.152
Levi,t−1 0.253∗∗∗ 0.146∗∗∗(0.057) (0.042)
Levi,t−1 × STrate 0.012 -0.002(0.008) (0.003)
Wald (p-value) 0.000 0.000Sargan (p-value) 0.052 0.858AB AR(2) (p-value) 0.534 0.303
Number of instruments 699 438Number of groups 8380 6174Number of Obervations 100,042 44,707
Notes: ***/**/* denotes significance at the 1%/5%/10% level;Windmeijer (2005) corrected standard errors in parentheses; AB AR(2) isthe Arellano and Bond(1991) test for second order autocorrelationin the differenced residual; Wald tests the joint significance of targetdeterminants; All regressions include state but not time dummies
It is evident from Table 7 that neither of our macroeconomic variables have an effect on
the adjustment speed. In other words, the data suggests that it is correct to model leverage
process using a constant adjustment speed.
4.6 Extension - The decision to borrow
Since of 34% of NPOs in our sample report no financial liabilities we use a panel conditional
fixed effects logit model to investigate equation (1) i.e. the decision to borrow. Note, such
a regression necessarily drops all NPOs for which we have all positive outcomes. Table 8
presents the results of this investigation.
27
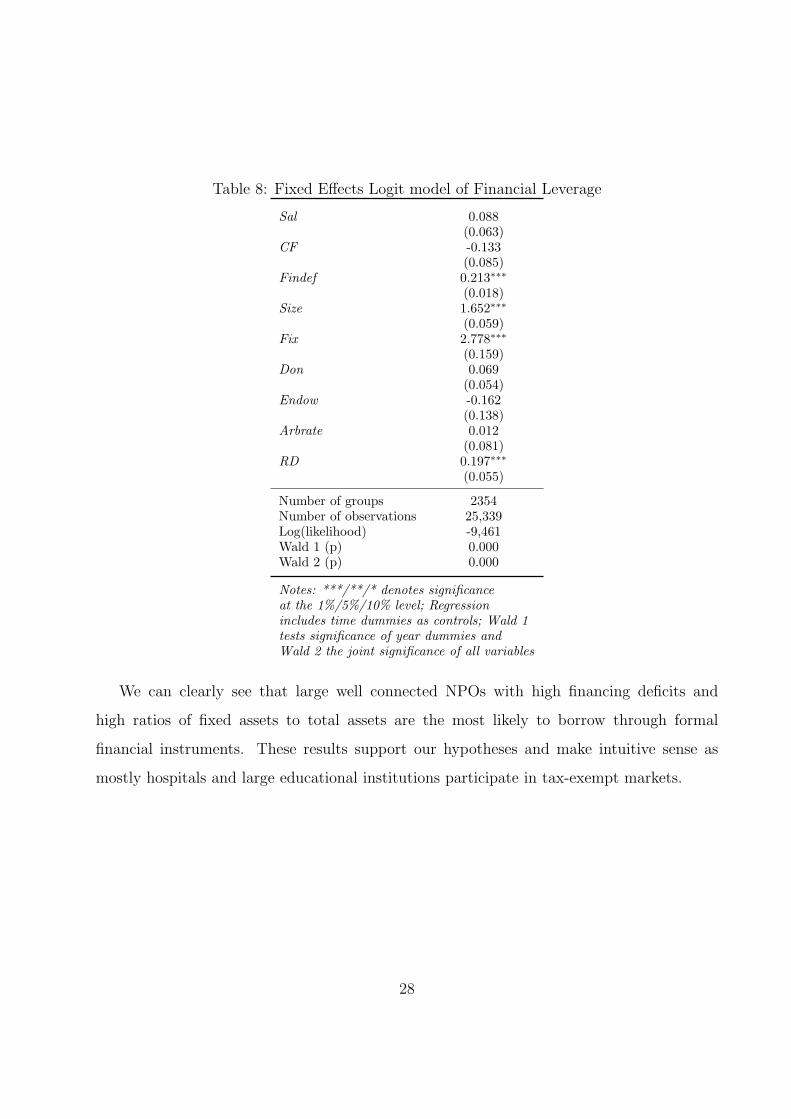
Table 8: Fixed Effects Logit model of Financial Leverage
Sal 0.088(0.063)
CF -0.133(0.085)
Findef 0.213∗∗∗(0.018)
Size 1.652∗∗∗(0.059)
Fix 2.778∗∗∗(0.159)
Don 0.069(0.054)
Endow -0.162(0.138)
Arbrate 0.012(0.081)
RD 0.197∗∗∗(0.055)
Number of groups 2354Number of observations 25,339Log(likelihood) -9,461Wald 1 (p) 0.000Wald 2 (p) 0.000
Notes: ***/**/* denotes significanceat the 1%/5%/10% level; Regressionincludes time dummies as controls; Wald 1tests significance of year dummies andWald 2 the joint significance of all variables
We can clearly see that large well connected NPOs with high financing deficits and
high ratios of fixed assets to total assets are the most likely to borrow through formal
financial instruments. These results support our hypotheses and make intuitive sense as
mostly hospitals and large educational institutions participate in tax-exempt markets.
28
5 Conclusion
In trying to understand the capital structure of nonprofit organisations this paper takes
a novel approach by framing such decisions in a dynamic model. We find strong support
for this method in our sample where NPOs exhibit a sluggish adjustment process. In this
framework we also establish and explore several hypotheses regarding the determinants of
a time varying NPO specific target. Instrumental among these are the positive effect of
financial deficit, negative effect of cash flow over total assets as a measure equity constraints
and a positive effect of total salaries over total assets as a proxy for agency costs. We find
that the relative importance of these variables depends on whether total leverage or financial
leverage is being studied. Endogenizing speed of adjustment to account for macroeconomic
factors leads us to conclude that speed of adjustment is better modeled as a constant. As an
extension we note that many NPOs in our sample do not report any financial liabilities. To
account for this we employ a fixed effects logit specification to explain financial borrowing.
The significant effects include size, fixed assets, relation dummy and financial deficit.
Perhaps the most important goal of this paper is to draw attention to this fledgling field.
Within the framework proposed here, which has recently become popular in PO research,
we can identify a host of topics that lend themselves to further research. For example
we could consider disaggregating by NTEE groups to account for the heterogeneity of the
sector. Other NPO specific determinants of speed of adjustment could be tested e.g. distance
to target to account for asymmetric adjustment. Leverage ratios can be further dissected
to investigate determinants and processes of tax-exempt borrowing as well as non-market
debt. In the context of the latter stewardship theory ideas could be tested. Finally, given
the serious persistence of leverage, Huang and Ritter (2007) suggest the long differencing
estimator developed by Hahn et al (2007) is more appropriate.
Fundamentally much can be gained from cross-applying ideas from PO research to un-
derstand this third sector.
29
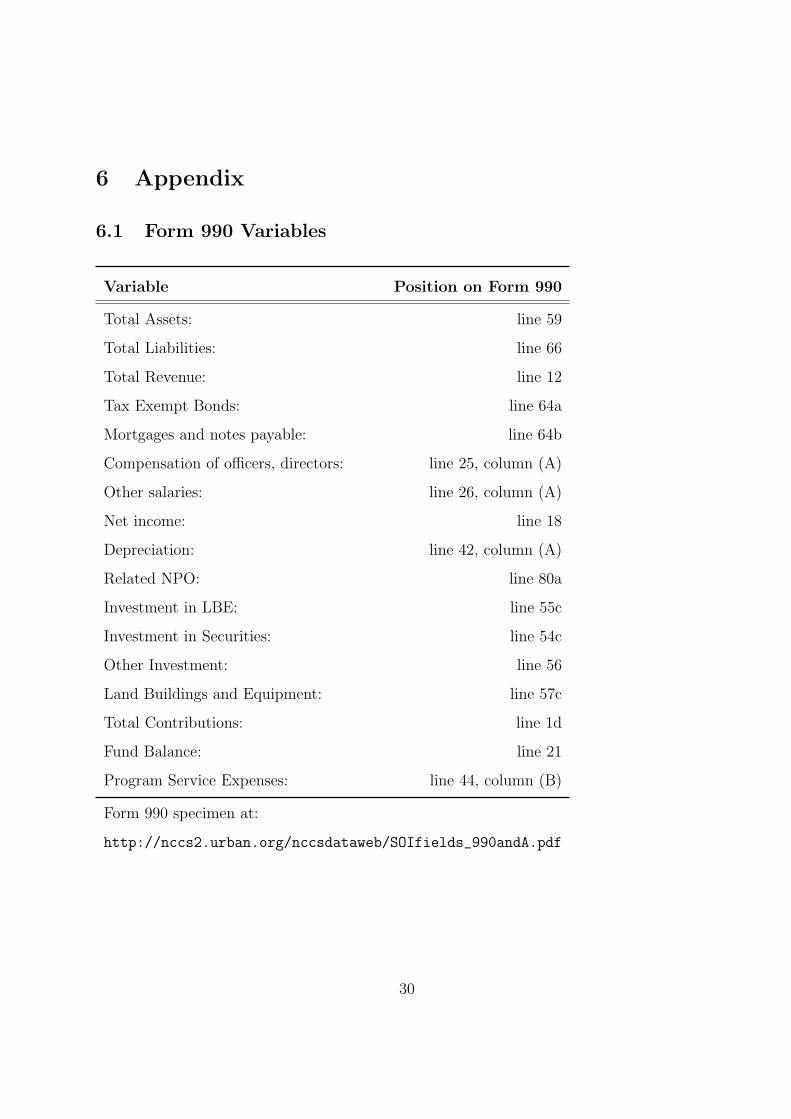
6 Appendix
6.1 Form 990 Variables
Variable Position on Form 990
Total Assets: line 59
Total Liabilities: line 66
Total Revenue: line 12
Tax Exempt Bonds: line 64a
Mortgages and notes payable: line 64b
Compensation of officers, directors: line 25, column (A)
Other salaries: line 26, column (A)
Net income: line 18
Depreciation: line 42, column (A)
Related NPO: line 80a
Investment in LBE: line 55c
Investment in Securities: line 54c
Other Investment: line 56
Land Buildings and Equipment: line 57c
Total Contributions: line 1d
Fund Balance: line 21
Program Service Expenses: line 44, column (B)
Form 990 specimen at:
http://nccs2.urban.org/nccsdataweb/SOIfields_990andA.pdf
30
Notes
1This study primarily focuses on the 501(c)3 group of US public charities. These organisations receive
the most generous tax treatment, being exempt from most state and local taxes2There has been a steady improvement in the efficiency of such markets. Currently there exist countless
orgnisations, guidestar.org being the prime example, set up to alleviate informational deficiencies. Donor
capital has also become much more sophisticated with the rise of new philanthropy. For example the
Nonprofit Finance Fund in the US has introduced an equity like financial instrument for NPOs and research
into a social stock exchange is underway in the UK3Bowman (2002) interestingly points out a similarity in POs, where almost three-quarters of publicly
traded corporations in the US do not declare dividend and reinvest all profits.4This source of internal equity is very important for the large NPOs studied here5Investors in effect push down yields on such bonds to reflect their tax free nature. Over the period 1988
- 2005 the average annual interest rate differential off tax-exempt private activity bonds was 1.6%6The majority of tax-exempt securities volume is issued for the purposes of education and health, i.e.
primarily by hospitals and educational establishments7Indeed the fact that tax-exempt entities have positive leverage is often used as indirect evidence against
the basic static trade-off theory in POs8For an excellent exposition of the necessary conditions see Duffie (1992)9Modigliani and Miller actually recognised the tax-shield benefits of debt in their paper
10Indeed, investing endowments is profitable business, over the past decade many university endowments
outpaced the S&P 500 and other institutional investors. According to NACUBO and TIAA-CREF, university
endowments in 2007 made an average return of 10.7% net of fees and expenses, with some blockbuster
endowments achieving 20% returns11Evidence of this is presented in Graham and Harvey (2001) and Brounen et al. (2004)12The approach is novel because some authors have used exogenously determined target ratios measured ei-
ther using historical data or industry averages (Jalilvand and Harris (1984), Shyam-Sunder and Myers(1999))13Over-adjustment can be thought of as arising from unanticipated shocks14We draw heavily from ideas developed in Bowman(2002) and Jegers and Vershueren (2006), see Empirical
Literature section15readers are referred to the aforementioned paper16See Estrella and Hardouvelis (1991)17All NPOs with gross receipts of $25,000 or more, apart from religious organisations, are required to file
31
a Form 990 tax return annually18The overall reliability of the database is shown to be acceptable, despite NPOs being aware of the use
of Form 990s by donors to calculate important ratios and trying to manipulate them. Froelich, Knoepfle
and Pollack (2000) compare audited financial statement data to Form 990 entries. They find that, although
income statement and balance sheet entries are of lower quality, there is a reasonable consistency with the
audited financial statements19Notice that the bulk of the sector’s revenues and assets are held by the top 5-10% of organisations20This includes Arts, culture and humanities; Health (including Hospitals); Education (Including Higher
Education); Public benefit; Human Services21This included removing NPOs with no assets, negative values of variables that could not be negative
e.g. liabilities and salaries22This involved trimming the top and bottom 0.5% of variables that were not already censored23This is provided by the Bureau of Economic Analysis in the US and transforms nominal variables to
real values in 2000 dollars24This includes accounts payable, accrued expenses, grants payable, deferred revenues, non market debt
from officers, tax-exempt bonds, mortgages and other notes payable, other liabilities25However using book values in POs is not unusual e.g. Rajan and Zingales (1995) or Dorbitz and
Wanzenreid (2006)26We could have used number of employees but this variable is only available from 1997 onwards and
correlates, naturally, with salaries.27A more direct measure of cash flow would be CF1 = net income + 2*depreciation - ∆ net fixed assets
- ∆ working capital requirement. Where working capital requirement is defined as cash + accounts payable
inventories - accounts payable and net fixed assets is defined as land buildings and equipment net of depre-
ciation (hence why we add back depreciation twice). However, due to differencing this variable reduces the
number of observations and its effects are insignificant in all regressions28It is entirely possible to have negative revenue. To avoid negative donation ratios we use the absolute
value of revenue29If fund balance is 0 we set this variable to equal program service expenses. If fund balances are negative
we add its value to expenses. Extremely large values of financial deficit are censored at 1030OLS is clearly inconsistent while the within transformation also induces a strong correlation between
the error and the transformed regressors31Historically researchers use one-step robust estimates for inference because of the severe downward finite
sample bias in the two step standard erros. However, the Windmeijer (2005) correction has greatly reduced
32

this problem32All apart from the dummy RD which is taken as exogenous33There are also two notable problems. Firstly, there is high correlation between Endowment and Fix.
Exclusion of either variable does not significantly alter the results. Secondly, there is a natural correlation
between the Arbrate and STrate, however specifications are robust to exclusion of the latter variable
33
References
[1] Antonious, A., Guney, Y. and Paudyal, K. 2008. ‘The Determinants of Capital Structure:
Capital Market-Oriented versus Bank-Oriented Institutions’, Journal of Financial and
Quantitative Analysis, 43, 1, pp. 59-92.
[2] Arellano, M. and Bond, S. 1991. ‘Some Tests for Panel Data: Monte Carlo Evidence and
an Application to Employment Equations’, Review of Economic Studies, 58, pp. 277-297.
[3] Arellano, M. and Bover, O. 1995. ‘Another look at the instrumental variable estimation
of error-components model’, Journal of Econometrics, 68, 1, pp. 29-51.
[4] Bacon, P. 1992. ‘Do Capital Structure Theories Apply to Nonprofit Hospitals?’, Journal
of the Midwest Finance Association, 21, pp. 86-90.
[5] Blundell, R. and Bond, S. 1998. ‘Initial conditions and moment restrictions in dynamic
panel data models’, Journal of Econometrics, 87, pp. 11-143.
[6] Bowman, W. 2002. ‘The Uniqueness of Nonprofit Finance and the Decision to Borrow’,
Nonprofit Management and Leadership, 12, 3, pp. 293-311.
[7] Brounen, D., de Jong, A. and Higgins, R. 2004. ‘Corporate finance in in Europe: con-
fronting theory and practice’, Financial Management, 33, pp. 71-101.
[8] Bureau of Economic Analysis (BEA), 2001. ‘National Income and Product Ac-
count Tables Table 1.7: Gross Domestic Product by Sector’, Available from:
http://www.bea.gov/national/nipaweb/TableView.asp#Mid.
[9] Caers, R., Du Bois, C., Jegers, M., De Gieter, S., Schepers, C., Permans, R. 2006.
‘Principal-Agent Relationships on the Stewardship-Agency Axis’, Nonprofit Management
and Leadership, 17, 1, pp. 25-47.
34
[10] De Miguel, A. and Pindado, J. 2001 ‘Determinants of the capital structure: new evidence
from Spanish data’, Journal of Corporate Finance, 7, pp. 7799.
[11] Drobetz, W. and Fix, R. 2003. ‘What are the Determinants of the Capital Struc-
ture? Some Evidence for Switzerland’, WWZ/University of Basel Department of Finance,
Working Paper No. 4/03.
[12] Drobetz, W. and Wanzenried, G. 2006. ‘What determines the speed of adjustment to
the target capital structure?’, Applied Financial Economics, 16, 13, pp. 941-958.
[13] Duffie, D. 1992 ‘Modigliani-Miller Theorem’, The New Palgrave Dictionary of Money
and Finance, vol II, McMillan, pp. 715-718.
[14] Estrella, A. and Hardouvelis, G. 1991. ‘The term structure as a predictor of real eco-
nomic activity’, Journal of Finance, 46, pp. 555-76.
[15] Federal Reserve, ‘Federal Statistical Release H. 15: Selected Interest Rates, Historical
Data’, Available from: http://www.federalreserve.gov/releases/h15/data.htm.
[16] Fisman, R. and Hubbard, R. 2005. ‘Precautionary savings and the governance of non-
profit organizations,’ Journal of Public Economics, 89, pp. 2231-2243.
[17] Froelich, K., Knoepfle P. and Pollak, T. 2000. ‘Financial Measures in Nonprofit Organi-
zations Research: Comparing IRS 990 Return and Audited Financial Statement Data’,
Nonprofit and Voluntary Sector Quarterly, 29, 2, pp. 232-54.
[18] Gentry, W. 2002. ‘Debt, Investment and Endowment Accumulation: The Case of Not-
for-Profit Hospitals’, Journal of Health Economics, 21, 5, pp. 845-72.
[19] Graham, J., and Harvey, C. 2001. ‘The Theory and Practice of Corporate Finance:
Evidence from the Field’, Journal of Financial Economics, 60, pp. 187-243.
35
[20] Goldstein, R., Ju, N., and Leland, H. 2001. ‘An EBIT Based Model of Dynamic Capital
Structure’, Journal of Business, 74, pp. 483-512.
[21] Hahn, J., Huasmann, J., and Kuersteiner, G. 2007. ‘Long Difference Instrumental Vari-
ables Estimation for Dynamic Panel Models with Fixed Effects’, Journal of Econometrics,
forthcoming (2007)
[22] Hansman, H. 1980. ‘The role of nonprofit enterprise’, The Yale Law Journal, 89, pp.
835-895.
[23] Harris, M. and Raviv A. 1991. ‘The Theory of Capital Structure’, Journal of Finance,
46, 1, pp. 297-355
[24] Huang, R. and Ritter J. 2007. ‘Testing Theories of Capital Structure and Estimating
the Speed of Adjustment’. 20th Australasian Finance & Banking Conference, 2007 paper,
available at SSRN: http://ssrn.com/abstract=938564.
[25] Jalilvand, A. and Harris, R. 1984. ‘Corporate behavior in adjusting to capital structure
and dividend targets: an econometric study’, Journal of Finance, 39, pp. 12744.
[26] Jegers, M. and Verschueren I., 2006. ‘On the Capital Structure of Non-profit Organisa-
tions: An Empirical Study for Californian Organisations’, Financial Accountability and
Management, 22, 4, pp. 209-329.
[27] Jegers, M., 1997. ‘Portfolio theory and nonprofit financial stability : a comment and
extension’, Nonprofit and Voluntary Sector Quarterly, 26,1.
[28] Jensen, M. 1986. ‘Agency Costs of Free Cash Flow, Corporate Finance, and Takeovers’,
American Economic Review, 76, 2, pp. 323-29.
[29] Lemmon, M., Roberts, M. and Zender, J. 2006. ‘Back to the Beginning: Persistence and
the Cross-Section of Corporate Capital Structure.’ available at SRRN: http://ssrn.
com/abstract=881899.
36
[30] Masulis, R. 1988. ‘The Debt/Equity Choice’, Ballinger Publishing Company, New York.
[31] Modigliani, F. and Miller M. 1958. ‘The Cost of Capital, Corporation Finance and the
Theory of Investment’, American Economic Review, 48, 3, pp. 261-97.
[32] Myers, S. 1977. ‘The Determinants of Corporate Borrowing’, Journal of Financial Eco-
nomics, 4, pp. 147-75.
[33] Myers, S. 1984. ‘The Capital Structure Puzzle’, Journal of Finance, 39, pp. 575-592.
[34] NACUBO (National Association of College and University Business Officers) and TIAA-
CREF (a financial services group), Estimates published in The Economist Newspaper 18
Jan 2007.
[35] Pollak, T. and Blackwood A. 2007 ‘The Nonprofit Sector in Brief: Facts and Figures
from the Nonprofit Almanac 2007’, National Center for Charitable Statistics, Urban
Institute, Available from: http://www.urban.org/url.cfm?ID=311373.
[36] Shyam-Sunder, L. and Myers, S. 1999. ‘Testing Static Tradeoff Against Pecking Order
Models of Capital Structure’, Journal of Financial Economics, 511, pp. 219-44.
[37] Titman, S. and Tsyplakov, S. 2006. ‘A Dynamic Model of Optimal Capital Structure’,
McCombs Research Paper Series, No. FIN-03-06.
[38] Wald, J. 1999. ‘How firm Characetristics Affect Capital Structure: An International
Comparison ’, Journal of Financial Research, 22, 2, pp. 161-187.
[39] Wedig, G.J. 1994. ‘Risk, Leverage, Donations, and Dividends-in-Kind: A Theory of
Nonprofit Financial Behavior’, International Review of Economics and Statistics, 3, 3,
pp. 257-278.
[40] Wedig, G.J. 1996. ‘Tax-exempt Debt and the Capital Structure of Nonprofit Organiza-
tions: An Application to Hospitals’, Journal of Finance, 43, 1, pp. 21-40.
37
[41] Wedig, G.J., Sloan, F., Hassan, M., and Morrisey, M. 1988. ‘Capital Structure, Owner-
ship and Capital Payment Policy: The Case of Hospitals’, Journal of Finance, 18, 1, pp.
21-40.
[42] Weisbrod, B. 1975. ‘Toward a Theory of the Voluntary Non-Profit Sector in a Three-
Sector Economy.’ in Phelps, E. (ed.) Altruism, Morality and Economic Theory, Russell
Sage, New York.
[43] Weisbrod, B. 1988. ‘The Nonprofit Economy’, Harvard University Press, Cambridge,
Mass.
[44] Windmeijer, F. 2005. ‘A finite sample correction for the variance of linear efficient two-
step GMM estimators’, Journal of Econometrics, 126, pp. 25-51.
38