Embed Size (px)
Citation preview
IJER © Serials Publications12(4), 2015: 1353-1370
ISSN: 0972-9380
CAPITAL STRUCTURE AND CORPORATEPERFORMANCE: EVIDENCE FROM THAILAND
Abstract: The purpose of this paper is to examine the relationship between capital structureand financial performance of the listed companies on the Stock Exchange of Thailand (SET).Fixed effect and random effect panel regression model is applied to the data covering theperiod 2009-2011. The empirical evidence shows that the firm’s capital structure is asignificant determinant of corporate performance. Specifically, SDTA has a negative andsignificant impact on the performance measure ROA and ROE. The significance and negativeeffects of SDTA on a firm’s performance ROA supports the argument that short-term debtdecreases a firm’s performance. Moreover, LDTA, TDTA and TDTE are significantlynegatively related to ROE. These results show that higher level of leverage lead to lowerROE. In addition, the results found the positive impact of ‘Agro & Food Industry’ sector tocorporate performance in Thailand. It may also indicate particular sector is more profitablethan others.
Keywords: Capital Structure; Corporate Performance; Agency Theory; Panel RegressionAnalysis
JEL Classification Code: G320; C330
1. INTRODUCTION
The capital structure of a company is a combination of debt and shareholder equities.The main problem in determining the capital structure is, considering the differencesbetween equity and debt, how much debt and how much equity the company shouldhave that is not subject to bankruptcy risk and less financing cost to pay (Shahveisi,Navid, Najafi, & Hosseini, 2012). In general, a company can choose among manyalternative capital structures. It can issue a large amount of debt or very little debt;however, it will attempt to find the particular combination that maximizes its overallmarket value (Abor, 2005).
Capital structure and its effect on firm performance has long been the subject ofconsiderable debate. Its importance derives from the fact that capital structure is closelyrelated to the ability of firms to fulfill the needs of various stakeholders. The last century
* Assistant Professor in Finance at Department of Finance, Faculty of Management Science, Khon KaenUniversity, Thailand, E-mail: [email protected]
1354 Nongnit Chancharat
has witnessed a continuous developing of new theories on the optimal debt to equityratio.
There have been empirical studies exploring the relationship between corporatecapital structure and its performance in various countries, both in emerging anddeveloped countries—for example, Australia (Cassar & Holmes, 2003; Skopljak & Luo,2012), the U.S. (Berger & Patti, 2002), Nigeria (Iorpev & Kwanum, 2012; Muritala,2012; Babalola, 2012), Jordan (Tian & Zeitun, 2007), India (Majumdar & Chhibber,1999), Bangladesh (Chowdhury & Chowdhury, 2010), Iran (Salehi & Biglar, 2009;Shahveisi et al., 2012), Pakistan (Khan, 2012), Egypt (Ebaid, 2009), Sri Lanka (San &Heng, 2011; Manawaduge, Zoysa, Chowdhury, & Chandarakumara, 2011) andMalaysia (Zuraidah Ahmad, Abdullah, & Roslan, 2012).
The objective of the current paper is to examine the relationship between capitalstructure and corporate performance in Thailand. In Thailand, to the best of myknowledge, there were very few studies focused on exploring the relationship betweencorporate capital structure and its performance in Thailand. Those studies includeWiwattanakantang (1999; 2000). However, these two studies focused on investigatingthe determinants of the Thai firms’ capital structure using the tax-based theory, thesignaling theory, and the agency theory, which are different from the main focus ofthe current study.
Wiwattanakantang (1999) presented empirical evidence on the determinants ofthe capital structure of non-financial firms in 1996. The study found that taxes,bankruptcy costs, agency costs and information costs are important factors in the Thaifirm’s financing decisions. Non-debt tax shields and profitability have negative effectson the debt-equity ratio. The Thai corporate leverage ratio is positively related to firms’size and tangibility. The estimates of measure for firm risk andvariation in sales areinsignificant. The author discussed that the tax effect, the signaling effect and theagency costs play a role in financing decisions. Ownership structure also effectsfinancial policy. Family-owned firms have significantly higher debt levels. Only insingle-family-owned firms do managerial shareholdings have a consistently positiveinfluence on firm leverage. The author presented that large shareholders negativelyaffect the debt ratio, implying that they may monitor the management.
In addition, Wiwattanakantang (2000) investigated the ownership and capitalstructure of Thai firms. The study examines the influence of the ownership structureand corporate governance on the capital structure policy and performance of Thai firms.The empirical results indicated that taxes, bankruptcy costs, agency costs and informationcosts are important factors in the Thai firms’ financing decisions. Non-debt tax shields,profitability and investment opportunities have negative effects on the debt-equity ratio.The results were consistent with the tax-based model and the pecking order theory.
The results of this study contribute to the finance literature in several ways. First,the study adds to the literature by showing that capital structure is significantly relatedto corporate performance.
Capital Structure and Corporate Performance: Evidence from Thailand 1355
Second, the effect of capital structure on the profitability of listed firms in Thailandis a scientific area that has not yet been thoroughly explored in Thai finance literature.Issues such as how the listed Thai firms finance their projects, how much they usedebt and equity financing, and the relationship between corporate financialperformance and the existing debt-equity choice are not yet well understood. A betterunderstanding of the issues at hand requires a look at the concept of capital structureand its effect on firm profitability. In practice, firm managers who are able to identifythe optimal capital structure are rewarded by minimizing a firm’s cost of finance,thereby maximizing the firm’s revenue. If a firm’s capital structure influences its firm’sperformance, then it is reasonable to expect that the firm’s capital structure wouldaffect the firm’s health and its likelihood of default. Finally, the literature in emergingmarkets also benefits from this study. Emerging markets are typically characterizedby severe information asymmetry, more acute agency costs, more corruption, andless developed financial markets (Udomsirikul, Jumreornvong, & Jiraporn, 2011). Theresults of this study show that, even in one such emerging market, the impact of capitalstructure on corporate performance is significant.In short, the issues regarding capitalstructure and firm performance are important for both academics and practitioners.
The remainder of this study proceeds as follows. Section 2 discusses the backgroundand literature review. Section 3 develops the theory and hypotheses. Then, Section 4presents the data and econometric methodology, followed by Section 5, which displaysthe empirical results. Finally, Section 6 presents the discussion and conclusions.
2. BACKGROUND AND LITERATURE REVIEW
2.1. Thai Context
This paper focuses on examining the effects of listed companies’ capital structure andcompany performance in Thailand. The reason for choosing Thailand as the case forthis topic is its uniqueness in several aspects, which are discussed below.
First, Thai firms obtain capital through commercial banks to a much larger extentthan do American firms. Indeed, many corporations in Thailand constitute part of alarge conglomerate that owns its own commercial banks and financial institutions,making it easier for these firms to obtain financing through banks than throughoutside capital markets. As bank loans constitute a crucial source of funding, Thaifirms exhibit less reliance on external financing than their U.S. counterparts(Udomsirikul et al., 2011). This phenomenon may affect the optimal capital structureof the firm.
Second, due to the high volatility of domestic interest rates, Thai banks and financialinstitutions provide primarily short- or medium-term loans. Very few financialinstitutions provide loans with maturity longer than ten years (Wiwattanakantang,1999). Thus, this banking credit policy could also have an impact on the capital structureof the borrowing companies and could also force these firms to choose a less than
1356 Nongnit Chancharat
optimal capital structure, which could make them vulnerable in the short term to anincrease in the interest rate (Udomsirikul et al., 2011).
Third, the corporate bond market in Thailand remains underdeveloped. Thaicompanies were not allowed to issue bonds prior to 1992 (Wiwattanakantang, 1999).Although the Thai bond market has made serious strides in the past few years, itremains relatively unsophisticated and illiquid when compared to the U.S.(Udomsirikul et al., 2011). The underdevelopment of the Thai bond market may makeThai firms prefer equity over public debt and hence may influencing the optimal levelof debt used in the company.
Therefore, these unique characteristics offer the researcher a new insight into thestudy on the effects of capital structure on firm performance.
2.2. Capital structure and corporate performance literature
Capital structure management involves the selection of debt and equity securities in away that will maximize the value of the firm (Sheikh & Wang, 2013). It has been arguedthat profitable firms are less likely to depend on debt in their capital structure thanless profitable ones. It has also been argued that firms with a high growth rate have ahigh debt to equity ratio. It has also been found that firms with a high growth ratehave a high debt to equity ratio. If a company’s capital structure influences thecompany’s performance, then it is reasonable to expect that the capital structure of acompany could affect the company’s likelihood of financial distress (Tian & Zeitun,2007).
Since the argument by Jensen and Meckling (1976) regarding the possibility ofcapital structure influence on firm performance, several researchers have followedthis extension and have conducted numerous studies that aim to examine therelationship between financial leverage and firm performance over the last decades.However, empirical evidence regarding this relationship is contradictory and mixed.While a positive relationship between leverage level and firm performance had beendocumented in some studies—for example, Nerlove(1968), Taub (1975), Champion(1999) and Hadlock & James (2002)—other studies document a negative relationshipbetween leverage level and firm performance—for example,Fama& French (1998), Tian& Zeitun (2007) and Muritala (2012).
However, some empirical studies have shown no significant relationship betweencapital structure and firm performance. For instance, Krishnan & Moyer (1997)investigated the impact of corporate performance on capital structure of largeenterprises from four emerging market economies in Asia. The study used 81corporations from Hong Kong, Malaysia, Singapore and Korea and found that bothfinancial performance and capital structure are influenced by the country of origin.They suggested that leverage itself does not seem to affect corporate performance.Similarly, Phillips & Sipahioglu (2004) explored the relationship between capitalstructure and corporate performance with 43 UK listed hotel companies. Empirical
Capital Structure and Corporate Performance: Evidence from Thailand 1357
analysis revealed no significant relationship between the level of debt found in thecapital structure and financial performance. Similarly, Ebaid (2009) concluded thatthe capital structure choice has a weak-to-no impact on firm performance.
Recently, Rajendran & Nimalthasan (2013) examined the relationship betweencapital structure and firm performance in Sri Lanka. The data were taken from a sampleof 25 manufacturing firms covering the period 2008-2012. The firm performancemeasurements include gross profit, net profit, ROE and ROA, while the debt-equityratio andthe debt-assets ratio were used as the measurement of capital structure.Regression models were estimated and showed that gross profit, net profit, ROE andROA were not significantly related to the debt-equity ratio, whereas gross profit marginand ROE were significantly negatively related to the debt-assets ratio.
Sheikh & Wang (2013) investigated whether capital structure affects theperformance of non-financial firms in Pakistan. Pooled ordinary least squares (OLS),fixed effects and random effects models were used to investigate the impact of capitalstructure on the performance of non-financial firms listed on the Karachi StockExchange Pakistan during 2004-2009. The empirical results indicated that all measuresof capital structure, includingthe total debt ratio, long-term debt ratio and short-termdebt ratio, were negatively related to ROA in all regressions. Moreover, the total debtratio and long-term debt ratio are negatively related to the market-to-book ratio underthe pooled OLS model, whereas these measures are positively related to the market-to-book ratio under the fixed effects model. The short-term debt ratio is positivelyrelated to the market-to-book ratio in all regressions; however, the relationship is foundinsignificant. A negative relationship between capital structure and performanceindicates that agency issues may lead firms to use higher than appropriate levels ofdebt in their capital structure.
According to Liu and Ning (2009), the results of the empirical research on therelationship between company performance and the debt ratio can be basically dividedinto two sorts: 1) The debt ratio and company performance showed a negativecorrelation. Generally, when the profitability of the enterprise is strong, the enterprisecan keep more surpluses and will have fewer debts. And when the enterprise is in aloss, because it cannot fulfill the condition of equity financing, it has to borrow largeamounts of short-term debt to fulfill the demand for the capital. Thus, the negativecorrelation between profitability and the debt ratio can be easily understood andaccepted. 2) The debt ratio and company performance showed a positive correlation.Taking net profit/ primary business income and net assets yield as explanatoryvariables and combining the empirical results with the balance theory, we can obtainthe result that a listed company with strong profitability has relatively low financialrisk; thus, the enterprise can select the high capital structure ratio, and profitabilityand debt ratio present a positive correlation relationship.
After more than fifty years of studies, economists have not reached an agreementon how and to what extent the capital structure of a firm impact its value, performance
1358 Nongnit Chancharat
and governance. However, the studies and empirical findings of the last decades haveat least demonstrated that capital structure has greater importance than in the simpleModigliani-Miller model.
3. THEORY AND HYPOTHESES DEVELOPMENT
A number of theories have been advanced for explaining the capital structure ofcompanies. The seminal work by Modigliani & Miller (1958) provided the broadlyknown theory of ‘capital structure irrelevance’, where financial leverage does not affectthe firm’s market value. However, this theory was based on very restrictiveassumptions, which do not exist in the real world. These assumptions include perfectcapital markets, homogenous expectations, no taxes and no transaction costs. Thepresence of bankruptcy costs and favorable tax treatment of interest payments lead tothe notion of an “optimal” capital structure that maximizes the value of the firm orminimizes its total cost of capital (Abor, 2005).
Many researchers introduce additional rationalizations for this proposition andits underlining assumptions showing that capital structure affects a firm’s value andperformance. This is the case with Modigliani & Miller (1963),who reviewed theirearlier study by incorporating tax benefits as determinants of the capital structure offirms. The key feature of taxation is that interest is a tax-deductible expense. A firmthat pays taxes receives a partially offsetting interest “tax-shield” in the form of lowertaxes paid. Therefore, as Modigliani and Miller (1963) propose, a firm should use asmuch debt capital as possible to maximize the firm’s value. Miller and Modigliani(1963) and Miller (1977) addressed the issue more specifically, showing that undersome conditions, the optimal capital structure can be complete debt finance due to thepreferential treatment of debt relative to equity in the tax code.
Other theories that have been advanced to explain the capital structure of firmsinclude bankruptcy costs(Titman, 1984), agency theory (Jensen & Meckling, 1976;C.Jensen & Meckling, 1976), and the pecking order theory (Myers & Majluf, 1984). Insummary, there is no universal theory of debt-equity choice. Different views havebeen put forward regarding the financing choice (Abor, 2005).
This research argues that the debt level of the company in terms of threemeasurements—short-term debt, long-term debt and total debt to total assets—affectsits performance. Furthermore, the researcher used more than one proxy for leveragebecause different hypotheses for leverage were developed to investigate their effecton corporate performance. For example, the SDTA and LDTA are used to investigatethe effect of short-term and long-term debt on a firm’s performance. The proxy ofTDTE was used in the study to validate our result. The research hypotheses are set asfollows:
Research Hypothesis #1: A company’s short-term debt to total assets ratiosignificantly influences its performance.
Capital Structure and Corporate Performance: Evidence from Thailand 1359
Research Hypothesis #2: A company’s long-term debt to total assets ratio significantlyinfluences its performance.
Research Hypothesis #3: A company’s total debt to total assets ratio significantlyinfluences its performance.
Research Hypothesis #4: A company’s total debt to total equity ratio significantlyinfluences its performance.
Growth opportunities are measured by growth of sales. It is expected thatcompanies with high growth opportunities have high performance ratios, as growthfirms are able to generate profit from investment. Thus, growth opportunities areexpected to positively affect a firm’s performance. Thus, Hypothesis 5 can be stated asfollows:
Research Hypothesis #5: A company’s growth opportunities significantly increasecorporate performance.
A company’s size is measured by the log of assets. The company’s size ishypothesized to be positively related to the company’s performance, as bankruptcycosts decrease with size. Thus, a company’s size is expected to have a positive influenceon a company’s performance. Based on this discussion, Hypothesis 6 can be stated asfollows:
Research Hypothesis #6: A company’s size significantly influences corporateperformance.
This paper also includes industry dummies to control for possible industry variationin performance. To control for the effect of industrial sectors on a firm’s performance,six dummy variables are used: Sector 1 (Agro & Food Industry), Sector 2 (Resources),Sector 3 (Technology), Sector 4 (Services), Sector 5 (Industrials), Sector 6 (ConsumerProducts) and Sector 7 (Property & Construction). The dummy variable takes the value1 if the firm is in that sector; otherwise, it takes the value 0. Consequently, Hypothesis7 could be formulated as:
Research Hypothesis #7: A company’s industry sector significantly influencescorporate performance.
4. DATA AND ECONOMETRIC METHODOLOGY
This study provides empirical evidence on the relationship between capital structureand corporate performance for firms listed on the Stock Exchange of Thailand (SET).Specifically, the study will explore whether capital structure does or does not affectcorporate performance. The analysis is conducted on a sample of all listed companieson the SET over a three-year period. The financial sector is excluded from the analysisbecause its characteristics are different.
The panel data included 370 companies listed on SET with completed data coveringthe period 2009-2011. The sample altogether consists of 1,110 observations. Panel data
1360 Nongnit Chancharat
allows the researcher to control for variables that change over time but not acrossentities. This accounts for individual heterogeneity.
The measurement of performance is dependent upon the information introduced inthe measurement system and the instruments employed. The classical indicators usedin financial analysis to measure performance have been return on investment, leverage,capital efficiency, liquidity, cash flow, inventory turnoverand receivables turnover ratio.In addition to these factors, the so-called modern value creation indicators are: 1)Accounting indicators: net profit or earnings per share; operating profit or EBIDTA,Return On Assets (ROA) and Return On Equity (ROE); 2) Hybrid indicators (accountingand financial): Economic Value Added (EVA), Cash Flow Return on Investment (CFROI);3) Financial indicators: Net Present Value (NPV); and 4) Market indicators: Market ValueAdded (MVA), total shareholder return. The choice of alternatives for ascertainingperformance may be influenced by the firm’s objective (Tudose, 2012).
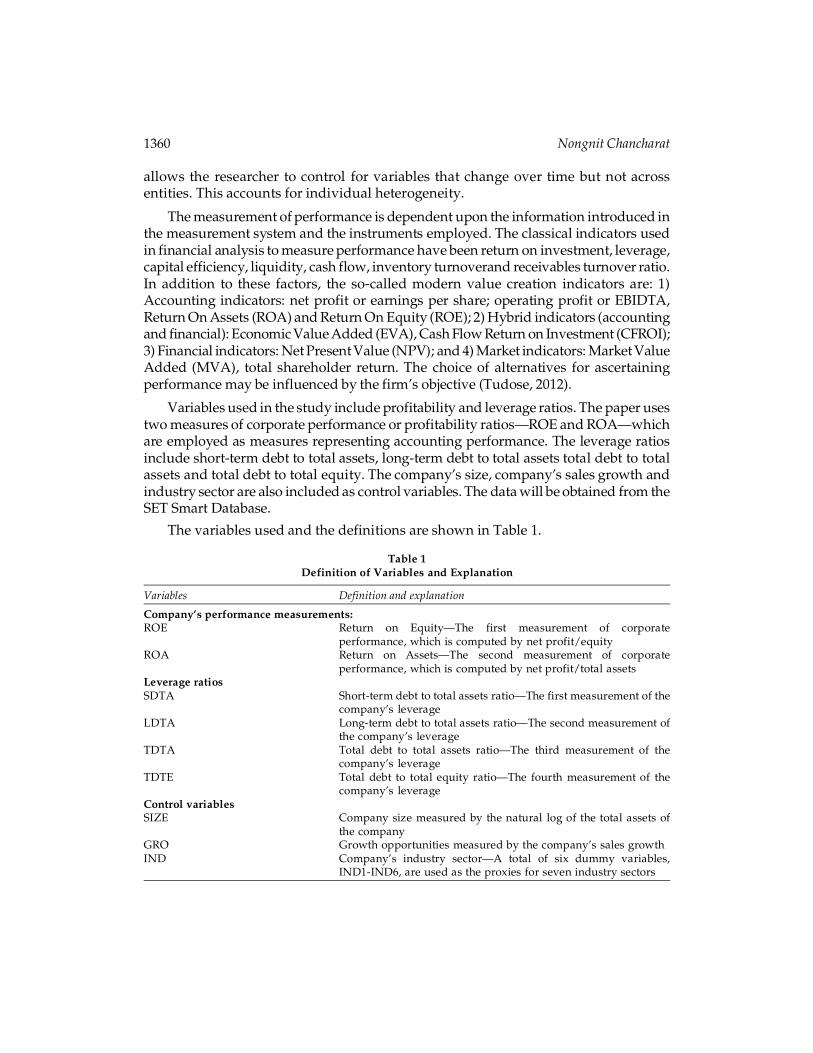
Variables used in the study include profitability and leverage ratios. The paper usestwo measures of corporate performance or profitability ratios—ROE and ROA—whichare employed as measures representing accounting performance. The leverage ratiosinclude short-term debt to total assets, long-term debt to total assets total debt to totalassets and total debt to total equity. The company’s size, company’s sales growth andindustry sector are also included as control variables. The data will be obtained from theSET Smart Database.
The variables used and the definitions are shown in Table 1.
Table 1Definition of Variables and Explanation
Variables Definition and explanation
Company’s performance measurements:ROE Return on Equity—The first measurement of corporate
performance, which is computed by net profit/equityROA Return on Assets—The second measurement of corporate
performance, which is computed by net profit/total assetsLeverage ratiosSDTA Short-term debt to total assets ratio—The first measurement of the
company’s leverageLDTA Long-term debt to total assets ratio—The second measurement of
the company’s leverageTDTA Total debt to total assets ratio—The third measurement of the
company’s leverageTDTE Total debt to total equity ratio—The fourth measurement of the
company’s leverageControl variablesSIZE Company size measured by the natural log of the total assets of
the companyGRO Growth opportunities measured by the company’s sales growthIND Company’s industry sector—A total of six dummy variables,
IND1-IND6, are used as the proxies for seven industry sectors
Capital Structure and Corporate Performance: Evidence from Thailand 1361
The relationship between capital structure and listed companies’ performance willbe investigated by using panel regression analysis. Panel data are employed coveringthe period from 2009 to 2011. Panel data involves the pooling of observations on across-section of units over several time periods and provides results that are simplynot detectable in pure cross-sections or pure time-series studies. A general model forpanel data that allows the researcher to estimate panel data with great flexibility andformulate the differences in the behavior of the cross-section elements is adopted (Abor,2005).
The estimation methods will consist of descriptive statistics, correlations analysis,and fixed effects and random effects panel regressions analysis. This paper focuses ontwo techniques use to analyze panel data—namely, fixed effects and random effectsmodels. One important assumption of the fixed effects model is that those time-invariant characteristics are unique to the individual and should not be correlatedwith other individual characteristics. Each entity is different; therefore, the entity’serror term and the constant (which captures individual characteristics) should not becorrelated with the others. If the error terms are correlated, then fixed effects is notsuitable because inferences may not be correct and the researcher needs to model thatrelationship using random effects model; this is the main rationale for the Hausmantest. This paper run a Hausman test where the null hypothesis is that the preferredmodel is the random effects model over the alternative—the fixed effects model. Itbasically tests whether the unique errors are correlated with the regressors; the nullhypothesis is that they are not.
This paper will estimate the following equations to test the hypotheses that a firm’scapital structure influences its performance. The dependent variable is the company’sperformance measurements. The independent variables are represented by leverage,corporate sales growth, company size and industry sector.
The empirical regression models to be estimated are as follows:PERi,t= b0+b1LEVi,t+b2GROi,t+b3SIZEi,t+b4INDi+ei,t (1)
where:PERi,t is corporate performance measured alternatively by ROA and ROEfor
company i in time t.LEVi,t is the financial leverage for company i in time t.Four measurements of
leverage include short-term debt to total assets ratio, long-term debt to total assetsratio, total debt to total assets ratio and total debt to total equity ratio.
GROi,t is the sales growth for company i in time t.SIZEi,t is company size measured by the natural log of assets for company i in
time t.INDi is the industry sector for company i.
ei,t is the error term.
1362 Nongnit Chancharat
5. EMPIRICAL RESULTS
5.1. Descriptive statistics
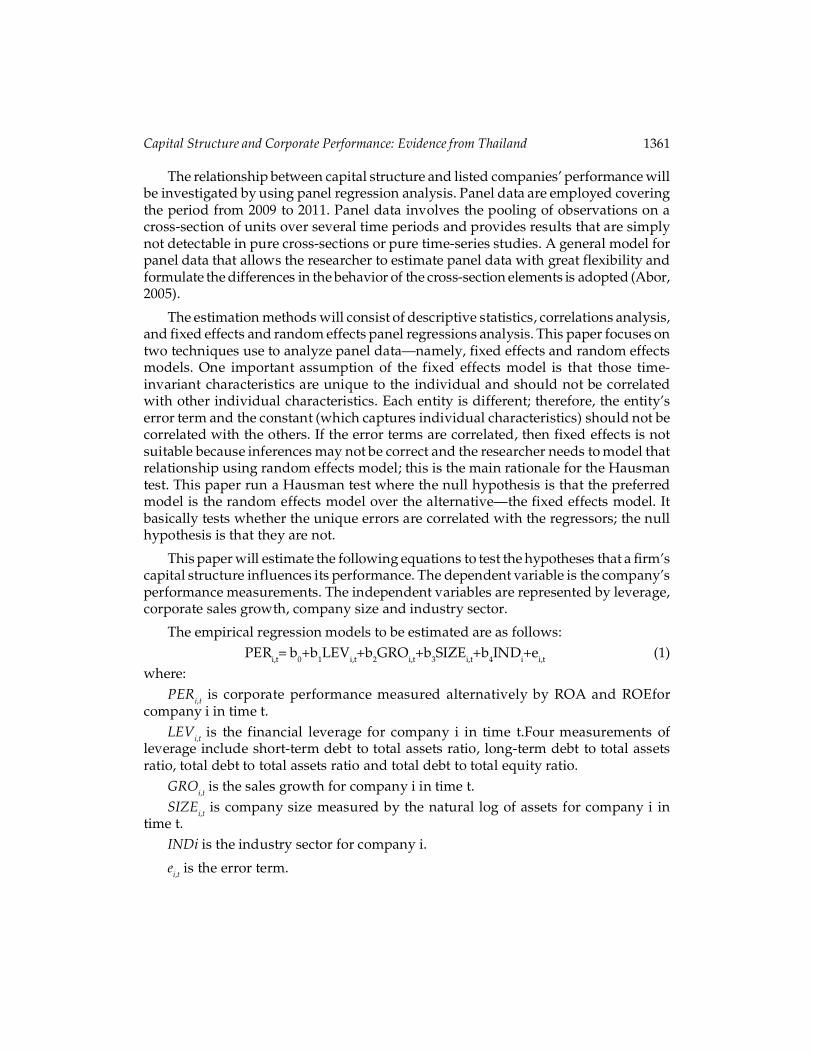
Table 2 reports descriptive statistics of the variables used in the study. The averagereturn to assets for the sample as a whole is 7.84%, while the average return to equityis approximately 6.94%. During the time period 2009-2011, the average total debt tototal assets for the sample as a whole is approximately 43%, while the average short-term debt to total assets and long-debt to total assets are 31% and 12%, respectively.The results show that Thai listed companies use short-term debt as a source of fundsrather than long-term debt.
Table 2Descriptive Statistics of the Variables, 2009-2011
Variable Mean Std. Dev. Minimum Maximum Skewness Kurtosis Jarque-Bera Probability
ROA 7.84 10.39 -62.91 57.29 -0.39 9.13 1,764.84 0.00ROE 6.94 34.55 -597.77 312.67 -7.49 127.77 730,365.30 0.00SDTA 0.31 0.20 0.00 0.99 0.72 2.86 95.81 0.00LDTA 0.12 0.14 0.00 0.86 1.51 5.16 637.50 0.00TDTA 0.43 0.22 0.00 1.07 0.06 2.27 25.21 0.00SIZE 8.30 1.48 4.98 14.15 0.67 3.43 92.52 0.00GRO 29.05 392.57 -98.61 10,791.45 22.49 564.90 14,696,057.00 0.00
Note: ROA = Return on assets, ROE = Return on equity, SDTA = Short-term debt to total assets, LDTA= Long-term debt to total assets, TDTA = Total debt to total assets, SIZE = Firm size andGRO=Firm growth.
5.2. Correlation analysis
The correlation matrix for the variables is reported in Table 3 to examine the correlationbetween the explanatory variables. The results show that there is a negative relationshipbetween growth and size, while size has a positive relationship with all leverage ratiosexcept short-term debt to total asset, which is negative. This implies that largercompanies tend to have a higher leverage ratio with lower growth opportunities. Italso implies that small firms have high growth opportunities which is consistent withMyers (1977).
Table 3Correlation Matrix of the Explanatory Variables, 2009-2011
SDTA LDTA TDTA SIZE GRO
SDTA 1LDTA -0.19704 1TDTA 0.76524 0.479961 1SIZE -0.02905 0.465782 0.280025 1GRO 0.045156 0.003858 0.041812 -0.01539 1
Note: ROA = Return on assets, ROE = Return on equity, SDTA = Short-term debt to total assets, LDTA= Long-term debt to total assets, TDTA = Total debt to total assets, SIZE = Firm size and GRO =Firm growth.
Capital Structure and Corporate Performance: Evidence from Thailand 1363
5.3. Fixed and randomeffects panel regressions analysis
The results of the estimation of the panel data models with each of the performancemeasures and for the full sample of observations for the period 2009-2011 are displayedin Tables 4 to 8.
For Hypotheses 1 to 4, the firm’s capital structure is expected to influence itsperformance. Four capital structure variables are used: SDTA, LDTA, TDTA and TDTE.From the regression results in Table 4, Table 5, Table 6 and Table 7, as expected, thecoefficients of those variables are negatively related to the accounting performancemeasure ROA and ROE.The results show that SDTA significantly negatively affectscorporate performance measure ROA and ROE. Moreover, LDTA, TDTA and TDTEare significantly negatively related to ROE at the 1 percent significance level. Theseresults show that a higher level of leverage leads to lower ROE.
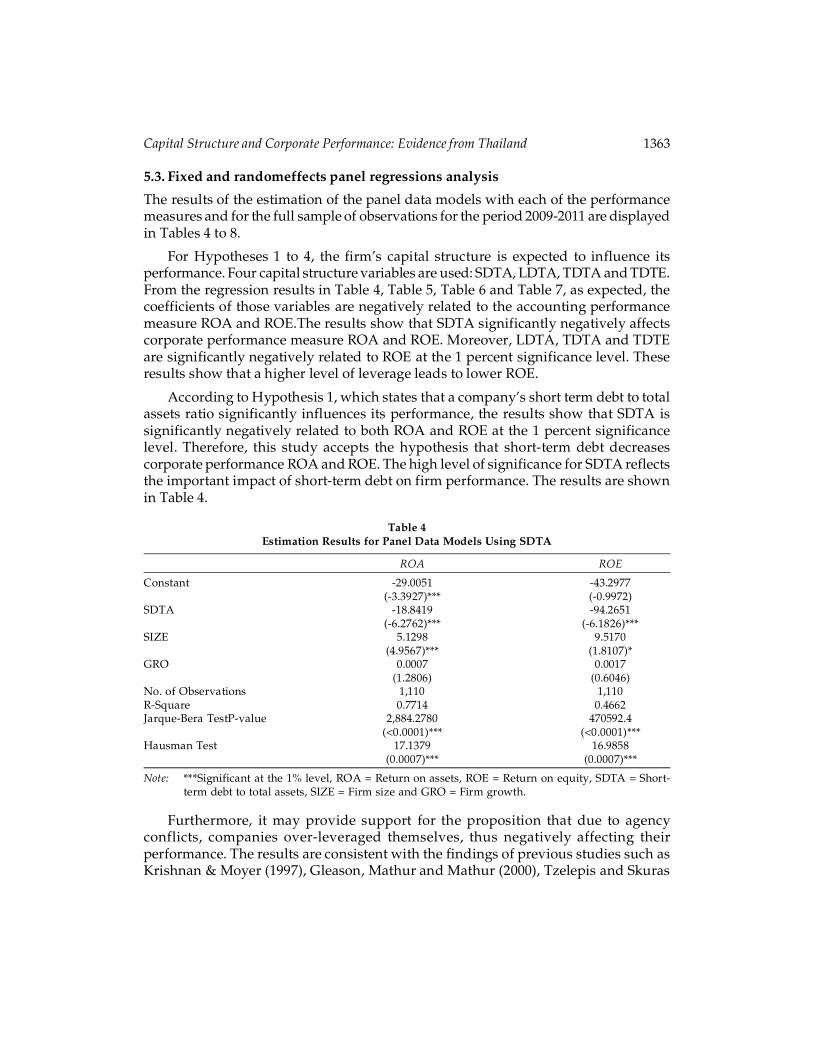
According to Hypothesis 1, which states that a company’s short term debt to totalassets ratio significantly influences its performance, the results show that SDTA issignificantly negatively related to both ROA and ROE at the 1 percent significancelevel. Therefore, this study accepts the hypothesis that short-term debt decreasescorporate performance ROA and ROE. The high level of significance for SDTA reflectsthe important impact of short-term debt on firm performance. The results are shownin Table 4.
Table 4Estimation Results for Panel Data Models Using SDTA
ROA ROE
Constant -29.0051 -43.2977(-3.3927)*** (-0.9972)
SDTA -18.8419 -94.2651(-6.2762)*** (-6.1826)***
SIZE 5.1298 9.5170(4.9567)*** (1.8107)*
GRO 0.0007 0.0017(1.2806) (0.6046)
No. of Observations 1,110 1,110R-Square 0.7714 0.4662Jarque-Bera TestP-value 2,884.2780 470592.4
(<0.0001)*** (<0.0001)***Hausman Test 17.1379 16.9858
(0.0007)*** (0.0007)***
Note: ***Significant at the 1% level, ROA = Return on assets, ROE = Return on equity, SDTA = Short-term debt to total assets, SIZE = Firm size and GRO = Firm growth.
Furthermore, it may provide support for the proposition that due to agencyconflicts, companies over-leveraged themselves, thus negatively affecting theirperformance. The results are consistent with the findings of previous studies such asKrishnan & Moyer (1997), Gleason, Mathur and Mathur (2000), Tzelepis and Skuras
1364 Nongnit Chancharat
(2004), Tian & Zeitun (2007), among others. Additionally, LDTA and TDTE have anegative and insignificant impact on a firm’s profitability measure (ROA). However,the negative and significant coefficient of LDTA does not support the argument byBrick & Ravid (1985) that long-term debt increases a firm’s value, which could be dueto the low ratio of long-term debt in the capital structure of Thai companies.
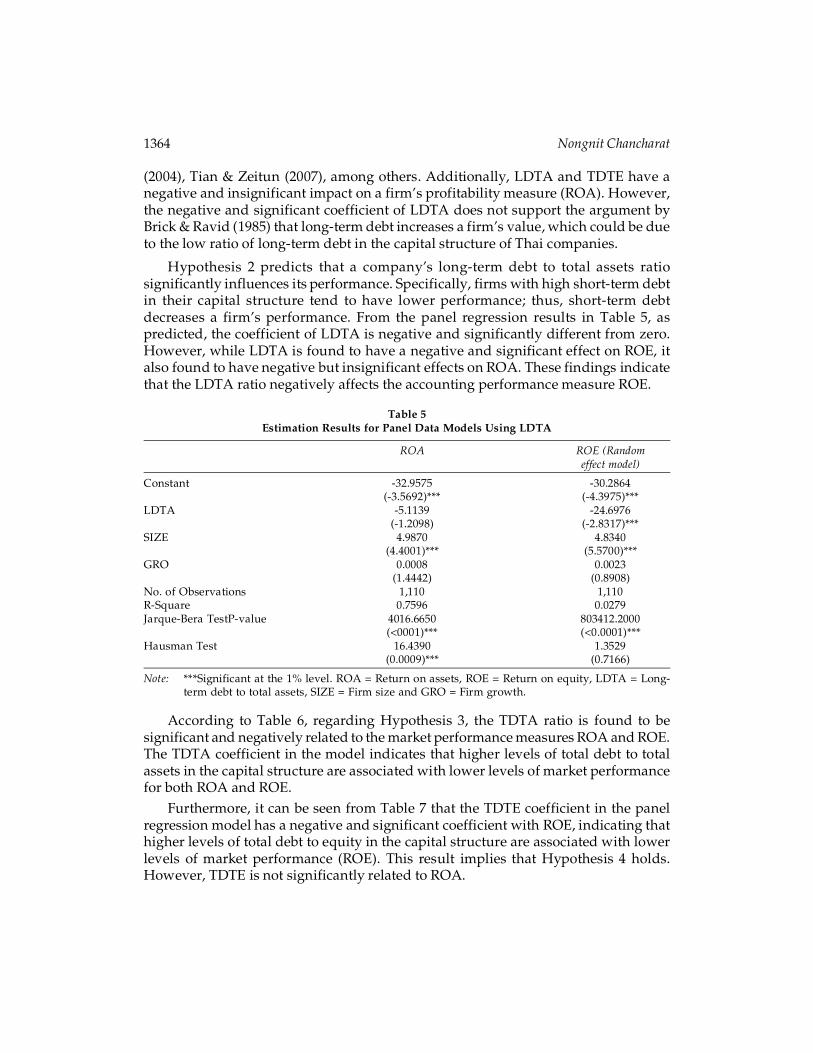
Hypothesis 2 predicts that a company’s long-term debt to total assets ratiosignificantly influences its performance. Specifically, firms with high short-term debtin their capital structure tend to have lower performance; thus, short-term debtdecreases a firm’s performance. From the panel regression results in Table 5, aspredicted, the coefficient of LDTA is negative and significantly different from zero.However, while LDTA is found to have a negative and significant effect on ROE, italso found to have negative but insignificant effects on ROA. These findings indicatethat the LDTA ratio negatively affects the accounting performance measure ROE.
Table 5Estimation Results for Panel Data Models Using LDTA
ROA ROE (Randomeffect model)
Constant -32.9575 -30.2864(-3.5692)*** (-4.3975)***
LDTA -5.1139 -24.6976(-1.2098) (-2.8317)***
SIZE 4.9870 4.8340(4.4001)*** (5.5700)***
GRO 0.0008 0.0023(1.4442) (0.8908)
No. of Observations 1,110 1,110R-Square 0.7596 0.0279Jarque-Bera TestP-value 4016.6650 803412.2000
(<0001)*** (<0.0001)***Hausman Test 16.4390 1.3529
(0.0009)*** (0.7166)
Note: ***Significant at the 1% level. ROA = Return on assets, ROE = Return on equity, LDTA = Long-term debt to total assets, SIZE = Firm size and GRO = Firm growth.
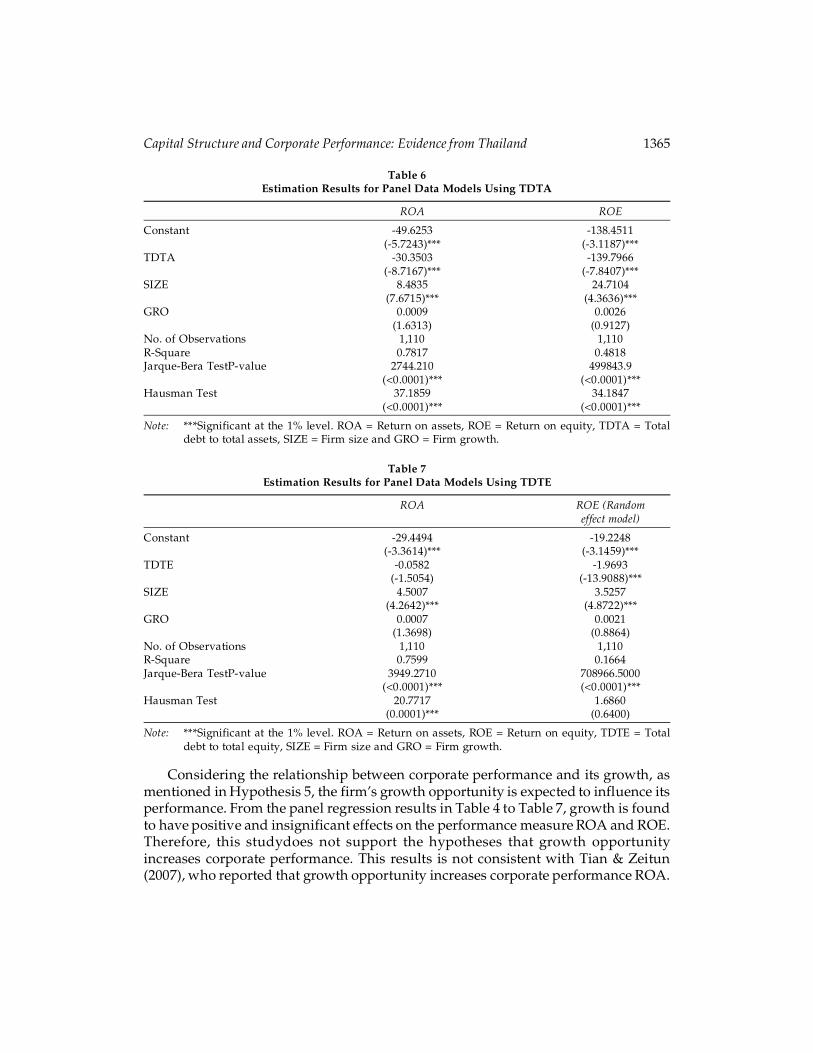
According to Table 6, regarding Hypothesis 3, the TDTA ratio is found to besignificant and negatively related to the market performance measures ROA and ROE.The TDTA coefficient in the model indicates that higher levels of total debt to totalassets in the capital structure are associated with lower levels of market performancefor both ROA and ROE.
Furthermore, it can be seen from Table 7 that the TDTE coefficient in the panelregression model has a negative and significant coefficient with ROE, indicating thathigher levels of total debt to equity in the capital structure are associated with lowerlevels of market performance (ROE). This result implies that Hypothesis 4 holds.However, TDTE is not significantly related to ROA.
Capital Structure and Corporate Performance: Evidence from Thailand 1365
Considering the relationship between corporate performance and its growth, asmentioned in Hypothesis 5, the firm’s growth opportunity is expected to influence itsperformance. From the panel regression results in Table 4 to Table 7, growth is foundto have positive and insignificant effects on the performance measure ROA and ROE.Therefore, this studydoes not support the hypotheses that growth opportunityincreases corporate performance. This results is not consistent with Tian & Zeitun(2007), who reported that growth opportunity increases corporate performance ROA.
Table 6Estimation Results for Panel Data Models Using TDTA
ROA ROE
Constant -49.6253 -138.4511(-5.7243)*** (-3.1187)***
TDTA -30.3503 -139.7966(-8.7167)*** (-7.8407)***
SIZE 8.4835 24.7104(7.6715)*** (4.3636)***
GRO 0.0009 0.0026(1.6313) (0.9127)
No. of Observations 1,110 1,110R-Square 0.7817 0.4818Jarque-Bera TestP-value 2744.210 499843.9
(<0.0001)*** (<0.0001)***Hausman Test 37.1859 34.1847
(<0.0001)*** (<0.0001)***
Note: ***Significant at the 1% level. ROA = Return on assets, ROE = Return on equity, TDTA = Totaldebt to total assets, SIZE = Firm size and GRO = Firm growth.
Table 7Estimation Results for Panel Data Models Using TDTE
ROA ROE (Randomeffect model)
Constant -29.4494 -19.2248(-3.3614)*** (-3.1459)***
TDTE -0.0582 -1.9693(-1.5054) (-13.9088)***
SIZE 4.5007 3.5257(4.2642)*** (4.8722)***
GRO 0.0007 0.0021(1.3698) (0.8864)
No. of Observations 1,110 1,110R-Square 0.7599 0.1664Jarque-Bera TestP-value 3949.2710 708966.5000
(<0.0001)*** (<0.0001)***Hausman Test 20.7717 1.6860
(0.0001)*** (0.6400)
Note: ***Significant at the 1% level. ROA = Return on assets, ROE = Return on equity, TDTE = Totaldebt to total equity, SIZE = Firm size and GRO = Firm growth.
1366 Nongnit Chancharat
Hypothesis 6 predicts that firm size significantly influences corporate performance.It can be seen from Table 4 to Table 7 that the firm size is significantly positivelyrelated to corporate performance for both ROA and ROE. The significance of firm sizeindicates that large firms earn higher returns compared to smaller firms, presumablyas a result of diversification of investment and economies of scale. This result isconsistent with previous findings including Gleason et al. (2000)and Tian & Zeitun(2007). The results indicate that a firm’s size is an important determinant of corporateperformance.
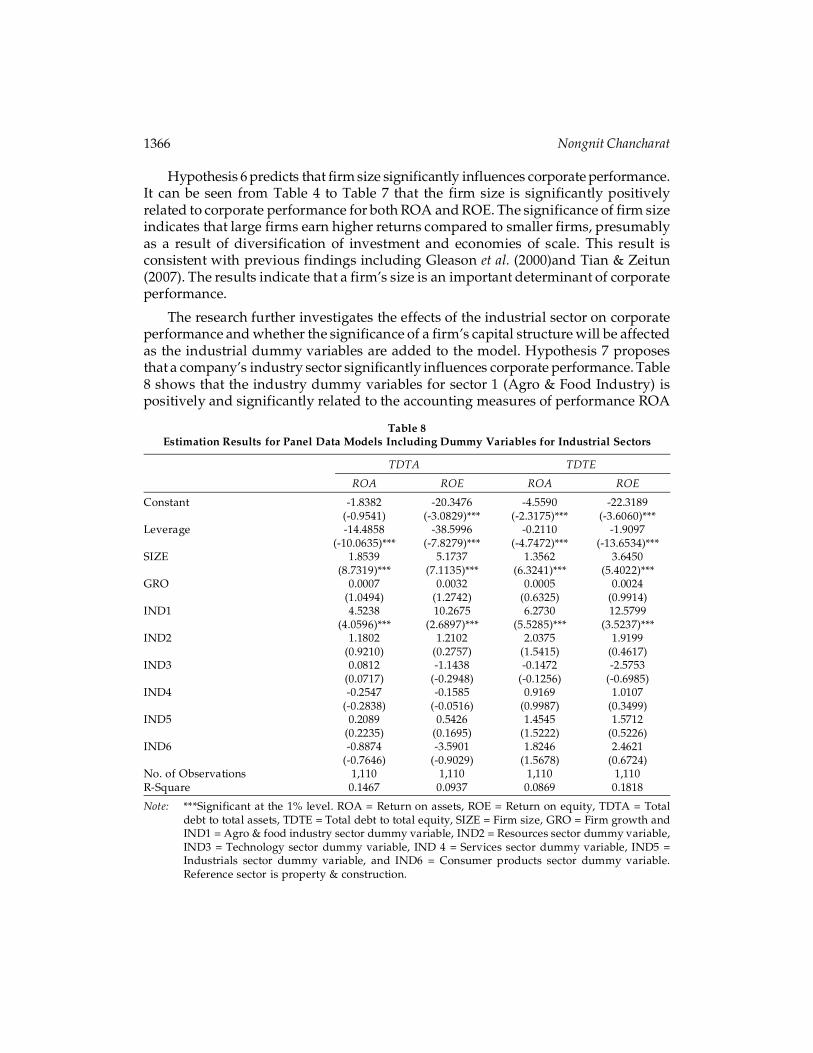
The research further investigates the effects of the industrial sector on corporateperformance and whether the significance of a firm’s capital structure will be affectedas the industrial dummy variables are added to the model. Hypothesis 7 proposesthat a company’s industry sector significantly influences corporate performance. Table8 shows that the industry dummy variables for sector 1 (Agro & Food Industry) ispositively and significantly related to the accounting measures of performance ROA
Table 8Estimation Results for Panel Data Models Including Dummy Variables for Industrial Sectors
TDTA TDTE
ROA ROE ROA ROE
Constant -1.8382 -20.3476 -4.5590 -22.3189(-0.9541) (-3.0829)*** (-2.3175)*** (-3.6060)***
Leverage -14.4858 -38.5996 -0.2110 -1.9097(-10.0635)*** (-7.8279)*** (-4.7472)*** (-13.6534)***
SIZE 1.8539 5.1737 1.3562 3.6450(8.7319)*** (7.1135)*** (6.3241)*** (5.4022)***
GRO 0.0007 0.0032 0.0005 0.0024(1.0494) (1.2742) (0.6325) (0.9914)
IND1 4.5238 10.2675 6.2730 12.5799(4.0596)*** (2.6897)*** (5.5285)*** (3.5237)***
IND2 1.1802 1.2102 2.0375 1.9199(0.9210) (0.2757) (1.5415) (0.4617)
IND3 0.0812 -1.1438 -0.1472 -2.5753(0.0717) (-0.2948) (-0.1256) (-0.6985)
IND4 -0.2547 -0.1585 0.9169 1.0107(-0.2838) (-0.0516) (0.9987) (0.3499)
IND5 0.2089 0.5426 1.4545 1.5712(0.2235) (0.1695) (1.5222) (0.5226)
IND6 -0.8874 -3.5901 1.8246 2.4621(-0.7646) (-0.9029) (1.5678) (0.6724)
No. of Observations 1,110 1,110 1,110 1,110R-Square 0.1467 0.0937 0.0869 0.1818
Note: ***Significant at the 1% level. ROA = Return on assets, ROE = Return on equity, TDTA = Totaldebt to total assets, TDTE = Total debt to total equity, SIZE = Firm size, GRO = Firm growth andIND1 = Agro & food industry sector dummy variable, IND2 = Resources sector dummy variable,IND3 = Technology sector dummy variable, IND 4 = Services sector dummy variable, IND5 =Industrials sector dummy variable, and IND6 = Consumer products sector dummy variable.Reference sector is property & construction.
Capital Structure and Corporate Performance: Evidence from Thailand 1367
and ROE using TDTA and TDTE as the measures of capital structure. The positiveand significant impacts of this industrial dummy variable indicate that a higher levelof investment in this sector could be associated with a higher ratio of ROA and ROE.
The positive impact of sector 1 (Agro & Food Industry) indicates that investing inthis sector is profitable. The main reason for this is that agriculture in Thailand is highlycompetitive, diversified and specialized, and its exports are very successfulinternationally. Recent developments in agriculture in Thailand have been achievedthrough a mixture of a strong and positive state role in ensuring investmentin infrastructure, education and access to credit and successful private initiatives inthe agribusiness sector. Additionally,it should be noted that the significance of thisindustrial sector may imply the presence of the industry sector.
Considering the dummy variables for Sector 3 (Technology), Sector 4 (Services)and Sector 6 (Consumer Products), the results show that the insignificance and sign ofthese industrial sectors changed as the performance measure changed, which mayimply the presence of the industry sector.
The dummy variables for Sector 2 (Resources) and Sector 5 (Industrials) are foundto have a positive but insignificant impact on the firm performance measures. Thenegative sign for some industries could be as a result of the negative equity value forsome firms included in the analysis. Therefore, the results support the hypothesis thatindustrial sectors affect Thai corporate performance. As mentioned earlier in thissection, the significance and sign of these industrial sectors changed as the performancemeasure changed, which may imply the presence of the industry sector. However, itshould be noted that including industrial dummy variables in the regression increasedthe model robustness and accuracy.
6. DISCUSSION AND CONCLUSIONS
This paper examines the relationship between capital structure andcorporateperformance in Thailand in which controlling for the effects of firm growth,size and industrial sectors. There were very few studies focused on exploring therelationship between corporate capital structure and its performance in Thailand. Thisstudy tried to fill the gap in this field by investigating the effects of capital structureon corporate performance by taking Thailand as a case study. Furthermore, this paperemployed different measures of capital structure such as short-termdebt, long-termdebt, total debt to total assets and total debt to total equity in order to investigate theeffects of thedebt structure on the corporate performance measures ROA and ROE. Abalanced panel of 370 companies is included in this paper. Financial data from 2009-2011 are used in fixed effects and random effects panel regression analysis.
A firm’s capital structure was found to have a significant and negative impact onthe firm’s performance measures. The results suggests that the broadly known theoryof ‘capital structure irrelevance’ in which financial leverage does not affect the firm’smarket value by Modigliani & Miller (1958) may not exist in the real world. To
1368 Nongnit Chancharat
summarize, the firm’s capital structure is a significant determinant of corporateperformance. Another important finding is that SDTA has a negative and significantimpact on the performance measures ROA and ROE. The significance and negativeeffects of SDTA on a firm’s performance ROA supports the argument that short-termdebt decreases a firm’s performance. Moreover, LDTA, TDTA and TDTE aresignificantly negatively related to ROE. These results show that a higher level ofleverage leads to lower ROE.
It should be noted that this study does not support the hypotheses that growthopportunity increases corporate performance. The results are not consistent with Tian& Zeitun (2007). However, consistent with Tian & Zeitun (2007), firm size was foundto have a positive impact on a firm’s performance, as large firms have low bankruptcycosts. In other words, bankruptcy costs increases as firm size decreases, and hence,bankruptcy costs negatively affect a firm’s performance.
In addition, the results found the positive impact of the ‘Agro & Food Industry’sector on corporate performance in Thailand. The result may also indicate that thisparticular sector is more profitable than others. Furthermore, including industrialdummy variables increased the robustness of the model.
Acknowledgement
The author would like to express the appreciation to The Innovation and ModernManagement Centre, Faculty of Management Science, Khon Kaen University, Khon Kaen,Thailand for research funding.
References
Abor, J. (2005), The effect of capital structure on profitability: An empirical analysis of listedfirms in Ghana. Journal of Risk Finance, 6(5), 438-445.
Babalola, Y. A. (2012), The effects of optimal capital structure on firms’performances inNigeria. Journal of Emerging Trends in Economics and Management Sciences, 3(2), 131-133.
Berger, A. N., & Patti, E. B. d. (2002), Capital structure and firm performance: A new approachto testing agency theory and an application to the banking industry: Bank of Italy.
Brick, I. E., & Ravid, S. A. (1985), On the relevance of debt maturity structure. The Journal ofFinance, 40(5), 1423-1437.
C.Jensen, M., & Meckling, W. H. (1976), Theory of the firm: Managerial behavior, agency costsand ownership structure. Journal of Financial Economics, 3(4), 305-360.
Cassar, G., & Holmes, S. (2003), Capital structure and financing of SMEs: Australian evidence.Accounting & Finance, 43(2), 123-147.
Champion, D. (1999), Finance: The joy of leverage. Harvard Business Review, 77(4), 19-22.Chowdhury, A., & Chowdhury, S. P. (2010), Impact of capital structure on firm’s value:
Evidence from Bangladesh. Business and Economic Horizons, 3(3), 111-122.Ebaid, I. E.-S. (2009), The impact of capital-structure choice on firm performance: Empirical
evidence from Egypt. The Journal of Risk Finance, 10(5), 477-487.
Capital Structure and Corporate Performance: Evidence from Thailand 1369
Fama, E. F., & French, K. R. (1998), Taxes, financing decisions, and firm value. Journal ofFinance, 53(3), 819-843.
Gleason, K. C., Mathur, L. K., & Mathur, I. (2000), The Interrelationship between culture,capital structure, and performance: Evidence from european retailers. Journal of BusinessResearch, 50(2), 185-191.
Hadlock, C. J., & James, C. M. (2002), Do banks provide financial slack? Journal of Finance, 57(3),1383-1419.
Iorpev, L., & Kwanum, I. M. (2012), Capital structure and firm performance: Evidence frommanufacturing companies in Nigeria. International Journal of Business and ManagementTomorrow, 2(5), 1-17.
Jensen, M. C., & Meckling, W. H. (1976), Theory of the firm: Managerial behavior, agency costsand ownership structure. Journal of Financial Economics, 3(4), 305-360.
Khan, A. G. (2012), The relationship of capital structure decisions with firm performance: Astudy of the engineering sector of Pakistan. International Journal of Accounting and FinancialReporting, 2(1), 245-262.
Krishnan, V. S., & Moyer, R. C. (1997), Performance, capital structure and home country: Ananalysis of Asian corporations. Global Finance Journal, 8(1), 129-143.
Liu, Y., & Ning, X. (2009), Empirical research of the capital structure influencing factors ofelectric power listed companies. International Journal of Marketing Studies, 1(1), 43-49.
Majumdar, S. K., & Chhibber, P. (1999), Capital structure and performance: Evidence from atransition economy on an aspect of corporate governance. Public Choice, 98.
Manawaduge, A., Zoysa, A. D., Chowdhury, K., & Chandarakumara, A. (2011), Capitalstructure and firm performance in emerging economies: An empirical analysis of SriLankan firms. Corporate Ownership & Control, 8(4), 253-263.
Miller, M. H. (1977), Debt and taxes. Journal of Finance, 32(2), 261-276.Modigliani, F., & Miller, M. H. (1958), The Cost of Capital, Corporation Finance and the Theory
of Investment. The American Economic Review, 48(3), 261-297.Modigliani, F., & Miller, M. H. (1963), Corporate income taxes and the cost of capital:A
correction. The American Economic Review, 53(3), 433-443.Muritala, T. A. (2012), An empirical analysis of capital structure on fims’ performance in
Nigeria. International Journal of Advances in Management and Economics, 1(5), 116-124.Myers, S. C. (1977), Determinants of corporate borrowing. Journal of Financial Economics, 5(2),
147-175.Myers, S. C., & Majluf, N. S. (1984), Corporate financing and investment decisions when firms
have information that investors do not have. Journal of Financial Economics, 13(2), 187-221.Nerlove, M. (1968), Factors affecting differences among rates of return on investments in
individual common stocks. Review of Economics and Statistics, 50(3), 312-331.Phillips, P. A., & Sipahioglu, M. A. (2004), Performance implications of capital structure:
evidence from quoted UK organisations with hotel interests. Service Industries Journal,24(5), 31-51.
Rajendran, K., & Nimalthasan, P. (2013), Capital structure and its impact on firm performance:A study on Sri Lankan listed manufacturing companies. Merit Research Journal of Businessand Management 1(2), 37-44.
1370 Nongnit Chancharat
Salehi, M., & Biglar, K. (2009), Study of the relationship between capital structure measuresand performance: Evidence from Iran. International Journal of Business and ManagementTomorrow, 4(1), 97-103.
San, O. T., & Heng, T. B. (2011), Capital structure and finanial performance: Evidence fromselected business companies in Colombo Stock Exchange Sri Lanka. Journal of Arts, Science& Commerce, 2(2), 171-183.
Shahveisi, F., Navid, B. J., Najafi, Y., & Hosseini, S. A. A. (2012), The study of the relationshipbetween the capital structure and the variables of the value-based performanceassessment. Research Journal of Finance and Accounting, 3(7), 131-140.
Sheikh, N. A., & Wang, Z. (2013), The impact of capital structure on performance: An empiricalstudy of non-financial listed firms in Pakistan. International Journal of Commerce andManagement, 23(4), 354 - 368.
Skopljak, V., & Luo, R. H. (2012), Capital structure and firm performance in the financialsector: Evidence from Australia. Asian Journal of Finance & Accounting, 4(1), 278-298.
Taub, A. J. (1975), Determinants of the firm’s capital structure. Review of Economics & Statistics,57(4), 410-416.
Tian, G., & Zeitun, R. (2007), Capital structure and corporate performance: Evidence fromJordan. Australasian Accounting Business & Finance Journal, 1(4), 16-37.
Titman, S. (1984), The effect of capital structure on a firm’s liquidation decisions. Journal ofFinancial Economics, 13(1), 137-151.
Tudose, M. B. (2012), Capital structure and firm performance. Economy TransdisciplinarityCognition, 15(2), 76-82.
Tzelepis, D., & Skuras, D. (2004), The effects of regional capital subsidies on firm performance:An empirical study. Journal of Small Business and Enterprise Development, 11 (1), 121 - 129.
Udomsirikul, P., Jumreornvong, S., & Jiraporn, P. (2011), Liquidity and capital structure: Thecase of Thailand. Journal of Multinational Financial Management, 21(2), 106-117.
Wiwattanakantang, Y. (1999), An empirical study on the determinants of the capital structureof Thai firms. Pacific-Basin Finance Journal, 7(3-4), 371-403.
Wiwattanakantang, Y. (2000), The ownership structure, capital structure and performance of Thaifirms. Unpublished PhD Thesis dissertation, Hitotsubashi University.
Zuraidah Ahmad, Abdullah, N. M. H., & Roslan, S. (2012), Capital structure effect on firmsperformance: Focusing on consumers and industrials sectors on Malaysian firms.International Review of Business Research Papers, 8(5), 137-155.