Embed Size (px)
Citation preview
Capital Services in Microprocessor ProductionQuantitative Implications of a Vintage Model
Ana Aizcorbe1 Samuel Kortum2 Unni Pillai3
1Bureau of Economic Analysis
2University of Chicago
3University at Albany - SUNY
9 Aug 2012

OBJECTIVES
• Derive implications for capital services when technologicalprogress is embodied in new vintages of capital equipment.
• Use these implications, together with detailed data onmicroprocessor production, to calculate capital services in thisindustry.
• Calculate the contribution of capital services in microprocessorproduction.
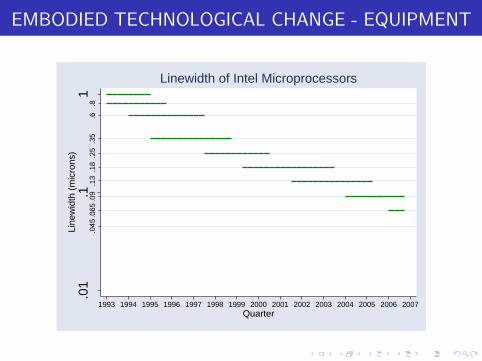
EMBODIED TECHNOLOGICAL CHANGE - EQUIPMENT
.045
.065
.09
.13
.18
.25
.35
.6.8
.01
.11
Line
wid
th (
mic
rons
)
1993 1994 1995 1996 1997 1998 1999 2000 2001 2002 2003 2004 2005 2006 2007Quarter
Linewidth of Intel Microprocessors

EMBODIED TECHNOLOGICAL CHANGE -
DESIGN/MICROARCHITECTURE
12
34
56
78
1993 1994 1995 1996 1997 1998 1999 2000 2001 2002 2003 2004 2005 2006 2007Quarter
Microarchitecture of Intel Microprocessors
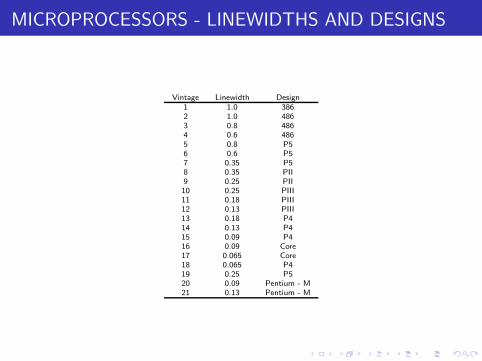
MICROPROCESSORS - LINEWIDTHS AND DESIGNS
Vintage Linewidth Design1 1.0 3862 1.0 4863 0.8 4864 0.6 4865 0.8 P56 0.6 P57 0.35 P58 0.35 PII9 0.25 PII10 0.25 PIII11 0.18 PIII12 0.13 PIII13 0.18 P414 0.13 P415 0.09 P416 0.09 Core17 0.065 Core18 0.065 P419 0.25 P520 0.09 Pentium - M21 0.13 Pentium - M

MODEL
• Time is discrete, t=1,2,3...
• • Linewidth introduced at time t = v indexed by v .• Design/Microarchitecture introduced at time t = m indexed by
m.• Microprocessor vintage indexed by (v ,m).
• For vintage (v ,m) chip, quality At(v ,m), and unit variablecost ct(v ,m), at time t are given.
• The total available capacity of vintage (v ,m) capital at timet, Kt(v ,m), satisfies Kt(v ,m) ≥ Kt′(v ,m),∀t ≥ t ′
• Total microprocessor units produced using vintage (v ,m)capital, yt(v ,m), satisfies yt(v ,m) ≤ Kt(v ,m)
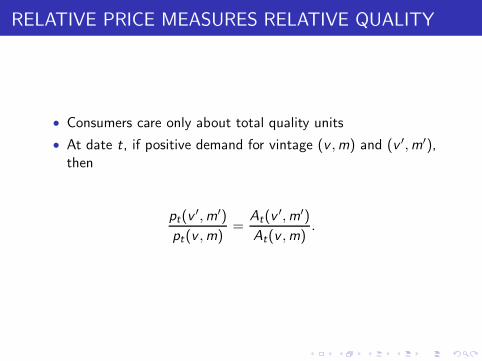
RELATIVE PRICE MEASURES RELATIVE QUALITY
• Consumers care only about total quality units
• At date t, if positive demand for vintage (v ,m) and (v ′,m′),then
pt(v′,m′)
pt(v ,m)=
At(v′,m′)
At(v ,m).
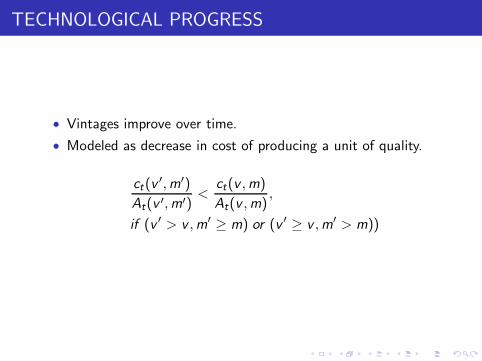
TECHNOLOGICAL PROGRESS
• Vintages improve over time.
• Modeled as decrease in cost of producing a unit of quality.
ct(v′,m′)
At(v ′,m′)<
ct(v ,m)
At(v ,m),
if (v ′ > v ,m′≥ m) or (v ′ ≥ v ,m′
> m))
CAPITAL RENT CALCULATION
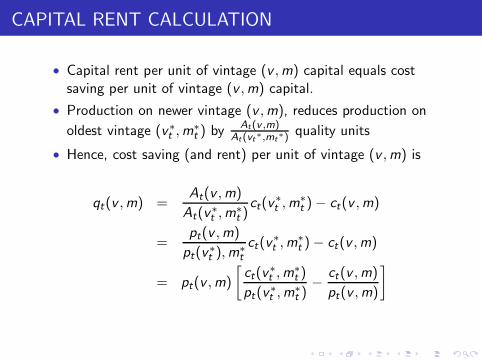
• Capital rent per unit of vintage (v ,m) capital equals costsaving per unit of vintage (v ,m) capital.
• Production on newer vintage (v ,m), reduces production on
oldest vintage (v∗t ,m∗
t ) byAt(v ,m)
At(vt∗,mt∗) quality units
• Hence, cost saving (and rent) per unit of vintage (v ,m) is
qt(v ,m) =At(v ,m)
At(v∗t ,m∗
t )ct(v
∗
t ,m∗
t )− ct(v ,m)
=pt(v ,m)
pt(v∗t ),m∗
t
ct(v∗
t ,m∗
t )− ct(v ,m)
= pt(v ,m)
[
ct(v∗
t ,m∗
t )
pt(v∗
t ,m∗
t )−
ct(v ,m)
pt(v ,m)
]
RENT TO EQUIPMENT AND RENT TO DESIGN
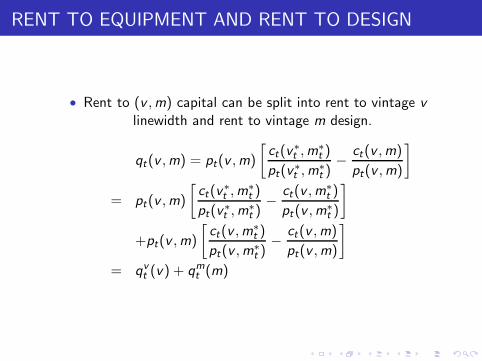
• Rent to (v ,m) capital can be split into rent to vintage v
linewidth and rent to vintage m design.
qt(v ,m) = pt(v ,m)
[
ct(v∗
t ,m∗
t )
pt(v∗
t ,m∗
t )−
ct(v ,m)
pt(v ,m)
]
= pt(v ,m)
[
ct(v∗
t ,m∗
t )
pt(v∗t ,m∗
t )−
ct(v ,m∗
t )
pt(v ,m∗
t )
]
+pt(v ,m)
[
ct(v ,m∗
t )
pt(v ,m∗
t )−
ct(v ,m)
pt(v ,m)
]
= qvt (v) + qmt (m)

THEORY : COST DIAGRAM

DATA SOURCES
• Quarterly quantity and price data on microprocessors fromMDR
• Unit variable cost data from MDR, IC Knowledge
• Linewidth, Microarchitecture of microprocessors from MDR,checked against Intel sources
• Fab production technology from MDR, checked against Intelsources
• Desktop and Laptop Microprocessors used, Servers andWorkstations excluded
• Quarterly data on Fab level investments, from SMA
• Quarterly Interest Rates from LIBOR
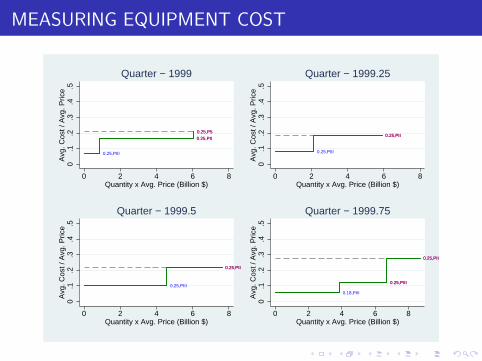
MEASURING EQUIPMENT COST
0.25,PIII
0.25,PII
0.25,P5
0.25,PII
0.25,P5
0.1
.2.3
.4.5
Avg
. Cos
t / A
vg. P
rice
0 2 4 6 8Quantity x Avg. Price (Billion $)
Quarter − 1999
0.25,PIII
0.25,PII0.25,PII
0.1
.2.3
.4.5
Avg
. Cos
t / A
vg. P
rice
0 2 4 6 8Quantity x Avg. Price (Billion $)
Quarter − 1999.25
0.25,PIII
0.25,PII0.25,PII
0.1
.2.3
.4.5
Avg
. Cos
t / A
vg. P
rice
0 2 4 6 8Quantity x Avg. Price (Billion $)
Quarter − 1999.5
0.18,PIII
0.25,PIII
0.25,PII
0.25,PIII
0.25,PII0
.1.2
.3.4
.5A
vg. C
ost /
Avg
. Pric
e
0 2 4 6 8Quantity x Avg. Price (Billion $)
Quarter − 1999.75
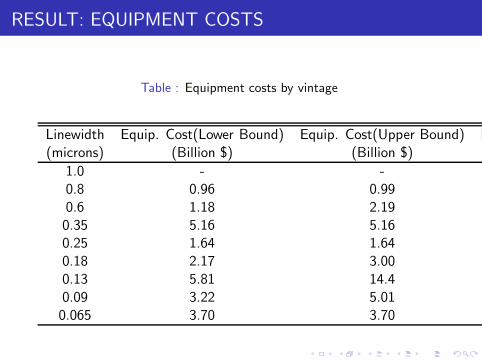
RESULT: EQUIPMENT COSTS
Table : Equipment costs by vintage
Linewidth Equip. Cost(Lower Bound) Equip. Cost(Upper Bound) Equip.(microns) (Billion $) (Billion $)
1.0 - -0.8 0.96 0.990.6 1.18 2.190.35 5.16 5.160.25 1.64 1.640.18 2.17 3.000.13 5.81 14.40.09 3.22 5.010.065 3.70 3.70
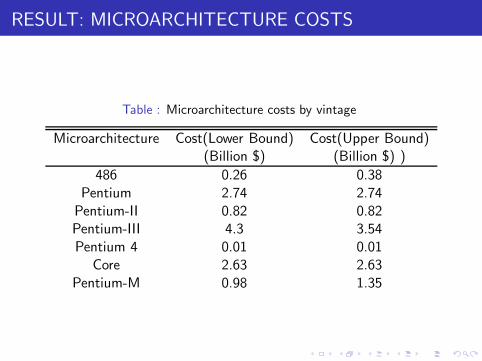
RESULT: MICROARCHITECTURE COSTS
Table : Microarchitecture costs by vintage
Microarchitecture Cost(Lower Bound) Cost(Upper Bound)(Billion $) (Billion $) )
486 0.26 0.38Pentium 2.74 2.74Pentium-II 0.82 0.82Pentium-III 4.3 3.54Pentium 4 0.01 0.01
Core 2.63 2.63Pentium-M 0.98 1.35
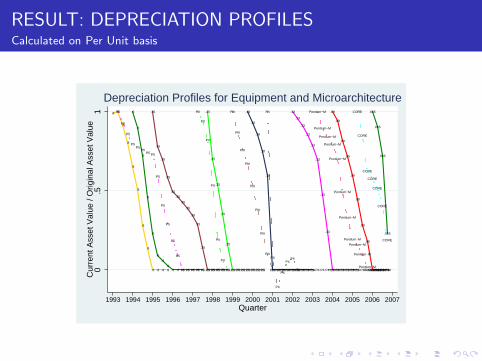
RESULT: DEPRECIATION PROFILESCalculated on Per Unit basis
.065
.065
.065
.065
.09
.09
.09
.09
.09
.09
.09
.09
.09.09.09.09
.13
.13
.13
.13
.13
.13
.13
.13
.13.13.13.13.13.13
.18
.18
.18
.18
.18
.18.18.18.18.18.18.18.18.18
.25
.25
.25
.25
.25
.25.25.25.25.25.25.25
.35
.35
.35
.35
.35
.35
.35
.35
.35
.35
.35
.35.35.35.35.35
.6
.6
.6
.6
.6
.6
.6
.6.6 .6 .6 .6 .6 .6 .6
.8 .8
.8
.8
.8
.8
.8
.8
.8 .8 .8 .8
P5
P5
P5
P5P5
P5P5 P5
P5
P5
P5
P5
P5
P5 P5 P5 P5 P5 P5 P5 P5 P5
P4
P4
P4
P4
P4P4
P4 P4 P4 P4 P4 P4 P4 P4 P4 P4 P4 P4 P4 P4 P4 P4 P4 P4 P4
PII
PII
PII
PII
PII
PII
PII PII PII PII PII PII PII PII
PIII
PIII
PIII
PIII
PIII
PIII
PIII
PIII
PIIIPIIIPIIIPIIIPIIIPIII
CORE
CORE
CORE
CORE
CORE
CORE
CORE
Pentium−M
Pentium−M
Pentium−M
Pentium−M
Pentium−M
Pentium−M
Pentium−M
Pentium−M
Pentium−M
Pentium−M
Pentium−MPentium−MPentium−MPentium−M0
.51
Cur
rent
Ass
et V
alue
/ O
rigin
al A
sset
Val
ue
1993 1994 1995 1996 1997 1998 1999 2000 2001 2002 2003 2004 2005 2006 2007Quarter
Depreciation Profiles for Equipment and Microarchitecture

CONCLUSION
Table : Decomposition of Real Output Growth
Year Real Output Linewidth Design Disembodied Labor1993 0.68 0.27 0.32 -0.133 0.271994 1.17 1.32 0.08 -0.031 0.131995 1.31 1.00 0.51 -0.009 0.031996 1.08 0.37 0.35 0.43 0.121997 1.08 0.70 0.19 0.46 -0.021998 1.04 0.55 0.46 0.13 0.141999 1.35 0.13 0.69 0.25 0.252000 0.65 0.10 0.24 0.44 -0.032001 0.53 0.00 -0.01 0.21 -0.432002 0.68 1.52 0.05 0.06 0.462003 0.61 0.22 0.01 0.30 0.062004 0.61 0.56 0.09 -0.21 0.142005 0.59 0.05 0.06 0.094 0.052006 0.22 0.20 0.19 -1.189 0.02Avg 0.85 0.50 0.23 0.059 0.084

MEASURING EQUIPMENT COST
0.8,486
1,4861,386
0.1
.2.3
.4.5
Avg
. Cos
t / A
vg. P
rice
0 2 4 6 8Quantity x Avg. Price (Billion $)
Quarter − 1993
0.8,4860.8,P5
1,4861,3861,4861,386
0.1
.2.3
.4.5
Avg
. Cos
t / A
vg. P
rice
0 2 4 6 8Quantity x Avg. Price (Billion $)
Quarter − 1993.25
0.8,4860.8,P5
1,3861,486
1,3861,486
0.1
.2.3
.4.5
Avg
. Cos
t / A
vg. P
rice
0 2 4 6 8Quantity x Avg. Price (Billion $)
Quarter − 1993.5
0.8,4860.8,P5
1,3861,486
1,3861,486
0.1
.2.3
.4.5
Avg
. Cos
t / A
vg. P
rice
0 2 4 6 8Quantity x Avg. Price (Billion $)
Quarter − 1993.75
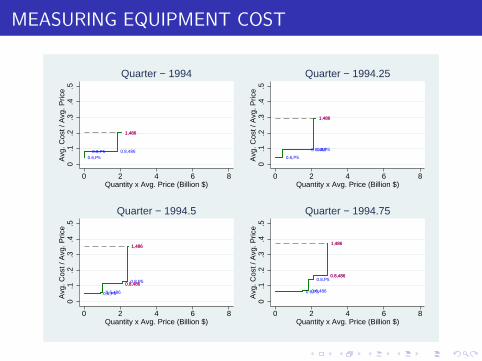
MEASURING EQUIPMENT COST
0.6,P50.8,P5 0.8,486
1,4861,486
0.1
.2.3
.4.5
Avg
. Cos
t / A
vg. P
rice
0 2 4 6 8Quantity x Avg. Price (Billion $)
Quarter − 1994
0.6,P5
0.8,4860.8,P5
1,4861,486
0.1
.2.3
.4.5
Avg
. Cos
t / A
vg. P
rice
0 2 4 6 8Quantity x Avg. Price (Billion $)
Quarter − 1994.25
0.6,P50.6,486
0.8,4860.8,P5
1,486
0.8,486
1,486
0.1
.2.3
.4.5
Avg
. Cos
t / A
vg. P
rice
0 2 4 6 8Quantity x Avg. Price (Billion $)
Quarter − 1994.5
0.6,P50.6,486
0.8,P50.8,486
1,486
0.8,486
1,486
0.1
.2.3
.4.5
Avg
. Cos
t / A
vg. P
rice
0 2 4 6 8Quantity x Avg. Price (Billion $)
Quarter − 1994.75
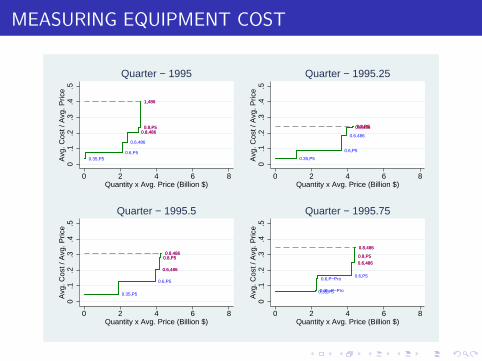
MEASURING EQUIPMENT COST
0.35,P50.6,P5
0.6,486
0.8,4860.8,P5
1,486
0.8,4860.8,P5
1,486
0.1
.2.3
.4.5
Avg
. Cos
t / A
vg. P
rice
0 2 4 6 8Quantity x Avg. Price (Billion $)
Quarter − 1995
0.35,P5
0.6,P5
0.6,486
0.8,4860.8,P50.8,4860.8,P5
0.1
.2.3
.4.5
Avg
. Cos
t / A
vg. P
rice
0 2 4 6 8Quantity x Avg. Price (Billion $)
Quarter − 1995.25
0.35,P5
0.6,P5
0.6,486
0.8,P50.8,486
0.6,486
0.8,P50.8,486
0.1
.2.3
.4.5
Avg
. Cos
t / A
vg. P
rice
0 2 4 6 8Quantity x Avg. Price (Billion $)
Quarter − 1995.5
0.35,P50.35, P−Pro
0.6,P−Pro0.6,P5
0.6,486
0.8,P5
0.8,486
0.6,486
0.8,P5
0.8,486
0.1
.2.3
.4.5
Avg
. Cos
t / A
vg. P
rice
0 2 4 6 8Quantity x Avg. Price (Billion $)
Quarter − 1995.75

MEASURING EQUIPMENT COST
0.35,P50.35, P−Pro
0.6,P−Pro0.6,P5
0.6,486
0.6,P5
0.6,486
0.1
.2.3
.4.5
Avg
. Cos
t / A
vg. P
rice
0 2 4 6 8Quantity x Avg. Price (Billion $)
Quarter − 1996
0.35,P50.35, P−Pro
0.6,P−Pro0.6,P5
0.6,486
0.6,P5
0.6,486
0.1
.2.3
.4.5
Avg
. Cos
t / A
vg. P
rice
0 2 4 6 8Quantity x Avg. Price (Billion $)
Quarter − 1996.25
0.35,P50.35, P−Pro
0.6,P−Pro0.6,P5
0.6,P−Pro0.6,P5
0.1
.2.3
.4.5
Avg
. Cos
t / A
vg. P
rice
0 2 4 6 8Quantity x Avg. Price (Billion $)
Quarter − 1996.5
0.35,P5
0.35, P−Pro
0.6,P50.6,P5
0.1
.2.3
.4.5
Avg
. Cos
t / A
vg. P
rice
0 2 4 6 8Quantity x Avg. Price (Billion $)
Quarter − 1996.75

MEASURING EQUIPMENT COST
0.35,P5
0.35, P−Pro
0.6,P50.6,P5
0.1
.2.3
.4.5
Avg
. Cos
t / A
vg. P
rice
0 2 4 6 8Quantity x Avg. Price (Billion $)
Quarter − 1997
0.35,PII 0.35,P5
0.35, P−Pro
0.6,P5
0.35,P5
0.35, P−Pro
0.6,P5
0.1
.2.3
.4.5
Avg
. Cos
t / A
vg. P
rice
0 2 4 6 8Quantity x Avg. Price (Billion $)
Quarter − 1997.25
0.25,P50.35,PII
0.35,P5
0.35, P−Pro
0.6,P5
0.35,P5
0.35, P−Pro
0.6,P5
0.1
.2.3
.4.5
Avg
. Cos
t / A
vg. P
rice
0 2 4 6 8Quantity x Avg. Price (Billion $)
Quarter − 1997.5
0.25,P50.25,PII0.35,PII
0.35,P50.35, P−Pro
0.35,P50.35, P−Pro
0.1
.2.3
.4.5
Avg
. Cos
t / A
vg. P
rice
0 2 4 6 8Quantity x Avg. Price (Billion $)
Quarter − 1997.75

MEASURING EQUIPMENT COST
0.25,PII0.25,P5
0.35,PII
0.35,P50.35,P5
0.1
.2.3
.4.5
Avg
. Cos
t / A
vg. P
rice
0 2 4 6 8Quantity x Avg. Price (Billion $)
Quarter − 1998
0.25,PII0.25,P5
0.35,PII
0.35,P5
0.35,PII
0.35,P5
0.1
.2.3
.4.5
Avg
. Cos
t / A
vg. P
rice
0 2 4 6 8Quantity x Avg. Price (Billion $)
Quarter − 1998.25
0.25,PII0.25,P5
0.35,PII0.35,P5
0.25,P5
0.35,PII0.35,P5
0.1
.2.3
.4.5
Avg
. Cos
t / A
vg. P
rice
0 2 4 6 8Quantity x Avg. Price (Billion $)
Quarter − 1998.5
0.25,PII0.25,P5
0.35,PII
0.25,P5
0.35,PII0
.1.2
.3.4
.5A
vg. C
ost /
Avg
. Pric
e
0 2 4 6 8Quantity x Avg. Price (Billion $)
Quarter − 1998.75

MEASURING EQUIPMENT COST
0.18,PIII
0.25,PIII
0.25,PII
0.25,PIII
0.25,PII
0.1
.2.3
.4.5
Avg
. Cos
t / A
vg. P
rice
0 2 4 6 8Quantity x Avg. Price (Billion $)
Quarter − 2000
0.18,PIII
0.25,PIII
0.25,PII
0.25,PIII
0.25,PII
0.1
.2.3
.4.5
Avg
. Cos
t / A
vg. P
rice
0 2 4 6 8Quantity x Avg. Price (Billion $)
Quarter − 2000.25
0.18,PIII
0.25,PII0.25,PII
0.1
.2.3
.4.5
Avg
. Cos
t / A
vg. P
rice
0 2 4 6 8Quantity x Avg. Price (Billion $)
Quarter − 2000.5111111
0.18,P40.18,PIII
0.1
.2.3
.4.5
Avg
. Cos
t / A
vg. P
rice
0 2 4 6 8Quantity x Avg. Price (Billion $)
Quarter − 2000.75

MEASURING EQUIPMENT COST
0.18,P40.18,PIII0.18,PIII
0.1
.2.3
.4.5
Avg
. Cos
t / A
vg. P
rice
0 2 4 6 8Quantity x Avg. Price (Billion $)
Quarter − 2001
0.18,PIII
0.18,P4
0.18,PIII
0.1
.2.3
.4.5
Avg
. Cos
t / A
vg. P
rice
0 2 4 6 8Quantity x Avg. Price (Billion $)
Quarter − 2001.25
0.13,PIII
0.18,PIII
0.18,P4
0.18,PIII
0.1
.2.3
.4.5
Avg
. Cos
t / A
vg. P
rice
0 2 4 6 8Quantity x Avg. Price (Billion $)
Quarter − 2001.5
0.13,PIII
0.18,PIII
0.18,P4
0.18,PIII
0.1
.2.3
.4.5
Avg
. Cos
t / A
vg. P
rice
0 2 4 6 8Quantity x Avg. Price (Billion $)
Quarter − 2001.75

MEASURING EQUIPMENT COST
0.13,P40.13,PIII
0.18,PIII0.18,P4
0.18,PIII0.18,P4
0.1
.2.3
.4.5
Avg
. Cos
t / A
vg. P
rice
0 2 4 6 8Quantity x Avg. Price (Billion $)
Quarter − 2002
0.13,P4
0.13,PIII0.18,PIII
0.18,P4
0.18,PIII
0.18,P4
0.1
.2.3
.4.5
Avg
. Cos
t / A
vg. P
rice
0 2 4 6 8Quantity x Avg. Price (Billion $)
Quarter − 2002.25
0.13,P40.13,PIII
0.18,P4
0.13,PIII
0.18,P4
0.1
.2.3
.4.5
Avg
. Cos
t / A
vg. P
rice
0 2 4 6 8Quantity x Avg. Price (Billion $)
Quarter − 2002.5
0.13,PIII0.13,P4
0.18,P4
0.13,PIII
0.18,P4
0.1
.2.3
.4.5
Avg
. Cos
t / A
vg. P
rice
0 2 4 6 8Quantity x Avg. Price (Billion $)
Quarter − 2002.75

MEASURING EQUIPMENT COST
0.13,PIII
0.13,P4
0.18,P4
0.13,PIII
0.18,P4
0.1
.2.3
.4.5
Avg
. Cos
t / A
vg. P
rice
0 2 4 6 8Quantity x Avg. Price (Billion $)
Quarter − 2003
0.13,PIII0.13,PM
0.13,P4
0.13,PIII
0.1
.2.3
.4.5
Avg
. Cos
t / A
vg. P
rice
0 2 4 6 8Quantity x Avg. Price (Billion $)
Quarter − 2003.25
0.13,PIII0.13,PM
0.13,P4
0.13,PIII
0.1
.2.3
.4.5
Avg
. Cos
t / A
vg. P
rice
0 2 4 6 8Quantity x Avg. Price (Billion $)
Quarter − 2003.5
0.13,PM0.13,PIII
0.13,P4
0.13,PIII
0.1
.2.3
.4.5
Avg
. Cos
t / A
vg. P
rice
0 2 4 6 8Quantity x Avg. Price (Billion $)
Quarter − 2003.75

MEASURING EQUIPMENT COST
0.13,PM0.09,P40.13,PIII
0.13,P4
0.13,PIII
0.13,P4
0.1
.2.3
.4.5
Avg
. Cos
t / A
vg. P
rice
0 2 4 6 8Quantity x Avg. Price (Billion $)
Quarter − 2004
0.09,PM0.13,PM0.09,P40.13,PIII
0.13,P4
0.13,PIII
0.13,P4
0.1
.2.3
.4.5
Avg
. Cos
t / A
vg. P
rice
0 2 4 6 8Quantity x Avg. Price (Billion $)
Quarter − 2004.25
0.13,PM0.09,PM0.09,P40.13,PIII
0.13,P4
0.13,PIII
0.13,P4
0.1
.2.3
.4.5
Avg
. Cos
t / A
vg. P
rice
0 2 4 6 8Quantity x Avg. Price (Billion $)
Quarter − 2004.5
0.13,PM0.09,PM0.09,P4
0.13,PIII
0.13,P4
0.13,PIII
0.13,P4
0.1
.2.3
.4.5
Avg
. Cos
t / A
vg. P
rice
0 2 4 6 8Quantity x Avg. Price (Billion $)
Quarter − 2004.75
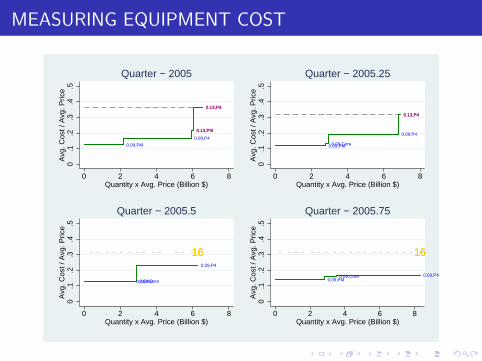
MEASURING EQUIPMENT COST
0.09,PM
0.09,P4
0.13,PIII
0.13,P4
0.13,PIII
0.13,P4
0.1
.2.3
.4.5
Avg
. Cos
t / A
vg. P
rice
0 2 4 6 8Quantity x Avg. Price (Billion $)
Quarter − 2005
0.09,PM0.09,Core
0.09,P4
0.13,P40.13,P4
0.1
.2.3
.4.5
Avg
. Cos
t / A
vg. P
rice
0 2 4 6 8Quantity x Avg. Price (Billion $)
Quarter − 2005.25
16161616
0.09,PM0.09,Core
0.09,P4
0.1
.2.3
.4.5
Avg
. Cos
t / A
vg. P
rice
0 2 4 6 8Quantity x Avg. Price (Billion $)
Quarter − 2005.5
16161616
0.09,PM0.09,Core 0.09,P4
0.1
.2.3
.4.5
Avg
. Cos
t / A
vg. P
rice
0 2 4 6 8Quantity x Avg. Price (Billion $)
Quarter − 2005.75


![Designingenergyefficient’ microprocessor:Howtofight ... Memory ... [MHz] 8086 80286 386DX 486DX 486DX4 Pentium Pentium Pro Pentium II Pentium MMX Pentium III ... Delay buffers are](https://img.pdfslide.us/doc/110x75/5ac1a5637f8b9ac6688d9ef1/designingenergyecient-microprocessorhowtoght-memory-mhz-8086.jpg)