Embed Size (px)
Citation preview
1
Capital Markets Review
Q4 2011
Material prepared by Raymond James for use by its advisors.
Reviewing the quarter ended September 30, 2011
The Shobe Financial Group is an independent service identity. Advisory services and business consulting servicesare offered through Shobe & Associates, Inc, an independent Registered Investment Advisor. Securities are offered throughRaymond James Financial Services, Inc. Member FINRA/SIPC.
One Oak Square ■ 8280 YMCA Plaza Dr.Building #4 ■ Baton Rouge, LA 70810
225-763-7010 ■ 800-942-2777
2
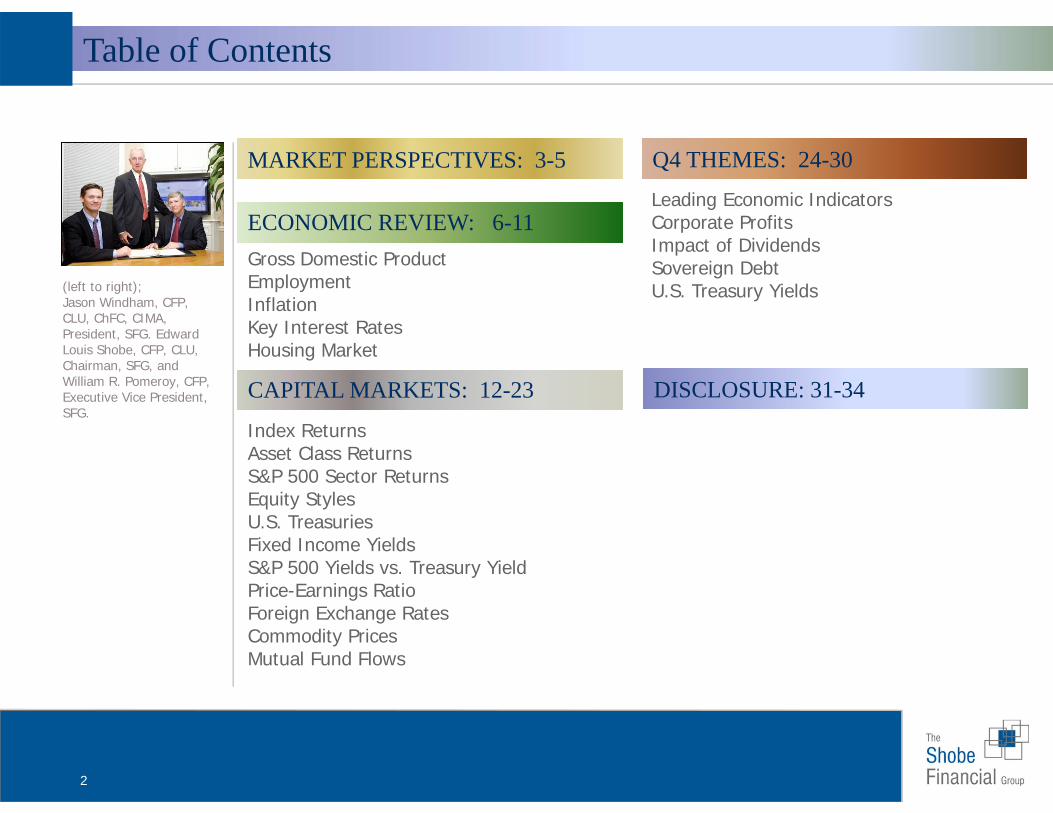
Table of Contents
(left to right); Jason Windham, CFP, CLU, ChFC, CIMA, President, SFG. Edward Louis Shobe, CFP, CLU, Chairman, SFG, and William R. Pomeroy, CFP, Executive Vice President, SFG.
Gross Domestic ProductEmploymentInflation Key Interest RatesHousing Market
ECONOMIC REVIEW: 6-11
Index ReturnsAsset Class Returns S&P 500 Sector ReturnsEquity StylesU.S. TreasuriesFixed Income YieldsS&P 500 Yields vs. Treasury YieldPrice-Earnings RatioForeign Exchange RatesCommodity PricesMutual Fund Flows
CAPITAL MARKETS: 12-23
MARKET PERSPECTIVES: 3-5
Leading Economic IndicatorsCorporate ProfitsImpact of DividendsSovereign DebtU.S. Treasury Yields
Q4 THEMES: 24-30
DISCLOSURE: 31-34
3
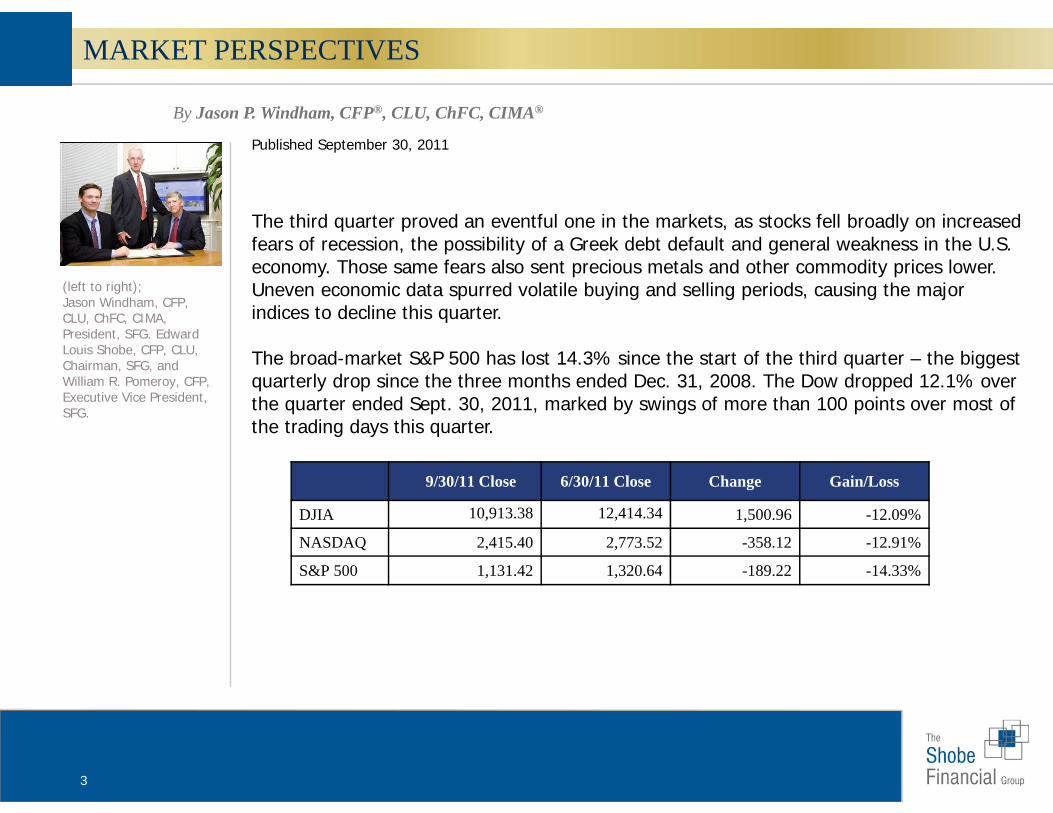
By Jason P. Windham, CFP®, CLU, ChFC, CIMA®
Published September 30, 2011
The third quarter proved an eventful one in the markets, as stocks fell broadly on increased fears of recession, the possibility of a Greek debt default and general weakness in the U.S. economy. Those same fears also sent precious metals and other commodity prices lower. Uneven economic data spurred volatile buying and selling periods, causing the major indices to decline this quarter.
The broad-market S&P 500 has lost 14.3% since the start of the third quarter – the biggest quarterly drop since the three months ended Dec. 31, 2008. The Dow dropped 12.1% over the quarter ended Sept. 30, 2011, marked by swings of more than 100 points over most of the trading days this quarter.
(left to right); Jason Windham, CFP, CLU, ChFC, CIMA, President, SFG. Edward Louis Shobe, CFP, CLU, Chairman, SFG, and William R. Pomeroy, CFP, Executive Vice President, SFG.
MARKET PERSPECTIVES
9/30/11 Close 6/30/11 Close Change Gain/Loss
DJIA 10,913.38 12,414.34 1,500.96 -12.09%
NASDAQ 2,415.40 2,773.52 -358.12 -12.91%
S&P 500 1,131.42 1,320.64 -189.22 -14.33%
4
MARKET PERSPECTIVES
European news and rumors caused the markets to gyrate wildly this summer in some of the most volatile trading on record. There’s speculation that Greece will default in the upcoming weeks or months. To deter that possibility, Greece’s government held an emergency cabinet meeting to plan new measures to bring its budget deficit in line, after warnings from its neighboring nations that efforts thus far were insufficient. Meanwhile, Greece’s lenders and neighbors are doing what they can to prevent a default from causing worldwide financial panic. To that end, finance ministers from the eurozone are considering a second bailout in an effort to contain the debt crisis. Leaders are also looking to expand a more general rescue fund as a temporary solution to buy time. However, a lasting solution to Europe’s debt crisis appears to be hindered by persistent squabbling over fiscal policy. For instance, the currency union’s strongest economies, France and Germany, have proposed that countries coordinate their spending and borrowing more closely. But, several other countries see that as a threat to their sovereignty.
(left to right); Jason Windham, CFP, CLU, ChFC, CIMA, President, SFG. Edward Louis Shobe, CFP, CLU, Chairman, SFG, and William R. Pomeroy, CFP, Executive Vice President, SFG.
5
MARKET PERSPECTIVES
On the other hand, not all the economic news was negative. In recent weeks, 14 of the 18 weekly economic releases came in better than expected. For example, the National Association of Realtors reported sales of existing homes increased a greater-than-expected 7.7% in August. In addition, initial jobless claims decreased 9,000 to 423,000 while the four-week average edged up 500 to 421,000. Also, the Institute for Supply Management said U.S. manufacturing activity unexpectedly rose to 51.1 in September, up from 50.6 in August, higher than was forecast. Generally, a reading above 50 means the sector is growing. In a separate report, U.S. construction spending rose 1.4% in August, surprising the market, which had expected a decline. Raymond James Chief Economist Scott J. Brown, Ph.D., noted this recent economic data has been consistent with the forecast of lackluster-to-moderate growth in the near term – not a recession –although he cautions that the risk of a renewed downturn remains.
Additionally, in late September, the Federal Reserve launched “Operation Twist,” its latest program designed to help the U.S. economy. The U.S. central bank bought $2.5 billion of U.S. government debt due February 2036 to August 2041, causing longer-dated U.S. Treasuries’ prices to reach session highs. The Federal Open Market Committee, known as the FOMC, will meet again Nov. 1-2, 2011.
In times of market volatility and economic uncertainty, it is very easy to be distracted by day-to-day headlines. However, year-end is a great time to refocus on the basic financial-planning fundamentals that underlie a sound financial plan. Please do not hesitate to contact us with any questions or concerns regarding your investment strategy. We would be happy to review it with you.
Investing involves risk, and investors may incur a profit or a loss. Past performance is not an indication of future results. Investors cannot invest directly in an index. The Dow Jones Industrial Average is an unmanaged index of 30 widely held stocks. The NASDAQ Composite Index is an unmanaged index of all common stocks listed on the NASDAQ National Stock Market. The S&P 500 is an unmanaged index of 500 widely held stocks.
(left to right); Jason Windham, CFP, CLU, ChFC, CIMA, President, SFG. Edward Louis Shobe, CFP, CLU, Chairman, Shobe Financial Group (SFG),and William R. Pomeroy, CFP, Executive Vice President, SFG.
6
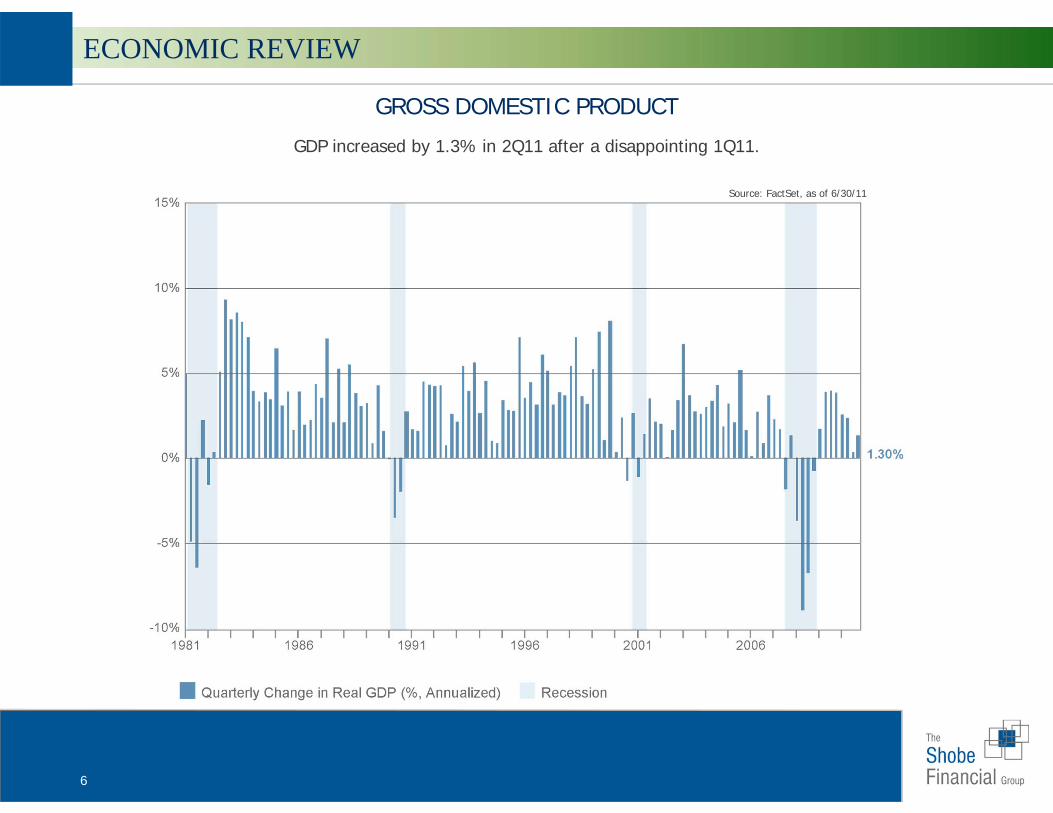
GROSS DOMESTIC PRODUCT
GDP increased by 1.3% in 2Q11 after a disappointing 1Q11.
Source: FactSet, as of 6/30/11
ECONOMIC REVIEW
7
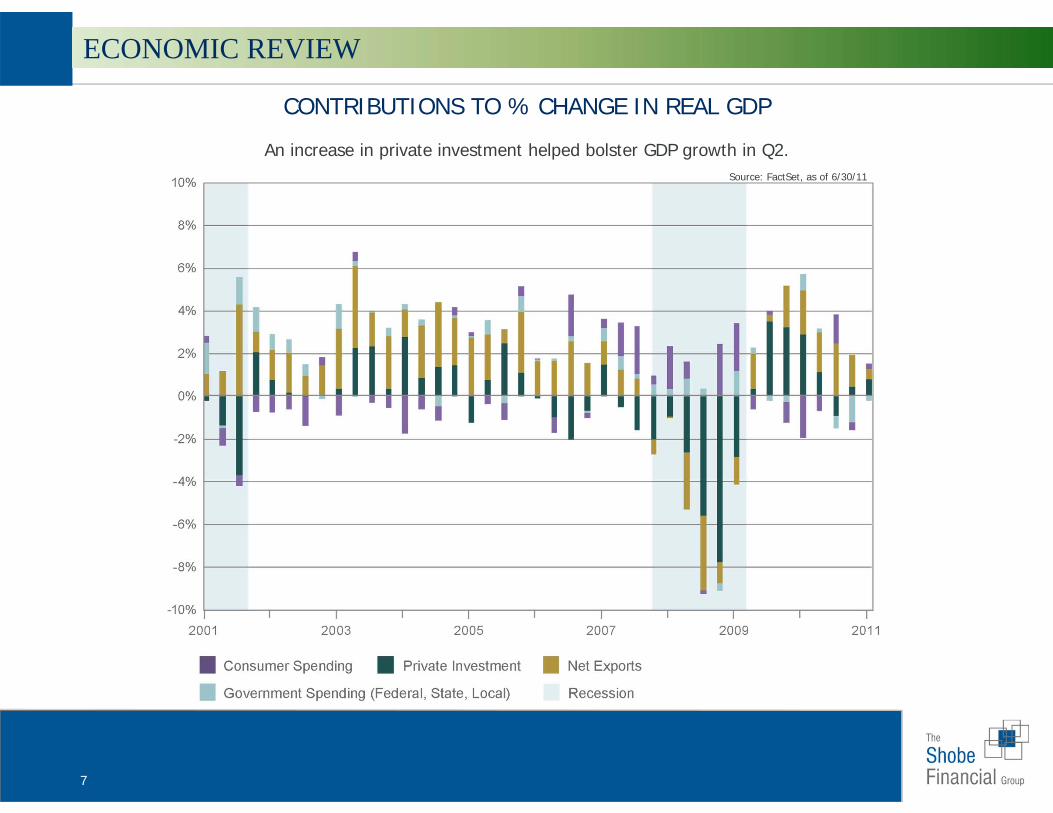
CONTRIBUTIONS TO % CHANGE IN REAL GDP
Source: FactSet, as of 6/30/11
An increase in private investment helped bolster GDP growth in Q2.
ECONOMIC REVIEW
8
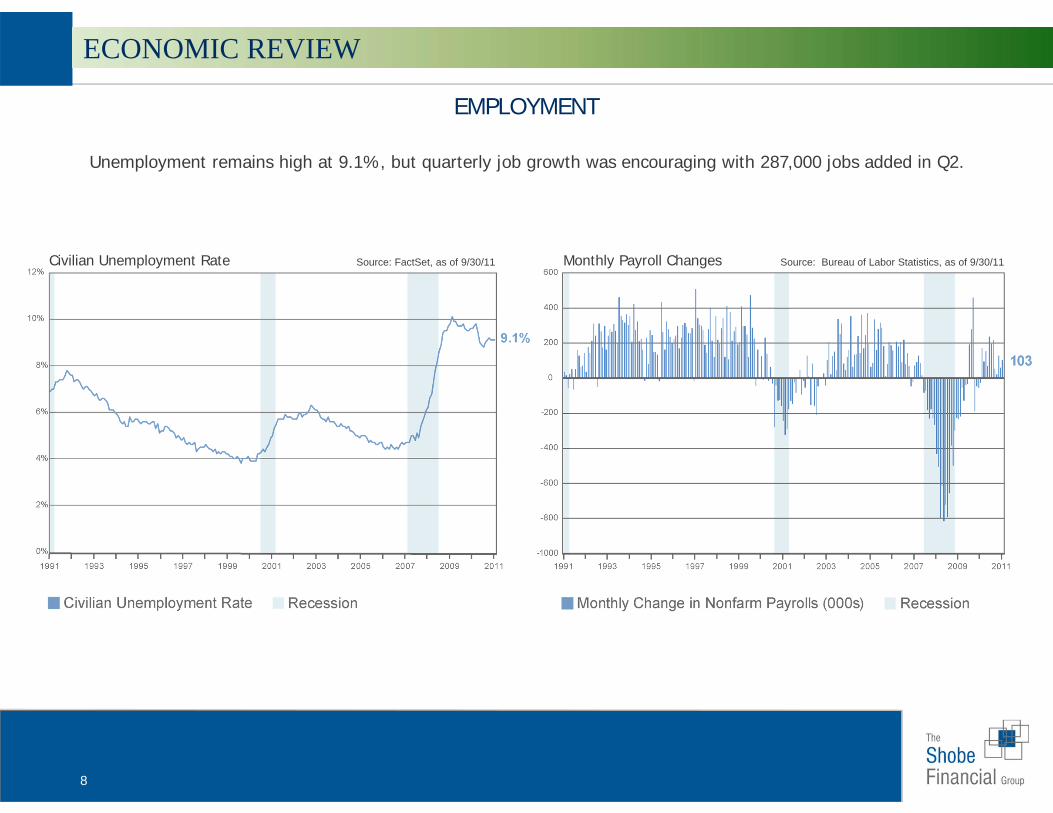
EMPLOYMENT
Source: FactSet, as of 9/30/11Civilian Unemployment Rate Monthly Payroll Changes
Unemployment remains high at 9.1%, but quarterly job growth was encouraging with 287,000 jobs added in Q2.
Source: Bureau of Labor Statistics, as of 9/30/11
ECONOMIC REVIEW
9
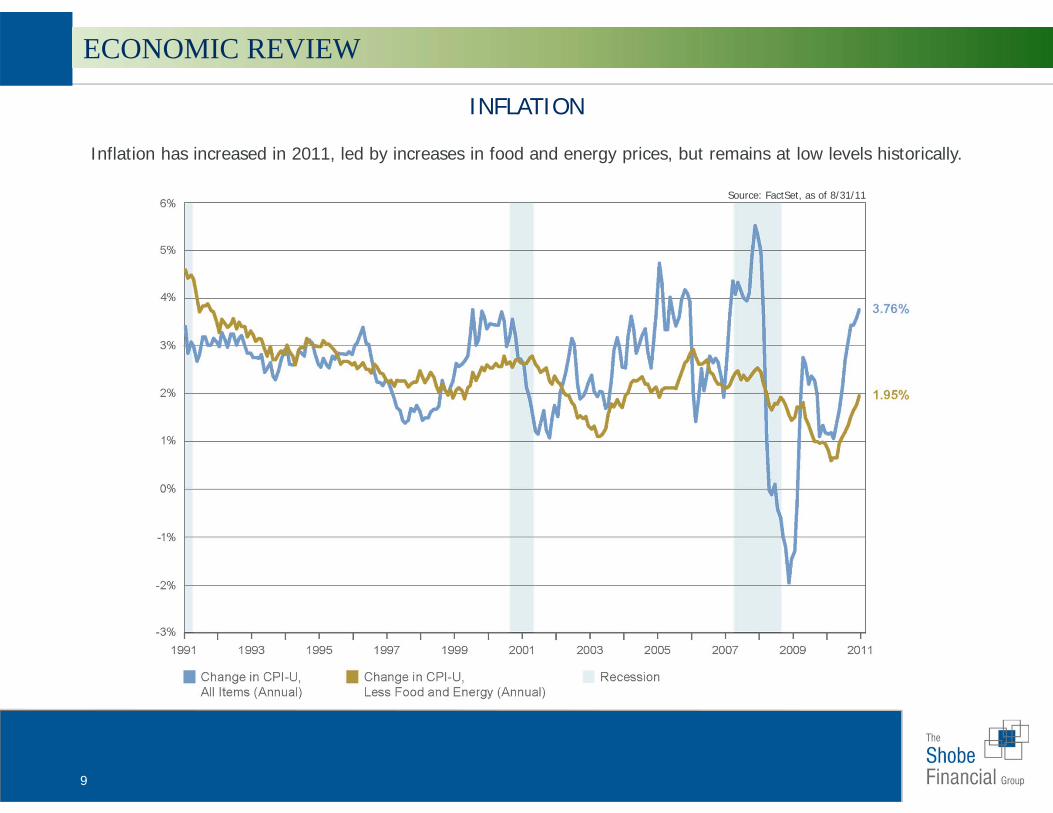
Inflation has increased in 2011, led by increases in food and energy prices, but remains at low levels historically.
INFLATION
Source: FactSet, as of 8/31/11
ECONOMIC REVIEW
10
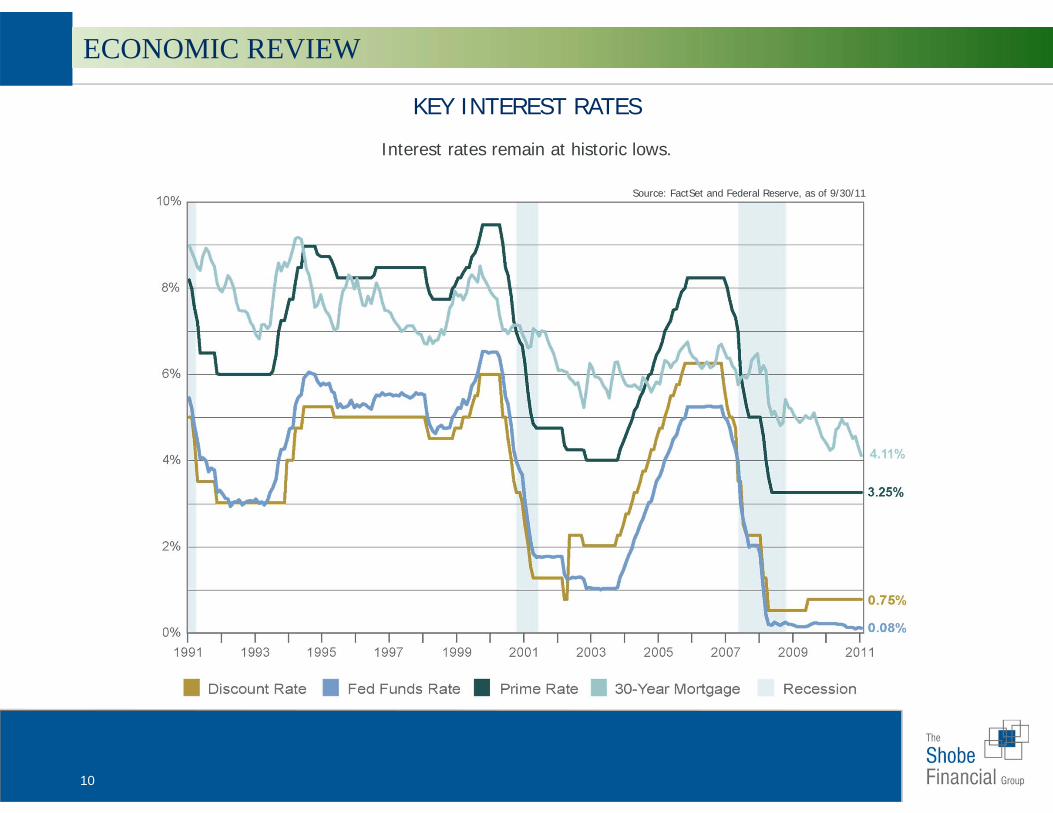
KEY INTEREST RATES
Source: FactSet and Federal Reserve, as of 9/30/11
Interest rates remain at historic lows.
ECONOMIC REVIEW
11
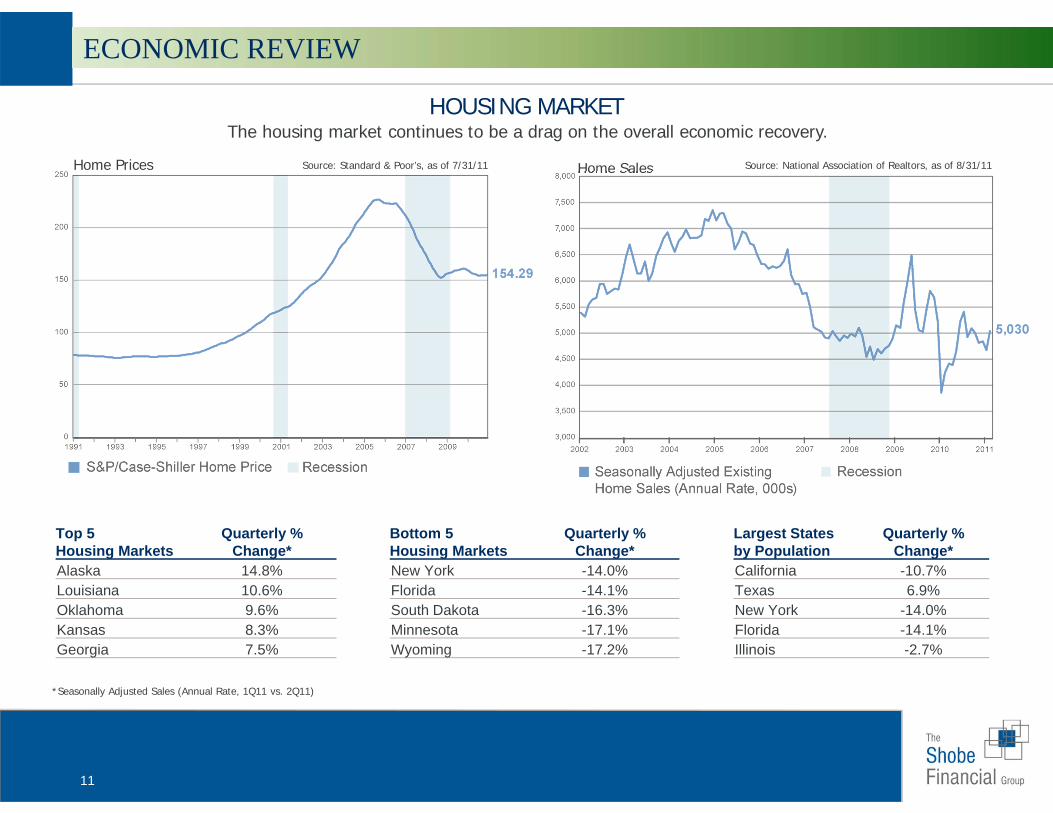
HOUSING MARKET
Source: Standard & Poor’s, as of 7/31/11Home Prices Source: National Association of Realtors, as of 8/31/11Home Sales
*Seasonally Adjusted Sales (Annual Rate, 1Q11 vs. 2Q11)
The housing market continues to be a drag on the overall economic recovery.
Top 5 Housing Markets
Quarterly %Change*
Alaska 14.8%Louisiana 10.6%Oklahoma 9.6%Kansas 8.3%Georgia 7.5%
Bottom 5 Housing Markets
Quarterly %Change*
New York -14.0%Florida -14.1%South Dakota -16.3%Minnesota -17.1%Wyoming -17.2%
Largest States by Population
Quarterly % Change*
California -10.7%Texas 6.9%New York -14.0%Florida -14.1%Illinois -2.7%
ECONOMIC REVIEW
12
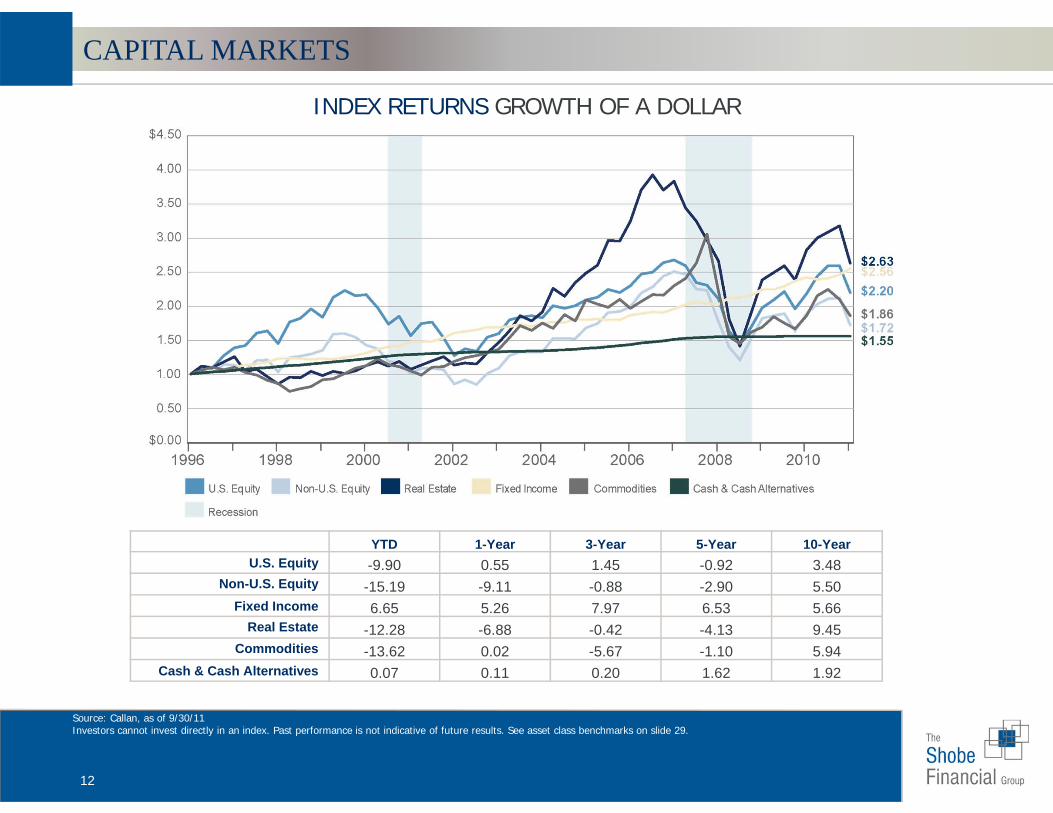
YTD 1-Year 3-Year 5-Year 10-YearU.S. Equity -9.90 0.55 1.45 -0.92 3.48
Non-U.S. Equity -15.19 -9.11 -0.88 -2.90 5.50Fixed Income 6.65 5.26 7.97 6.53 5.66
Real Estate -12.28 -6.88 -0.42 -4.13 9.45Commodities -13.62 0.02 -5.67 -1.10 5.94
Cash & Cash Alternatives 0.07 0.11 0.20 1.62 1.92
Source: Callan, as of 9/30/11Investors cannot invest directly in an index. Past performance is not indicative of future results. See asset class benchmarks on slide 29.
INDEX RETURNS GROWTH OF A DOLLAR
CAPITAL MARKETS
13
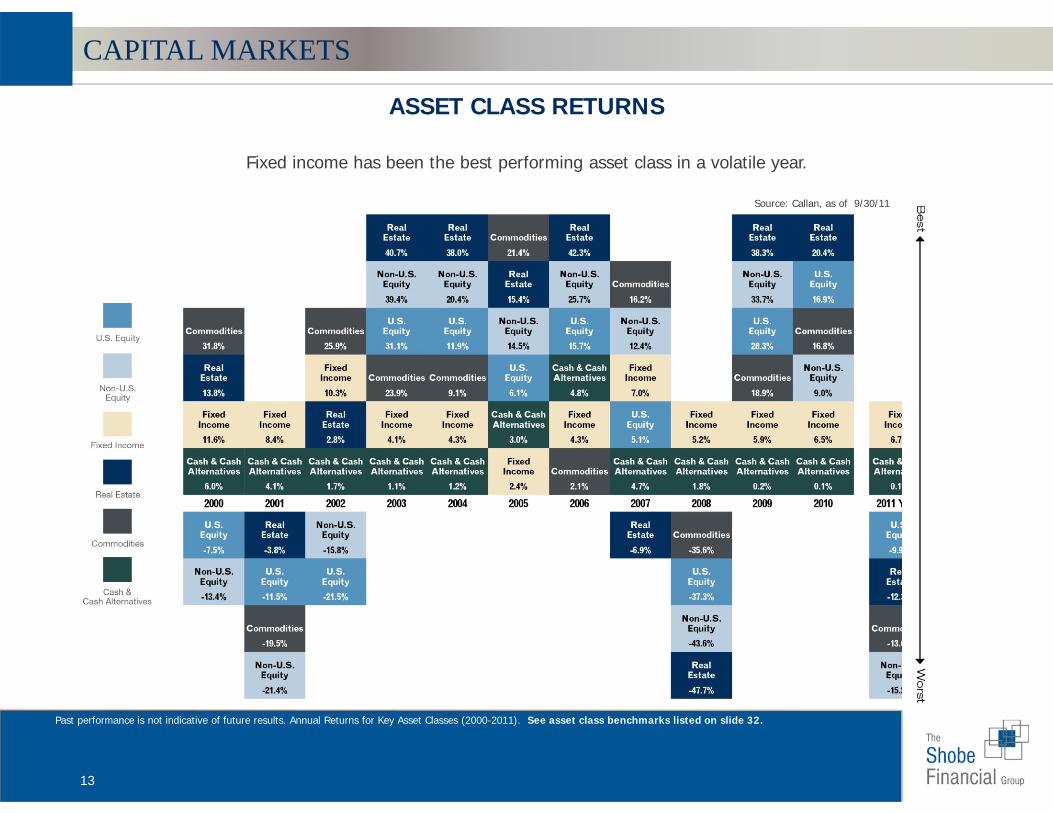
ASSET CLASS RETURNS
Past performance is not indicative of future results. Annual Returns for Key Asset Classes (2000-2011). See asset class benchmarks listed on slide 32.
Fixed income has been the best performing asset class in a volatile year.
Source: Callan, as of 9/30/11
CAPITAL MARKETS
14
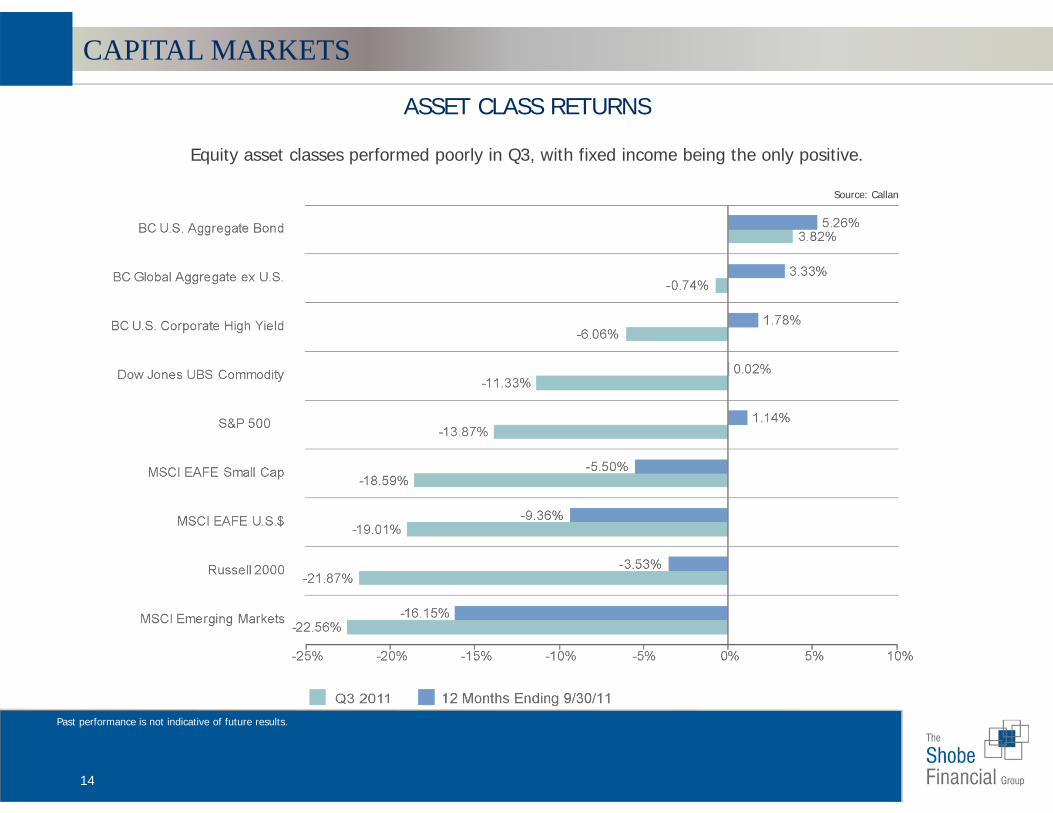
ASSET CLASS RETURNS
Past performance is not indicative of future results.
Equity asset classes performed poorly in Q3, with fixed income being the only positive.
Source: Callan
CAPITAL MARKETS
15
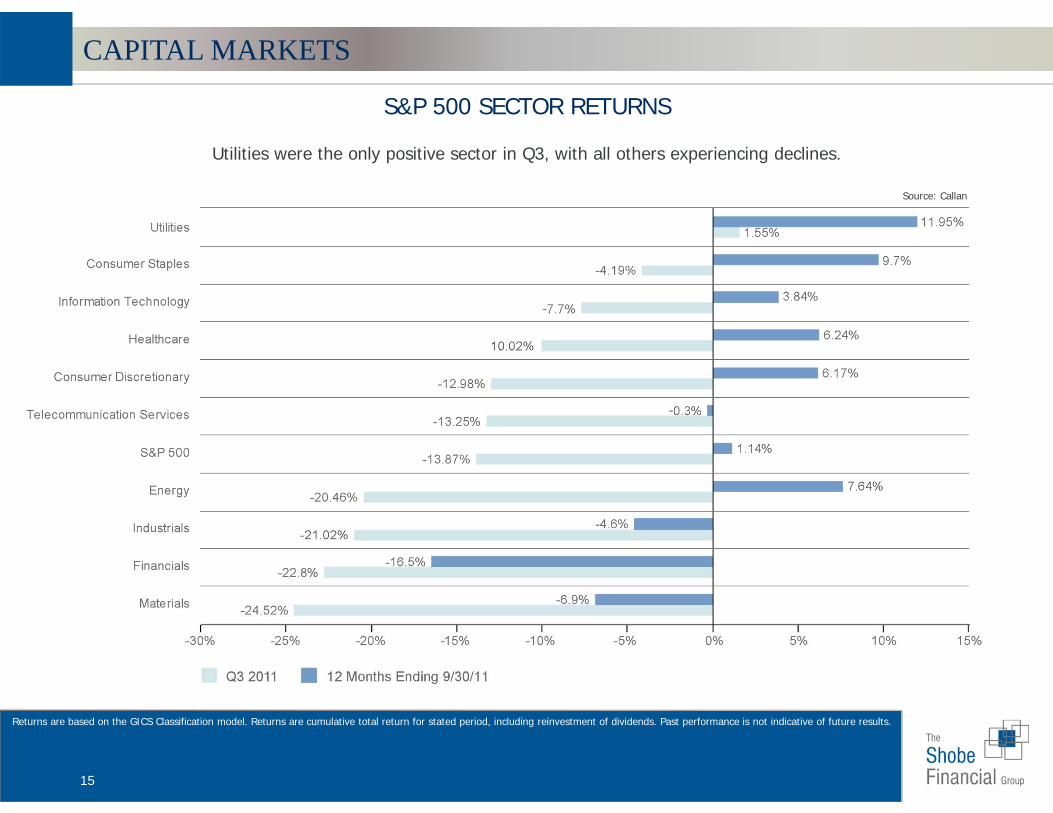
S&P 500 SECTOR RETURNS
Returns are based on the GICS Classification model. Returns are cumulative total return for stated period, including reinvestment of dividends. Past performance is not indicative of future results.
Utilities were the only positive sector in Q3, with all others experiencing declines.
Source: Callan
CAPITAL MARKETS
16
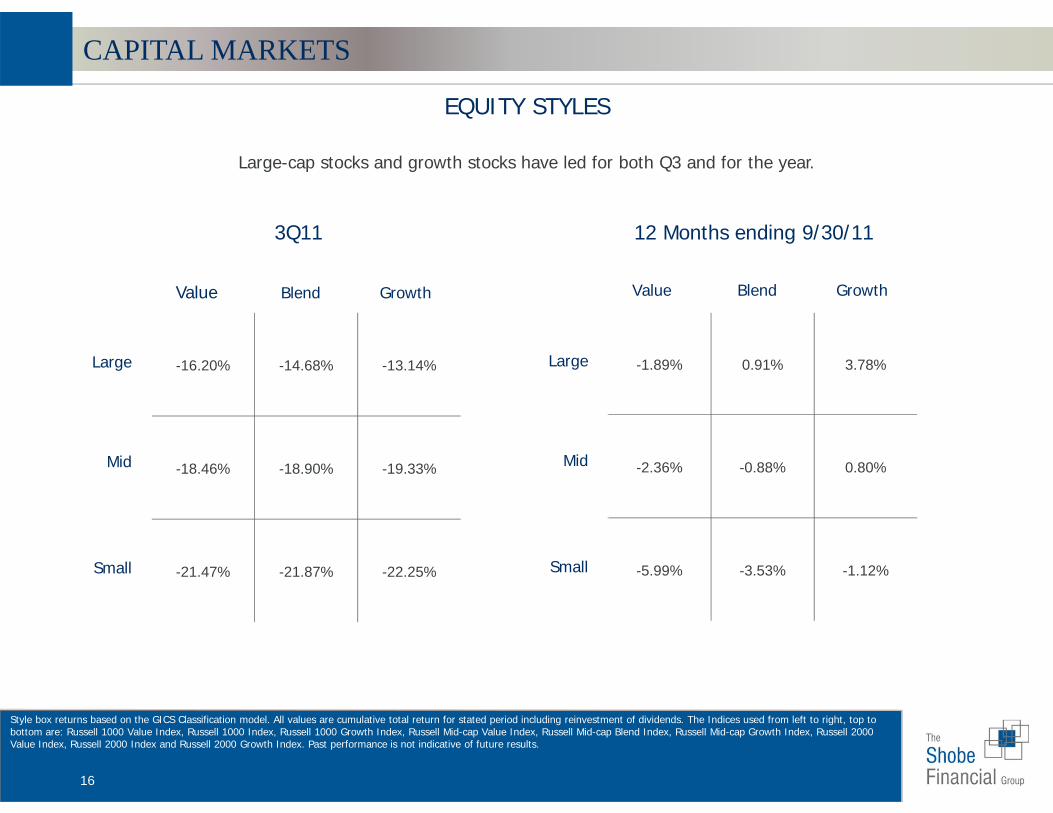
EQUITY STYLES
12 Months ending 9/30/113Q11
Style box returns based on the GICS Classification model. All values are cumulative total return for stated period including reinvestment of dividends. The Indices used from left to right, top to bottom are: Russell 1000 Value Index, Russell 1000 Index, Russell 1000 Growth Index, Russell Mid-cap Value Index, Russell Mid-cap Blend Index, Russell Mid-cap Growth Index, Russell 2000 Value Index, Russell 2000 Index and Russell 2000 Growth Index. Past performance is not indicative of future results.
-1.89% 0.91% 3.78%
-2.36% -0.88% 0.80%
-5.99% -3.53% -1.12%
Large
Mid
Small
Value Blend Growth
-16.20% -14.68% -13.14%
-18.46% -18.90% -19.33%
-21.47% -21.87% -22.25%
Large
Mid
Small
Value Blend Growth
Large-cap stocks and growth stocks have led for both Q3 and for the year.
CAPITAL MARKETS

17
U.S. TREASURIES
Source: U.S. Treasury, as of 9/30/11 Source: FactSet, as of 9/30/11Treasury Yield Curve 2YR/10YR Treasury Spreads
The Treasury curve flattened sharply in Q3 with the 10-year yield falling below 2%.
CAPITAL MARKETS
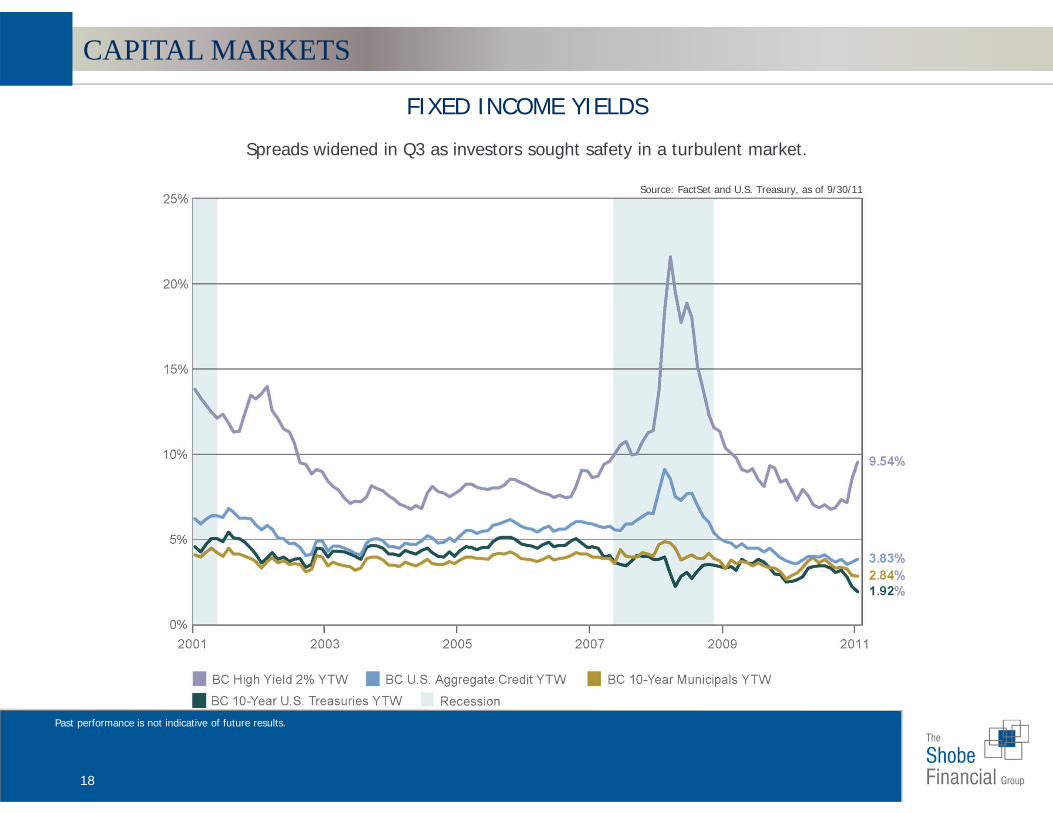
18
FIXED INCOME YIELDS
Source: FactSet and U.S. Treasury, as of 9/30/11
Past performance is not indicative of future results.
Spreads widened in Q3 as investors sought safety in a turbulent market.
CAPITAL MARKETS
19
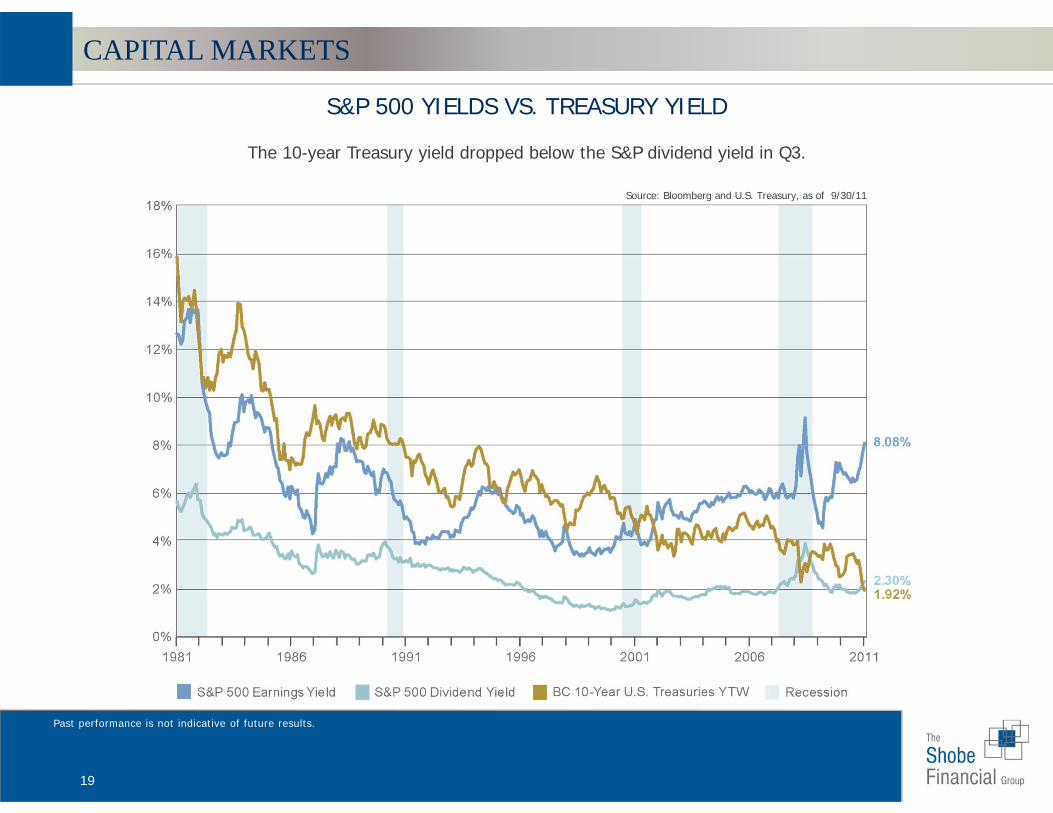
S&P 500 YIELDS VS. TREASURY YIELD
Source: Bloomberg and U.S. Treasury, as of 9/30/11
Past performance is not indicative of future results.
The 10-year Treasury yield dropped below the S&P dividend yield in Q3.
CAPITAL MARKETS
20
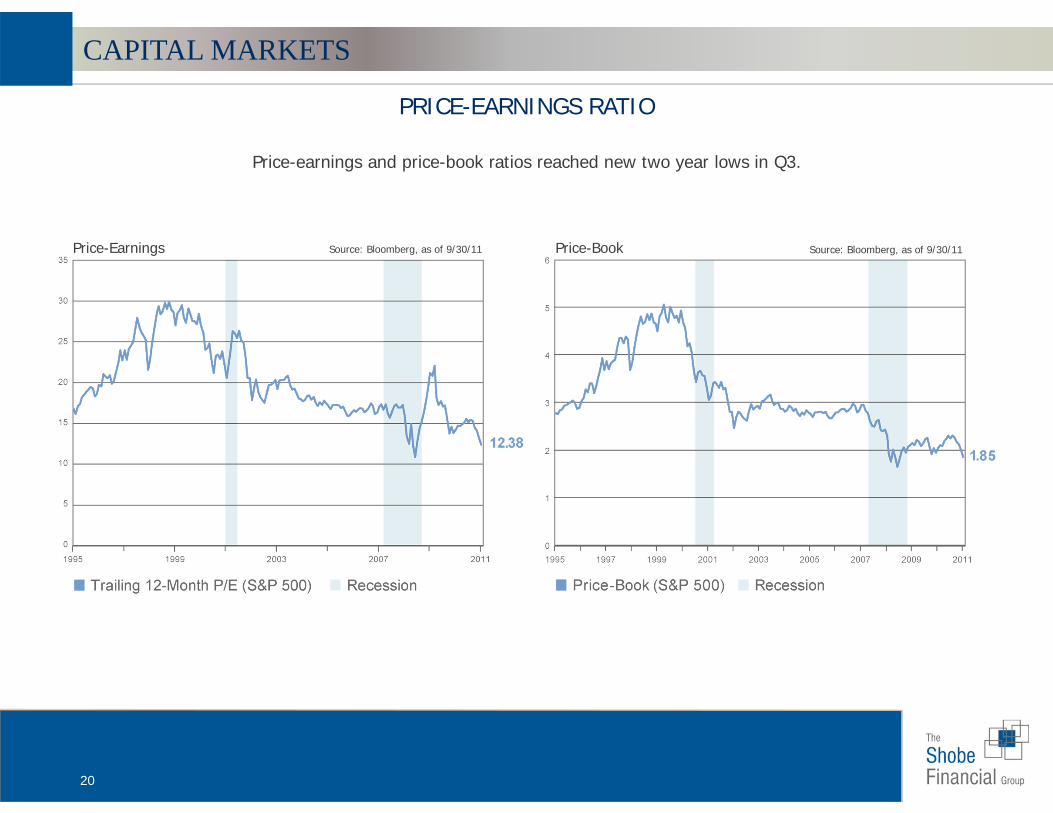
PRICE-EARNINGS RATIO
Source: Bloomberg, as of 9/30/11Price-Earnings Price-Book
Price-earnings and price-book ratios reached new two year lows in Q3.
Source: Bloomberg, as of 9/30/11
CAPITAL MARKETS
21
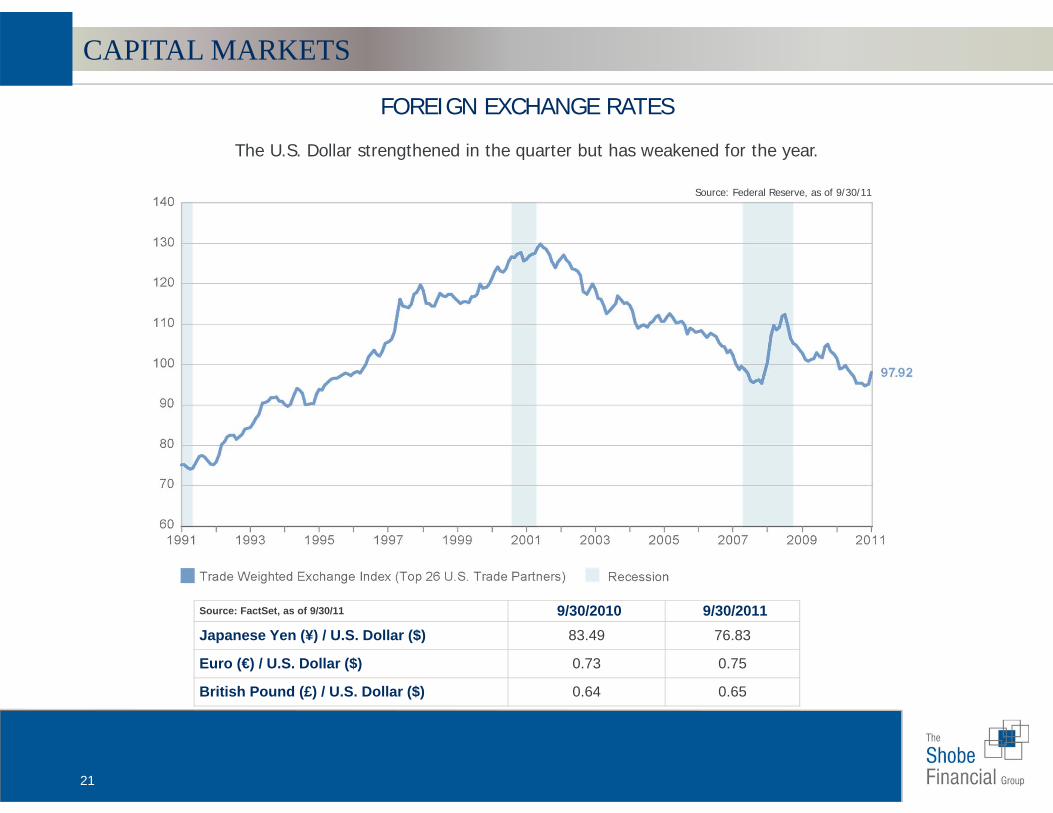
FOREIGN EXCHANGE RATES
Source: Federal Reserve, as of 9/30/11
The U.S. Dollar strengthened in the quarter but has weakened for the year.
Source: FactSet, as of 9/30/11 9/30/2010 9/30/2011Japanese Yen (¥) / U.S. Dollar ($) 83.49 76.83
Euro (€) / U.S. Dollar ($) 0.73 0.75
British Pound (£) / U.S. Dollar ($) 0.64 0.65
CAPITAL MARKETS
22
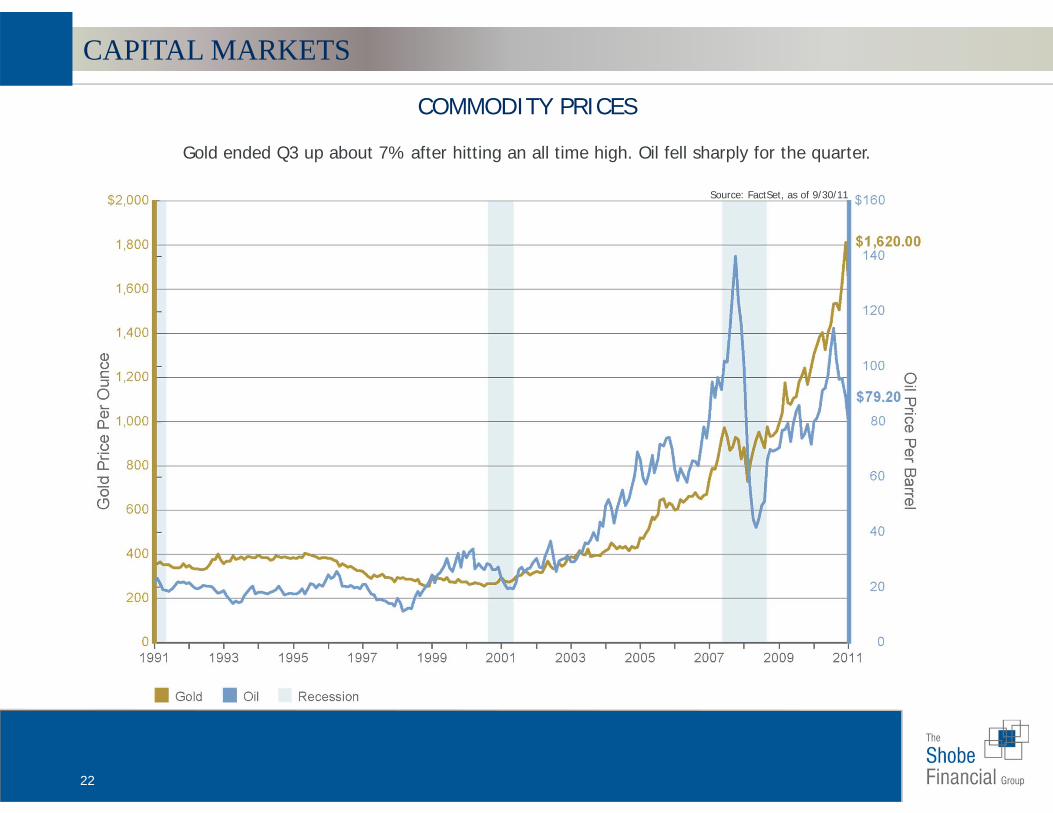
COMMODITY PRICES
Source: FactSet, as of 9/30/11
Gold ended Q3 up about 7% after hitting an all time high. Oil fell sharply for the quarter.
CAPITAL MARKETS
23
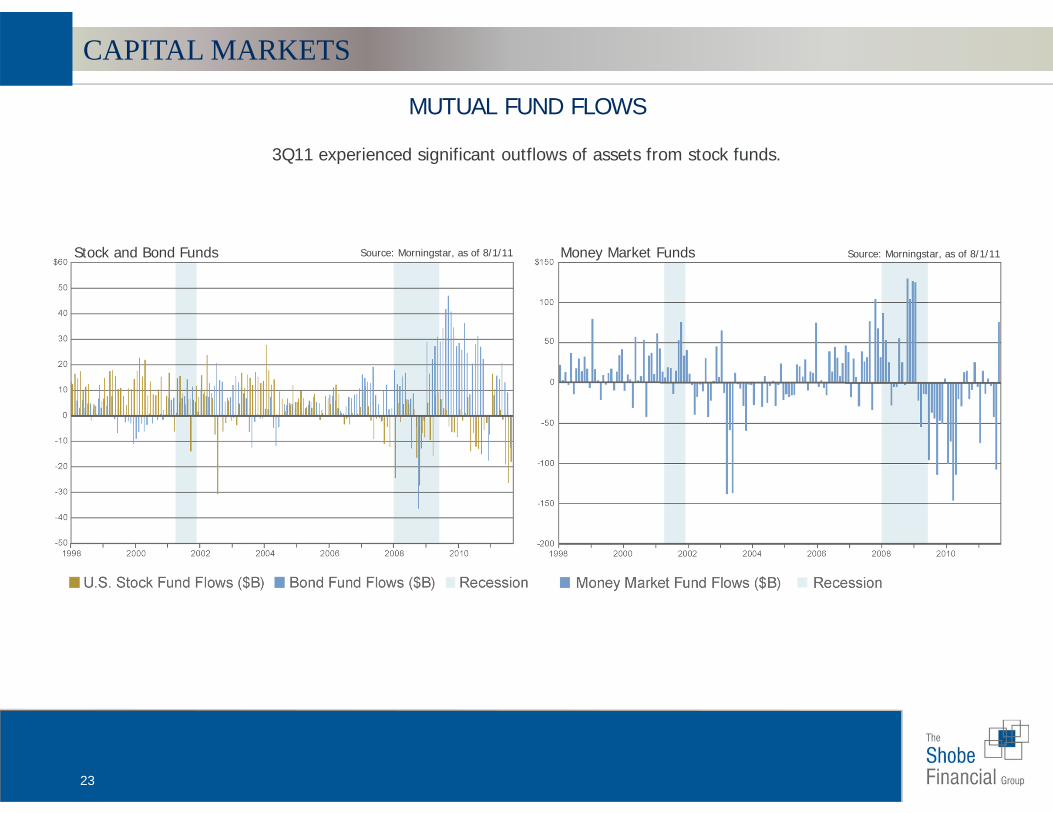
MUTUAL FUND FLOWS
Source: Morningstar, as of 8/1/11Stock and Bond Funds Money Market Funds
3Q11 experienced significant outflows of assets from stock funds.
Source: Morningstar, as of 8/1/11
CAPITAL MARKETS
24
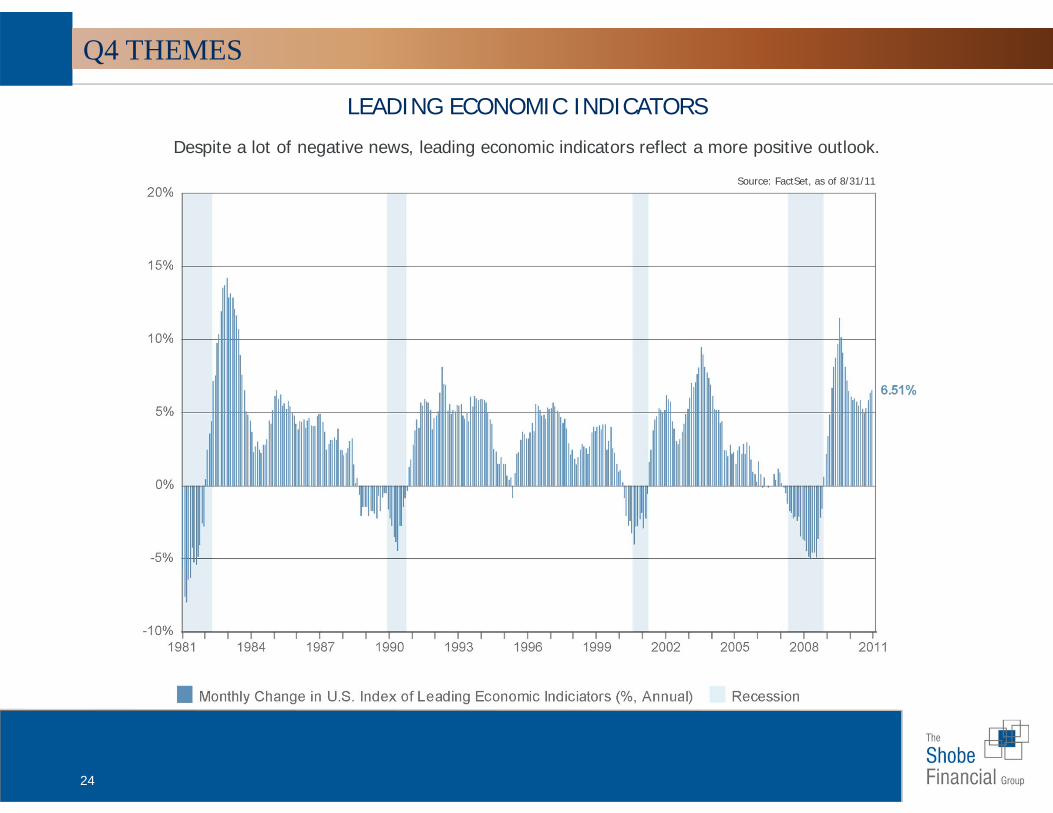
LEADING ECONOMIC INDICATORS
Despite a lot of negative news, leading economic indicators reflect a more positive outlook.
Source: FactSet, as of 8/31/11
Q4 THEMES
25
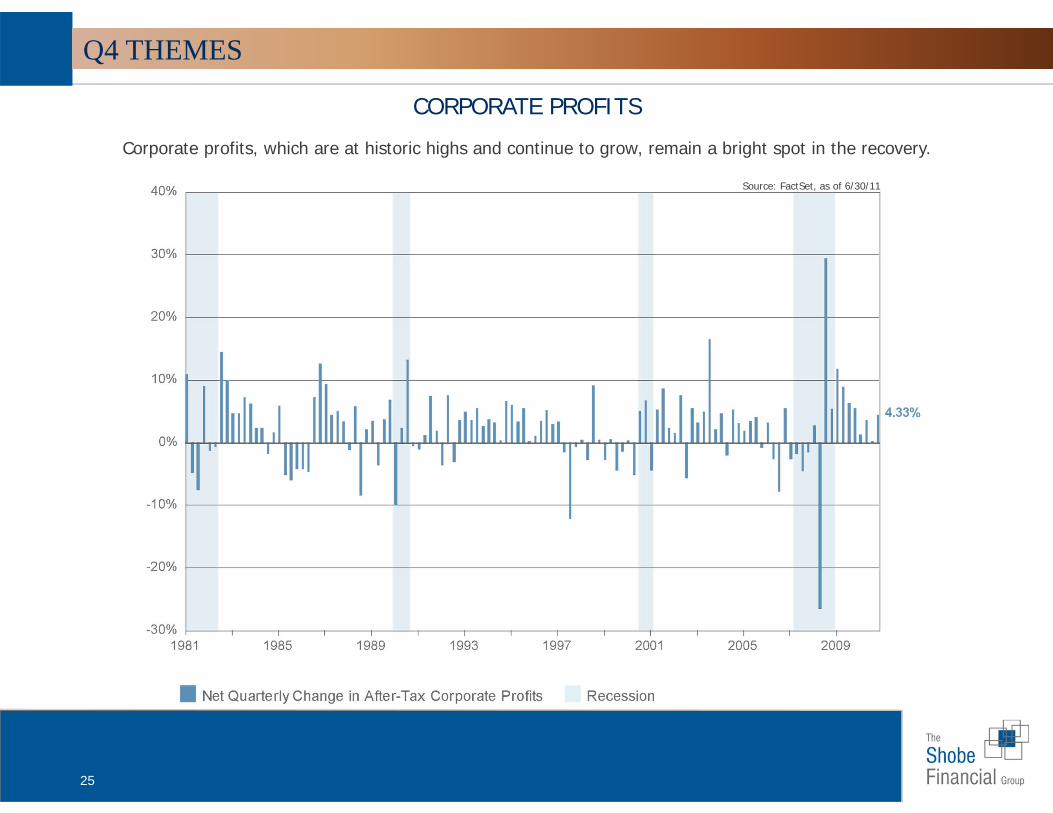
Corporate profits, which are at historic highs and continue to grow, remain a bright spot in the recovery.
CORPORATE PROFITS
Source: FactSet, as of 6/30/11
Q4 THEMES

26
IMPACT OF DIVIDENDS GROWTH OF A DOLLAR
Source: Bloomberg, as of 9/30/11
The long-term impact of dividends on equity returns is significant.
Q4 THEMES
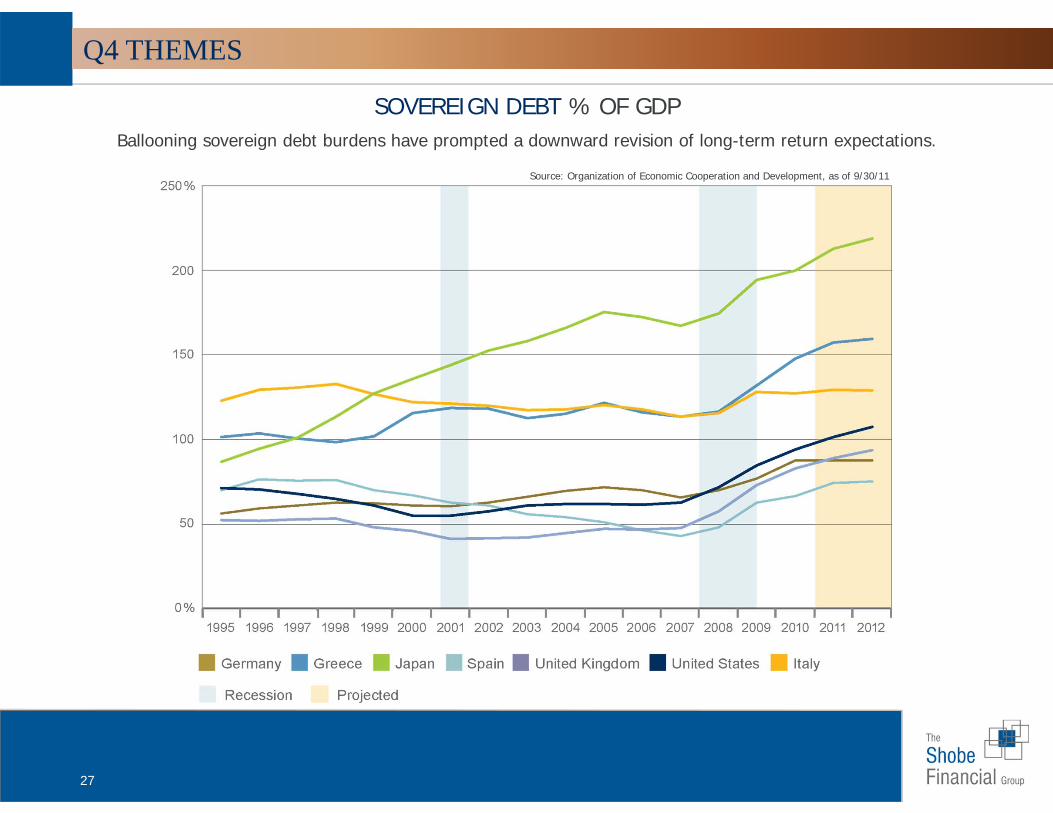
27
SOVEREIGN DEBT % OF GDPBallooning sovereign debt burdens have prompted a downward revision of long-term return expectations.
Source: Organization of Economic Cooperation and Development, as of 9/30/11
Q4 THEMES
28
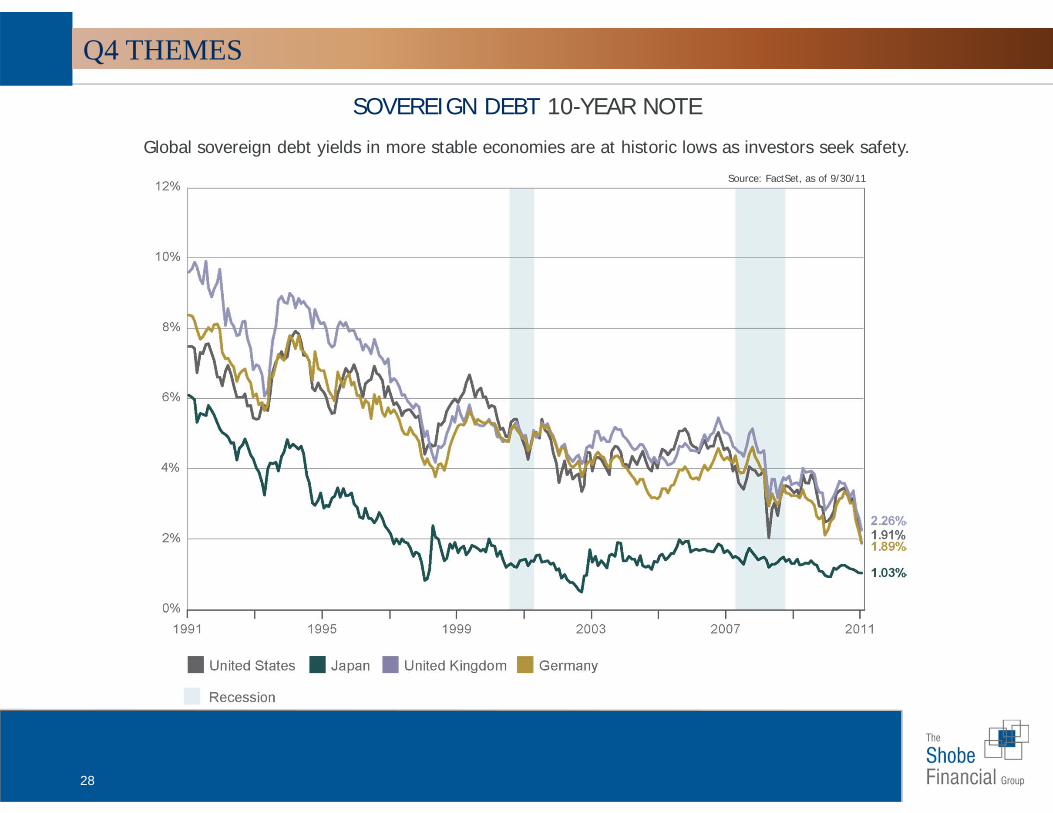
SOVEREIGN DEBT 10-YEAR NOTE
Global sovereign debt yields in more stable economies are at historic lows as investors seek safety.
Source: FactSet, as of 9/30/11
Q4 THEMES
29
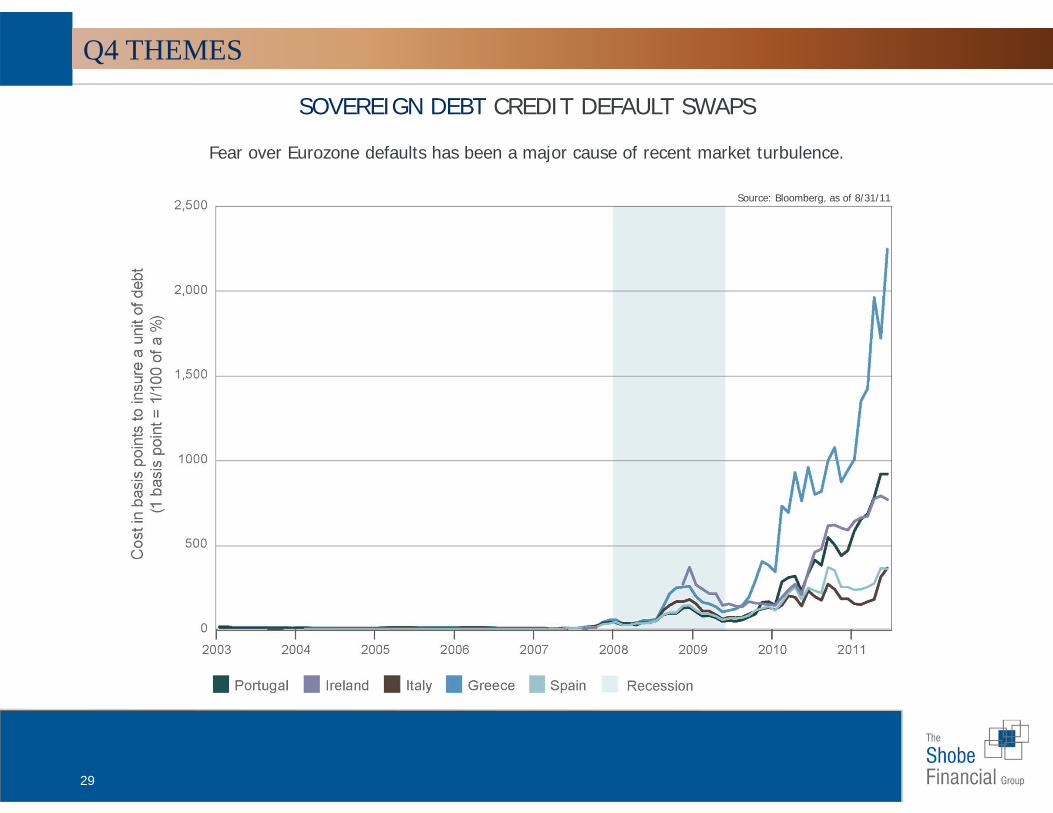
SOVEREIGN DEBT CREDIT DEFAULT SWAPS
Fear over Eurozone defaults has been a major cause of recent market turbulence.
Source: Bloomberg, as of 8/31/11
Q4 THEMES
30
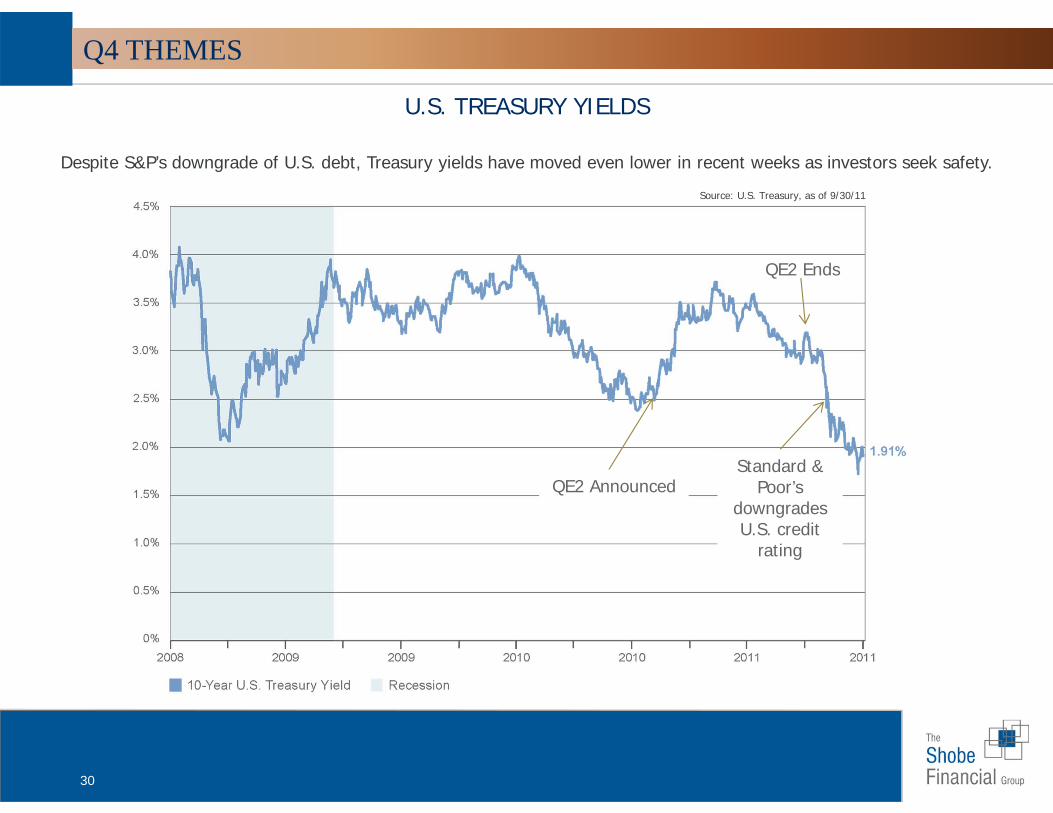
U.S. TREASURY YIELDS
Despite S&P’s downgrade of U.S. debt, Treasury yields have moved even lower in recent weeks as investors seek safety.
Source: U.S. Treasury, as of 9/30/11
Standard & Poor’s
downgrades U.S. credit
rating
QE2 Ends
QE2 Announced
Q4 THEMES
31
Data provided by Raymond James Asset Management Services.
This material is for informational purposes only and should not be used or construed as a recommendation regarding any security outside of a managed account.
There is no assurance that any investment strategy will be successful or that any securities transaction, holdings, sectors or allocations discussed will be profitable. It should not be assumed that any investment recommendation or decisions made in the future will be profitable or will equal any investment performance discussed herein.
Please note that all indices are unmanaged and investors cannot invest directly in an index. An investor who purchases an investment product that attempts to mimic the performance of an index will incur expenses that would reduce returns. Past performance is not indicative of future results. The performance noted in this presentation does not include fees and costs, which would reduce an investor's returns.
Fixed income securities are subject to interest rate risk. Generally, when interest rates rise, bond prices fall, and vice versa. Specific-sector investing can be subject to different and greater risks than more diversified investments.
The Consumer Price Index (CPI) is a measure of inflation.
Gross Domestic Product (GDP) is the annual total market value of all final goods and services produced domestically by the United States.
Investing in small-cap and mid-cap stocks generally involves greater risks, and, therefore, may not be appropriate for every investor. International investing also involves special risks, including currency fluctuations, different financial accounting standards, and possible political and economic volatility.
High-yield bonds are not suitable for all investors. The risk of default may increase due to changes in the issuer’s credit quality. Price changes may occur due to changes in interest rates and the liquidity of the bond. When appropriate, these bonds should only comprise a modest portion of your portfolio.
Commodities trading is generally considered speculative because of the significant potential for investment loss.
U.S. government bonds and Treasury bills are guaranteed by the U.S. government and, if held to maturity, offer a fixed rate of return and guaranteed principal value. U.S. government bonds are issued and guaranteed as to the timely payment of principal and interest by the federal government. Treasury bills are certificates reflecting short-term (less than one year) obligations of the U.S. government.
Fixed Income Sectors: Returns based on the four sectors of Lehman Global Sector Classification Scheme: Securitized (consisting of U.S. MBS Index, the ERISA-Eligible CMBS Index and the fixed-rate ABS Index), Government Related (consisting of U.S. Agencies and non-corporate debts with four sub sectors: Agencies, Local Authorities, Sovereign and Supranational), Corporate (dollar-denominated debt from U.S. and non-U.S. industrial, utility, and financial institutions issuers), and Treasuries (includes public obligations of the U.S. Treasury that have remaining maturities of one year or more).
Diversification does not guarantee a profit nor protect against loss. Dividends are not guaranteed and will fluctuate.
DISCLOSURE
32
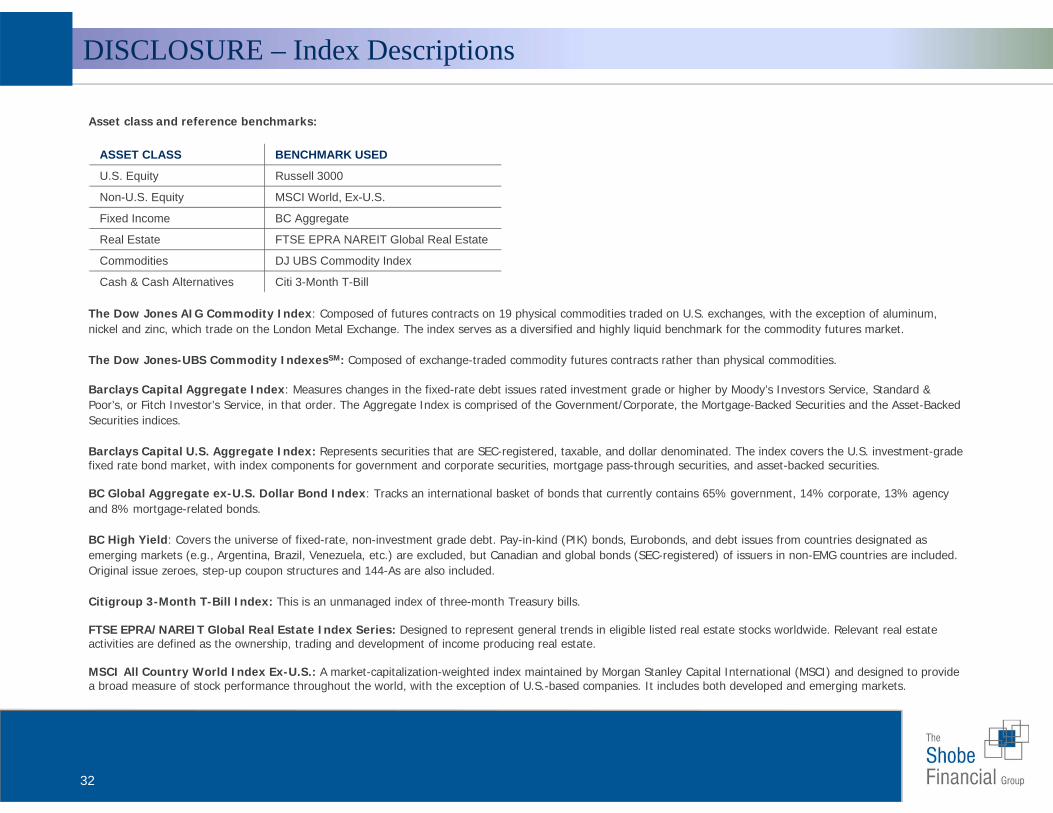
Asset class and reference benchmarks:
The Dow Jones AIG Commodity Index: Composed of futures contracts on 19 physical commodities traded on U.S. exchanges, with the exception of aluminum, nickel and zinc, which trade on the London Metal Exchange. The index serves as a diversified and highly liquid benchmark for the commodity futures market.
The Dow Jones-UBS Commodity IndexesSM: Composed of exchange-traded commodity futures contracts rather than physical commodities.
Barclays Capital Aggregate Index: Measures changes in the fixed-rate debt issues rated investment grade or higher by Moody’s Investors Service, Standard & Poor’s, or Fitch Investor’s Service, in that order. The Aggregate Index is comprised of the Government/Corporate, the Mortgage-Backed Securities and the Asset-Backed Securities indices.
Barclays Capital U.S. Aggregate Index: Represents securities that are SEC-registered, taxable, and dollar denominated. The index covers the U.S. investment-grade fixed rate bond market, with index components for government and corporate securities, mortgage pass-through securities, and asset-backed securities.
BC Global Aggregate ex-U.S. Dollar Bond Index: Tracks an international basket of bonds that currently contains 65% government, 14% corporate, 13% agency and 8% mortgage-related bonds.
BC High Yield: Covers the universe of fixed-rate, non-investment grade debt. Pay-in-kind (PIK) bonds, Eurobonds, and debt issues from countries designated as emerging markets (e.g., Argentina, Brazil, Venezuela, etc.) are excluded, but Canadian and global bonds (SEC-registered) of issuers in non-EMG countries are included. Original issue zeroes, step-up coupon structures and 144-As are also included.
Citigroup 3-Month T-Bill Index: This is an unmanaged index of three-month Treasury bills.
FTSE EPRA/NAREIT Global Real Estate Index Series: Designed to represent general trends in eligible listed real estate stocks worldwide. Relevant real estate activities are defined as the ownership, trading and development of income producing real estate.
MSCI All Country World Index Ex-U.S.: A market-capitalization-weighted index maintained by Morgan Stanley Capital International (MSCI) and designed to provide a broad measure of stock performance throughout the world, with the exception of U.S.-based companies. It includes both developed and emerging markets.
ASSET CLASS BENCHMARK USED
U.S. Equity Russell 3000
Non-U.S. Equity MSCI World, Ex-U.S.
Fixed Income BC Aggregate
Real Estate FTSE EPRA NAREIT Global Real Estate
Commodities DJ UBS Commodity Index
Cash & Cash Alternatives Citi 3-Month T-Bill
DISCLOSURE – Index Descriptions
33
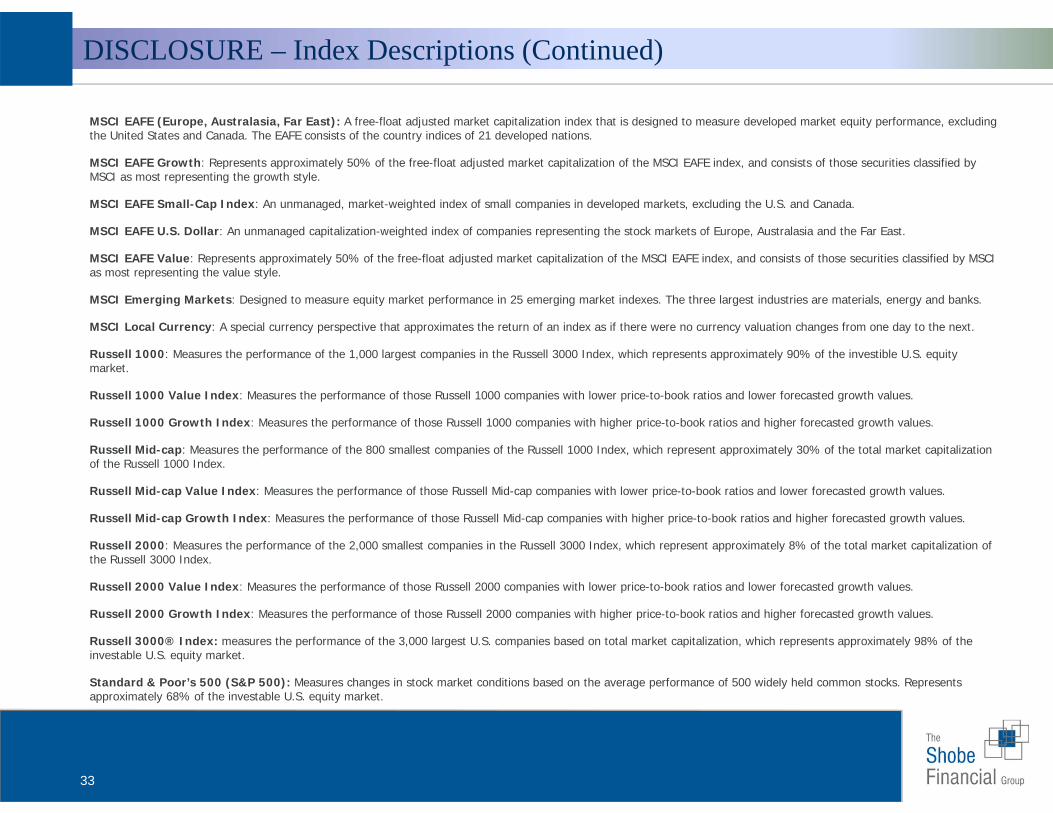
MSCI EAFE (Europe, Australasia, Far East): A free-float adjusted market capitalization index that is designed to measure developed market equity performance, excluding the United States and Canada. The EAFE consists of the country indices of 21 developed nations.
MSCI EAFE Growth: Represents approximately 50% of the free-float adjusted market capitalization of the MSCI EAFE index, and consists of those securities classified by MSCI as most representing the growth style.
MSCI EAFE Small-Cap Index: An unmanaged, market-weighted index of small companies in developed markets, excluding the U.S. and Canada.
MSCI EAFE U.S. Dollar: An unmanaged capitalization-weighted index of companies representing the stock markets of Europe, Australasia and the Far East.
MSCI EAFE Value: Represents approximately 50% of the free-float adjusted market capitalization of the MSCI EAFE index, and consists of those securities classified by MSCI as most representing the value style.
MSCI Emerging Markets: Designed to measure equity market performance in 25 emerging market indexes. The three largest industries are materials, energy and banks.
MSCI Local Currency: A special currency perspective that approximates the return of an index as if there were no currency valuation changes from one day to the next.
Russell 1000: Measures the performance of the 1,000 largest companies in the Russell 3000 Index, which represents approximately 90% of the investible U.S. equity market.
Russell 1000 Value Index: Measures the performance of those Russell 1000 companies with lower price-to-book ratios and lower forecasted growth values.
Russell 1000 Growth Index: Measures the performance of those Russell 1000 companies with higher price-to-book ratios and higher forecasted growth values.
Russell Mid-cap: Measures the performance of the 800 smallest companies of the Russell 1000 Index, which represent approximately 30% of the total market capitalization of the Russell 1000 Index.
Russell Mid-cap Value Index: Measures the performance of those Russell Mid-cap companies with lower price-to-book ratios and lower forecasted growth values.
Russell Mid-cap Growth Index: Measures the performance of those Russell Mid-cap companies with higher price-to-book ratios and higher forecasted growth values.
Russell 2000: Measures the performance of the 2,000 smallest companies in the Russell 3000 Index, which represent approximately 8% of the total market capitalization of the Russell 3000 Index.
Russell 2000 Value Index: Measures the performance of those Russell 2000 companies with lower price-to-book ratios and lower forecasted growth values.
Russell 2000 Growth Index: Measures the performance of those Russell 2000 companies with higher price-to-book ratios and higher forecasted growth values.
Russell 3000® Index: measures the performance of the 3,000 largest U.S. companies based on total market capitalization, which represents approximately 98% of the investable U.S. equity market.
Standard & Poor’s 500 (S&P 500): Measures changes in stock market conditions based on the average performance of 500 widely held common stocks. Represents approximately 68% of the investable U.S. equity market.
DISCLOSURE – Index Descriptions (Continued)
34
Any opinions are those of Shobe & Associates Inc. and not necessarily those of RJFS or Raymond James. Expressions of opinion are as of this date and are subject to change without notice. The S&P 500 is an unmanaged index of 500 widely held stocks. Keep in mind that you cannot invest directly into an index. Please note that international investing involves special risks, including currency fluctuations, differing financial accounting standards, and possible political and economic volatility. Investing in emerging markets can be riskier than investing in well‐ established foreign markets. Investing involves risk and investors may incur a profit or a loss. There is an inverse relationship between interest rate movements and bond prices. Generally, when interest rates rise, bond prices fall and when interest rates fall, bond prices generally rise. High‐yield (below investment grade) bonds are not suitable for all investors. When appropriate, these bonds should only comprise a modest portion of your portfolio. Commodities may be subject to greater volatility than investments in traditional securities. Investments in commodities may be affected by overall market movements, changes in interest rates, and other factors such as weather, disease, embargoes and international economic and political developments.
DISCLOSURE – Shobe & Associates
35
The Shobe Financial Group is an independent service identity. Advisory services and business consulting services are offered through Shobe & Associates, Inc, an independent Registered Investment Advisor. Securities are offered through Raymond James Financial Services, Inc. Member FINRA/SIPC.
The Shobe Financial Group has created plans designed tohelp clients reach their life goals through personal andbusiness financial planning and wealth building since1983.
We have several industry partnerships including ouradvisors’ association with Raymond James FinancialServices, a full-service broker/dealer, member of theFinancial Industry Regulatory Authority (FINRA)and the Securities Investor Protection Corporation(SIPC). Established in 1962, RaymondJames Financial Services' brings, long-termstability, a strong reputation and helpful resourcesto The Shobe Financial Group.
E-Mail: [email protected]
Helping people achieve life goals through good financial decisions.
One Oak Square ■ 8280 YMCA Plaza Dr.Building #4 ■ Baton Rouge, LA 70810225-763-7010 ■ 800-942-2777
www.shobe.com
© 2011 Raymond James & Associates, Inc. member New York Stock Exchange/SIPC© 2011 Raymond James Financial Services, Inc. member FINRA/SIPC 10-RJNet-0422 10/10