Embed Size (px)
Citation preview

MULTINATIONAL FIRMS, FDI FLOWS, AND IMPERFECTCAPITAL MARKETS∗
POL ANTRAS
MIHIR A. DESAI
C. FRITZ FOLEY
This paper examines how costly financial contracting and weak investor pro-tection influence the cross-border operational, financing, and investment decisionsof firms. We develop a model in which product developers can play a useful role inmonitoring the deployment of their technology abroad. The analysis demonstratesthat when firms want to exploit technologies abroad, multinational firm (MNC)activity and foreign direct investment (FDI) flows arise endogenously when mon-itoring is nonverifiable and financial frictions exist. The mechanism generatingMNC activity is not the risk of technological expropriation by local partners butthe demands of external funders who require MNC participation to ensure valuemaximization by local entrepreneurs. The model demonstrates that weak investorprotections limit the scale of MNC activity, increase the reliance on FDI flows, andalter the decision to deploy technology through FDI as opposed to arm’s lengthtechnology transfers. Several distinctive predictions for the impact of weak in-vestor protection on MNC activity and FDI flows are tested and confirmed usingfirm-level data.
I. INTRODUCTION
Firms globalizing their operations and the associated cap-ital flows have become major features of the world economy.These cross-border activities and capital flows span institutionalsettings with varying investor protections and levels of capi-tal market development. Although the importance of institutionalheterogeneity in dictating economic outcomes has been empha-sized, existing analyses typically ignore the global firms and thecapital flows that are now commonplace. Investigating how globalfirms make operational and financing decisions in a world of het-erogeneous institutions promises to provide a novel perspectiveon observed patterns of flows and firm activity.
∗The statistical analysis of firm-level data on U.S. multinational companieswas conducted at the Bureau of Economic Analysis, U.S. Department of Com-merce, under arrangements that maintain legal confidentiality requirements. Theviews expressed are those of the authors and do not reflect official positions of theU.S. Department of Commerce. The authors thank Robert Barro, four anonymousreferees, Gita Gopinath, James Markusen, Aleh Tsyvinski, Bill Zeile, and semi-nar participants at Boston University, Brown University, Hitotsubashi University,MIT, the NBER ITI program meeting, the New York Fed, Oxford, UC Berkeley, UCBoulder, Universidad de Vigo, Universitat Pompeu Fabra, the University of Michi-gan, and the World Bank for helpful suggestions. Davin Chor provided excellentresearch assistance.C© 2009 by the President and Fellows of Harvard College and the Massachusetts Institute ofTechnology.The Quarterly Journal of Economics, August 2009
1171

1172 QUARTERLY JOURNAL OF ECONOMICS
This paper develops and tests a model of the operational andfinancial decisions of firms as they exploit their technologies incountries with differing levels of investor protections. The modeldemonstrates that multinational firm (MNC) activity and foreigndirect investment (FDI) arise endogenously in settings charac-terized by financial frictions. The model generates several predic-tions regarding how investor protections influence the use of arm’slength technology transfers, the degree to which MNC activity isfinanced by capital flows, the extent to which multinationals takeownership in foreign projects, and the scale of multinational oper-ations. These predictions are tested using firm-level data on U.S.MNCs.
The model considers the problem of a firm that has devel-oped a proprietary technology and is seeking to deploy this tech-nology abroad with the help of a local entrepreneur. A varietyof alternative arrangements, including an arm’s length technol-ogy transfer or directly owning and financing the entity thatuses it, are considered. External investors are a potential sourceof funding, but they are concerned with managerial misbehav-ior, particularly in settings where investor protections are weak.The central premise of the model is that developers of technolo-gies are particularly useful monitors for ensuring that local en-trepreneurs are pursuing value maximization. The concerns ofexternal funders regarding managerial misbehavior lead to opti-mal contracts in which the developer of the technology is requiredto hold an ownership claim in the foreign project and, in certaincases, this developer is also required to provide financial capitalto the local entrepreneur. As such, MNCs and FDI flows ariseendogenously in response to concerns over managerial misbehav-ior and weak investor protections.1 Extending the model to allowfor a similar form of monitoring by external investors does notvitiate the primary results. We also show that although simplerevenue-sharing agreements may also provide incentives for tech-nology developers to monitor, this type of contract is generally notoptimal.
1. The experience of Disney in Japan, as documented in Misawa (2005), pro-vides one example of the mechanism that drives the behavior of external investors.In 1997, Disney was evaluating how to structure a new opportunity with a localpartner in Japan. Japanese banks expressed a strong preference for equity partic-ipation by Disney over a licensing agreement in order to ensure that Disney hadstrong incentives to monitor the project and ensure value maximization. The con-cerns of these lenders and the intuition that Disney would have a unique abilityto monitor local partners are reflective of the central ideas of the model.

MULTINATIONAL FIRMS AND IMPERFECT CAPITAL MARKETS 1173
The characterization of MNCs as developers of technologieshas long been central to models explaining MNC activity. In con-trast to those models that emphasize the risk of technology expro-priation, the model in this paper emphasizes financial frictions, acruder form of managerial opportunism and the role of externalfunders. As such, although technology is central to these othermodels and the model in this paper, the mechanism generatingMNC activity is entirely distinct. Our emphasis on monitoringbuilds on the theory presented by Holmstrom and Tirole (1997),which captures how monitoring is critical to understanding finan-cial intermediation.
Our model delivers several novel predictions about the natureof FDI and patterns of MNC activity. First, the model predictsthat arm’s length technology transfers will be more common, rel-ative to the deployment of that technology through affiliate activ-ity, in countries where investor protections are stronger. Second,the share of activity abroad financed by capital flows from themultinational parent will be decreasing in the quality of investorprotections in host economies. Third, ownership shares by multi-national parents will also be decreasing in the quality of investorprotections in host economies. These predictions reflect the factthat monitoring by the developer of the technology is more criticalin settings where investor protections are weaker. The model alsopredicts that the scale of activity based on multinational technolo-gies in host countries will be an increasing function of the qualityof the institutional environment. Better investor protections re-duce the need for monitoring and therefore allow for a larger scaleof activity.
We test these predictions using the most comprehensive avail-able data on the activities of U.S. MNCs and on arm’s length tech-nology transfers by U.S. firms. These data provide details on theworldwide operations of U.S. firms, including measures of parentalownership, financing and operational decisions, and informationon royalty payments and licensing fees received by U.S. firms fromunaffiliated foreign persons. The data enable the use of parent-year fixed effects that implicitly control for a variety of unobservedattributes.
The analysis indicates that the likelihood of using arm’slength technology transfer to serve a foreign market increaseswith measures of investor protections, as suggested by the model.The predictions on parent financing and ownership decisionsare also confirmed to be a function of the quality of investor

1174 QUARTERLY JOURNAL OF ECONOMICS
protections and the depth of capital markets. The model also sug-gests that these effects should be most pronounced for technologi-cally advanced firms because these firms are most likely to be ableto provide valuable monitoring services. The empirical evidenceindicates a differential effect for such firms.
Settings where ownership restrictions are liberalized providean opportunity to test the final prediction of the model. The modelimplies that ownership liberalizations should have a particularlylarge effect on multinational affiliate activity in countries withweak investor protections. Our empirical analysis confirms thataffiliate activity increases by larger amounts after liberalizationsin countries with weaker investor protections.
This paper extends the large and growing literature on theeffects of investor protections and capital market development oneconomic outcomes to an open-economy setting where firms makeoperational and financial decisions across borders. La Porta et al.(1997, 1998) relate investor protections to the concentration ofownership and the depth of capital markets. A large literature,including King and Levine (1993), Levine and Zervos (1998), Ra-jan and Zingales (1998), Wurgler (2000), and Acemoglu, Johnson,and Mitton (2005), has shown that financial market conditionsinfluence firm investment behavior, economic growth, and indus-trial structure.
By exclusively emphasizing firms with local investmentand financing, this literature has neglected how cross-border,intrafirm activity responds to institutional variations. Theopen-economy dimensions of institutional variations have beenexplored but overwhelmingly in the context of arm’s-lengthcross-border lending as in Gertler and Rogoff (1990), Boyd andSmith (1997), and Shleifer and Wolfenzon (2002).2 In relatedwork, Albuquerque (2003) shows that the differential alienabilityof FDI and portfolio inflows can allow the risk of expropriationto alter the composition of capital inflows. In contrast to thiswork, we derive the existence of MNCs and FDI flows in responseto the possibility of opportunism by private actors. Accordingly,our empirical work employs firm-level data that allow us to
2. Gertler and Rogoff (1990) show how arm’s length lending to entrepreneursin poor countries is limited by their inability to pledge large amounts of their ownwealth. This insight is embedded into an MNC’s production decisions in the modelpresented here. Our setup also relates to Shleifer and Wolfenzon (2002), who studythe interplay between investor protection and equity markets. In contrast, Kraayet al. (2005) emphasize the role of sovereign risk in shaping the structure of worldcapital flows.
MULTINATIONAL FIRMS AND IMPERFECT CAPITAL MARKETS 1175
analyze both patterns of firm activity and financial flows ratherthan the division of aggregate capital flows between FDI andportfolio flows. In short, we show that weak financial institutionsdecrease the scale of MNC activity but simultaneously increasethe reliance on capital flows from the parent. As such, observedpatterns of capital flows reflect these two distinct and contradic-tory effects. The empirical investigations of microdata providedin the paper indicate that both effects are operative.3
By jointly considering the determinants of MNC activitiesand the flows of capital that support these activities, the paperalso links two literatures—the international trade literature onmultinationals and the macroeconomic literature on capital flows.Industrial-organization and international-trade scholars charac-terize multinationals as having proprietary assets and empha-size the role of market imperfections, such as transport costs andmarket power, in determining patterns of multinational activ-ity. Recent work on MNCs investigates “horizontal” or “vertical”motivations4 for FDI and explores why alternative productive ar-rangements, such as whole ownership of foreign affiliates, jointventures, exports, or arm’s length contracts, are employed.5
Such analyses of MNC activity typically do not consider asso-ciated capital flows.6 Research on capital flows typically abstracts
3. It should be emphasized that our model abstracts from any portfolio deci-sion by investors and instead focuses on the financing decisions of firms. Bertaut,Griever, and Tryon (2006) analyze U.S. ownership of foreign securities and con-clude that nonfinancial institutions are a fairly small fraction (less than 10%) ofoverall foreign portfolio investment, and this is when including all securities suchas fixed-income investments. As such, our model (unlike the one in Albuquerque[2003]) may not be particularly well suited to interpret cross-country patterns inthe composition of capital flows.
4. The horizontal FDI view represents FDI as the replication of capacity inmultiple locations in response to factors such as trade costs, as in Markusen (1984),Brainard (1997), Markusen and Venables (2000), and Helpman, Melitz, and Yeaple(2004). The vertical FDI view represents FDI as the geographic distribution of pro-duction globally in response to the opportunities afforded by different markets, asin Helpman (1984) and Yeaple (2003). Caves (1996) and Markusen (2002) provideparticularly useful overviews of this literature.
5. Ethier and Markusen (1996), Antras (2003, 2005), Antras and Helpman(2004), Desai, Foley, and Hines (2004a), Grossman and Helpman (2004), and Feen-stra and Hanson (2005) analyze the determinants of alternative foreign productionarrangements.
6. Several studies linking levels of MNC activity and FDI flows are worthnoting. First, high-frequency changes in FDI capital flows have been linked torelative wealth levels through real exchange rate movements (as in Froot and Stein[1991] and Blonigen [1997]), broader measures of stock market wealth (as in Kleinand Rosengren [1994] and Baker, Foley, and Wurgler [2009]) and to credit marketconditions (as in Klein, Peek, and Rosengren [2002]). Second, MNCs have also beenshown to opportunistically employ internal capital markets in weak institutionalenvironments (as in Desai, Foley, and Hines [2004b]) and during currency crises(as in Aguiar and Gopinath [2005] and Desai, Foley, and Forbes [2008]). These

1176 QUARTERLY JOURNAL OF ECONOMICS
from firm activity and has focused on the paradox posed by Lucas(1990) of limited capital flows from rich to poor countries in theface of large presumed rate-of-return differentials. Whereas Lucas(1990) emphasizes human-capital externalities to help explainthis paradox, Reinhart and Rogoff (2004) review subsequent re-search on aggregate capital flows and conclude that credit marketconditions and political risk play significant roles. By examiningfirm behavior in a setting with variation in investor protections,this paper attempts to unify an investigation of MNC activity andFDI flows.
The rest of the paper is organized as follows. Section II laysout the model and generates several predictions related to themodel. Section III provides details on the data employed in theanalysis. Section IV presents the results of the empirical analysis,and Section V concludes.
II. THEORETICAL FRAMEWORK
In this section, we develop a model of financing that buildson and extends the work of Holmstrom and Tirole (1997).7 Weillustrate how the model generates both multinational activity aswell as FDI flows. Finally, we explore some firm-level empiricalpredictions that emerge from the model and that we take to thedata in later sections.
II.A. A Model of Financial Contracting
Environment. We consider the problem of an agent—aninventor—who is endowed with an amount W of financial wealthand the technology or knowledge to produce a differentiated good.Consumers in two countries, Home and Foreign, derive util-ity from consuming this differentiated good. (Appendix I devel-ops a multicountry version of the model.) The good, however, is
papers emphasize how heterogeneity in access to capital can interact with MNCproduction decisions. Marin and Schnitzer (2004) also study the financing decisionsof MNCs in a model that stresses managerial incentives. Their model, however,takes the existence of MNCs as given and considers an incomplete-contractingsetup, in contrast to our complete-contracting setup. The predictions from theirmodel are quite distinct to the ones we develop here and show to be supported byU.S. data.
7. Our model generalizes the setup in Holmstrom and Tirole (1997) by allow-ing for diminishing returns to investment and for variable monitoring levels. Thescope of the two papers is also very distinct: Holmstrom and Tirole (1997) studythe monitoring role of banks in a closed-economy model, whereas our focus is onMNCs.
MULTINATIONAL FIRMS AND IMPERFECT CAPITAL MARKETS 1177
prohibitively costly to trade, and thus servicing a particular mar-ket requires setting up a production facility in that country. Theinventor is located at Home and cannot fully control productionin Foreign. Servicing that market thus requires contracting witha foreign agent—an entrepreneur—to manage production there.We assume that entrepreneurs are endowed with no financialwealth and their outside option is normalized to 0. There also ex-ists a continuum of infinitessimal external investors in Foreignthat have access to a technology that gives them a gross rate ofreturn equal to 1 on their wealth. All parties are risk neutraland are protected by limited liability. There are three periods: adate-0 contracting stage, a date-1 investment stage, and a date-2production/consumption stage.
Consumer Preferences and Technology. In the main text, wefocus on describing production and financing decisions in the For-eign market. For that purpose, we assume that preferences andtechnology at Home are such that at date 2 the inventor obtains aconstant gross return β > 1 for each unit of wealth he invests inproduction at Home at date 1. We refer to this gross return as theinventor’s shadow value of cash. Our assumption β > 1 impliesthat the opportunity cost of funds is lower for external investorsthan for the inventor. In Appendix I, this higher-than-1 value ofβ is endogenously derived in a multicountry version of the modelwhere consumer preferences, technology, and financial contract-ing in all countries are fully specified. Note that the provision thatβ > 1 does not imply that the effective cost of capital provided byexternal investors is always lower than the effective cost of capi-tal provided by the inventor because informational frictions maydrive a wedge between returns earned and the costs borne by therelevant parties.
We assume that Foreign preferences are such that cash flowsor profits obtained from the sale of the differentiated good inForeign can be expressed as a strictly increasing and concavefunction of the quantity produced; that is, R(q), with R′(q) > 0and R′′(q) ≤ 0. We also assume the standard conditions R(0) = 0,limq→0 R′(q) = +∞, and limq→∞ R′(q) = 0. These properties ofR(q) can be derived from preferences featuring a constant (andhigher-than-1) elasticity of substitution across a continuum of dif-ferentiated goods produced by different firms. In such case, theelasticity of R(q) with respect to q is constant and given by aparameter α ∈ (0, 1).

1178 QUARTERLY JOURNAL OF ECONOMICS
Foreign production is managed by the foreign entrepreneur,who at date 1 can privately choose to behave and enjoy no pri-vate benefits, or misbehave and take private benefits. When themanager behaves, the project performs with probability pH , in thesense that when an amount x is invested at date 1, project cashflows at date 2 are equal to R(x) with probability pH and 0 other-wise.8 When the manager misbehaves, the project performs witha lower probability pL < pH and expected cash flows are pLR(x).We assume that the private benefit a manager obtains from mis-behaving is increasing in the size of the project, and for simplicity,we specify it as being proportional to the return of the project, thatis, BR(x). In Section II.C, we discuss how similar results obtain ifprivate benefits are proportional to the level of investment x.
Managerial misbehavior and the associated private benefitscan be manifested by choosing to implement the project in a waythat generates perquisites for the manager or his associates, ina way that requires less effort, or in a way that is more fun orglamorous. As described below, we relate the ability to engage insuch private benefits to the level of investor protections in Foreignas well as to the extent to which the entrepreneur is monitored.The idea is that countries with better investor protections tend toenforce laws that limit the ability of managers to divert fundsfrom the firm or to enjoy private benefits or perquisites. Thisinterpretation parallels the logic in Tirole (2005, p. 359).
When investor protections are not perfectly secure, monitor-ing by third agents is helpful in reducing the extent to which man-agers are able to divert funds or enjoy private benefits. FollowingHolmstrom and Tirole (1997), we introduce a monitoring technol-ogy that reduces the private benefit of the foreign entrepreneurwhen he misbehaves. It is reasonable to assume that the inven-tor can play a particularly useful role in monitoring the behaviorof the foreign entrepreneur because the inventor is particularlywell informed about how to manage the production of output us-ing its technology. Intuitively, the developer of a technology isin a privileged position to determine if project failure is associ-ated with managerial actions or bad luck.9 We capture this in a
8. This assumes that, when the project succeeds, each unit invested resultsin a unit of output (q = x), whereas when the project fails, output is zero (q = 0).We relax the latter assumption in Section II.C.
9. An alternative way to interpret monitoring is as follows. Suppose that theforeign entrepreneur can produce the good under a variety (a continuum, actually)of potential techniques indexed by z ∈ [0, B]. Technique 0 entails a probability ofsuccess equal to pH and a zero private benefit. All techniques with z > 0 are
MULTINATIONAL FIRMS AND IMPERFECT CAPITAL MARKETS 1179
stark way by assuming that no other agent in the economy canproductively monitor the foreign entrepreneur, though we discussa more general setup in Section II.C. We assume that monitor-ing costs are proportional to the return of the project and whenthe inventor incurs an effort cost C R(x) in monitoring at date 1,the private benefit for the local entrepreneur is multiplied by afactor δ (C), with δ′ (C) < 0, δ′′ (C) > 0, δ(0) = δ, limC→∞ δ (C) = 0,limC→0 δ′ (C) = −∞, and limC→∞ δ′ (C) = 0.10 This assumption re-flects the idea that larger projects require effort to monitor. SectionII.C considers the possibility that effort costs are proportional toinvestment levels and similar results follow.
As mentioned earlier, the scope of private benefits is relatedto the level of investor protection of the host country by an indexγ ∈ (0, 1). In particular, we specify that
(1) B(C; γ ) = (1 − γ ) δ(C).
Note that this formulation implies that ∂ B(·)/∂γ < 0, ∂ B(·)/∂C < 0,and ∂2 B(·)/∂C∂γ = −δ′(C) > 0. This formulation captures the in-tuition that the scope for private benefits is decreasing in bothinvestor protection and monitoring and that monitoring has arelatively larger effect on private benefits in countries with poorlegal protection of investors. It also implies that parent moni-toring substitutes for investor protection. The idea behind thisassumption is that both parent monitoring and investor protec-tions constrain managers and that parent monitoring is effectiveeven in imperfect legal environments. This would be the case if,for example, parent monitoring during the production process pre-vented misbehavior from occurring, thus eliminating any need forlegal action after improper behavior occurs.
Contracting. We consider optimal contracting between threesets of agents: the inventor, the foreign entrepreneur, and foreignexternal investors. At date 0, the inventor and the foreign en-trepreneur negotiate a contract that stipulates the terms underwhich the entrepreneur will exploit the technology developed by
associated with a probability of success equal to pL and a private benefit equal toz. Clearly, all techniques with z ∈ (0, B) are dominated from the point of view ofthe foreign entrepreneur, who will thus effectively (privately) choose either z = 0or z = B, as assumed in the main text. Under this interpretation, we can think ofmonitoring as reducing the upper bound of [0, B].
10. These conditions are sufficient to ensure that the optimal contract isunique and satisfies the second-order conditions.

1180 QUARTERLY JOURNAL OF ECONOMICS
the inventor. This contract includes a (possibly negative) date-0transfer F from the inventor to the entrepreneur, as well as theagents’ date-2 payoffs contingent on the return of the project.11
When F > 0, the date-0 payment represents the extent to whichthe inventor cofinances the project in the Foreign country. WhenF < 0, this payment can be thought of as the price or up-frontroyalties paid for the use of the technology, which the inventorcan invest in the Home market at date 1. The contract betweenthe inventor and the entrepreneur also stipulates the date-1 scaleof investment x, while the managerial and monitoring efforts ofthe entrepreneur and inventor, respectively, are unverifiable andthus cannot be part of the contract.
Also at date 0, the foreign entrepreneur and external in-vestors sign a financial contract under which the entrepreneurborrows an amount E from the external investors at date 0 in re-turn for a date-2 payment contingent on the return of the project.
We consider an optimal contract from the point of view ofthe inventor and allow the contract between the inventor andthe entrepreneur to stipulate the terms of the financial contractbetween the entrepreneur and foreign external investors. We ruleout “direct” financial contracts between the inventor and foreignexternal investors. This is justified in the extension of the modeldeveloped in Appendix I, where the inventor’s shadow value ofcash β is endogenized.
Given the payoff structure of our setup and our assumptionsof risk neutrality and limited liability, it is straightforward toshow that an optimal contract is such that all date-2 payoffs canbe expressed as shares of the return generated by the project. Allagents obtain a payoff equal to zero when the project fails (i.e.,when the return is zero) and a positive payoff when the projectsucceeds (in which case cash flows are positive). When an agent’sshare of the date-2 return is positive, this agent thus becomes anequity holder in the entrepreneur’s production facility.12 We de-fine φI and φE as the equity shares held by the inventor and exter-nal investors, respectively, with the remaining share 1 − φI − φE
11. For simplicity, we assume that the inventor’s date-2 return in its Homemarket (which is not modeled in the main text) is not pledgeable in Foreign.
12. We focus on an interpretation of payoffs resembling the payoffs of an equitycontract, but the model is not rich enough to distinguish our optimal contract froma standard debt contract. Our results would survive in a model in which agentsrandomized between using equity and debt contracts. In any case, we bear this inmind in the empirical section of the paper, where we test the predictions of themodel.

MULTINATIONAL FIRMS AND IMPERFECT CAPITAL MARKETS 1181
accruing to the foreign entrepreneur. Notice that when φI is largeenough, the entrepreneur’s production facility becomes a sub-sidiary of the inventor’s firm.
II.B. Optimal Contract and Empirical Predictions
We next characterize an optimal contract that induces theentrepreneur to behave and the inventor to monitor. This optimalcontract is given by the tuple {F, φI, x, φE, E, C} that solves thefollowing program:
maxF,φI ,x,φE,E,C
�I = φI pH R(x) + (W − F) β − C R(x)
s.t. x ≤ E + F (i)pHφER(x) ≥ E (ii)
(P1) pH (1 − φE − φI) R(x) ≥ 0 (iii)(pH − pL) (1 − φE − φI) R(x) ≥ (1 − γ ) δ (C) R (x) (iv)(pH − pL) φI R(x) ≥ C R(x). (v)
The objective function represents the payoff of the inventor.The first term represents the inventor’s dividends from the ex-pected cash flows of the foreign production facility. The secondterm represents the gross return from investing his wealth W mi-nus the date-0 transfer F in the Home market.13 The last termrepresents the monitoring costs.
The first constraint is a financing constraint. Because the lo-cal entrepreneur has no wealth, his ability to invest at date 1is limited by the sum of the external investors’ financing E andthe cofinancing F by the inventor. The second inequality is theparticipation constraint of external investors, who need to earnat least an expected gross return on their investments equal to1. Similarly, the third inequality is the participation constraintof the foreign entrepreneur, given his zero outside option. Thefourth inequality is the foreign entrepreneur’s incentive compat-ibility constraint. This presumes that it is in the interest of theinventor to design a contract in a way that induces the foreignentrepreneur to behave. In Appendix II, we show that this willnecessarily be the case, provided that γ is sufficiently large. The fi-nal constraint is the inventor’s incentive compatibility constraint:if this condition was not satisfied, the inventor’s payoff would be
13. We assume throughout that W is large enough to ensure that W − F ≥ 0in equilibrium.
1182 QUARTERLY JOURNAL OF ECONOMICS
lower when exerting the monitoring level C than when not doingso.14
In the program above, constraint (iii) will never bind. Intu-itively, as is standard in incomplete information problems, theincentive compatibility constraint of the entrepreneur demandsthat this agent obtains some informational rents in equilibrium,and thus his participation constraint is slack. Conversely, theother four constraints will bind in equilibrium. This is intuitivefor the financing constraint (i) and the participation constraint ofinvestors (ii). It is also natural that the optimal contract from thepoint of view of the inventor will seek to minimize the (incentive-compatible) equity share accruing to the foreign entrepreneur,which explains why constraint (iv) binds.
It is perhaps less intuitive that constraint (v) also binds, in-dicating that the optimal contract minimizes the equity share φIallocated to the inventor. In particular, it may appear that a largeφI would be attractive because it may foster a larger level of co-financing F at date 0, thereby encouraging investment. However,inspection of constraint (iv) reveals that a larger φI decreases theability of the entrepreneur to borrow from external investors, asit reduces his pledgeable income. Overall, one can show that, fora given level of monitoring, whether utility is transferred throughan equity share or a date-0 lump-sum payment has no effect onthe scale of the project. In addition, it is clear from the objec-tive function that the inventor strictly prefers a date-0 lump-sumtransfer because he can use these funds to invest domestically andobtain a gross rate of return β > 1 on them. Hence, the minimalincentive-compatible inventor equity share φI is optimal.
With these results at hand, it is immediate from constraint(v) that the optimal equity stake held by the inventor will be givenby
(2) φI = CpH − pL
,
which will be positive as long as C is positive. In addition, ma-nipulation of the first-order conditions of program (P1) deliversthe following expression that implicitly determines the level of
14. Our derivation of this IC constraint assumes that if the inventor deviatesfrom C, it does so by setting C = 0 (which for large enough δ would lead to aviolation of the entrepreneur’s incentive compatibility constraint). This is withoutloss of generality because any other deviation C > 0 is dominated.

MULTINATIONAL FIRMS AND IMPERFECT CAPITAL MARKETS 1183
monitoring (see Appendix II for details):
(3) − δ′(C) = βpH − pL
(1 − γ )βpH.
Straightforward differentiation of (3) together with the convexityof the function δ (·) produces the following result:
LEMMA 1. The amount of monitoring C is decreasing in both in-vestor protection γ in Foreign and in the inventor’s shadowvalue of cash β.
The effect of investor protection on monitoring is intuitive.Given our specification of the private benefit function B(·) in (1),the marginal benefit from monitoring is larger, the less developedis the financial system in Foreign (the lower is γ ). Because themarginal cost of monitoring is independent of γ , C and γ arenegatively correlated in the optimal contract.
The effect of the shadow value of cash β on monitoring is abit subtler. The intuition behind the result lies in the fact that thelarger that β is, the larger is the opportunity cost of remuneratingthe inventor through ex-post dividends rather than through anex-ante lump-sum transfer. Because of the tight mapping betweenφI and C imposed by the incentive compatibility constraint in (v),we have that a larger β is also associated with a higher shadowcost of monitoring and hence with a lower optimal amount ofmonitoring.
In light of (2), it is clear that our theory has implications forthe share of equity held by the inventor that relate closely to theimplications for monitoring. In particular, φI is proportional to thelevel of monitoring C and thus is affected by the parameters γ andβ in the same way as is monitoring. This reflects that equity sharesemerge in our model as incentives for the inventor to monitor theforeign entrepreneur. As a result, we can establish the followingproposition.
PROPOSITION 1. The share of equity held by the inventor is de-creasing both in investor protection γ in Foreign and in theinventor’s shadow value of cash β.
An immediate corollary of this result follows.
COROLLARY 1. Suppose that a transaction is recorded as an FDItransaction only if φI ≥ φI .Then, there exists a threshold

1184 QUARTERLY JOURNAL OF ECONOMICS
investor protection γ ∗ ∈ [0, 1
]such that the optimal contract
entails FDI only if γ < γ ∗.
Our theory thus predicts that the prevalence of FDI in a givencountry should, other things equal, be a decreasing function of thelevel of investor protection in that country.
Manipulation of the first-order conditions of program (P1)also delivers an implicit function of the level of investment as afunction of parameters and the optimal level of monitoring C:
(4) R′ (x) = 1
pH
(
1 − (1 − γ ) δ(C
)
pH − pL−
(βpH − pL
pH − pL
)C
βpH
) .
Equation (4) implicitly defines the level of expected sales by thefirm, that is, pH R (x). Differentiating this equation with respectto γ and β, we obtain the following proposition (see Appendix IIIfor details).
PROPOSITION 2. Output and cash flows in Foreign are increasingin investor protection γ in Foreign and decreasing in the in-ventor’s shadow value of cash β.
The intuition for the effect of investor protection is straight-forward. Despite the fact that the inventor’s monitoring reducesfinancial frictions, both the foreign entrepreneur’s compensation,as dictated by his incentive compatibility constraint (iv), and mon-itoring costs are increasing in the scale of operation. In countrieswith weaker investor protections, the perceived marginal cost ofinvestment is higher, thus reducing equilibrium levels of invest-ment.
Using constraints (i), (ii), and (iv), one can also obtain theterms of the optimal financial contract with external investors interms of C and x:
φE = 1 − (1 − γ ) δ(C)pH − pL
− CpH − pL
,
E = pH φE R(x).
Finally, straightforward manipulation delivers an optimal lump-sum date-0 transfer equal to
F = pL
β (pH − pL)C R (x) −
(R (x)
R′ (x) x− 1
)x.
MULTINATIONAL FIRMS AND IMPERFECT CAPITAL MARKETS 1185
Depending on parameter values, the lump-sum transfer can bepositive or negative, and it also varies nonmonotonically with theparameters of the model. We can, however, derive sharper predic-tions for the share of financing that is provided by the inventor.To see this, focus on the case in which the date-0 payment F ispositive and can be interpreted as the level of cofinancing by theinventor. The share of investment financed by the inventor is thengiven by
(5)Fx
= pL
β (pH − pL)C
R (x)x
−(
1 − α (x)α (x)
),
where α(x) ≡ xR′(x)/R(x) is the elasticity of revenue to output.As mentioned earlier, when preferences feature a constant elas-ticity of substitution across a continuum of differentiated goodsproduced by different firms, α(x) is independent of x, and R(x) canbe written as R(x) = Axα, where A > 0 and α ∈ (0, 1).
Notice that the first term in (5) is increasing in C and decreas-ing in x due to the concavity of R(x). It thus follows from Lemma1 and Proposition 2 that this first term is necessarily decreasingin γ . As for the second term, it will increase or decrease in x de-pending on the properties of α(x). In most applications, α(x) willbe either independent of x or decreasing in x (e.g., when the firmfaces a linear demand function). In those situations, the secondterm in (5) will also be decreasing in γ and we can conclude thefollowing.
PROPOSITION 3. Provided that α′(x) is sufficiently small, the shareof inventor financing in total financing (F/x) is decreasing ininvestor protection γ .
The intuition behind the result is that monitoring by inven-tors has a relatively high marginal product in countries with weakfinancial institutions. To induce the inventor to monitor, the opti-mal contract specifies a relatively steeper payment schedule, witha relatively higher contribution by the inventor at date 0 (a higherF/x) in anticipation of a higher share of the cash flows generatedby the project at date 2 (a higher φI).15
15. The effect of the shadow value of cash on the ratio F/x is ambiguous. Alarger β is associated with a lower monitoring level C (Lemma 1), but also with alower level of x and thus a higher ratio R (x) /x (Proposition 2). In addition, β hasan additional direct negative effect on the ratio. The overall effect is, in general,ambiguous.

1186 QUARTERLY JOURNAL OF ECONOMICS
The fact that the monitoring provided by the inventor is un-verifiable by third parties is central to our theory of FDI. In par-ticular, if monitoring was verifiable (and thus contractible), theoptimal contract analogous to the one described above would im-mediately imply an equity share for the inventor equal to zero (seeAntras, Desai, and Foley [2007] for details). Hence, the inventorwould never choose to deploy her technology abroad through FDI.Instead, the inventor would sell the technology to the foreign en-trepreneur in exchange for a positive lump-sum fee (and, hence,the inventor would never cofinance the project).
In Section IV, we present empirical tests of Propositions 1, 2,and 3, and Corollary 1. Appendix I shows that Propositions 1, 2,and 3 continue to hold in a multicountry version of the model inwhich the statements apply to cross-sectional variation in investorprotections. Our empirical tests exploit variation in the locationof affiliates of U.S. MNCs and analyze the effect of investor pro-tections on proxies for x, φI , and F/x. We identify the inventor inthe model as being a parent firm and control for other parametersof the model, such as the shadow value of cash β, the concavity ofR(x), the monitoring function δ (C), and the probabilities pH andpL by using fixed effects for each firm in each year and controllingfor a wide range of host-country variables. Because our estima-tion employs parent-firm fixed effects, we are not able to test thepredictions regarding the effect of β in Propositions 1, 2, and 3.
II.C. Generalizations
Before proceeding to the empirical analysis, it is useful toconsider the robustness of these results to more general environ-ments. In particular, we consider the degree to which revenuesharing might substitute for equity contracts, the possibility thatprivate benefits and monitoring costs may be proportional to xrather than R(x), and the effects of introducing productive moni-toring by external investors. The underlying analysis is providedin Appendix IV.
In the model above, we assume that when the project fails,it delivers a level of revenue equal to zero. Such an assumptiongreatly enhances tractability but suggests that revenue-sharingcontracts may provide benefits similar to equity arrangements.This is problematic because it blurs the mapping between φI inthe model and equity shares in the data. More generally, however,revenue-sharing contracts are not optimal when the project deliv-ers a positive level of revenue in case of failure. In fact, a simple

MULTINATIONAL FIRMS AND IMPERFECT CAPITAL MARKETS 1187
contract in which external investors are issued secured (or risk-free) debt and the inventor and entrepreneur take equity stakesis optimal.16 To see the intuition for this, consider the same setupas in Section II.A, but now assume that, when the project does notperform, it yields a level of revenue equal to R(x) ∈ (0, R(x)). As isstandard in moral hazard problems with risk-neutral agents, theoptimal contract calls for the agents undertaking unobservable ac-tions (e.g., effort decisions) to be maximally punished (subject tothe limited-liability constraint) whenever a failure of the projectis observed. In our particular setup, this would imply that theoptimal contract yields both the inventor and the entrepreneur apayoff of zero whenever a project failure is observed. The entirerevenue stream R(x) should accrue to external investors.
A straightforward way to implement such a contract is forthe entrepreneur to issue an amount of secure debt equal to R(x)to external investors and for the inventor and entrepreneur tobe equity holders. Once the debt is paid, the inventor and en-trepreneur receive a share of zero in case of project failure anda share of the amount R(x) − R(x) in case of project success. Thedetermination of their optimal shares is analogous to that in Sec-tion II.A with R(x) − R(x) replacing R(x) (details available uponrequest). In this more general setting, it is not possible to im-plement this optimal allocation of payoffs across agents throughsimple revenue-sharing arrangements. As such, the model canexplain why an instrument with the features of equity tends todominate both fixed-fee and revenue-sharing contracts in finan-cially underdeveloped countries. Such contracts will likely entailan inefficiently low punishment to the inventor when the projectdoes not perform well.
We next briefly discuss alternative formulations for the en-trepreneur’s private benefit of misbehavior and the inventor’s pri-vate cost of monitoring. We have assumed above that these areproportional to the revenue generated by the project in case ofsuccess. If instead we specified them as being proportional to x,then the optimal equity share φI would be given by
φI = C(pH − pL)
xR (x)
16. A contract in which an entrepreneur issues debt to external investorsappears to have empirical validity because most capital provided to affiliates fromlocal sources takes the form of debt.

1188 QUARTERLY JOURNAL OF ECONOMICS
and would also depend on x and the concavity of the R(x) function.One may thus worry that for a sufficiently concave R(x) function,it could be the case that equity stakes could be low in low-γ coun-tries on account of the low values of x/R (x) in those countries. Weshow in Appendix IV, however, that our main comparative staticconcerning equity shares holds as long as the elasticity of rev-enue with respect to output—that is, α (x) ≡ xR′ (x) /R (x)—doesnot increase in x too quickly. The required condition is analogousto that in Proposition 3 and is satisfied for the case of constantprice elasticity and linear demand functions.
We finally consider the possibility that local external in-vestors (e.g., banks) also provide useful monitoring, the pro-ductivity of which may also be higher in countries with worseinvestor protections. In Appendix IV, we develop an extension ofthe model that incorporates monitoring by external investors andthat, as with the monitoring by the inventor, is subject to declin-ing marginal benefits. Although the optimal contract is now morecomplicated, we show that the incentive compatibility constraintfor the inventor will continue to bind in equilibrium, implying thatthe inventor’s equity stake moves proportionally with its level ofmonitoring. Furthermore, provided that the level of investor pro-tection γ is sufficiently high, the analysis remains qualitativelyunaltered by the introduction of local monitoring. The reason forthis is that, for large values of γ , the optimal contract alreadyallocates equity stakes φE to external investors that are largeenough to induce them to monitor the entrepreneur.17 As a result,although certain details of the optimal contract change with thepossibility of local monitoring, the comparative static results de-rived in Section II.B continue to hold in this more general model,provided that γ is sufficiently large.
III. DATA AND DESCRIPTIVE STATISTICS
The empirical work presented in Section IV is based on themost comprehensive available data on the activities of U.S. MNCsand on arm’s length technology transfers by U.S. firms. The Bu-reau of Economic Analysis (BEA) annual survey of U.S. Direct
17. When the level of investor protection is below a certain threshold, then theincentive compatibility for external investors becomes binding, in which case theanalysis becomes more complicated. Without imposing particular functional formson the monitoring functions, it becomes impossible to derive sharp comparativestatic results (see Appendix IV).

MULTINATIONAL FIRMS AND IMPERFECT CAPITAL MARKETS 1189
Investment Abroad from 1982 through 1999 provides a panel ofdata on the financial and operating characteristics of U.S. firmsoperating abroad. U.S. direct investment abroad is defined as thedirect or indirect ownership or control by a single U.S. legal entityof at least 10% of the voting securities of an incorporated foreignbusiness enterprise or the equivalent interest in an unincorpo-rated foreign business enterprise. A U.S. multinational entity isthe combination of a single U.S. legal entity that has made thedirect investment, called the U.S. parent, and at least one foreignbusiness enterprise, called the foreign affiliate.18 The most exten-sive data for the period examined in this study are available for1982, 1989, 1994, and 1999 when BEA conducted Benchmark Sur-veys. Accordingly, the analysis is restricted to benchmark yearsexcept when the annual frequency of the data is critical—in theanalysis of scale in Section IV.C that uses the liberalizations ofownership restrictions.
To analyze arm’s length technology transfers, measures ofroyalty payments, licensing fees, and other payments for intan-gible assets received by U.S. firms from unaffiliated foreign per-sons are drawn from the results of BEA’s annual BE-93 survey.This survey requires that all firms receiving payments above cer-tain thresholds report, regardless of whether the firm is a multi-national.19 Table I provides descriptive statistics for the variablesused in the analysis employing the benchmark year data (PanelA) and analysis employing the full panel (Panel B).
Implementing empirical tests requires mapping the variablesof the model to reasonable proxies in the data. To investigate thechoice of an inventor to engage in arm’s length technology transferor FDI (Corollary 1), the analysis uses a dummy variable that isequal to 1 if a U.S. firm receives an arm’s length royalty paymentfrom a country in a given year and 0 if that firm only servesthe country through affiliate activity in a particular year. ForProposition 3’s predictions on the share of inventor financing intotal financing (F/x), a variable is defined as the ratio of the sumof parent-provided equity and debt to affiliate assets. Specifically,this share is the ratio of the sum of parent-provided equity and
18. Coverage and methods of the BEA survey are described in Desai, Foley,and Hines (2002). The survey covers all countries and industries, classifying affili-ates into industries that are roughly equivalent to three-digit SIC code industries.As a result of confidentiality assurances and penalties for noncompliance, BEAbelieves that coverage is close to complete and levels of accuracy are high.
19. Because these data have been collected since 1986, data used in the anal-ysis of arm’s length technology transfers cover only 1989, 1994, and 1999.

1190 QUARTERLY JOURNAL OF ECONOMICS
TABLE IDESCRIPTIVE STATISTICS
StandardMean deviation
A: Benchmark year data for Tables II–VMultinational firm variablesArm’s length technology transfer dummy 0.2552 0.4360Share of affiliate assets financed by parent 0.4146 0.3267Share of affiliate equity owned by parent 0.8991 0.2195Log of affiliate sales 9.9024 1.7218Log of affiliate employment 4.7601 1.6060Affiliate net PPE/assets 0.2355 0.2264Log of parent R&D 9.0580 4.3927
Country variablesCreditor rights 2.1415 1.2100Private credit 0.7536 0.3891FDI ownership restrictions 0.2247 0.4174Workforce schooling 8.1385 2.1739Log of GDP 26.8002 1.4252Log of GDP per capita 9.3995 1.1019Corporate tax rate 0.3488 0.1060Patent protections 3.2287 0.8480Property rights 4.3767 0.8378Rule of law 9.3207 1.4088Risk of expropriation 5.1398 1.2731
B: Annual data for Table VLog of affiliate sales 10.1285 2.1426Log of aggregate affiliate sales 15.7572 1.7018
Notes. Panel A provides descriptive statistics for data drawn from the benchmark year survey and usedin the analysis presented in Tables II–V. Arm’s length technology transfer dummy is defined for country-yearpairs in which a parent has an affiliate or from which a parent receives a royalty payment from an unaffiliatedforeign person. This dummy is equal to 1 if the parent receives a royalty payment from an unaffiliated foreignperson, and it is otherwise equal to 0. Share of affiliate assets financed by parents is the ratio of parent-provided equity and net parent lending to total affiliate assets. Share of affiliate equity ownership is theequity ownership of the multinational parent. Affiliate net PPE/assets is the ratio of affiliate net propertyplant and equipment to affiliate assets. Creditor rights is an index of the strength of creditor rights developedin Djankov, McLiesh, and Shleifer (2007); higher levels of the measure indicate stronger legal protections.Private credit is the ratio of private credit lent by deposit money banks to GDP, as provided in Beck, Demirguc-Kunt, and Levine (1999). FDI ownership restrictions is a dummy equal to 0 if two measures of restrictions onforeign ownership as measured by Shatz (2000) are above 3 on a scale of 1 to 5 and 1 otherwise. Workforceschooling is the average schooling years in the population over age 25 years provided in Barro and Lee (2000).Corporate tax rate is the median effective tax rate paid by affiliates in a particular country and year. Patentprotections is an index of the strength of patent rights provided in Ginarte and Park (1997). Property rightsis an index of the strength of property rights drawn from the 1996 Index of Economic Freedom. Rule oflaw is an assessment of the strength and impartiality of a country’s overall legal system drawn from theInternational Country Risk Guide. Risk of expropriation is an index of the risk of outright confiscation orforced nationalization of private enterprise, and it is also drawn from the International Country Risk Guide;higher values of this index reflect lower risks. Panel B provides descriptive statistics for annual data coveringthe 1982–1999 period that are used in the analysis presented in Table V. Log of aggregate affiliate sales isthe log of affiliate sales summed across affiliates in a particular country and year.

MULTINATIONAL FIRMS AND IMPERFECT CAPITAL MARKETS 1191
net borrowing by affiliates from the parent to affiliate assets.20
Proposition 1 considers the determinants of the share of equityheld by the inventor, φI , and this variable is measured in the dataas the share of affiliate equity owned by the multinational parent.The log of affiliate sales is used to test Proposition 2’s predictionson the scale of affiliate activity.
Table I also provides descriptive statistics for a number ofother variables. Two measures of investor protections and capitalmarket development are used in the analysis below. Because themodel emphasizes the decisions of local lenders, the first mea-sure is creditor rights. This measure is drawn from Djankov,McLiesh, and Shleifer (2007), which extends the sample studiedby La Porta et al. (1998) to cover a broader sample of countriesover the 1982–1999 period on an annual basis. Creditor rights isan index taking values between 0 and 4 and measures the ex-tent to which the legal system constrains managers from divert-ing value away from creditors (as a large γ does in the model).21
The second measure is the annual ratio of private credit pro-vided by deposit money banks and other financial institutionsto GDP, and it is drawn from Beck, Demirguc-Kunt, and Levine(1999). This measure has the advantage of being an objective,continuous measure of the lending environment that captures thewillingness of lenders to provide credit in response to investorprotections.22
Measures of capital market development are correlated withother measures of economic and institutional development thatcould affect the outcome studied in ways not considered in the
20. In the model, we have interpreted all sources of financing as equity financ-ing, but as explained in footnote 12, our setup is not rich enough to distinguishequity financing from debt financing. Hence, our empirical tests of Proposition 5include both.
21. Specifically, the measure is an index formed by adding 1 when (1) thecountry imposes restrictions, such as creditors’ consent or minimum dividends tofile for reorganization; (2) secured creditors are able to gain possession of theirsecurity once the reorganization petition has been approved (no automatic stay);(3) secured creditors are ranked first in the distribution of the proceeds that resultfrom the disposition of the assets of a bankrupt firm; and (4) the debtor does notretain the administration of its property pending the resolution of the reorganiza-tion.
22. It is possible to employ a measure of shareholder rights to measure in-vestor protections. Creditor rights and private credit are used to measure investorprotections for several reasons. First, shareholder rights are only available for asingle year near the end of our sample. Second, in our data, there is very little localownership of affiliate equity, but affiliates do make extensive use of debt borrowedfrom local sources. As such, using creditor rights and private credit allows us tocapitalize on some time-series variation in investor protections and more closelycorresponds empirically to the financing choices of affiliates.

1192 QUARTERLY JOURNAL OF ECONOMICS
model. Therefore, the regressions control for several measuresof economic and institutional variation that might otherwiseobscure the analysis. The baseline specifications include con-trols for FDI ownership restrictions, human capital development,the log of GDP, the log of GDP per capita, and corporate taxrates. A number of countries impose restrictions on the extentto which foreign firms can own local ones. Shatz (2000) docu-ments these restrictions using two distinct measures that cap-ture restrictions on greenfield FDI and cross-border mergers andacquisition activity. The FDI ownership restriction dummy usedbelow is equal to 1 if either of these measures is below 3 and 0otherwise.
Countries with more human capital, with more economic ac-tivity, or with a higher level of economic development may be moreable to use technology obtained through an arm’s length transfer,and affiliates in these countries may exhibit distinctive financingpatterns that reflect the quality of local entrepreneurs as opposedto financial market conditions. To address these possibilities, thespecifications include workforce schooling, which measures theaverage schooling years in the population over 25 years old andis provided in Barro and Lee (2000). Data on the log of GDP andthe log of GDP per capita come from the World Development Indi-cators. Firms could avoid local production or alter their financingpatterns in response to tax considerations. Corporate tax ratesare imputed from the BEA data by taking the median tax ratepaid by affiliates that report positive net income in a particularcountry and year.
Several other controls appear in additional specifications.Firms might choose to deploy technology through affiliate activityas opposed to through an arm’s length transfer, and they mightselect higher levels of ownership if they fear expropriation by lo-cal entrepreneurs (see, for instance, Ethier and Markusen [1986]for a theoretical treatment). Ginarte and Park (1997) provide ameasure of the strength of patent protections, and the Index ofEconomic Freedom provides a measure of more general propertyrights. Rule of law is an assessment of the strength and impar-tiality of a country’s legal system, and it is drawn from the Inter-national Country Risk Guide (ICRG). Additionally, firms mightfear expropriation by foreign governments and might limit for-eign activity and make more extensive use of local financing inresponse. The ICRG also provides an index of the risk of outright

MULTINATIONAL FIRMS AND IMPERFECT CAPITAL MARKETS 1193
confiscation or forced nationalization faced by foreign investors.For this measure, higher values indicate lower risks.23
Because the BEA data are a panel measuring activity of indi-vidual firms in different countries, they allow for the inclusion ofeffects for each firm in each year, which we refer to as parent-yearfixed effects. These fixed effects help control for other parametersof the model that are likely to be specific to particular firms atparticular points in time, such as the shadow value of cash β, theconcavity of R(x), the monitoring function δ (C), and the probabili-ties pH and pL. The inclusion of these fixed effects implies that theeffects of investor protections are identified from within-firm vari-ation in the characteristics of countries in which the firm is active.
Although the comprehensive data on MNCs and arm’s lengthtechnology transfers do offer a number of advantages, it is worthnoting one significant oversight. Neither the model nor the empir-ical work considers situations in which a firm neither invests innor transfers technology to a particular location.
IV. EMPIRICAL RESULTS
Each of the analyses below is composed of a descriptive fig-ure and firm-level regressions. The figures provide a transparentand intuitive perspective on the predictions, and the regressionsallow for a full set of controls and subtler tests emphasizing therole of technology intensity. The predictions on the use of arm’slength technology transfers and the financing and ownership offoreign affiliates are investigated by pooling cross sections fromthe benchmark years. Investigating the effect on scale requiresan alternative setup because controlling for the many unobserv-able characteristics that might determine firm size is problematic.Fortunately, the model provides a stark prediction with respect toscale that can be tested by analyzing responses to the easing ofownership restrictions.
IV.A. Arm’s Length Technology Transfer Decisions
Figure I provides a preliminary perspective on the extentto which firms deploy technology through arm’s length transfers
23. Some country-level measures of economic and institutional developmentare highly correlated. The multicollinearity of these variables might cause thestandard errors of our key estimates to be large. However, these coefficient esti-mates remain unbiased.

1194 QUARTERLY JOURNAL OF ECONOMICS
FIGURE IArm’s Length Technology Transfer versus Direct Investment
Arm’s length technology transfer share is the ratio of the number of firms thatreceive a royalty from an unaffiliated foreign person to the sum of the number ofsuch firms and those firms that have an affiliate in a particular country and year.These shares are averaged by quintiles of private credit. Private credit varies byyear and is the ratio of private credit lent by deposit money banks to GDP, asprovided in Beck, Demirguc-Kunt, and Levine (1999). Higher number quintilesrelate to higher values of private credit.
relative to direct ownership, across different quintiles of the pri-vate credit measure of investor protections. The propensity to usearm’s length technology transfer is computed at the country-yearlevel as the ratio of the number of firms that receive a royaltypayment from an unaffiliated foreign person to the number offirms that either receive such an arm’s length royalty or have anaffiliate. The average arm’s length royalty share is 0.11 for thelowest private credit quintile of observations while it is 0.27 forthe highest quintile. As predicted by the theory, firms appear tomake greater use of arm’s length technology transfers, relative todirect ownership, to access countries with more developed capitalmarkets.
Table II further explores arm’s length technology transfersthrough specifications that include various controls and incorpo-rate subtler tests. The dependent variable in these tests, the arm’slength technology transfer dummy, is defined for country-yearpairs in which a firm either has an affiliate or receives a royaltypayment from an unaffiliated foreign person. The dummy is equalto 1 if the firm receives a royalty payment from an unaffiliated

MULTINATIONAL FIRMS AND IMPERFECT CAPITAL MARKETS 1195
TABLE IIARM’S LENGTH TECHNOLOGY TRANSFER VERSUS DIRECT INVESTMENT
Dependent variable: Arm’s length technology transfer dummy
(1) (2) (3) (4) (5) (6)
Creditor rights 0.0086 0.0131 0.0023(0.0022) (0.0026) (0.0039)
Creditor rights* 0.0016log of parent R&D (0.0005)
Private credit 0.0273 0.0295 −0.0606(0.0129) (0.0147) (0.0133)
Private credit* 0.0117log of parent R&D (0.0020)
FDI ownership 0.0098 0.0063 0.0079 −0.0001 0.0017 0.0020restrictions (0.0089) (0.0085) (0.0094) (0.0093) (0.0087) (0.0097)
Workforce schooling 0.0069 0.0122 0.0134 0.0066 0.0097 0.0103(0.0019) (0.0018) (0.0020) (0.0025) (0.0021) (0.0024)
Log of GDP 0.0238 0.0239 0.0268 0.0212 0.0216 0.0243(0.0032) (0.0033) (0.0038) (0.0031) (0.0035) (0.0039)
Log of GDP per capita −0.0148 −0.0129 −0.0144 −0.0179 −0.0182 −0.0223(0.0039) (0.0058) (0.0066) (0.0047) (0.0067) (0.0077)
Corporate tax rate 0.1239 0.1583 0.1777 0.1367 0.1363 0.1588(0.0435) (0.0413) (0.0453) (0.0434) (0.0393) (0.0438)
Patent protections 0.0124 0.0127 0.0155 0.0158(0.0046) (0.0052) (0.0057) (0.0066)
Property rights −0.0227 −0.0254 −0.0095 −0.0086(0.0061) (0.0067) (0.0057) (0.0066)
Rule of law −0.0013 −0.0022 −0.0025 −0.0040(0.0039) (0.0043) (0.0043) (0.0046)
Risk of expropriation −0.0076 −0.0080 −0.0082 −0.0080(0.0044) (0.0049) (0.0050) (0.0055)
Constant −0.3780 −0.3569 −0.5162 −0.2839 −0.2638 −0.3923(0.0840) (0.0822) (0.0979) (0.0807) (0.0843) (0.0968)
Parent-year fixed Y Y Y Y Y Yeffects?
No. of obs. 37,314 36,029 30,954 34,583 33,922 29,238R2 .7628 .7645 .6061 .7598 .7624 .6105
Notes. The dependent variable, the arm’s length technology transfer dummy, is defined for country-yearpairs in which a parent has an affiliate or from which a parent receives a royalty payment from an unaffiliatedforeign person. This dummy is equal to 1 if the parent receives a royalty payment from an unaffiliated foreignperson, and it is otherwise equal to 0. Creditor rights is an index of the strength of creditor rights developed inDjankov, McLiesh, and Shleifer (2007); higher levels of the measure indicate stronger legal protections. Privatecredit is the ratio of private credit lent by deposit money banks to GDP, as provided in Beck, Demirguc-Kunt,and Levine (1999). FDI ownership restrictions is a dummy equal to 0 if two measures of restrictions on foreignownership as measured by Shatz (2000) are above 3 on a scale of 1 to 5 and 1 otherwise. Workforce schooling isthe average schooling years in the population over age 25 years provided in Barro and Lee (2000). Corporatetax rate is the median effective tax rate paid by affiliates in a particular country and year. Patent protectionsis an index of the strength of patent rights provided in Ginarte and Park (1997). Property rights is an index ofthe strength of property rights drawn from the 1996 Index of Economic Freedom. Rule of law is an assessmentof the strength and impartiality of a country’s overall legal system drawn from the International CountryRisk Guide. Risk of expropriation is an index of the risk of outright confiscation or forced nationalizationof private enterprise, and it is also drawn from the International Country Risk Guide; higher values of thisindex reflect lower risks. Each specification is an OLS specification that includes parent-year fixed effects.Heteroscedasticity-consistent standard errors that correct for clustering at the country-year level appear inparentheses.

1196 QUARTERLY JOURNAL OF ECONOMICS
foreign person, and it is otherwise equal to 0. The inclusion ofparent-year fixed effects controls for a variety of unobservablefirm characteristics that might otherwise conflate the analysis.All specifications presented in the table also include a measure ofthe existence of foreign ownership restrictions, workforce school-ing, the log of GDP, the log of GDP per capita, and host country taxrates.24 Standard errors are heteroscedasticity-consistent and areclustered at the country-year level. These specifications are lin-ear probability models and are used in order to allow for bothparent-year fixed effects and for clustering of standard errors atthe country-year level.25
The coefficient on creditor rights in column (1) is positiveand significant, affirming the prediction of Corollary 1 that firmsare more likely to serve countries with higher levels of investorprotections through arm’s length technology transfer as opposedto only through a foreign affiliate. The results also indicate thatfirms are more likely to engage in arm’s length technology transferas opposed to just affiliate activity in countries that have a moreeducated workforce and that have higher corporate tax rates.
The predictions of the model relate to credit market develop-ment, but the measure of creditor rights may be correlated withmore general variation in the institutional environment. The spec-ification presented in column (2) includes additional proxies forthe quality of other host country institutions, including indices ofpatent protections, property rights, the strength and impartialityof the overall legal system, and the risk of expropriation as controlvariables. The coefficient on creditor rights remains positive andsignificant with the inclusion of these additional controls, imply-ing that capital market conditions play an economically significantrole relative to other host country institutions. The effect of a one-standard-deviation change in creditor rights is approximately oneand a half times as large as the effect of a one-standard-deviationchange in patent protections, which is also positive and significantin explaining the use of arm’s length technology transfer.
24. For the estimated effects of capital market conditions to be unbiased inthis and the subsequent tests, these country characteristics must be exogenous tofirms’ decisions to use arm’s length technology transfers as opposed to FDI, andfirms’ financing and ownership decisions.
25. Given the limited time dimension of our data set, our linear specificationavoids the incidental parameter problem inherent in the estimation of a largenumber of fixed effects. As a robustness check, these specifications have been runas conditional logit specifications. The resulting coefficients on the measures offinancial development are of the same sign and statistical significance as thosepresented in Table II.

MULTINATIONAL FIRMS AND IMPERFECT CAPITAL MARKETS 1197
The specification presented in column (3) provides a subtlertest of the model and the particular mechanism that gives riseto FDI as opposed to arm’s length technology transfer. The modelimplies that the relative value of monitoring should be more pro-nounced for firms that conduct more research and development(R&D) because these firms are more likely to be deploying noveltechnologies that require the unique monitoring ability of par-ents. Alternatively, firms with limited technological capabilitiesare less likely to be important to external funders as monitors,and the effects of capital market development on the choice toserve a country through arm’s length technology transfer or affil-iate activity should be less pronounced for these kinds of firms.
The specification presented in column (3) uses the log of par-ent R&D as a proxy for the degree to which firms are technolog-ically advanced. Because this specification includes parent-yearfixed effects, this variable does not enter on its own, but it isinteracted with creditor rights.26 The positive coefficient on theinteraction term is consistent with the prediction that the valueof creating incentives to monitor through ownership in countrieswith weak financial development is highest for technologicallyadvanced firms.
The specifications presented in columns (4)–(6) of Table II re-peat those presented in columns (1)–(3), replacing creditor rightswith private credit as a measure of financial development. Thepositive and significant coefficients on private credit in columns(4) and (5) are consistent with the findings in columns (1) and(2) and illustrate that countries with higher levels of financialdevelopment are more likely to be served through arm’s lengthtechnology transfers as opposed to just affiliate activity. The pos-itive and significant coefficient on private credit interacted withthe log of parent R&D presented in column (6) indicates that theeffects of capital markets are most pronounced for firms that areR&D intensive.27
26. Because parent characteristics are absorbed by the parent-year fixed ef-fects, the coefficient on this interaction term picks up how the effect of capitalmarket conditions varies across firms. The sample used in this specification andthe specification in column (6) includes only MNCs because R&D expenditures areonly available in the BEA data for these firms.
27. When running these specifications as conditional logit specifications, theresulting coefficients on these interaction terms are of the same sign and statisticalsignificance as those in the Table II, except for the interaction of creditor rightsand the log of parent R&D. The coefficient on this variable is positive, but it is notstatistically different from zero at conventional levels.

1198 QUARTERLY JOURNAL OF ECONOMICS
FIGURE IIParent Financing of Affiliate Assets
Parent financing share is the ratio of the sum of net borrowing from the parentand parent equity provisions to affiliate assets. The bars display medians of thecountry-level average shares for each quintile of private credit. Private creditis the ratio of private credit lent by deposit money banks to GDP, as providedin Beck, Demirguc-Kunt, and Levine (1999). Higher number quintiles relate tohigher values of private credit.
IV.B. Financing and Ownership of Foreign Affiliates
The analysis presented in Figure II and Table III investi-gates whether financing and ownership decisions reflect the me-chanics emphasized in the model. As depicted in Figure II, parentfirms provide financing that averages 45% of affiliate assets incountries in the lowest quintile of private credit but 38% of affili-ate assets in countries from the highest quintile of private credit.28
Table III presents the results of more detailed tests of this relation.In addition to a variety of country-level controls, fixed effects foreach parent in each year control for differences across firms. Thenegative and significant coefficient on creditor rights in column (1)
28. More specifically, the values displayed in this chart are computed by firsttaking average shares of affiliate assets financed by parents for each country ineach year. These shares are defined as the ratio of the sum of net borrowingfrom the parent and parent equity provisions (including both paid-in-capital andretained earnings) to affiliate assets. The bars display medians of the country-levelaverages for each quintile of private credit.

MULTINATIONAL FIRMS AND IMPERFECT CAPITAL MARKETS 1199
TABLE IIIPARENT FINANCING DECISIONS
Dependent variable: Share of affiliate assets financed by parent
(1) (2) (3) (4) (5) (6)
Creditor rights −0.0166 −0.0164 −0.0080(0.0054) (0.0051) (0.0055)
Creditor rights* −0.0010log of parent R&D (0.0003)
Private credit −0.0632 −0.0384 −0.0084(0.0195) (0.0215) (0.0220)
Private credit* −0.0031log of parent R&D (0.0012)
FDI ownership −0.0406 −0.0426 −0.0426 −0.0323 −0.0358 −0.0358restrictions (0.0146) (0.0154) (0.0155) (0.0171) (0.0160) (0.0162)
Workforce schooling 0.0200 0.0110 0.0114 0.0199 0.0151 0.0157(0.0057) (0.0042) (0.0043) (0.0060) (0.0048) (0.0049)
Log of GDP −0.0224 −0.0180 −0.0180 −0.0157 −0.0148 −0.0148(0.0055) (0.0070) (0.0071) (0.0062) (0.0084) (0.0085)
Log of GDP per capita −0.0327 −0.0066 −0.0072 −0.0285 0.0027 0.0030(0.0112) (0.0153) (0.0154) (0.0136) (0.0167) (0.0169)
Corporate tax rate −0.1288 −0.2135 −0.2061 −0.1135 −0.1803 −0.1731(0.0776) (0.0763) (0.0764) (0.0743) (0.0742) (0.0745)
Patent protections −0.0392 −0.0388 −0.0434 −0.0436(0.0113) (0.0114) (0.0119) (0.0120)
Property rights 0.0112 0.0110 −0.0096 −0.0113(0.0112) (0.0115) (0.0103) (0.0106)
Rule of law 0.0059 0.0062 0.0065 0.0068(0.0078) (0.0079) (0.0080) (0.0080)
Risk of expropriation 0.0010 0.0007 0.0009 0.0003(0.0090) (0.0091) (0.0092) (0.0094)
Constant 1.2571 0.9710 0.9728 1.0444 0.8389 0.8330(0.1083) (0.1420) (0.1435) (0.1479) (0.1868) (0.1906)
Parent-year fixed Y Y Y Y Y Yeffects?
Affiliate controls? N Y Y N Y YNo. of obs. 51,060 41,232 40,297 48,183 38,911 38,016R2 .3013 .3105 .3071 .3076 .3167 .3134
Notes. The dependent variable is the ratio of parent-provided equity and net parent lending to totalassets. Creditor rights is an index of the strength of creditor rights developed in Djankov, McLiesh, andShleifer (2007); higher levels of the measure indicate stronger legal protections. Private credit is the ratio ofprivate credit lent by deposit money banks to GDP, as provided in Beck, Demirguc-Kunt, and Levine (1999).FDI ownership restrictions is a dummy equal to 0 if two measures of restrictions on foreign ownership asmeasured by Shatz (2000) are above 3 on a scale of 1 to 5 and 1 otherwise. Workforce schooling is the averageschooling years in the population over age 25 years provided in Barro and Lee (2000). Corporate tax rateis the median effective tax rate paid by affiliates in a particular country and year. Patent protections is anindex of the strength of patent rights provided in Ginarte and Park (1997). Property rights is an index of thestrength of property rights drawn from the 1996 Index of Economic Freedom. Rule of law is an assessmentof the strength and impartiality of a country’s overall legal system drawn from the International CountryRisk Guide. Risk of expropriation is an index of the risk of outright confiscation or forced nationalizationof private enterprise, and it is also drawn from the International Country Risk Guide; higher values of thisindex reflect lower risks. Each specification is an OLS specification that includes parent-year fixed effects. Asaffiliate controls, the specifications presented in columns (2), (3), (5), and (6) include the log of affiliate sales,the log of affiliate employment, and affiliate net PPE/assets. Affiliate net PPE/assets is the ratio of affiliate netproperty plant and equipment to affiliate assets. Heteroscedasticity-consistent standard errors that correctfor clustering at the country-year level appear in parentheses.

1200 QUARTERLY JOURNAL OF ECONOMICS
indicates that the share of affiliate assets financed by the parentis higher in countries that do not provide creditors with exten-sive legal protections. This result is consistent with the predictioncontained in Proposition 3 and the pattern depicted in Figure II.
The specification in column (2) includes the set of other in-stitutional variables also used in Table II to ensure that proxiesfor financial development are not proxying for some other kindof institutional development. In addition, this specification alsocontrols for affiliate characteristics that the corporate finance lit-erature suggests might influence the availability of external cap-ital. Harris and Raviv (1991) and Rajan and Zingales (1995) findthat larger firms and firms with higher levels of tangible assetsare more able to obtain external debt. Two proxies for affiliatesize (the log of affiliate sales and the log of affiliate employment)and a proxy for the tangibility of affiliate assets (the ratio of af-filiate net property, plant, and equipment to affiliate assets) areincluded.29
In the specification in column (2), the −0.0164 coefficient oncreditor rights implies that the share of affiliate assets financedby the affiliate’s parent is 0.0327, or 7.9% of its mean value, higherfor affiliates in countries in the 25th percentile of creditor rightsrelative to the 75th percentile of creditor rights. The negative andsignificant coefficient on FDI ownership restrictions is consistentwith the hypothesis that such restrictions limit parent capitalprovisions, and the negative and significant coefficient on the logof GDP suggests that affiliates located in smaller markets aremore reliant on their parents for capital. When affiliates borrow,they primarily borrow from external sources, and Desai, Foley,and Hines (2004b) show that affiliates borrow more in high-taxjurisdictions. These facts could explain the negative coefficient onthe corporate tax rate in explaining the share of assets financedby the parent.30 Previous theoretical work stressing how concernsover technology expropriation might give rise to multinationalactivity does not make clear predictions concerning the share ofaffiliate assets financed by the parent, but it is worth noting thatthe indices of patent protection and property rights are negative in
29. The affiliate controls included in this specification as well as those incolumns (3), (5), and (6) of Table III and columns (2), (3), (5), and (6) of Table IVare potentially endogenous. It is comforting that their inclusion does not typicallyhave a material impact on the estimated effects of capital market conditions.
30. The model’s predictions relate to overall parent capital provision. As such,these specifications differ from the analysis in Desai, Foley, and Hines (2004b),where only borrowing decisions are analyzed.

MULTINATIONAL FIRMS AND IMPERFECT CAPITAL MARKETS 1201
the specification in column (2). None of the unreported coefficientson affiliate characteristics is significant.
If parent financing creates incentives for monitoring and theeffects of monitoring are strongest for firms with more technology,then the effects documented in column (2) should be most pro-nounced for R&D-intensive firms. The specification in column (3)tests for a differential effect of creditor rights on financing by in-cluding creditor rights interacted with the log of parent R&D. Thenegative and significant coefficient on this interaction term indi-cates that more technologically advanced firms finance a highershare of affiliate assets in countries with weak credit markets.This finding is not implied by many other intuitions for why in-vestor protections might affect parental financing provisions.
The specifications presented in columns (4)–(6) of Table IIIrepeat the analysis presented in columns (1)–(3) substituting mea-sures of private credit for creditor rights. In columns (4) and (5),the coefficient on private credit is negative, and it is significantin column (4) but only marginally significant in column (5). Inthe specification in column (6), the interaction of private creditand the log of parent R&D is significant. The results obtainedwhen using private credit are also consistent with the predictionof Proposition 3 and with Figure II.
The model also predicts that multinational parents shouldhold larger ownership stakes in affiliates located in countries withweak investor protections. Table IV presents results of using theshare of affiliate equity owned by the parent as the dependentvariable in specifications that are similar to those presented inTable III. Although parent equity shares are bounded between0 and 1, and there is a large grouping of affiliates with equitythat is 100% owned by a single parent firm, the specifications pre-sented in Table IV are ordinary least squares models that includeparent-year fixed effects and that allow standard errors to be clus-tered at the country-year level.31 In the specifications presentedin columns (1), (2), (4), and (5), the proxy for credit market devel-opment is negative and significant. Parent companies own highershares of affiliate equity when affiliates are located in countrieswhere protections extended to creditors are weaker and privatecredit is scarcer, as predicted by the model. In the specifications
31. Wholly owned affiliates comprise 77.2% of all observations. These resultsare robust to using an alternative estimation technique. Conditional logit specifi-cations that use a dependent variable that is equal to 1 for wholly owned affiliatesand 0 for partially owned affiliates yield similar results.
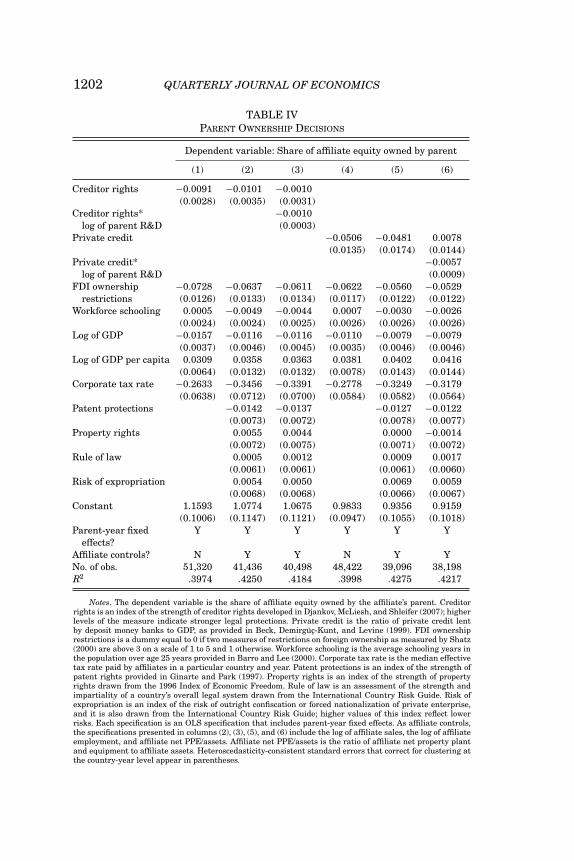
1202 QUARTERLY JOURNAL OF ECONOMICS
TABLE IVPARENT OWNERSHIP DECISIONS
Dependent variable: Share of affiliate equity owned by parent
(1) (2) (3) (4) (5) (6)
Creditor rights −0.0091 −0.0101 −0.0010(0.0028) (0.0035) (0.0031)
Creditor rights* −0.0010log of parent R&D (0.0003)
Private credit −0.0506 −0.0481 0.0078(0.0135) (0.0174) (0.0144)
Private credit* −0.0057log of parent R&D (0.0009)
FDI ownership −0.0728 −0.0637 −0.0611 −0.0622 −0.0560 −0.0529restrictions (0.0126) (0.0133) (0.0134) (0.0117) (0.0122) (0.0122)
Workforce schooling 0.0005 −0.0049 −0.0044 0.0007 −0.0030 −0.0026(0.0024) (0.0024) (0.0025) (0.0026) (0.0026) (0.0026)
Log of GDP −0.0157 −0.0116 −0.0116 −0.0110 −0.0079 −0.0079(0.0037) (0.0046) (0.0045) (0.0035) (0.0046) (0.0046)
Log of GDP per capita 0.0309 0.0358 0.0363 0.0381 0.0402 0.0416(0.0064) (0.0132) (0.0132) (0.0078) (0.0143) (0.0144)
Corporate tax rate −0.2633 −0.3456 −0.3391 −0.2778 −0.3249 −0.3179(0.0638) (0.0712) (0.0700) (0.0584) (0.0582) (0.0564)
Patent protections −0.0142 −0.0137 −0.0127 −0.0122(0.0073) (0.0072) (0.0078) (0.0077)
Property rights 0.0055 0.0044 0.0000 −0.0014(0.0072) (0.0075) (0.0071) (0.0072)
Rule of law 0.0005 0.0012 0.0009 0.0017(0.0061) (0.0061) (0.0061) (0.0060)
Risk of expropriation 0.0054 0.0050 0.0069 0.0059(0.0068) (0.0068) (0.0066) (0.0067)
Constant 1.1593 1.0774 1.0675 0.9833 0.9356 0.9159(0.1006) (0.1147) (0.1121) (0.0947) (0.1055) (0.1018)
Parent-year fixed Y Y Y Y Y Yeffects?
Affiliate controls? N Y Y N Y YNo. of obs. 51,320 41,436 40,498 48,422 39,096 38,198R2 .3974 .4250 .4184 .3998 .4275 .4217
Notes. The dependent variable is the share of affiliate equity owned by the affiliate’s parent. Creditorrights is an index of the strength of creditor rights developed in Djankov, McLiesh, and Shleifer (2007); higherlevels of the measure indicate stronger legal protections. Private credit is the ratio of private credit lentby deposit money banks to GDP, as provided in Beck, Demirguc-Kunt, and Levine (1999). FDI ownershiprestrictions is a dummy equal to 0 if two measures of restrictions on foreign ownership as measured by Shatz(2000) are above 3 on a scale of 1 to 5 and 1 otherwise. Workforce schooling is the average schooling years inthe population over age 25 years provided in Barro and Lee (2000). Corporate tax rate is the median effectivetax rate paid by affiliates in a particular country and year. Patent protections is an index of the strength ofpatent rights provided in Ginarte and Park (1997). Property rights is an index of the strength of propertyrights drawn from the 1996 Index of Economic Freedom. Rule of law is an assessment of the strength andimpartiality of a country’s overall legal system drawn from the International Country Risk Guide. Risk ofexpropriation is an index of the risk of outright confiscation or forced nationalization of private enterprise,and it is also drawn from the International Country Risk Guide; higher values of this index reflect lowerrisks. Each specification is an OLS specification that includes parent-year fixed effects. As affiliate controls,the specifications presented in columns (2), (3), (5), and (6) include the log of affiliate sales, the log of affiliateemployment, and affiliate net PPE/assets. Affiliate net PPE/assets is the ratio of affiliate net property plantand equipment to affiliate assets. Heteroscedasticity-consistent standard errors that correct for clustering atthe country-year level appear in parentheses.

MULTINATIONAL FIRMS AND IMPERFECT CAPITAL MARKETS 1203
presented in columns (3) and (6), the negative and significant co-efficients on the interaction terms indicate that these results arealso more pronounced for technologically advanced firms.
The results in Table IV also indicate that equity ownershipshares are lower in countries with ownership restrictions andcountries with higher corporate tax rates. If equity ownership de-cisions placed strong emphasis on the protection of technology andownership substituted for weak patent protections, the coefficienton the patent protections variable should be negative and signif-icant. Although the estimated coefficient is negative, it is onlymarginally significant in some specifications.
The results presented in Tables II, III, and IV are robust toa number of concerns. First, it is possible that the estimates ofcoefficients on capital market conditions interacted with the logof parent R&D may reflect the effect of similar interactions withalternative institutional variables. To consider this possibility, itis useful to consider the inclusion of other interaction terms. Forexample, when the log of parent R&D interacted with the rule oflaw index is included in the specifications presented in columns(3) and (6) of the three tables, the interactions that include prox-ies for capital market development remain significant in all of thetests. When the log of parent R&D interacted with the patent pro-tection index is included in these specifications, the interactionsfeaturing proxies for credit market development remain signifi-cant in all of the tests except for the one in column (3) of TableII. As such, it appears that the role of R&D intensity is most pro-nounced through the channel emphasized in the model, throughinteractions with capital market conditions.
It may also be the case that the share of affiliate assets fi-nanced by the parent and parent ownership levels are lower forolder affiliates and these affiliates may be more prevalent in coun-tries with better investor protections. Including proxies for affili-ate age in the specifications presented in Tables III and IV doesnot affect the results of interest.32 Similarly, the model does not ex-plicitly consider the possibility that a firm exploits its technologythrough trade as opposed to through FDI or arm’s length technol-ogy transfers. To consider if trade channels could affect the mainfindings, the log of parent exports to unaffiliated foreign persons
32. The proxies for age are the number of years since an affiliate first reporteddata to BEA and a dummy equal to 1 if the affiliate first reported in 1982 and 0otherwise.

1204 QUARTERLY JOURNAL OF ECONOMICS
in each country and year is included as a control in each of thespecifications. The magnitude and significance of the coefficientson the proxies for capital market conditions and the interactionsof these proxies and the log of parent R&D are not materiallychanged. Finally, contractual forms that are specific to the nat-ural resources sector could affect some of the results. Removingobservations of firms in this sector reduces the significance of theresults on the effects of private credit in specifications presentedin column (5) of Tables II and III, but does not materially changeany of the other results on the effects of capital market conditionsin Tables II, III, and IV.33
IV.C. Scale of Multinational Activity
The model predicts that multinational activity will be of alarger scale in countries with stronger investor protections. Be-cause there are many theories for the determinants of FDI activ-ity, using specifications similar to those presented in Tables II,III, and IV to explore scale is problematic because it is difficultto include a set of controls sufficiently extensive to distinguishbetween alternative theories.34
Fortunately, a subtler prediction of the model allows for testsof scale effects. Specifically, the model suggests that the responseto the liberalizations of ownership restrictions should be larger inhost countries with weak investor protections. The intuition forthis prediction is that in countries with weak investor protections,ownership restrictions are more likely to bind because ownershipis most critical for maximizing the value of the enterprise in thesesettings. As such, the relaxation of an ownership constraint shouldhave muted effects for affiliates in countries with deep capitalmarkets and more pronounced effects for affiliates in countrieswith weaker investor protections.35
33. Firms in BEA industries 101–148 and 291–299 are dropped from thesample. The coefficient on private credit in column (5) of Table II, when estimatedusing the reduced sample, is 0.0292, and it has a t-statistic of 1.92. The coefficienton private credit in column (5) of Table III, when estimated using the reducedsample, is −0.0351, and it has a t-statistic of 1.62.
34. Appendix Table I in Antras, Desai, and Foley (2007) presents the results ofsuch an exercise. Although the coefficients on both the creditor rights variables andprivate credit variables are usually positive in explaining the log of affiliate sales,as Proposition 2 predicts, none of the coefficients on these variables is significant.
35. This prediction can in fact be explicitly derived from the model. In par-ticular, one can envision an ownership restriction as an additional constraint toprogram (P1), requiring that φI ≤ φ I for some foreign ownership cap φ I ∈ R. Onecan then show (details available upon request) that (i) for large enough γ , thisconstraint will not bind, and thus a removal of the constraint will have no effects

MULTINATIONAL FIRMS AND IMPERFECT CAPITAL MARKETS 1205
FIGURE IIILiberalizations and Multinational Firm Growth
The two lines correspond to averages of an index computed at the country levelas the ratio of aggregate affiliate sales in a given year to the level of sales in theyear of the liberalization. Countries are split into two samples at the median levelof private credit. Private credit is the ratio of private credit lent by deposit moneybanks to GDP, as provided in Beck, Demirguc-Kunt, and Levine (1999).
Figure III illustrates how the scale of multinational activitychanges around the time of ownership liberalizations in countrieswith different levels of capital market development. Liberaliza-tions are defined as the first year in which the FDI ownershiprestriction dummy described above changes from 1 to 0.36 The
on affiliate activity; (ii) when the constraint binds, the level of affiliate activity x islower than in the absence of the constraint; and (iii) a marginal increase in φ I (i.e.,a relaxation of the restriction) increases x by more, the lower is γ . Hence, the re-sponse of affiliate activity to a removal of ownership restrictions will be relativelylarger in countries with relatively weaker investor protections.
36. The countries experiencing a liberalization are Argentina (1990), Aus-tralia (1987), Colombia (1992), Ecuador (1991), Finland (1990), Honduras (1993),Japan (1993), Malaysia (1987), Mexico (1990), Norway (1995), Peru (1992), Philip-pines (1992), Portugal (1987), Sweden (1992), Trinidad and Tobago (1994), andVenezuela (1990). Because control variables measuring the development of insti-tutions other than credit markets do not vary much (if at all) through time andare unavailable for six of the sixteen reforming countries, these controls are notincluded in the analysis of liberalizations. The affiliate fixed effects implicitly con-trol for time-invariant country characteristics, and so this is unlikely to pose asignificant problem.

1206 QUARTERLY JOURNAL OF ECONOMICS
TABLE VLIBERALIZATIONS AND MULTINATIONAL FIRM SCALE
Dependent variable
Log of aggregateLog of affiliate sales affiliate sales
(1) (2) (3) (4)
Post-liberalization dummy 0.0016 −0.0073 −0.0633 −0.1049(0.0684) (0.0712) (0.1230) (0.1262)
Post-liberalization dummy * 0.3011 0.3682low creditor rights dummy (0.0827) (0.1552)
Post-liberalization dummy * 0.2947 0.3812low private credit dummy (0.0899) (0.1769)
Log of GDP 0.3886 0.3409 −0.0786 −0.1351(0.3888) (0.3960) (0.7833) (0.7040)
Log of GDP per capita 1.3675 1.4488 2.6620 2.8376(0.3720) (0.3867) (0.5425) (0.6192)
Constant −13.5818 −13.0613 −4.7847 −4.9033(9.2414) (9.2484) (22.1876) (20.0397)
Affiliate and year fixed effects? Y Y N NCountry and year fixed effects? N N Y YNo. of obs. 180,796 181,103 827 845R2 .8035 .8040 .9243 .9251
Notes. The dependent variable in the first two columns is the log of affiliate sales, and the dependentvariable in the last two columns is the log of affiliate sales aggregated across affiliates in a particular country.The data are annual data covering the 1982–1999 period. The post-liberalization dummy is equal to 1 for thesixteen countries that liberalize their ownership restrictions in the year of and years following liberalizationof foreign ownership restrictions. The low creditor rights dummy is equal to 1 for observations related tocountries with below median levels of creditor rights among liberalizing countries measured in the year priorto liberalization and 0 otherwise. The low private credit dummy is equal to 1 for observations related tocountries with below median levels of private credit among liberalizing countries measured in the year priorto liberalization and 0 otherwise. Creditor rights is an index of the strength of creditor rights developed inDjankov, McLiesh, and Shleifer (2007). Private credit is the ratio of private credit lent by deposit moneybanks to GDP, as provided in Beck, Demirguc-Kunt, and Levine (1999). The first two specifications are OLSspecifications that include affiliate and year fixed effects, and the last two are OLS specifications that includecountry and year fixed effects. Heteroscedasticity-consistent standard errors that correct for clustering at thecountry level appear in parentheses.
lines trace out an index that is computed by calculating the ra-tio of aggregate affiliate sales in a particular country and year tothe value of aggregate affiliate sales in that country in the yearof liberalization. The line demarcated by squares (triangles) plotsthe average of this index across countries that have a measure ofprivate credit in the year prior to the liberalization that is equalto or less than (above) the median private credit of liberalizingcountries. The lines indicate that affiliate activity increases by alarger margin in countries with low levels of private credit follow-ing liberalizations.
The specifications presented in Table V investigate whetherthese differential effects are robust. The dependent variable in

MULTINATIONAL FIRMS AND IMPERFECT CAPITAL MARKETS 1207
columns (1) and (2) is the log value of affiliate sales, and the sam-ple consists of the full panel from 1982 to 1999. Given the limiteddata requirements of these specifications (relative to the variablesinvestigated in Tables II, III, and IV) and the desire to investigatechanges within affiliates, the full panel provides a more appro-priate setting for these tests. These specifications include affiliateand year fixed effects, and the standard errors are clustered at thecountry level. The sample includes all countries so that affiliateactivity in countries that do not liberalize helps identify the yeareffects and the coefficients on the income variables. The resultsare robust to using a sample drawn only from reforming countries.
The specifications in columns (1) and (2) include controls forlog GDP, log GDP per capita, and the post-liberalization dummy.The coefficient on log GDP per capita is positive and significantindicating that rising incomes are associated with larger levelsof affiliate activity. The coefficient of interest in column (1) is thecoefficient on the interaction of the post-liberalization dummy anda dummy that is equal to 1 if the country has a value of the creditorrights index in the year before liberalization that is equal to or lessthan the median value for liberalizing countries. The positive andsignificant coefficient indicates that affiliates in weak-creditor-rights countries grow quickly after liberalizations. The coefficienton the post-liberalization dummy on its own indicates that theeffect of liberalizations is negligible and statistically insignificantfor affiliates in high-creditor-rights countries. In column (2), thesesame results are obtained when the measure of private credit isused as the proxy for financial development. At the affiliate level,the model’s predictions regarding how the scale of activity relatesto capital market depth are validated using tests that, through theuse of affiliate fixed effects and the emphasis on the interactionterm, are difficult to reconcile with alternative theories.
It is possible that the results presented in columns (1) and (2)inaccurately capture the effects of the liberalizations because theyonly measure activity on the intensive margin and fail to captureresponses on the extensive margin. Entry or exit might accompanyliberalizations and might amplify or dampen these results. Fig-ure III suggests this is not the case because it is constructed usingdata aggregated to the country level. The specifications providedin columns (3) and (4) employ a dependent variable that is the logvalue of the aggregate value of all sales of U.S. multinational af-filiates within a country-year cell. These specifications substitutecountry fixed effects for affiliate fixed effects but are otherwisesimilar to the regressions provided in columns (1) and (2).

1208 QUARTERLY JOURNAL OF ECONOMICS
In column (3), the coefficient on the interaction term includingthe creditor rights variable is again positive and significant, in-dicating that incorporating activity on the extensive margin doesnot appear to contradict the earlier result. In column (4), the co-efficient on the interaction term is again positive and significant.Taken together, the results suggest that the scale of activity ispositively related to the quality of investor protections and capitalmarket development, and these results persist when incorporat-ing the effects of entry and exit.
V. CONCLUSION
Efforts to understand patterns of MNC activity have typi-cally emphasized aspects of technology expropriation rather thanthe constraints imposed by weak investor protections and shal-low capital markets. In the prior literature, MNCs arise becauseof the risk of a partner expropriating a proprietary technology. Inthe model presented in this paper, the exploitation of technologyis central to understanding MNC activity, but the critical con-straint is the nature of capital market development and investorprotections in host countries. Entrepreneurs must raise capital tofund projects, and external investors are aware of the possibilitythat these entrepreneurs might behave opportunistically. Inven-tors can alleviate financial frictions because they have privilegedknowledge of their technology and can thus play a role in moni-toring entrepreneurs. As a result, MNC activity and capital flowsarise endogenously to ensure that monitoring occurs. Externalinvestors demand higher levels of multinational parent firm fi-nancial participation in countries with weak investor protections.
By placing financial frictions at the center of understandingpatterns of activity and flows, the model delivers novel predictionsabout the use of arm’s length technology transfers and about thefinancial and investment decisions of MNCs that are validated infirm-level analysis. The use of arm’s length technology transfersis more common in countries with strong investor protections anddeep capital markets. Previous findings that FDI flows to devel-oping countries are limited reflect two opposing forces. Weak in-vestor protections and shallow capital markets limit the efficientscale of enterprise but also result in greater parent provision ofcapital and more parent ownership of affiliate equity. The effects ofthe institutional setting are more pronounced for R&D-intensivefirms because parental monitoring is particularly valuable for the

MULTINATIONAL FIRMS AND IMPERFECT CAPITAL MARKETS 1209
investments of these firms. By jointly considering operational andfinancial decisions, the theory and empirics provide an integratedexplanation for patterns of MNC activity and FDI flows that havetypically been considered separately.
Further consideration of the role of financial frictions on MNCactivity along several dimensions may prove fruitful. First, themodel presented effectively rules out exports to unrelated partiesas a means of serving foreign markets. Incorporating the trade-offbetween exports and production abroad in a world with financialfrictions may yield additional predictions that would help explainthe choice between exporting and FDI. Second, exploring the im-plications of financial frictions for intrafirm trade may help ex-plain how the demands of external funders in weak institutionalenvironments affect the fragmentation of production processesacross borders. Finally, the central role of foreign ownership inreducing diversion may lead to significant variation in the rela-tive competitiveness of local and foreign firms that reflects theinstitutional environment emphasized in this paper.
APPENDIX I: THE SHADOW COST OF CASH
In the main text, we have treated the shadow value of cash β
as exogenous. In this Appendix we briefly illustrate how to endo-genize it and show how it relates to characteristics of the Homecountry and in particular to its level of investor protection.
For this purpose, we generalize the setup described in SectionII.A and consider the situation in which there are J − 1 Foreigncountries, each associated with a level of financial developmentγ j and a cash flow function Rj(x j).37 The inventor contracts witheach of J − 1 foreign entrepreneurs and, as a result of the optimalcontracting described above, has an amount of cash equal to W −∑
j �=H F j to invest in the Home country.Preferences and technology at Home are such that the cash
flows obtained from the sale of the differentiated good at Homecan be expressed as a strictly increasing and concave functionof the quantity produced, RH(qH), satisfying the same propertiesas the cash flow function in other countries. Home productionis managed by the inventor, who can also privately choose to be-have or misbehave, with consequences identical to those discussed
37. With some abuse of notation, we use J to denote both the number ofcountries as well as the set of these countries.
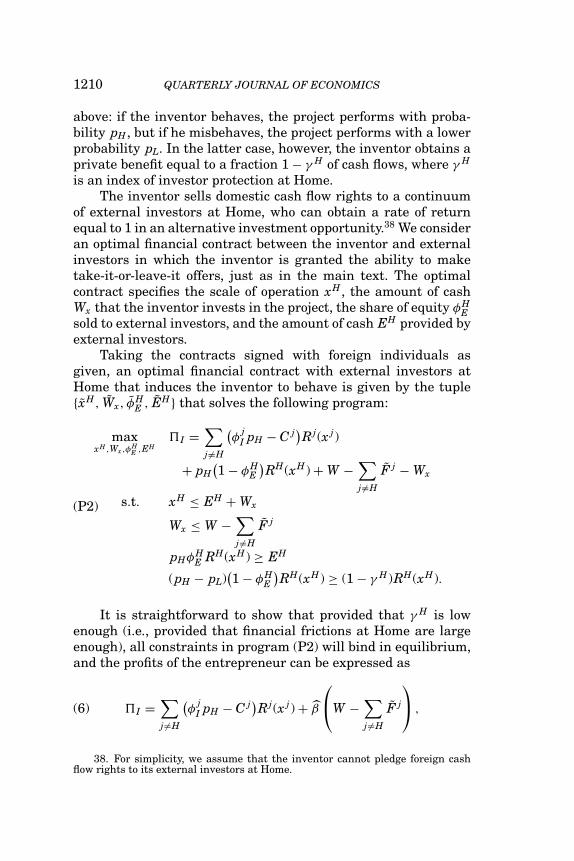
1210 QUARTERLY JOURNAL OF ECONOMICS
above: if the inventor behaves, the project performs with proba-bility pH , but if he misbehaves, the project performs with a lowerprobability pL. In the latter case, however, the inventor obtains aprivate benefit equal to a fraction 1 − γ H of cash flows, where γ H
is an index of investor protection at Home.The inventor sells domestic cash flow rights to a continuum
of external investors at Home, who can obtain a rate of returnequal to 1 in an alternative investment opportunity.38 We consideran optimal financial contract between the inventor and externalinvestors in which the inventor is granted the ability to maketake-it-or-leave-it offers, just as in the main text. The optimalcontract specifies the scale of operation xH , the amount of cashWx that the inventor invests in the project, the share of equity φH
Esold to external investors, and the amount of cash EH provided byexternal investors.
Taking the contracts signed with foreign individuals asgiven, an optimal financial contract with external investors atHome that induces the inventor to behave is given by the tuple{xH, Wx, φ
HE , EH} that solves the following program:
maxxH ,Wx,φ
HE ,EH
�I =∑
j �=H
(φ
jI pH − C j)Rj(x j)
+ pH(1 − φH
E
)RH(xH) + W −
∑
j �=H
F j − Wx
s.t. xH ≤ EH + Wx
Wx ≤ W −∑
j �=H
F j
pHφHE RH(xH) ≥ EH
(pH − pL)(1 − φH
E
)RH(xH) ≥ (1 − γ H)RH(xH).
(P2)
It is straightforward to show that provided that γ H is lowenough (i.e., provided that financial frictions at Home are largeenough), all constraints in program (P2) will bind in equilibrium,and the profits of the entrepreneur can be expressed as
(6) �I =∑
j �=H
(φ
jI pH − C j)Rj(x j) + β
⎛
⎝W −∑
j �=H
F j
⎞
⎠ ,
38. For simplicity, we assume that the inventor cannot pledge foreign cashflow rights to its external investors at Home.

MULTINATIONAL FIRMS AND IMPERFECT CAPITAL MARKETS 1211
where
β =1 − γ H
(pH − pL)1 − γ H
pH − pL−
(1 − xH
pH RH(xH)
) > 1.
Notice that the resulting profit function (6) is closely related tothat considered in program (P1) in Section II.B, where β nowreplaces β. There are, however, two important differences betweenthe two profit functions.
First, the formulation in (6) considers the case in which theinventor obtains cash flow from the exploitation of the technol-ogy in multiple countries. Nevertheless, notice that for a given β,the profit function features separability between these differentsources of dividends. As a result, for a given β, the optimal contractwith the entrepreneur and external investors in each country jis as described in Section II.B.39 Hence, Propositions 1, 2, and 3continue to apply and their statements not only apply to changesin the parameter γ but also to cross-sectional (cross-country) vari-ation in investor protection. In this sense, the tests performed inSection IV are well defined.
The second important difference between the profit functionin (6) and in program (P1) is that the shadow value of cash β isin fact endogenous, in the sense that it is a function of the scale ofoperation at Home xH , which in turn will depend on the optimalcontracts in the other J countries through the date-0 transfers F j
for j �= H (as is clear from program (P2)). Hence, β will in gen-eral be a function of the vector of country investor protections γ ≡(γ 1, . . . , γ J−1, γ H). Notice, however, that for large enough J, the ef-fect of a particular investor protection level γ j ( j �= H) on the over-all shadow value of cash β will tend to be negligible, and thus thecomparative static results in Section II.B will continue to apply.
To sum up, this Appendix has illustrated that a higher-than-1 shadow value of cash can easily be rationalized in a simple
39. Notice also that when β > 1, the inventor is financially constrained atHome, in the sense that external investors at Home are only willing to lend tohim a multiple of his pledgeable income (wealth plus date-0 payments). If externalinvestors were to lend a larger amount, the inventor’s incentive-compatibilityconstraint would be violated. The same would of course apply to external investorsin foreign countries. This helps rationalize our assumption in Section II.A that theinventor does not sign bilateral financial contracts with external investors in hostcountries.

1212 QUARTERLY JOURNAL OF ECONOMICS
extension of our initial partial equilibrium model, in which notonly foreign entrepreneurs, but also the inventor, face financialconstraints. We have seen that endogenizing the shadow value ofcash may affect the solution of the optimal contract in subtle ways,but that if the number of host countries in which the inventorexploits his technology is large enough, the comparative staticresults in Section II.B remain qualitatively valid.
APPENDIX II: CHARACTERIZATION OF THE OPTIMAL CONTRACT
Let us start by writing the Lagrangian corresponding to pro-gram (P1). Letting λk denote the multiplier corresponding to con-straint k = 1, 2, 4, 5 (remember constraint (iii) cannot bind), wehave
L = φI pH R(x) + (W − F)β − C R(x) + λ1(E + F − x)
+ λ2(pHφER(x) − E) + λ4((pH − pL)(1 − φE − φI)
−(1 − γ )δ(C)) + λ5
(φI − C
(pH − pL)
).
The first-order conditions of this program (apart from the stan-dard complementarity slackness conditions) are
∂L∂F
= −β + λ1 = 0,
∂L∂φI
= pH R (x) − λ4 (pH − pL) + λ5 = 0,
∂L∂x
= φI pH R′ (x) − C R′ (x) − λ1 + λ2 pH φE R′ (x) = 0,(7)
∂L∂φE
= λ2 pH R (x) − λ4 (pH − pL) = 0,
∂L∂E
= λ1 − λ2 = 0,
∂L∂C
= −R (x) − λ4 (1 − γ ) δ′(C) − λ5
(pH − pL)= 0.(8)
Straightforward manipulation of these conditions delivers
λ1 = λ2 = β > 0,
λ4 = pH
pH − pLλ2 R (x) = pH
pH − pLβR (x) > 0,
λ5 = (β − 1) pH R (x) > 0,

MULTINATIONAL FIRMS AND IMPERFECT CAPITAL MARKETS 1213
from which we conclude that all constraints bind, as claimed inthe main text.
The fact that λ5 > 1 immediately implies that constraint (v)binds and we have φI = C/ (pH − pL), as indicated in equation (2).Next, plugging the values of the multipliers in (8) yields
−δ′(C) = βpH − pL
(1 − γ ) βpH,
as claimed in equation (3) in the main text. Next, plugging themultipliers and φI into (7) yields
R′ (x) = 1
pH
(
1 − (1 − γ ) δ(C)pH − pL
−(
βpH − pL
pH − pL
)C
βpH
) ,
which corresponds to equation (4) in the main text.Setting the constraints to equality, we can also compute the
total payoff obtained by the inventor:
(9) �I = Wβ + β
(R (x)R′ (x)
− x)
.
This expression can be used to analyze when it is optimal forthe inventor to implement good behavior. To do so, consider theoptimal contract that implements bad behavior. It is clear that inthis case the inventor has no incentive to exert monitoring effort.It is also immediate that even when the entrepreneur does notobtain any share of the cash flows, her participation constraintwill be satisfied, and thus we have that φL
I + φLE = 1. The program
defining the optimal contract can then be written as
(P1L)
maxF,φI ,x,E
�I = φI pLR(x) + (W − F) β
s.t. x ≤ E + F (i)pL (1 − φI) R(x) ≥ E (ii)φI ≥ 0. (iii)
Following the same steps as before, we find that all three con-straints will bind, and hence CL = φL
I = 0. Furthermore, the opti-mal level of investment is given by
pLR′(xL) = 1,

1214 QUARTERLY JOURNAL OF ECONOMICS
while the overall payoff obtained by the inventor equals
(10) �L = βW + β
(R(xL)R′(xL)
− xL)
.
Comparing equations (9) and (10) we see that �I > �L if andonly if
R (x)R′ (x)
− x >R(xL)R′(xL)
− xL.
However, because R(x)/R′(x) − x is strictly increasing in x when-ever R′′(x) < 0, we can conclude that good behavior will be imple-mented whenever
x > xL.
Note also that x is increasing in γ (this is formally proved inAppendix III), while xL is independent of γ . Furthermore, whenγ → 1, it is necessarily the case that x > xL. Hence, there exists athreshold γ over which it is optimal to implement good behavior.
APPENDIX III: PROOFS OF COMPARATIVE STATIC RESULTS
The comparative statics in Lemma 1 simply follow from thefact that the right-hand side of equation (3) is increasing in γ andβ, while the left-hand side is decreasing in C (given the convexityof δ (·)).
The statements of Proposition 1 directly follow from Lemma1 because φI is proportional to C.
Consider next the comparative statics in Proposition 2. Forthat purpose, let
F(γ, β, C(γ, β)) = (1 − γ ) δ(C)pH − pL
+(
βpH − pL
pH − pL
)C
βpH,
so that
pH R′(x)[1 − F(γ, β, C(γ, β))] = 1.
Using equation (3), we can establish that
dF (·)dγ
= − δ(C)pH − pL
+ (1 − γ ) δ′(C)pH − pL
dCdγ
+(
βpH − pL
pH − pL
)1
βpH
dCdγ
= − δ(C)pH − pL
< 0;

MULTINATIONAL FIRMS AND IMPERFECT CAPITAL MARKETS 1215
dF (·)dβ
= (1 − γ ) δ′(C)pH − pL
dCdβ
+(
βpH − pL
pH − pL
)1
βpH
dCdβ
+ pLC(pH − pL) β2 pH
= pLC(pH − pL) β2 pH
> 0.
From inspection of (4) and the concavity of R (·), it is then clearthat x is increasing in γ and decreasing in β.
Finally, the statements in Proposition 3 follow from the dis-cussion in the main text and the fact that R (x) /x is decreasing inx, and thus decreasing in γ and increasing in β.
APPENDIX IV: GENERALIZATIONS
In this Appendix, we provide more details on the generaliza-tions outlined in Section II.C.
Consider first the case in which the entrepreneur’s privatebenefit and the inventor’s private cost of monitoring are propor-tional to x rather than to R(x). Following the same steps as in theformulation in the main text, we find that the optimal C and x arenow given by
−δ′(C) = βpH − pL
βpH (1 − γ )
and
(11) pH R′ (x) = 1 + (βpH − pL) Cβ (pH − pL)
+ pH (1 − γ ) δ(C)pH − pL
.
Straightforward differentiation indicates that both C and x con-tinue to be decreasing in γ , as in our paper. Next note that we canuse equation (11) to write
φI = C(pH − pL)
xR (x)
= pHC(pH − pL)
xR′ (x)R (x)
CpH R′ (x)
= pH
(pH − pL)xR′ (x)R (x)
[1
C+ (βpH − pL)
β (pH − pL)+ pH (1 − γ ) δ(C)
(pH − pL) C
]−1
.
It is straightforward to see that the last term continues to bean increasing function of C and is thus decreasing in γ . This im-plies that the only way that φI could be increasing in γ would be ifthe elasticity of revenue to output—that is, α(x) ≡ xR′(x)/R(x)—was sufficiently increasing in x. For a constant-elasticity function,R(x) = Axα, we have α(x) = α for all x and thus φI continues to be

1216 QUARTERLY JOURNAL OF ECONOMICS
decreasing in γ for any level of concavity of the R(x) function.Remember that the revenue function will be isoelastic wheneverthe firm faces a demand with constant price elasticity. If the firmwere to face a linear demand function, then α(x) would be decreas-ing in x, hence reinforcing the result that φI is decreasing in γ .
We next consider the case in which (local) external investorscan also serve a monitoring role. In particular, if external investorsexert an unverifiable effort cost MR(x), the private benefit is now
B(C, M; γ ) = (1 − γ ) (δ (C) + μ (M)) ,
with μ(·) satisfying the same properties as δ(·) above, namely,μ′(M) < 0, μ′′(M) > 0, μ(0) = μ, limM→∞ μ(M) = 0, limM→0 μ′
(M) = −∞, and limM→∞ μ′(M) = 0. Because local monitoring isnot verifiable, the program that determines the optimal contractwill need to include a new incentive compatibility constraintfor external investors. In particular, an optimal contract thatinduces the entrepreneur to behave is now given by the tuple{F, φI, x, φE, E, C, M} that solves a program analogous to (P1) butwith constraints (ii) and (iv) now given by
pHφER(x) − MR(x) ≥ E (ii)
(pH − pL) (1 − φE − φI) ≥ (1 − γ ) (δ (C) + μ (M)) (iv)
and with the additional constraint
φE ≥ M/ (pH − pL) (vi).
Manipulating the first-order conditions of this new program,we obtain
λ5 = (β − 1) pH R′ (x) + λ6,
which immediately implies that constraint (v) continues to bindeven in the case with local monitoring. Consequently, inventor (orparent firm) equity shares continue to move proportionately withthe amount of monitoring undertaken by the inventor.
Furthermore, provided that the level of investor protectionis sufficiently high, the analysis in the main text goes throughessentially unaltered. The reason for this is that in such a case,constraint (vi) is not binding (λ6 = 0) and we obtain C and M beingdetermined by
(12) − δ′(C) = βpH − pL
(1 − γ ) βpH,

MULTINATIONAL FIRMS AND IMPERFECT CAPITAL MARKETS 1217
which is identical to (3), and
(13) − μ′(M) = (pH − pL)(1 − γ ) pH
.
From the convexity of the monitoring functions, we thus obtainthat both C and M are decreasing functions of γ . Furthermore,manipulating the first-order conditions we can also easily showthat (i) the investment levels (and thus) sales revenue continueto be increasing in γ , and (ii) the ratio F/x is still increasing inγ , provided that α (x) does not increase in x too quickly, just as inthe main text (details available upon request).
Note that equations (12) and (13) also imply that −δ′(C) >
−μ′(M), and if the functions δ (·) and μ (·) are sufficiently simi-lar we will have M > C. Intuitively, a disproportionate amount oflocal monitoring may be optimal because it is “cheaper,” as exter-nal investors have a lower shadow cost of getting remuneratedthrough equity shares. Still, as long as the equilibrium level ofM is sufficiently low (or γ is sufficiently high), the above analy-sis suggests that the inventor equity share comoves with investorprotections in the same manner as in our simpler model with onlyinventor monitoring.
For low enough values of γ , however, the above optimal con-tract leads to M > (pH − pL) φE, which violates constraint (vi). Insuch a case, we have λ6 > 0. Manipulating the first-order condi-tions, one can show that C and M are implicitly defined by thesystem
1 + (1 − γ ) μ′(M)
1 + (1 − γ ) δ′(C)= β,
pH − pL − C − M = (1 − γ )(δ(C) + μ(M)).
Unfortunately, without imposing particular functional forms forthe functions δ (·) and μ (·), it becomes impossible to characterizehow C (and thus φI) varies with γ .
HARVARD UNIVERSITY AND NBERHARVARD BUSINESS SCHOOL AND NBERHARVARD BUSINESS SCHOOL AND NBER

1218 QUARTERLY JOURNAL OF ECONOMICS
REFERENCES
Acemoglu, Daron, Simon Johnson, and Todd Mitton, “Determinants of VerticalIntegration: Finance Contracts and Regulation,” NBER Working Paper No.11424, 2005.
Aguiar, Mark, and Gita Gopinath, “Fire-Sale FDI and Liquidity Crises,” Review ofEconomics and Statistics, 87 (2005), 439–452.
Albuquerque, Rui, “The Composition of International Capital Flows: Risk Sharingthrough Foreign Direct Investment,” Journal of International Economics, 61(2003), 353–383.
Antras, Pol, “Firms, Contracts, and Trade Structure,” Quarterly Journal of Eco-nomics, 118 (2003), 1375–1418.
——, “Incomplete Contracts and the Product Cycle,” American Economic Review,95 (2005), 1054–1073.
Antras, Pol, and Elhanan Helpman, “Global Sourcing,” Journal of Political Econ-omy, 112 (2004), 552–580.
Antras, Pol, Mihir A. Desai, and C. Fritz Foley, “Multinational Firms, FDI Flowsand Imperfect Capital Markets,” NBER Working Paper No. 12855, 2007.
Baker, Malcolm, C. Fritz Foley, and Jeffrey Wurgler, “Multinationals as Arbi-trageurs? The Effects of Stock Market Valuations on Foreign Direct Invest-ment,” Review of Financial Studies, 22 (2009), 337–369.
Barro, Robert J., and Jong-Wha Lee, “International Data on Educational Attain-ment: Updates and Implications,” CID Working Paper No. 42, 2000.
Beck, Thorsten, Asli Demirguc-Kunt, and Ross Levine, “A New Database on Fi-nancial Development and Structure,” World Bank, Policy Research WorkingPaper No. 2146, 1999.
Bertaut, Carol, William L. Griever, and Ralph W. Tryon, “Understanding U.S.Cross-Border Securities Data,” Federal Reserve Bulletin, 92 (2006), A59–A75.
Blonigen, Bruce A., “Firm-Specific Assets and the Link Between Exchange Ratesand Foreign Direct Investment,” American Economic Review, 87 (1997), 447–465.
Boyd, John H., and Bruce D. Smith, “Capital Market Imperfections, InternationalCredit Markets and Nonconvergence,” Journal of Economic Theory, 73 (1997),335–364.
Brainard, S. Lael, “An Empirical Assessment of the Proximity-ConcentrationTrade-off between Multinational Sales and Trade,” American Economic Re-view, 87 (1997), 520–544.
Caves, Richard E., Multinational Enterprise and Economic Analysis, 2nd ed.(Cambridge, UK: Cambridge University Press, 1996).
Desai, Mihir A., C. Fritz Foley, and Kristin J. Forbes, “Financial Constraints andGrowth: Multinational and Local Firm Responses to Currency Depreciations,”Review of Financial Studies, 21 (2008), 2857–2888.
Desai, Mihir A., C. Fritz Foley, and James R. Hines, Jr., “Dividend Policy Insidethe Firm,” NBER Working Paper No. 8698, 2002.
——, “The Costs of Shared Ownership: Evidence from International Joint Ven-tures,” Journal of Financial Economics, 73 (2004a), 323–374.
——, “A Multinational Perspective on Capital Structure Choice and Internal Cap-ital Markets,” Journal of Finance, 59 (2004b), 2451–2488.
Djankov, Simeon, Caralee McLiesh, and Andrei Shleifer, “Private Credit in 129Countries,” Journal of Financial Economics, 84 (2007), 299–329.
Ethier, Wilfred J., and James R. Markusen, “Multinational Firms, TechnologyDiffusion and Trade,” Journal of International Economics, 41 (1996), 1–28.
Feenstra, Robert, and Gordon Hanson, “Ownership and Control in Outsourcing toChina: Estimating the Property-Rights Theory of the Firm,” Quarterly Journalof Economics, 120 (2005), 729–761.
Froot, Kenneth A., and Jeremy C. Stein, “Exchange Rates and Foreign DirectInvestment: An Imperfect Capital Markets Approach,” Quarterly Journal ofEconomics, 106 (1991), 1191–1217.
Gertler, Mark, and Kenneth S. Rogoff, “North-South Lending and EndogenousDomestic Capital Market Inefficiencies,” Journal of Monetary Economics, 26(1990), 245–266.
Ginarte, Juan Carlos, and Walter Park, “Determinants of Patent Rights: A Cross-National Study,” Research Policy, 26 (1997), 283–301.
MULTINATIONAL FIRMS AND IMPERFECT CAPITAL MARKETS 1219
Grossman, Gene M., and Elhanan Helpman, “Managerial Incentives and the In-ternational Organization of Production,” Journal of International Economics,63 (2004), 237–262.
Harris, Milton, and Arthur Raviv, “The Theory of Capital Structure,” Journal ofFinance, 46 (1991), 297–355.
Helpman, Elhanan, “A Simple Theory of International Trade with MultinationalCorporations,” Journal of Political Economy, 92 (1984), 451–471.
Helpman, Elhanan, Marc J. Melitz, and Stephen R. Yeaple, “Exports versus FDIwith Heterogeneous Firms,” American Economic Review, 94 (2004), 300–316.
Holmstrom, Bengt, and Jean Tirole, “Financial Intermediation, Loanable Funds,and the Real Sector,” Quarterly Journal of Economics, 112 (1997), 663–691.
King, Robert G., and Ross Levine, “Finance and Growth: Schumpeter Might BeRight,” Quarterly Journal of Economics, 108 (1993), 717–738.
Klein, Michael W., Joe Peek, and Eric Rosengren, “Troubled Banks, ImpairedForeign Direct Investment: The Role of Relative Access to Credit,” AmericanEconomic Review, 92 (2002), 664–682.
Klein, Michael W., and Eric Rosengren, “The Real Exchange Rate and ForeignDirect Investment in the United States,” Journal of International Economics,36 (1994), 373–389.
Kraay, Aart, Norman Loayza, Luis Serven, and Jaume Ventura, “Country Portfo-lios,” Journal of the European Economic Association, 3 (2005), 914–945.
La Porta, Rafael, Florencio Lopez-de-Silanes, Andrei Shleifer, and Robert W.Vishny, “Legal Determinants of External Finance,” Journal of Finance, 52(1997), 1131–1150.
——, “Law and Finance,” Journal of Political Economy, 106 (1998), 1113–1155.Levine, Ross, and Sara Zervos, “Stock Markets, Banks, and Economic Growth,”
American Economic Review, 88 (1998), 537–558.Lucas, Robert, “Why Doesn’t Capital Flow from Rich to Poor Countries?” American
Economic Review, 80 (1990), 92–96.Marin, Dalia, and Monika Schnitzer, “Global versus Local: The Financing of For-
eign Direct Investment,” University of Munich, Working Paper, 2004.Markusen, James R., “Multinationals, Multi-Plant Economies, and the Gains from
Trade,” Journal of International Economics, 16 (1984), 205–226.——, Multinational Firms and the Theory of International Trade (Cambridge, MA:
MIT Press, 2002).Markusen, James R., and Anthony J. Venables, “The Theory of Endowment, Intra-
industry and Multi-national Trade,” Journal of International Economics, 52(2000), 209–234.
Misawa, Mitsuru, “Tokyo Disneyland: Licensing vs. Joint Venture,” Asia CaseResearch Centre, University of Hong Kong, Case HKU420, 2005.
Rajan, Raghuram G., and Luigi Zingales, “What Do We Know about Capital Struc-ture? Some Evidence from International Data,” Journal of Finance, 50 (1995),1421–1460.
——, “Financial Dependence and Growth,” American Economic Review, 88 (1998),559–586.
Reinhart, Carmen M., and Kenneth S. Rogoff, “Serial Default and the ‘Paradox’ ofRich to Poor Capital Flows,” American Economic Review, 94 (2004), 52–58.
Shatz, Howard J., “The Location of U.S. Multinational Affiliates,” Ph.D. Disserta-tion, Harvard University, 2000.
Shleifer, Andrei, and Daniel Wolfenzon, “Investor Protection and Equity Markets,”Journal of Financial Economics, 66 (2002), 3–27.
Tirole, Jean, The Theory of Corporate Finance (Princeton, NJ: Princeton UniversityPress, 2005).
Wurgler, Jeffrey, “Financial Markets and the Allocation of Capital,” Journal ofFinancial Economics, 58 (2000), 187–214.
Yeaple, Stephen, “The Role of Skill Endowments in the Structure of U.S. OutwardFDI,” Review of Economics and Statistics, 85 (2003), 726–734.