Embed Size (px)
Citation preview

8/14/2019 Annexes Mihir Baxi
http://slidepdf.com/reader/full/annexes-mihir-baxi 1/45
DEVELOPING A MODEL TO ANALYZE THE
IMPACTS OF SELF-SERVICE AND WEB
CHECK-IN AT AIRPORTS
ANNEXURE A
Results of Statistical Analysis for Processing Time

8/14/2019 Annexes Mihir Baxi
http://slidepdf.com/reader/full/annexes-mihir-baxi 2/45
Developing a Model to analyze the impacts of Self- ervice and Web Check-in at airports
Annexure A- Results of Statistical Analysis for Processing Time
A-1
ANOVA TES T
The processing times where observed at three airports and it was felt necessary to
analyze if the data at all three airports has significant variations in the data due to the
change in the group size or number of bags per passenger.
Thus, statistical analysis was carried out to confirm the same. The single factor Analysis
of Variance was performed for all the check-in modes. The results of the test are
shown in Table 1, Table 2 and Table 3. It was concluded that there is no significant
variations in the data collected at three airports and all the samples can be pooled
together.
SUMMARY F TEST FOR CHECK IN COUNTERS
roups Count um Average Variance
LCY 78 1:43:18 01:19 00:00
MAN 149 3:40:30 01:29 00:00
ANOVA
ource of Variation S Df MS P-value F crit
Between Groups 00:00 1 00:00 07:03 0.186607 11:42
Within Groups 00:07 225 00:00
8/14/2019 Annexes Mihir Baxi
http://slidepdf.com/reader/full/annexes-mihir-baxi 3/45
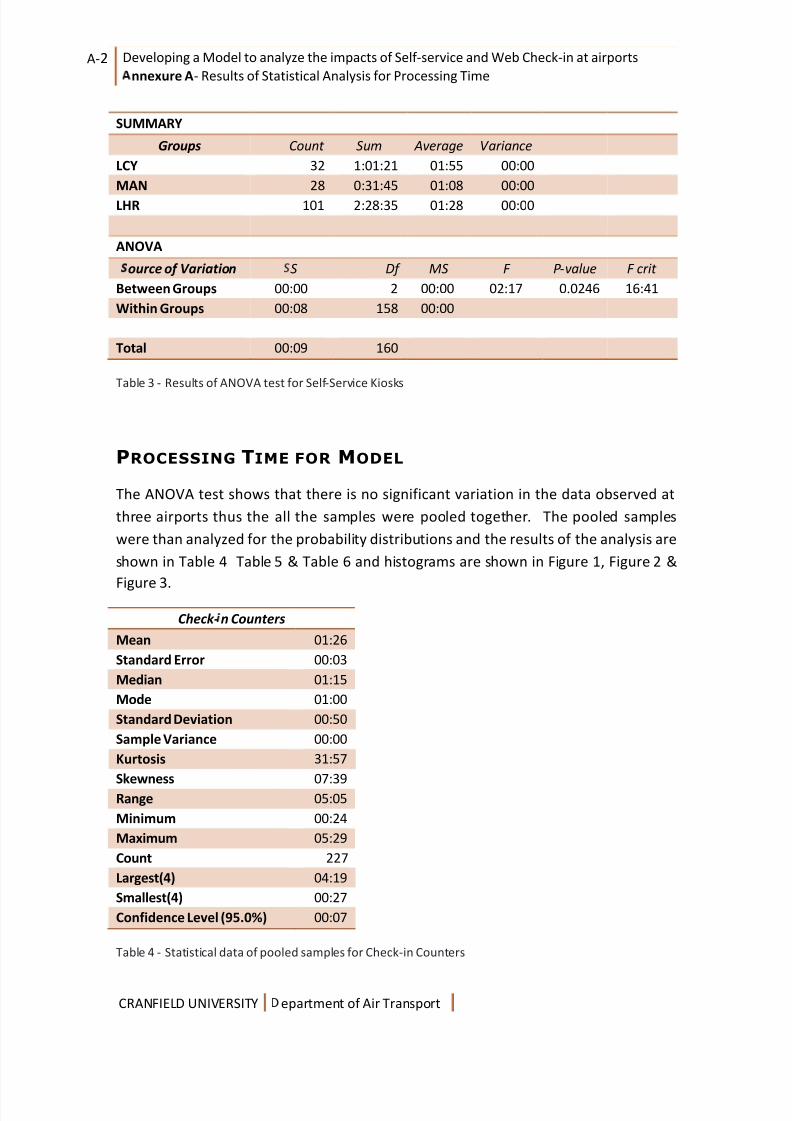
A-2 Developing a Model to analyze the impacts of Self-service and Web Check-in at airports
nnexure A- Results of Statistical Analysis for Processing Time
SUMMARY
Groups Count Sum Average Variance
LCY 32 1:01:21 01:55 00:00
MAN 28 0:31:45 01:08 00:00
LHR 101 2:28:35 01:28 00:00
ANOVA
ource of Variation S Df MS F P-value F crit
Between Groups 00:00 2 00:00 02:17 0.0246 16:41
Within Groups 00:08 158 00:00
Total 00:09 160
Table 3 - Results of ANOVA test for Self-Service Kiosks
PROCESSING TIME FOR MODEL
The ANOVA test shows that there is no significant variation in the data observed at
three airports thus the all the samples were pooled together. The pooled samples
were than analyzed for the probability distributions and the results of the analysis are
8/14/2019 Annexes Mihir Baxi
http://slidepdf.com/reader/full/annexes-mihir-baxi 4/45
Developing a Model to analyze the impacts of Self- ervice and Web Check-in at airports
Annexure A- Results of Statistical Analysis for Processing Time
A-3
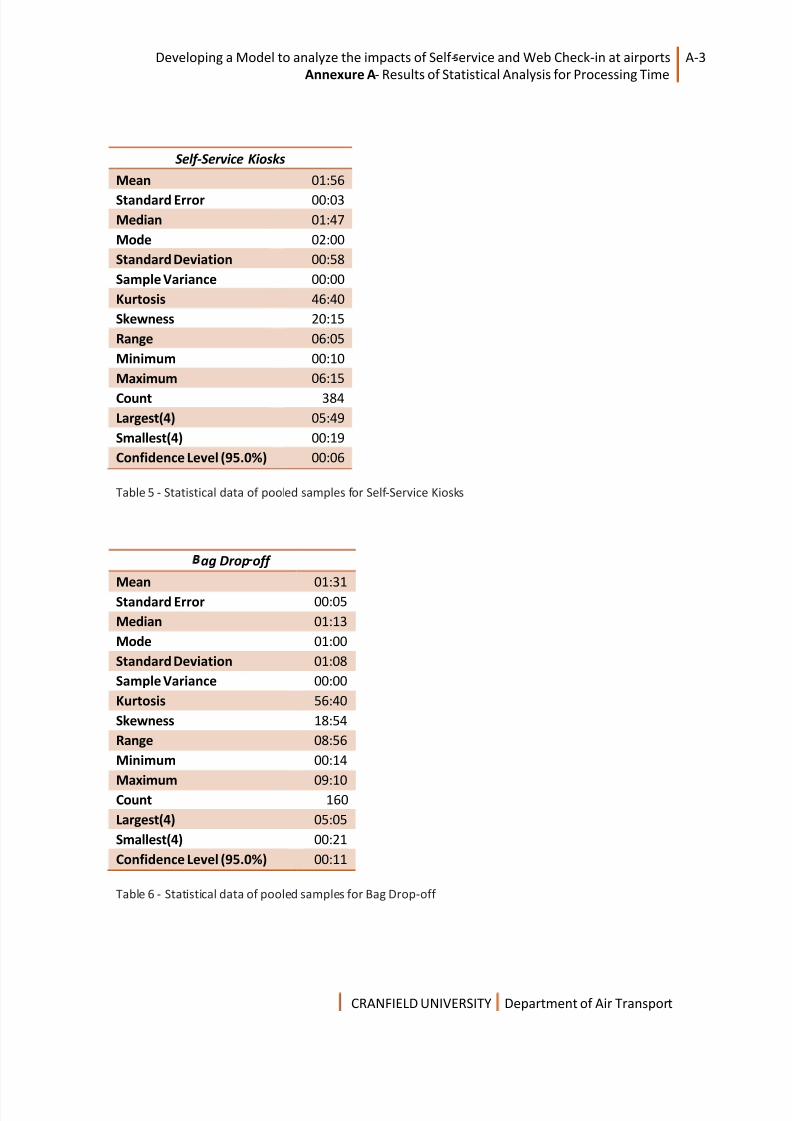
Self-Service Kiosks
Mean 01:56
Standard Error 00:03
Median 01:47
Mode 02:00
Standard Deviation 00:58
Sample Variance 00:00
Kurtosis 46:40
Skewness 20:15
Range 06:05
Minimum 00:10
Maximum 06:15
Count 384
Largest(4) 05:49
Smallest(4) 00:19
Confidence Level (95.0%) 00:06
Table 5 - Statistical data of pooled samples for Self-Service Kiosks
ff
8/14/2019 Annexes Mihir Baxi
http://slidepdf.com/reader/full/annexes-mihir-baxi 5/45
A-4 Developing a Model to analyze the impacts of Self-service and Web Check-in at airports
nnexure A- Results of Statistical Analysis for Processing Time
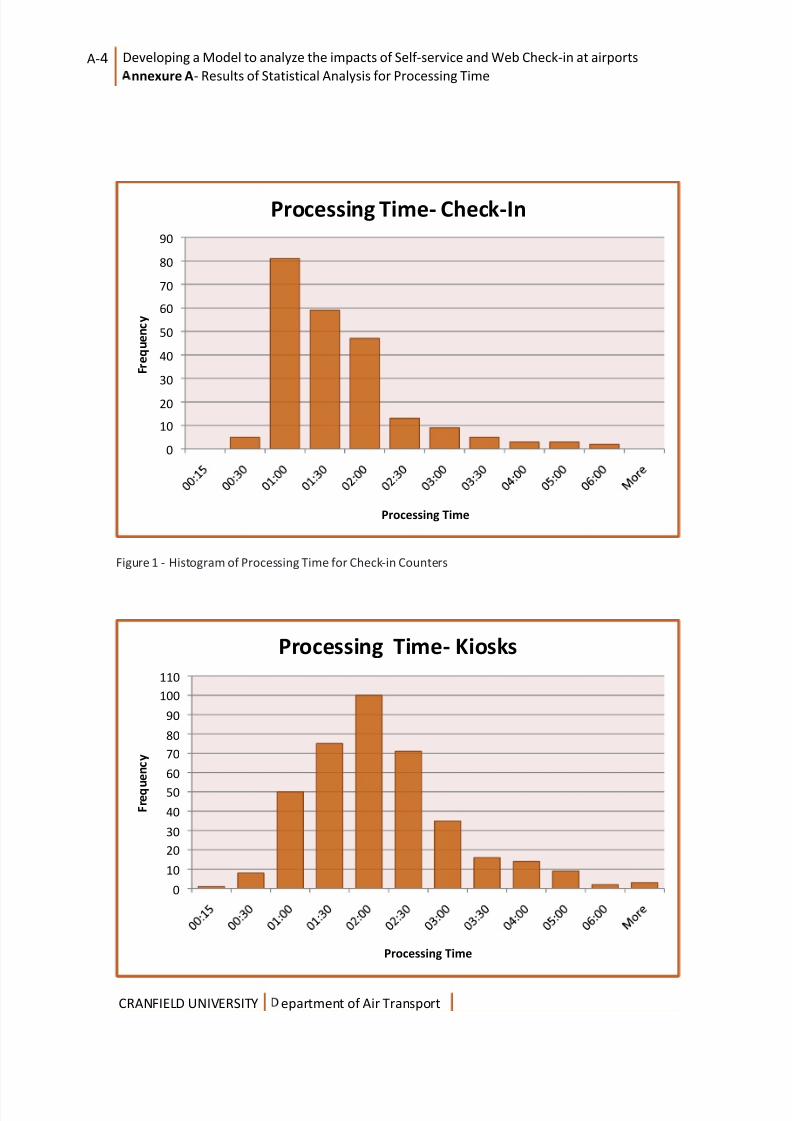
0
10
20
30
40
50
60
70
80
90
F r e q u e n c y
Processing Time
Processing Time- Check-In
8/14/2019 Annexes Mihir Baxi
http://slidepdf.com/reader/full/annexes-mihir-baxi 6/45
Developing a Model to analyze the impacts of Self- ervice and Web Check-in at airports
Annexure A- Results of Statistical Analysis for Processing Time
A-5
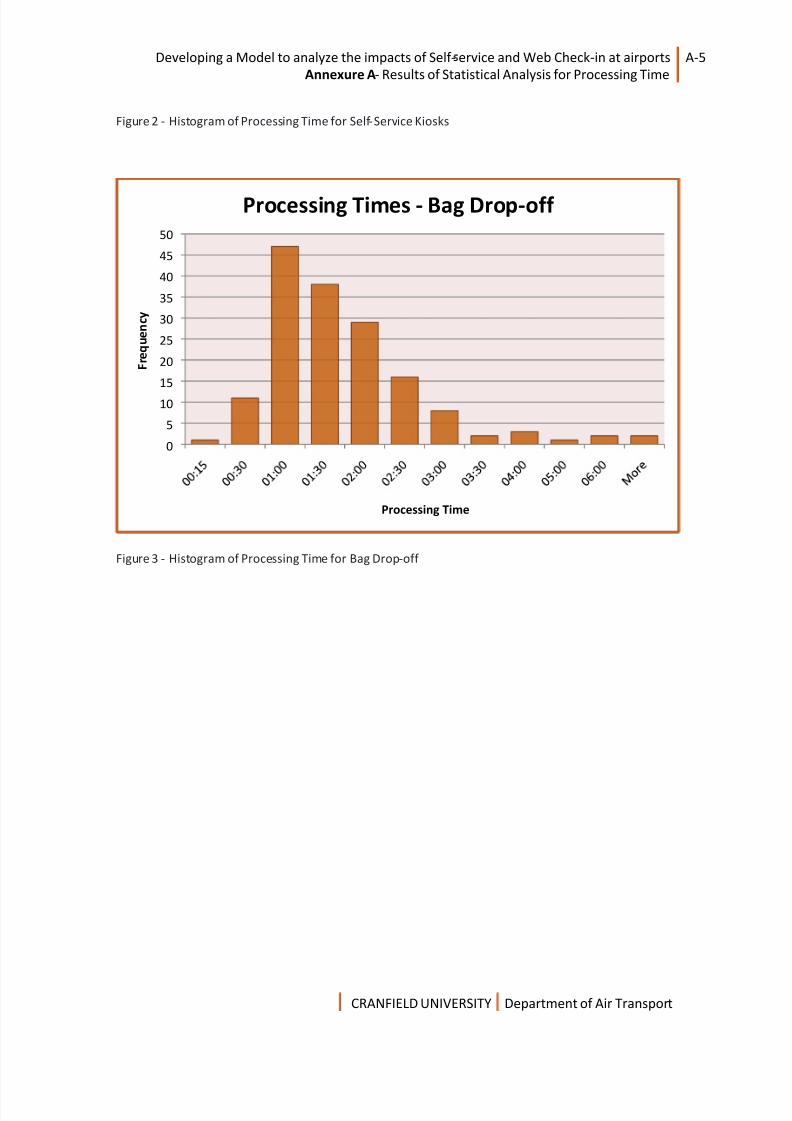
Figure 2 - Histogram of Processing Time for Self-Service Kiosks
Fi 3 Hi t f P i Ti f B D ff
0
5
10
15
20
25
30
35
40
45
50
F r e q u e n c y
Processing Time
Processing Times - Bag Drop-off
8/14/2019 Annexes Mihir Baxi
http://slidepdf.com/reader/full/annexes-mihir-baxi 7/45
DEVELOPING A MODEL TO ANALYZE THE
IMPACTS OF SELF-SERVICE AND WEB
CHECK-IN AT AIRPORTS
ANNEXURE B
Simulation Model: Description and Users Guide
8/14/2019 Annexes Mihir Baxi
http://slidepdf.com/reader/full/annexes-mihir-baxi 8/45
Developing a Model to analyze the impacts of Self-service and Web Check-in at airports
Annexure B - Simulation Model: Description and Users Guide
B-1
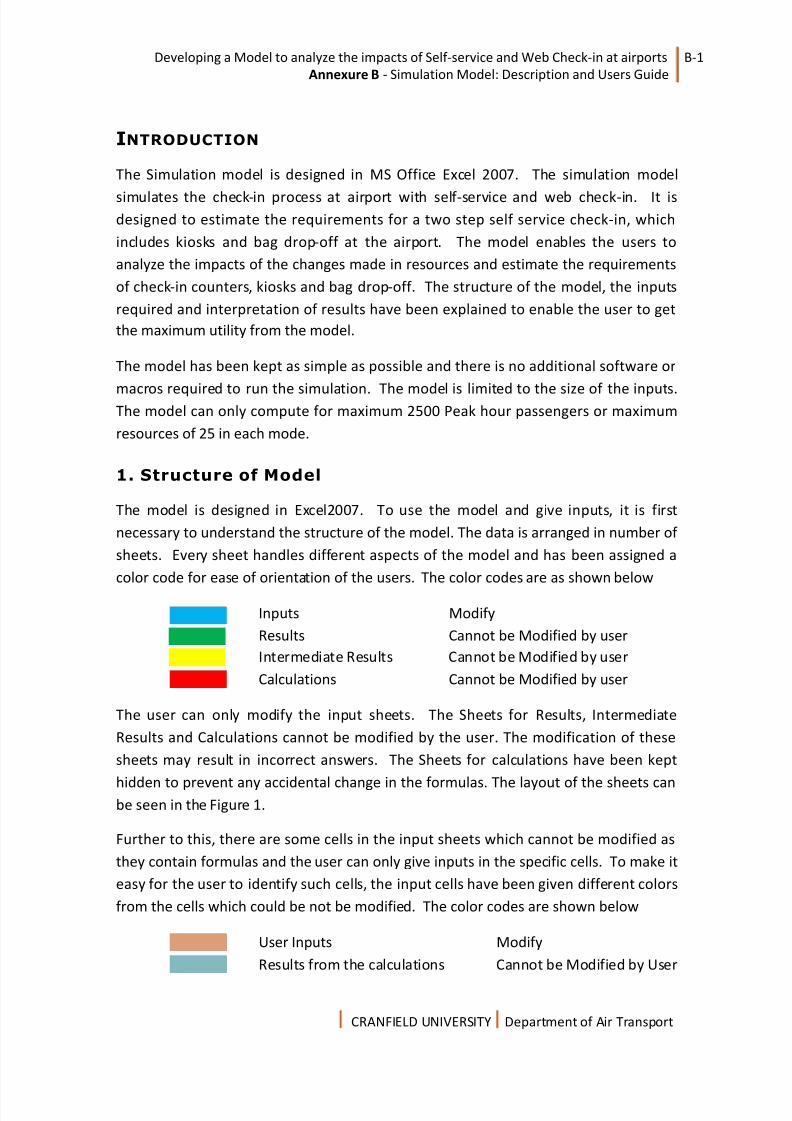
INTRODUCTION
The Simulation model is designed in MS Office Excel 2007. The simulation model
simulates the check-in process at airport with self-service and web check-in. It is
designed to estimate the requirements for a two step self service check-in, which
includes kiosks and bag drop-off at the airport. The model enables the users to
analyze the impacts of the changes made in resources and estimate the requirements
of check-in counters, kiosks and bag drop-off. The structure of the model, the inputs
required and interpretation of results have been explained to enable the user to get
the maximum utility from the model.
The model has been kept as simple as possible and there is no additional software or
macros required to run the simulation. The model is limited to the size of the inputs.
The model can only compute for maximum 2500 Peak hour passengers or maximumresources of 25 in each mode.
1. Structure of Model
The model is designed in Excel2007. To use the model and give inputs, it is first
necessary to understand the structure of the model. The data is arranged in number of
h t E h t h dl diff t t f th d l d h b i d

8/14/2019 Annexes Mihir Baxi
http://slidepdf.com/reader/full/annexes-mihir-baxi 9/45
B-2 Developing of Model to analyze the impacts of Self-service and Web Check-in at airports
nnexure B – Simulation Model: Description and Users Guide
Figure 1 - Layout of the Excel Worksheet
The sheets are arranged in order of the importance to user. The first two sheets
“Inputs” and “Arrival profiles” are the input sheets where the user has to input the key
l d ti f th d l Th t f h t “Q i Ti ” “S
8/14/2019 Annexes Mihir Baxi
http://slidepdf.com/reader/full/annexes-mihir-baxi 10/45
Developing a Model to analyze the impacts of Self-service and Web Check-in at airports
Annexure B - Simulation Model: Description and Users Guide
B-3
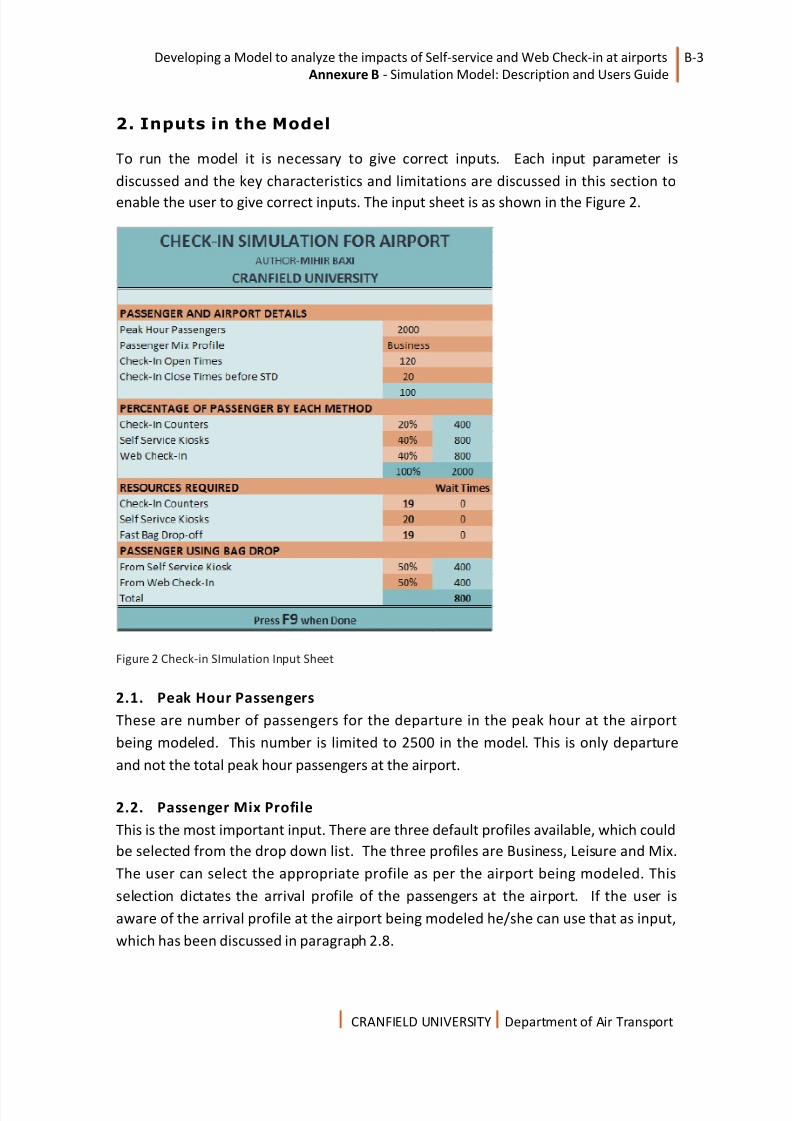
2. Inputs in the Model
To run the model it is necessary to give correct inputs. Each input parameter is
discussed and the key characteristics and limitations are discussed in this section to
enable the user to give correct inputs. The input sheet is as shown in the Figure 2.
8/14/2019 Annexes Mihir Baxi
http://slidepdf.com/reader/full/annexes-mihir-baxi 11/45
B-4 Developing of Model to analyze the impacts of Self-service and Web Check-in at airports
nnexure B – Simulation Model: Description and Users Guide
2.3. Check-in Open Times
This is the opening time for the all the counters, kiosks and bag drop-off. The time has
to be given in minutes. It is necessary to decide the check-in open times as that will
govern the number of passengers arriving at the airport. This input cannot be Zero.
2.4. Check-in Close Times before STD
It is time in minutes for closing of check-in counters before departure time of the
flight. If assumed zero, the model considers the full duration between check-in opentimes and departure.
2.5. Passengers by each Check-in Mode
This is expected breakup of the passengers using each mode to check-in in
percentages. The user needs to provide the information such that the expected break
up totals 100%. The numbers for each mode is calculated by the model and shown in
the next cell to it, which cannot be modified by the user. If any of the modes are not
available at the airport the user can input zero for the mode, but the total of all three
cells should be 100. The user can modify these proportions to analyze the impacts on
the available resources.
2.6. Resources Required
Th ll h i d f i h Th ll
8/14/2019 Annexes Mihir Baxi
http://slidepdf.com/reader/full/annexes-mihir-baxi 12/45
Developing a Model to analyze the impacts of Self-service and Web Check-in at airports
Annexure B - Simulation Model: Description and Users Guide
B-5
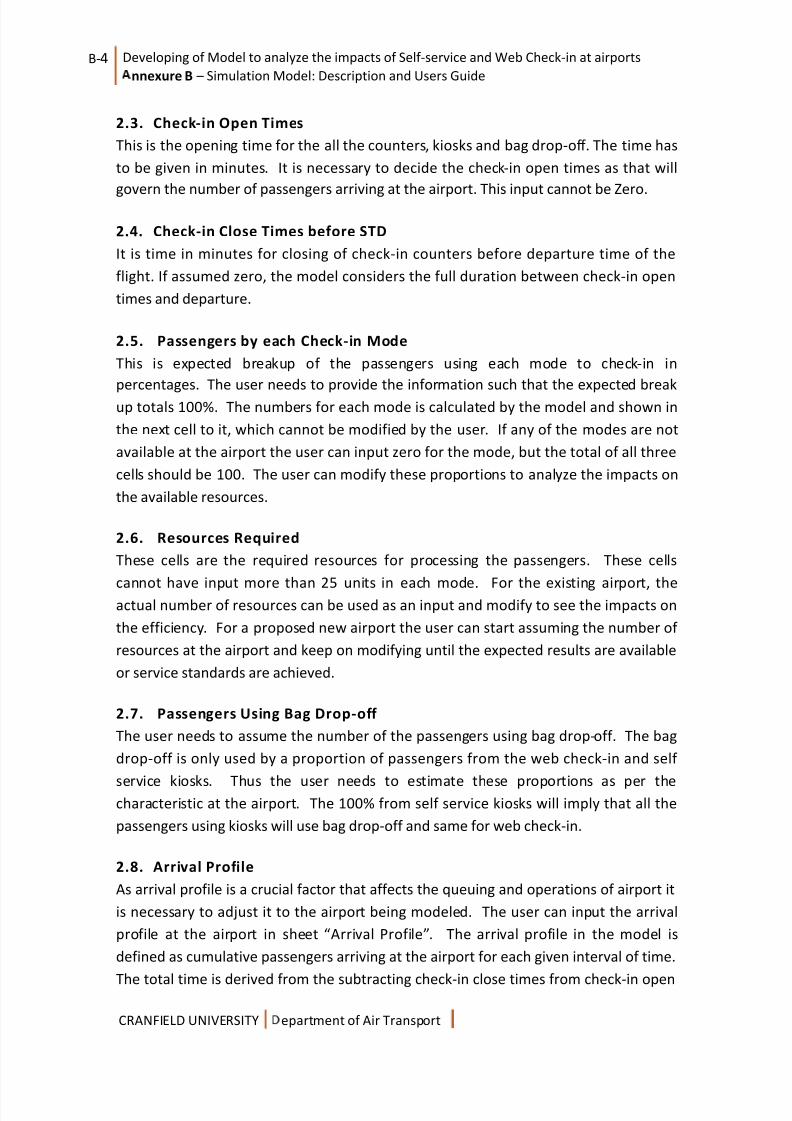
times and is to be given by user and thus has been converted to percentages. So the
user has to first convert the total time in percentage and passengers arriving at each
10% time interval should be calculated and used as input in one of the three columns
B, C & D as see in the Figure 3.
Figure 3 - Input for Arrival Profile
Th h ld h h h di f h fil d ill b bl i l
8/14/2019 Annexes Mihir Baxi
http://slidepdf.com/reader/full/annexes-mihir-baxi 13/45
B-6 Developing of Model to analyze the impacts of Self-service and Web Check-in at airports
nnexure B – Simulation Model: Description and Users Guide
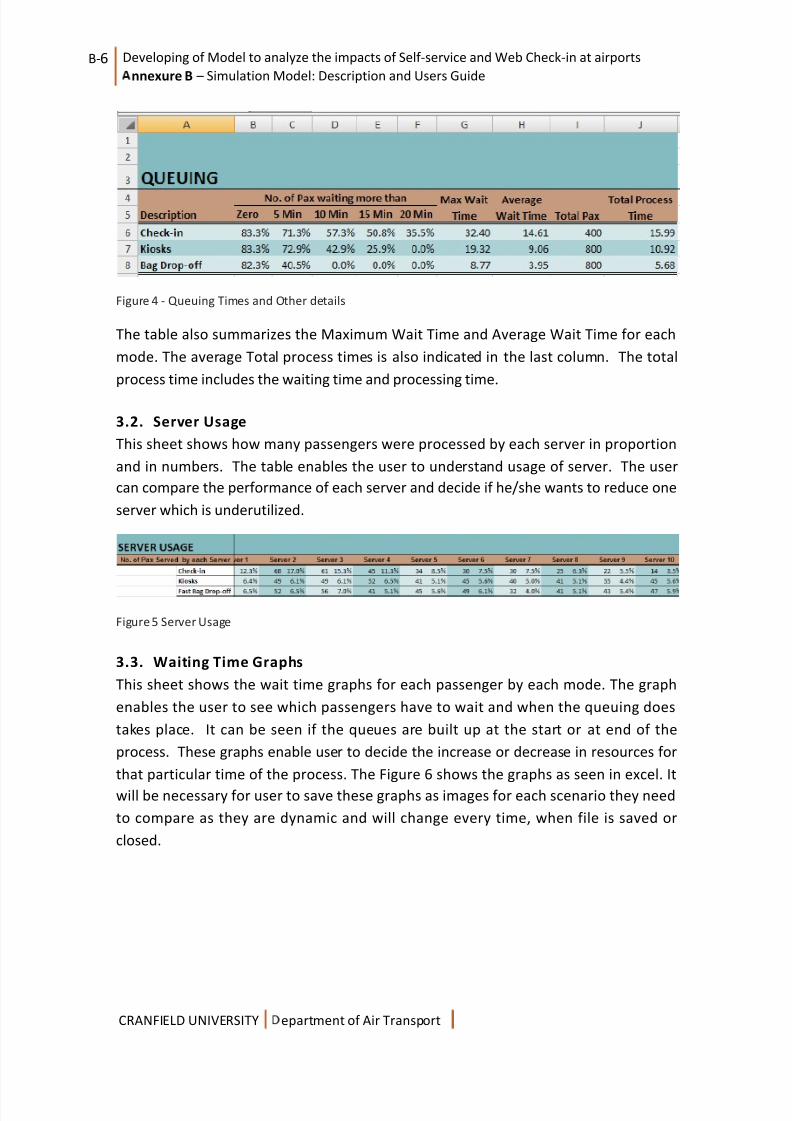
Figure 4 - Queuing Times and Other details
The table also summarizes the Maximum Wait Time and Average Wait Time for each
mode. The average Total process times is also indicated in the last column. The total
process time includes the waiting time and processing time.
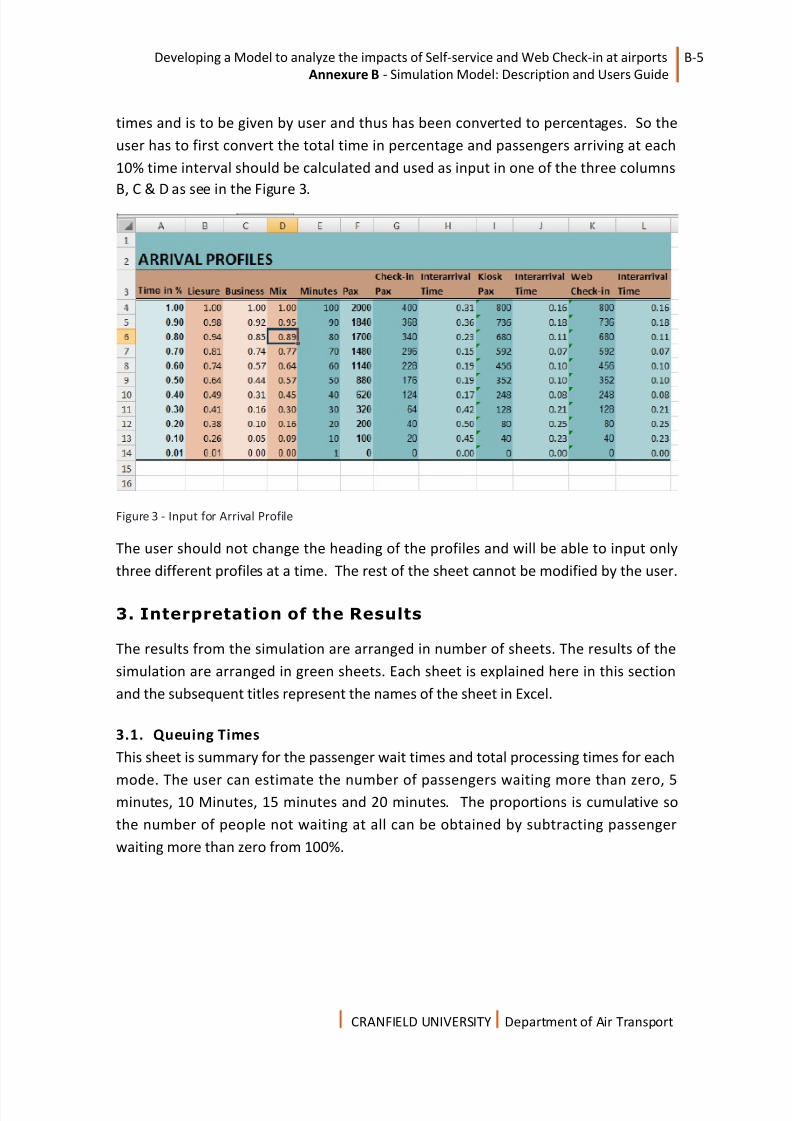
3.2. Server Usage
This sheet shows how many passengers were processed by each server in proportion
and in numbers. The table enables the user to understand usage of server. The user
can compare the performance of each server and decide if he/she wants to reduce one
server which is underutilized.
8/14/2019 Annexes Mihir Baxi
http://slidepdf.com/reader/full/annexes-mihir-baxi 14/45
Developing a Model to analyze the impacts of Self-service and Web Check-in at airports
Annexure B - Simulation Model: Description and Users Guide
B-7
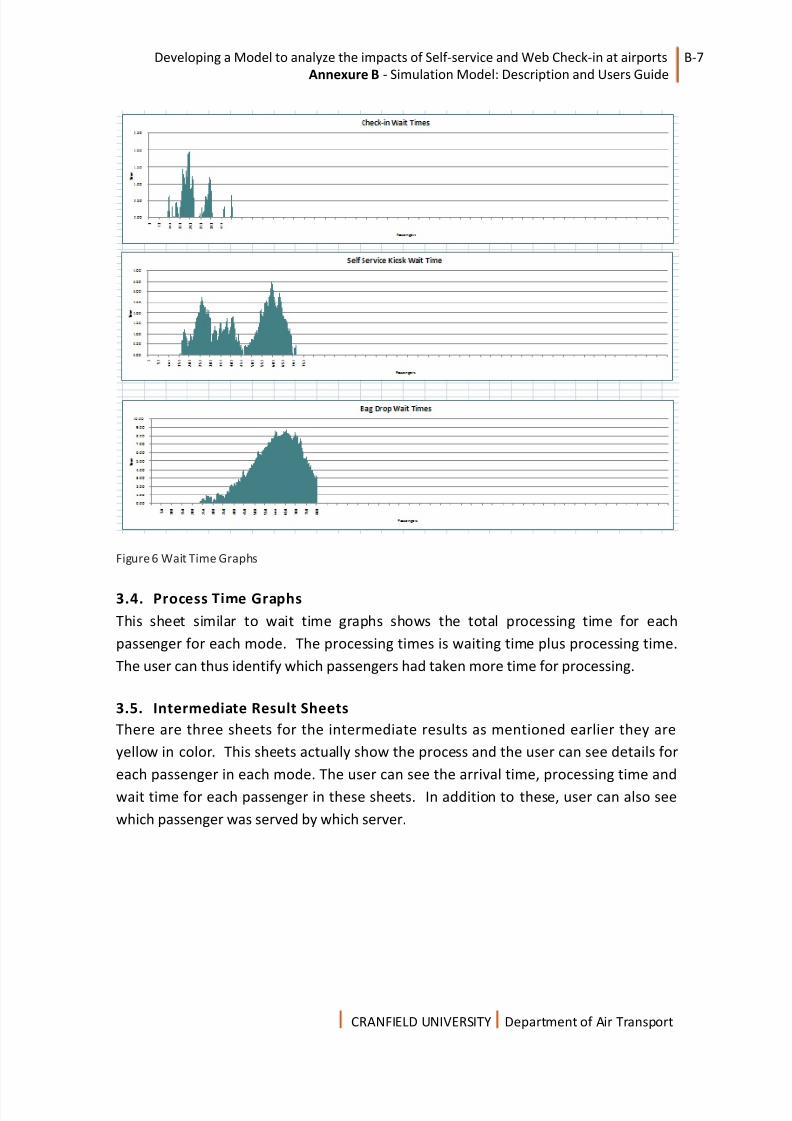
Fi 6 W it Ti G h
8/14/2019 Annexes Mihir Baxi
http://slidepdf.com/reader/full/annexes-mihir-baxi 15/45
B-8 Developing of Model to analyze the impacts of Self-service and Web Check-in at airports
nnexure B – Simulation Model: Description and Users Guide
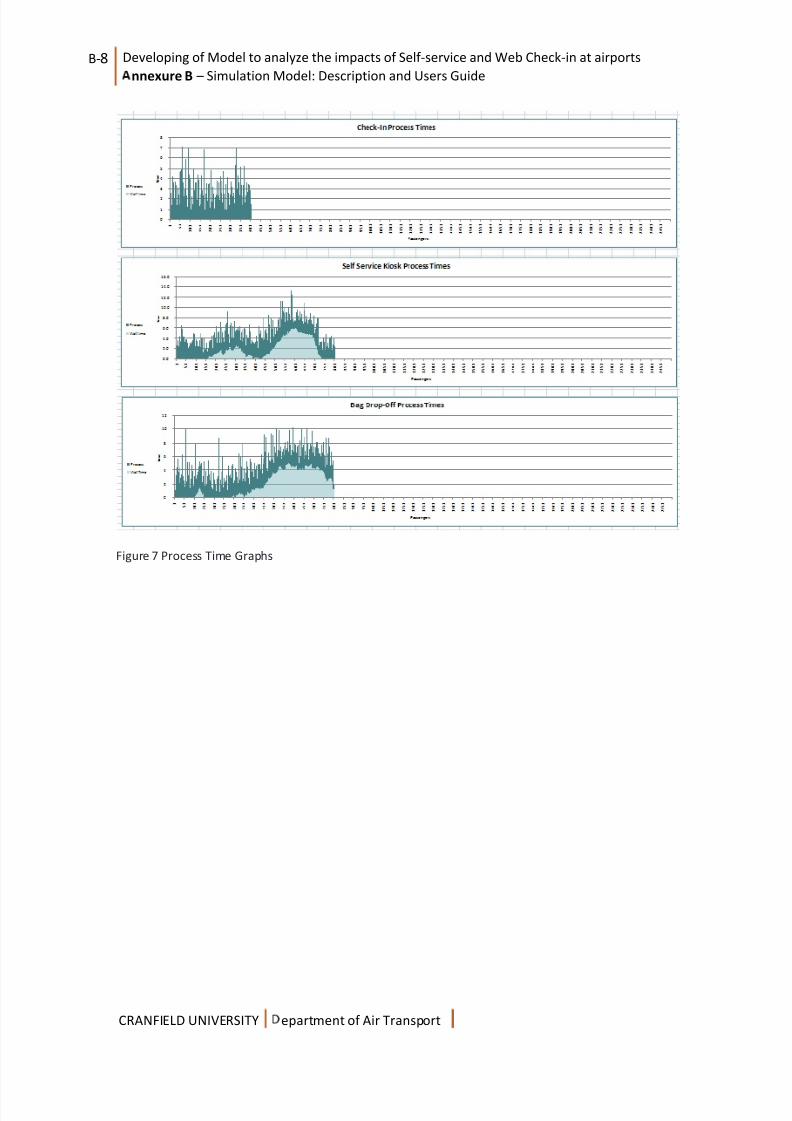
Fi 7 P Ti G h
8/14/2019 Annexes Mihir Baxi
http://slidepdf.com/reader/full/annexes-mihir-baxi 16/45
D EV ELO PI NG A MO DE L T O A NA LYZE
IMPACTS OF SELF-SERVICE AND WEB
CHECK-IN AT AIRPORTS
ANNEXURE C
Results from Simulation Model:
Scenario 1-Scenario 5
8/14/2019 Annexes Mihir Baxi
http://slidepdf.com/reader/full/annexes-mihir-baxi 17/45
Cranfield University | Department of Air Transport C-1 Developing a Model to Analyze the impacts of Self-service and Web Check-in at Airports
Annexure C- Results from Simulation Model
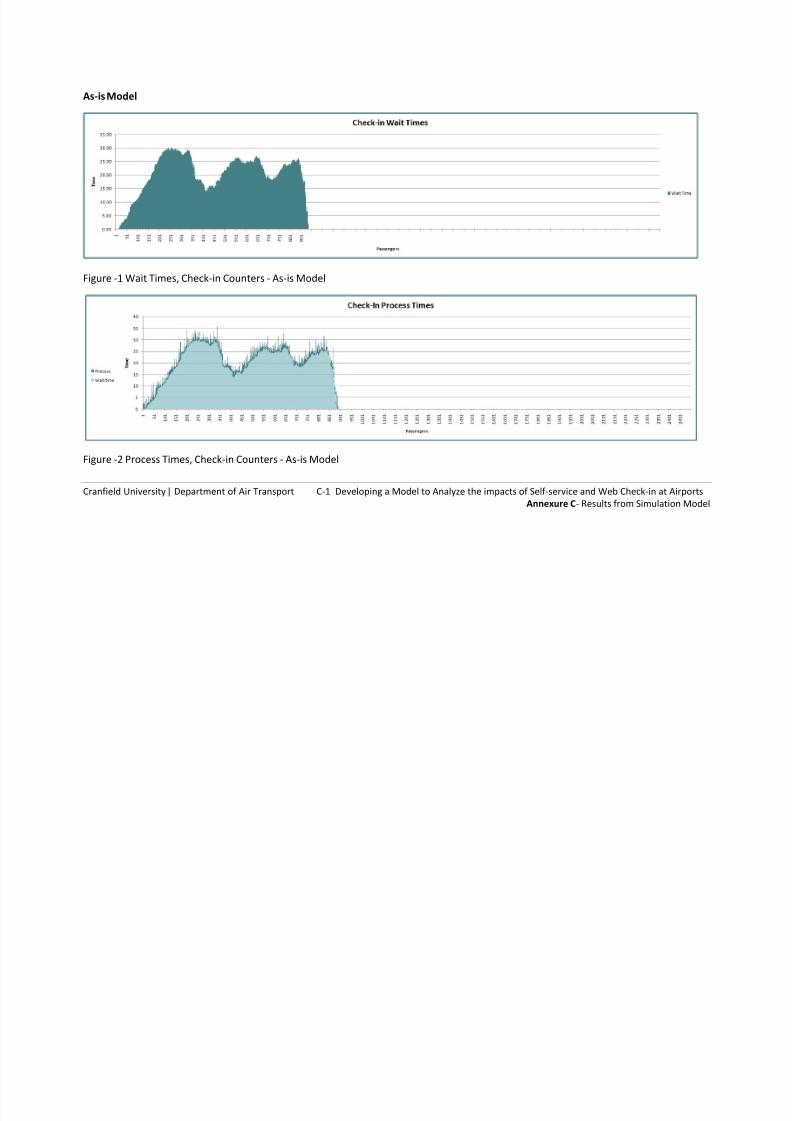
As-is Model
Figure -1 Wait Times, Check-in Counters - As-is Model
Figure -2 Process Times, Check-in Counters - As-is Model
8/14/2019 Annexes Mihir Baxi
http://slidepdf.com/reader/full/annexes-mihir-baxi 18/45
Cranfield University | Department of Air Transport C-2 Developing a Model to Analyze the impacts of Self-service and Web Check-in at Airports
Annexure C- Results from Simulation Model
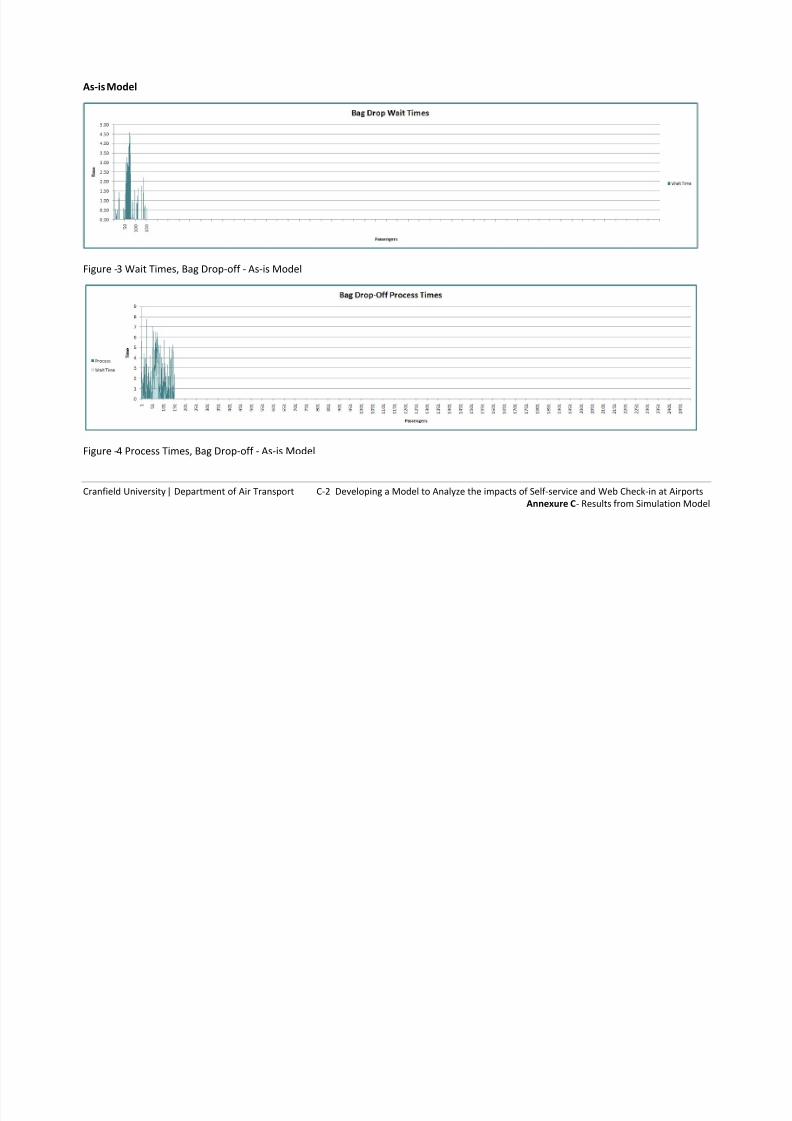
As-is Model
Figure -3 Wait Times, Bag Drop-off - As-is Model
Figure -4 Process Times, Bag Drop-off - As-is Model
8/14/2019 Annexes Mihir Baxi
http://slidepdf.com/reader/full/annexes-mihir-baxi 19/45
Cranfield University | Department of Air Transport C-3 Developing a Model to Analyze the impacts of Self-service and Web Check-in at Airports
Annexure C- Results from Simulation Model
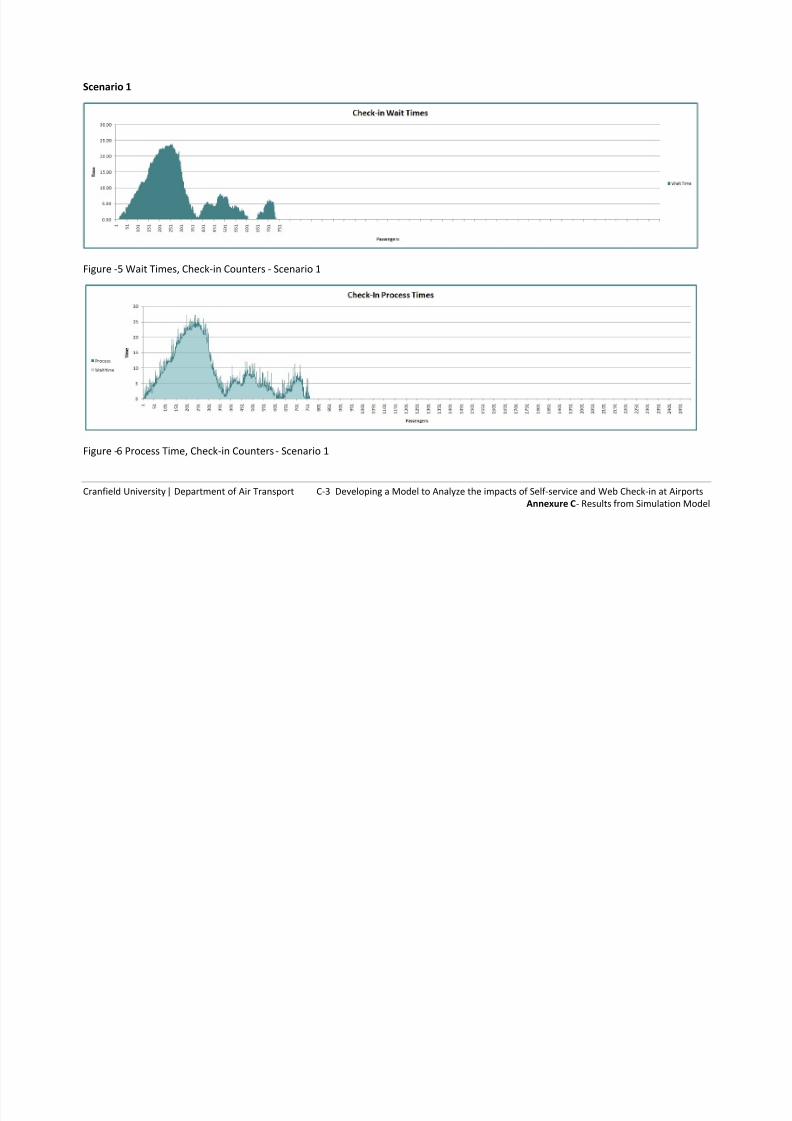
Scenario 1
Figure -5 Wait Times, Check-in Counters - Scenario 1
Figure -6 Process Time, Check-in Counters - Scenario 1
8/14/2019 Annexes Mihir Baxi
http://slidepdf.com/reader/full/annexes-mihir-baxi 20/45
Cranfield University | Department of Air Transport C-4 Developing a Model to Analyze the impacts of Self-service and Web Check-in at Airports
Annexure C- Results from Simulation Model
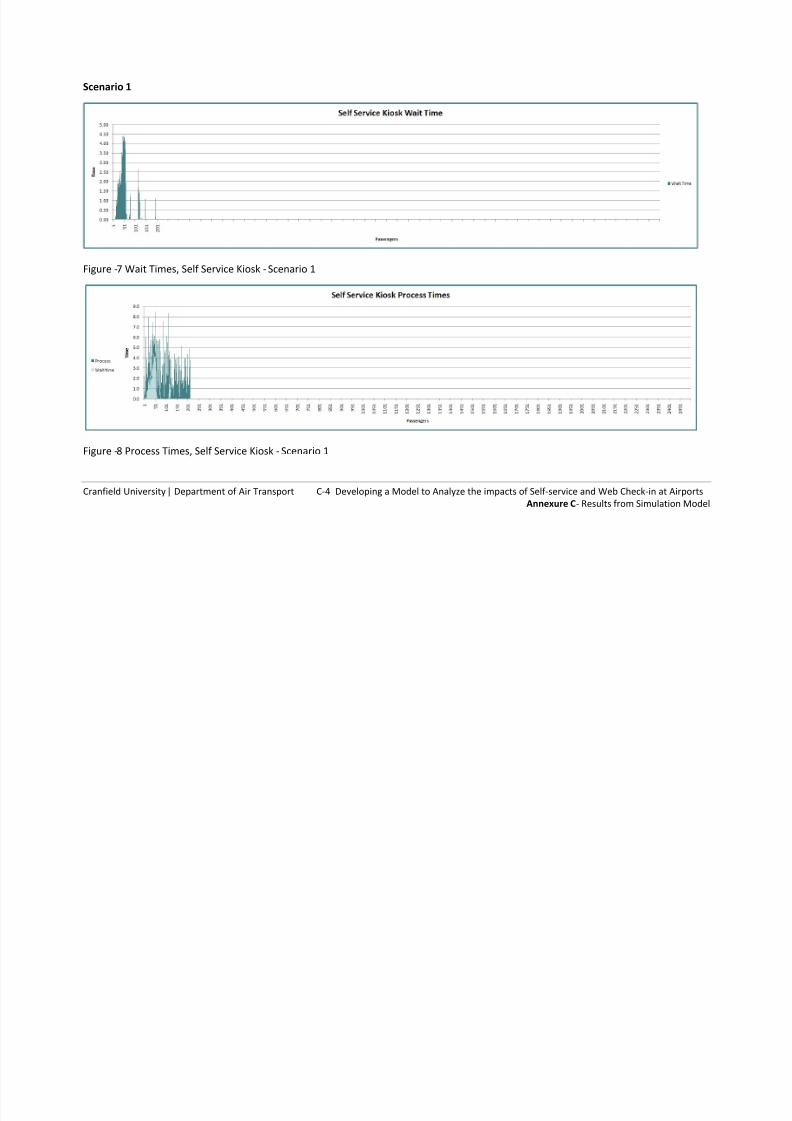
Scenario 1
Figure -7 Wait Times, Self Service Kiosk - Scenario 1
Figure -8 Process Times, Self Service Kiosk - Scenario 1

8/14/2019 Annexes Mihir Baxi
http://slidepdf.com/reader/full/annexes-mihir-baxi 21/45
Cranfield University | Department of Air Transport C-5 Developing a Model to Analyze the impacts of Self-service and Web Check-in at Airports
Annexure C- Results from Simulation Model
Scenario 1
Figure -9 Wait Times, Bag Drop-off - Scenario 1
Figure -10 Process Times, Bag Drop-off - Scenario 1
8/14/2019 Annexes Mihir Baxi
http://slidepdf.com/reader/full/annexes-mihir-baxi 22/45
Cranfield University | Department of Air Transport C-6 Developing a Model to Analyze the impacts of Self-service and Web Check-in at Airports
Annexure C- Results from Simulation Model
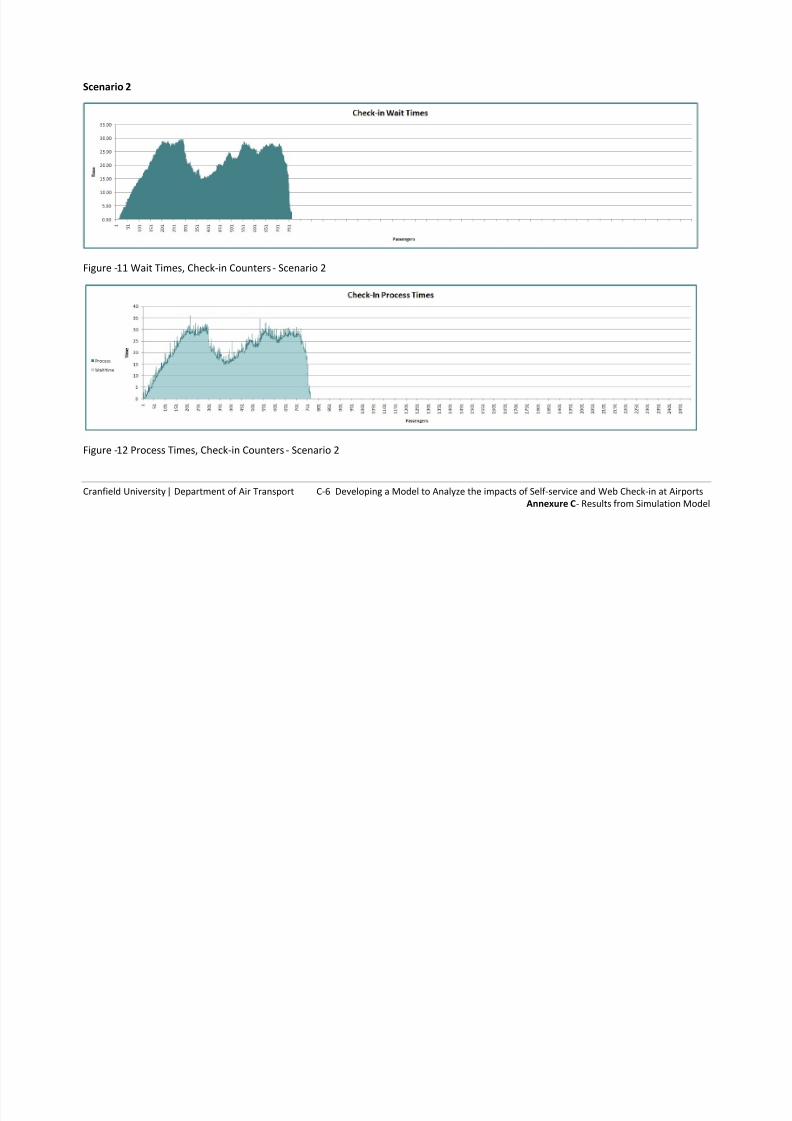
Scenario 2
Figure -11 Wait Times, Check-in Counters - Scenario 2
Figure -12 Process Times, Check-in Counters - Scenario 2
8/14/2019 Annexes Mihir Baxi
http://slidepdf.com/reader/full/annexes-mihir-baxi 23/45
Cranfield University | Department of Air Transport C-7 Developing a Model to Analyze the impacts of Self-service and Web Check-in at Airports
Annexure C- Results from Simulation Model
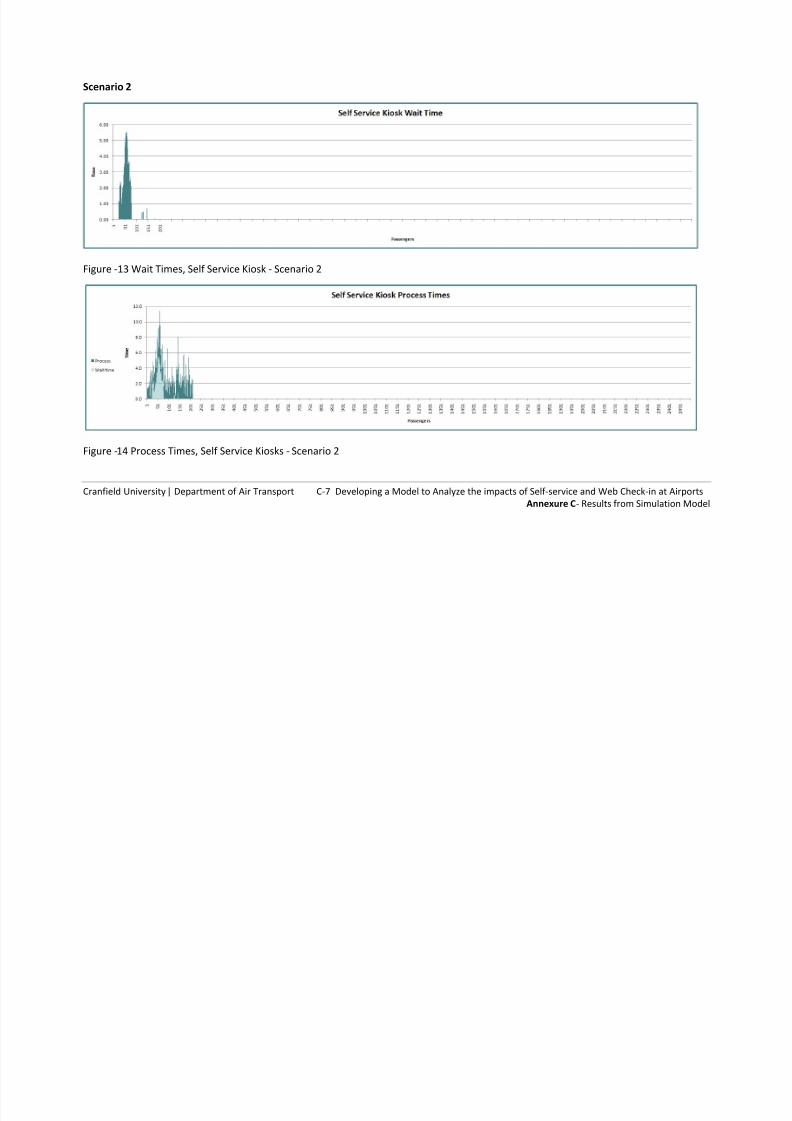
Scenario 2
Figure -13 Wait Times, Self Service Kiosk - Scenario 2
Figure -14 Process Times, Self Service Kiosks - Scenario 2

8/14/2019 Annexes Mihir Baxi
http://slidepdf.com/reader/full/annexes-mihir-baxi 24/45
Cranfield University | Department of Air Transport C-8 Developing a Model to Analyze the impacts of Self-service and Web Check-in at Airports
Annexure C- Results from Simulation Model
Scenario 2
Figure -15 Wait Times, Bag Drop-off - Scenario 2
Figure -16 Process Times, Bag Drop-off - Scenario 2
8/14/2019 Annexes Mihir Baxi
http://slidepdf.com/reader/full/annexes-mihir-baxi 25/45
Cranfield University | Department of Air Transport C-9 Developing a Model to Analyze the impacts of Self-service and Web Check-in at Airports
Annexure C- Results from Simulation Model
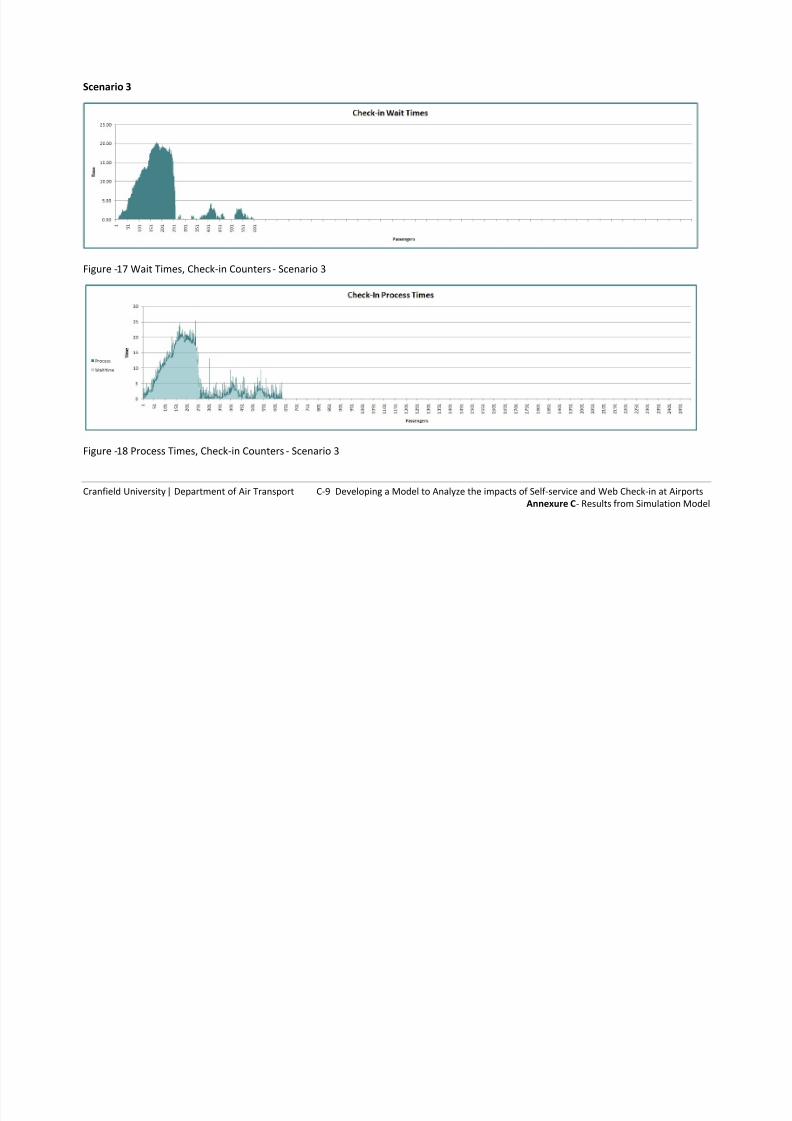
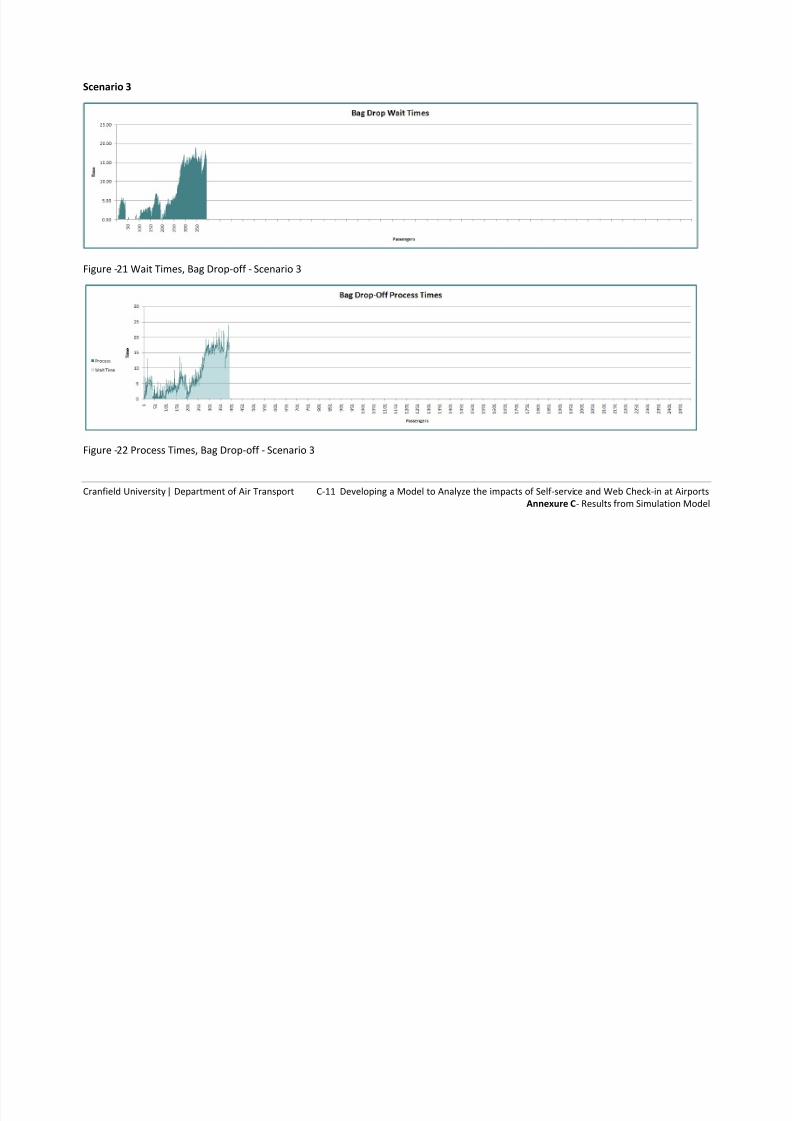
Scenario 3
Figure -17 Wait Times, Check-in Counters - Scenario 3
Figure -18 Process Times, Check-in Counters - Scenario 3
8/14/2019 Annexes Mihir Baxi
http://slidepdf.com/reader/full/annexes-mihir-baxi 26/45
Cranfield University | Department of Air Transport C-10 Developing a Model to Analyze the impacts of Self-service and Web Check-in at Airports
Annexure C- Results from Simulation Model
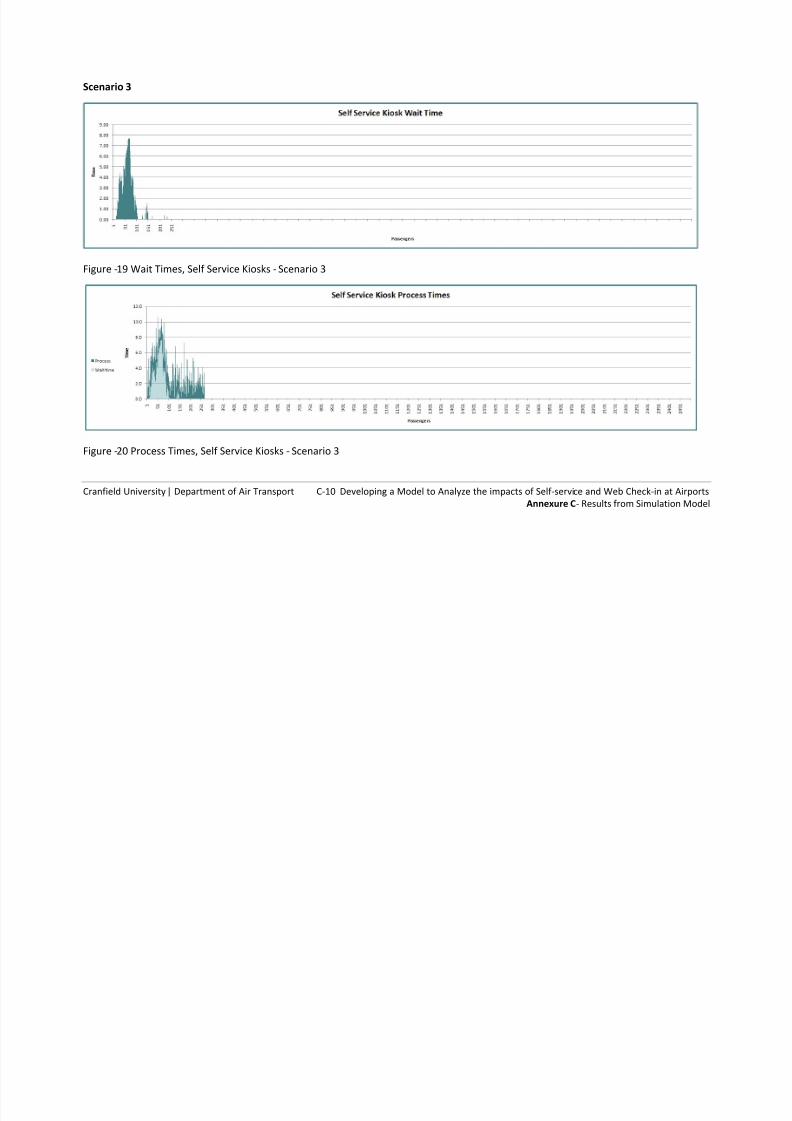
Scenario 3
Figure -19 Wait Times, Self Service Kiosks - Scenario 3
Figure -20 Process Times, Self Service Kiosks - Scenario 3
8/14/2019 Annexes Mihir Baxi
http://slidepdf.com/reader/full/annexes-mihir-baxi 27/45
Cranfield University | Department of Air Transport C-11 Developing a Model to Analyze the impacts of Self-service and Web Check-in at Airports
Annexure C- Results from Simulation Model
Scenario 3
Figure -21 Wait Times, Bag Drop-off - Scenario 3
Figure -22 Process Times, Bag Drop-off - Scenario 3
8/14/2019 Annexes Mihir Baxi
http://slidepdf.com/reader/full/annexes-mihir-baxi 28/45
Cranfield University | Department of Air Transport C-12 Developing a Model to Analyze the impacts of Self-service and Web Check-in at Airports
Annexure C- Results from Simulation Model
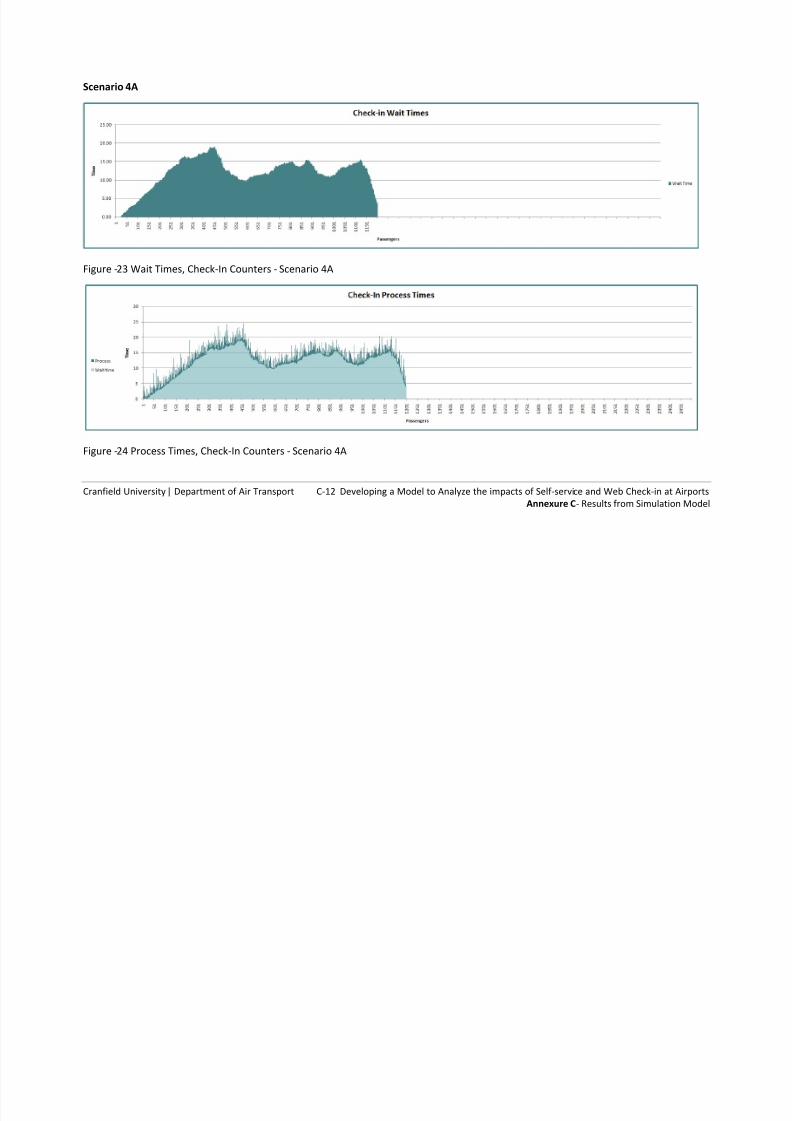
Scenario 4A
Figure -23 Wait Times, Check-In Counters - Scenario 4A
Figure -24 Process Times, Check-In Counters - Scenario 4A

8/14/2019 Annexes Mihir Baxi
http://slidepdf.com/reader/full/annexes-mihir-baxi 29/45
Cranfield University | Department of Air Transport C-13 Developing a Model to Analyze the impacts of Self-service and Web Check-in at Airports
Annexure C- Results from Simulation Model
Scenario 4A
Figure -25 Wait Times, Self Service Kiosks - Scenario 4A
Figure -26 Process Times, Self Service Kiosks - Scenario 4A

8/14/2019 Annexes Mihir Baxi
http://slidepdf.com/reader/full/annexes-mihir-baxi 30/45
Cranfield University | Department of Air Transport C-14 Developing a Model to Analyze the impacts of Self-service and Web Check-in at Airports
Annexure C- Results from Simulation Model
Scenario 4A
Figure -27 Wait Times, Bag Drop-off - Scenario 4A
Figure -28 Process Times, Bag Drop-off - Scenario 4A
8/14/2019 Annexes Mihir Baxi
http://slidepdf.com/reader/full/annexes-mihir-baxi 31/45
Cranfield University | Department of Air Transport C-15 Developing a Model to Analyze the impacts of Self-service and Web Check-in at Airports
Annexure C- Results from Simulation Model
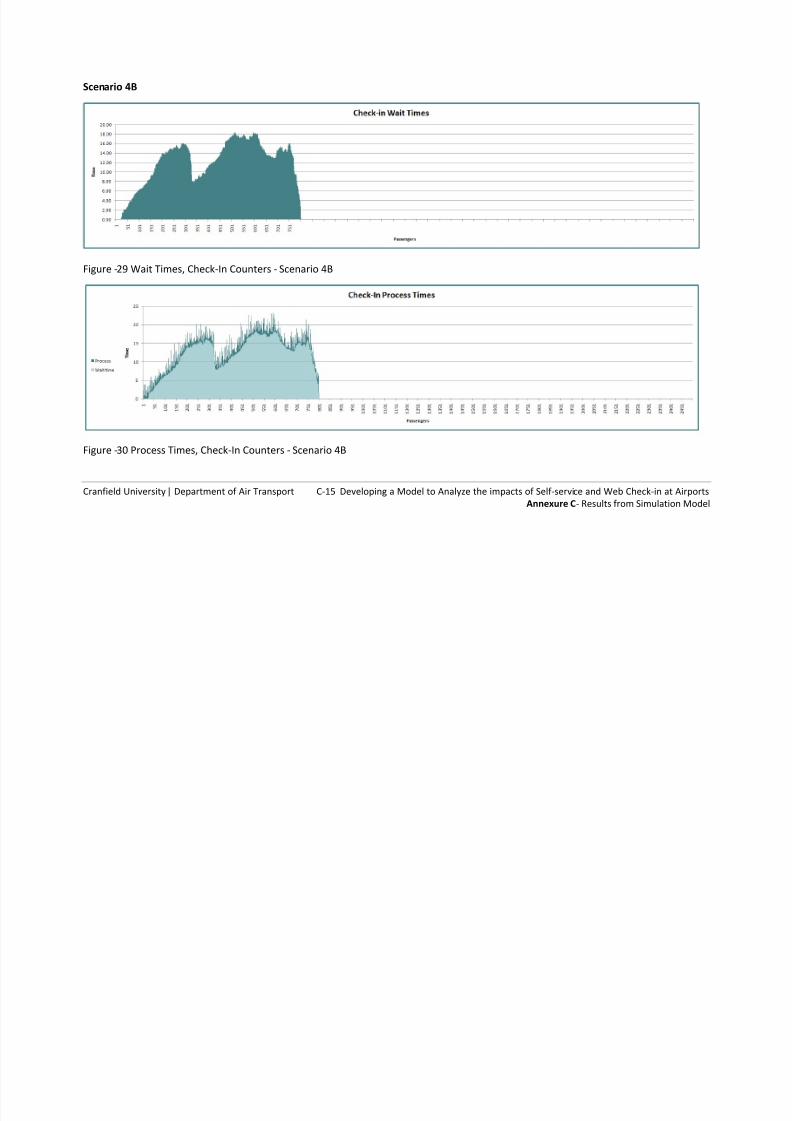
Scenario 4B
Figure -29 Wait Times, Check-In Counters - Scenario 4B
Figure -30 Process Times, Check-In Counters - Scenario 4B
8/14/2019 Annexes Mihir Baxi
http://slidepdf.com/reader/full/annexes-mihir-baxi 32/45
Cranfield University | Department of Air Transport C-16 Developing a Model to Analyze the impacts of Self-service and Web Check-in at Airports
Annexure C- Results from Simulation Model
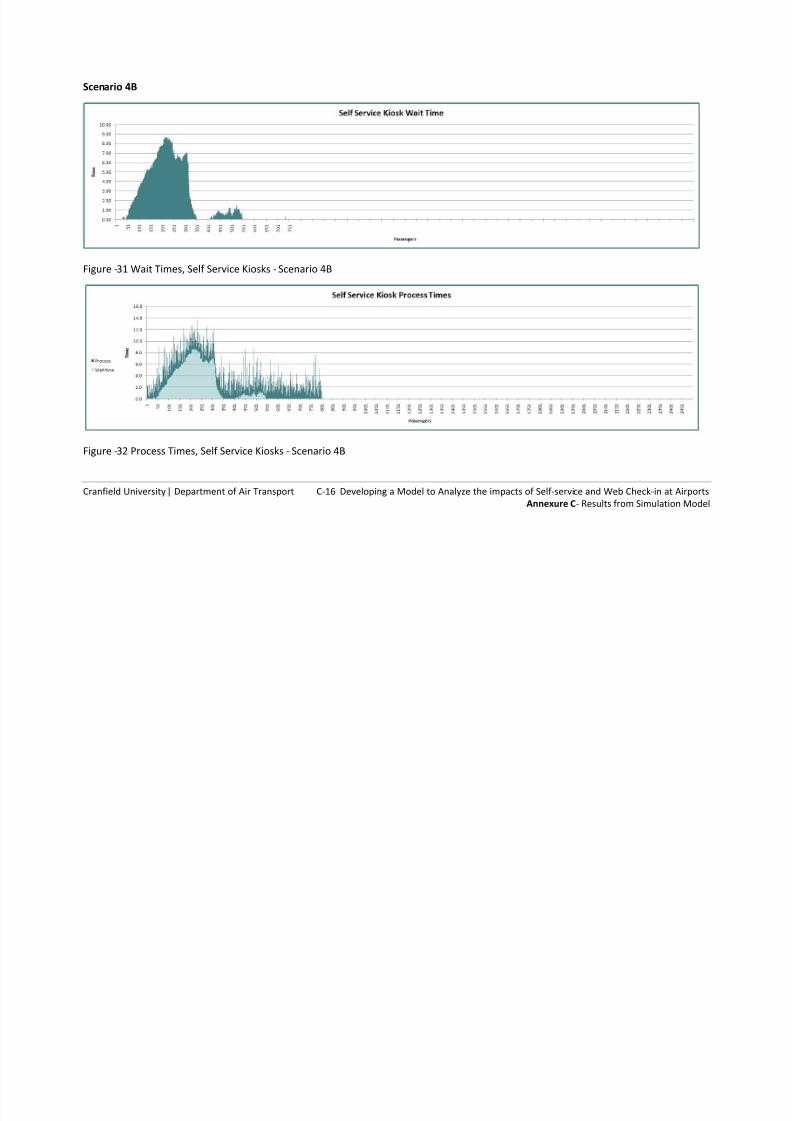
Scenario 4B
Figure -31 Wait Times, Self Service Kiosks - Scenario 4B
Figure -32 Process Times, Self Service Kiosks - Scenario 4B
8/14/2019 Annexes Mihir Baxi
http://slidepdf.com/reader/full/annexes-mihir-baxi 33/45
Cranfield University | Department of Air Transport C-17 Developing a Model to Analyze the impacts of Self-service and Web Check-in at Airports
Annexure C- Results from Simulation Model
Scenario 4B
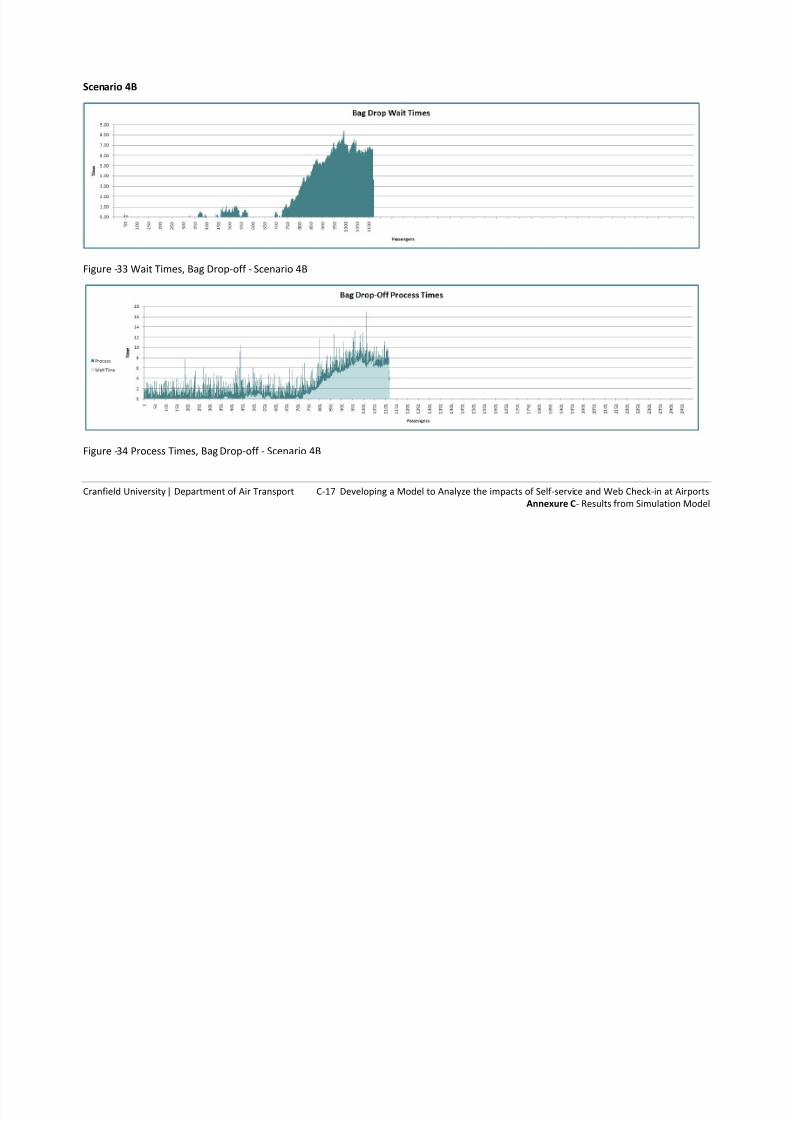
Figure -33 Wait Times, Bag Drop-off - Scenario 4B
Figure -34 Process Times, Bag Drop-off - Scenario 4B
8/14/2019 Annexes Mihir Baxi
http://slidepdf.com/reader/full/annexes-mihir-baxi 34/45
Cranfield University | Department of Air Transport C-18 Developing a Model to Analyze the impacts of Self-service and Web Check-in at Airports
Annexure C- Results from Simulation Model
Scenario 4C
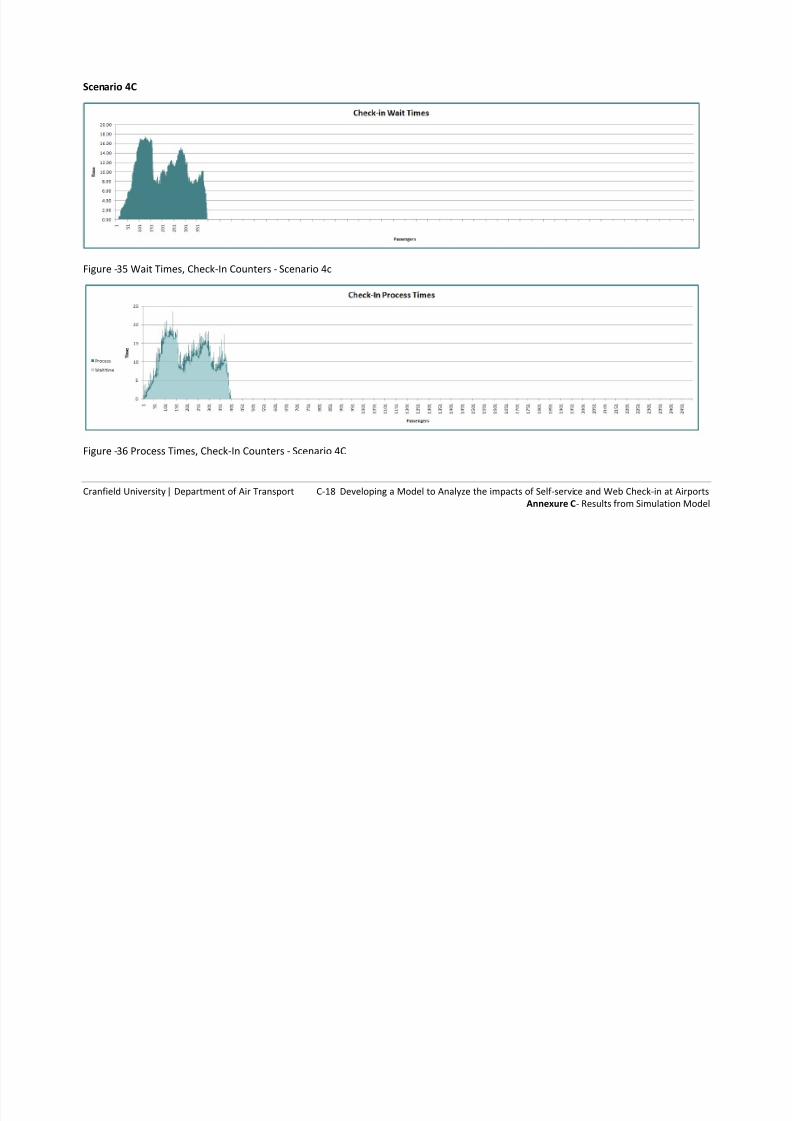
Figure -35 Wait Times, Check-In Counters - Scenario 4c
Figure -36 Process Times, Check-In Counters - Scenario 4C
8/14/2019 Annexes Mihir Baxi
http://slidepdf.com/reader/full/annexes-mihir-baxi 35/45
Cranfield University | Department of Air Transport C-19 Developing a Model to Analyze the impacts of Self-service and Web Check-in at Airports
Annexure C- Results from Simulation Model
Scenario 4C
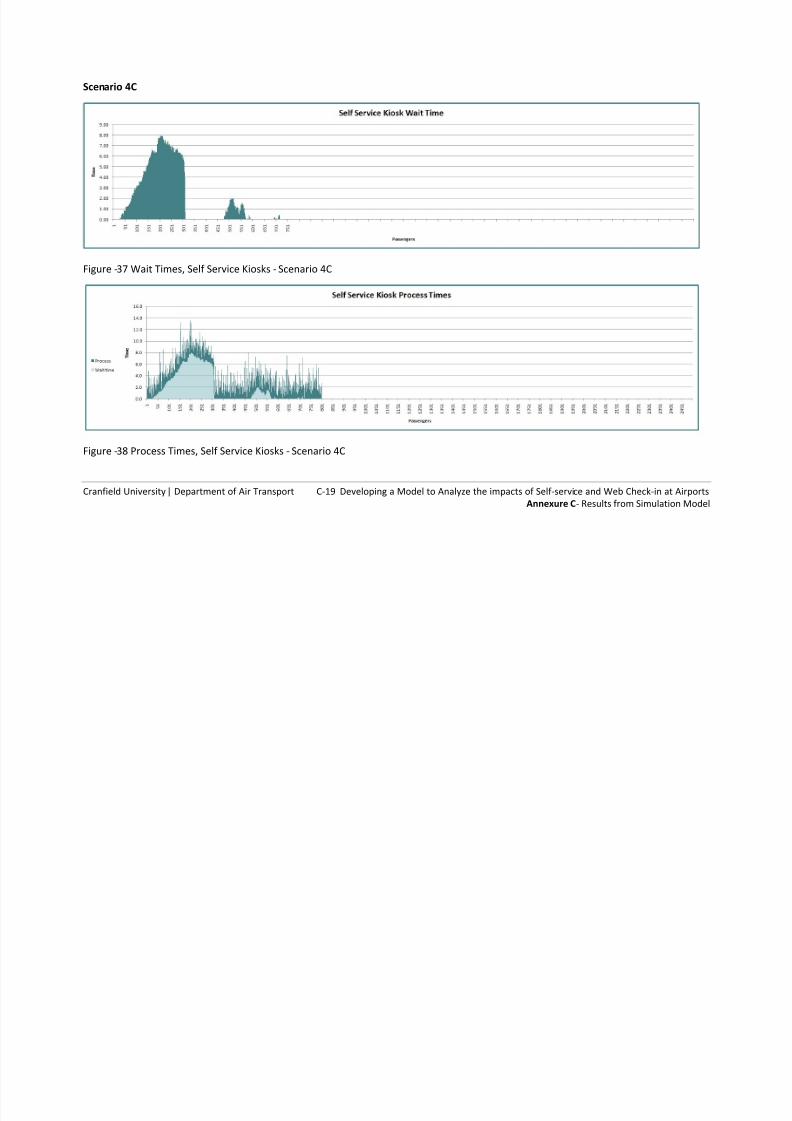
Figure -37 Wait Times, Self Service Kiosks - Scenario 4C
Figure -38 Process Times, Self Service Kiosks - Scenario 4C
8/14/2019 Annexes Mihir Baxi
http://slidepdf.com/reader/full/annexes-mihir-baxi 36/45
Cranfield University | Department of Air Transport C-20 Developing a Model to Analyze the impacts of Self-service and Web Check-in at Airports
Annexure C- Results from Simulation Model
Scenario 4C
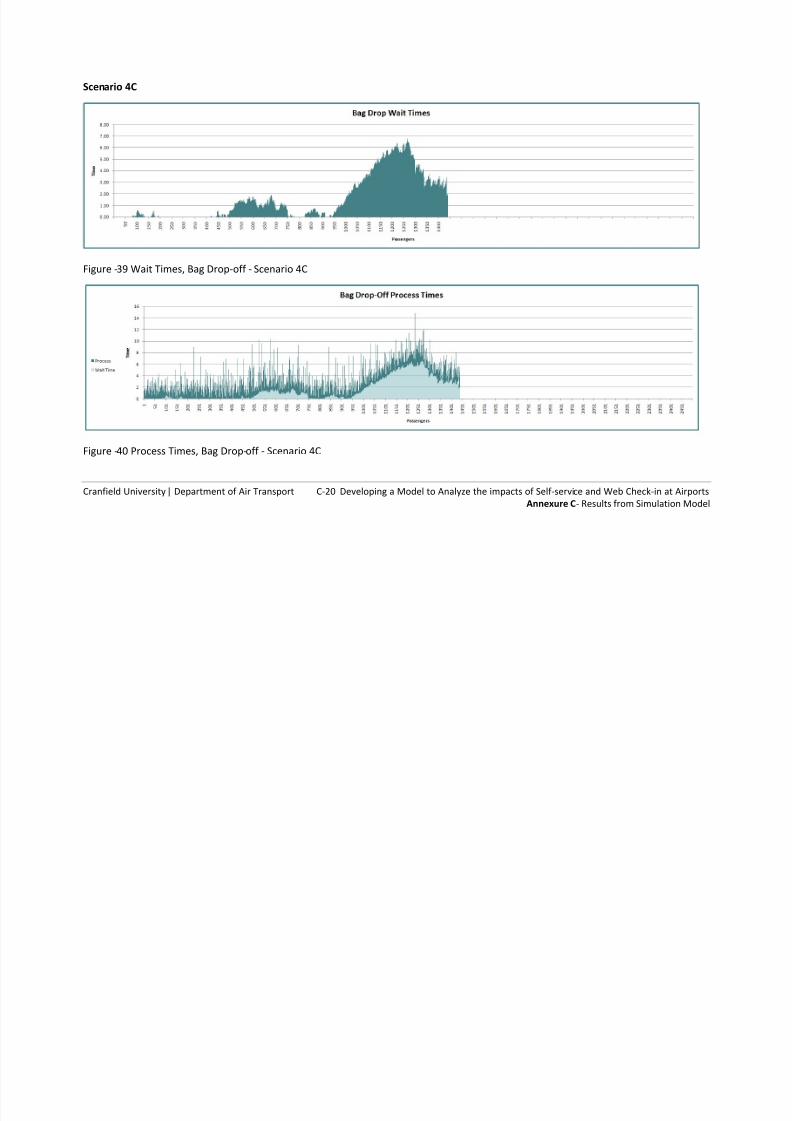
Figure -39 Wait Times, Bag Drop-off - Scenario 4C
Figure -40 Process Times, Bag Drop-off - Scenario 4C
8/14/2019 Annexes Mihir Baxi
http://slidepdf.com/reader/full/annexes-mihir-baxi 37/45
Cranfield University | Department of Air Transport C-21 Developing a Model to Analyze the impacts of Self-service and Web Check-in at Airports
Annexure C- Results from Simulation Model
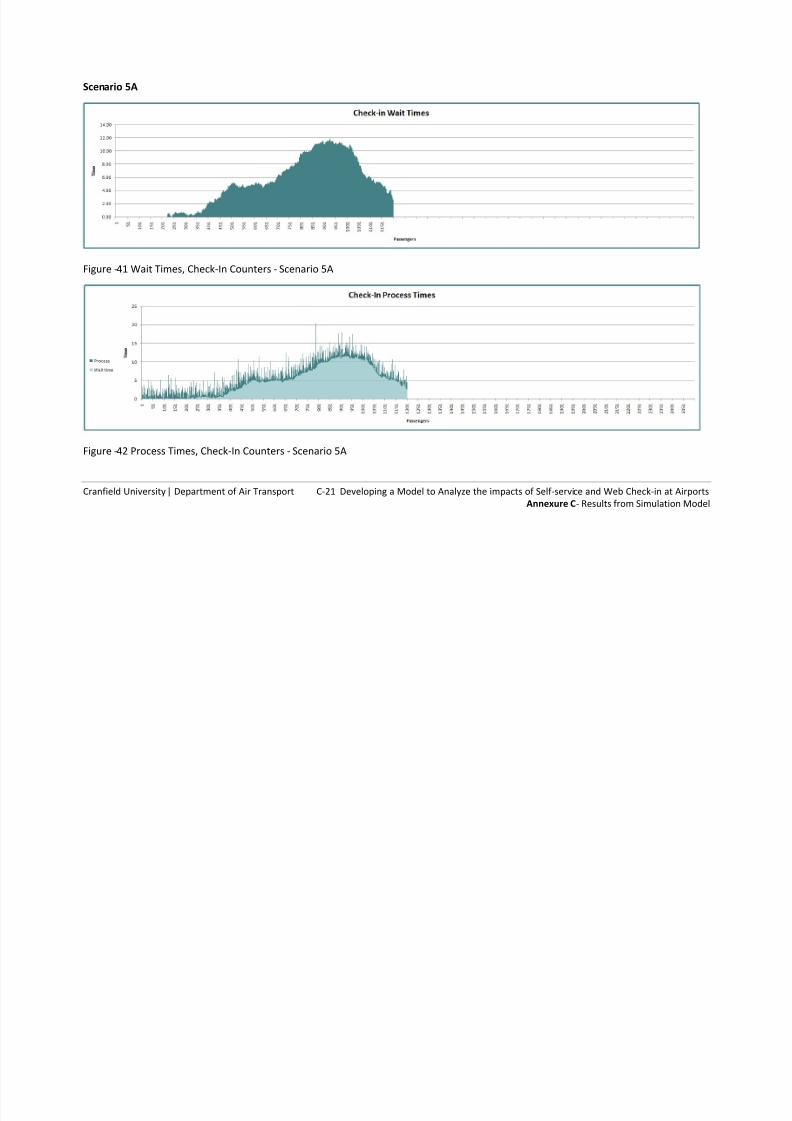
Scenario 5A
Figure -41 Wait Times, Check-In Counters - Scenario 5A
Figure -42 Process Times, Check-In Counters - Scenario 5A
8/14/2019 Annexes Mihir Baxi
http://slidepdf.com/reader/full/annexes-mihir-baxi 38/45
Cranfield University | Department of Air Transport C-22 Developing a Model to Analyze the impacts of Self-service and Web Check-in at Airports
Annexure C- Results from Simulation Model
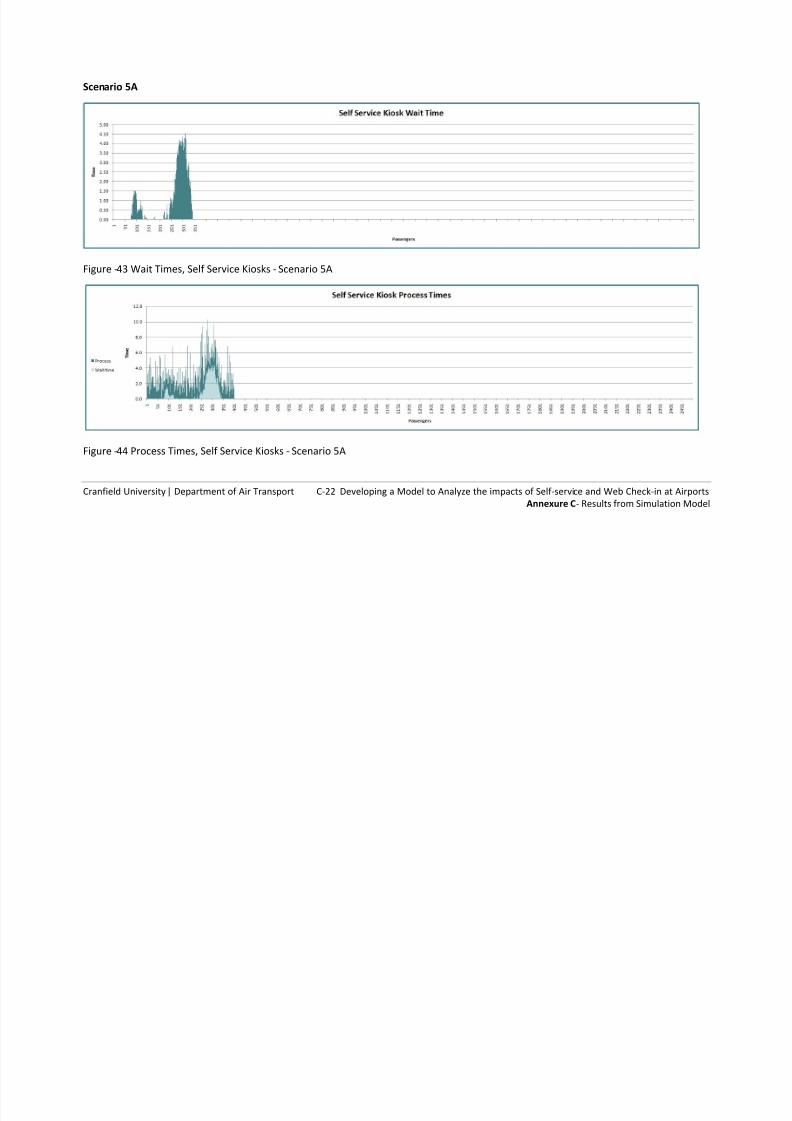
Scenario 5A
Figure -43 Wait Times, Self Service Kiosks - Scenario 5A
Figure -44 Process Times, Self Service Kiosks - Scenario 5A
8/14/2019 Annexes Mihir Baxi
http://slidepdf.com/reader/full/annexes-mihir-baxi 39/45
Cranfield University | Department of Air Transport C-23 Developing a Model to Analyze the impacts of Self-service and Web Check-in at Airports
Annexure C- Results from Simulation Model
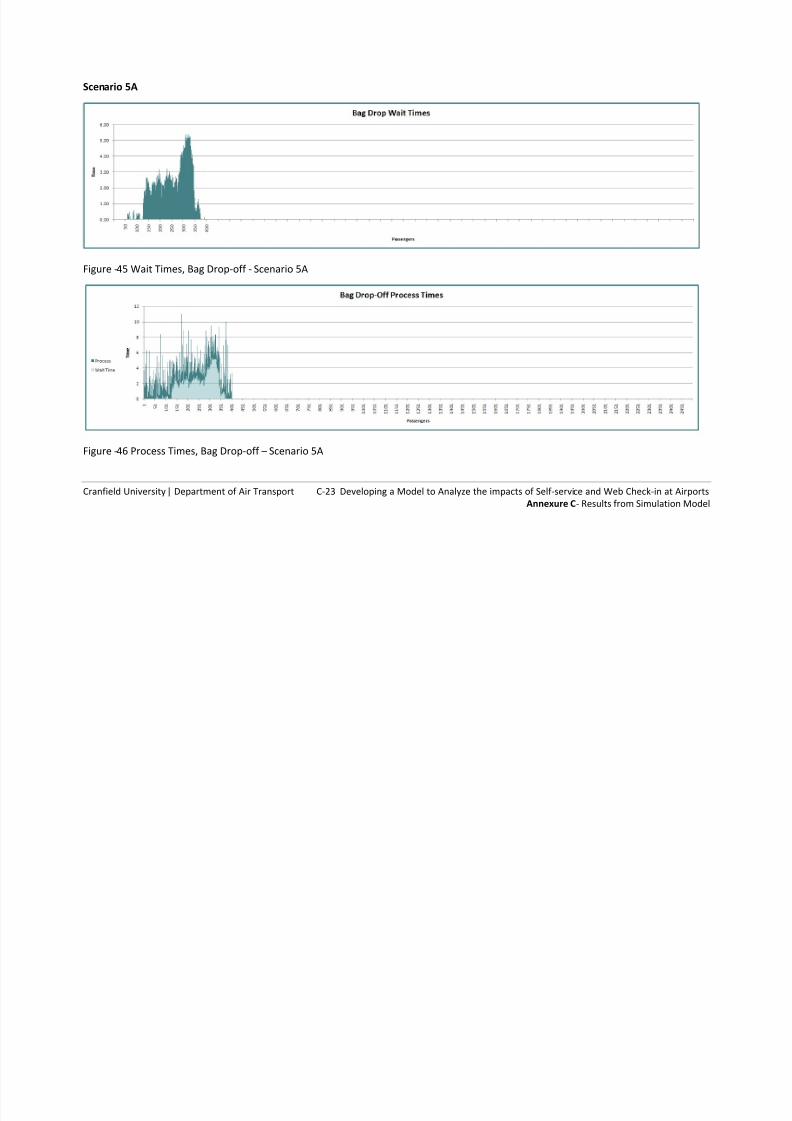
Scenario 5A
Figure -45 Wait Times, Bag Drop-off - Scenario 5A
Figure -46 Process Times, Bag Drop-off – Scenario 5A
8/14/2019 Annexes Mihir Baxi
http://slidepdf.com/reader/full/annexes-mihir-baxi 40/45
Cranfield University | Department of Air Transport C-24 Developing a Model to Analyze the impacts of Self-service and Web Check-in at Airports
Annexure C- Results from Simulation Model
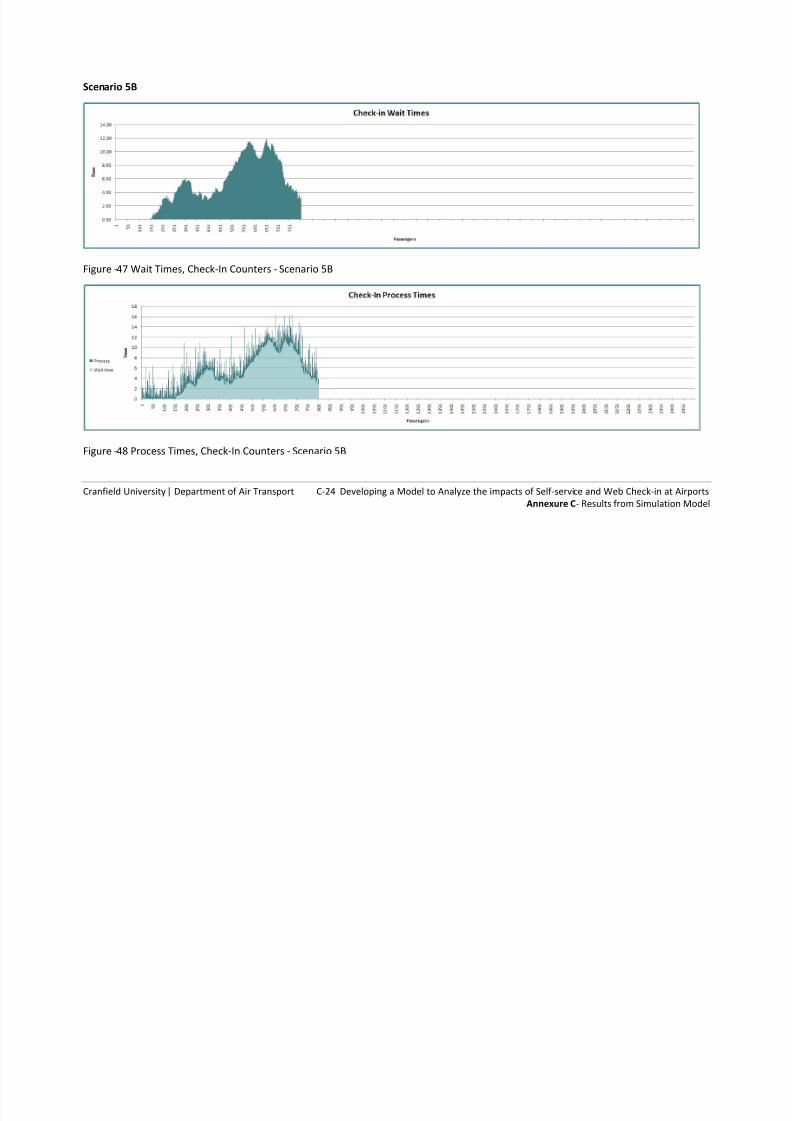
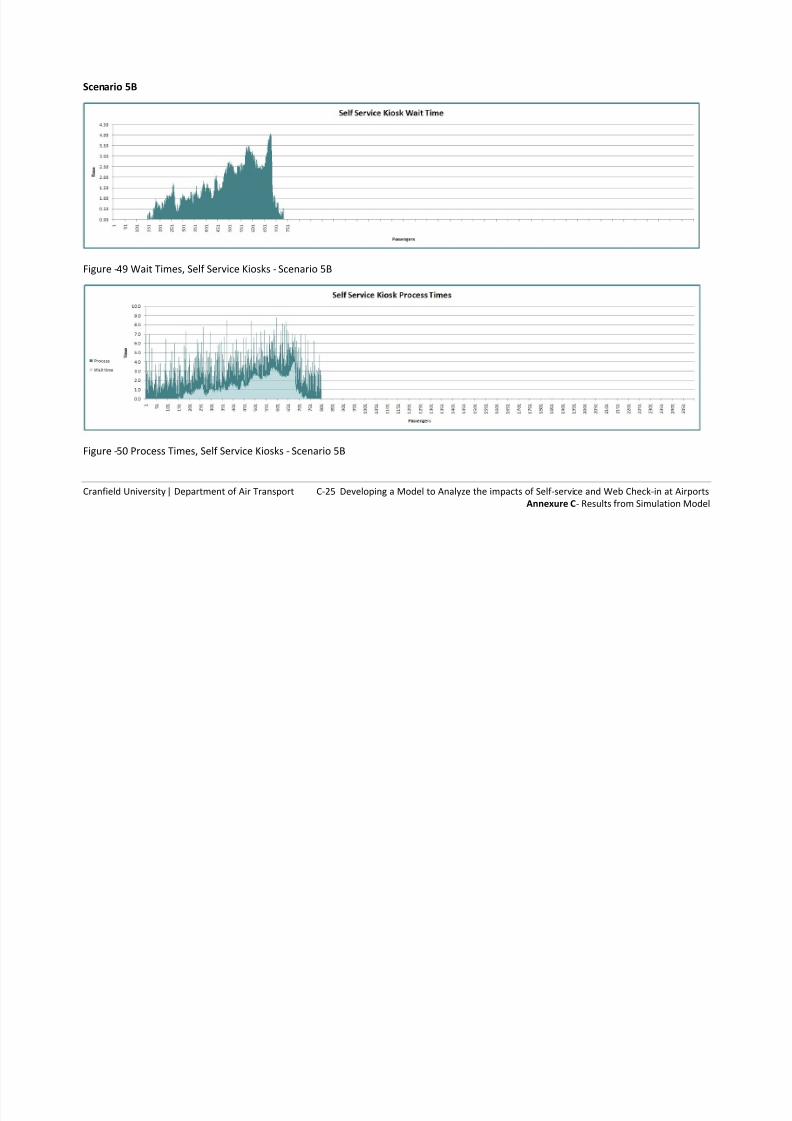
Scenario 5B
Figure -47 Wait Times, Check-In Counters - Scenario 5B
Figure -48 Process Times, Check-In Counters - Scenario 5B
8/14/2019 Annexes Mihir Baxi
http://slidepdf.com/reader/full/annexes-mihir-baxi 41/45
Cranfield University | Department of Air Transport C-25 Developing a Model to Analyze the impacts of Self-service and Web Check-in at Airports
Annexure C- Results from Simulation Model
Scenario 5B
Figure -49 Wait Times, Self Service Kiosks - Scenario 5B
Figure -50 Process Times, Self Service Kiosks - Scenario 5B

8/14/2019 Annexes Mihir Baxi
http://slidepdf.com/reader/full/annexes-mihir-baxi 42/45
Cranfield University | Department of Air Transport C-26 Developing a Model to Analyze the impacts of Self-service and Web Check-in at Airports
Annexure C- Results from Simulation Model
Scenario 5B
Figure -51 Wait Times, Bag Drop-off - Scenario 5B
Figure -52 Process Times, Bag Drop-off - Scenario 5B
8/14/2019 Annexes Mihir Baxi
http://slidepdf.com/reader/full/annexes-mihir-baxi 43/45
Cranfield University | Department of Air Transport C-27 Developing a Model to Analyze the impacts of Self-service and Web Check-in at Airports
Annexure C- Results from Simulation Model
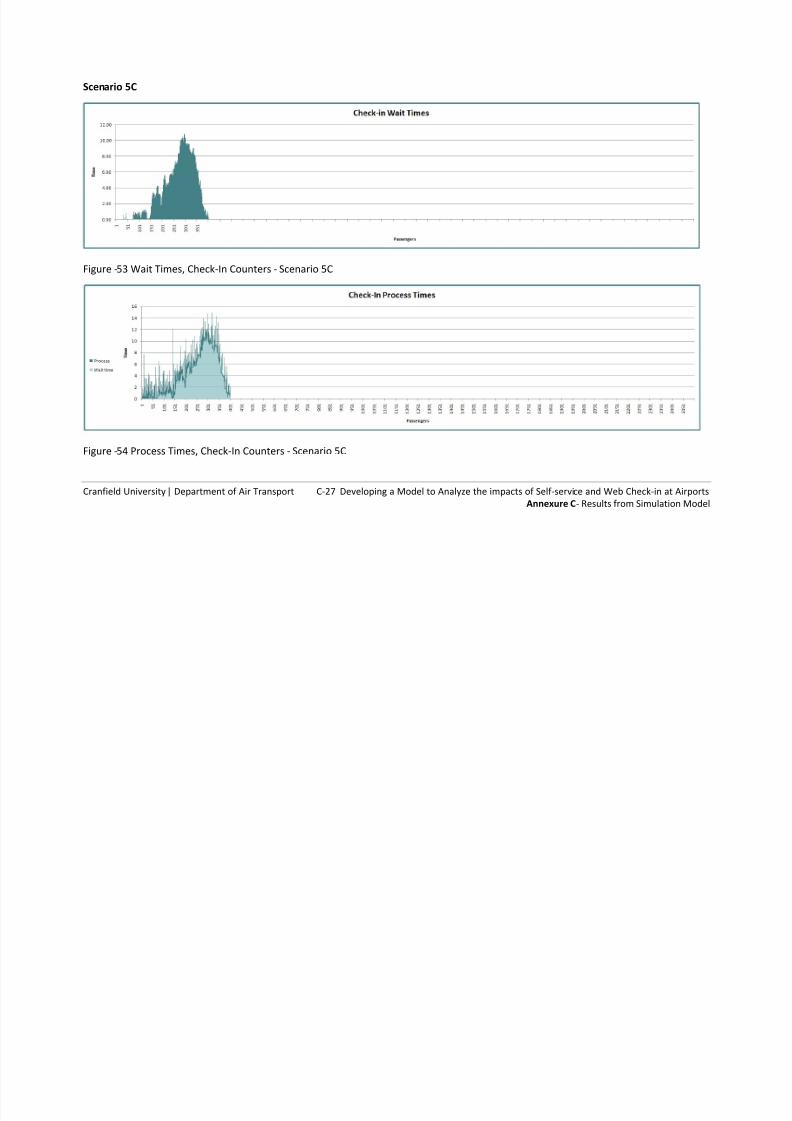
Scenario 5C
Figure -53 Wait Times, Check-In Counters - Scenario 5C
Figure -54 Process Times, Check-In Counters - Scenario 5C
8/14/2019 Annexes Mihir Baxi
http://slidepdf.com/reader/full/annexes-mihir-baxi 44/45
Cranfield University | Department of Air Transport C-28 Developing a Model to Analyze the impacts of Self-service and Web Check-in at Airports
Annexure C- Results from Simulation Model
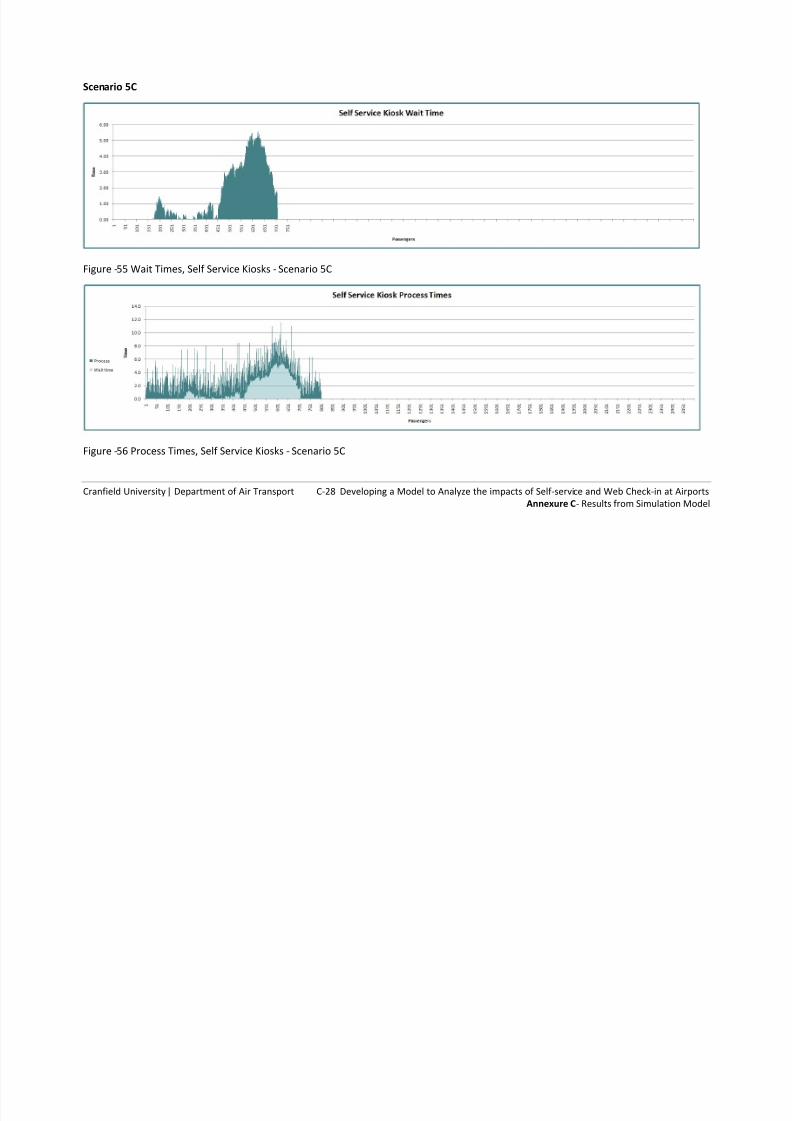
Scenario 5C
Figure -55 Wait Times, Self Service Kiosks - Scenario 5C
Figure -56 Process Times, Self Service Kiosks - Scenario 5C
8/14/2019 Annexes Mihir Baxi
http://slidepdf.com/reader/full/annexes-mihir-baxi 45/45
Cranfield University | Department of Air Transport C-29 Developing a Model to Analyze the impacts of Self-service and Web Check-in at Airports
Annexure C- Results from Simulation Model
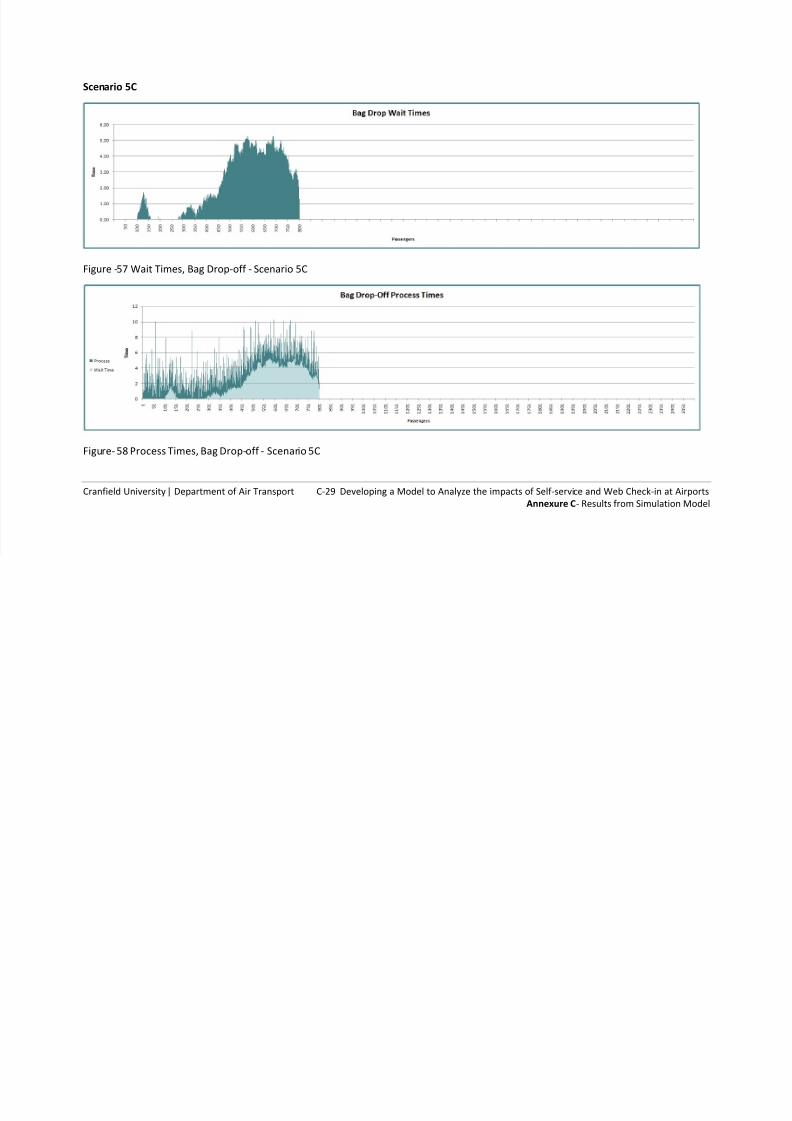
Scenario 5C
Figure -57 Wait Times, Bag Drop-off - Scenario 5C
Figure- 58 Process Times, Bag Drop-off - Scenario 5C