Embed Size (px)
Citation preview

Capital Markets DayStrategic Plan 2019-21
Alberto De Paoli CFO
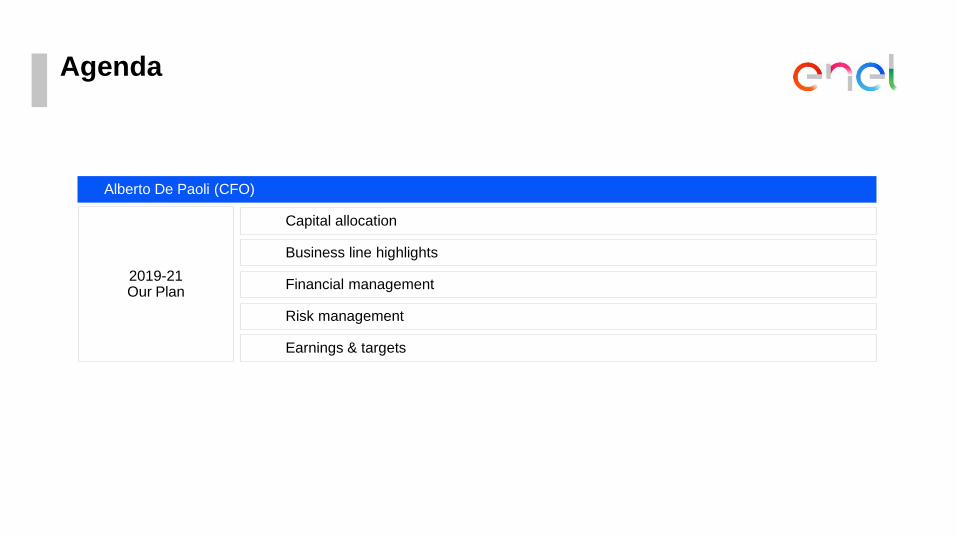
Agenda
Alberto De Paoli (CFO)
Capital allocation
Financial management
Risk management
Earnings & targets
Business line highlights
2019-21 Our Plan

2019-2021
Our Plan
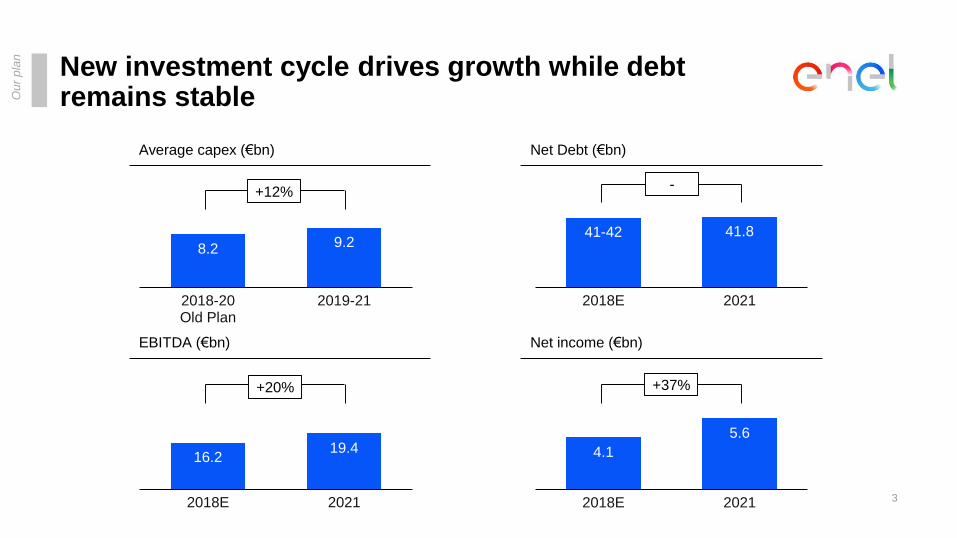
New investment cycle drives growth while debt remains stable
3
8.2 9.2
-
1.0
2.0
3.0
4.0
5.0
6.0
7.0
8.0
9.0
10.0
2018-20Old Plan
2019-21
Net income (€bn)
41-42 41.8
10.0 0
15.0 0
20.0 0
25.0 0
30.0 0
35.0 0
40.0 0
45.0 0
50.0 0
2018E 2021
Net Debt (€bn)
-
Average capex (€bn)
+12%
4.1
5.6
-
1.00
2.00
3.00
4.00
5.00
6.00
7.00
2018E 2021
+37%
EBITDA (€bn)
16.219.4
-
2.0
4.0
6.0
8.0
10.0
12.0
14.0
16.0
18.0
20.0
2018E 2021
+20%
Ou
r p
lan
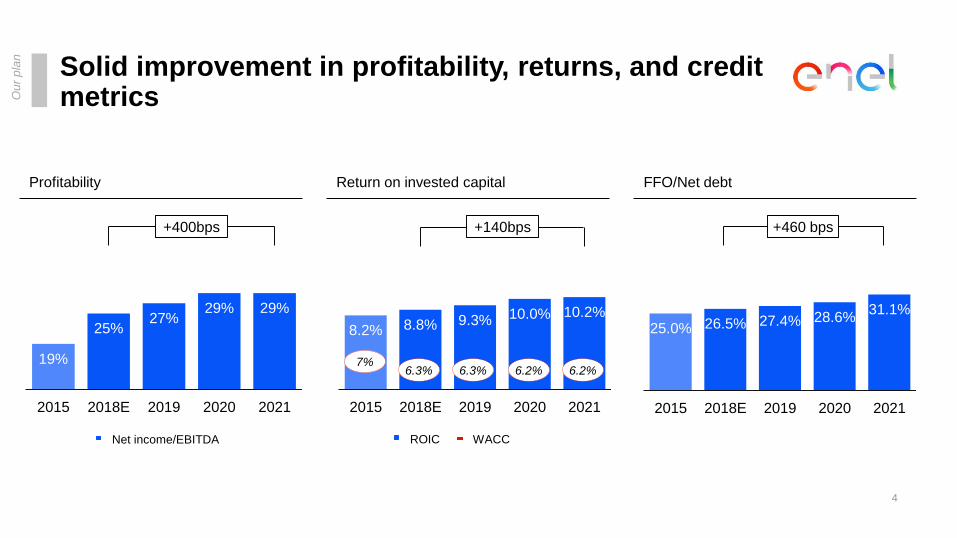
Solid improvement in profitability, returns, and credit metrics
FFO/Net debtReturn on invested capitalProfitability
19%
25%27%
29% 29%
0.1 0
0.1 5
0.2 0
0.2 5
0.3 0
0.3 5
2015 2018E 2019 2020 2021
Net income/EBITDA
25.0% 26.5% 27.4% 28.6%31.1%
0.0 %
5.0 %
10.0%
15.0%
20.0%
25.0%
30.0%
35.0%
2015 2018E 2019 2020 2021
4
Ou
r p
lan
8.2% 8.8% 9.3% 10.0% 10.2%
0.0 %
2.0 %
4.0 %
6.0 %
8.0 %
10.0%
12.0%
14.0%
2015 2018E 2019 2020 2021
ROIC WACC
7%6.3% 6.3% 6.2% 6.2%
+400bps +140bps +460 bps

2019-2021
Capital Allocation
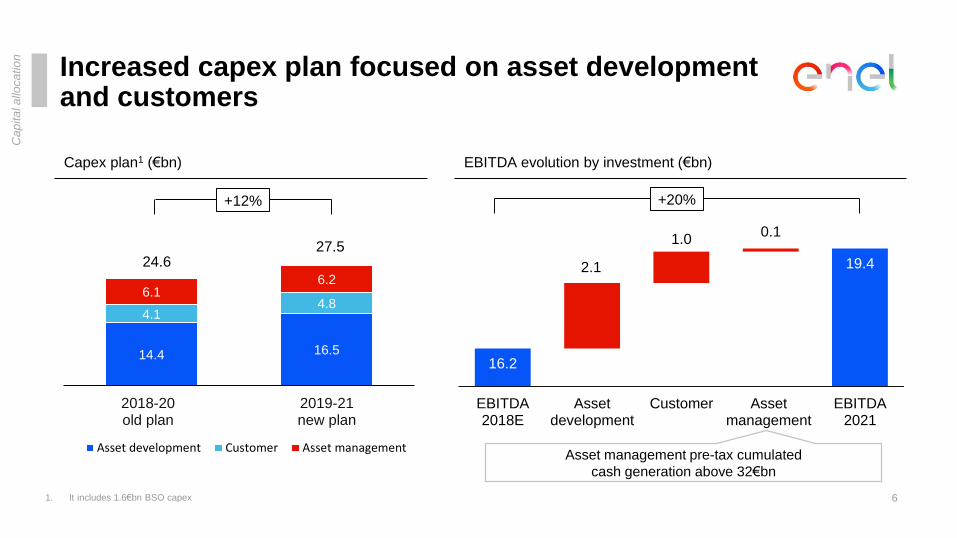
Increased capex plan focused on asset development and customers
6
Capex plan1 (€bn)
14.4 16.5
4.14.8
6.16.2
0
5
10
15
20
25
30
35
2018-20old plan
2019-21new plan
Asset development Customer Asset management
27.524.6
+12%
Cap
ita
l a
lloca
tio
n
16.2
2.1
1.00.1
19.4
EBITDA2018E
Assetdevelopment
Customer Assetmanagement
EBITDA2021
EBITDA evolution by investment (€bn)
Asset management pre-tax cumulated
cash generation above 32€bn
+20%
1. It includes 1.6€bn BSO capex
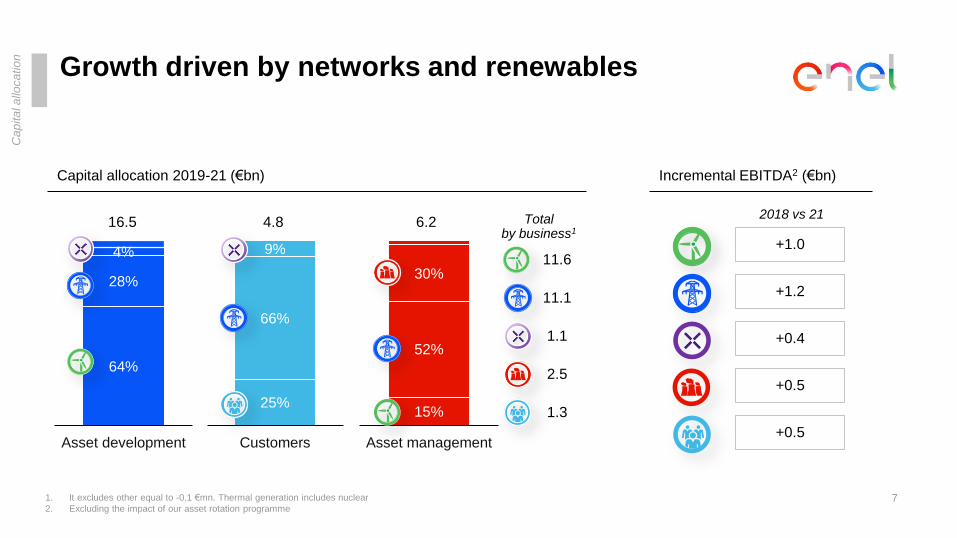
Growth driven by networks and renewables
7
Cap
ita
l a
lloca
tio
n
+1.0
+1.2
+0.4
+0.5
+0.5
2018 vs 21
64%
28%
4%
0%
10%
20%
30%
40%
50%
60%
70%
80%
90%
100 %
Asset development
16.5
Capital allocation 2019-21 (€bn)
25%
66%
9%
0%
10%
20%
30%
40%
50%
60%
70%
80%
90%
100 %
Customers
4.8
15%
52%
30%
0%
10%
20%
30%
40%
50%
60%
70%
80%
90%
100 %
Asset management
6.2
Incremental EBITDA2 (€bn)
11.6
1.3
11.1
1.1
2.5
Total by business1
1. It excludes other equal to -0.1 €mn. Thermal generation includes nuclear
2. Excluding the impact of our asset rotation programme
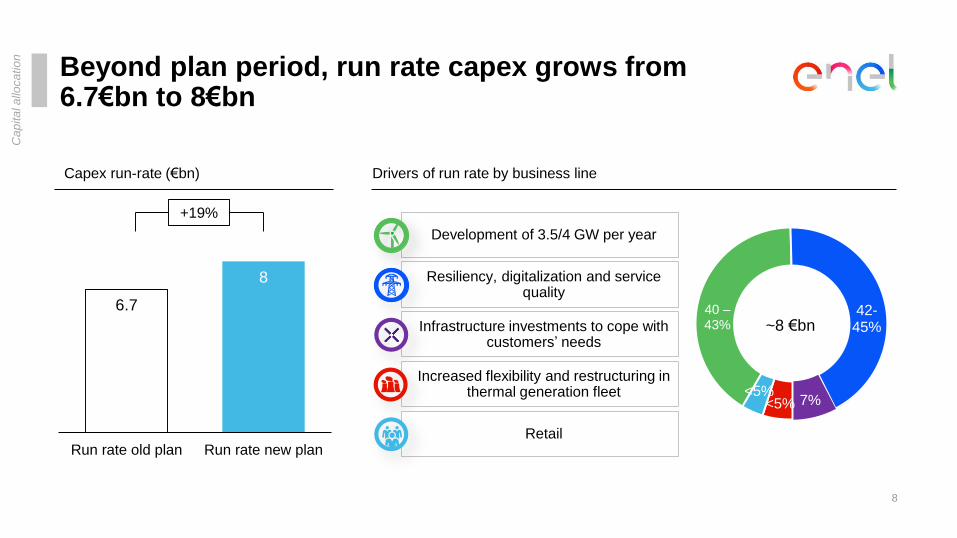
Beyond plan period, run rate capex grows from 6.7€bn to 8€bn
8
Cap
ita
l a
lloca
tio
n
Capex run-rate (€bn)
+19%
Drivers of run rate by business line
40 –43%
42-45%
7%<5%<5%
~8 €bn
Development of 3.5/4 GW per year
Resiliency, digitalization and service quality
Infrastructure investments to cope with customers’ needs
Increased flexibility and restructuring in thermal generation fleet
Retail
8
6.7
Run rate old plan Run rate new plan

2019-2021
Business Line Highlights
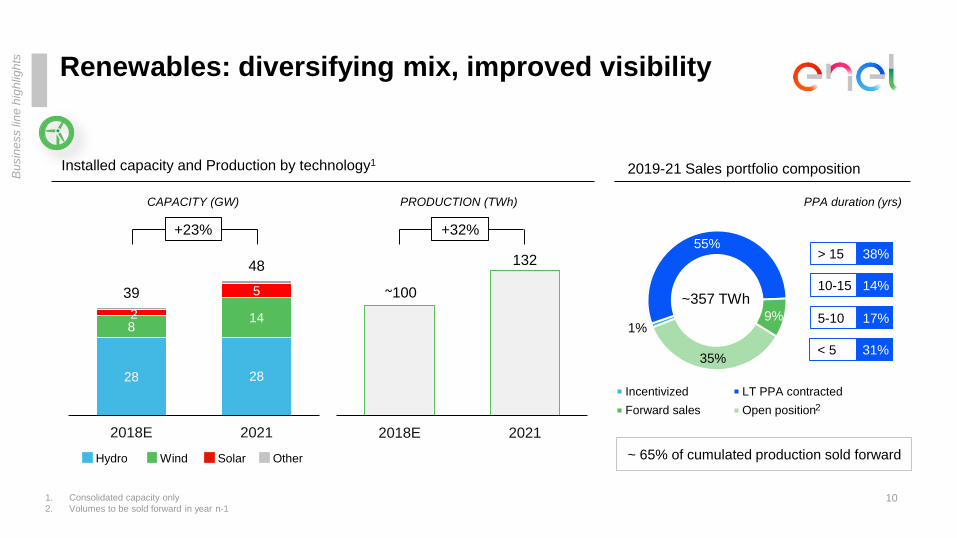
28 28
8142
539
48
0.0
10. 0
20. 0
30. 0
40. 0
50. 0
2018E 2021
Wind
Renewables: diversifying mix, improved visibility
10
Installed capacity and Production by technology1
~100
132
0
20
40
60
80
100
120
140
2018E 2021
CAPACITY (GW) PRODUCTION (TWh)
1. Consolidated capacity only
2. Volumes to be sold forward in year n-1
Bu
sin
ess lin
e h
igh
ligh
ts
2019-21 Sales portfolio composition
1%
55%
9%
35%
Incentivized LT PPA contracted
Forward sales Open position
~357 TWh
> 15 38%
10-15 14%
5-10 17%
PPA duration (yrs)
< 5 31%
+23% +32%
~ 65% of cumulated production sold forward
2
Hydro Solar Other
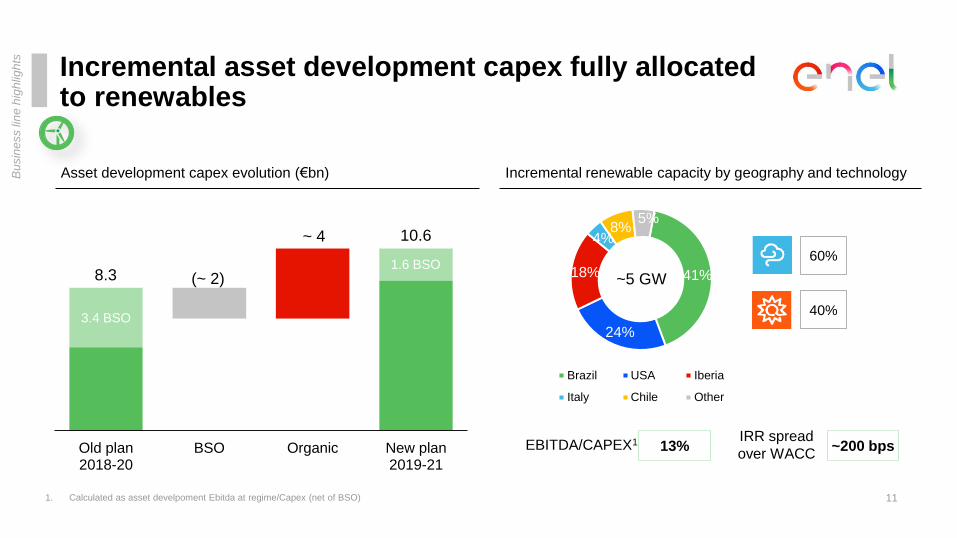
Incremental asset development capex fully allocated to renewables
1. Calculated as asset develpoment Ebitda at regime/Capex (net of BSO)
41%
24%
18%
4%8%
5%
Brazil USA Iberia
Italy Chile Other
~5 GW
EBITDA/CAPEX1 IRR spread
over WACC 13% ~200 bps
11
8.3
10.6
60%
40%
Bu
sin
ess lin
e h
igh
ligh
ts
Asset development capex evolution (€bn) Incremental renewable capacity by geography and technology
(~ 2)
~ 4
Old plan2018-20
BSO Organic New plan2019-21
3.4 BSO
1.6 BSO
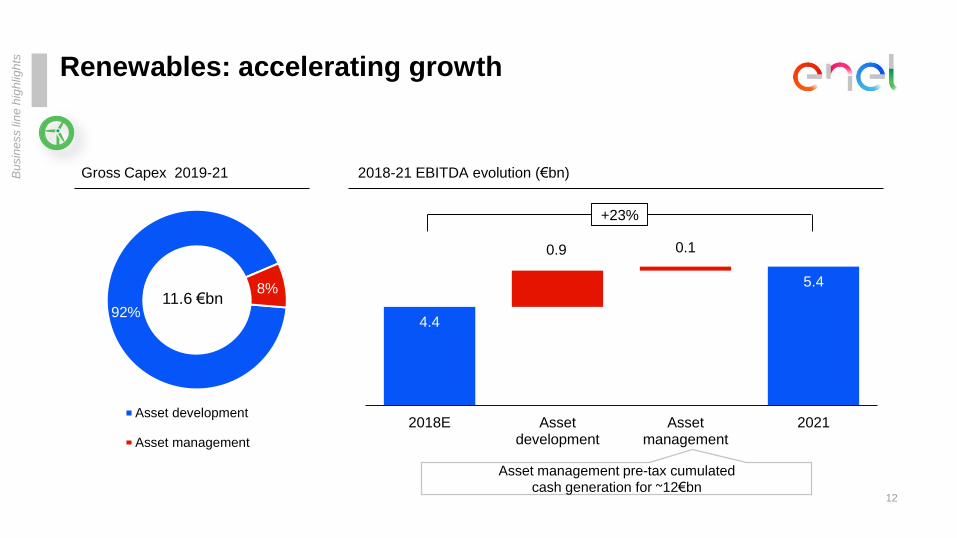
4.4
0.9 0.1
5.4
2018E Assetdevelopment
Assetmanagement
2021
92%
8%
Asset development
Asset management
Renewables: accelerating growth
12
Gross Capex 2019-21
11.6 €bn
Bu
sin
ess lin
e h
igh
ligh
ts
2018-21 EBITDA evolution (€bn)
+23%
Asset management pre-tax cumulated cash generation for ~12€bn
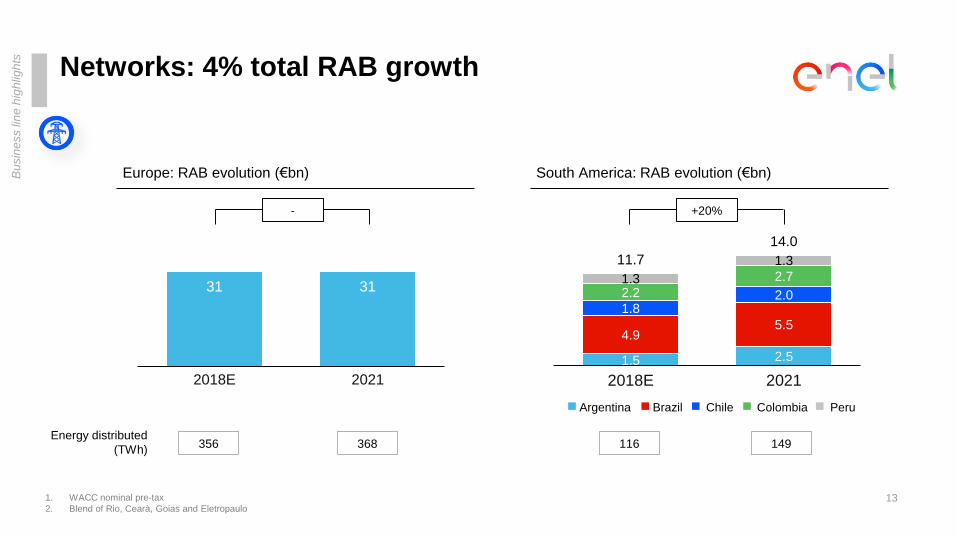
Networks: 4% total RAB growth
13
1.5 2.5
4.95.5
1.82.02.2
2.71.3
1.311.7
14.0
-
5.00
10.0 0
15.0 0
20.0 0
2018E 2021
31 31
-
5.00
10.0 0
15.0 0
20.0 0
25.0 0
30.0 0
35.0 0
40.0 0
45.0 0
2018E 2021
+20%-
Bu
sin
ess lin
e h
igh
ligh
ts
1. WACC nominal pre-tax
2. Blend of Rio, Cearà, Goias and Eletropaulo
Energy distributed
(TWh)356 368 116 149
Europe: RAB evolution (€bn) South America: RAB evolution (€bn)
BrazilArgentina Chile Colombia Peru
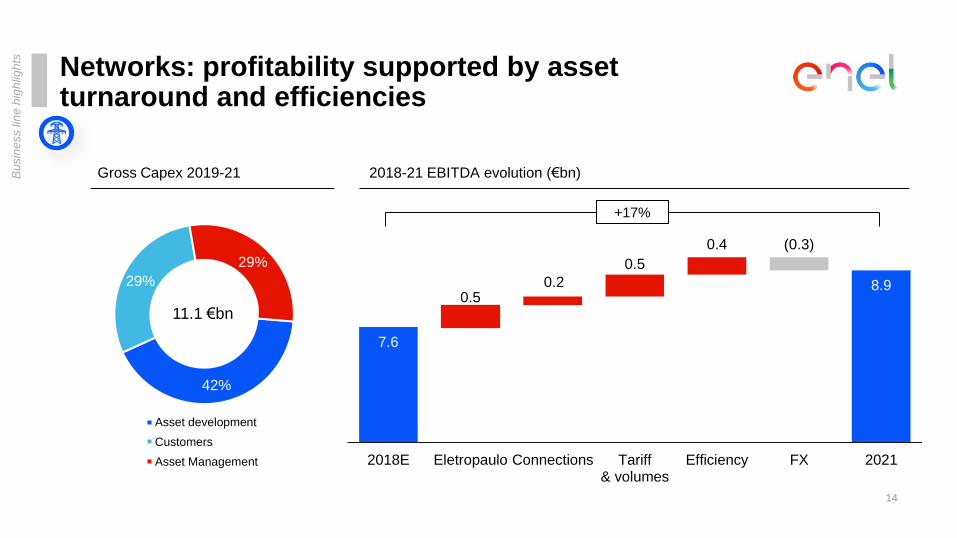
42%
29%
29%
Asset development
Customers
Asset Management
Networks: profitability supported by asset turnaround and efficiencies
14
Gross Capex 2019-21
11.1 €bn
Bu
sin
ess lin
e h
igh
ligh
ts
2018-21 EBITDA evolution (€bn)
7.6
0.50.2
0.5
0.4 (0.3)
8.9
2018E Eletropaulo Connections Tariff& volumes
Efficiency FX 2021
+17%
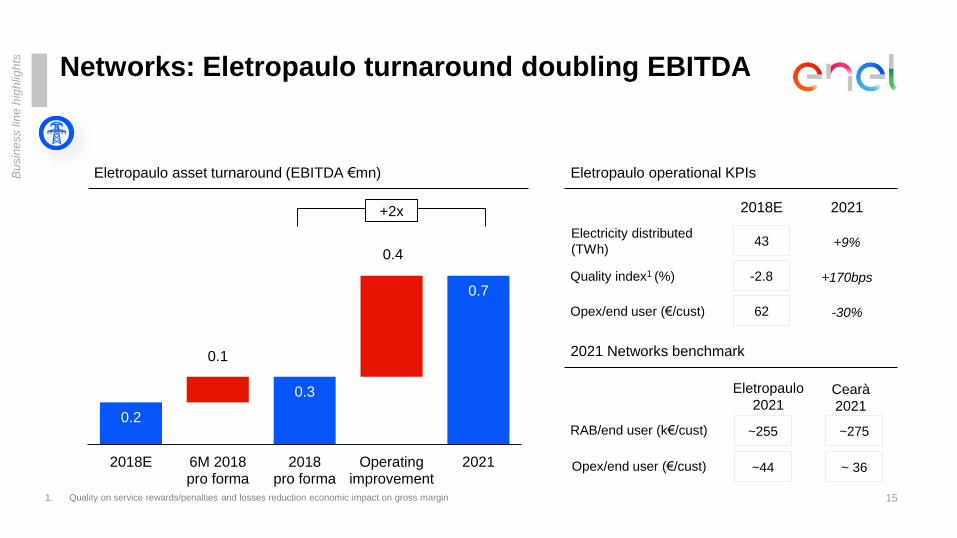
Networks: Eletropaulo turnaround doubling EBITDA
15
Bu
sin
ess lin
e h
igh
ligh
ts
Eletropaulo asset turnaround (EBITDA €mn)
+2x
Eletropaulo operational KPIs
0.3
0.2
0.1
0.4
0.7
2018E 6M 2018pro forma
2018pro forma
Operatingimprovement
2021
62 -30%Opex/end user (€/cust)
-2.8 +170bpsQuality index1 (%)
2018E 2021
43 +9%Electricity distributed
(TWh)
RAB/end user (k€/cust)
Opex/end user (€/cust)
~275
~ 36
Cearà
2021
Eletropaulo
2021
~255
~44
1. Quality on service rewards/penalties and losses reduction economic impact on gross margin
2021 Networks benchmark
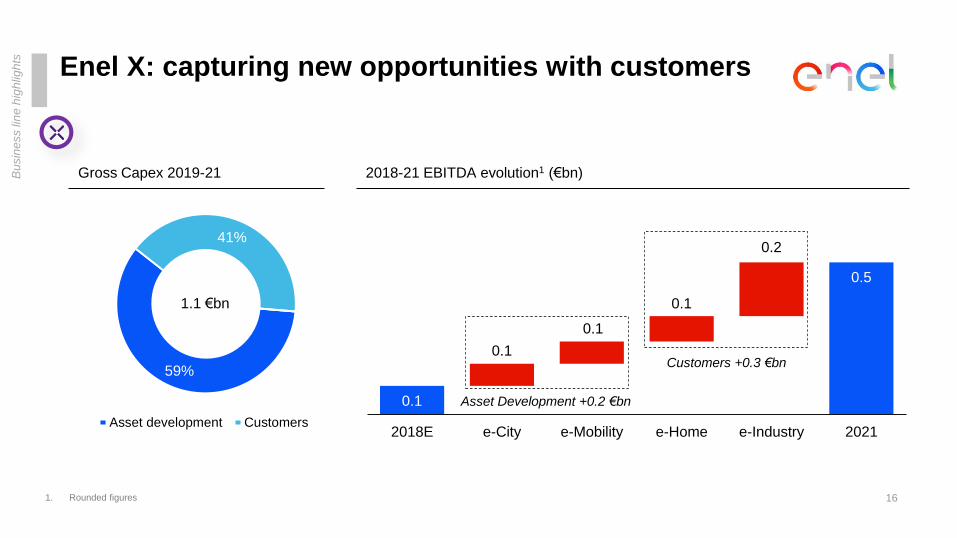
Enel X: capturing new opportunities with customers
16
1.1 €bn
Bu
sin
ess lin
e h
igh
ligh
ts
0.1
0.1
0.1
0.1
0.2
0.5
2018E e-City e-Mobility e-Home e-Industry 2021
2018-21 EBITDA evolution1 (€bn)
Asset Development +0.2 €bn
Customers +0.3 €bn59%
41%
Asset development Customers
1. Rounded figures
Gross Capex 2019-21
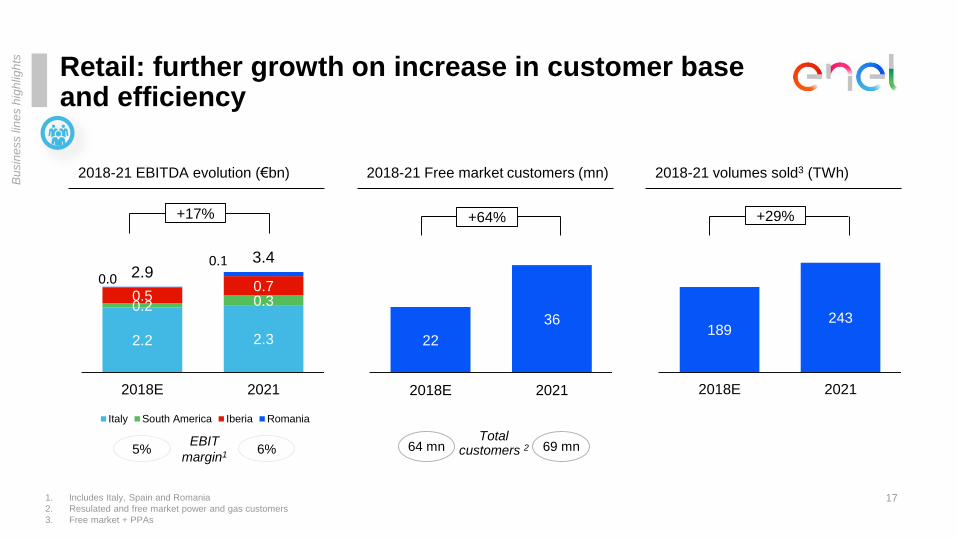
189243
0
50
100
150
200
250
300
350
400
2018E 2021
Retail: further growth on increase in customer base and efficiency
17
2018-21 EBITDA evolution (€bn)
2.2 2.3
0.2 0.30.50.7
0.00.1
2.93.4
0.0
1.0
2.0
3.0
4.0
5.0
6.0
2018E 2021
Italy South America Iberia Romania
+17%
22
36
0
10
20
30
40
50
60
2018E 2021
+64%
2018-21 volumes sold3 (TWh)
1. Includes Italy, Spain and Romania
2. Resulated and free market power and gas customers
3. Free market + PPAs
Bu
sin
ess lin
es h
igh
ligh
ts
5% 6%EBIT
margin1
Total customers 264 mn 69 mn
+29%
2018-21 Free market customers (mn)

2019-2021
Financial Management
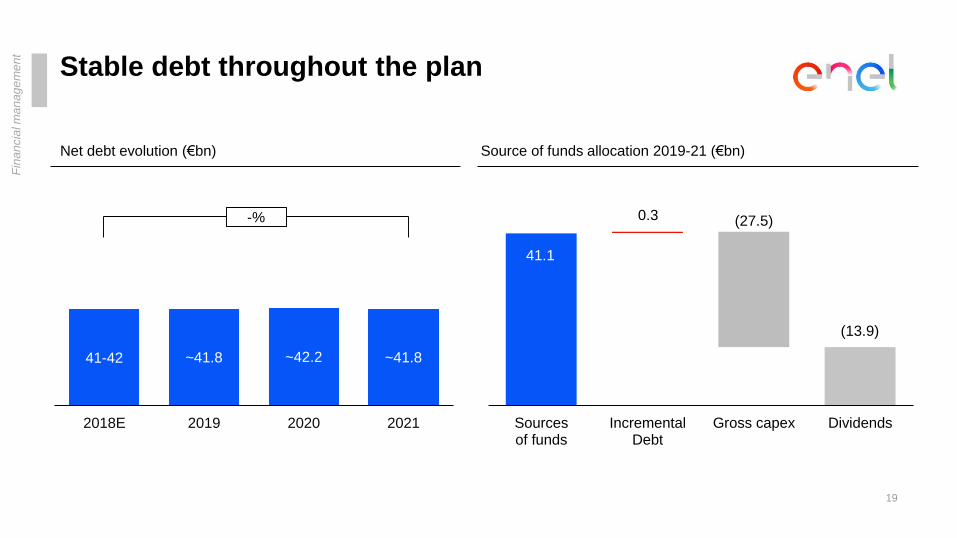
Stable debt throughout the plan
19
41.1
0.3 (27.5)
(13.9)
0.0
5.0
10. 0
15. 0
20. 0
25. 0
30. 0
35. 0
40. 0
45. 0
50. 0
Sourcesof funds
IncrementalDebt
Gross capex Dividends
Source of funds allocation 2019-21 (€bn)
Fin
an
cia
l ma
na
ge
me
nt
41-42 ~41.8 ~42.2 ~41.8
2018E 2019 2020 2021
Net debt evolution (€bn)
-%
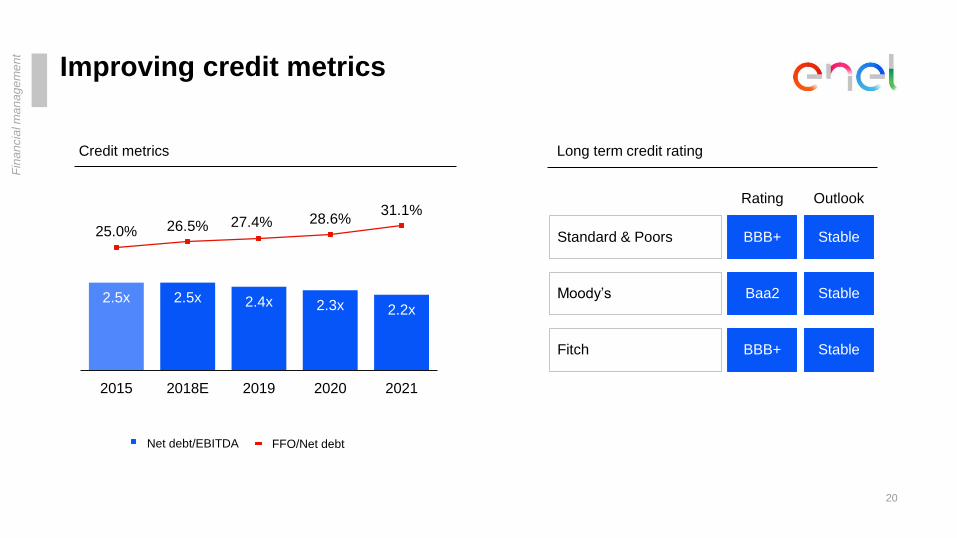
Improving credit metrics
20
Long term credit rating
Standard & Poors
Moody’s
Fitch
BBB+
Baa2
BBB+
Stable
Stable
Stable
Rating Outlook
Fin
an
cia
l ma
na
ge
me
nt
Credit metrics
Net debt/EBITDA FFO/Net debt
2.5x 2.5x 2.4x 2.3x 2.2x
25.0% 26.5% 27.4% 28.6%31.1%
-10%
-5%
0%
5%
10%
15%
20%
25%
30%
35%
-
0.5 0
1.0 0
1.5 0
2.0 0
2.5 0
3.0 0
3.5 0
4.0 0
4.5 0
2015 2018E 2019 2020 2021
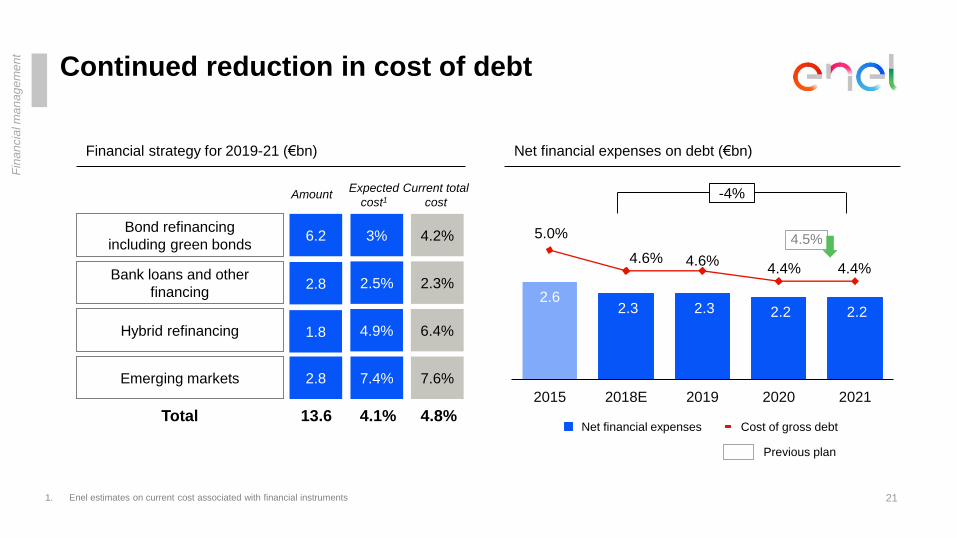
Continued reduction in cost of debt
21
Bond refinancing
including green bonds
Bank loans and other
financing
Hybrid refinancing
Financial strategy for 2019-21 (€bn)
6.2
2.8
1.8
2.62.3 2.3 2.2 2.2
5.0%
4.6% 4.6%4.4% 4.4%
2.5 0%
3.0 0%
3.5 0%
4.0 0%
4.5 0%
5.0 0%
0
0.5
1
1.5
2
2.5
3
3.5
4
2015 2018E 2019 2020 2021
Net financial expenses on debt (€bn)
-4%
Cost of gross debtNet financial expenses
4.5%
Total 13.6 4.8%
Amount
Emerging markets 2.8
4.2%
2.3%
6.4%
Current total
cost
7.6%
3%
2.5%
4.9%
7.4%
Expected
cost1
4.1%
Fin
an
cia
l ma
na
ge
me
nt
1. Enel estimates on current cost associated with financial instruments
Previous plan

2019-2021
Risk Management
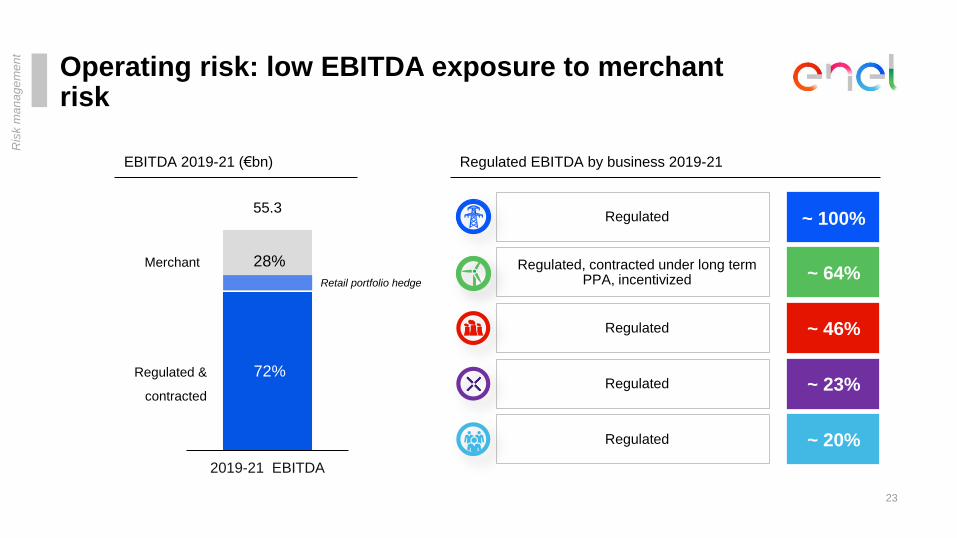
Operating risk: low EBITDA exposure to merchantrisk
72%
28%
0%
20%
40%
60%
80%
100 %
120 %
2019-21 EBITDA
23
Ris
k m
an
ag
em
en
t
Regulated &
contracted
Merchant
55.3
Regulated EBITDA by business 2019-21
~ 64%Regulated, contracted under long term
PPA, incentivized
~ 100%Regulated
~ 46%Regulated
~ 20%Regulated
~ 23%Regulated
EBITDA 2019-21 (€bn)
Retail portfolio hedge
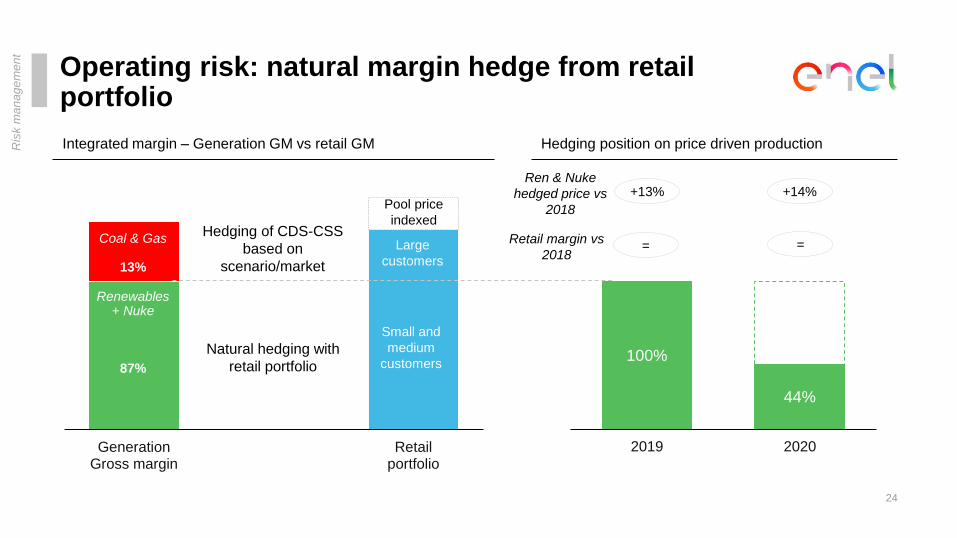
Operating risk: natural margin hedge from retail portfolio
24
Ris
k m
an
ag
em
en
t
100%
44%
0%
20%
40%
60%
80%
100 %
120 %
140 %
160 %
2019 2020
-
10.0
20.0
30.0
40.0
50.0
60.0
GenerationGross margin
A Retailportfolio
Renewables+ Nuke
87%
Coal & Gas
13%
Natural hedging with
retail portfolio
Hedging of CDS-CSS
based on
scenario/market
Integrated margin – Generation GM vs retail GM Hedging position on price driven production
Pool price
indexed
Small and
medium
customers
Large
customers
+13%Ren & Nuke
hedged price vs
2018
+14%
=Retail margin vs
2018=
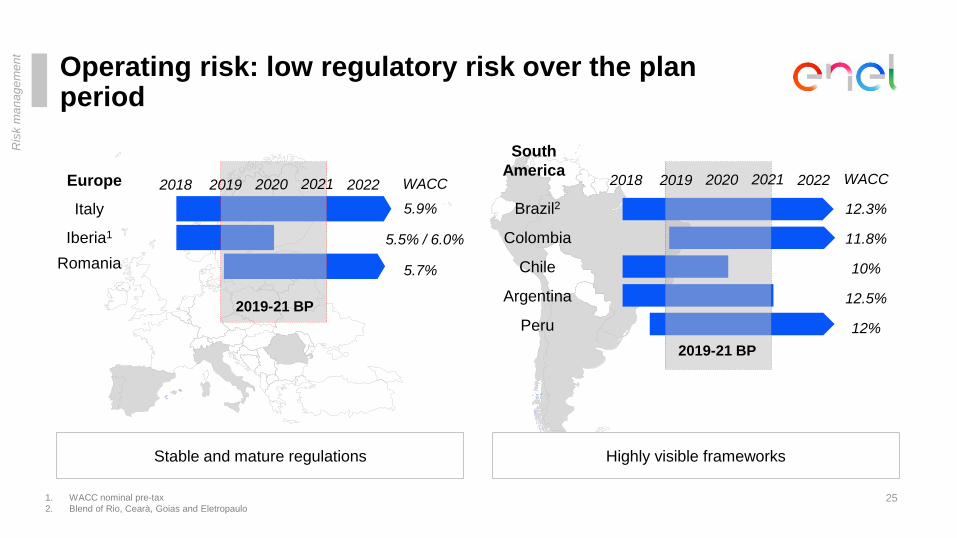
Operating risk: low regulatory risk over the plan period
25
Ris
k m
an
ag
em
en
t
1. WACC nominal pre-tax
2. Blend of Rio, Cearà, Goias and Eletropaulo
Highly visible frameworks
Argentina
Brazil2
Chile
Colombia
Peru
Italy
Iberia1
Romania
2019 2020 2021 20222018
2019-21 BP
South
America
2019-21 BP
Stable and mature regulations
WACC WACC
5.9%
5.5% / 6.0%
5.7%
12.3%
11.8%
10%
12.5%
12%
Europe 2019 2020 20222018 2021
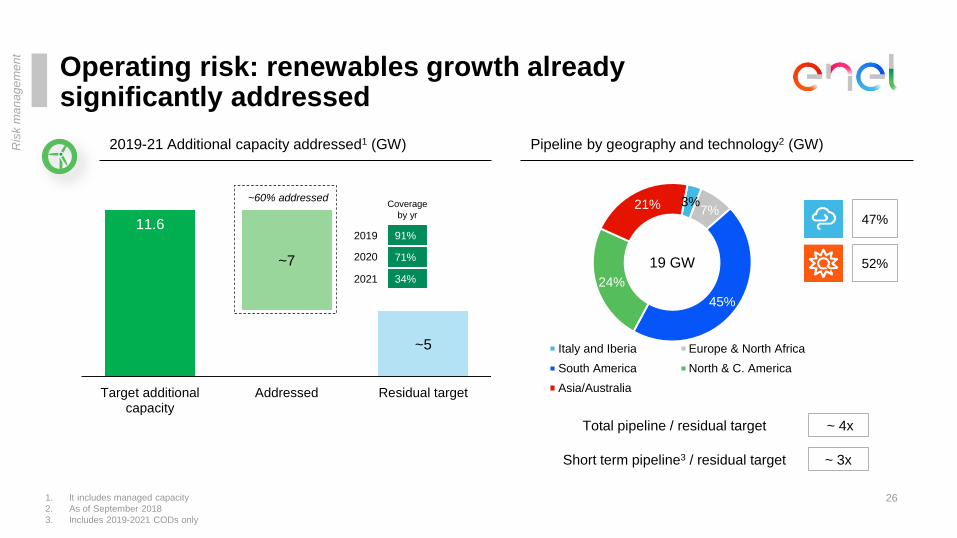
Operating risk: renewables growth alreadysignificantly addressed
26
Ris
k m
an
ag
em
en
t
1. It includes managed capacity
2. As of September 2018
3. Includes 2019-2021 CODs only
11.6
~7
~5
0.0
2.0
4.0
6.0
8.0
10.0
12.0
14.0
Target additionalcapacity
Addressed Residual target
2019-21 Additional capacity addressed1 (GW)
~60% addressed
Pipeline by geography and technology2 (GW)
3%7%
45%
24%
21%
Italy and Iberia Europe & North Africa
South America North & C. America
Asia/Australia
47%
52%19 GW
Total pipeline / residual target
~ 3x
~ 4x
Short term pipeline3 / residual target
2019
2020
2021
Coverage
by yr
91%
71%
34%
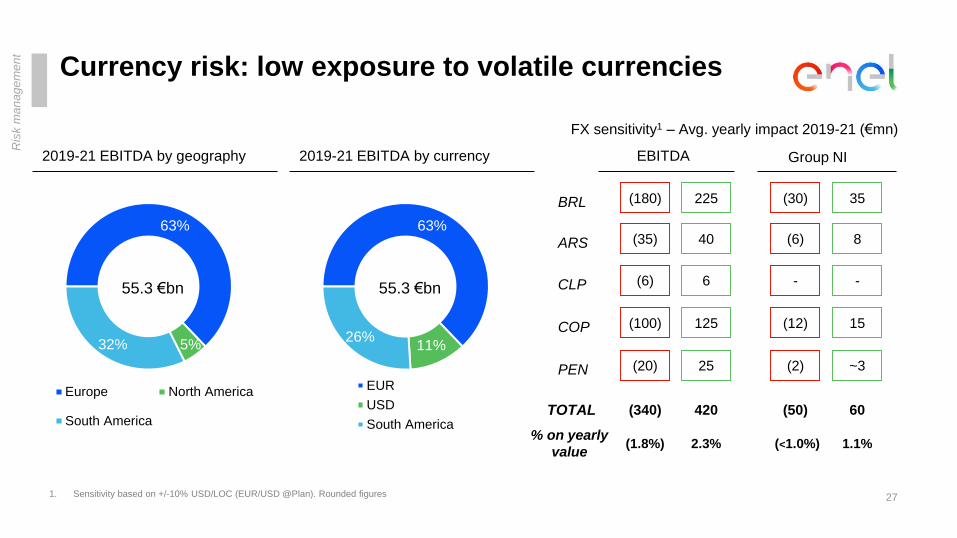
Currency risk: low exposure to volatile currencies
63%
5%32%
Europe North America
South America
2019-21 EBITDA by currency
55.3 €bn
2019-21 EBITDA by geography
63%
11%26%
EUR
USD
South America
55.3 €bn
27
Ris
k m
an
ag
em
en
t
FX sensitivity1 – Avg. yearly impact 2019-21 (€mn)
1. Sensitivity based on +/-10% USD/LOC (EUR/USD @Plan). Rounded figures
(180) 225
(35) 40
(6) 6
(100) 125
(20) 25
BRL
ARS
CLP
COP
PEN
(30) 35
(6) 8
- -
(12) 15
(2) ~3
Group NIEBITDA
(340) 420 TOTAL (50) 60
(1.8%) 2.3% % on yearly
value(<1.0%) 1.1%
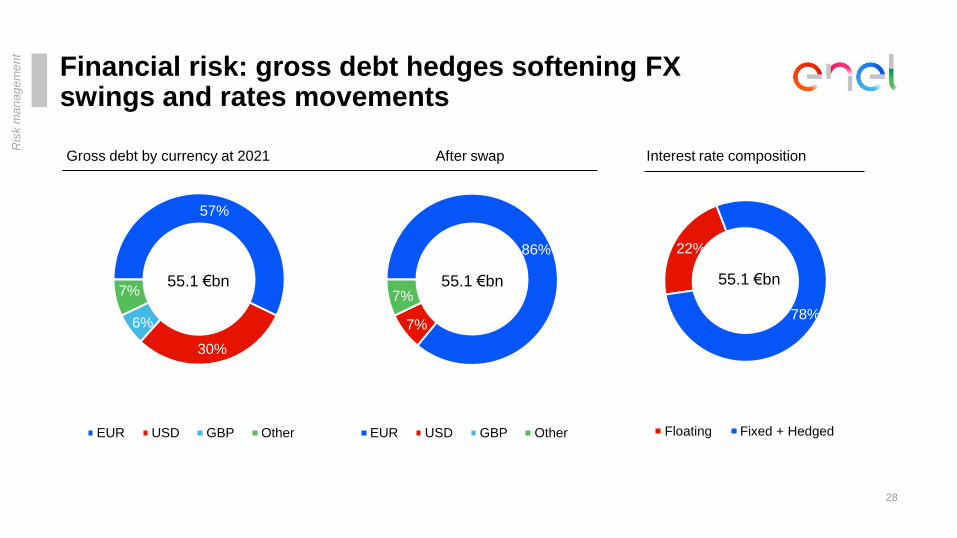
22%
78%
Floating Fixed + Hedged
55.1 €bn
57%
30%
6%
7%
EUR USD GBP Other
Financial risk: gross debt hedges softening FX swings and rates movements
28
Ris
k m
an
ag
em
en
t
86%
7%
7%
EUR USD GBP Other
55.1 €bn55.1 €bn
Gross debt by currency at 2021 After swap Interest rate composition
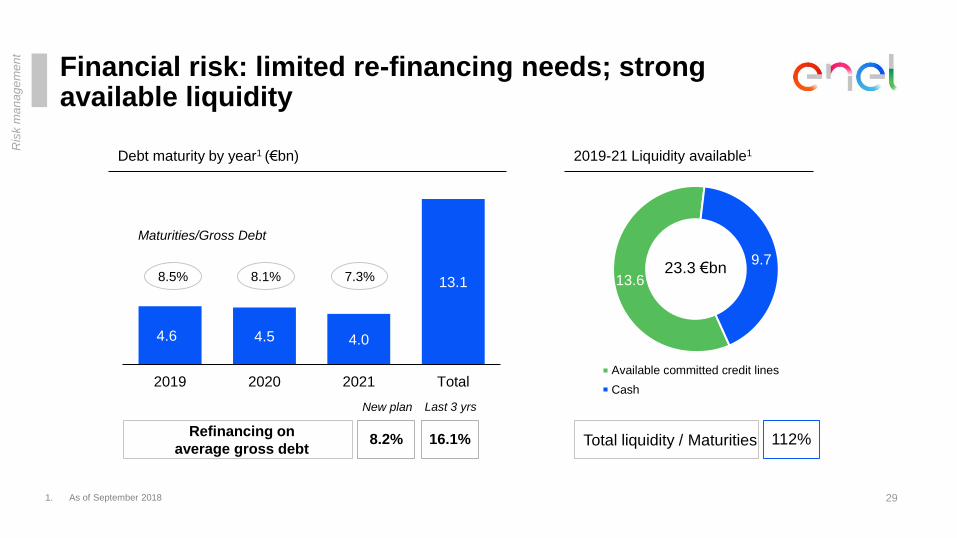
Financial risk: limited re-financing needs; strong available liquidity
13.6
9.7
Available committed credit lines
Cash
23.3 €bn
2019-21 Liquidity available1
4.6 4.5 4.0
13.1
0.0
2.0
4.0
6.0
8.0
10.0
12.0
14.0
2019 2020 2021 Total
Debt maturity by year1 (€bn)
112%
1. As of September 2018
8.5% 8.1% 7.3%
Maturities/Gross Debt
Ris
k m
an
ag
em
en
t
Refinancing on
average gross debtTotal liquidity / Maturities
29
New plan Last 3 yrs
8.2% 16.1%

2019-2021
Earnings & Targets
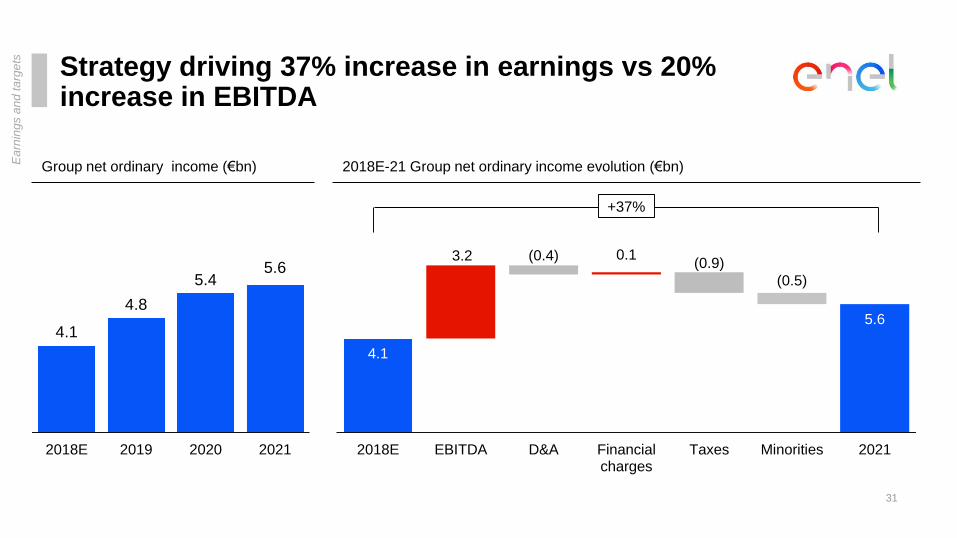
Strategy driving 37% increase in earnings vs 20% increase in EBITDA
31
5.65.4
4.8
4.1
2.0
2.5
3.0
3.5
4.0
4.5
5.0
5.5
6.0
6.5
7.0
2021202020192018E
Group net ordinary income (€bn) 2018E-21 Group net ordinary income evolution (€bn)
4.1
3.2 (0.4) 0.1(0.9)
(0.5)
5.6
0.0
1.0
2.0
3.0
4.0
5.0
6.0
7.0
8.0
9.0
2018E EBITDA D&A Financialcharges
Taxes Minorities 2021
+37%
Ea
rnin
gs a
nd
ta
rge
ts
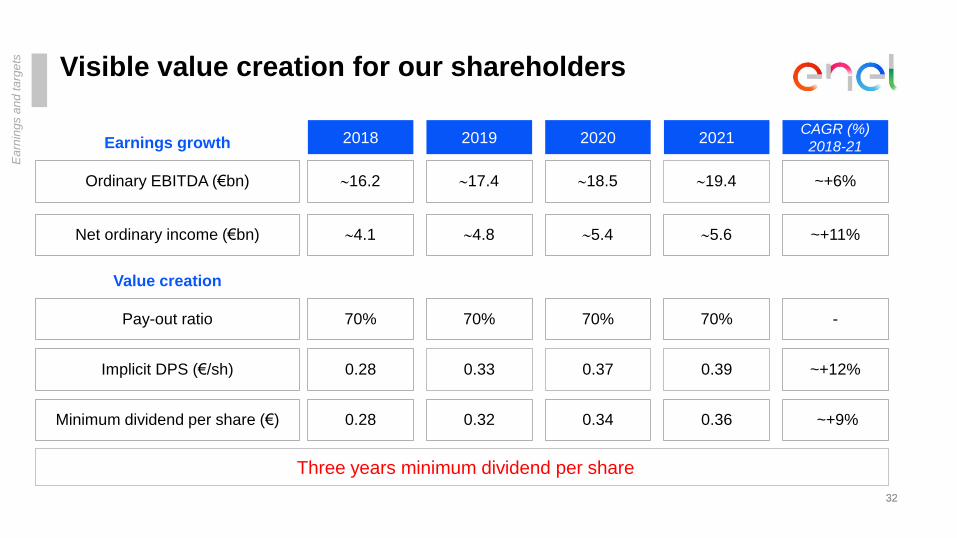
Visible value creation for our shareholders
3232
Net ordinary income (€bn)
Ordinary EBITDA (€bn)
4.1
16.2
2018
4.8
17.4
2019
~+11%
~+6%
CAGR (%)
2018-21
Implicit DPS (€/sh) 0.28 0.33 ~+12%
5.4
18.5
2020
0.37
5.6
19.4
2021
0.39
Pay-out ratio 70% 70% -70% 70%
Minimum dividend per share (€) 0.28 0.32 ~+9%0.34 0.36
Earnings growth
Value creation
Ea
rnin
gs a
nd
ta
rge
ts
Three years minimum dividend per share