Embed Size (px)
Citation preview

1
Capital Budgeting in Global
Markets
Fall 2013
Stephen Sapp
Yes, our chief analyst is recommending further investments in the new year.

2
Introduction
• Capital budgeting is the process of determining which
investments are worth pursuing.
• Firms (and individuals) frequently want to diversify their
operations (investments). This can be across asset types
(bonds and equities), industries and countries.
• What firm and industry characteristics do we look for in “investments”
across different countries? What country characteristics do we look for?
• Which characteristics influence how we value these “projects”?
• What are the implications if global financial markets are “coupled”? If
they have become “de-coupled”?
How to Value Assets - Theory
“The concept of future prospects and particularly of continued growth in the future invites the application of formulas out of higher mathematics to establish the present value of the favored issue. But the combination of precise formulas with highly imprecise assumptions can be used to establish, or rather justify, practically any value one wishes, however high, for a really outstanding issue.”
Benjamin Graham
• What does this mean?
• How does this influence our decision-making process?
• We should use several perspectives to value any investment.
• This allows us to benefit from their strengths and weaknesses.
• These should be acknowledged and leveraged.

3
How to Value Assets?
• Why do we try to put a value on assets?
• For assets we may want to buy: global M&A, or investments
• What would we pay? What value would these assets provide to us?
• For assets we own (and may want to sell?): What are they worth to
us? To others in the market? On our balance sheet?
• What is “fair market value”? What is marking-to-market? What is
marking-to-model? Does it matter?
• Need to understand the strengths and weaknesses
of the different ways to value assets.
• Why are we doing the valuation?
• What special internal and external factors should we
consider?
Valuation Techniques: Review
• Discounted cash flow (DCF) approaches:
• Dividend discount models (DDM’s)
• Free cash flow models (FCF’s)
• Relative / multiples valuation approaches:
• Determine market value of a firm based on financial ratios or other
characteristics of comparable firms.
• Value based on “similar” transactions.
• Valuation of separate parts / Break-up value
• Determine the value of all “subsidiaries” separately and add
together.

4
Valuing Cross-Border Investments
• One of the most common and intuitive ways to value a project is by discounting the future expected cashflows generated by the “project”.
• We can generally forecast cashflows from a “project”.
• Comparable transactions are not always available to do a relative valuation, especially in emerging markets.
• Similar to the DCF analysis from the first Finance course.
• Internationally, there are some extra considerations:
• Choice of currency for the FCF’s
• Choice of country/investor for cost of capital (discount rate)
• Incorporation of special international risks: political risk, etc.
• Option value of setting up a project in a different country
Cost of Capital
• The minimum rate of return on the capital investment required for the investor to undertake the “project”:
• the expected return that is just sufficient to compensate all investors for the risk of the project.
• sometimes referred to as the required rate of return or the hurdle rate.
• The basic principle is:
• any project that can provide an expected return greater than the cost of capital required by its investors should be undertaken.
• any positive NPV project should be undertaken.

5
Some Preliminary Issues
• The true cost of capital cannot be observed directly
• It is frequently estimated by analyzing the required returns on
publicly traded financial securities for firms or projects with “similar
risk characteristics”.
• The estimated cost of capital should make sense!
– Investors require higher returns on assets whose cash flow
generating ability is more uncertain.
– It is a long-run characteristic. It should be relatively stable over
time.
– Only include compensation for risks consistently faced by the firm.
Other factors should influence expected cashflow estimates.
• What about country and political risk? (i.e., China? Russia? US?)
Relationship between Risk and
Return
Required or
Expected
Rate of Return
Risk premium
Risk Free Rate

6
Local versus Foreign Cost of
Capital?
• It appears logical to use the local cost of capital (the cost
of capital for the market of the project or the location of
the investment being considered).
• A French cost of capital for a project located in France.
• The key question is: who are the investors supplying the
capital and what are the returns that they require on the
capital they are providing?
• The cost of capital should be calculated using the required returns
for the actual suppliers of capital (both debt and equity) for
projects with the same level of risk.
Weighted Average Cost of Capital
(WACC)
• What is the cost of capital for all of a firm’s investors?
• Since the government “pays” part of the interest expense,
the after-tax cost of capital is:
kc = (D/V ) * kd * (1-t) + (E/V ) * ke
kd = cost of debt D = value of debt
ke = cost of equity E = value of equity
kc = overall cost of capital Value of firm = D + E
t = firm’s marginal tax rate

7
Capital Structure: Local vs Global?
• Localized capital structures are better because:
• Address criticisms that the foreign affiliate is insensitive to local market conditions.
• Helps management evaluate performance relative to other firms in the same market.
• Forces the local operations to allocate capital efficiently by not insulating them from local forces.
• Localized capital structures are worse because:
• Loss of their competitive advantage from their better access to global capital markets.
• Diversity in capital structure across countries makes it harder to interpret consolidated financial statements.
• The affiliate’s debt ratio would not reflect true default risk due to the guarantees it has from the parent.
What Do We Do?
• The target capital structure we start with is the mix of
financing (in market values) the “project” would maintain
as a “stand alone” entity.
• May need local comparables or even comparables from another
country to determine this.
• Its actual capital structure may deviate from this for tax
purposes, to deal with political or other types of risk or
opportunities.
• Expected after-tax effects of the actual capital structure should be
incorporated into the expected cashflows to the parent.

8
Cost of Debt (kd)
• Match with the term of projects (generally long-term).
• Use current rates (what the firm would pay today) as opposed to past interest rates:
• If the corresponding corporate rates can not be found, take government rates and add a risk “premium” based on:
• historic spread or premium for issuer
• spread required given the bond rating, if available
• Given current events: What risks does the bond rating capture? What risks does it not consider?
• Tax shield
• depends on the countries involved and tax treaties.
• usually use the highest marginal tax rate to be conservative.
Cost of Equity (ke)
Problem: we cannot observe current required equity returns directly.
• We can only observe current equity prices and past equity returns.
• This is an even greater problem in the international environment, because market data may not be readily available and/or reliable.
Two Basic Approaches: 1. Estimate the expected (internal rate of) return to owning the
company’s stock using the dividend discount model (DDM).
2. Estimate the market’s required return on the firm’s equity using a risk pricing model such as the CAPM.
• Note: in an efficient market the required and expected returns should be the same.

9
Cost of Equity: The CAPM Approach
• The return the firm’s equity investors require based on the level of risk they face by owning this investment relative to having a comparable position in the most relevant market index.
• The CAPM relates the cost of equity for an individual asset to that asset’s “beta”. Formally:
ke = rf + bE(rm - rf)
where:
ke = required rate of return on equity
rf = risk-free rate
b = beta of stock (risk relative to market)
E(rm - rf) = expected market risk premium
CAPM: Graphically
Required or
Expected Risk Premium,
Rate of Return, E(ri) bi(E(rm) - rf )
Risk Free Rate, rf
Risk, bi
Slope = (E(rm) - rf )

10
How Is Beta Measured or Estimated?
• Regression of observed excess returns for security i, ri,t -rf,t, against the excess return on a market index, rm,t - rf,t, also referred to as the Market Risk Premium (MRP):
(ri,t -rf,t) = ai + bi(MRPt) + i,t
where bi is the slope or regression coefficient, and
ai is the intercept that represents the sample
“abnormal” return. (Why do people seek “alpha”?)
• The R2 from the regression is an indication of the degree of correlation between the market and the asset.
• This can be done using Excel or another statistical program. Bloomberg and other commercial providers do this automatically.
The CAPM: Inputs and Outputs
• b - beta
• Beta for an asset of similar risk to the market portfolio = 1.0. Typical range of betas: 0.5 - 2.0
• If you cannot measure this for a firm, use the beta of comparable firms. Be consistent with capital structure assumptions - may need to unlever / relever the beta.
• rf - risk free rate
• Current yield on intermediate or long-term government bonds (What does this capture?)
• E(rm - rf) - expected market risk premium • Historic average of difference between the return on the market (e.g.
S&P500, S&P/TSX, Hang Seng) and long-term government bonds
• 4-6% for most developed countries if no better data available (what about for less-developed countries?)

11
Which Cashflows to Forecast?
• Usually easier to forecast FCF’s in the local currency • Takes local market conditions into consideration (e.g. inflation,
regulation, etc.)
• Cashflows earned abroad may be hard to repatriate. • Regardless of when the earnings will be repatriated, we should use
earned cashflows since these funds can be re-invested.
• An “as is” valuation uses existing market prices and the cash in and outflows for the stand alone firm. • Ultimately, however, we are interested in the value of the “project” to
the firm with transfer pricing, royalties, subsidies, taxes etc.
• At the end of the process, we should perform sensitivity analyses on economic risks, political risks, learning and the impact of other international risks/opportunities on cashflows.
Cashflows and Cost of Capital
The two are not independent choices.
• The appropriate discount rate can be either:
• A domestic currency rate if expected future cashflows are in the domestic
currency, or
• A foreign currency rate if expected future cashflows are converted into the
foreign currency.
• Choice of currency depends on the ability to accurately
forecast the total cashflows.
• Generally better to use the foreign currency because it is easier to
explicitly include forecasted inflation, exchange rates, etc. in these
estimates.
• Be clear and consistent!

12
Converting Cost of Capital
• What do we do if we can not compute the costs of capital in the required markets? (i.e., if the equity and/or bond markets are under-developed or there are no local comparables)
• We can convert estimates made in our home market to
approximate the foreign values.
• For example, a French WACC (or cost of debt or cost of equity) can be converted to a Canadian WACC (or vice-versa) using interest rate parity:
(1 + kCanada) = (1 + kFrance)·{(1 + rCanada)/(1 + rFrance)}
• Intuition: if Canada or the Canadian dollar is riskier than France or the Euro, the interest rates should be higher in Canada so the cost
of capital in Canada will be higher than in France.
Free Cash Flows to the Firm (FCF)
• What exactly are these cashflows?
• FCFs represent cash flows upon which all stakeholders have a
claim. They are the cashflows we expect to have generated by the
assets of the firm in the future.
• Basically, free cash flows to the firm equal:
FCF = EBIT (1 - tax rate) + Depreciation and Amortization
- Capital Expenditures
- Increase in Working Capital

13
Forecasting Free Cashflows
• The value of the assets is the net present value (NPV) of all of
the expected future operating free cash flows (actually EV).
• Once we have forecasts for these, they are discounted at the
firm’s cost of capital:
• If the growth rate is constant into the future (i.e., terminal
value):
• Or combination of the two: forecast period and terminal value.
NPV = FCF1 + FCF2 + ....
1+kc (1+kc)2
NPV = FCF1
kc - g
NPV for FCF in Different Currencies
• Suppose we are considering a firm with a sequence
of forecasted free cash flows to the firm (revenues) in
Yen:
FCF1, FCF2, FCF3,…, FCFn in Yen.
• What is the present value of this cash stream in
Canadian dollars?

14
Method 1:
• Discount the yen cash flows using the yen discount
rate.
• This gives us a present value in yen.
• Convert the result into today’s dollars using the spot
dollar/yen exchange rate.
NPV = S[FCF1/(1+kc,Yen) + FCF2/(1+ kc,Yen)2 +
…+ FCFn/(1+ kc,Yen) n]
PV in Yen
Method 2:
• Use forward contracts (interest rate parity) to determine
the expected future dollar/yen exchange rate at each
point in time at which the cash flows are received.
• Compute the present value of the “hedged into dollars”
cash flows using the dollar discount rate.
NPV = [F1×FCF1]/(1+ kc,CAD) + [F2×FCF2]/(1+ kc,CAD)2 +
…
+ [Fn×FCFn]/(1+ kc,CAD) n
FCF in $
15
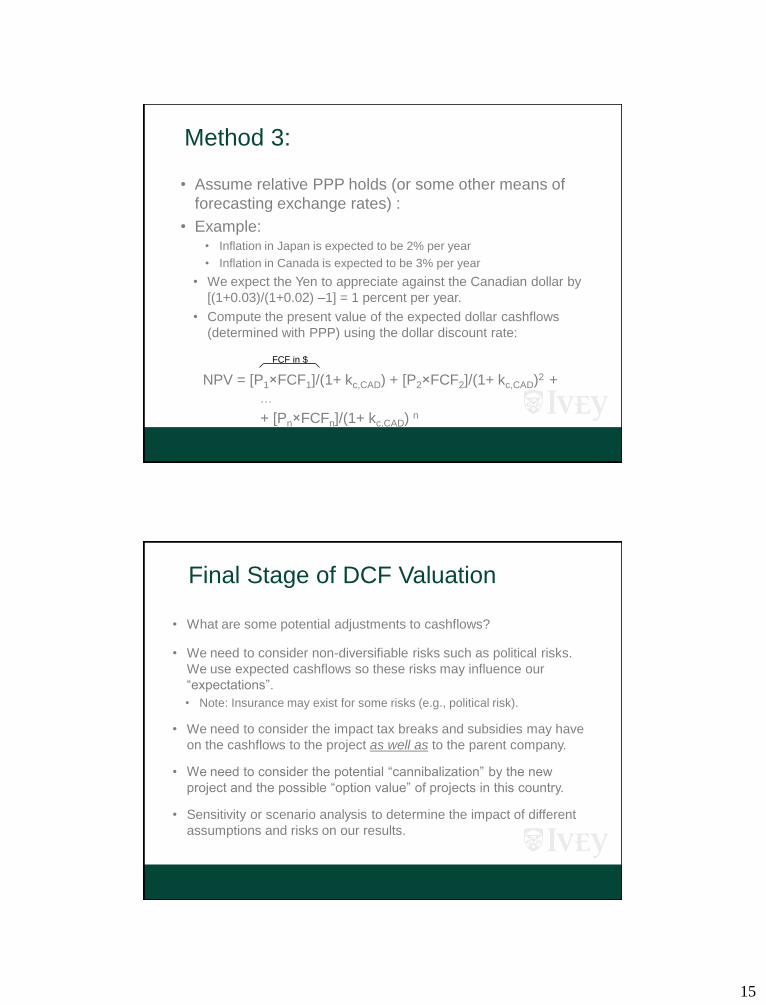
Method 3:
• Assume relative PPP holds (or some other means of
forecasting exchange rates) :
• Example: • Inflation in Japan is expected to be 2% per year
• Inflation in Canada is expected to be 3% per year
• We expect the Yen to appreciate against the Canadian dollar by
[(1+0.03)/(1+0.02) –1] = 1 percent per year.
• Compute the present value of the expected dollar cashflows
(determined with PPP) using the dollar discount rate:
NPV = [P1×FCF1]/(1+ kc,CAD) + [P2×FCF2]/(1+ kc,CAD)2 +
…
+ [Pn×FCFn]/(1+ kc,CAD) n
FCF in $
Final Stage of DCF Valuation
• What are some potential adjustments to cashflows?
• We need to consider non-diversifiable risks such as political risks.
We use expected cashflows so these risks may influence our
“expectations”.
• Note: Insurance may exist for some risks (e.g., political risk).
• We need to consider the impact tax breaks and subsidies may have
on the cashflows to the project as well as to the parent company.
• We need to consider the potential “cannibalization” by the new
project and the possible “option value” of projects in this country.
• Sensitivity or scenario analysis to determine the impact of different
assumptions and risks on our results.

16
Relative Valuation Approaches
• Expected value of the equity of a company (on a per share basis) is equal to P/E multiple times expected earnings:
P0 = “P/E multiple” x EPS1
• This multiple usually comes from “comparable” firms or
is based on “comparable” transactions. • Preferably within the same country or a country with similar
characteristics.
• Different countries value assets differently and have different accounting standards.
Valuation Approaches
• What We Learned From Twitter’s IPO: The Value of Innovation Is at an All-Time High (BusinessWeek November 18, 2013)
• Wall Street investors spoke loud and clear when they made Twitter (TWTR) one of the most valuable companies in the world at a $24.9 billion valuation. Twitter has only $500 million in revenue, no major physical assets, and no profit. Its staggering valuation is based on one thing: a great innovation that is changing the way the world communicates.
• The initial public offerings of Twitter and others recently demonstrate that we have officially entered the “ideas economy,” where innovative ideas are more valuable than physical assets or existing cash flow.
• While some may argue this is another bubble like the dot.com bust at the turn of this century, it is actually part of a longer-term trend that is valuing innovation at increasingly higher rates. … When it became evident that Apple was unlikely to continue to launch new blockbuster devices at its historic pace, the company lost $200 billion in value, even though Apple continued to increase its revenue.
• Historically, company values have been based on such solid metrics as past revenue, profit, and physical assets, … innovation is a wild card that trumps everything else, and it is making these old metrics obsolete. … Innovation is increasing in value partly because it is becoming easier to convert to higher sales (and therefore future profits).

17
Relative Valuation Approaches
• Facebook road show could be a tough sell for world’s biggest tech IPO (Globe and Mail May 6, 2012)
• Facebook Inc. has put a price tag on itself of as much as $96-billion
(U.S.), and this week senior executives will take to the road to pitch
investors on the biggest technology IPO ever.
• The eight-year-old company is targeting an initial share price
between $28 and $35, which translates into a valuation of between
$77-billion and $96-billion.
• Facebook will try to convince investors that its shares are worth almost 100 times earnings, tapping bullish sentiment that sees an almost unparalleled growth trajectory for the world’s largest social networking community that is already one of the most popular destinations on the Internet.
Valuation: The Process
Stand-
alone
target
value
Value
of
target
with
syner-
gies
Value
of synergy
and other
gains to
bidder Transaction
Costs
Min.
bid
Max.
Bid
18
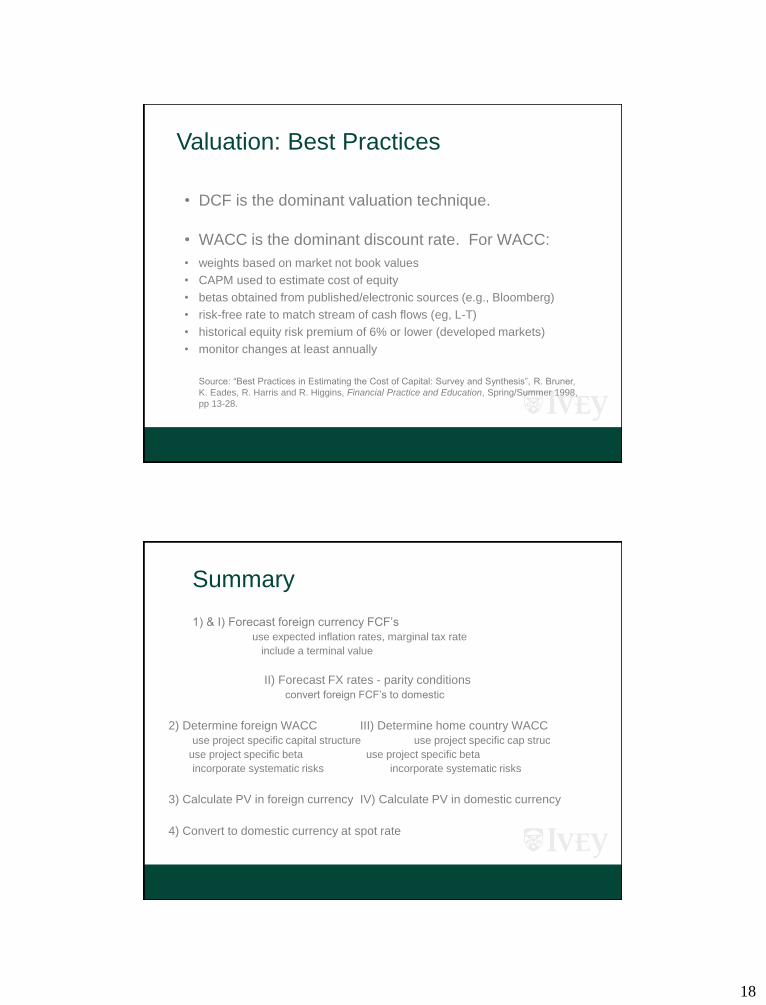
Valuation: Best Practices
• DCF is the dominant valuation technique.
• WACC is the dominant discount rate. For WACC:
• weights based on market not book values
• CAPM used to estimate cost of equity
• betas obtained from published/electronic sources (e.g., Bloomberg)
• risk-free rate to match stream of cash flows (eg, L-T)
• historical equity risk premium of 6% or lower (developed markets)
• monitor changes at least annually
Source: “Best Practices in Estimating the Cost of Capital: Survey and Synthesis”, R. Bruner,
K. Eades, R. Harris and R. Higgins, Financial Practice and Education, Spring/Summer 1998,
pp 13-28.
Summary
1) & I) Forecast foreign currency FCF’s
use expected inflation rates, marginal tax rate
include a terminal value
II) Forecast FX rates - parity conditions
convert foreign FCF’s to domestic
2) Determine foreign WACC III) Determine home country WACC
use project specific capital structure use project specific cap struc
use project specific beta use project specific beta
incorporate systematic risks incorporate systematic risks
3) Calculate PV in foreign currency IV) Calculate PV in domestic currency
4) Convert to domestic currency at spot rate