Embed Size (px)
Citation preview

Capacity Management, Congestion and Demand Management
Airport Planning and Management
Module 12
March 2015
Istanbul Technical University
Air Transportation Management
M.Sc. Program
Prof. Amedeo Odoni

Page 2
Objective and Topics
Objective:
– To summarize fundamental concepts regarding (a) the management of airport capacity and demand and (b) the relationship between capacity, demand and delays
Topics:
– Demand variability at major airports
– Capacity of airfield (runways, taxiways, aprons)
– Capacity of landside elements
– Measures of delay; the relationships that generate delay
– Current approach to demand management
– Market-based approaches to demand management

Page 3
OutlineVariability of Demand
Airside Capacity and Its Variability
– Runway Systems
– Taxiways and Aprons
– Passenger Terminals
Delays
– Proper Measurement
– Non-linearity
– Landside vs. Airside
Demand Management: Schedule Coordination
Demand Management: Market-Based Schemes
Page 4
OutlineVariability of Demand
Airside Capacity and Its Variability
– Runway Systems
– Taxiways and Aprons
– Passenger Terminals
Delays
– Proper Measurement
– Non-linearity
– Landside vs. Airside
Demand Management: Schedule Coordination
Demand Management: Market-Based Schemes

Airport Capacity Management: General Framework
Capacity management refers to the steps that an airport
must take in order to offer sufficient capacity to match
demand and provide an adequate Level of Service (LOS)
Demand management refers to interventions aimed at
modifying demand; such interventions may be necessary if
available capacity is not sufficient to ensure adequate LOS
To provide and manage capacity, it is necessary to
understand well the characteristics of both demand and
capacity on both airside and landside
The issues and the measures of LOS on airside and on
landside are quite different; will be considered separately Page 5
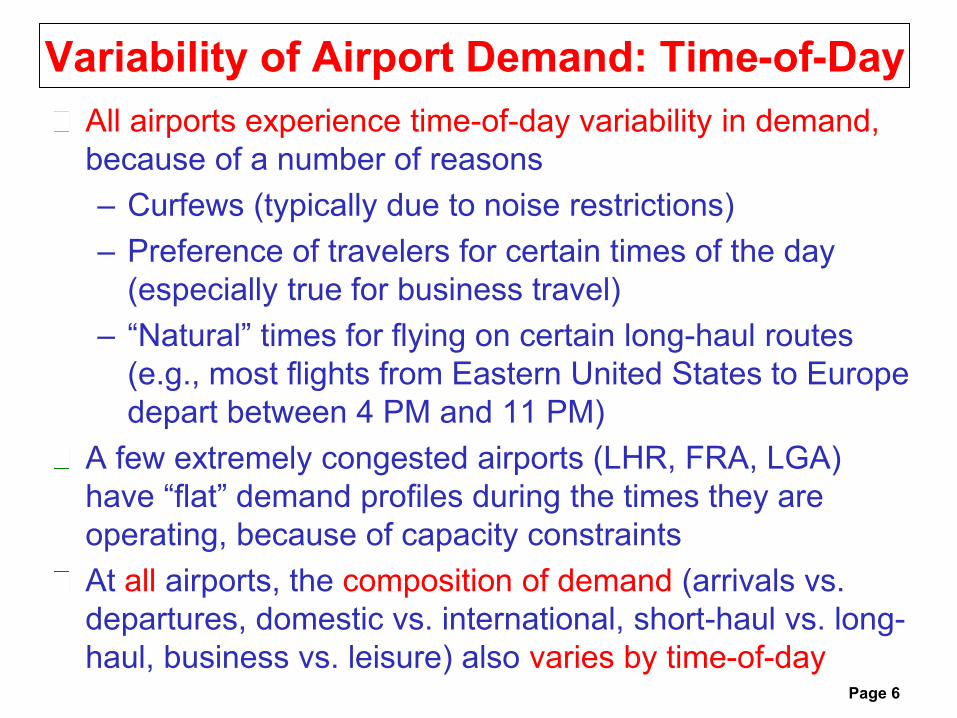
Variability of Airport Demand: Time-of-Day
All airports experience time-of-day variability in demand,
because of a number of reasons
– Curfews (typically due to noise restrictions)
– Preference of travelers for certain times of the day
(especially true for business travel)
– “Natural” times for flying on certain long-haul routes
(e.g., most flights from Eastern United States to Europe
depart between 4 PM and 11 PM)
A few extremely congested airports (LHR, FRA, LGA)
have “flat” demand profiles during the times they are
operating, because of capacity constraints
At all airports, the composition of demand (arrivals vs.
departures, domestic vs. international, short-haul vs. long-
haul, business vs. leisure) also varies by time-of-dayPage 6

0
10
20
30
40
50
60
70
1 2 3 4 5 6 7 8 9 10 11 12 13 14 15 16 17 18 19 20 21 22 23 24
IST Total Demand: 2013 vs. 2011
Total: 2011: 950 movts; 2013: 1151 movts (+21%) [LHR=1350]
Peak hour: 2011: 65 movts; 2013: 64 movts (-1%)
Peaking factor for the day (2013):
64/1151= 0.056 or 5.6%

0
5
10
15
20
25
30
35
1 2 3 4 5 6 7 8 9 10 11 12 13 14 15 16 17 18 19 20 21 22 23 24
IST Arrivals Demand: 2013 vs. 2011
Totals: 2011: 461 arrs; 2013: 572 arrs (+24%)
Peak hour: 2011: 33 arrs; 2013: 33 arrs (0%)
Peaking factor for the day (2013):
33/572= 0.058 or 5.8%

0
5
10
15
20
25
30
35
40
45
1 2 3 4 5 6 7 8 9 10 11 12 13 14 15 16 17 18 19 20 21 22 23 24
IST Departures Demand: 2013 vs. 2011
Totals: 2011: 489 deps; 2013: 579 deps (+18%)
Peak hour: 2011: 42 deps; 2013: 36 deps (-14%)
Peaking factor for the day (2013):
36/579= 0.062 or 6.2%

NY JFK: Scheduled Movements per 15 Minutes
Page 10

NY JFK: Scheduled Movements per 15 Minutes
Page 11

NY LaGuardia (LGA): Scheduled Movements per 15
Minutes
Page 12

Variability of Airport DemandSignificant variability in demand may also exist with
respect to:
– Day of the week (e.g., in the US Saturday is the
lowest day, Sunday is second lowest, while
weekdays are similar to one another and have the
highest demand)
– Month and season (e.g., summer vs. winter, high
and low months, influence of religious or other
holidays)
– Special events (e.g., sports, expos, etc.)
Peaking patterns and demand variability can be
very consistent at airports over many yearsPage 13
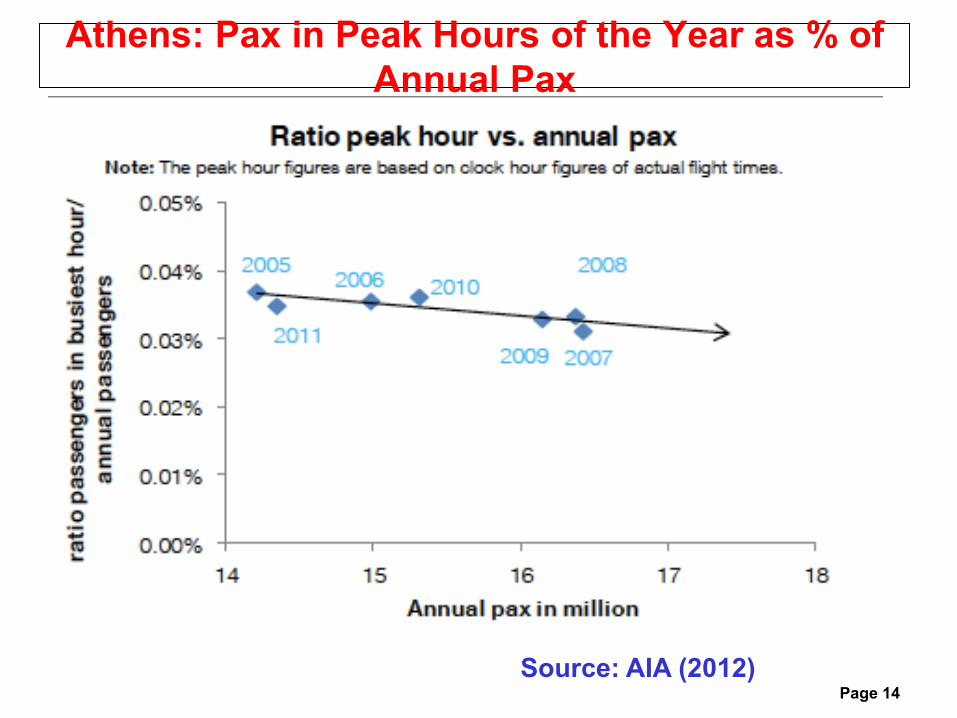
Athens: Pax in Peak Hours of the Year as % of
Annual Pax
Page 14
Source: AIA (2012)

Daily Demand Profile: Newark Aircraft Movements
Page 15

Daily Demand Profile: Newark Aircraft Movements
(% of Daily Movements)
Page 16

Stability of Monthly Patterns: Total Movements
at the 3 New York Airports
Page 17

Stability of Monthly Patterns: No. of Passengers at NY JFK
Page 18

Monthly Pax and Movements: Athens, 2008-2012
Page 19
Source: AIA (2012)

Detailed RecordsVery important: Airport operators should
– Collect and maintain detailed historical records
of operations
– Perform statistical analyses with the data
– Perform data mining to identify significant
patterns and trends
Large databases developed by air navigation
service providers (ANSP) and airlines are
becoming increasingly common
– often available to airport operators and
sometimes to researchers or the general
publicPage 20

Page 21
OutlineVariability of Demand
Airside Capacity and Its Variability
– Runway Systems
– Taxiways and Aprons
– Passenger Terminals
Delays
– Proper Measurement
– Non-linearity
– Landside vs. Airside
Demand Management: Schedule Coordination
Demand Management: Market-Based Schemes

Capacity: An Important Initial Point
Airside capacities can be computed with
reasonable accuracy because of the presence of
well-defined “rules of the road” (separation
requirements, single occupancies, etc.)
Landside capacities are much less well-defined
because they depend on what Level of Service
(LOS) one is willing to accept, behavioral
characteristics, physical layout of facilities, etc.
Implications about validity of comparisons across
airportsPage 22

The Principal Bottleneck
The runway systems of the world’s busiest airports
act usually as the principal bottlenecks of the air
transport system’s infrastructure
While other components of infrastructure may
also occasionally act as bottlenecks, the capacity
of runway systems is the most “resistant to
expansion”
Runway Final Approach PathApproach Gate
Holding Stack
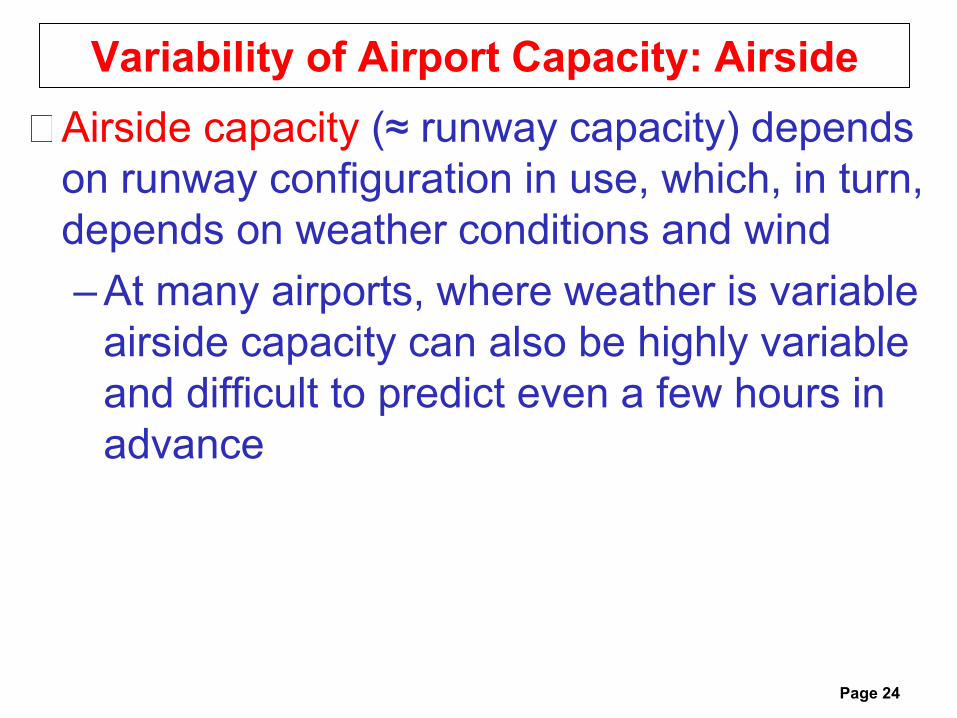
Variability of Airport Capacity: Airside
Airside capacity (≈ runway capacity) depends
on runway configuration in use, which, in turn,
depends on weather conditions and wind
– At many airports, where weather is variable
airside capacity can also be highly variable
and difficult to predict even a few hours in
advance
Page 24
Page 25
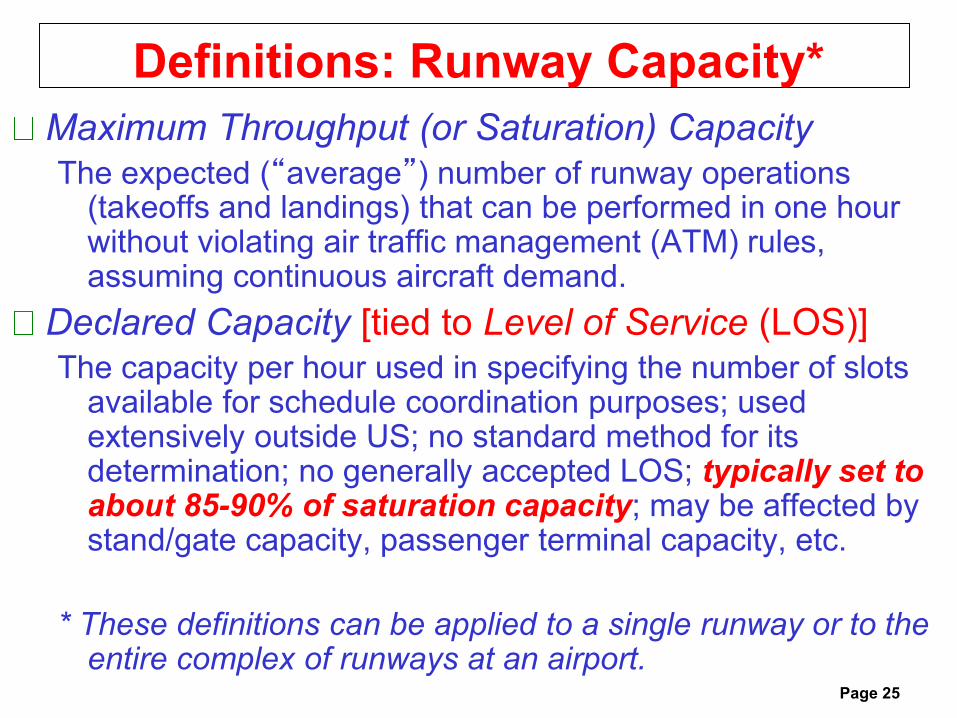
Definitions: Runway Capacity*
Maximum Throughput (or Saturation) Capacity
The expected (“average”) number of runway operations (takeoffs and landings) that can be performed in one hour without violating air traffic management (ATM) rules, assuming continuous aircraft demand.
Declared Capacity [tied to Level of Service (LOS)]The capacity per hour used in specifying the number of slots
available for schedule coordination purposes; used extensively outside US; no standard method for its determination; no generally accepted LOS; typically set to about 85-90% of saturation capacity; may be affected by stand/gate capacity, passenger terminal capacity, etc.
* These definitions can be applied to a single runway or to the entire complex of runways at an airport.

Page 26
Factors Affecting Runway Capacity
Number and layout of
active runways
Separation
requirements
(longitudinal, lateral)
Weather (ceiling,
visibility)
Wind (direction,
strength)
Mix of aircraft
Mix and sequencing
of operations
(landings, takeoffs,
mixed)
Quality and
performance of ATM
system (including
human factor -- pilots
and controllers)
Runway exit locations
Noise considerations

Page 27
Role of ATM Separation Requirements
Runway (and airfield) capacities are constrained by ATM
separation requirements
Typically aircraft are separated into a small number (4 or 5)
of classes according to their maximum takeoff weight
(MTOW)
Example: ICAO classification
– Super Heavy (SH): Airbus 380 [560 tons], Boeing 747-8
– Heavy (H): 136 tons ≤ MTOW [and <SH]
– Medium (M): 7 tons ≤ MTOW < 136 tons
– Light (L): MTOW < 7 tons
Required separations (in time or in distance) are then
specified for every possible pair of aircraft classes and
operation types (landing or takeoff)
Example: “arrival of H followed by arrival of M requires 5
nautical miles of separation on final approach”

Page 28
Aircraft Classes for Terminal Area ATM Purposes
“Super Heavy”: A380 (560 tons), B747-8 (448 tons)

Page 29
ICAO Recommended Separations*: Arrival -
Arrival
* Separations shown in n. miles (1 n.mile =1.852 km)
• In addition, the leading aircraft in each pair must be
safely out of the runway before the trailing aircraft can
touch down on the runway

Page 30
ICAO Recommended Separations*:
Departure - Departure
* Approximate separations in seconds (vary
according to national practices)

Numerical Example: Inputs
Page 31
Aircraft Characteristics
Type Mix (%) Approach
Speed
(knots)
Runway
Occupancy
Times (sec)
Heavy (1) 20 140 60
Medium (2) 50 120 55
Light (3) 30 100 50
Single Runway;
Arrivals only
Length of Final
Approach
= 5 n. miles
Trailing Aircraft
Leading
Aircraft
1 2 3
1 4 n.m. 5 n.m. 6 n.m.
2 3 n. m. 3 n.m. 4 n.m.
3 3 n.m. 3 n.m. 3 n.m.
Separation Requirements
Page 32
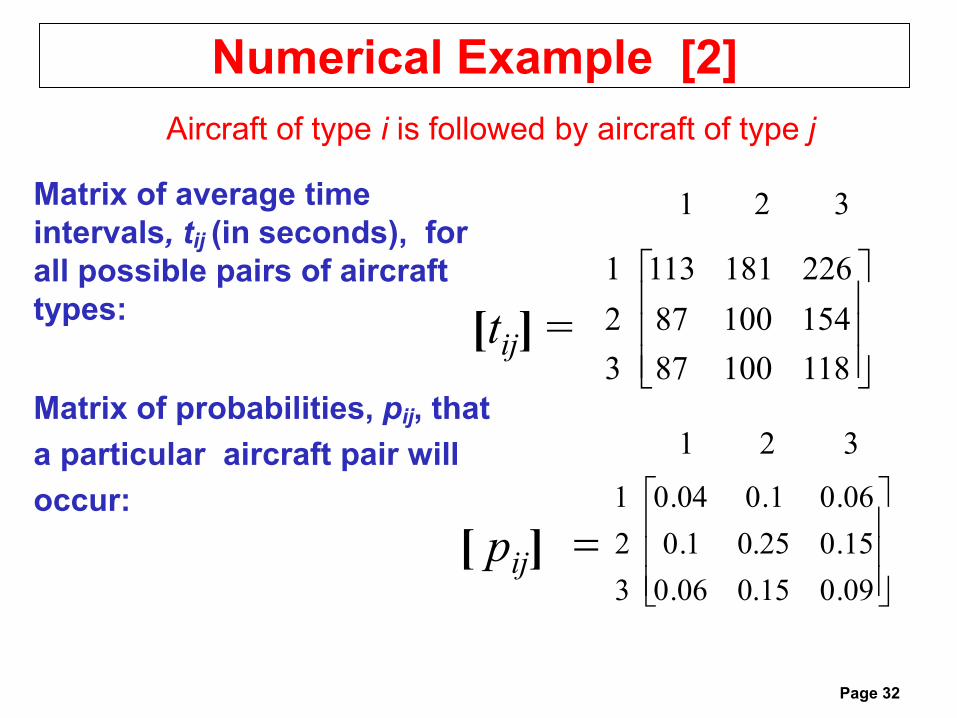
Numerical Example [2]
Matrix of average time
intervals, tij (in seconds), for
all possible pairs of aircraft
types:
Matrix of probabilities, pij, that
a particular aircraft pair will
occur:
[tij] =
321
3
2
1
11810087
15410087
226181113
=[ pij]
321
3
2
1
09.015.006.0
15.025.01.0
06.01.004.0
Aircraft of type i is followed by aircraft of type j

Page 33
Numerical Example [3]
By multiplying the corresponding elements of the matrices [pij] and [tij] we can compute the average separation (in seconds) between a pair of aircraft at the runway in question.
• Max throughput/saturation capacity (typically stated as no.
of aircraft per hour):
The Concept of the “Runway Configuration”
Multi-runway airports can operate in any one of many
possible “configurations”.
Each configuration is described by:
– The set of runways which are active
– The type of operations (arrivals only, departures only, or
mixed) assigned to each of the active runways
Example: A common configuration at IST consists of “05
for arrivals, 35L for departures” (denoted as “05|35L”)
Weather and wind direction and strength play a major role
in the selection of a configuration – occasionally allowing a
single choice only
But air traffic managers often have the option of selecting
among many alternative configurations (e.g., in calm
winds) Page 34

Page 35
High-capacity configurations in opposite directions,
Boston/Logan (VMC)
27-22L | 22R-22L
North
4R-4L | 4R-4L-9

Page 36
Parallel Runways (IFR)
Separation
between runway
centerlines
Arrival/
arrival
Departure/
departure
Arrival/
departure
Departure/
arrival
Closely-spaced
700/1200 – 2500
ft
(213/366 – 762 m)
As in
single
runway
As in single
runway
Arrival
touches
down
Departure is
clear of
runway
Medium-spaced
2500 – 5000* ft
(762 – 1525* m)
1.5 nmi
(diagonal)
Indep’nt Indep’nt Indep’nt
Independent
> 5000* ft
(> 1525* m)
Indep’nt Indep’nt Indep’nt Indep’nt
* 3400 ft (1035 m) or 4300 ft (1310 m) are alternative limits; 3000 ft
(915 m) stated as feasible by ICAO and FAA, subject to conditions

Page 37
LBPIA: Single-Runway and Dedicated Two-Runway Capacities
Type of Operation Example Runway
Configuration
IMC VMC
Single Runway, Mixed
Operations
Arr 05, Dep 05 48 56
Dedicated Dependent
East/West Operations
Arr 06R, Dep 06L 60 70
Dedicated Independent
North/South Parallel
Operations
Arr 15R, Dep 15L 63 65
Arr 33L, Dep 33R 68 75
Dedicated Independent
East/West Parallel
Operations
Arr 05, Dep 06L 80 82
Arr 23, Dep 24L 80 82
Summarizing Runway System Capacity
Capacity envelopes: For any given runway
configuration, the capacity envelope shows the
number of arrivals and departures that can be
performed per “unit of time” (one hour or 15
minutes or other) for all possible “mixes” of
arrivals and departures
Capacity coverage charts: For a specified long
period of time (one year, one month) capacity
coverage charts show how much total capacity is
available at the airport for what percentage of
time
Page 38

Page 39
Typical capacity envelope (“Pareto envelope”)
for a single runway
30 Arrivals/hour
Departures/hour
36
Feasible
region
45o
0
Feasible
region
20
20

VMC vs. IMC Envelopes
“Good” weather (VMC)
“Poor” weather
(IMC)
Arrivals/hour
Departures/hour

Page 41
Capacity envelope: two independent runways, one for
arrivals, the other for departures
Arrivals/hour
Departures/hour
1
2
4
0
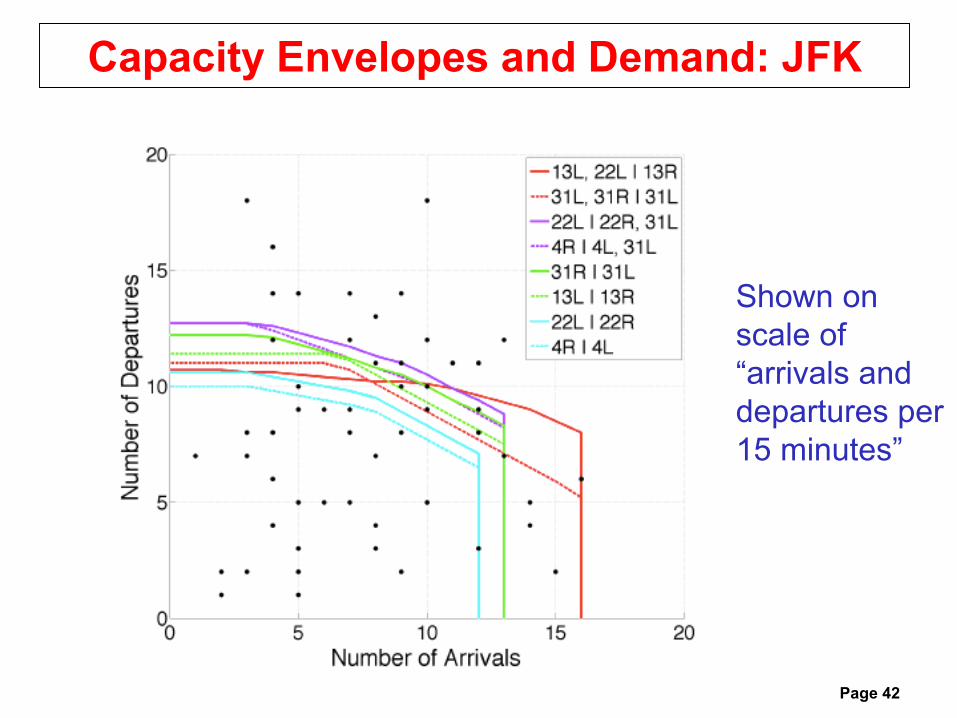
Capacity Envelopes and Demand: JFK
Page 42
Shown on
scale of
“arrivals and
departures per
15 minutes”

Page 43
Capacity Coverage Chart
CCC shows how much capacity is available for what percentage of time
Assumptions:
• airport will operate at all times with the highest capacity configuration available for prevailing weather/wind conditions
• the capacity shown is for a 50%-50% mix of arrivals and
departures
Note: Neither of these assumptions is necessarily true in
practice (e.g., noise may be the principal consideration in
selecting configuration during periods of low demand)

Page 44
Annual Capacity Coverage Chart: Boston/Logan
10080
80
120
40
0
604020
Movements per
hour
% of time

Page 45
Range of Airfield Saturation Capacities
The saturation capacity of a single runway varies greatly among airports, depending on ATM rules and performance, weather conditions, traffic mix, operations mix and other factors identified earlier
At major commercial airports, in developed countries, the typical range per runway in good weather conditions is
– 25 – 44 arrivals per hour for arrivals-only operations
– 30 – 55 departures per hour for departures-only ops
– 30 – 56 movements per hour for mixed ops
Depending on the number of runways and the airport’s geometric configuration, total airfield capacity of major commercial airports ranges from 30 per hour to 260+ per hour

Page 46
Annual Airside Capacity
= The number of aircraft movements that can be handled at a reasonable level of service in one year
Vaguely defined, but very important for planning purposes
Runway system is typically the limiting element
Estimation of annual capacity must consider:
– Typical hourly (saturation) capacity
– Pattern of airport use during a day (largely determined by type of airport demand and by geographical location)
– Acceptable level of delay during busy hours
– Seasonal and day-of-the-week peaking patterns of demand

Daily Demand Profile: Newark Aircraft Movements
(% of Daily Movements)
Page 47

Stability of Monthly Patterns: No. of Passengers at NY JFK
Page 48
Page 49
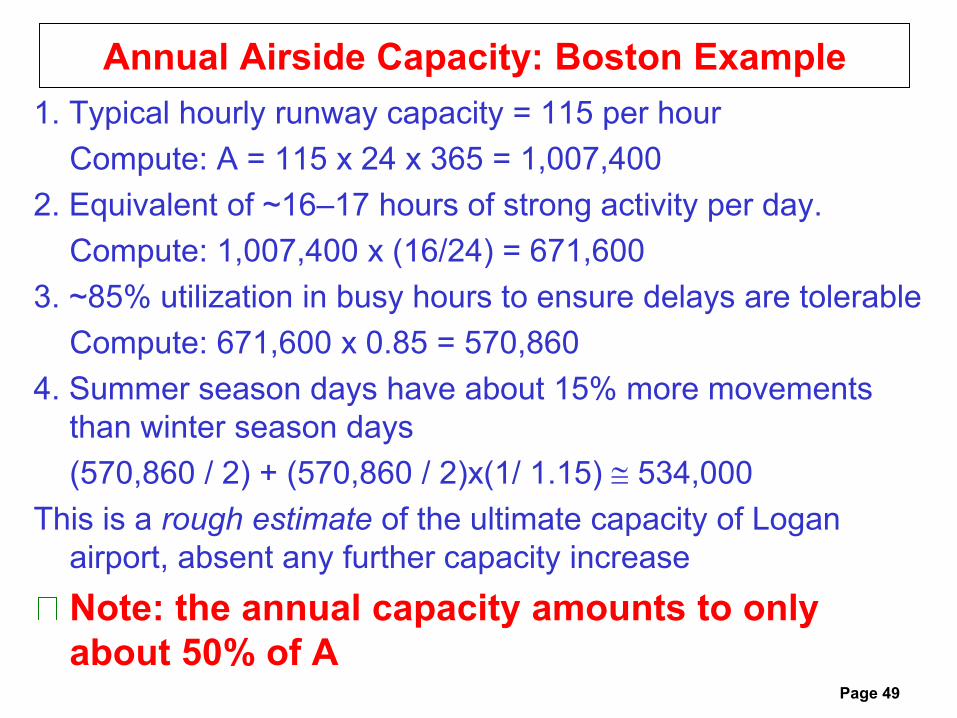
Annual Airside Capacity: Boston Example
1. Typical hourly runway capacity = 115 per hour
Compute: A = 115 x 24 x 365 = 1,007,400
2. Equivalent of ~16–17 hours of strong activity per day.
Compute: 1,007,400 x (16/24) = 671,600
3. ~85% utilization in busy hours to ensure delays are tolerable
Compute: 671,600 x 0.85 = 570,860
4. Summer season days have about 15% more movements
than winter season days
(570,860 / 2) + (570,860 / 2)x(1/ 1.15) 534,000
This is a rough estimate of the ultimate capacity of Logan
airport, absent any further capacity increase
Note: the annual capacity amounts to only
about 50% of A
Increasing Runway Capacity
At high levels of utilization, even small increases in
the capacity of the runway system can have a large
impact on air traffic delays
This is the motivation behind many of the current efforts of
airport operators and of ANSPs (e.g., NextGen and SESAR)
– Reducing, even marginally, separation requirements (e.g.,
at many US and several European airports)
– Improved precision in separations, especially on arrival
– Sequencing of landing aircraft to minimize the use of wake
vortex separations (e.g., LHR, Denver, Dallas/Ft. Worth)
– Intersection departures to reduce separations between
departures (e.g., Munich, LHR)
– Time-based inter-arrival separations in headwinds (LHR)
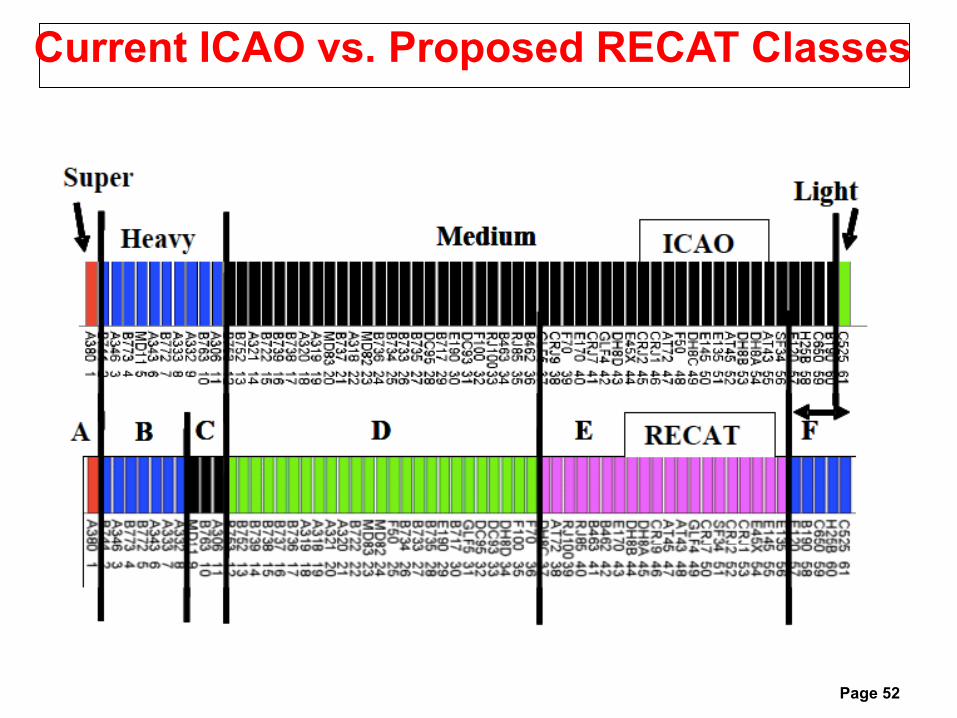
– Re-definition of aircraft classes (RECAT) Page 50

Page 51
IFR Separation Requirements: Single Runway (USA)
H L or B757 S
H 4 5 6*
B757 4 4 5*
L 2.5 2.5 4*
S 2.5 2.5 2.5
Arrival-Arrival:
(1) Airborne separations on final approach (nmi):
Trailing aircraft
Leading
aircraft
(2) Leading aircraft must be clear of the runway before
trailing aircraft touches down
* Applies when leading aircraft is at threshold of runway
Page 52
Current ICAO vs. Proposed RECAT Classes

Page 53
Need for More Capacity
ATM innovations will result in only limited increases
in runway system capacity at the busiest airports
[e.g., +10% – 20%(??) over 20 years]
Quantum increases in capacity can only come from
new airports or new runways at existing airports
Practically no new primary airports planned in North
America and Western Europe; several in Asia
(India, China, Middle East)
New runways are planned at a very few busy
airports in Europe and US and at many major
airports in Asia
Page 54
OutlineVariability of Demand
Airside Capacity and Its Variability
– Runway Systems
– Taxiways and Aprons
– Passenger Terminals
Delays
– Proper Measurement
– Non-linearity
– Landside vs. Airside
Demand Management: Schedule Coordination
Demand Management: Market-Based Schemes

Page 55
Capacity of Taxiways
The capacity of the taxiway system is rarely, if ever, the capacity bottleneck of major airports
However, some specific parts of the taxiway system may consistently act as “hot spots” (points of congestion), especially at older, limited-area airports
Local geometry and traffic flows determine the location of these hot spots
The blocking of groups of stands by a single lane passage is one of the most common examples of such taxiway hot spots
Much more common problem: long taxiing times (15+ minutes) associated with surface movements, as the airfields and runway systems of busiest airports become ever more expansive and complex

Page 56
Capacity of Taxiways
The capacity of the taxiway system is rarely, if ever, the capacity bottleneck of major airports
However, some specific parts of the taxiway system may consistently act as “hot spots” (points of congestion), especially at older, limited-area airports
Local geometry and traffic flows determine the location of these hot spots
The blocking of groups of stands by a single lane passage is one of the most common examples of such taxiway hot spots
Much more common problem: long taxiing times (15+ minutes) associated with surface movements, as the airfields and runway systems of busiest airports become ever more expansive and complex

Page 57
Capacity of Aprons/Stands
Often a tough problem!
Different stands can accommodate different sizes of aircraft
Remote vs. contact stands
Shared use vs. exclusive use (airlines, handlers)
Dependence among neighboring stands
Static capacity: No. of aircraft that can be parked simultaneously at the stands. (Easy!)
Dynamic capacity: No. of aircraft that can be accommodated per hour. (Can be difficult to compute.)

Page 58
Stand Blocking Time (SBT)
Scheduled occupancy time (SOT) [30 minutes to 4
hours, except for overnight stays]
Positioning time (PT) [5 – 20 min for in-and-out]
Buffer time (BT) [can be more than 1 hour at some
locations]
SBT = SOT + PT + BT
No. of aircraft served by a single gate rarely
exceeds 6 – 7 per day and can be significantly
less for gates serving long-range flights

Page 59
OutlineVariability of Demand
Airside Capacity and Its Variability
– Runway Systems
– Taxiways and Aprons
– Passenger Terminals
Delays
– Proper Measurement
– Non-linearity
– Landside vs. Airside
Demand Management: Schedule Coordination
Demand Management: Market-Based Schemes

General ObservationsBecause of the absence of clear “rules of the
road”, capacities of terminal buildings (or of some
of their components) are often estimated on the
basis of space availability standards that are
associated (rather arbitrarily) with various Levels
of Service
This simplistic approach does not account for
fundamental issues such as:
– Behavioral characteristics (e.g., how do people
allocate their pre-departure time)
– Space configuration (e.g., points where people
tend to concentrate, lines of vision, etc.) Page 60

Design Peak Days and Design Peak Hours
Airfields and passenger terminals are designed for “design
peak days” (DPD) and “design peak hours” (DPH)
associated with selected annual traffic levels
The DPD and DPH loads are estimated in terms of aircraft
movements (for airfields) and of arriving and departing
passengers (for terminals and landside facilities)
Numerous definitions of DPD (and DPH)
– 20th or 30th or 40th busiest day of year
– Average day of peak month
– 90th or 95th percentile busiest day of year
Common characteristic of all definitions: not busiest day (or
hour) of the year, but “reasonably close” to it
Practical rule: It makes little difference which definition one
chooses, as long as it is consistent with the above concept Page 61
Page 62
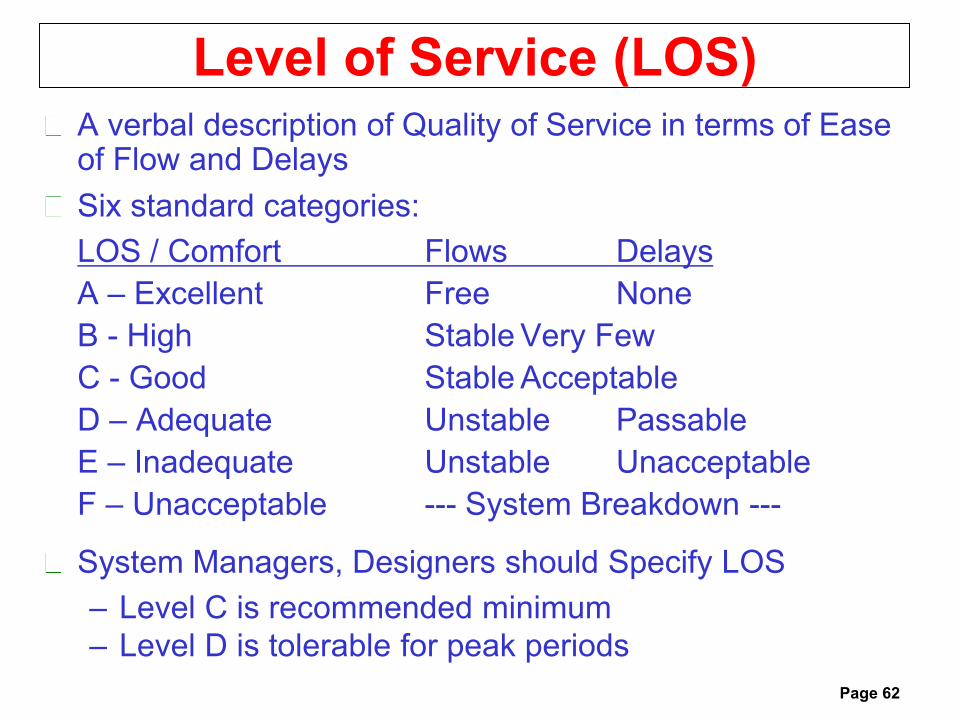
Level of Service (LOS)A verbal description of Quality of Service in terms of Ease of Flow and Delays
Six standard categories:
LOS / Comfort Flows Delays
A – Excellent Free None
B - High Stable Very Few
C - Good Stable Acceptable
D – Adequate Unstable Passable
E – Inadequate Unstable Unacceptable
F – Unacceptable --- System Breakdown ---
System Managers, Designers should Specify LOS
– Level C is recommended minimum
– Level D is tolerable for peak periods

Page 63
Level of Service Standards: Space (sq. m. per occupant)
A B C D E F
Wait and circulate
with bags
2.7 2.3 1.9 1.5 1.0 ?
Wait and circulate
w/o bags
2.0 1.8 1.6 1.4 1.2 ?
Wait with bags 1.8 1.6 1.4 1.2 1.0 ?
Wait without bags 1.4 1.2 1.0 0.8 0.6 ?
Source: IATA Airport Development Reference Manual, 8th ed., 1995
NOTE: No guidelines exist concerning delays at
the various parts of the terminal

LOS Standards: Passageways
Page 64
Type of
Passageway
Speed of
Walking
Level of Service
A B C D E F
Corridor Regular 10 12.5 20 28 37 More
Stairway Slower 8 10 12.5 20 28 More
[Source: Modified from Fruin (1971)]
Passengers per meter of effective width per
minute (PPM)

Page 65
Space Required
Space Required, sq. meters =
(Load, persons/hour)x(Standard,
sq.m./person)x(Dwell time, hours)
Example:
What space is required at LOS C for
passport inspection of 2000 passengers per
hour when maximum dwell is 20 minutes?
Space Required = 2000x1x(1/3) = 667 sq. m.

Refinements to the LOS Standards
IATA Airport Development Reference Manual, 9th ed.,
2004 has refined the 1995 LOS standards
Depending on the type of space being considered, the
LOS standards are now also sensitive to
– The presence of carts in the space
– The number of bags (many or few) typically carried by
passengers occupying the space
For passageways (such as corridors and stairways),
allowances are also made for ergonomics; for example,
for 2-way passenger flows: 1.5 m extra is required to
account for “edge effects” (0.5 m from each side of the
corridor and another 0.5 m between the two flows)
IATA Airport Development Reference Manual, 10th ed.,
2014 has introduced flexibility in the guidelines so that
local considerations can be taken into account Page 66

In Truth…Unfortunately, an approach that relies on average space
availability guidelines to determine the capacity of terminals
or to design terminals is usually totally inadequate
Often leads to big mistakes and oversized or undersized
passenger terminals
Approach does not consider
– The presence of several different stakeholders, each with
its own priorities
– The possibility of creating “hot spots” because of the
behavioral characteristics of terminal’s users
– The potential for modifying passenger behavior with
proper signage and information
Every design of a passenger terminal must be
driven by local considerationsPage 67

Page 68
Stakeholders in Passenger Building Design/Planning
Airport operator
Airlines
Passengers
Government (security, immigration, customs..)
Commercial vendors and non-aeronautical
service providers
Different stakeholders attach different values
and priorities to the various attributes of a
terminal
“Efficient” vs. “shopping mall” debate

Page 69
Evaluation Measures for Passenger Terminals
Direct:
– Capacity Time-in-system
– Waiting time Space requirements
– Facility requirements Walking distances
Indirect:
– Non-aeronautical revenues
– Operating costs Staffing requirements
– Flexibility Security
– Ambience / image Signalization/orientation

Page 70
Connecting traffic, dwell time, discretionary time
Hubbing airports must serve large numbers of connecting passengers instead of just originating and terminating ones
Connecting passengers often have long dwell times at airports (space needed) and take advantage of commercial services there
Dwell times of departing passengers are also becoming longer, primarily due to security requirements
Large investments in infrastructure required
Influencing the magnitude and allocation of dwell time and of “discretionary” time has become critical for airports

Page 71
OutlineVariability of Demand
Airside Capacity and Its Variability
– Runway Systems
– Taxiways and Aprons
– Passenger Terminals
Delays
– Proper Measurement
– Non-linearity
– Landside vs. Airside
Demand Management: Schedule Coordination
Demand Management: Market-Based Schemes

Delay / Congestion on AirsideDelay is one of the two key measures of performance on airside; the other is environmental impact
Delay affects airline costs in major ways:
– Direct costs: labor, fuel, maintenance, depreciation
– Level of service perceived by passengers
– Disruption of daily schedules
– Need for additional resources (staff, aircraft, etc) to permit schedule recovery
– Long-term loss of goodwill, loss of demand (diversion to other modes, alternatives to travel)
Similar negative impacts on passengers
– Direct cost of lost time
– High cost of trip disruptions
– Change of travel strategies, more time spent traveling
Negative impacts on environment and safety Page 72

Cost of Air Traffic Delays in US, 2007
Cost Component
Cost
(billion dollars)
Cost to Airlines 8.3
Cost to Passengers 16.1
Cost of Lost Demand 7.9
Total Direct Cost 32.3
Indirect Impact on GDP 4.0
Total Cost Impact 36.3
Source: Total Delay Impact Study: A Comprehensive Assessment of the
Costs and Impacts of Flight Delay in the United States, NEXTOR 2010
Delay / Congestion on Landside
Delay is also one of the principal measures of
performance on landside
But, because landside performance has so many
different aspects and is evaluated by several types
of “stakeholders”, many other measures must also
be used
In contrast to space-related standards, there are
no international guidelines on what is “reasonable”
delay and what is “unacceptable” delay on airside
– Different airports and airlines have different
standards in this respect (and many have no
standards at all) Page 74

Sketch of a Distribution of Time for Check-in
Page 75
Total time for check-in
(waiting + processing)
F
r
e
q
u
e
n
c
y
10th percentile
Average
Mode

Measuring and Assessing Delay
Delay-related performance at an airport must be
assessed from several perspectives:
– “Average” (expected value)
– “Spread” / “uncertainty” (standard deviation)
– “Extreme cases” / “outliers” (X-percentile of
distribution, where X=10 or 5 or 1)
– “Most frequent” (mode of distribution)
Typically we are concerned about
– Delay over the entire period under consideration,
as well as
– Delay during peak demand periods (peak hours,
peak days, peak month, special daysPage 76

Runway Delay Statistics for a Typical Day at FRA
Page 77
! " #
$" #
%! " #
%$" #
&! " #
&$" #
' ! " #
' $" #
! #
&#
( #
) #
*#
%! #
%&#
&+! ! # ( +! ! # ) +! ! # *+! ! # %! +! ! # %&+! ! # %( +! ! # %) +! ! # %*+! ! # &! +! ! # &&+! ! # ! +! ! # &+! ! #
!"#$"%&&'(%)*"+,)%-,+"."/0"1
'2*"
)#3%)"+,)%-"1
'245,*"
6#3%)"7#4&"
,-. /012#1,#. --3#4 #567. 8#9#%$: ;23# . <=#567. 8#>6-#%$#: ;23#

Page 78
OutlineVariability of Demand
Airside Capacity and Its Variability
– Runway Systems
– Taxiways and Aprons
– Passenger Terminals
Delays
– Proper Measurement
– Non-linearity
– Landside vs. Airside
Demand Management: Schedule Coordination
Demand Management: Market-Based Schemes

Page 79
Behavior of Queuing Systems in the “Long Run”
The “utilization ratio”, r , measures the intensity
of use of a queuing system:
A queuing system cannot be operated in the long
run with a utilization ratio which exceeds 1; the
longer such a system is operated, the longer the
queue length and waiting time will be.
But delays may occur even when r < 1 due to
time-variability of demand and to probabilistic
fluctuations of demand and capacity; these
delays can be very large when r is close to 1.
r =average demand rate
average service rate=
"demand"
"capacity"=
l
m

Page 80
Behavior of Queuing Systems in the “Long
Run”[2]
In the “long run”, the average queue length and average delay in a queuing system are proportional to:
Thus, as the demand rate approaches the service rate (or as r 1, or as “demand approaches capacity”) the average queue length and average delay increase rapidly
The “proportionality constant” increases with the variability of demand inter-arrival times and of service times
r1
1
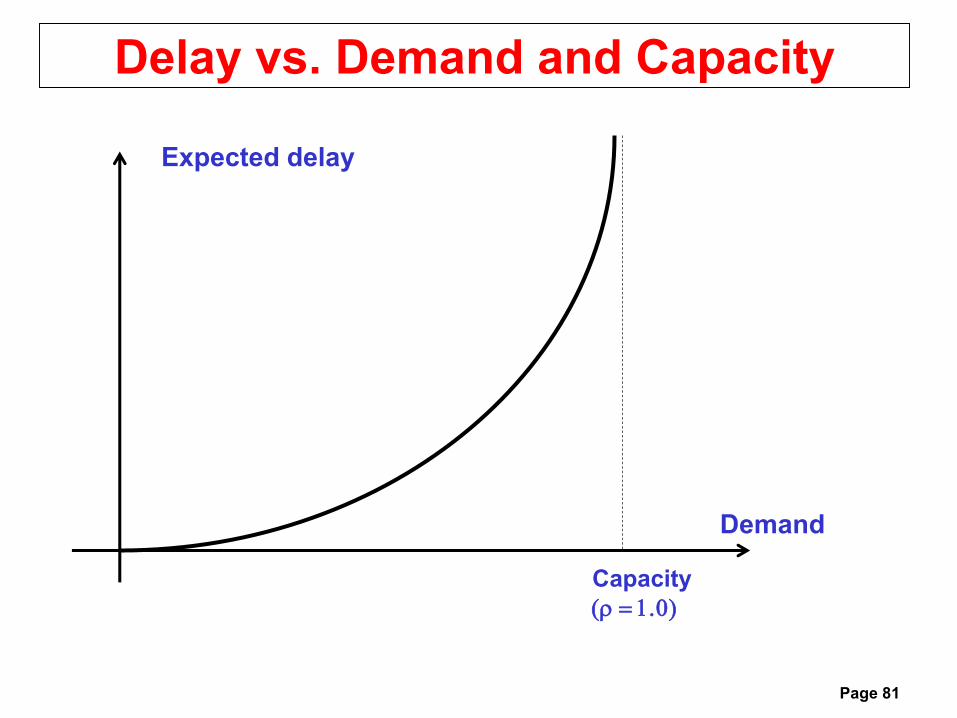
Page 81
Delay vs. Demand and Capacity
Capacity
(r = 1.0)
Demand
Expected delay

Page 82
High Sensitivity of Delay at High Levels of Utilization
Capacity
(r = 1.0)
Demand
Expected delay

Delay vs. Annual Operations at Orlando Airport (MCO)
Page 83
Annual Service Volume Estimates
0
5
10
15
20
25
400,000 450,000 500,000 550,000 600,000 650,000 700,000
Annual Operations
Avera
ge D
ela
y p
er
Op
era
tio
n (
min
.)

Page 84
Scheduled aircraft movements at LGA before and after
2001 slot lottery
0
20
40
60
80
100
120
5 7 9 11 13 15 17 19 21 23 1 3
Nov, 00
Aug, 01
81 flights/hour
Scheduled
movements
per hour
Time of day (e.g., 5 = 0500 – 0559)

Page 85
Estimated average delay at LGA before and after slot
lottery in 2001
0
20
40
60
80
100
5 7 9 11 13 15 17 19 21 23 1 3
Nov, 00
Aug, 01
Time of day
Average
delay
(min per
movt)

Evolution of NY Delays (2007 – 2010)
Page 86
JFK EWR
Month in 2010 July August July August
Demand -6.84% -8.02% -3.37% -5.16%
Actual Delays -46.90% -53.15% -32.93% -52.02%
Model-Predicted Delays -48.69% -51.30% -36.14% -41.56%
Jacquillat, 2012

Page 87
Variability of Queues
The variability of delay also builds up rapidly as
demand approaches capacity.
In “steady state,” the standard deviation --a
measure of variability -- of delay and of queue
length is also proportional to:
A large standard deviation implies unpredictability
of delays from day to day and low reliability of
schedules
r1
1

Page 88
Two Types of Delay Measurement
Two types of delay measures; cause of much confusion:
– “True” delay: the difference between the actual time it took to complete a flight (or a flight segment) and an estimate of the time (“nominal time”) that would be required in the absence of delay
– Delay relative to schedule
In much of the world, a flight is counted as “late” if it arrives or departs (at gate) more than 15 minutes later than scheduled [note this is delay relative to schedule]
In recognition of habitual “true” delays, airlines have been lengthening (“padding”) the scheduled duration of flights
• improve “on-time arrival” statistics
• improve reliability and realism of their schedules
Thus, airline scheduled flight durations include a delay allowance: a flight that arrives on schedule may in truth have been significantly delayed!

Understanding the Measurement of a Flight’s Delay
Page 89True Delay = Buffer Time + Block Delay
Page 90
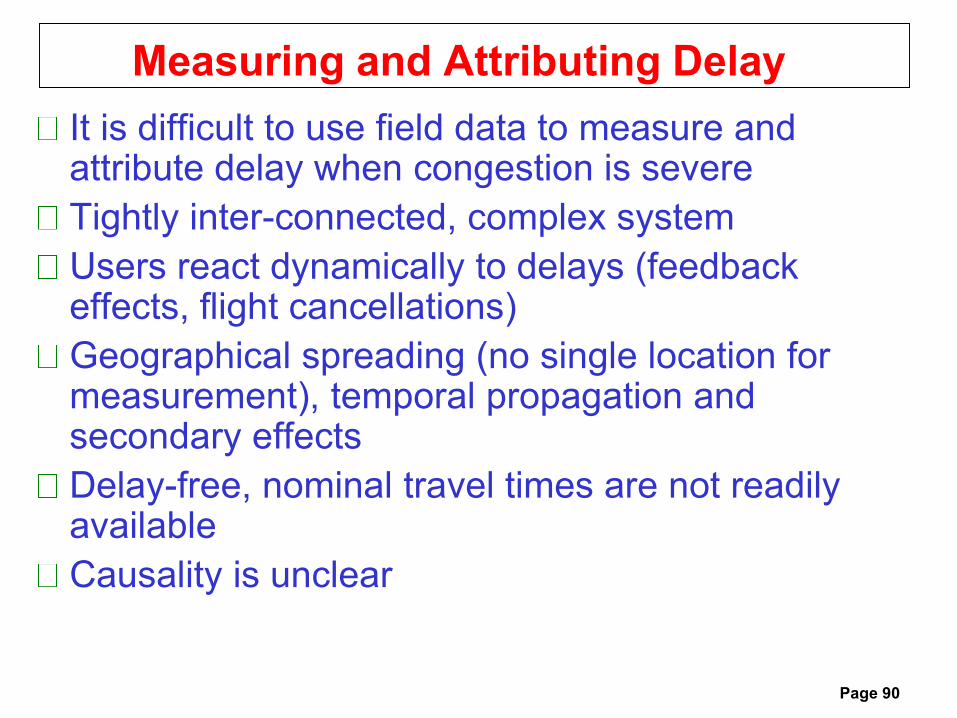
Measuring and Attributing Delay
It is difficult to use field data to measure and attribute delay when congestion is severe
Tightly inter-connected, complex system
Users react dynamically to delays (feedback effects, flight cancellations)
Geographical spreading (no single location for measurement), temporal propagation and secondary effects
Delay-free, nominal travel times are not readily available
Causality is unclear

Page 91
Tools for Estimating Delays Theoretically
The estimation of delays at an airport is usually sufficiently complex to require use of computer-based models
– Dynamic queuing models: solve numerically the equations describing system behavior over time
– Simulation models (e.g., TAAM, SIMMOD)
For very rough approximations, simplified models may sometimes be useful
– Simple (“steady-state”) queuing models
– Cumulative diagrams
Note: Field data on air traffic delays increasingly available, getting better in quality (e.g., ASPM, CODA)

Page 92
OutlineVariability of Demand
Airside Capacity and Its Variability
– Runway Systems
– Taxiways and Aprons
– Passenger Terminals
Delays
– Proper Measurement
– Non-linearity
– Landside vs. Airside
Demand Management: Schedule Coordination
Demand Management: Market-Based Schemes

Delay / Congestion on Landside
Delay is also one of the most important measures
of performance on landside
But, because airside performance (i) affects many
“stakeholders” and (ii) impacts people
– Many other measures must also be used
It is also true that, in contrast to space-related
standards, there are no international guidelines on
what is “reasonable” delay and what is
“unacceptable” delay on airside
– Different airports and airlines have different
standards in this respect (and many have no
standards at all) Page 93
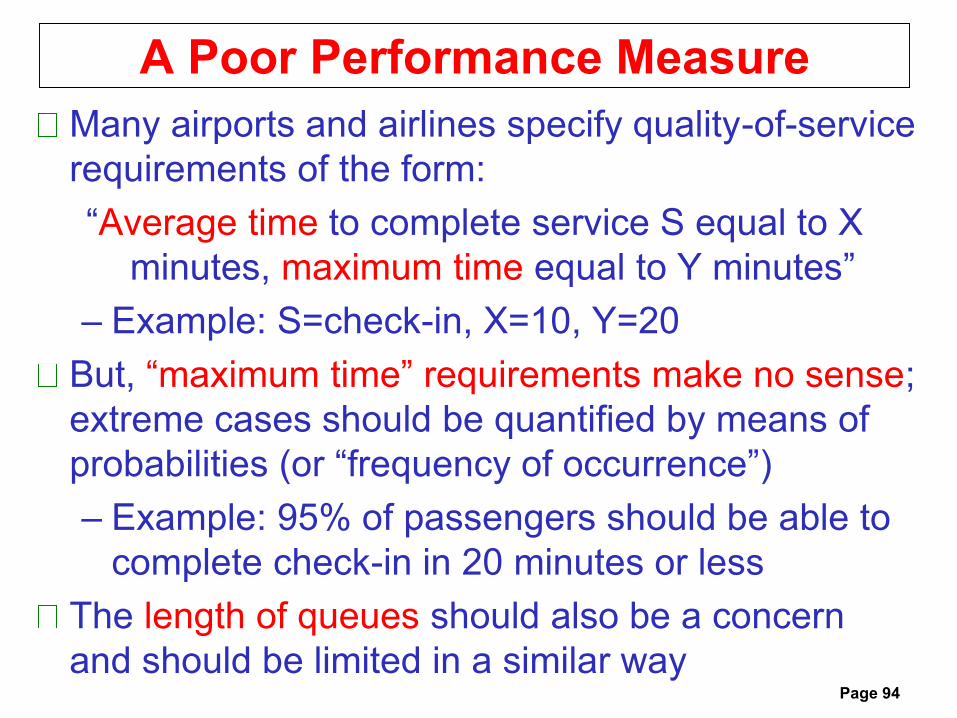
A Poor Performance Measure
Many airports and airlines specify quality-of-service
requirements of the form:
“Average time to complete service S equal to X
minutes, maximum time equal to Y minutes”
– Example: S=check-in, X=10, Y=20
But, “maximum time” requirements make no sense;
extreme cases should be quantified by means of
probabilities (or “frequency of occurrence”)
– Example: 95% of passengers should be able to
complete check-in in 20 minutes or less
The length of queues should also be a concern
and should be limited in a similar wayPage 94

LHR: Quality Control Program
A program to control quality of service at LHR, called the
Service Quality Rebate Scheme (SQRS) was introduced by
the regulatory Civil Aviation Authority
Identifies the service standards that airlines and
passengers should expect from Heathrow in return for the
regulatory charges they paid.
If performance falls below a certain level, Heathrow must
repay a proportion of charges levied back to the airlines.
SQRS provides an incentive to the airport operator to meet
the specified standards of service quality
Rebate payments are made monthly to airlines
Maximum amount of rebates is 7% of airport charges
Rebates are paid on performance in each individual
terminalPage 95

Example of Proper Measures and Targets
London Heathrow, Terminal 5
Central security queue: Measures of performance
1. Percent of time that queue requires less than 5
minutes
– Target: 95%
– Actual figure for January 2015: 96.54%
2. Percent of time that queue requires less than 10
minutes
– Target: 99%
– Actual figure for January 2015: 99.88%
Page 96

Page 97
OutlineVariability of Demand
Airside Capacity and Its Variability
– Runway Systems
– Taxiways and Aprons
– Passenger Terminals
Delays
– Proper Measurement
– Non-linearity
– Landside vs. Airside
Demand Management: Schedule Coordination
Demand Management: Market-Based Schemes
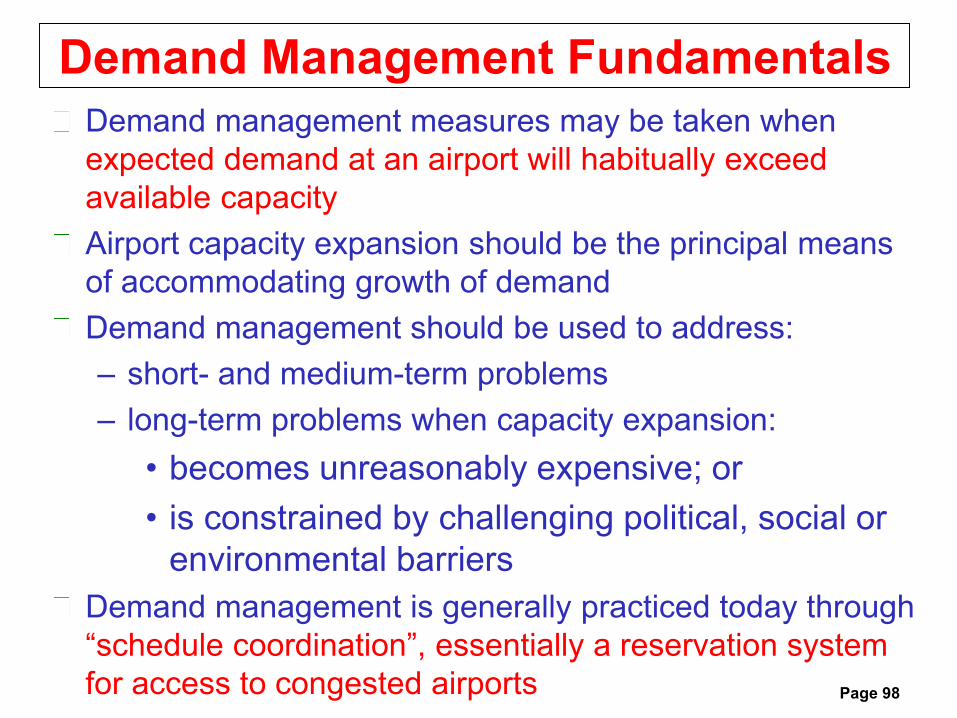
Demand Management Fundamentals
Demand management measures may be taken when
expected demand at an airport will habitually exceed
available capacity
Airport capacity expansion should be the principal means
of accommodating growth of demand
Demand management should be used to address:
– short- and medium-term problems
– long-term problems when capacity expansion:
• becomes unreasonably expensive; or
• is constrained by challenging political, social or
environmental barriers
Demand management is generally practiced today through
“schedule coordination”, essentially a reservation system
for access to congested airports Page 98

The Concept of Schedule Coordination
Slots are “permissions to use a runway and airport
infrastructure on a specific date and time for an
arrival or departure”
Schedule Coordination “rations” scarce capacity
among airlines so as to achieve high utilization of
airport while keeping delays at reasonable levels
– “smoothens peaks and valleys” in daily demand
– keeps demand below a target level specified by
the airport’s “declared capacity”
Important to estimate declared capacity accurately
and to understand the relationship and tradeoffs
between number of flights served and delay Page 99

Declared Capacities – Brussels, 2009
Page 100
Source: Morisset, 2010

101
Determining Declared Capacity
No standard methodology for determining declared capacity (= the number of “slots” available at an airport)
– some sophisticated approaches with detailed simulations and extensive consultation with stakeholders
– many ad hoc, “back-of-the-envelope” approaches with limited inputs and “politicized” considerations
Declared capacities are typically set with reference to IMC capacity of the airport:
– Lower than IMC capacity in most cases (MUCH lower in some)
– Very close to (and sometimes slightly above) estimated IMC capacities at some of the busiest airports (e.g., Heathrow, Frankfurt, Gatwick, Munich)
– Terminal building capacity may also be a constraint

FRA – Average daily schedule by month (2007)
25.03.2015
Evenly distributed demand profile from 07:00 to 21:00
Hourly demand peaks at 84-movement hourly slot limit
0
10
20
30
40
50
60
70
80
90
05 06 07 08 09 10 11 12 13 14 15 16 17 18 19 20 21 22 23
mo
vem
en
ts / h
ou
r
time
January
February
March
April
Mai
June
July
August
September
October
November
December
IMC Capacity
VMC CapacityScheduling limit

Page 103
IATA Schedule Coordination Process
Level 1 (“non-coordinated”)
Level 2 (“schedules facilitated”) (~ 120 airports)
Level 3 (“fully coordinated”)
~ 170 airports (~100 in Europe, practically all busiest ones outside US)
Coordinator appointed by appropriate authority, usually assisted by a coordination committee
IATA Schedule Coordination Conferences (SCC); in June and November for subsequent season
Attended by ~300 air carriers, coordinated airport reps, schedule coordinators, etc.

Level 3 and Level 2 Airports (Feb 2015)
Region Level 3 Level 2
Asia Pacific 36 16
Europe 100 74
Middle East and Africa 11 12
North Asia 13 2
Americas 7 12
Total 167 116
Page 104
Source: IATA

Page 105
IATA Schedule Coordination Process [2]
Carriers must submit slot requests 27 days before SCC
During SCC and post -SCC, coordinators resolve conflicts, finalize schedules
Historical precedent is over-riding criterion
Carriers may change use of slots or exchange slots
Use-it-or-lose-it clause (80% use required)
New entrants are allocated up to 50% of “free” slots
Restrictive definition of “new entrant”
– Maximum of 4 slots in a day after being awarded new slots
Other allocation criteria: size and type of market, length of period of operation, curfews, etc.
“Transparent” slot buying/selling permitted in some EU countries (authorized as an option by EU Commission in 2008)

Page 106
LHR Slots: Summer 2015
Summer 2009: Arrs. 676, Deps. 691; Weekly, 9524
Annual Limit: 480,000 movements (Terminal 5 agreement)
Page 107
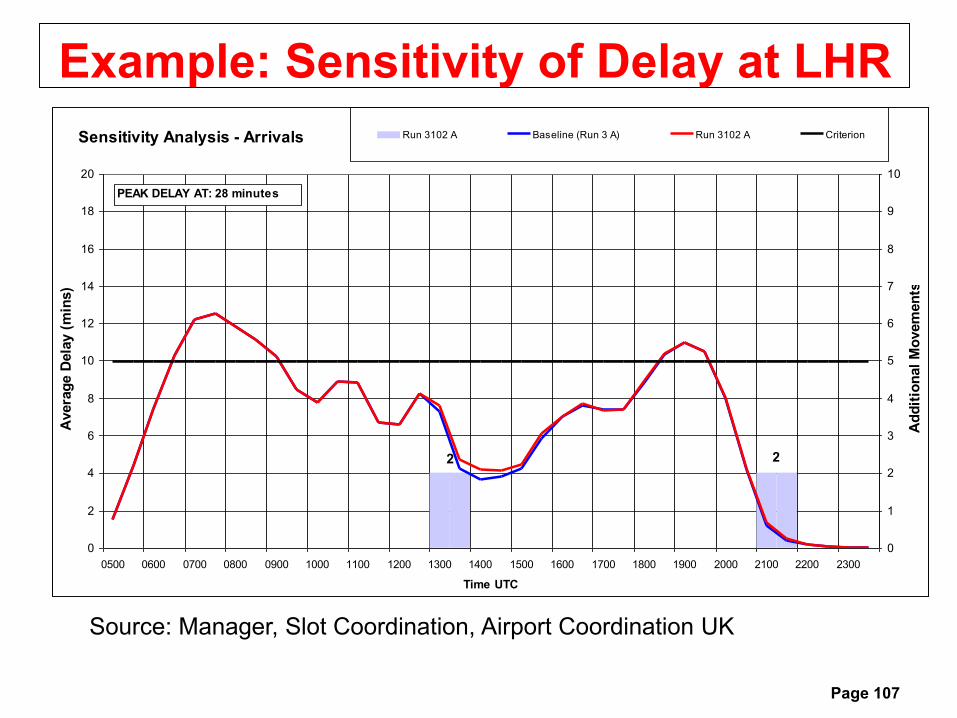
Example: Sensitivity of Delay at LHR
Sensitivity Analysis - Arrivals
2 2
0
2
4
6
8
10
12
14
16
18
20
0500 0600 0700 0800 0900 1000 1100 1200 1300 1400 1500 1600 1700 1800 1900 2000 2100 2200 2300
Time UTC
Avera
ge D
ela
y (
min
s)
0
1
2
3
4
5
6
7
8
9
10
Ad
dit
ion
al
Mo
vem
en
ts
Run 3102 A Baseline (Run 3 A) Run 3102 A Criterion
PEAK DELAY AT: 28 minutes
Source: Manager, Slot Coordination, Airport Coordination UK

Passenger Limits: LHR, Summer 2015
Page 108

Assumed Load Factors: LHR, Summer 2015
Page 109

Stand Limits: LHR, Summer 2015
Page 110

Page 111
Slot Availability at LHR: The Limits!
HOUR Mon Tue Wed Thu Fri Sat Sun HOUR Mon Tue Wed Thu Fri Sat Sun
0600 0 0 0 0 0 1 0 0600 0 0 0 0 0 3 12
0700 0 0 0 0 0 0 1 0700 0 0 0 0 0 0 9
0800 0 0 0 0 0 0 3 0800 0 0 0 0 0 0 0
0900 0 0 0 0 0 0 0 0900 0 0 0 0 0 0 0
1000 0 0 0 0 0 0 0 1000 0 0 0 0 0 0 0
1100 0 0 0 0 0 1 1 1100 0 0 0 0 0 0 0
1200 0 0 0 0 0 0 1 1200 0 0 0 0 0 0 0
1300 0 0 0 0 0 1 1 1300 0 0 0 0 0 0 0
1400 2 1 2 0 3 0 4 1400 0 0 0 0 0 0 0
1500 0 1 1 0 0 0 0 1500 0 0 0 0 0 0 0
1600 0 0 0 0 0 0 0 1600 0 0 0 0 0 0 0
1700 0 0 0 1 0 0 0 1700 0 0 0 0 0 0 0
1800 0 0 0 0 0 0 0 1800 0 0 0 0 0 0 0
1900 0 0 0 0 0 2 0 1900 0 0 0 0 0 0 0
2000 0 0 0 0 0 3 0 2000 0 0 0 0 0 4 0
2100 0 0 0 0 0 15 1 2100 8 1 1 0 0 12 0
2200 4 3 1 2 2 12 3 2200 0 2 2 1 0 5 0
ARRIVALS DEPARTURES
Source: Manager, Slot
Coordination, Airport
Coordination UK for
Summer, 2001
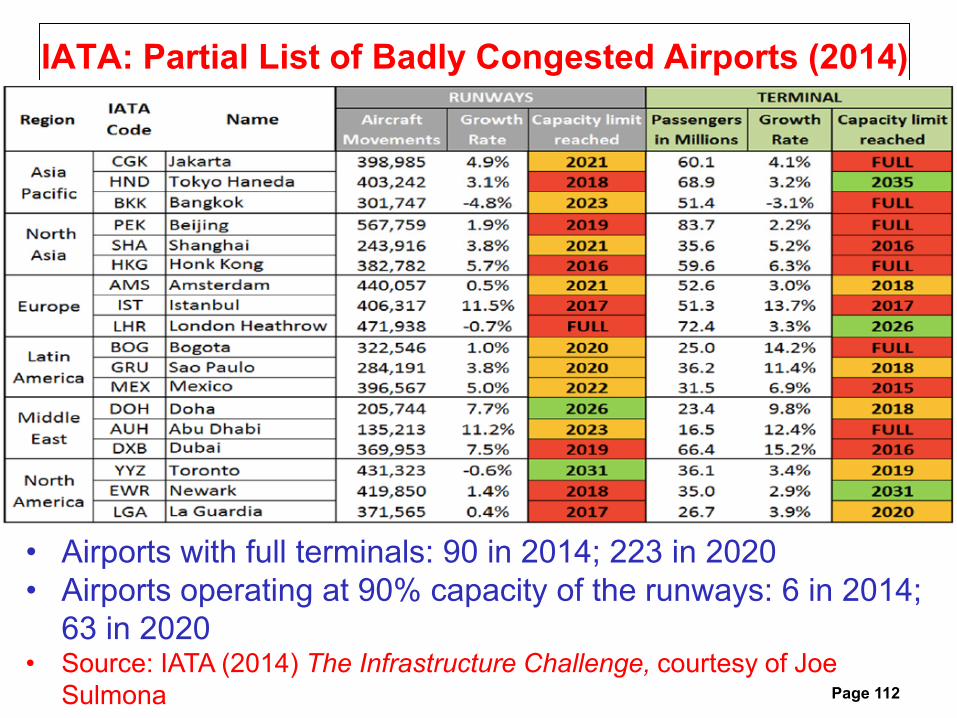
IATA: Partial List of Badly Congested Airports (2014)
Page 112
• Airports with full terminals: 90 in 2014; 223 in 2020
• Airports operating at 90% capacity of the runways: 6 in 2014;
63 in 2020• Source: IATA (2014) The Infrastructure Challenge, courtesy of Joe
Sulmona

Page 113
OutlineVariability of Demand
Airside Capacity and Its Variability
– Runway Systems
– Taxiways and Aprons
– Passenger Terminals
Delays
– Proper Measurement
– Non-linearity
– Landside vs. Airside
Demand Management: Schedule Coordination
Demand Management: Market-Based Schemes

Page 114
Outline
Capacity of Runway Systems
Capacity of Passenger Terminals
Capacity of Taxiways and Aprons
Delays: Non-linearity
Demand Management: Schedule Coordination
Demand Management: Market-Based Schemes

Criticisms of Slot Coordination
Grandfathering allows no consideration of the
economic value of a slot; an airline has no way of
obtaining a slot to which it assigns high value
By prioritizing punctuality, slot-coordinated airports
may often be setting their declared capacity to
smaller than optimum values, i.e., may be serving
fewer than the optimum number of flights
Heavy reliance on historical precedent in the
allocation of slots and limitations on access by new
entrants may inhibit competition
May mask need for and economic value of
additional capacity

Traditional Weight-Based Landing Fee
Aircraft Weight
Landing
Fee ($)
Rate per
unit weight

Page 117
Congestion Pricing: A Key Observation
The marginal congestion cost associated with an
aircraft movement has 2 components:
– Cost of delay to that movement (internal cost)
– Cost of additional delay to all other aircraft
operators (external cost)
• At congested airports, this second component
can be very large -- often much more than
$1000 per aircraft movement
Congestion pricing aims at increasing the efficiency
of resource utilization by forcing users to
“internalize external costs” through the payment of
a congestion toll

Page 118
Possible Forms of Congestion Pricing
Due to the many practical difficulties, the realistic possibilities for application of congestion pricing seem limited to charging during peak periods:
A surcharge in addition to the weight-based landing fee
A flat fee independent of aircraft weight (or variation thereof)
A multiplier applied to the weight-based landing fee
A landing fee equal to the larger of a specified minimum charge and of the weight-based landing fee

Page 119
Landing Fees, BAA (2005)
Heathrow
Gatwick
Stansted
Aircraft weight (tons)
Peak Off-peak Peak Off-peak Peak Off-peak
MTOW 16 £ 590 £ 250 £ 385 £ 110 £ 95 £ 85
16<MTOW 50 £ 590 £ 250 £ 385 £ 110 £ 142 £ 105
50 < MTOW £ 590 £ 425 £385 £ 125 £ 231 £ 131
For MTOW > 250
£ 590 £ 425 £385 £ 125 £ 400 £ 400
Apply to domestic and international flights
Note: “Peak” varies by airport (e.g., Heathrow peak: 07:00-9:59 and
17:00-18:59 GMT, April 1-Oct. 31)

Some Major Airport Fees, LHR (2015)
Landing fee for Chapter 3 and 4 aircraft: £ 2,934 and
£ 1,430, respectively, irrespective of weight. [Note:
The fee is closely tied to “noise”; further adjustments
are made for noise characteristics and for late night
(00:30-03:30) operations.]
Air navigation service fee: £ 80.53 + 1.08 per metric
tonne of MTOW.
Charge per departing passenger: £ 29.59 for
European destinations; £ 41.54 for others.
Page 120

Page 121
Boston (1993): Proposed Landing Fee vs.
Traditional Weight-Based Fee
LandingFee$
Peak Operations
Charge
Fixed Operations
Charge
Off-PeakRate
Peak PeriodRate
TraditionalWeight - BasedRate
Aircraft Weight

Page 122
Auctions
A much-discussed approach for which there is
no practical experience to date
Possible Scenario:
– Carriers submit sealed bids for any number of
slots
– All slots are auctioned simultaneously
BUT: How to do this and address all the
complexities remains an open question!

Page 123
Complexity of Slot Auctions Value an airline derives from a slot depends on what other
slots it obtains
• Landings and takeoffs
• Alternative times for a given flight
• Slots for connecting flights
Network effects are also important
• A slot at a given time at airport A may be useless without a corresponding slot at airport B
Hence, there is a huge number of combinations that each carrier may be interested in at each airport.– How does one prepare such bids and how does the auction
administrator select the best bids?
A follow-up market is also clearly needed to adjust auctioned slot allocations

Secondary Trading of Slots
Several countries now allow the trading of slots (purchasing,
leasing) at Level 3 airports
European Commission (2008): Leaves it up to Member
States to permit or ban secondary trading of slots; such
trading must “take place in a transparent manner”.
LHR rules:
– The Coordinator must confirm feasibility of trade
– Buyer purchases runway slot pair along with historical
terminal and stand capacity (e.g., Code D aircraft with 150
seats in T3)
– May “re-time” slot or change terminal subject to availability
– Transactions are public, but price need not be disclosed
– Once the slot has grandfather rights, it can be traded
(must wait 2 years for new entrant slots) Page 124

Some Slot Prices from Secondary Trading
Highest published price (until recently): $207 million for four
daily pairs at LHR
LHR: A non-daily slot pair may be worth up to £0.5 million for
a single day
LGA (New York) and DCA (Washington) slot pairs valued at
about $5 million each
Compensation may not be purely monetary (e.g., swap slots
at other airports)
Eligibility to acquire slots may be restricted
February 2015: SAS sold two pairs of slots at LHR; a
morning pair for $60 million and an afternoon pair for $22
million; now has 19 more available pairs at LHR
[Sources: Morrell, 2012; LHR Holdings, Ltd, 2012]Page 125

More on Slot Valuation
Page 126
• Time of day is important; morning slots at LHR are the
most valuable
[Sources: LHR Holdings, Ltd, 2012]

Page 127
Future Trends: Demand Management
Innovative slot allocation schemes with emphasis
on more efficient use of slots (e.g., incentives for
use of large aircraft, “specialized” airports with
respect to traffic)
and/or
Slot allocation schemes that include economic
criteria and approaches:
– Congestion pricing
– Slot auctions
– (“Secondary) slot trading
References
de Neufville, R. and A. Odoni (2013) Airport
Systems: Planning, Design and Management,
2nd Edition, McGraw-Hill Education. [Chapters
10, 11, 12, 15 and 16]
ACRP – Airport Cooperative Research Program
Airport Passenger Terminal Planning and
Design, Report 25, vol. 1.
ACRP – Airport Cooperative Research Program
Airport Passenger Terminal Planning and
Design, Report 25, vol. 2.
Page 128

Questions? Comments?
Page 129