Embed Size (px)
Citation preview
Report
Capacity for Collaboration?
Analysis of School-to-School Support Capacity in England
National Foundation for Educational Research (NFER)
Capacity for Collaboration?
Analysis of School-to-School Support Capacity in England
Karen Wespieser
Claudia Sumner
Daniele Bernardinelli
Published July 2017 By the National Foundation for Educational Research, The Mere, Upton Park, Slough, Berkshire SL1 2DQ www.nfer.ac.uk
© 2017 National Foundation for Educational Research Registered Charity No. 313392
ISBN: 978 1 911039 53 2
How to cite this publication: Wespieser, K., Sumner, C. and Bernardinelli, D. (2017). Capacity for Collaboration? Analysis of School-to-School Support Capacity in England. Slough: NFER.
Contents
Acknowledgements
Capacity for collaboration? Interactive map tool 1
Executive summary 2
1. Background 4
2. Findings 7
3. Discussion and recommendations 14
References 15
Appendix A: Methodology 17
Acknowledgements
The authors would like to thank all the people who contributed to
the production of this report. Particular thanks go to Timo Hannay of
SchoolDash for producing the useful, interactive maps. Our
gratitude also goes to NFER colleagues Jennifer Garry, Maire
Williams, Jude Hillary and Louis Coiffait.
Capacity for Collaboration? Analysis of School-to-school Support Capacity in England 1
Capacity for collaboration?
Interactive map tool
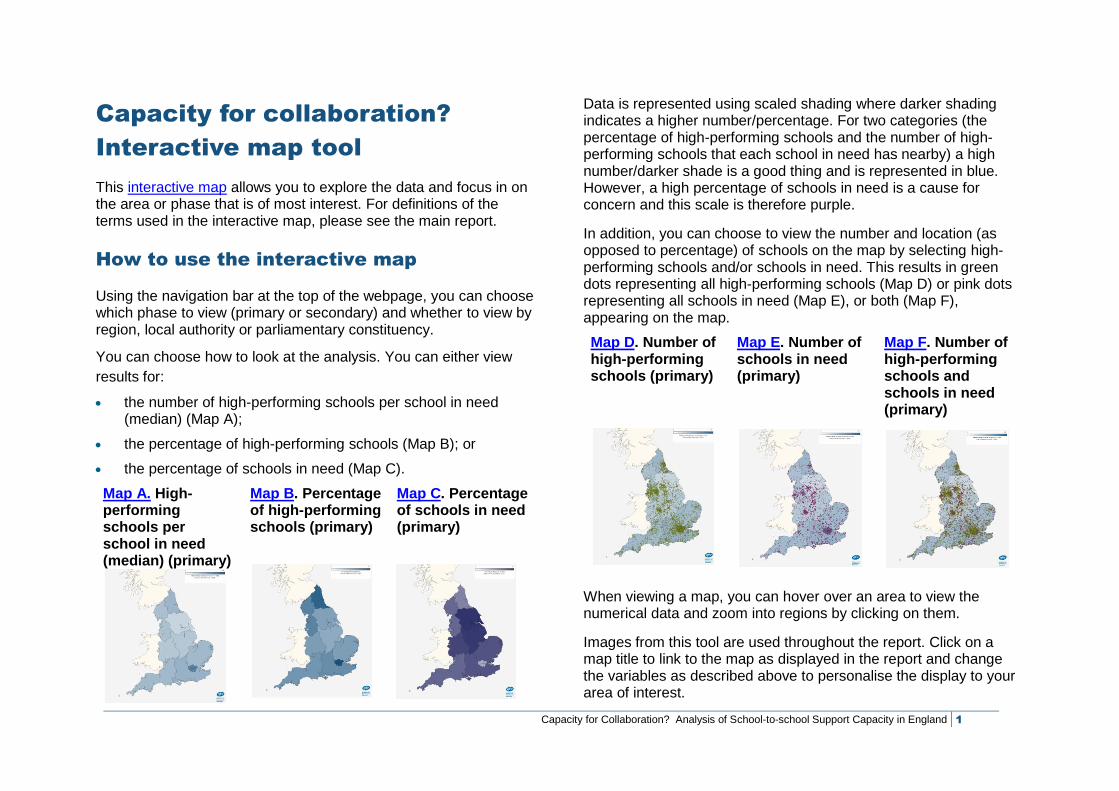
This interactive map allows you to explore the data and focus in on the area or phase that is of most interest. For definitions of the terms used in the interactive map, please see the main report.
How to use the interactive map
Using the navigation bar at the top of the webpage, you can choose which phase to view (primary or secondary) and whether to view by region, local authority or parliamentary constituency.
You can choose how to look at the analysis. You can either view
results for:
the number of high-performing schools per school in need(median) (Map A);
the percentage of high-performing schools (Map B); or
the percentage of schools in need (Map C).
Map A. High-performing schools per school in need (median) (primary)
Map B. Percentage of high-performing schools (primary)
Map C. Percentage of schools in need (primary)
Data is represented using scaled shading where darker shading indicates a higher number/percentage. For two categories (the percentage of high-performing schools and the number of high-performing schools that each school in need has nearby) a high number/darker shade is a good thing and is represented in blue. However, a high percentage of schools in need is a cause for concern and this scale is therefore purple.
In addition, you can choose to view the number and location (as opposed to percentage) of schools on the map by selecting high-performing schools and/or schools in need. This results in green dots representing all high-performing schools (Map D) or pink dots representing all schools in need (Map E), or both (Map F), appearing on the map.
Map D. Number of high-performing schools (primary)
Map E. Number of schools in need (primary)
Map F. Number of high-performing schools and schools in need (primary)
When viewing a map, you can hover over an area to view the numerical data and zoom into regions by clicking on them.
Images from this tool are used throughout the report. Click on a map title to link to the map as displayed in the report and change the variables as described above to personalise the display to your area of interest.
Capacity for Collaboration? Analysis of School-to-school Support Capacity in England 2
Executive summary
The Government’s consultation paper (2016) Schools that work for
everyone, highlighted the importance of ‘leveraging the expertise of
high performing institutions to… turn around existing schools’ (DfE,
2016). The NFER welcomes this collaborative approach to school
improvement.
In order to assess capacity within the system for collaboration, we
conducted analysis to identify and match underperforming schools
and high-performing schools within a set radius1. We only sought to
match schools within the same phase (secondary or primary).
Underperforming schools that are already in a multi-academy trust
(MAT) were excluded from the matching process as these were
assumed to already have support arrangements in place. High-
performing academies in a MAT were included within the group of
available high-performing schools unless, based on school
performance measures alone, their MAT was not considered ‘ready
for further expansion’ (see Hillary et al. 2017).
There are more high-performing schools than
underperforming schools, in both phases
Our analysis shows that there are 5,677 high-performing schools
and 2,511 underperforming schools (categorised for the purpose of
this analysis as schools ‘in need’ of support), across all regions and
1 High-performing schools: outstanding schools; Teaching Schools or National Support Schools; and good schools with outstanding leadership, and high levels of attainment and progress at Key Stage 2 or Key Stage 4. Underperforming schools: below floor standards; Ofsted judgement of requires improvement or inadequate; coasting.
phases of education in England. The number of high-performing
schools exceeds the number of schools ‘in need’ in all Government
Office Regions at primary level and in most regions at secondary
level.
We found that 27 per cent of primary schools are high-performing
institutions and 12 per cent are in need of support. Amongst
secondary schools, we identified 33 per cent as high-performing
and 17 per cent in need.
Schools in need have high-performing schools
nearby which could potentially provide support
In order to assess what potential support might be available, we
looked at how many high-performing schools each school in need
has nearby. Our analysis shows that each primary school in need
has on average2 (median) nine high-performing primary schools
close at hand. Each secondary school has a median number of two
high-performing secondary schools within our set radiuses. While
having support close at hand does not necessarily mean that the
schools in question will want to / will be able to help (because, for
example, they may already be working with other schools), it is
nonetheless positive that schools in need have options nearby that
they can explore for support.
Set radius: 2 miles for urban schools (major and minor conurbations); 5 miles for semi-rural schools (smaller cities and towns); 10 miles for rural schools (rural towns and villages). 2 This average used here, and for similar statements later in the report, is the median. We have used the median rather than the mean as the latter can be affected by outliers – in this case, one or more schools in need with a very large number of potential helpers.
Capacity for Collaboration? Analysis of School-to-school Support Capacity in England 3
Considerable regional differences exist between
the numbers of schools in need and high-
performing schools
Our analysis shows that primary schools in need in London have
the most choice, with on average 18 high-performing primary
schools nearby which they could potentially approach for
collaboration. This is twice the national average and three times the
amount of high-performing schools that primary schools in need in
Yorkshire and the Humber have.
For secondary schools in need, each one in London has on
average five high-performing secondary schools that they might
approach for support, which is considerably more than North-East
England, Yorkshire and the Humber or the South-West England
regions, where each secondary school in need has, on average,
just one high-performing school nearby.
A small number of local authorities have more
schools in need than high-performing schools
Whilst the national and regional picture is promising, the analysis
does reveal a small number of local authorities (LAs) where the
number of schools in need outnumbers the number of high-
performing schools. Yet in the self-improving system, support need
not be limited to within LA boundaries. Currently, school-to-school
support is delivered through, for example, MATs, Teaching School
Alliances (TSAs), and national and local leaders of education
operating across LA boundaries.
There is significant potential capacity in the
system for school-to-school support
Evidence shows school-to-school collaboration works best between
partners with some similarities and system leaders emphasise that
the benefits of collaboration ought to be present for both parties.
Our analysis shows significant potential capacity in the system for
same-phase high-performing schools to collaborate with schools in
need in close proximity. This capacity to collaborate should be
prioritised as a potentially cost neutral activity at a time of budget
constraint. Other sources of support previously proposed by the
Government (HEIs, independent and grammar schools) are
naturally at a disadvantage when it comes to collaboration because
they are unlikely to have the similarities necessary for the most
effective partnerships.
NFER suggests that the Government promotes this capacity for
collaboration to demonstrate its commitment to the self-improving
school system that is flourishing in England.
Capacity for Collaboration? Analysis of School-to-school Support Capacity in England 4
1. Background
To inform its response to the Government’s Schools that work for
everyone consultation, NFER conducted two original pieces of
analysis. This report is the second of these. The other, a research
report on partially selective schools, was published in March
(Wespieser et al, 2017).
In its consultation, the Government sought views on the role that
selective schools, independent schools, higher education
institutions and faith schools could play in meeting the need for
more good school places and turning around existing schools. A
summary of NFER’s consultation response can be found on our
website (NFER, 2016).
In order to address the issue of school-to-school support, this new
NFER analysis of Edubase and school performance data asked the
following research question:
Is there sufficient capacity in the system for high-performing
schools to collaborate with schools in need within close
geographical proximities?
School-to-school support
The self-improving system relies on high-performing schools and
effective school leaders working beyond the parameters of their
own institutions to support the wider school landscape. At its heart
is the notion that stronger and weaker schools should work together
to drive up standards for the mutual benefit of both.
Launching the self-improving school system in 2010, the
Government stated:
Our aim should be to create a school system which is more
effectively self-improving... It is also important that we design the
system in a way which allows the most effective practice to
spread more quickly and the best schools and leaders to take
greater responsibility and extend their reach (DfE, 2010).
In their report on school collaboration in 2013, the Education Select
Committee noted that ‘school partnerships and cooperation have
become an increasingly important part of what has been referred to
as a "self-improving" or "school-led" system’ (GB. Parliament. HoC.
Education Committee, 2013).
A school-to-school partnership approach can facilitate collaboration
and allow schools to provide resources to support each other while
retaining autonomy. Ideally, arrangements should involve
institutions demonstrating excellent practice that can be shared,
whilst recognising that such practice cannot be simply replicated
between institutions. Collaboration between institutions should be
two-way. For example, the National Schools Commissioner, Sir
David Carter, has spoken of the incentives for outstanding schools
to engage with underperforming neighbours, explaining that ‘every
school… should be both a giver and a receiver of support’ (ASCL
et. al., 2016) and that ‘there is as much, possibly even more, to
learn from the teachers who have gone from special measures to
good as there is from the ones who have gone from good to
outstanding’ (Busby, 2016).
Capacity for Collaboration? Analysis of School-to-school Support Capacity in England 5
A school-led system also relies on effective leaders…
working collaboratively to improve the quality both of teachers
entering the profession and existing teachers, cultivating peer
learning within schools and between them, encouraging
innovation to discover future leading practices and ultimately
ownership of outcomes and the quality of education by the
profession (Cruddas, 2015).
School models in the self-improving
system
Recent system changes have led to the evolution of a variety of
school types and a range of collaborative models have evolved as
part of the self-improving school system. There are a range of
formal and informal collaborative partnerships between schools
such as multi academy trusts (MATs), umbrella trusts, ‘hard’ or ‘soft’
federations and TSAs. Not all institutions are in formal school-to-
school partnerships; many schools remain under the remit of the
local authority or are ‘stand-alone’ academies. There has, however,
been an ever-increasing emphasis on the value of schools working
together.
Evidence shows school-to-school support works best between
partners with some similarities, including similar cohorts, ethos and
a mutual commitment to collaboration (Walker et al., 2012).
Evidence further suggests that geographical proximity is an
important element of effective cooperation (ibid).
This resource (the report and accompanying interactive map) is
intended to highlight the amount of potential support already within
the system with a view to revealing the capacity for collaboration
available within a self-improving system.
A note on methodology
We used Edubase data to conduct new analysis, exploring the
number, characteristics and locations of schools. We identified
high-performing and underperforming schools using Ofsted data
and DfE attainment data. We also analysed the geographical
distance between them in order to assess whether or not, on this
basis, there was the potential capacity to collaborate. For the
purpose of our analysis, the two relevant categories were defined
as follows:
a) Underperforming schools (i.e. those that might benefit from
partnerships to raise standards)
i. below floor standards
ii. Ofsted judgment of Requires Improvement
iii. Ofsted judgement of Inadequate
iv. coasting.
b) High-performing schools within the existing system (i.e. state
schools which could potentially collaborate to help raise
standards). These were defined for the purpose of our analysis
as:
i. outstanding schools
Capacity for Collaboration? Analysis of School-to-school Support Capacity in England 6
ii. Teaching Schools or National Support Schools, Good
schools with Outstanding leadership or
iii. high levels of attainment and progress made at KS2 or
KS4.
High-performing schools that fit the criteria and are already part of a
MAT were excluded from further analysis if, based on school
performance measures alone, the MAT was not considered ‘ready
for further expansion’. We have classified a MAT as ‘ready for
further expansion’ if there are at least two good schools for every
one underperforming school in the MAT (see Hillary et al. 2017).
In defining the distance between these groups, we recognised that
an appropriate distance between potential collaborators would vary
depending on geographical factors. We therefore set an optimum
distance of two miles in urban locations, five miles in semi-urban
locations and ten miles in rural locations.
We anticipate that schools would be best placed to understand the
challenges faced by another school of the same phase, so whilst it
is possible that cross-phase support could be a successful
approach, we have focused in our analysis only within-phase.
While our analysis took into account whether the schools were in a
MAT, no information was gathered, for the purpose of this analysis,
about whether the schools were already in any other type of
collaborative arrangement.
This analysis looks at the issue of school-to-school support through
the lens of school performance, proximity and phase of education
only. There are, of course, other factors that affect the capacity to
collaborate, such as ethos, which we are unable to account for
using publicly available data. Furthermore, just because a school in
need has some potential sources of help close at hand, this does
not mean that these high-performing schools will be willing to help
and/or have capacity to help, as they may already be supporting
other schools. It is nonetheless useful to show that there is potential
support nearby that most schools in need could explore.
Further details of the methodology can be found in Appendix B.
Capacity for Collaboration? Analysis of School-to-school Support Capacity in England 7
2. Findings
Our analysis shows that there is significant capacity for
collaboration available in the system as most schools in need are
geographically close to one or more high-performing schools.
We have identified 5,677 high-performing schools and 2,511
schools in need across all regions and phases of education. We
looked at these schools in relation to their phase and geography
and found significant variations, which are explored further below.
2.1 Variations between phases
There are wide variations in the available capacity for collaboration
across phases.
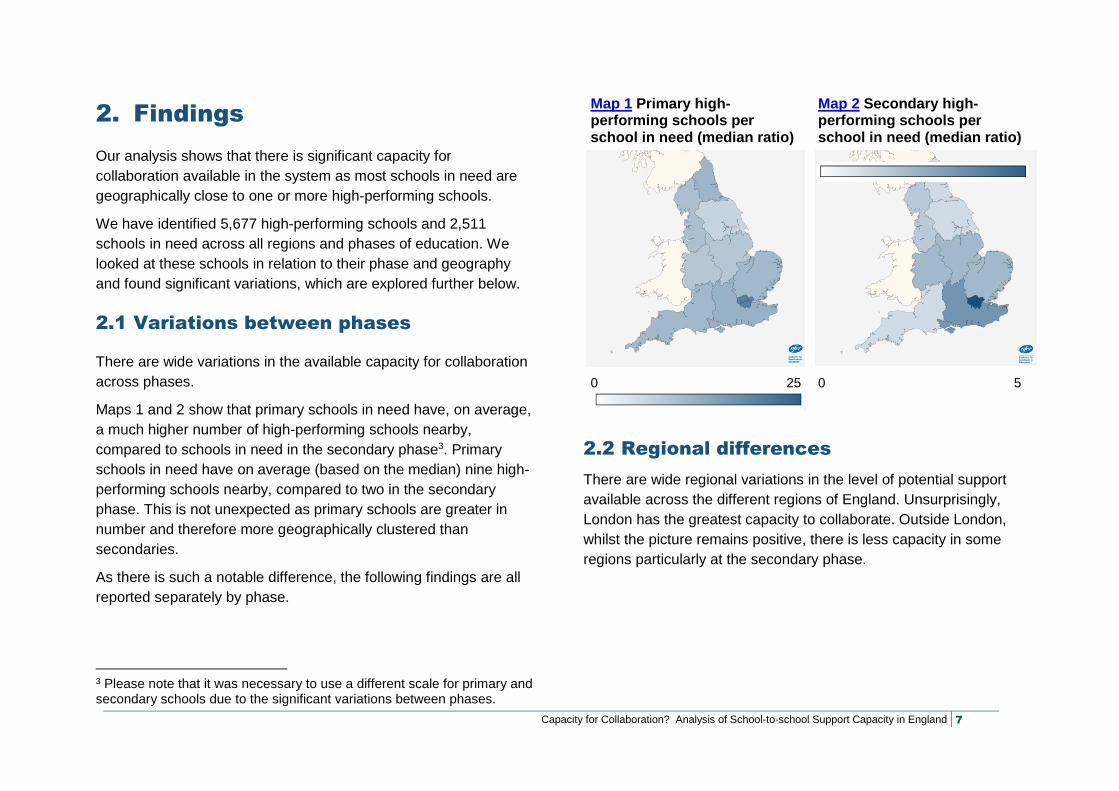
Maps 1 and 2 show that primary schools in need have, on average,
a much higher number of high-performing schools nearby,
compared to schools in need in the secondary phase3. Primary
schools in need have on average (based on the median) nine high-
performing schools nearby, compared to two in the secondary
phase. This is not unexpected as primary schools are greater in
number and therefore more geographically clustered than
secondaries.
As there is such a notable difference, the following findings are all
reported separately by phase.
3 Please note that it was necessary to use a different scale for primary and secondary schools due to the significant variations between phases.
Map 1 Primary high-performing schools per school in need (median ratio)
0 25
Map 2 Secondary high-performing schools per school in need (median ratio)
0 5
2.2 Regional differences
There are wide regional variations in the level of potential support
available across the different regions of England. Unsurprisingly,
London has the greatest capacity to collaborate. Outside London,
whilst the picture remains positive, there is less capacity in some
regions particularly at the secondary phase.
Capacity for Collaboration? Analysis of School-to-school Support Capacity in England 8
London has the greatest proportion of high-
performing schools
London has the greatest proportion of high-performing schools and
the lowest proportion of schools in need across all regions and
phases.
These figures reflect the ‘London effect’ (Cook, 2013) which shows
that student attainment is higher in the capital. Reasons cited for
these better outcomes include policy initiatives such as the London
Challenge (which fostered school collaborations and partnership)
and Teach First, as well as the ethnic composition of the student
body (Burgess, 2014).
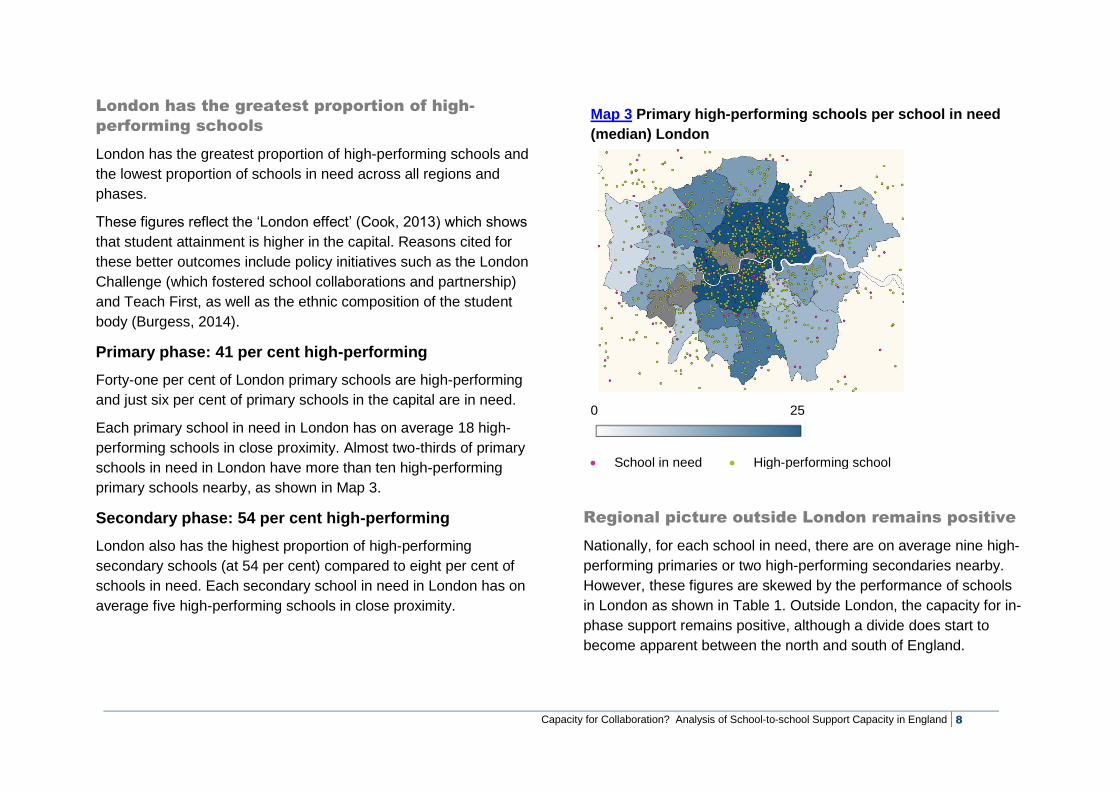
Primary phase: 41 per cent high-performing
Forty-one per cent of London primary schools are high-performing
and just six per cent of primary schools in the capital are in need.
Each primary school in need in London has on average 18 high-
performing schools in close proximity. Almost two-thirds of primary
schools in need in London have more than ten high-performing
primary schools nearby, as shown in Map 3.
Secondary phase: 54 per cent high-performing
London also has the highest proportion of high-performing
secondary schools (at 54 per cent) compared to eight per cent of
schools in need. Each secondary school in need in London has on
average five high-performing schools in close proximity.
Map 3 Primary high-performing schools per school in need
(median) London
0 25
School in need High-performing school
Regional picture outside London remains positive
Nationally, for each school in need, there are on average nine high-
performing primaries or two high-performing secondaries nearby.
However, these figures are skewed by the performance of schools
in London as shown in Table 1. Outside London, the capacity for in-
phase support remains positive, although a divide does start to
become apparent between the north and south of England.
Capacity for Collaboration? Analysis of School-to-school Support Capacity in England 9
Table1. Average number of high-performing schools that schools in need have nearby, by region and phase
Region
Primary Secondary
North-East England 11 1
North-West England 9 2
Yorkshire and the Humber 6 1
East-Midlands 8 2
West-Midlands 8 2
East of England 10 2
South-East England 11 3
South-West England 10 1
London 18 5
England 9 2
Primary phase: southern regions strongest
Whilst still some way off the London average (18), primary schools
in need in South-East England, South-West England and the East
of England have on average a greater number of high-performing
primary schools nearby than there are across England as a whole.
As well as these southern regions, North-East England is also
comfortably above the national average.
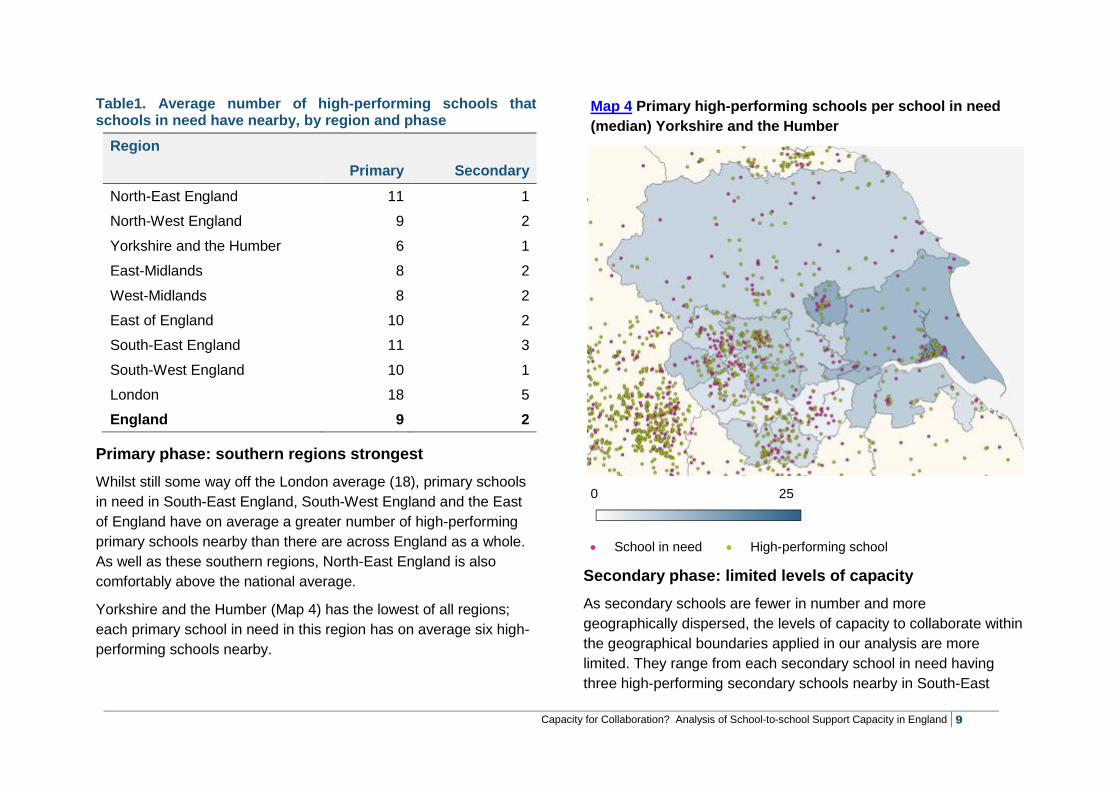
Yorkshire and the Humber (Map 4) has the lowest of all regions;
each primary school in need in this region has on average six high-
performing schools nearby.
Map 4 Primary high-performing schools per school in need
(median) Yorkshire and the Humber
0 25
School in need High-performing school
Secondary phase: limited levels of capacity
As secondary schools are fewer in number and more
geographically dispersed, the levels of capacity to collaborate within
the geographical boundaries applied in our analysis are more
limited. They range from each secondary school in need having
three high-performing secondary schools nearby in South-East
Capacity for Collaboration? Analysis of School-to-school Support Capacity in England 10
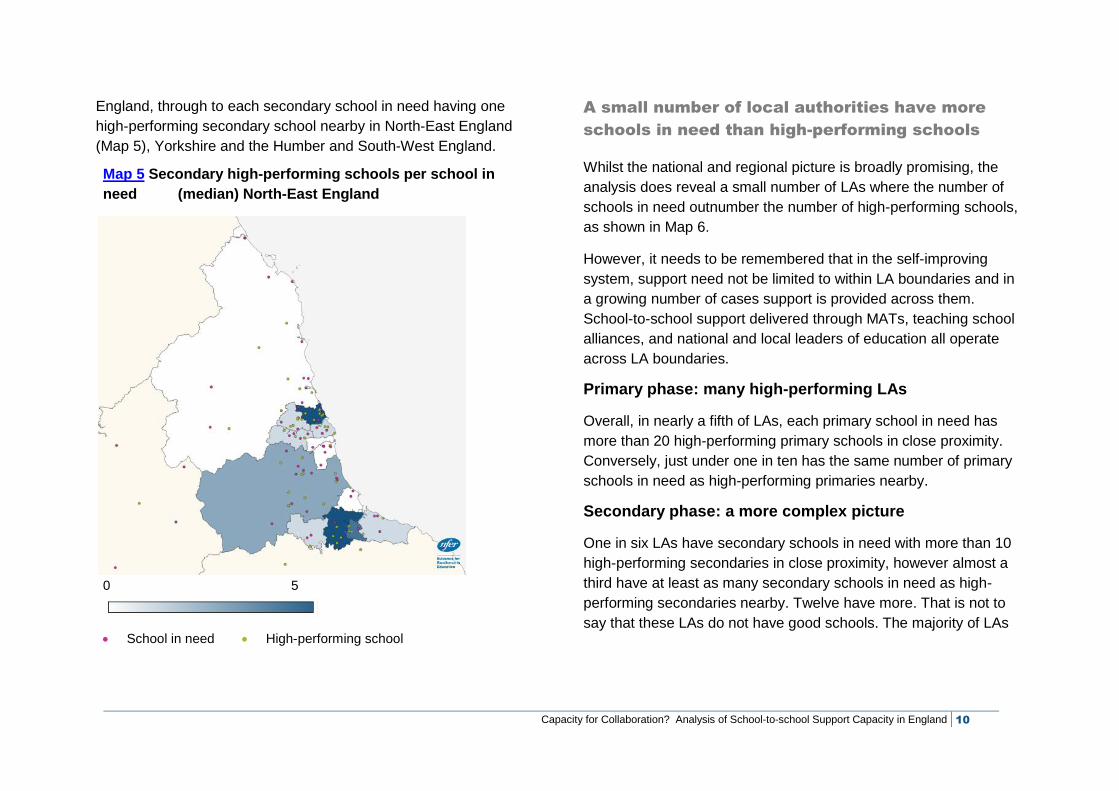
England, through to each secondary school in need having one
high-performing secondary school nearby in North-East England
(Map 5), Yorkshire and the Humber and South-West England.
Map 5 Secondary high-performing schools per school in
need (median) North-East England
0 5
School in need High-performing school
A small number of local authorities have more
schools in need than high-performing schools
Whilst the national and regional picture is broadly promising, the
analysis does reveal a small number of LAs where the number of
schools in need outnumber the number of high-performing schools,
as shown in Map 6.
However, it needs to be remembered that in the self-improving
system, support need not be limited to within LA boundaries and in
a growing number of cases support is provided across them.
School-to-school support delivered through MATs, teaching school
alliances, and national and local leaders of education all operate
across LA boundaries.
Primary phase: many high-performing LAs
Overall, in nearly a fifth of LAs, each primary school in need has
more than 20 high-performing primary schools in close proximity.
Conversely, just under one in ten has the same number of primary
schools in need as high-performing primaries nearby.
Secondary phase: a more complex picture
One in six LAs have secondary schools in need with more than 10
high-performing secondaries in close proximity, however almost a
third have at least as many secondary schools in need as high-
performing secondaries nearby. Twelve have more. That is not to
say that these LAs do not have good schools. The majority of LAs
Capacity for Collaboration? Analysis of School-to-school Support Capacity in England 11
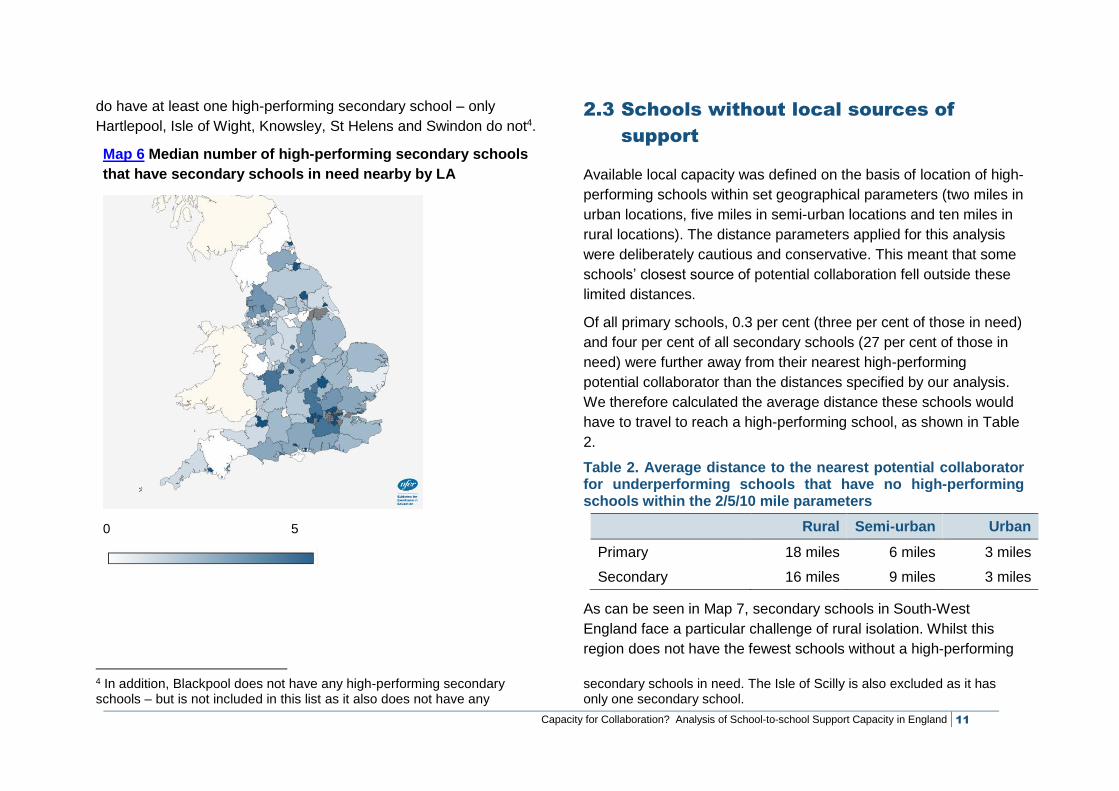
do have at least one high-performing secondary school – only
Hartlepool, Isle of Wight, Knowsley, St Helens and Swindon do not4.
Map 6 Median number of high-performing secondary schools
that have secondary schools in need nearby by LA
0 5
4 In addition, Blackpool does not have any high-performing secondary schools – but is not included in this list as it also does not have any
2.3 Schools without local sources of
support
Available local capacity was defined on the basis of location of high-
performing schools within set geographical parameters (two miles in
urban locations, five miles in semi-urban locations and ten miles in
rural locations). The distance parameters applied for this analysis
were deliberately cautious and conservative. This meant that some
schools’ closest source of potential collaboration fell outside these
limited distances.
Of all primary schools, 0.3 per cent (three per cent of those in need)
and four per cent of all secondary schools (27 per cent of those in
need) were further away from their nearest high-performing
potential collaborator than the distances specified by our analysis.
We therefore calculated the average distance these schools would
have to travel to reach a high-performing school, as shown in Table
2.
Table 2. Average distance to the nearest potential collaborator for underperforming schools that have no high-performing schools within the 2/5/10 mile parameters
Rural Semi-urban Urban
Primary 18 miles 6 miles 3 miles
Secondary 16 miles 9 miles 3 miles
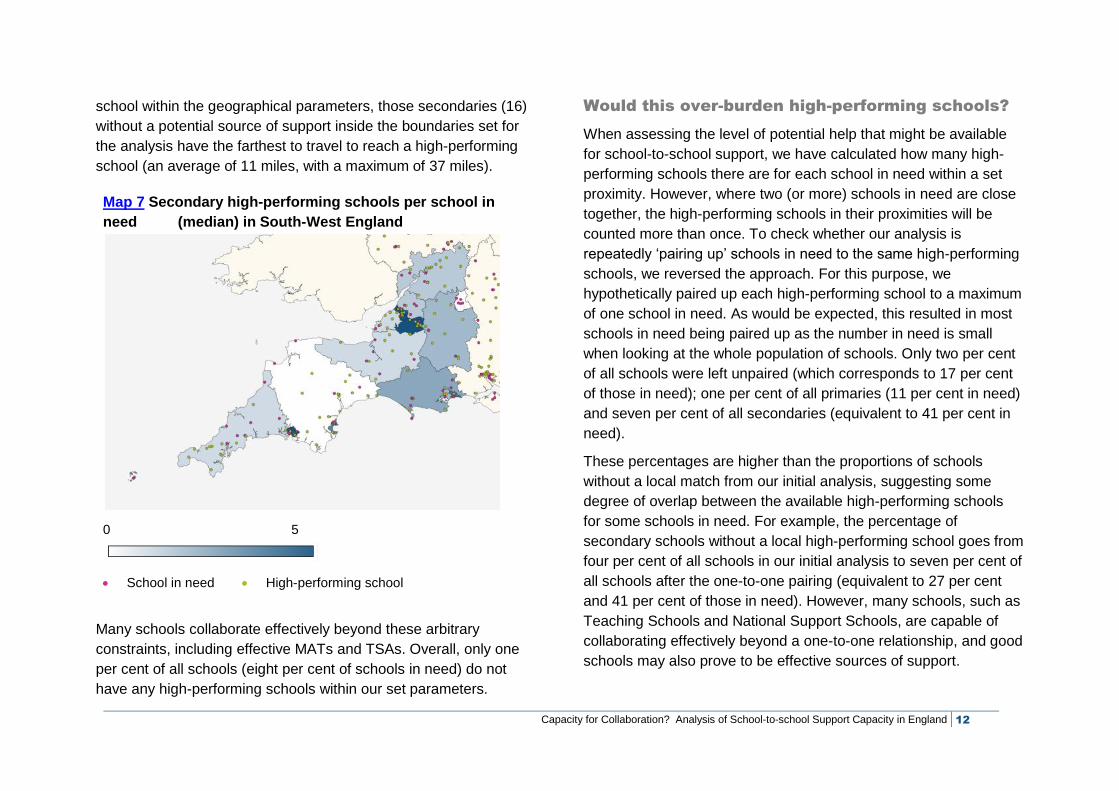
As can be seen in Map 7, secondary schools in South-West
England face a particular challenge of rural isolation. Whilst this
region does not have the fewest schools without a high-performing
secondary schools in need. The Isle of Scilly is also excluded as it has only one secondary school.
Capacity for Collaboration? Analysis of School-to-school Support Capacity in England 12
school within the geographical parameters, those secondaries (16)
without a potential source of support inside the boundaries set for
the analysis have the farthest to travel to reach a high-performing
school (an average of 11 miles, with a maximum of 37 miles).
Map 7 Secondary high-performing schools per school in
need (median) in South-West England
0 5
School in need High-performing school
Many schools collaborate effectively beyond these arbitrary
constraints, including effective MATs and TSAs. Overall, only one
per cent of all schools (eight per cent of schools in need) do not
have any high-performing schools within our set parameters.
Would this over-burden high-performing schools?
When assessing the level of potential help that might be available
for school-to-school support, we have calculated how many high-
performing schools there are for each school in need within a set
proximity. However, where two (or more) schools in need are close
together, the high-performing schools in their proximities will be
counted more than once. To check whether our analysis is
repeatedly ‘pairing up’ schools in need to the same high-performing
schools, we reversed the approach. For this purpose, we
hypothetically paired up each high-performing school to a maximum
of one school in need. As would be expected, this resulted in most
schools in need being paired up as the number in need is small
when looking at the whole population of schools. Only two per cent
of all schools were left unpaired (which corresponds to 17 per cent
of those in need); one per cent of all primaries (11 per cent in need)
and seven per cent of all secondaries (equivalent to 41 per cent in
need).
These percentages are higher than the proportions of schools
without a local match from our initial analysis, suggesting some
degree of overlap between the available high-performing schools
for some schools in need. For example, the percentage of
secondary schools without a local high-performing school goes from
four per cent of all schools in our initial analysis to seven per cent of
all schools after the one-to-one pairing (equivalent to 27 per cent
and 41 per cent of those in need). However, many schools, such as
Teaching Schools and National Support Schools, are capable of
collaborating effectively beyond a one-to-one relationship, and good
schools may also prove to be effective sources of support.
Capacity for Collaboration? Analysis of School-to-school Support Capacity in England 13
Additionally, as well as unpaired schools in need, we found a
significant number of high-performing schools remained available
after the one-to-one pairing. If we relax our analysis to allow pairing
of schools within region (regardless of distance), then there is
potential capacity across the country at all phases except for
secondary schools in North-East England, where a few schools in
need might remain unpaired (four in our calculations).
Capacity for Collaboration? Analysis of School-to-school Support Capacity in England 14
3. Discussion and
recommendations
NFER welcomes the Government’s aim that all parts of the
education system collaborate more to widen opportunity and raise
standards in existing schools.
Achieving this aspiration will involve harnessing the potential
identified by this analysis into actual collaboration or sponsorship
arrangements, requiring local will and support, as well as
recognising and appropriately resourcing the associated costs.
What this evidence demonstrates is that local schools, across the
country and across both phases, are well positioned to support
each other – and many already are – working collaboratively within
a partnership of their choosing be it a MAT, federation or other type
of cluster.
This analysis shows that there is potential capacity within the self-
improving system to support improvement. The number of high-
performing schools significantly exceeds the number of schools in
need.
It is worth noting that this analysis is a snapshot of the current
picture using the latest data available. A sensible next step would
be to look at demographic trends to identify those areas where
future demands on schools may be particularly high.
In a context of school budget cuts, the Government needs to
consider leveraging the capacity of the high-performing institutions
in the system in a way that enables all schools to improve.
We recommend that this evidence be used to support heads,
governing bodies and LAs, highlighting the amount of capacity
already within the system. The future success of the self-improving
system will depend upon governors, trustees and school leaders
embracing the opportunities offered by working with colleagues at
neighbouring institutions to raise attainment for all young people.
Evidence shows school-to-school collaboration works best between
partners with some similarities, including similar cohorts, ethos and
a mutual commitment (Walker, et al., 2012), and system leaders
have emphasised that the benefit of collaboration ought to be
present for both parties (ASCL et al., 2016).
Our analysis reveals significant capacity in the system for same-
phase high-performing schools to collaborate with schools in need
in close proximity.
For the small number of schools in need which do not have a high
performing school within our set geographical parameters, it is
important to note that it is not the case that there is no support
available, rather that it might be slightly further away.
This capacity to collaborate could and should be explored in order
to maximise the potential benefits of the self-improving schools
system that has evolved since 2010.
Capacity for Collaboration? Analysis of School-to-school Support Capacity in England 15
References
ASCL, NGA and Browne Jacobson (2016). Staying in Control of
your School’s Destiny: Considering Forming or Joining a Group of
Schools. Leicester: ASCL [online]. Available:
https://www.ascl.org.uk/download.9895DAE7-5F26-4F8F-
98DF50D04CE0E3EB.html [12 June, 2017]
Burgess, S. (2014). Understanding the Success of London’s
Schools. Bristol: CMPO [online]. Available:
http://www.bristol.ac.uk/media-
library/sites/cmpo/migrated/documents/wp333.pdf [8 May, 2017]
Busby, E. (2016). ‘Sir David Carter spoke about school
improvement today. Here are five things we learned’ TES [online].
Available: https://www.tes.com/news/school-news/breaking-
news/sir-david-carter-spoke-about-school-improvement-today-here-
are-five [8 May, 2017]
Cook, C. (2013) ‘London school children perform the best’ Financial
Times, 13 January [online]. Available:
https://www.ft.com/content/8f65f1ce-5be7-11e2-bef7-00144feab49a
[8 May, 2017]
Cruddas, L. (2015). Leading the Way: Blueprint for a Self-Improving
System. Leicester: ASCL [online]. Available:
http://www.ascl.org.uk/policy/blueprint-for-selfimproving-
system/executive-summary.html [12 June, 2017]
Department for Education (2010). The Importance of Teaching: The
Schools White Paper 2010 (Cm. 7980). London: TSO [online].
Available:
https://www.gov.uk/government/uploads/system/uploads/attachmen
t_data/file/175429/CM-7980.pdf [8 May, 2017]
Department for Education (2016). Schools That Work for Everyone.
Government Consultation. London: TSO [online]. Available:
https://consult.education.gov.uk/school-frameworks/schools-that-
work-for-
everyone/supporting_documents/SCHOOLS%20THAT%20WORK
%20FOR%20EVERYONE%20%20FINAL.PDF [8 May, 2017].
Great Britain. Parliament. House of Commons.
Education Committee (2013). Education Committee - Fourth
Report. School Partnerships and Cooperation. London: TSO
[online]. Available:
https://www.publications.parliament.uk/pa/cm201314/cmselect/cme
duc/269/26902.htm [8 May, 2017]
Hillary, J., Easton, C., Bernardinelli, D. and Gee, G. (2016). A Tale
of Eight Regions - Part 1: Snapshot of the Evolving School System
Across the Regional School Commissioner Areas. Slough: NFER
[online]. Available: https://www.nfer.ac.uk/publications/RSCS01/ [8
May, 2017].
Hillary, J., Bamford, S., Bernardinelli, D. and Gee, G. (2017). A Tale
of Eight Regions. Part 2: Challenge and Support Across the
Regional Schools Commissioner Areas. Slough: NFER [online].
Available: https://www.nfer.ac.uk/publications/RSCS02/ [12 June,
2017]
Capacity for Collaboration? Analysis of School-to-school Support Capacity in England 16
National Foundation for Educational Research (2016). Schools that
Work for Everyone: Department for Education Consultation. Slough:
NFER [online]. Available:
https://www.nfer.ac.uk/publications/99961/ [8 May, 2017]
Walker, M., Sims, D., Lynch, S., Durbin, B., Henderson, L. and
Morris, M. (2012). Evaluation of the Gaining Ground Strategy (DFE-
RR216). London: TSO [online]. Available:
https://www.gov.uk/government/uploads/system/uploads/attachmen
t_data/file/184088/DFE-RR216.pdf [8 May, 2017].
Wespieser, K., Sumner, C., Garry, J., Bernardinelli, D. and Coiffait,
L. (2017). The Performance of Partially Selective Schools in
England. Slough: NFER [online]. Available:
https://www.nfer.ac.uk/publications/GRAM02/ [8 May, 2017].
Capacity for Collaboration? Analysis of School-to-school Support Capacity in England 17
Appendix A: Methodology
Data
Numbers and percentages of schools by type and phase in each
Government Office Region and Local Authority are based on data
from Edubase, reflecting school status as of 16 September 2016.
The analysis includes all mainstream state-funded primary,
secondary and all-through schools. All-through schools are included
in the counts of both primary and secondary schools for analysis by
phase. The analysis excludes post-16 institutions (i.e. further
education colleges, sixth form colleges and sixth form centres, 16-
19 academies/free schools), special schools and alternative
provision.
Number and percentages of coasting schools and schools below
floor standards are based on data from the DfE performance
tables for the academic years 2013/14, 2014/15 and 2015/16. For
the purpose of this analysis, current academies have been matched
to their predecessors to assess attainment over time. Numbers and
percentages of schools classified as requiring improvement or
inadequate are based on Ofsted’s monthly management
information publications, with data including inspections up to 31
December 2016.
Data on academy trusts is available from Edubase and reflects the
status quo as of 16 September 2016.
Schools in need
A school is classified as being in need of help if it is either:
rated by Ofsted as requires improvement or inadequate; or
below the floor standards (in 2015/16, or in at least two of the three academic years considered), or
coasting (in 2015/16).
Where an academy falls within our definition of need, we have
assumed that it is not currently in need of help if it is part of a Multi-
Academy Trust. However, Single-Academy Trusts can be classified
as in need of help.
Our definition of need closely follows official underperformance
definitions from DfE. However, we do not apply the same exclusion
criteria when identifying coasting schools or schools below the floor
standards. This is because our analysis is aimed at providing a
picture of the levels of underperformance across the country, and
the potential sources of support available to address these issues. It
is not intended to hold schools to account.
Floor standards and coasting schools
Key Stage 2
A school is classified as being below the floor at Key Stage 2 in the
academic year 2015/16 if:
The percentage of pupils meeting the expected standards in English reading, English writing and Mathematics is below 65%, and
Capacity for Collaboration? Analysis of School-to-school Support Capacity in England 18
The school achieves a progress score in English reading below -5, or a progress score in English writing below -7, or a progress score in Mathematics below -5.
A school is classified as being below the floor at Key Stage 2 in the
academic years 2013/14 and 2014/15 if:
the percentage of pupils achieving level 4 or above in English reading, English writing and Mathematics is below 65%, and
the percentage of pupils achieving the expected progress in English reading, English writing and Mathematics is below the national median for all three
A school is classified as being coasting at Key Stage 2 in the
academic year 2015/16 if:
in 2015/16, the percentage of pupils meeting the expected standards in English reading, English writing and Mathematics is below 85%, and the school achieves a progress score in English reading below -2.5, or a progress score in English writing below -3.5, or a progress score in Mathematics below -2.5.
in 2013/14 and 2014/15, the percentage of pupils achieving level 4 or above in English reading, English writing and Mathematics is below 85% and the percentage of pupils achieving expected progress is below the national median for all three components.
Key Stage 4
A school is classified as being below the floor at Key Stage 4 for the
academic year 2015/16 if:
the progress 8 measure is below -0.5, and
the upper bound of the progress 8 confidence interval is below zero
A school is classified as being below the floor at Key Stage 4 for the
academic years 2013/14 and 2014/15 if:
the proportion of pupils achieving 5 A*-C GCSEs (or equivalents) including English and Mathematics is less than 40%, and
proportion of pupils achieving expected progress is below the national median for both English and Mathematics
A school is classified as being coasting at Key Stage 4 in the
academic year 2015/16 if:
in 2015/16, the progress 8 measure is below -0.25 and the upper bound of its confidence interval is below zero in 2013/14 and 2014/15, the percentage of pupils achieving 5 A*-C GCSEs (or equivalents) including English and Mathematics is less than 60%, and the proportion of pupils achieving expected progress is below the national median for both English and Mathematics
High-performing schools
For the purpose of identifying the capacity of the system to support
the need to improve school performance, a school is classified as
high-performing if it is not already classified as in need, and if one
or more of the following is true:
the school is rated by Ofsted as outstanding
the school is rated by Ofsted as good with outstanding leadership
the school is a Teaching School or a National Support School (i.e. the headteacher is a National Leader of Education)
Capacity for Collaboration? Analysis of School-to-school Support Capacity in England 19
the school has high levels of attainment in 2015/16, at either Key Stage 2 or Key Stage 4, defined as:
Key Stage 2
- the percentage of pupils meeting the expected standards
in English reading, English writing and Mathematics is
within the top 25% nationally, and
- progress scores in English reading, English writing and
Mathematics are all above zero.
Key Stage 4
- the progress 8 measure is within the top 25% nationally,
and the attainment 8 score is above the national median,
or
- the attainment 8 score is within the top 25% nationally,
and the progress 8 measure is above the national
median
Where a high-performing school is within a MAT that we classify as
not being ready to expand, we exclude that school from the
analysis. Please see Hillary et al. (2017) for the definition of
readiness to expand.
Matching high-performing schools to
schools in need
Our analysis shows the median number of high-performing schools
at the national level, as well as in each region, Local Authority or
Parliamentary constituency.
We have calculated these numbers following the steps below.
1) Calculate the distance of all high-performing schools from each
school in need, and classify a high-performing school as
available if it falls within a given radius from the school in need.
The radius depends on the rurality indicator for the school in
need (available from Edubase), and is set as follows:
2 miles for urban schools (major and minor conurbations)
5 miles for semi-rural schools (smaller cities and towns)
10 miles for rural schools (rural towns and villages).
2) Match high-performing schools to schools in need by phase of
education as follows:
primary schools can collaborate with other primary schools
secondary schools can collaborate with other secondary schools and all-through schools
all through schools can collaborate with primary, secondary and all-through schools.
3) Calculate the number of available high-performing schools
within set proximities for each school in need.
4) For every level of aggregation, calculate the median number of
available high-performing schools for each school in need.
We have also calculated the average and maximum distance
between the nearest high-performing school and schools in need
without an in-phase match based on the above parameters. The
results are presented in Table 4. This shows that most of these
schools would find a potential collaborator not too far outside the
set radius. It is important to note that the distance shown for rural
schools is derived from a very small number of occurrences, and is
therefore inflated by a few relatively remote cases.
NFER ref. GRAM01 ISBN. 978 1 911039 53 2